
Abstract
Introduction:
Urinary angiotensinogen is considered a reliable biomarker for intrarenal renin–angiotensin system activity. The aims of this study were to assess the urinary angiotensinogen level during the first day of life and to evaluate its correlation with renal function in critically ill neonates.
Methods:
Urinary angiotensinogen concentration during the first 24 hours of life was measured in 98 critically ill neonates. Neonatal renal function was assessed by urinary levels of cystatin-C, albumin and α1-microglobulin and urinary electrolyte excretion.
Results:
Urinary angiotensinogen level decreased with increasing gestational age and body weight in critically ill neonates (P<0.001). After adjustment for gestational age, urinary angiotensinogen level correlated with urinary fractional excretion of sodium and urinary levels of cystatin-C and α1-microglobulin. Multivariate linear regression identified a significant impact of urinary cystatin-C on urinary angiotensinogen level (P<0.001). Furthermore, urinary angiotensinogen was significantly increased in neonates with a urinary cystatin-C-to-creatinine ratio ⩾2500 ng/mg, which was the optimal cut-off value to predict acute kidney injury in our previous study.
Conclusions:
The urinary angiotensinogen level correlates with the overall maturity of renal function during the early postnatal period in critically ill neonates and an increased urinary angiotensinogen level might reflect renal injury in immature neonates.
Keywords
Introduction
The renin–angiotensin system (RAS) is known to play an important role in the regulation of blood pressure and fluid and electrolyte homeostasis. There is an increased emphasis on the local RAS, which plays a significant role in specific tissues. 1 The intrarenal RAS is an independent system, and inappropriate activation of this system is an important contributor to renal injury. 2
Angiotensinogen, as a hormone precursor, is the principal substrate for renin, which is the rate-limiting enzyme of the RAS. It is well documented that urinary angiotensinogen (uAGT) can serve as a reliable marker to reflect intrarenal RAS activity accurately,3–7 although one study showed that uAGT was not an effective marker of renal RAS activity. 8 Previous studies indicate that uAGT is locally produced and secreted into the tubular lumens directly by proximal tubular cells,2,6,9,10 and no correlation exists between the plasma angiotensinogen concentration and uAGT excretion. 11
In adult patients with chronic kidney disease (CKD), uAGT was inversely correlated to the estimated glomerular filtration rate (GFR). There was also a significant positive correlation between the uAGT concentration and the urinary albumin–creatinine ratio, fractional excretion of sodium and serum creatinine level. 12 Thus, uAGT is considered to be a potential biomarker of the severity of CKD.12–14 In addition, the uAGT level was elevated in adult patients with cardiac injury who developed more severe acute kidney injury (AKI) after sample collection. 13
During the neonatal or infantile period, the RAS is more activated compared to later in childhood, 15 and this activity is functionally independent of the maternal RAS system and important for normal kidney development. 16 However, the effect of the intrarenal RAS on immature renal function during the neonatal period remains unclear, and little is known about the uAGT level during neonatal life. The aims of this study were to assess the uAGT level during the first 24 hours of life and to evaluate its correlation with renal glomerular and tubular function in critically ill neonates.
The early postnatal period is characterised by the maturation of renal function. Neonates, especially critically ill premature neonates, are affected by multiple factors that influence kidney function and that may predispose to the development of AKI.17,18 Creatinine clearance, as an assessment of GFR, is unreliable in neonates, unless bladder catheterisation is used to assure an accurately timed urine collection. Moreover, the serum creatinine level of neonates reflects the maternal levels during the first few days of life, 17 and serum creatinine and estimated GFR based on the Schwartz formula therefore cannot be used to assess renal function at this time.
Cystatin-C (CysC) is normally filtered, completely reabsorbed and catabolised within the proximal tubule. The urinary cystatin-C (uCysC) concentration can be used as a marker of renal function.19,20 The ratio of uCysC to urinary creatinine is considered to be a reliable screening tool for detecting decreased GFR in children, 20 and we and other authors have demonstrated that increased uCysC is an independent predictor of AKI during the first days of life in neonates.21,22 Therefore, the urinary levels of CysC, albumin, and α1-microglobulin as well as urinary electrolyte excretion were measured to evaluate neonatal renal glomerular and tubular function in this study.
Materials and methods
Subject selection
Neonates admitted to the neonatal intensive care unit (NICU) from August 2011 to August 2012 were eligible for this study. The exclusion criteria were as follows: neonates admitted after 24 hours of life; severe congenital anomalies; antenatal exposure to angiotensin-converting enzyme inhibitors (ACEIs) or angiotensin receptor blockers; receiving treatment with diuretics or nephrotoxic antibiotics; failure to collect a urine sample during the first 24 hours of life; and refusal to participate by parents. The study was performed in accordance with the Declaration of Helsinki, with approval of the Institutional Review Board of the Children’s Hospital of Soochow University. Written informed consent was obtained from the parents.
Clinical and laboratory data collection
Maternal data including gestational diabetes mellitus, hypertension, pre-eclampsia, premature rupture of the membranes >24 hours, antenatal steroids and mode of delivery, as well as neonatal data including gestational age, birth weight, gender and the Apgar scores were collected. The score for neonatal acute physiology (SNAP) was calculated based on 28 items collected during the first 24 hours of admission as described previously,22,23 which is a valid measure of illness severity and an important predictor of neonatal mortality and clinical outcomes.24,25 Clinical status, medication and therapeutic interventions of the neonates were recorded daily during the hospitalisation. The diagnostic criteria for respiratory distress syndrome (RDS), patent ductus arteriosus, early-onset sepsis, hypoxic-ischaemic encephalopathy and intraventricular haemorrhage, as well as the indications for mechanical ventilation during the first day of life were in accordance with our previous study. 25
Clinical laboratory results from the first 24 hours of life such as serum electrolytes, urea nitrogen, creatinine, osmolality and bicarbonate were recorded for each neonate as part of routine care.
Neonatal renal function tests
The urinary concentrations of albumin, α1-microglobulin and CysC, as well as the urinary fractional excretion of sodium (FENa), potassium (EFK) and chloride (FECl), were measured to evaluate renal glomerular and tubular function.
Urine sample collection and measurement
A urine sample after admission to the NICU during the first 24 hours of life was collected using a plastic bag and stored at −80°C. The concentrations of angiotensinogen from single-voided urine samples were measured using a human total angiotensinogen enzyme-linked immunosorbent assay (ELISA) kit (code no. 27412; Immuno-Biological Laboratories Co. Ltd., Takasaki-Shi, Japan) that specifically detects human angiotensinogen. The cross-reactivity of the kit for angiotensin is ⩿0.1%. The assay was performed according to the manufacturer’s protocol. Briefly, angiotensinogen standards or diluted urine samples were applied onto the precoated plates and incubated for 60 minutes at 37°C. After washing with wash buffer, streptavidin-horseradish peroxidase conjugated anti-human angiotensinogen antibody was incubated in the plates at 37°C for 30 minutes. After washing, tetramethylbenzidine substrate solution was added for 30 minutes at room temperature in the dark before adding stop solution. Finally, the angiotensinogen concentration was measured at 450 nm wavelength in each plate. Linearity was observed in the range of 0.31–20 ng/ml, with a correlation coefficient (R2) >0.99. The detection limit for angiotensinogen was 0.03 ng/ml. The coefficient of variation of inter-assay and intra-assay reproducibility for angiotensinogen concentration ranges from 4% to 7%, corresponding to that reported by the kit manufacturer. The measurements were repeated on eight ‘standard’ samples that were run with each set of patient samples to confirm the reliability of the results. 26 The final angiotensinogen concentration was expressed in micrograms per gram of urinary creatinine (µg/g uCr).
The urinary concentrations of albumin, α1-microglobulin and CysC were measured as described previously.22,23 Urinary concentrations of sodium, potassium and chloride from the same samples were measured in the clinical laboratory in the First Hospital of Soochow University. FENa, EFK and FECl were calculated as 100 × Px × Ucr /Pcr × Ux, when Ux and Px are the urinary and plasma concentrations of sodium, potassium or chloride, respectively, and Ucr and Pcr are the urinary and plasma concentrations of creatinine, respectively.
Plasma sample collection
To determine whether the uAGT level is related to the plasma angiotensinogen concentration, a blood sample was collected during the first 24 hours of life. The sample was collected directly into a tube containing anticoagulant and the plasma was stored at −80°C. The plasma angiotensinogen concentration was measured as above and expressed in microgram per milliliter (µg/ml).
Statistical analysis
Statistical analyses were performed using SPSS Statistics 13.0. Continuous variables were expressed as medians (min–max range) and categorical variables as proportions. Because the continuous variables violated the assumptions of normality and homogeneity of variance, Spearman’s analysis was used to examine correlations. The Mann–Whitney U-test was used to evaluate differences between the two groups.
To meet the assumptions of regression analysis and the analysis of covariance (ANCOVA), the data for continuous variables were log-transformed. A univariate linear regression was performed to examine the contribution of clinical and laboratory factors to the level of uAGT. Variables with P<0.2 in the univariate analysis were entered into a stepwise multivariate regression model. The assumptions of regression analysis were verified by residual plots. ANCOVA or general linear model (GLM) univariate analysis was used to adjust for confounders. Differences with P values <0.05 were considered to be statistically significant. All probability values are two-sided.
Results
Patient characteristics
The study enrolled 98 neonates. Written informed parental consent was obtained from 112 neonates admitted to the NICU on the first day of life during the study period. The following 14 neonates were excluded: one infant diagnosed with severe congenital anomalies; two exposed to antenatal ACEIs and 11 due to failure to obtain a urine sample during the first 24 hours of life. The patient characteristics are shown in Table 1. None of the neonates received diuretics, vancomycin, ibuprofen or vaccines.
Patient characteristics and correlation with urinary angiotensinogen level.
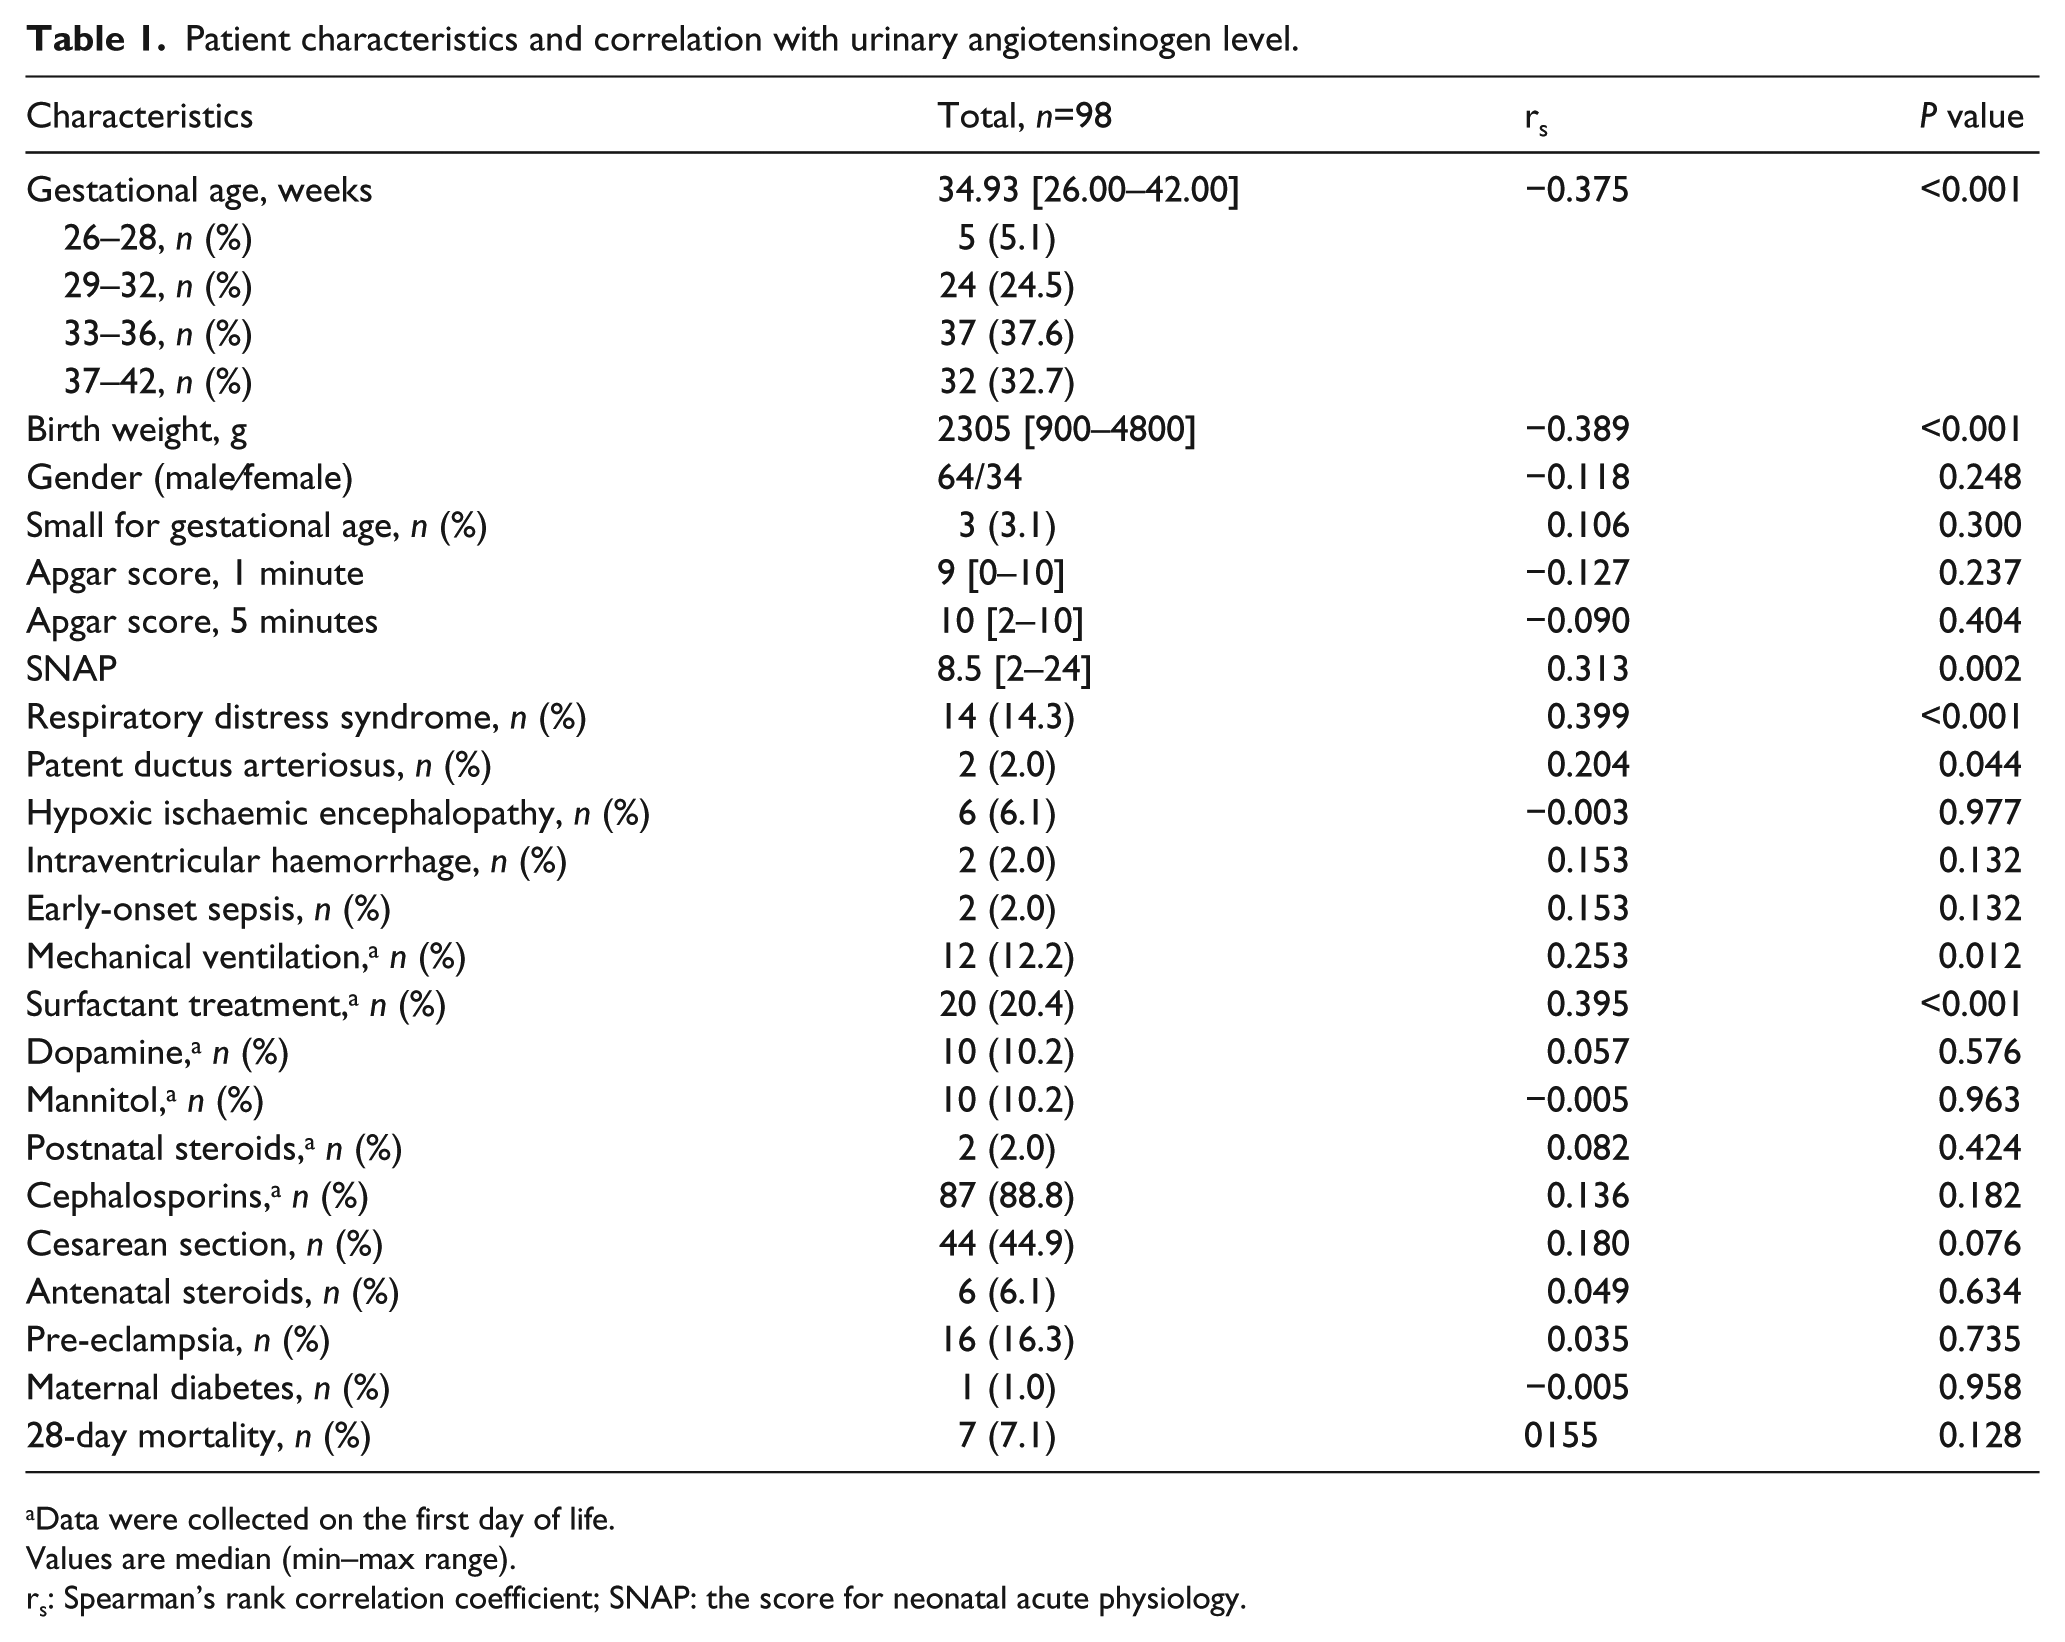
Data were collected on the first day of life.
Values are median (min–max range).
rs: Spearman’s rank correlation coefficient; SNAP: the score for neonatal acute physiology.
uAGT results
The present study evaluated a heterogeneous population of critically ill neonates with various gestational ages, and uAGT levels were detectable within a wide range in 96 samples. The median uAGT level during the first 24 hours of life was 96.90 ng/ml (range 0–241.56) and the median uAGT/creatinine ratio was 722.1 µg/g (range 0–16178.1). In addition, uCysC was detectable in 86 samples. For those samples with undetectable levels, the values of uAGT and uCysC were arbitrarily recorded as 0.03 ng/ml and 10 ng/ml, respectively, corresponding to the detection limit of the assay as indicated by the manufacturer. The results of uAGT and uCysC with adjustment for urinary creatinine were analysed in the study.
The correlation analysis of the uAGT level and various patient characteristics is shown in Table 1. The negative correlation of the log-transformed level of uAGT with gestational age and birth weight is shown in Figure 1.

Correlation between urinary angiotensinogen and gestational age or body weight. For undetectable levels, the values of urinary angiotensinogen were arbitrarily given a value of 0.03 ng/ml, corresponding to the detection limit. Data were log-transformed, n=98.
The contribution of potential factors to the uAGT level
Univariate and multivariate linear regression analysis was used to examine the contribution of clinical and laboratory factors to the level of uAGT, as shown in Tables 2 and 3. The following factors were significantly associated with the uAGT level in univariate analyses: gestational age, birth weight, SNAP, mechanical ventilation, RDS, surfactant, FENa and the urinary levels of albumin, α1-microglobulin and CysC. In the univariate analyses, there were no significant associations between the uAGT level and gender, Apgar score, EFK, FECl or any of the following serum values, which were measured on the same day: creatinine, urea nitrogen, sodium, potassium, chloride, bicarbonate and osmolality (Table 2).
Univariate linear regression of factors associated with urinary angiotensinogen level. a
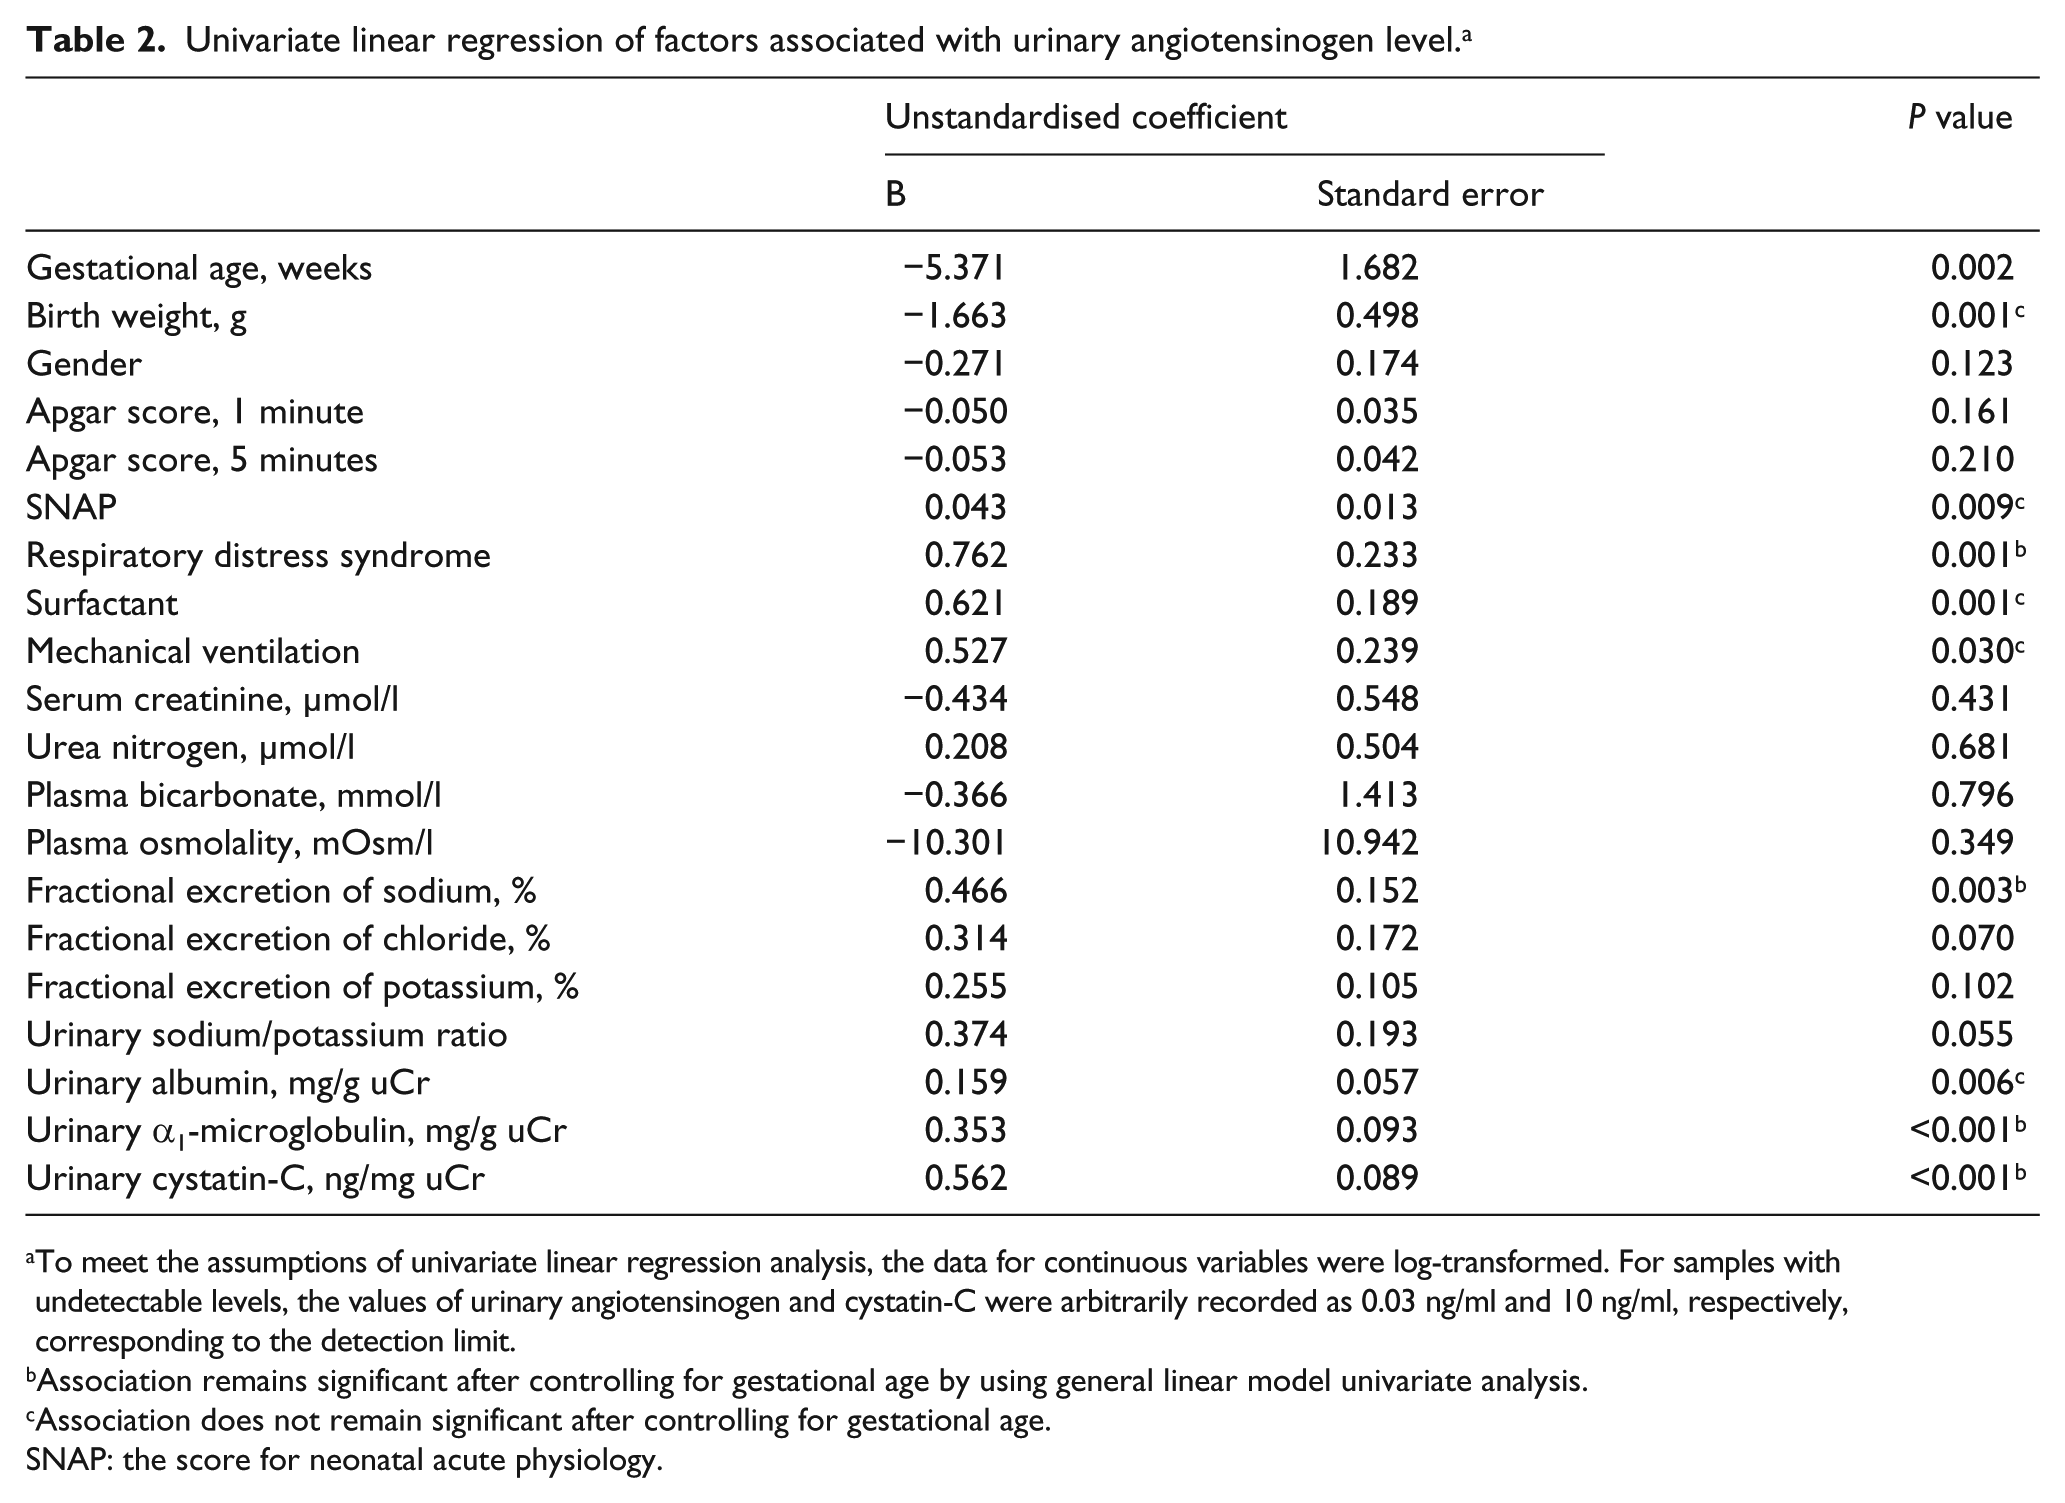
To meet the assumptions of univariate linear regression analysis, the data for continuous variables were log-transformed. For samples with undetectable levels, the values of urinary angiotensinogen and cystatin-C were arbitrarily recorded as 0.03 ng/ml and 10 ng/ml, respectively, corresponding to the detection limit.
Association remains significant after controlling for gestational age by using general linear model univariate analysis.
Association does not remain significant after controlling for gestational age.
SNAP: the score for neonatal acute physiology.
Variables with P<0.2 in the univariate analysis were entered into a stepwise multivariate linear regression analysis. The final model confirmed the impact of uCysC (unstandardised coefficient B=0.572, P<0.001) on the level of AGT in the urine (R2=0.287) (Table 3).
Multivariate linear regression of factors associated with urinary angiotensinogen level. a

Total R2=0.287, adjusted R2=0.278.
Variables with P<0.2 in the univariate analysis (Table 2) were entered into a stepwise multivariate linear regression analysis. To meet the assumptions of multivariate linear regression analysis, the data for continuous variables were log-transformed. For samples with undetectable levels, the values of urinary angiotensinogen and cystatin-C were arbitrarily recorded as 0.03 ng/ml and 10 ng/ml, respectively, corresponding to the detection limit.
Correlation between the uAGT level and urinary electrolyte excretion
Spearman’s rank correlation demonstrated that the uAGT level was significantly positively correlated with FENa (R2=0.161, P<0.001), FEK (R2=0.089, P=0.004) and FECl (R2=0.069, P=0.012). There was also a significant positive correlation between the uAGT level and urinary sodium/potassium ratio (R2=0.067, P0.010). However, only FENa remained significantly correlated with the uAGT level after adjustment for gestational age (P=0.043, GLM univariate analysis, the data were log-transformed). Correlation analyses of log-transformed data are shown in Figure 2.

Correlation between urinary angiotensinogen and urinary sodium/potassium ratio or urinary fractional excretion of sodium (FENa), potassium (FEK) or chloride (FECl). For undetectable levels, the values of urinary angiotensinogen were arbitrarily given a value of 0.03 ng/ml, corresponding to the detection limit. Data were log-transformed, n=98.
Correlation between uAGT and the urinary levels of CysC, albumin and α1-microglobulin
The uAGT level was significantly positively correlated with the urinary levels of CysC (R2=0.482, P<0.001), albumin (R2=0.123, P<0.001) and α1-microglobulin (R2=0.218, P<0.001) in Spearman’s rank analysis. The correlation between uAGT and uCysC levels remained significant after adjustment for gestational age, birth weight, SNAP, FENa, FEK, FECl, urinary sodium/potassium ratio, urinary albumin and urinary α1-microglobulin (P<0.001). However, the correlation of the uAGT level with the urinary level of albumin and α1-microglobulin did not remain significant after adjustment for the level of uCysC (P>0.05, GLM univariate analysis, the data were log-transformed). The positive correlation between the uAGT level and the urinary level of CysC, albumin or α1-microglobulin performed with log-transformed data is shown in Figure 3.
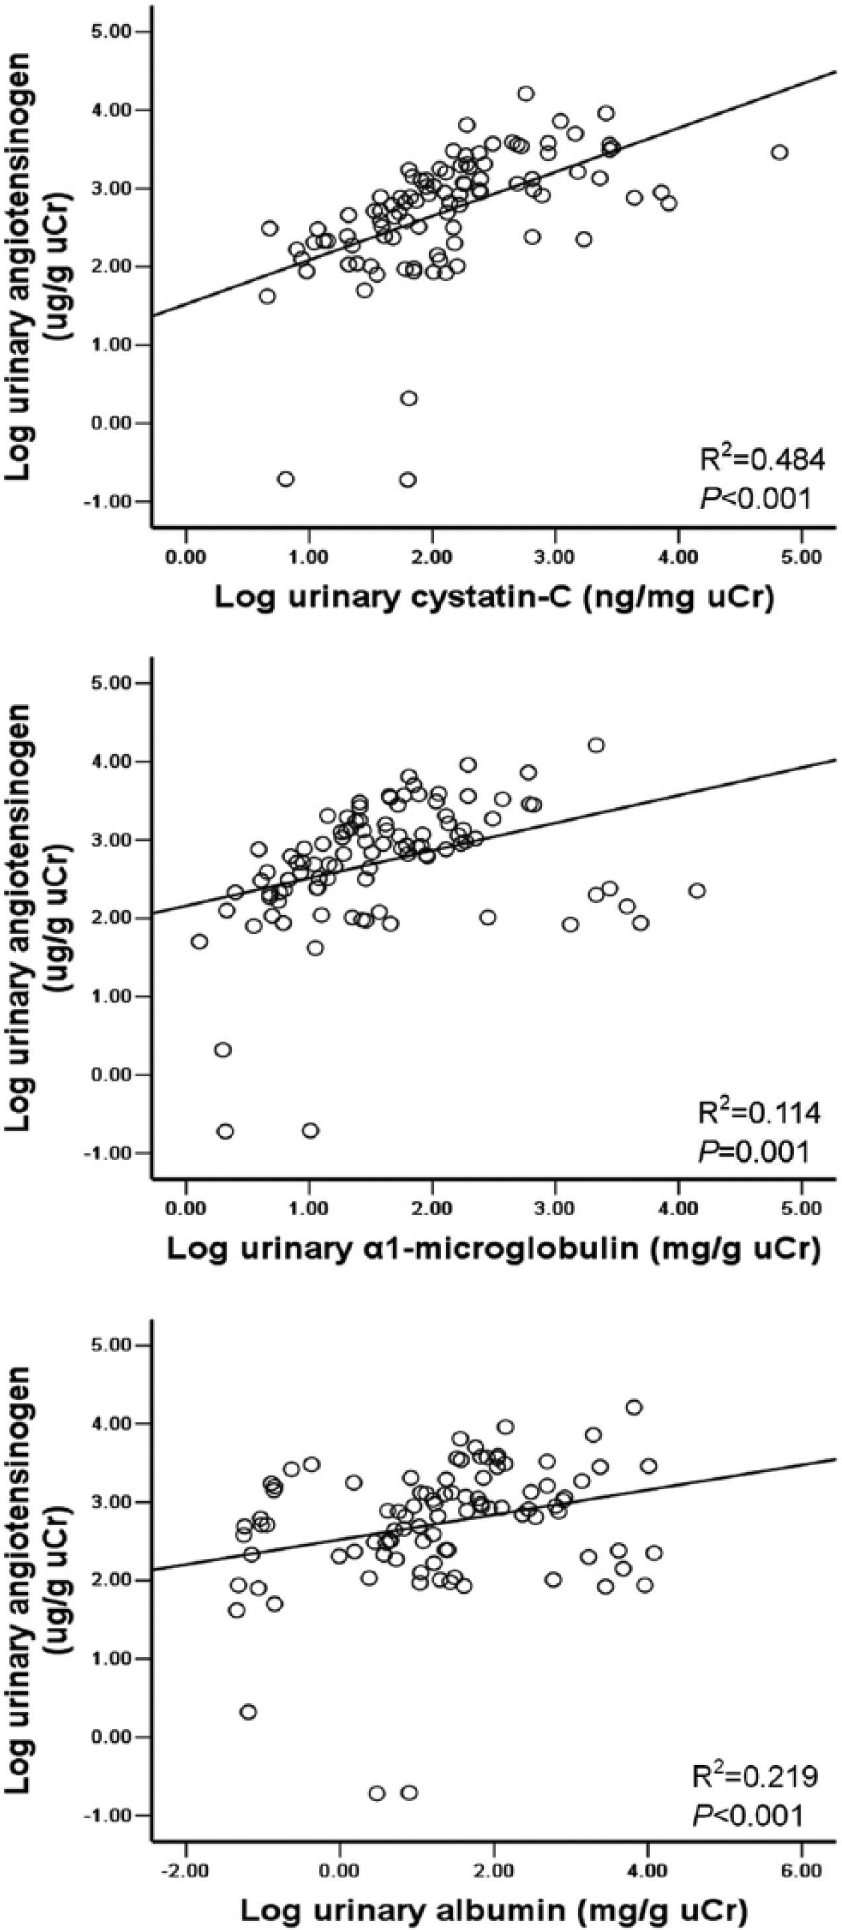
Correlation between urinary angiotensinogen and urinary level of cystatin-C, albumin or α1-microglobulin. For undetectable levels, the values of angiotensinogen and cystatin-C in urine were arbitrarily recorded as 0.03ng/ml and 10 ng/ml, respectively, corresponding to the detection limit. Data were log-transformed, n=98.
Comparison of the uAGT level in neonates with urinary CysC-to-creatinine ratio ⩾2500 ng/mg to those with a ratio <2500 ng/mg
The concentration of uAGT was significantly higher in critically ill neonates with a urinary CysC-to-creatinine ratio ⩾2500 ng/mg (2985.8 (652.3–9094.3) vs. 634.5 (0.19–16178.1) µg/g uCr; P=0.009) as compared to those with a ratio <2500 ng/mg, which was shown to be the optimal cut-off value to predict AKI development in critically ill neonates in our previous study. 22 Moreover, this difference remained significant after adjustment for gestational age, birth weight and SNAP by ANCOVA (P<0.001). The comparison of log-transformed uAGT levels between these two groups is shown in Figure 4.

Comparison of urinary angiotensinogen level in critically ill neonates with urinary cystatin-C-to-creatinine ratio ⩾2500 ng/mg (n=8) and in those with <2500 ng/mg (n=90), which was the optimal cut-off value shown to predict acute kidney injury in critically ill neonates in our previous study. For undetectable levels, the values of angiotensinogen in urine were arbitrarily given a value of 0.03 ng/ml, corresponding to the detection limit. Data were log-transformed. Each circle represents an individual patient, and horizontal lines indicate median values.
Correlation between uAGT and the plasma level of angiotensinogen
To determine whether the uAGT level is related to the plasma angiotensinogen concentration, we analysed the correlation between plasma and urinary levels of angiotensinogen. Because of the difficulty in collecting blood samples during the first 24 hours of life, venous blood samples were obtained in only 48 patients. Plasma angiotensinogen levels were detectable in all the samples (86.78 (25.06–239.50) µg/ml, n=48). There was no significant correlation between the uAGT level (104.31 (0.03–241.27) ng/ml, n=48) and the level of angiotensinogen in plasma (R2=0.015, P=0.411, n=48).
In addition, there was no significant difference between the uAGT level in 48 patients and in all 98 patients (104.31 (0.03–241.27) ng/ml vs. 96.90 (0.03–241.56) ng/ml, P=0.740).
Discussion
This study provides initial data on the uAGT level during the first 24 hours of life in critically ill neonates. We evaluated the impact of multiple covariates on the uAGT level and determined the correlation of uAGT with renal function. Although previous studies suggest that uAGT originates from angiotensinogen in the kidney, rather than from angiotensinogen in the plasma,2,27 the data are not entirely consistent. By measuring uAGT in patients with type 2 diabetes, Terami et al. 28 suggested that plasma angiotensinogen is filtered through glomerular capillaries and that uAGT is mainly derived from the plasma. In the present study, there was no relationship between plasma and urinary levels of angiotensinogen. Thus, it is unlikely that the increased uAGT is accounted for by leakage across the glomerular filtration barrier in immature neonates. Our observations support the concept that uAGT originates from angiotensinogen in the kidney.
Because multiple factors that affect renal function and limit postnatal renal functional adaptation to endogenous and exogenous stress are present in critically ill neonates, 29 this study examined the impact of multiple covariates, including gestational age, birth weight, gender, Apgar score and the severity of illness as assessed by SNAP, on the level of uAGT.
We found that the uAGT level in the first day of life decreased with increasing gestational age and birth weight, suggesting that the uAGT level might decrease with increasing maturity of the neonates. Our results are in accordance with previous studies. It is well known that the RAS is functional during fetal life.16,30 The renin concentration in umbilical venous blood and the activity of the angiotensin-l-converting enzyme in fetal blood samples exceed the corresponding maternal values, which suggests that the activity of the fetal RAS is independent from the maternal RAS system.31–33 In addition, RAS activity is higher during the fetal period compared to postnatal life.15,32 Accordingly, angiotensin-l-converting enzyme activity measured in the peripheral blood during the first 24 hours of life was significantly higher in premature infants compared to full-term infants. 34
The urinary fractional excretion of electrolytes is high in neonates and even higher in premature neonates, indicating immature renal tubular function.35,36 The correlation between uAGT and FENa suggests that the increased uAGT level in neonates might be partially due to renal immaturity. The uAGT level was positively correlated with the urinary sodium/potassium ratio in the present study, and the increased urinary sodium loss accompanied by limited renal potassium excretion seems to suggest an important role of the RAS system. 37 Previous studies have suggested that the urinary sodium/potassium ratio is closely associated with aldosterone activity, reflecting both the aldosterone blood level and responsiveness of kidney tubules to aldosterone action. The increased urinary sodium/potassium ratio also indicates low aldosterone activity in neonates.26,38 However, the weak correlation between the uAGT level and the urinary sodium/potassium ratio did not remain statistically significant after adjusting for gestational age. Thus, this correlation does not necessarily indicate a relationship between uAGT and aldosterone activity, but instead more likely reflects the immaturity in renal tubular handling of sodium and potassium.
The major finding of this study was the positive relationship between uAGT and uCysC levels in critically ill neonates, even after adjustment for gestational age, birth weight, the severity of illness and the urinary levels of albumin and α1-microglobulin. Our results are in line with previously published findings, suggesting that uAGT is correlated with urinary albumin and α1-microglobulin.12,28 In the present study, however, the correlation between uAGT and the urinary levels of albumin and α1-microglobulin did not remain significant after controlling for uCysC.
The increased concentration of CysC in the urine reflects renal tubular injury and impairment, independent of the GFR. 39 Urinary CysC is an independent predictor of AKI in neonates.21,22 Therefore, the independent correlation between uAGT and uCysC levels in the present study suggests that higher uAGT levels might result from greater renal injury in immature neonates. This result is consistent with a recently published finding in adult patients with cardiac surgery, showing that elevated urinary angiotensinogen is associated with worsening of AKI. 13 Our data indicate that the presence of uAGT is not a non-specific result of proteinuria. In particular, the increased urinary excretion of angiotensinogen in neonates reflects renal injury, which may promote intrarenal RAS activation and the production of tubular angiotensinogen. Our findings imply that the RAS may be critical for normal renal maturation, but also may be mechanistically involved in renal injury during renal maturation. This is supported by previous studies suggesting the association between pharmacological inhibition of the RAS and the risk of developing AKI, although there are inconsistent reports.40,41 It has been demonstrated that uAGT reflects renal angiotensin II production, the most important component of the RAS. Positive correlation between uAGT and intrarenal angiotensin II has been shown in clinical and experimental studies.14,27,42,43
The concentration of uAGT during the first 24 hours of life was increased in neonates with RDS, even after adjustment for gestational age. It is possible that the high levels of uAGT in neonates with RDS are due to kidney immaturity and potential kidney injury, as RDS occurs almost exclusively in premature infants, and critically ill neonates with RDS are predisposed to the development of kidney injury. 29 However, although our findings suggest a large amount of uAGT is released by the kidneys, the possibility that the increased uAGT level in neonates with RDS may have been caused by activation of the circulating RAS must be considered. These results are consistent with a previous study in which serum angiotensin-l-converting enzyme activity was significantly elevated in newborn infants with idiopathic RDS, reflecting activation of the renin–angiotensin–aldosterone system in response to stress. 44
To our knowledge, this is the first clinical study reporting urinary levels of AGT during early life in critically ill neonates. Our data suggest the potential of uAGT as a novel tool for assessing intrarenal RAS activity in neonates. However, our study has certain limitations. First, the physiological mechanism underlying the association between uAGT and renal injury in neonates is uncertain. Although activation of the RAS is clearly established to be linked to chronic diseases such as hypertension and CKD,12,43 its link to acute injury remains controversial.13,40,41 Further studies are needed to elucidate the underlying mechanism of the association between the RAS and renal injury in immature neonates. Second, we demonstrated significantly higher concentrations of uAGT in critically ill neonates with a urinary CysC-to-creatinine ratio ⩾2500 ng/mg, which was the optimal cut-off value shown to predict AKI in our previous study. 22 Howerer, the current study was unable to address whether uAGT, as a biomarker, is associated with the risk of AKI in critically ill neonates. Third, the urine samples used for the measurement of angiotensinogen were collected only during the first 24 hours of life. Thus, time-dependent changes in this parameter during postnatal maturation were not evaluated. In particular, it remains to be evaluated whether changes in the uAGT concentration over time could reflect the clinical responses of critically ill neonates to treatment. Fourth, among all the 98 patients, blood samples were obtained in only 48 patients for analysing the correlation between plasma and urinary levels of angiotensinogen. Nevertheless, there was no difference between the uAGT level in 48 patients and in all the 98 patients. Fifth, food intake was not recorded, although the total amount of food consumed during the first day of life is quite small. Whether dietary sodium intake, which is considered to be an important modifier of the intrarenal RAS, 45 could impact the production of uAGT remains to be elucidated.
In conclusion, the current study demonstrated that the uAGT level was negatively associated with gestational age, but independently positively associated with the uCysC level in critically ill neonates. Thus, our data suggest that the uAGT level correlates with the overall maturity of renal function during the early postnatal period and that increased uAGT levels may reflect renal injury in immature neonates. Further studies are necessary to clarify whether elevated uAGT represents a specific indicator of AKI in neonates.
Footnotes
Conflict of interest
The authors declare that there is no conflict of interest.
Funding
This work was supported by grants from the National Natural Science Foundation of China (81370773), the Natural Science Foundation of Jiangsu Province (BK2012604), and the Natural Science Foundation for Research Projects in the Colleges and Universities of Jiangsu Province (12KJB320006).