
Abstract
Background:
Aldosterone synthase (CYP11B2) is one of the most studied candidate genes related to essential hypertension (EH) and left ventricular hypertrophy (LVH). Some studies have focused on the relationship between −344C/T polymorphism (rs1799998) in the CYP11B2 gene and LVH, but the results are controversial. This meta-analysis is purposed to reveal the relationship between the −344C/T and the left ventricular structure and function, including left ventricular end diastolic dimension (LVEDD), left ventricular end systolic diameter (LVESD), left ventricular mass/left ventricular mass index (LVM/LVMI), left ventricular posterior wall thickness (LVPWT), and interventricular septal wall thickness (IVS).
Methods:
A literature search of PubMed and Embase databases was conducted on articles published before January 27, 2014. The odds ratios with 95% confidence intervals were calculated. Heterogeneity analyses were performed using meta-regression. Tests for publication bias were also performed and biased studies should be removed from subsequent analyses.
Results:
There were 20 studies with a total of 6780 subjects meeting the inclusion criteria. The main finding was that concentration levels of LVEDD and LVESD were higher in CC homozygous individuals than in TT homozygous individuals in the whole group. In the Asian subgroup, TT homozygous individuals had larger IVS than CC homozygous individuals. In the Caucasian normotension subgroup, CC homozygous individuals had larger LVM/LVMI than TT homozygous individuals. In the Asian essential hypertension subgroup, TT homozygous individuals had larger LVPWT values than CC homozygous individuals.
Conclusions:
The present findings support the hypothesis that CC homozygous individuals may have greater left ventricular diameters (LVEDD and LVESD) regardless of their ethnicities or physical conditions.
Background
Left ventricular hypertrophy (LVH) is not only an inevitable adaptation to increased hemodynamic load in hypertension, but it is one of the most important, strongest, and independent risk factors for cardiovascular morbidity and mortality. It has been postulated that left ventricular growth and structure have complex interactions with genetic, environmental, and lifestyle control factors. 1 LVH was first deemed a complication of hypertension 150 years ago at autopsy, and by chest X-ray in the following years. Over the years, electrocardiography has become the first choice for the definite diagnosis of LVH, particularly in hypertensives. 2 LVH was diagnosed mainly by left ventricular mass (LVM) or left ventricular mass index (LVMI) in ultrasonic cardiography. 3
Between 30% and 70% of the population variability in LVH appears to be genetically determined.4–6 In this way, focusing on the specific genes that influence quantitative variation in left ventricular structure is merited, and the findings may generate insights into the pathogenesis of cardiac hypertrophy. The renin-angiotensin-aldosterone system (RAAS) has been shown to influence myocardial growth independently of hypertension, and it has been speculated that the polymorphisms of genes coding this system may explain the heritability of LVH.
Aldosterone synthase (CYP11B2) is a key enzyme in RASS. In 1998, Kupari et al. originally reported the −344C/T polymorphism (rs1799998) in CYP11B2 was associated with left ventricular size and LVM. 7 Then a large number of studies seeking to link the −344C/T polymorphism to LVH were conducted in individuals of different races and ethnic groups using different statistical models in various left ventricular structure and function indicators, but the results have often been unreproducible.8–13 A meta-analysis regarding the relationship between −344C/T and left ventricular size was published in 2008. This meta-analysis covered 14 studies that were performed mainly on Europeans, but in recent years, many studies covering other ethnic groups, especially Asians, have been published. 14 In recent studies, sample size is much greater than previously. Here, all available data were collected and the influence of the −344C/T polymorphism on the left ventricular structure and function, such as LVM, left ventricular end diastolic dimension (LVEDD), and left ventricular end systolic diameter (LVESD), was systematically evaluated.
Methods
Literature search
To identify all the studies that addressed the association between CYP11B2 −344C/T polymorphism and left ventricular structure and function, a systematic computerized literature search of PubMed and Embase databases (up to March 5, 2014) was conducted using the following keywords and Medical Subject Headings (MeSH) terms: (aldosterone synthase or CYP11B2) and (gene(s) or variant(s) or polymorphism(s) or allele(s)) and (left ventricular). Search results were limited to studies on human subjects. We searched the articles without language limitation. The full text of the retrieved studies was scrutinized, and all of the references cited in the articles were searched to identify potentially relevant studies. All the articles were organized by year of publication and first author. They were entered into a dedicated literature database.
Selection criteria
The studies had to meet all the following criteria. Inclusion criteria: (1) The articles had to include at least one of the following echocardiographically measured traits: LVM, LVMI, left ventricular end diastolic volume index (LVEDVI), LVEDD, left ventricular end systolic volume index (LVESVI), LVESD, left ventricular posterior wall thickness (LVPWT), and interventricular septal wall thickness (IVS). (2) Only research articles and clinical trials were included. (3) Eligible articles had to provide sufficient information to extract or calculate for the CYP11B2 −344C/T genotype number of subjects and the mean and standard deviation (SD) of continuous left ventricular structure/function indicators. (4) If the eligible article was a case-control study, both case and control groups had to be involved and the genotype distribution of control population had to obey the Hardy-Weinberg equilibrium (HWE). Duplicates were removed. Exclusion criteria: Studies involving non-echocardiographically measured phenotypes and studies assessed by magnetic resonance imaging were excluded. Studies in patients with specific disorders, such as renovascular diseases and renal dysfunction, were ignored. Data based on follow-up studies involving pharmacological interventions according to −344C/T were also excluded.
Data extraction
Two investigators (LW, JZ) read through all the research articles and extracted and calculated the required statistics and relevant information independently. Inconsistencies were discussed between the two investigators until a consensus was reached on all items. For all studies included, the following information was collected: year of publication, first author, country, journal, racial makeup of the study population, demographics, sex, age, sources of recruitment, character of participants (e.g. kinds of diseases or healthy), allelic and genotypic frequencies of the −344C/T, left ventricular phenotypes corresponding to −344C/T, and confirmation of diagnosis. If allele frequencies were not given, they were calculated from the corresponding genotype frequencies of the case and the control groups. All the eligible studies were ordered by year of publication and then were entered into a dedicated literature database. Mean ± SD was used for continuous variables. The methodology of CYP11B2 −344C/T genotyping was treated as a possible confounding factor in the statistical analysis.
Statistical analysis
Software R (http://cran.stat.sfu.ca/) and Review Manager 5.0 (Oxford, UK) were used to enter extracted data into a manageable database and for subsequent statistical analyses. Yu’s method was used to calculate the mean standardized difference, which was used to assess inter-group differences independent of the unit of measurement.4,14
Heterogeneity was tested using I square (I2). We used a random-effects model to conduct all the comparisons. 15
For the meta-regression, the dominant genetic model and homozygote comparison model were mainly used. 16 Dominant genetic models were used to compare the phenotype values of TC+CC genotype individuals to that of TT genotype individuals. Homozygote comparison models were used to compare the phenotype values of CC genotype individuals to those of TT genotype individuals. These values were found to be equal to those of an additive genetic model with selective and extreme genotypes. Empirically, the studies were regrouped into subsets by ethnicity and physical condition and the meta-regression analyses were repeated for the new subsets.
Sensitivity analyses were performed to evaluate the reliability of meta-regression results and to detect any uncertainty. 17 Sensitivity analyses were conducted by sequentially deleting a single study each time in an attempt to identify the influence of the individual data sets on pooled effect sizes. If the point estimate of the combined effect size with one study omitted lay outside the 95% confidence intervals (CIs) of the estimate with all available studies, then the study in question was considered to have excessive influence and was omitted. In addition, a regression with confounding factors as covariates was also conducted, and p values < 0.1 were considered statistically significant. 4
Publication bias was assessed using visual inspection of funnel plots and the Egger regression intercept method. P values < 0.05 were considered statistically significant. Asymmetrical funnel plots and p values < 0.05 of the corresponding Egger’s test suggested obvious publication bias.18,19
Results
Study characteristics
Figure 1 shows the process of literature searching and filtering. The search terms listed in the Methods section above were used, and 917 hits were generated in the PubMed and Embase electronic databases. Reviews of the titles found that 297 were not in humans, four were comments and responses, and 98 were reviews. Reviews of the abstracts resulted in exclusion of 497 studies because they were outside the focus of the present work. A full paper review of 37 studies was performed. Among these, 17 were excluded because their data were duplicated (n = 1) or incomplete (n = 16). Because data regarding LVM, IVS, LPWD, LVEDD, and LVESD from a study published by Rao et al. in 2003 was also included in the study published by the same team in 2004, the latter study was included in the analysis.20,21 The remaining 16 studies contained no matched phenotype or genotype data on any left ventricular echocardiography indicator. Ultimately, 20 studies met the criteria. Characteristics of the 20 included studies are listed in Table 1. Most of them were published from 1998 to 2007, one in 2011, and one in 2012. Thirteen studies were performed on Caucasians, six on Asians, and one study on a United States (US) population. Three-quarters of the studies were hospital based.9,11–13,22–31 One-quarter were population based.7,8,32,33,25 Eighteen studies used patients who suffered from cardiovascular disease (CVD). There were three ethnicities: 13 studies included Caucasian subjects, six studies included Asian subjects, and one study consisted of 279 white American subjects. HWE tests were performed for each study, and all were found to be in equilibrium.

Flowchart of studies included in this analysis.
Characteristics of the included studies. 20
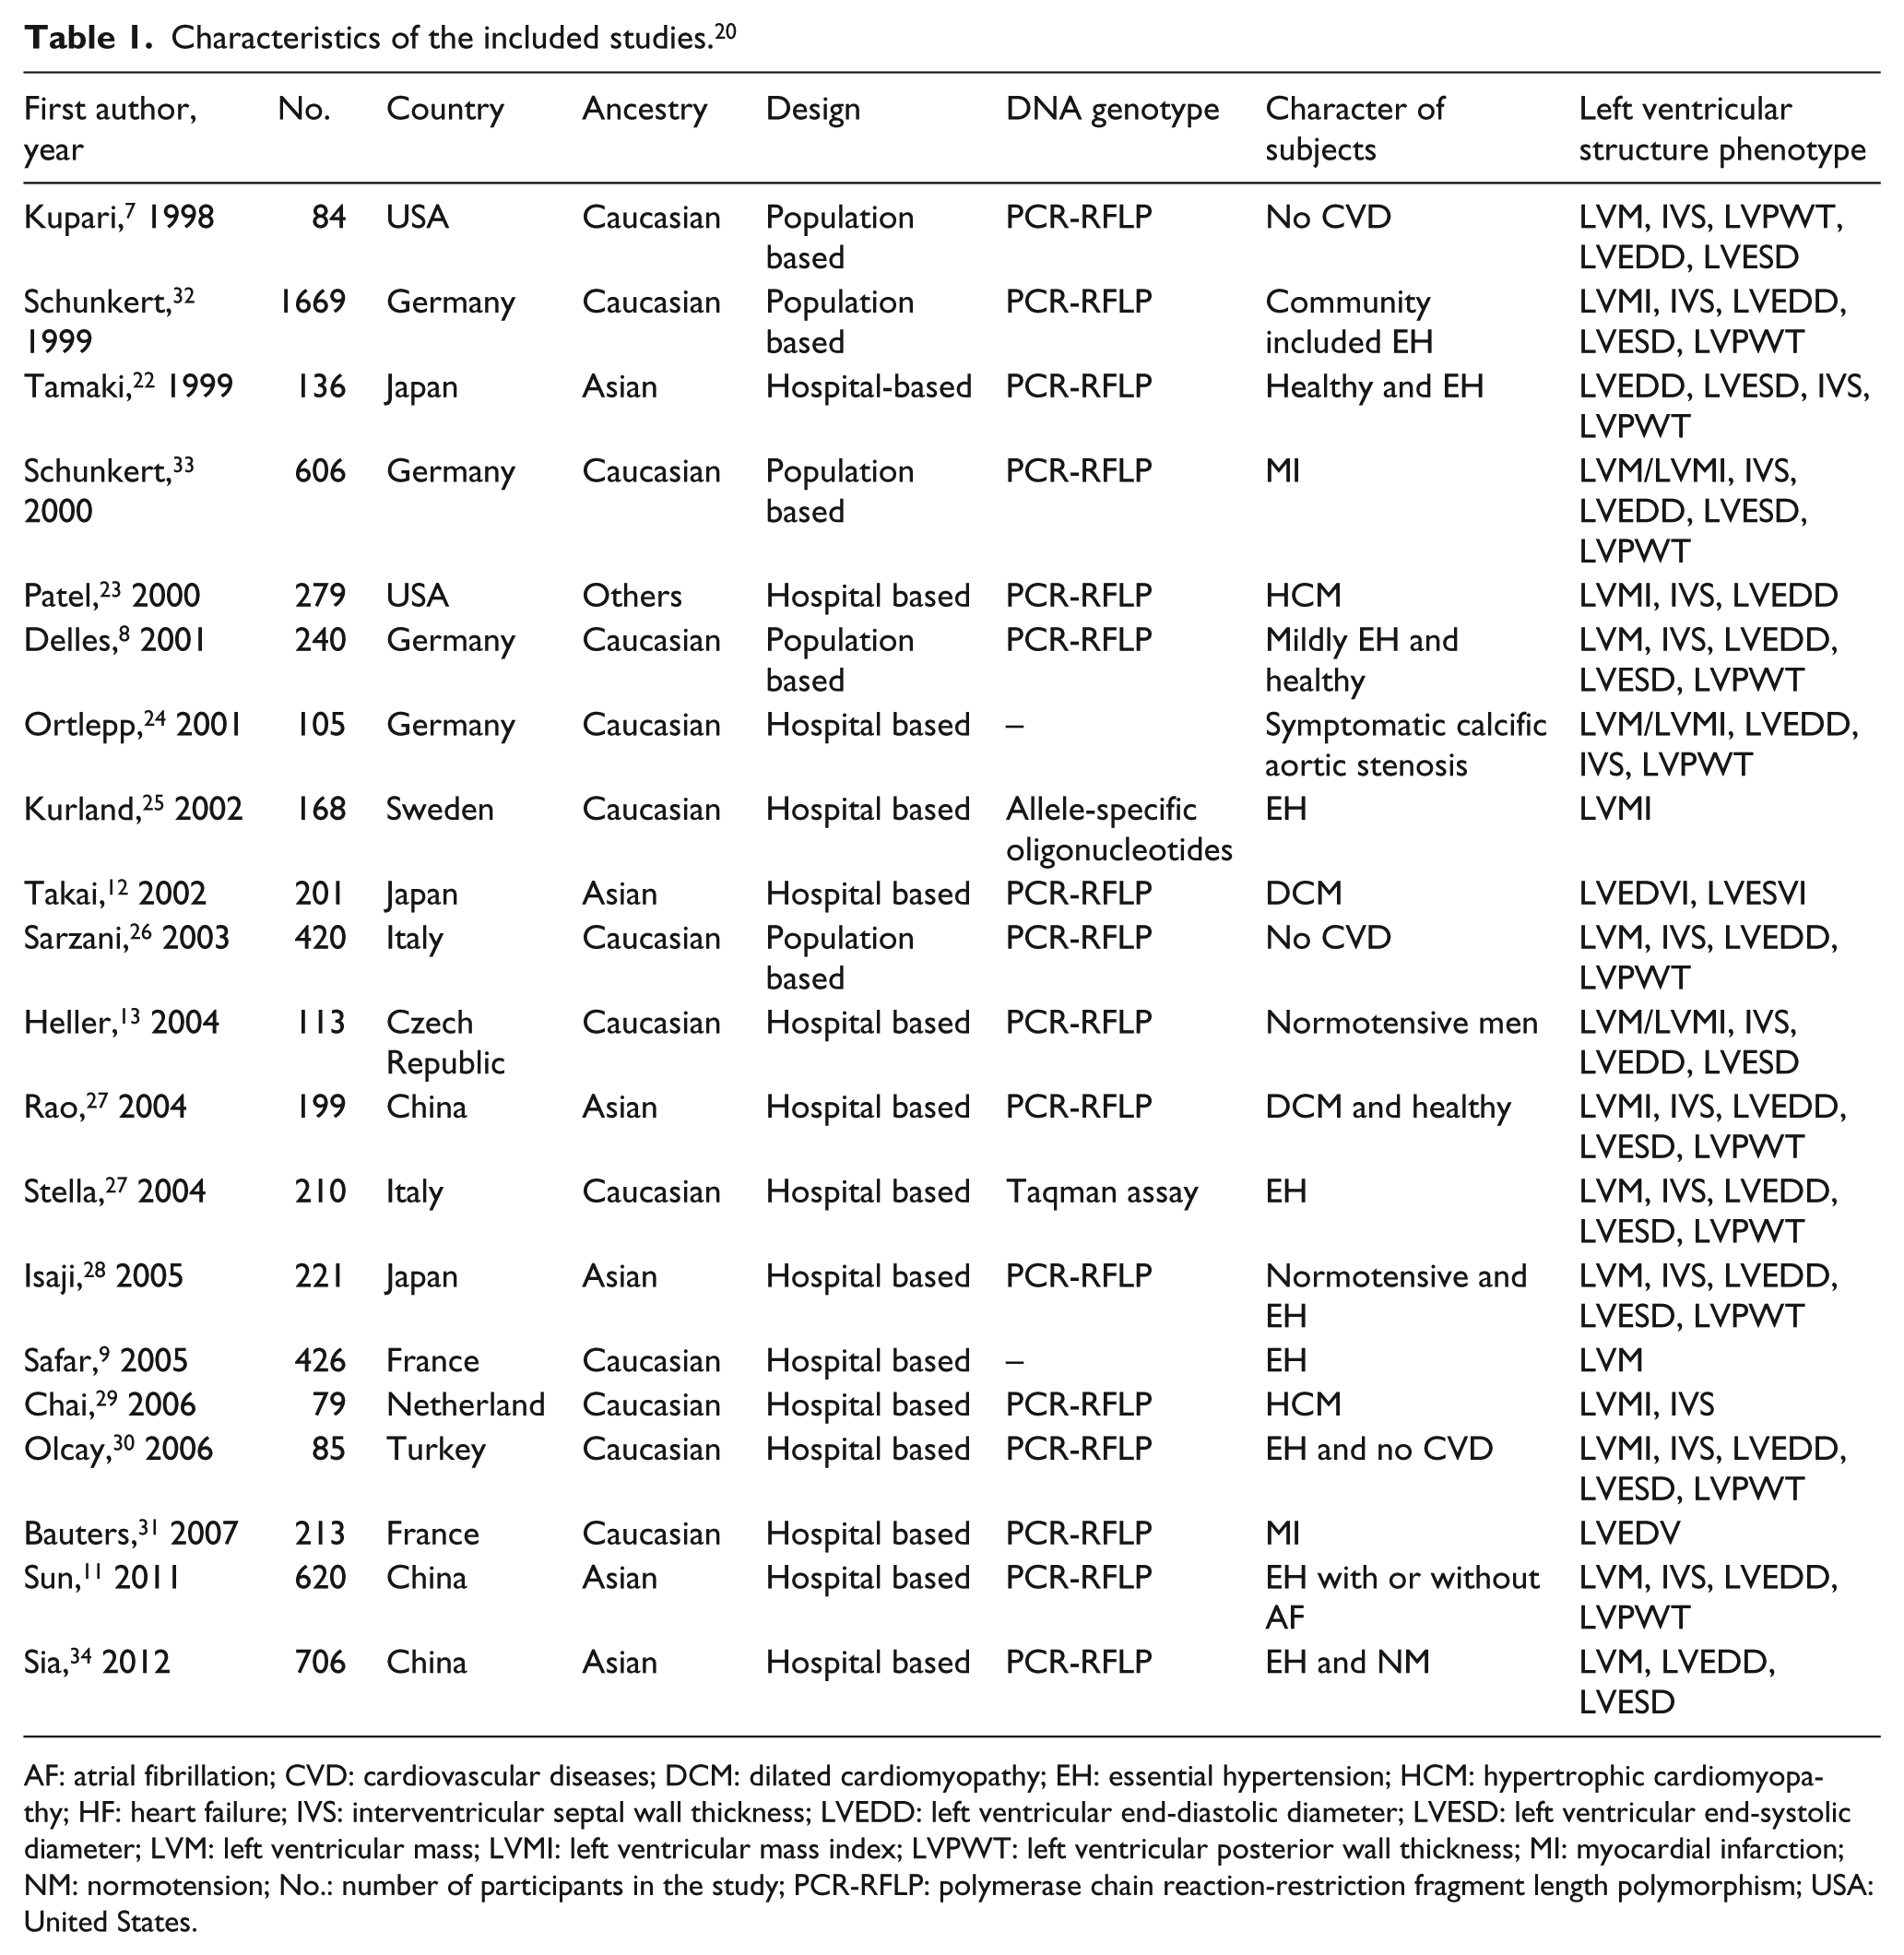
AF: atrial fibrillation; CVD: cardiovascular diseases; DCM: dilated cardiomyopathy; EH: essential hypertension; HCM: hypertrophic cardiomyopathy; HF: heart failure; IVS: interventricular septal wall thickness; LVEDD: left ventricular end-diastolic diameter; LVESD: left ventricular end-systolic diameter; LVM: left ventricular mass; LVMI: left ventricular mass index; LVPWT: left ventricular posterior wall thickness; MI: myocardial infarction; NM: normotension; No.: number of participants in the study; PCR-RFLP: polymerase chain reaction-restriction fragment length polymorphism; USA: United States.
The genotyping of CYP11B2 −344C/T polymorphism was mainly carried out across studies using polymerase chain reaction-restriction fragment length polymorphism (PCR-RFLP) followed by digestion with the restriction enzyme Hae III in 16 studies. One study was genotyped using allele-specific oligonucleotides. 25 One study was genotyped by Taqman assay. 27 Two studies did not mention what method had been used (Table 1). However, the genotyping methods did not show any obvious confounding effect. In the eligible case-control studies, all the control populations obeyed HWE.
LVM/LVMI
There were 17 studies included in the present analysis of LVM/LVMI. A comparison of 5649 individuals who provided relevant data about LVM was performed (Table 2). Fifteen studies were evaluated (pe = 0.1288, pheterogeneity < 0.01) for the differences in LVM between TT homozygotes and CC homozygotes (1337 vs 846). Seventeen studies (pe = 0.2642, pheterogeneity < 0.01) were used to compare TT to TC+CC (1976 vs 3673). There was no significant publication bias, but significant heterogeneity was detected among the reports. Then TT and CC/TC+CC were compared across different ethnicities with respect to essential hypertension (EH) and normotension (NM). No statistically significant differences were detected when the LVM/LVMI of TT and CC/TC+CC were compared, even in the EH and NM subgroups (see Figures 2 and 3). The comparison results were not significantly different under the allele model (C/T).
Pooled estimates of subgroup associations of LV structure and the CYP11B2 −344C/T.
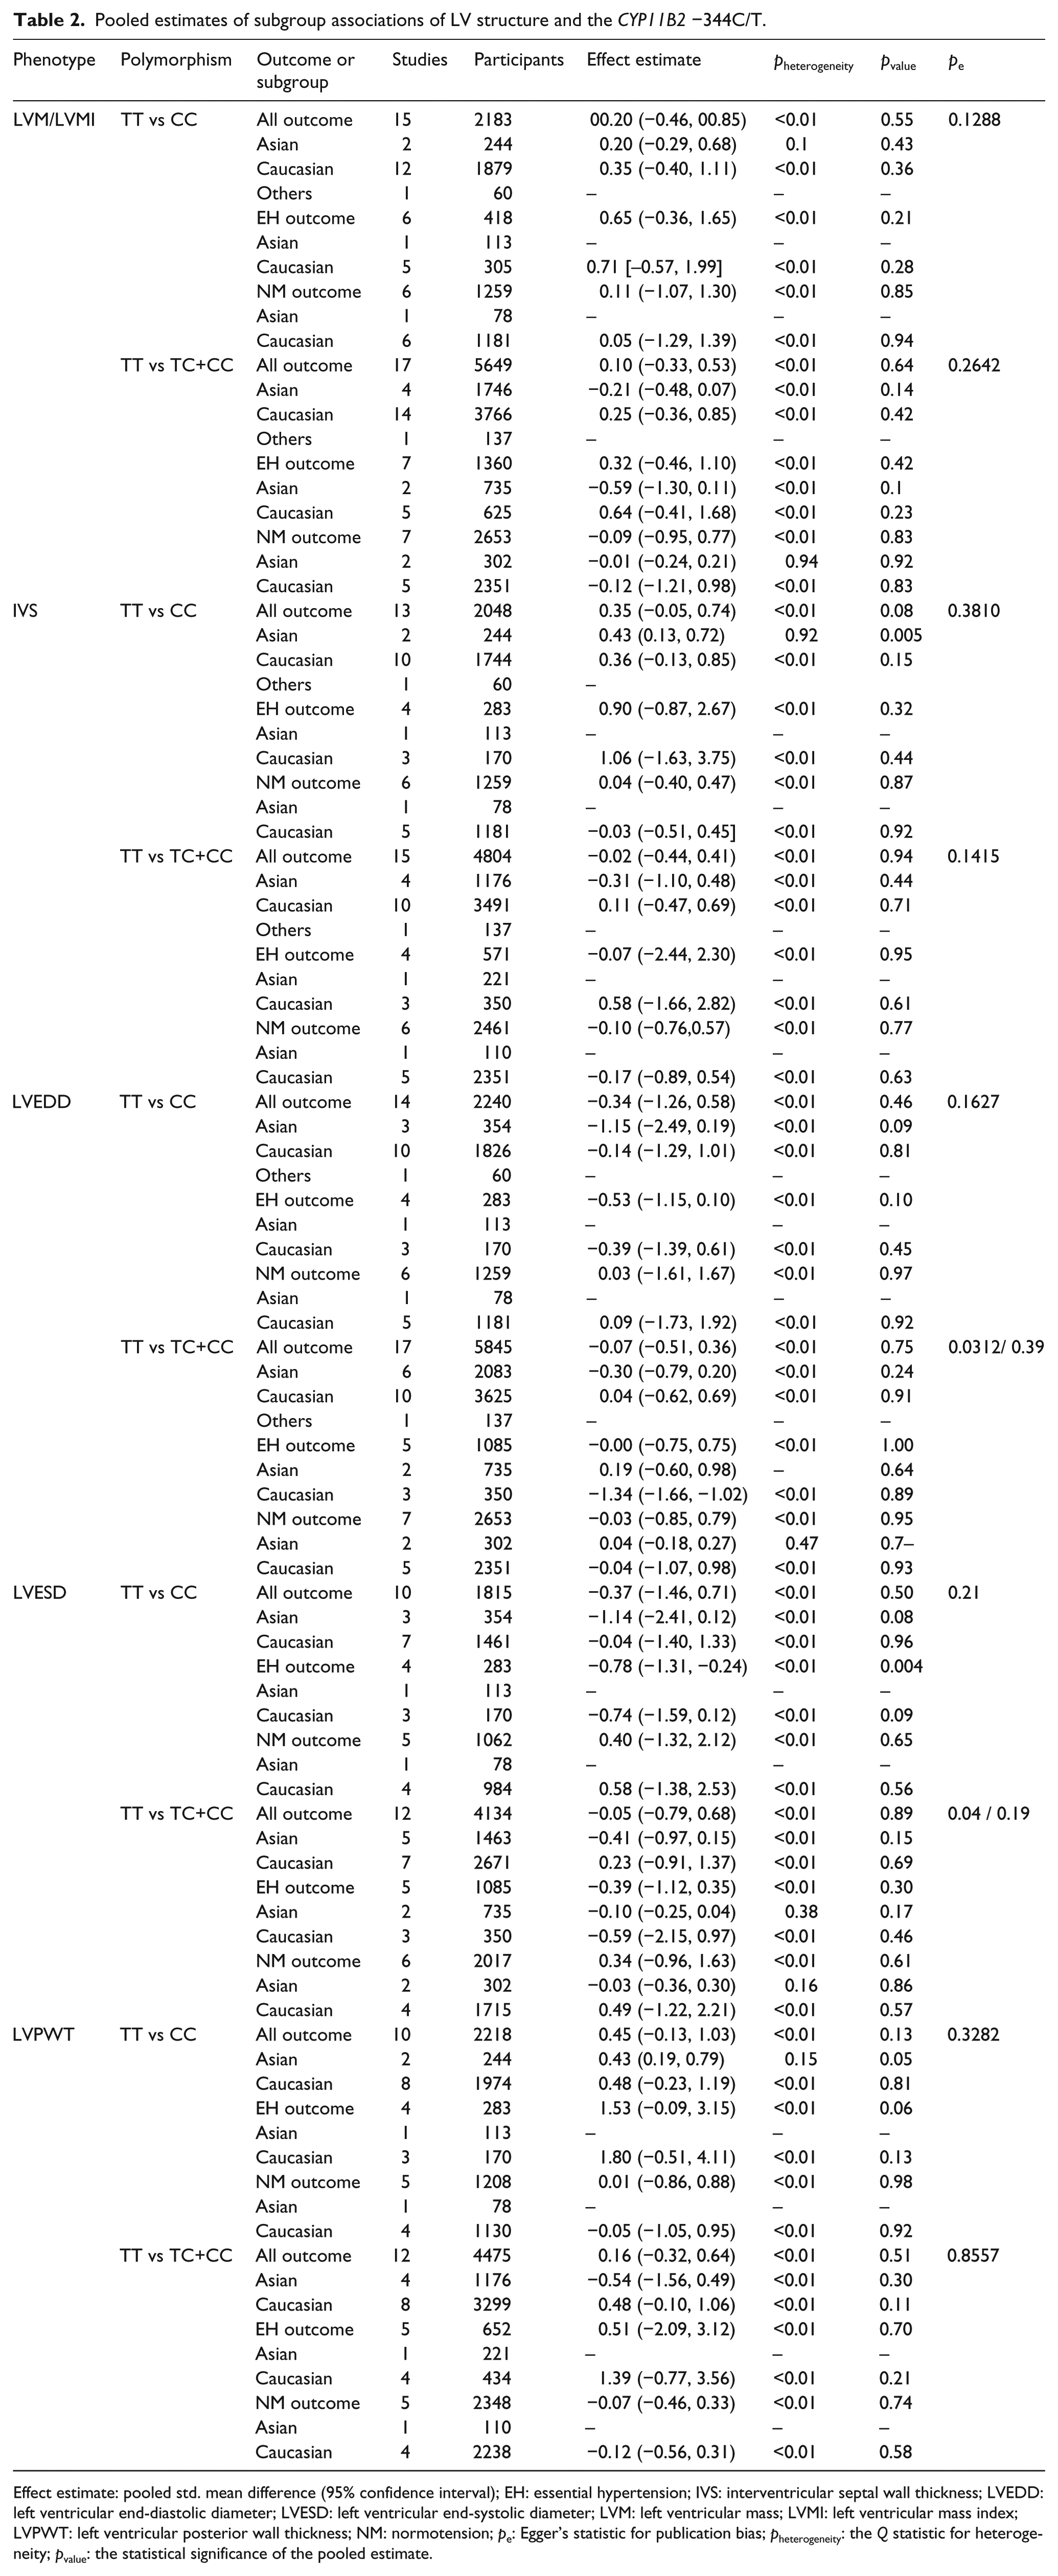
Effect estimate: pooled std. mean difference (95% confidence interval); EH: essential hypertension; IVS: interventricular septal wall thickness; LVEDD: left ventricular end-diastolic diameter; LVESD: left ventricular end-systolic diameter; LVM: left ventricular mass; LVMI: left ventricular mass index; LVPWT: left ventricular posterior wall thickness; NM: normotension; pe: Egger’s statistic for publication bias; pheterogeneity: the Q statistic for heterogeneity; pvalue: the statistical significance of the pooled estimate.

Forest plot of LVM/LVMI in TT versus CC homozygotes.
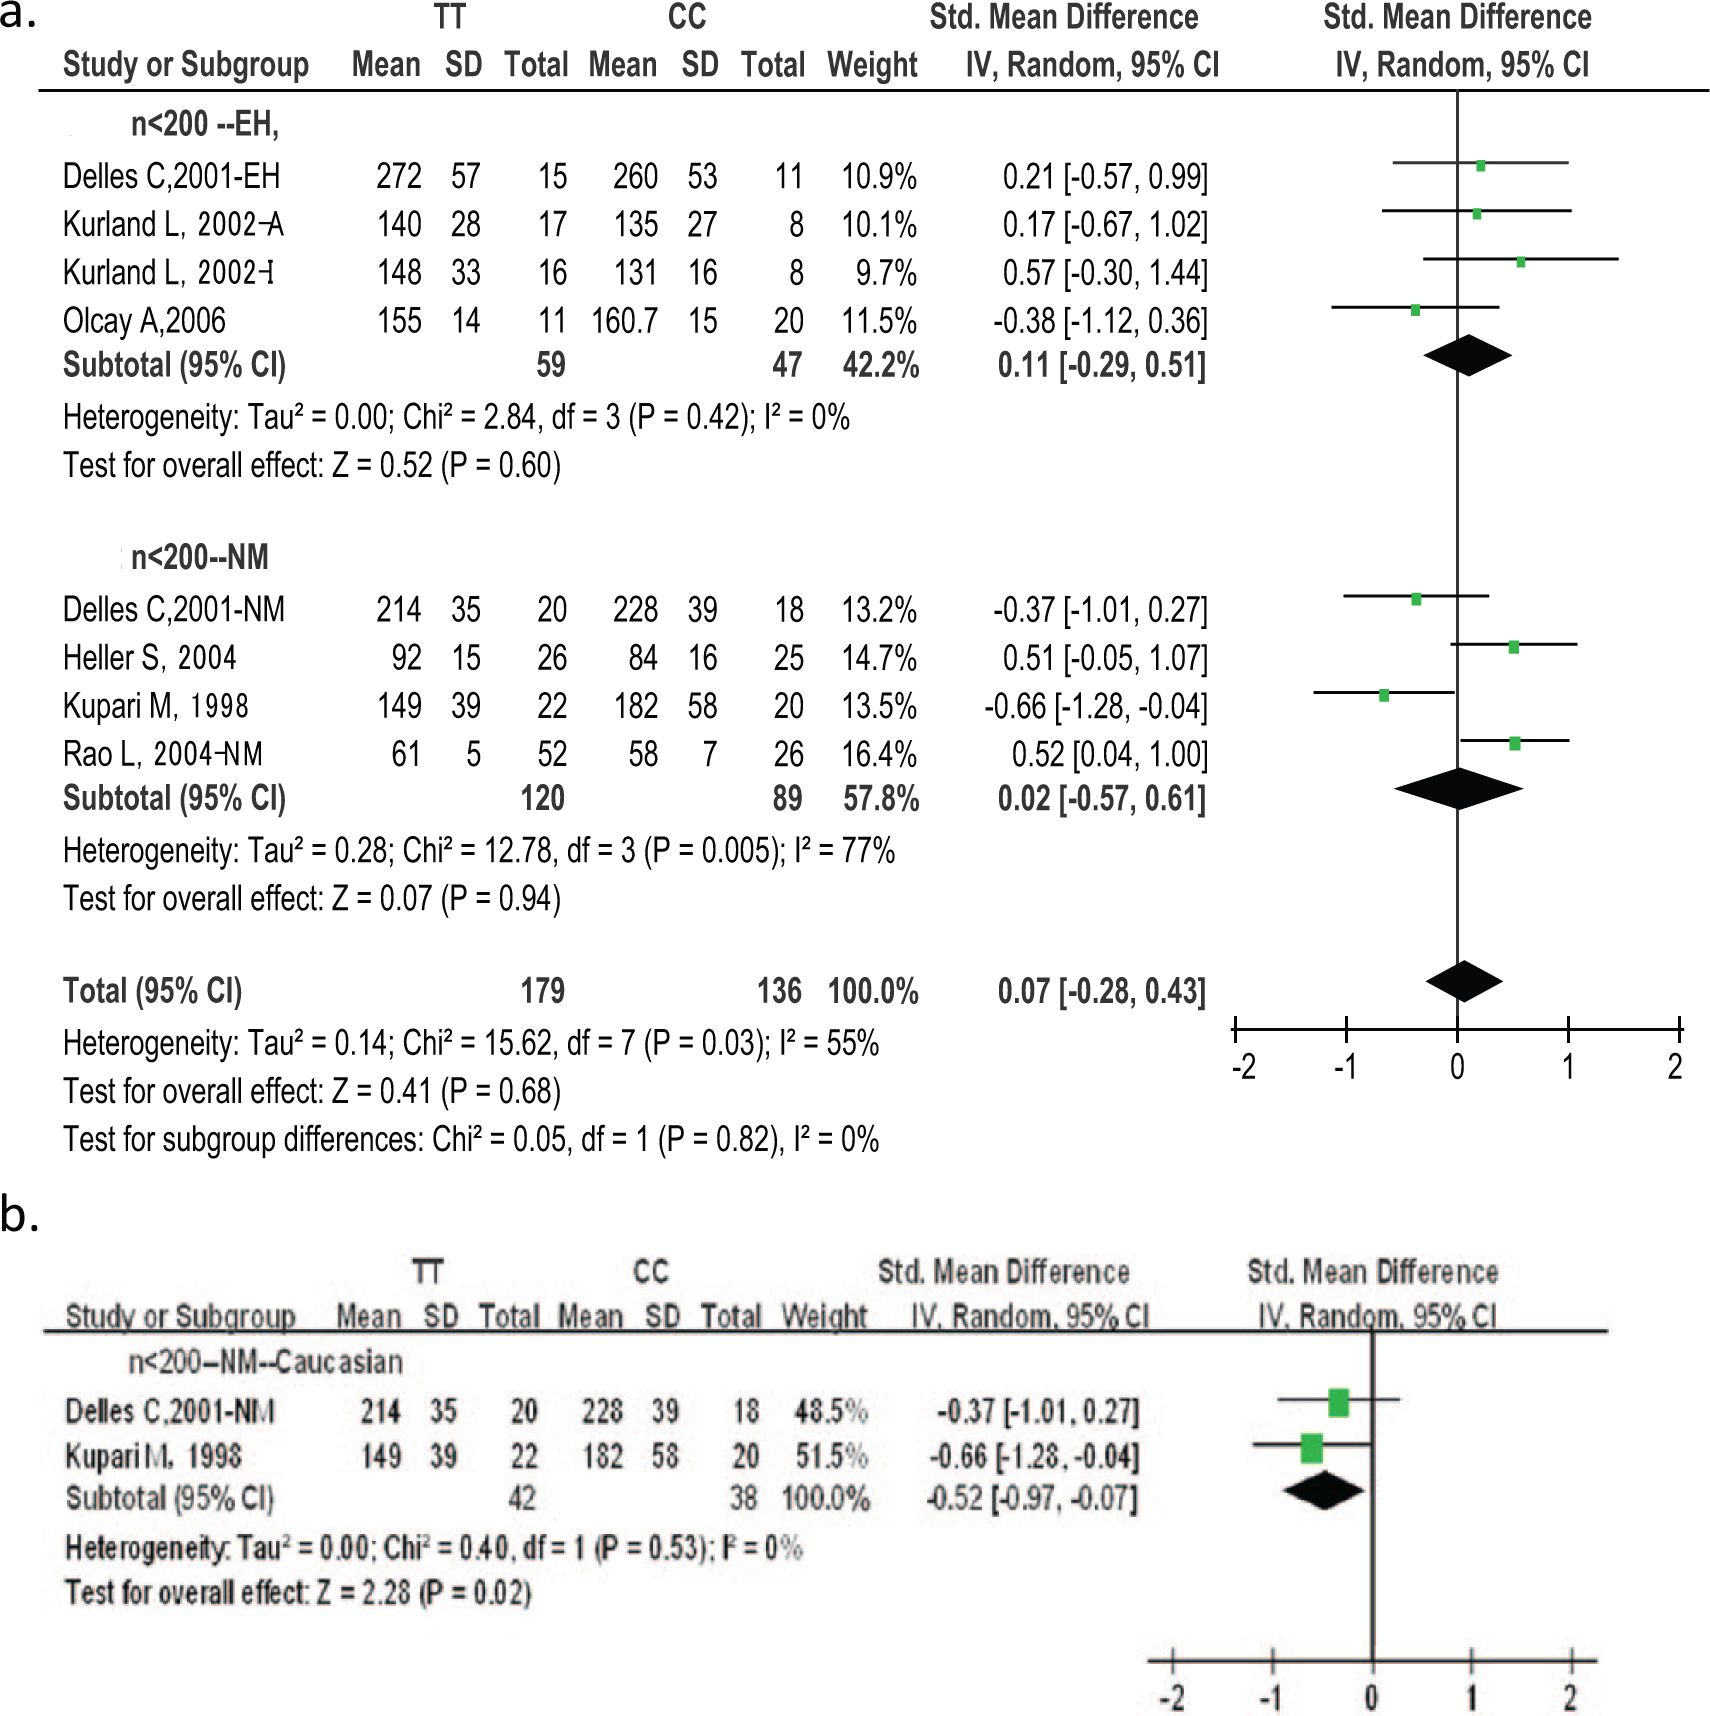
Forest plot of LVM/LVMI in TT versus CC homozygotes (n < 200).
In order to confirm the source of heterogeneity, regression analyses of echocardiographic LVM/LVMI were performed. The contrast between TT and CC is shown in Table 3. Table 3 summarizes the results of regression according to single nucleotide polymorphism (SNP) −344C/T, ethnicity, country, design of included studies, number of included studies, age, sex, character of participants, prevalence of EH, year of publication, body mass index (BMI), systolic blood pressure (SBP), and diastolic blood pressure (DBP). The regression analyses showed the following: LVM/LVMI could be affected by the number of studies (p = 0.04), study design (p = 0.06), sex (p = 0.09), and BP (pSBP = 0.05, pDBP = 0.09). When the heterogeneity of any studies with respect to number of participants n < 200, or n > 200, ethnicity, or EH and NM was close to zero (Figure 3). CC was associated with larger LVM values than TT (pheterogeneity = 0.53, I2 = 0%, pvalue = 0.02, 95% CI −0.52 (−0.97, −0.07)) in the n < 200 NM Caucasian subgroup (Kupari 7 , Delles 8 ). No difference in LVM between TT and CC/TC+CC was observed in any other subgroup.
Meta-regression analyses for left ventricular structure variables under the homozygote comparison.

Age: average age of participants; Character: feature of participants; Country: participants’ state; Number: number of sample; Sex: percentage of males; Year: publication year; BMI: body mass index; DBP: diastolic blood pressure; SBP: systolic blood pressure; EH: essential hypertension; IVS: interventricular septal wall thickness; LVEDD: left ventricular end-diastolic diameter; LVESD: left ventricular end-systolic diameter; LVM: left ventricular mass; LVMI: left ventricular mass index; LVPWT: left ventricular posterior wall thickness; NM: normotension.
For the sensitivity analyses, one study was omitted at a time and the pooled SD was recalculated. The mean difference of the remaining studies was also calculated. No study was found to move the point estimate outside the 95% CI.
IVS
No significant publication bias was detected in the contrast of IVS with TT and CC/TC+CC. There were 13 eligible studies (2048 individuals) in the analysis of IVS and comparison of TT and CC. No significant difference was detected for the total group (p = 0.08). The results were also not significant in the NM or EH subgroups (pNM = 0.87 and pEH = 0.32). After adjustment for ethnicity as a covariate, the results became significant. When regression was performed for IVS under the homozygote comparison, age, sex, character, year of publication, SBP, and DBP were found to affect the results of the IVS comparison. There was no significant result under the allele model (C/T) in IVS.
Sensitivity analyses for IVS showed that no single study could affect the results of the comparison between TT and CC or TC+CC.
LVEDD
A total of 14 studies were available for comparison of TT and CC (1383 vs 857 individuals). There were 17 studies available for comparison of TT and TC + CC (1738 vs 3401 individuals). There was obvious publication bias (pe = 0.0312) for LVEDD under the TT vs TC+CC genetic model. Sensitivity analyses were performed and results showed that a part of one multi-center study could change the total LVEDD comparison results between TT and CC/TC+CC. 32 The publication bias disappeared after this part of the study was removed (TT vs CC, pe = 0.16; TT vs TC+CC, Pe = 0.39). The report in question showed this group of participants to be older (25–74 years old) and the age distribution to be more balanced within each decade group than in other studies. The LVEDD of the two parts showed obvious heterogeneity. The pooled LVEDD comparison is shown in Figure 4 (TT vs CC, 95% CI −0.60 (−1.15, −0.06, pvalue = 0.03; TT vs TC+CC, 95% CI −0.17 (−0.49, 0.15), pvalue = 0.29). CC was found to have a larger LVEDD than TT. Covariate regression analyses showed that country, number, age, characteristics of participants, EH, and DBP could affect the LVEDD results in the homozygote comparison. When removing the major case of heterogeneity (Olcay 30 ) from the EH group, the results showed that CC had larger LVEDD values than TT (pheterogeneity = 0.96, I2 = 0%, 95% CI -0.86 (−1.14, −0.59), pvalue < 0.0001). Under the C/T allelic model, the C allele had larger LVEDD than the T allele in the EH subset8,27 (I2 = 0, pheterogeneity = 0.7, pvalue < 0.0001, 95% CI −0.54 (−0.79, −0.30)).

The pooled LVEDD results omitting Schunkert, 1999–3. 32
LVESD
Ten studies were included for comparison of TT vs CC (1121 vs 694 individuals). P values were 0.50, 0.65, and 0.004 for the total, NM, and EH groups, respectively. For comparison of TT vs TC+CC, 12 studies were included (1196 vs 2232). Publication bias was observed in the contrast of LVESD between TT and TC+CC (pe = 0.04).
Results of sensitivity analyses for LVESD under the homozygote comparison and the dominant genetic model showed that Schunkert, 1999–3 could change the overall results of LVESD comparison. 32 If Schunkert, 1999–3 was omitted, then the publication bias disappeared (TT vs CC, pe = 0.86, TT vs TC+CC, pe = 0.19), and CC had larger LVESD values than TT (pheterogeneity < 0.01, pvalue = 0.002, 95% CI −0.71 (−1.16, −0.26)). No differences in LVESD were found during a comparison of other groups under the dominant genetic model and the homozygote comparison. After covariate regression for LVESD under the homozygote comparison, number of participants, age, sex, characteristics, year of publication, SBP, and DBP were all found to affect the results of the LVESD comparison. In the n > 200 EH subgroup (Isaji, 28 Stella 27 ), CC had larger LVESD than TT (pheterogeneity = 0.15, pvalue < 0.0001, 95% CI −1.02 (−1.45, −0.60)). Under the C/T allelic model, the C allele had larger LVESD values than the T allele in the EH subset8,27 (I2 = 0, pheterogeneity = 0.39, pvalue < 0.0001, 95% CI −0.72 (−0.97, −0.47)).
LVPWT
There were 10 studies included for the LVPWT and a total of 1484 TTs vs 734 CCs. P values of 0.13, 0.98, and 0.06 were recorded for the total, NM, and EH groups, respectively. As for comparison of TT vs (TC+CC), 12 studies were included (1524 vs 2951). P values of 0.51, 0.74, and 0.21 were recorded for the three groups. Under the homozygote comparison, covariate regression results demonstrated that ethnicity, country, design, number of participants, age, sex, and participant characteristics could affect the results of the LVPWT comparison. In the n < 200 EH subgroup, TT was associated with larger LVPWT values than CC (pheterogeneity = 0.74, pvalue = 0.02, 95% CI 0.67 (0.12, 1.22)).8,30
Discussion
This is a systematic review of the literature in the form of an update meta-analysis of the association between the CYP11B2 −344C/T polymorphism (rs1799998) and left ventricular structure. In total, 20 studies and 6780 subjects were analyzed for left ventricular parameters. The main finding of the present meta-analysis was that echocardiographic left ventricular diameters (LVEDD and LVESD) were greater in CC than in TT on average (involving 17 studies). CC individuals had larger LVM/LVMI ratios than TT individuals in the subgroup of NM Caucasians (n < 200). Among Asians, TT had larger IVS than CC, and TT had larger LVPWT than CC in the much smaller sample (n < 200) EH subgroup without heterogeneity (pheterogeneity > 0.05, pvalue < 0.01, respectively). There was no obvious heterogeneity among the subgroups. The same allele (e.g. the C allele) of rs1799998 was found to have different effects in different populations. No publication bias was detected in any these results. The same results showed CC to be associated with larger left ventricle diameter than TT in the non-heterogeneity subgroup analyses. Statistical differences were observed among continuous echocardiographic variables only during comparisons of homozygotes.
In 2008, Sookoian et al. reported that the CYP11B2 −344T allele was associated with an increased thickness of the posterior wall of the left ventricle. 14 Other studies have shown the −344T allele to be associated with greater IVS and PWT values. The previous version of the present meta-analysis contained 14 studies and more than 4000 individuals. The main limit of that study was that it did not contain any Chinese or other Asian individuals, with the exception of one study that was performed on Japanese participants. The present meta-analysis was consistent with a 2008 report by Sookoian et al. among small subgroups (n < 200), but this relationship was not detected when the groups were pooled. One of the reasons for this may be that the more groups pooled, the more confounding factors there were. Most of those confounding factors were not recorded, so the association results may be different or biased.
Because of the heterogeneity present, sensitivity analyses and covariance regression analyses were performed to identify the main factors capable of affecting the results. Ethnicity, sample size, age, sex, participant characteristics, study design, DBP, and SBP could all influence the results. Patients were regrouped according to ethnicity, sample size, and other characteristics. CC was still associated with larger LVEDD and LVESD values in the subsets with pheterogeneity > 0.05, pvalue < 0.05 during the comparison of homozygotes. These results suggested that the CC genotype of rs1799998 might be associated with larger left ventricular diameter.
Aldosterone independently influences the vascular environment in humans. It does so by affecting structural and functional modification of the arterial wall as derived from mineralocorticoid receptors. 35 Aldosterone has endocrine properties. These properties may contribute to the pathophysiology of cardiac fibrosis, cardiovascular dysfunction, and progressive renal dysfunction.36–38 Recent evidence has shown that aldosterone may play an important role in potentiating some of the hypertrophic effects of angiotensin II on cultured vascular smooth muscle (VSM) cells. Those cells showed evidence of mRNA for CYP11B2.36–38
Aldosterone increases the synthesis of collagen I at the mRNA and protein level. 39 And aldosterone receptor blockade using spironolactone markedly reduces procollagen type III amino-terminal peptide. All these results suggest that aldosterone is a key point of collagen turnover. 39 Some investigations have shown the expression of CYP11B2 mRNA and production of aldosterone in the vessel wall and vascular VSM cells.40,41 In 1992, Lifton et al. demonstrated that mutations in the aldosterone synthase gene could account for all the physiological abnormalities associated with glucocorticoid-remediable aldosteronism and that this mutation could cause hypertension in otherwise phenotypically normal animals or humans. 42 The polymorphism −344C/T is located upstream of the start of translation within a binding site for the transcription factor, steroidogenic factor-1 (SF-1). SF-1 is necessary for the development of adrenal glands and other steroidogenic tissues and for expression of most of the enzymes involved in adrenal steroid biosynthesis; 7 −344C/T is located in the promoter of the CYP11B2 gene and might influence the gene expression by affecting the binding of the SF-1 transcription factor. A previous study showed that the −344C allele binds to the SF-1 binding site more strongly than the T allele does in vitro. 43 Several studies have shown that BP is higher in CC and TC than in TT individuals. Some studies have also shown the −344C allele to be associated with increased left ventricular size and decreased baroreflex sensitivity in healthy people. 44 This supports the results of the present meta-analysis with respect to the NM Caucasian subgroup with n < 200 (CC had larger LVM/LVMI than TT, pheterogeneity = 0.53, I2 = 0%, pvalue = 0.02).
Kupair et al. observed that LVM increased with the number of copies of −344C in young adults. 7 Delles et al. also found that CCs had greater LVEDD than those with the TTs in arterial hypertension, suggesting that CC genotype might be associated with early LVH. 8 A recent, large, genome-wide association study of BP traits also supported the association between BP traits and CYP11B2 −344C/T. 45 Those results showed that the −344C allele may be more strongly associated with large left ventricular size.
In the present study, differences were found only during comparisons of homozygotes (additive genetic model with selective/extreme genotypes) in LVM, IVS, LVEDD, LVESD, and LVPWT. Under the dominant model, no significant association was detected between the CYP11B2 −344C/T polymorphism and left ventricular structure. Homozygote/extreme genotypes showed extreme phenotypes, and additive genetic models with selective/extreme genotypes may have more power. The present meta-analysis was also performed using the recessive model (TT+TC vs CC). No significant differences were found even in subset analyses.
The present results have to be interpreted within the context of their limitations. First, there was detectable heterogeneity among studies. To reduce the effect of heterogeneity, studies were regrouped according to covariate regression analyses. An association was found between all five left ventricular structure traits and CYP11B2 −344C/T in some sub-group analyses without heterogeneity (pheterogeneity > 0.05). The results of subgroup heterogeneity may be more reliable than the results of the total group with heterogeneity. Second, there was publication bias for studies reported on the association of LVEDD or LVESD with CYP11B2 −344C/T. Publication bias may lead to overestimation of pooled association between these two traits and CYP11B2 −344C/T. Strictly speaking, only the estimations of pooled association on LVM, IVS, and LVPWT were credible. Last, we searched PubMed and Embase databases. Some studies could not be searched in these two databases, including some in local languages, and could not be included in our study. Because of this, the recall ratio of literature retrieval might be affected.
Through covariate regression analyses under homozygote comparison, sample size, age, sex, patient characteristics, design, DBP, and SBP were found to influence the left ventricular echocardiographic variables in addition to ethnicity. In the table of covariate regression analyses (Table 3), number of participants, age, sex, participant characteristics, year of publication, DBP, and SBP showed significant differences (p < 0.05) in at least two left ventricular structure traits out of the five, which indicated that many factors besides ethnicity could also affect the left ventricular structure, and different traits may be affected by different factors.
In conclusion, the present findings support the hypothesis that CC individuals of rs1799998 may have higher left ventricular diameter (LVEDD, LVESD) regardless of ethnicity or physical conditions. The same allele (e.g. the C allele of rs1799998) may play different roles in different populations, but this merits deeper study. Confounding factors, such as the sample number, age bracket, sex ratio, characteristics of the participants, year of publication, and BP were found influence to the results of the association analyses (all p < 0.05).
List of abbreviations
AF: atrial fibrillation; CVD: cardiovascular diseases; DCM: dilated Cardiomyopathy; EH: essential hypertension; HCM: hypertrophic cardiomyopathy; HF: heart failure; IVS: interventricular septal wall thickness; LVEDD: left ventricular end-diastolic diameter; LVESD: left ventricular end-systolic diameter; LVM: left ventricular mass; LVMI: left ventricular mass index; LVPWT: left ventricular posterior wall thickness; MI: myocardial infarction; NM: normotension; No.: the number of participants in the study; pe: Egger’s statistic for publication bias; pheterogeneity: the Q statistic for heterogeneity; pvalue: the statistical significance of the pooled estimate.
Footnotes
Authors’ contributions
LW and JZ researched, designed and read through all the research articles. BZ reviewed the reading results. HW, ML and QN extracted and analyzed the data. YC, RC and SW guided the article writing and editing.
Conflict of interest
None declared.
Funding
This work was supported by the Natural Science Foundation of Beijing (grant no. 7120001, grant no. 7102045), the special fund for overseas talent from Beijing Academy of Science and Technology (grant no. OTP-2011-011, grant no. OTP-2012-011), and the National Natural Science Foundation of China (grant no. 81270216).