
Abstract
Hypothesis/Introduction:
Transformer Growth Factor (TGF-β1) and angiotensin II (AngII) induce epithelial mesenchymal transition (EMT) and myofibroblastic transdifferentiation (MFT) contributing to renal fibrosis. The present study evaluated the capacity of an AT1 receptor blocker (losartan) to induce the regression of pre-existing fibrosis via interference with MFT and EMT in a rat model of type 2 diabetes, and in cultured mesangial cells (MCs) stimulated with high glucose and AngII.
Materials and methods:
After 12 weeks of diabetes induction (D12 group), animals showing evidence of nephropathy, were divided in groups untreated for additional 8 weeks (D20 group) and treated for additional 8 weeks with losartan (D20+los group).
Results:
D12 animals presented hyperglycemia, insulin resistance, hypertension, proteinuria, increased levels of TGF-β1 and MFT/EMT markers. Losartan stabilized all of these parameters and hindered the progression of fibrosis, but it did not reverse the pre-existing fibrotic manifestations. Losartan reduced TGF-β1 in the tubules, but not in the glomeruli. Stimulated MC exhibited myofibroblast phenotype and capacity for migration, which were completely reversed by losartan.
Conclusions:
Cellular transition may play a role in diabetes-inducing renal fibrogenesis in both AngII-TGF-β1 axis-dependent and independent manners. Losartan was efficient in preventing cells from undergoing further transdifferentiation, but this strategy was not sufficient to induce regression of the pre-existing tissue fibrosis.
Keywords
Introduction
The prevalence of diabetes mellitus has increased to epidemic proportions, especially due to the global rise in type 2 diabetes.1–3 Diabetic nephropathy is characterized clinically by proteinuria, glomerulosclerosis and tubulointerstitial fibrosis. Fibrosis is the final common pathway leading to renal disease of many etiologies, including diabetes. Fibroblasts are the key cells responsible for producing collagen, and activated fibroblasts (myofibroblasts) synthesize an abnormal amount of collagen, which plays a major role in the development of renal fibrosis.4,5 However, recent studies suggest that resident cells, including glomerular and tubular epithelial cells, may undergo a phenotypic transition, acquire a myofibroblast phenotype and contribute to extracellular matrix (ECM) accumulation and fibrosis. 6 These cellular phenotypic changes, known as myofibroblastic transdifferentiation (MFT) in non-epithelial cells and epithelial-mesenchymal transition (EMT) in epithelial cells (6), contribute to renal fibrogenesis. TGF-β1 is the major inducer of MFT and EMT. Angiotensin II (AngII) plays an important role in these phenomena through induction of TGF-β1.7,8 In addition, many studies have suggested that suppression of the renin-angiotensin system (RAS), which is classically used to retard the progression of renal disease, could be utilized to hinder the progression of renal injury and reverse renal tissue fibrosis.9–11 In theory, to achieve reversal of fibrosis, stopping the excessive production of ECM is not sufficient. In fact, at least two additional steps are necessary which include degradation of the excessive matrix through stimulating matrix metalloproteinase activity and cell recovery, or a return towards a normal cell phenotype. A capacity of renal cells to undergo remodeling, acquire a fibroblastic characteristic and then return to normal phenotype under therapeutic conditions has been observed in some experimental models12,13 and in humans, 14 but there are many controversial hypotheses regarding the role of the cellular transdifferentiation process in renal fibrogenesis and the reversibility of renal fibrosis. 15
In this study, we evaluated the capacity of an AT1 receptor blocker, losartan, to revert EMT/MFT and fibrosis in the kidneys of rats with type 2 diabetes and established nephropathy. The obtained in vivo results were complemented with an in vitro study using cultured mesangial cells stimulated with a high concentration of glucose and AngII. Both the in vivo and in vitro results suggest that losartan considerably reduced the progression of fibrosis by reducing EMT and MFT, but this strategy was not sufficient to abrogate the pre-existing fibrosis and to return the renal tissue to normal phenotype.
Materials and methods
The experimental protocol was approved by the Ethical Committee of the Federal University of São Paulo under number 0353/08. Twelve-week-old male Wistar rats were used. The animals were divided into two groups: a control group (CT), which was fed standard rat chow throughout the protocol, and a diabetic group. Type 2 diabetes was induced as previously described.16,17 Briefly, the rats were fed a high-fat diet composed of 30% carbohydrates, 25% protein and 45% fat, with a total energy content of 5.2 Kcal/g. The standard chow was composed of 70% carbohydrates, 20% protein and 10% fat and had a total energy content of 3.8 Kcal/g. After five weeks on the hypercaloric diet, the rats received a single injection of a low dose of streptozotocin (STZ, 30 mg/kg, intravenous (i.v.); Sigma, St. Louis, Missouri, USA) dissolved in sodium citrate buffer, pH 4.5. The control rats (n=5) received citrate buffer alone. Two days later, plasma glucose concentrations were determined using tail vein blood samples (Accu-chek, Boehringer Mannheim, Indianapolis, Indiana, USA), and only the STZ-treated animals with blood glucose levels >200 mg/dl were included in further analyses. Twelve weeks after STZ administration, the diabetic animals (D) were subdivided into three groups: D12 (n=5), which were sacrificed 12 weeks after STZ administration; D20 (n=7), which were sacrificed 20 weeks after STZ treatment; and D20+Los (n=8), which were treated with losartan (50 mg/Kg/day per os). Losartan administration started 12 weeks after diabetes induction, when nephropathy was already present. The animals were treated for eight weeks and were sacrificed 20 weeks after STZ administration. Glycemia and body weight were determined weekly by placing the animals in metabolic cages for 24 h for urine collection. Periodically, retro-orbital blood samples were collected from all of the animals for cholesterol measurements under ketamine and xylazine anesthesia. At the end of the experimental protocol, the animals were anesthetized, and blood samples were collected from the abdominal aorta, while both of the kidneys were excised for protein and histochemical analyses. For protein expression analysis, the left kidney was immediately frozen in liquid nitrogen and kept at −80ºC until use. For histochemical and immunohistochemical analyses, the right kidney was fixed in formaldehyde, and after several washes in ethanol and xilol, the samples were embedded in paraffin wax. Biochemical parameters were determined in the plasma and urine samples using commercial kits.
Insulin tolerance test
After a 6 h fast, the rats were subjected to an insulin tolerance test, as described previously. 18 Briefly, 1.0 IU/kg insulin was infused intraperitoneally, and plasma glucose was measured after 0 (basal), 5, 10, 15, 20, 25 and 30 min. The glucose disappearance rate (KITT) was calculated from the formula 0.693/t1/2, where t1/2 represents the time it takes for glucose to reach 50% of the basal value. The glucose t1/2 was calculated from the slope obtained in a least square analysis of the blood glucose concentration during the linear phase of decline.
Western blotting
Kidney fragments were homogenized (homogenizer, Polytron, Switzerland) in ice-cold buffer (50 mM tris(Hydroxymethyl) aminomethane (TRIS), 150 mM NaCl, 1.0% nonidet P-40, 0.5% sodium deoxycholate, 0.1% Sodium Dodecyl Sulphate (SDS), pH=8,0) containing a pool of protease inhibitors (Sigma Chemical Co., St. Louis, Missouri, USA). Total protein was measured using a modified Lowry method (Bio-Rad DC protein assay reagent, Bio-Rad, Richmond, California, USA). The protein samples (50 µg) were separated by size via Sodium Dodecyl Sulphate: Polyacrylamide (SDS-PAGE) electrophoresis and electroblotted onto a nitrocellulose membrane (Amersham Pharmacia Biotech, Piscataway, New Jersey, USA). The membrane blots were probed with various primary antibodies followed by horseradish peroxidase (HRP)-conjugated secondary antibodies. MFT and EMT were identified based on the presence of specific protein markers, including α-smooth muscle actin (αSMA), which is typical of myofibroblasts (1:400, Sigma-Aldrich Co., Missouri, USA), fibroblastic-specific protein-1 (FSP1) (1:400, Dako, CA, USA) and desmin, a mesenchyme cell marker (1:500, Sigma-Aldrich Co., Missouri, USA). In addition, antibodies against type IV collagen (1:500, Abcam, Massachusetts, USA) and TGF-β1 (1:400, Sigma-Aldrich, Missouri, USA) were used. β-actin expression was used as an internal control (1:3000, Sigma-Aldrich Co, Missouri, USA). Protein bands were visualized using the Immobilon Western Horseradish peroxidase (HRP) Substrate (Millipore Corporation, Billerica, USA). The obtained bands were quantified using a Luminescent Image Analyzer-LAS 4000 and Image Gauge V3.1 software (Fuji Photo Film Co., Japan).
Light microscopy studies
Histological sections were stained with Picrosirius or hematoxylin-eosin and examined under light microscopy. Fibrotic tissue was stained with Picrosirius, and the area was quantified using Corel Photo-Paint 12 (Ottawa, Canada) and UTHSCSA – ImageTool software (Texas, USA).
Immunohistochemical analyses
The paraffin-embedded tissues were cut into 5 µm sections using a rotary microtome (Leica Mycrosystems, Herlev, Denmark). The kidney slices were then deparaffinized and rehydrated. To expose antigens, kidney sections were boiled in a target retrieval solution (citrate buffer, pH 6.0 for FSP1 and desmin; TRIS buffer, pH 9.0 for αSMA, ED-1 and TGF-β1) for 30 min. Endogenous peroxidase activity was blocked with 3% H2O2 for 10 min at room temperature. Non-specific binding was prevented by incubating the sections in protein blocker (Dako, California, USA). The sections were incubated overnight at 4°C with primary antibodies against TGF-β1 (1:400, Sigma-Aldrich Co., Missouri, USA), a-smooth muscle action (αSMA) (1:500, Sigma-Aldrich Co., Missouri, USA), Fibroblast Specific Protein-1 (FSP1) (1:400, Dako, California, USA); desmin (1:600, Sigma-Aldrich Co., Missouri, USA) and CD68 (1:100, Serotec, Oxford, UK). A negative control was performed using a mixture without the primary antibody. After washing with Phosphate Buffered Saline (PBS), the sections were incubated with a HRP-conjugated polymer (Dako, California, USA) for 30 min at room temperature. The slides were rinsed with PBS, and the sites of antibody-antigen reactions were visualized with 3,3’-diaminobenzidine (Dako, California, USA). The sections were lightly counterstained with hematoxylin. Analyses were carried out under light microscopy (Leica Imaging Systems), and the stained proteins were quantified using Corel Photo-Paint 12 and UTHSCSA – ImageTool software.
Mesangial cell culture
Immortalized mouse mesangial cells (MCs) were purchased from the American Type Culture Collection (ATCC, Chicago, Illinois, USA) and were cultured in RPMI 1640 culture medium (Life Technologies BRL, Grand Island, New York, USA) containing glucose at a standard concentration (10 mM) and supplemented with 10% fetal bovine serum, 50 U/ml penicillin-streptomycin, 2.6 g acid Hepes (pH 7.4) and 2 mM glutamine. All of the cell culture reagents were obtained from Sigma Chemical Co. (St. Louis, Missouri, USA). The cell culture flasks were kept in a humidified environment composed of 95% air and 5% CO2 at 37°C. The culture medium was replaced every 36 h. At semi-confluence, the cells were rinsed twice with phosphate-buffered saline and divided into the CT and groups stimulated with high glucose concentration (30 mM) and AngII (10−7 M) for four or six days (4dGAII, 6dGAII). After four days of stimulation, when the cells displayed myofibroblastic features, they were treated with losartan (10−6 M to 10−4 M) for 48 h.
Quantitative real-time polymerase chain reaction (PCR)
Total RNA was purified from MCs using the phenol and guanidine isothiocyanate-cesium chloride method with an appropriate kit (TRIzol; Gibco BRL, Rockland, Maryland, USA), following the manufacturer’s instructions. Total RNA (2 µg) was treated with DNase (RQ1 RNase-free DNase; Promega, Madison, Wisconsin, USA) to avoid genomic DNA contamination and reverse transcribed into cDNA via the addition of a mixture containing 0.5 mg/ml oligo(dT), 10 mM Dithiotreitol (DTT), 0.5 mM deoxynucleoside triphosphates (Amersham Pharmacia Biotech, Uppsala, Sweden) and 200 U of reverse transcriptase (SuperScript RT; Gibco BRL). The mRNA expression levels were estimated through quantitative real-time PCR (Gene-Amp 5700; Applied Biosystems, Foster City, California, USA) using specific primers for each molecule, as follows (forward and reverse, respectively): β-actin (5’ cctctatgccaacacagtgc 3’ and 5’ acatct-gctggaaggtggac 3’), FSP1 (5’ aacaagacagagctcaaggagctac 3’ and 5’ tgttgctgtccaag-ttgctcat 3’) and α-SMA (5’ cagagtccagcacaataccagttg 3’ and 5’ ttatgtttgagaccttcaatgtccc 3’). The relative expression levels of the target genes were normalized based on values obtained for the β-actin housekeeping gene. The accumulation of PCR products was monitored using the SYBR Green I intercalating dye (Molecular Probes, Eugene, Oregon, USA), which exhibits higher fluorescence upon binding to double-stranded DNA.
Cell migration assay
An in vitro migration assay was performed using transwell tissue culture plates embedded with a polycarbonate membrane (pore size, 8 µm), as described previously. 19 Four hours before the end of the in vitro protocol, the cells were placed into the transwell system. Following incubation, the residual cells were removed from the top of the membrane using a scraper, alternating with PBS washes. The cells that migrated through the pores were fixed with methanol for 8 min to the underside of each membrane. The membranes were stained with hematoxylin. The individual membranes were cut out of each well and mounted onto large cover slips. Using a light microscope, the numbers of cells in 20 sequential fields were counted. All of the experiments were performed in triplicate.
Statistical analysis
Results are expressed as the mean±standard error (SE). Data were analyzed by SigmaStat 2.0 software. Statistical tests used were one-way analysis of variance (ANOVA) followed by Tukey test. A value of p<0.05 was considered statistically significant.
Results
As shown in Figure 1, after 12 weeks, the animals that received a high-fat diet and a low dose of streptozotocin developed characteristics of type 2 diabetes, including a gradual increase in glycemia and insulin resistance. Hypertension and high cholesterolemia were also observed.
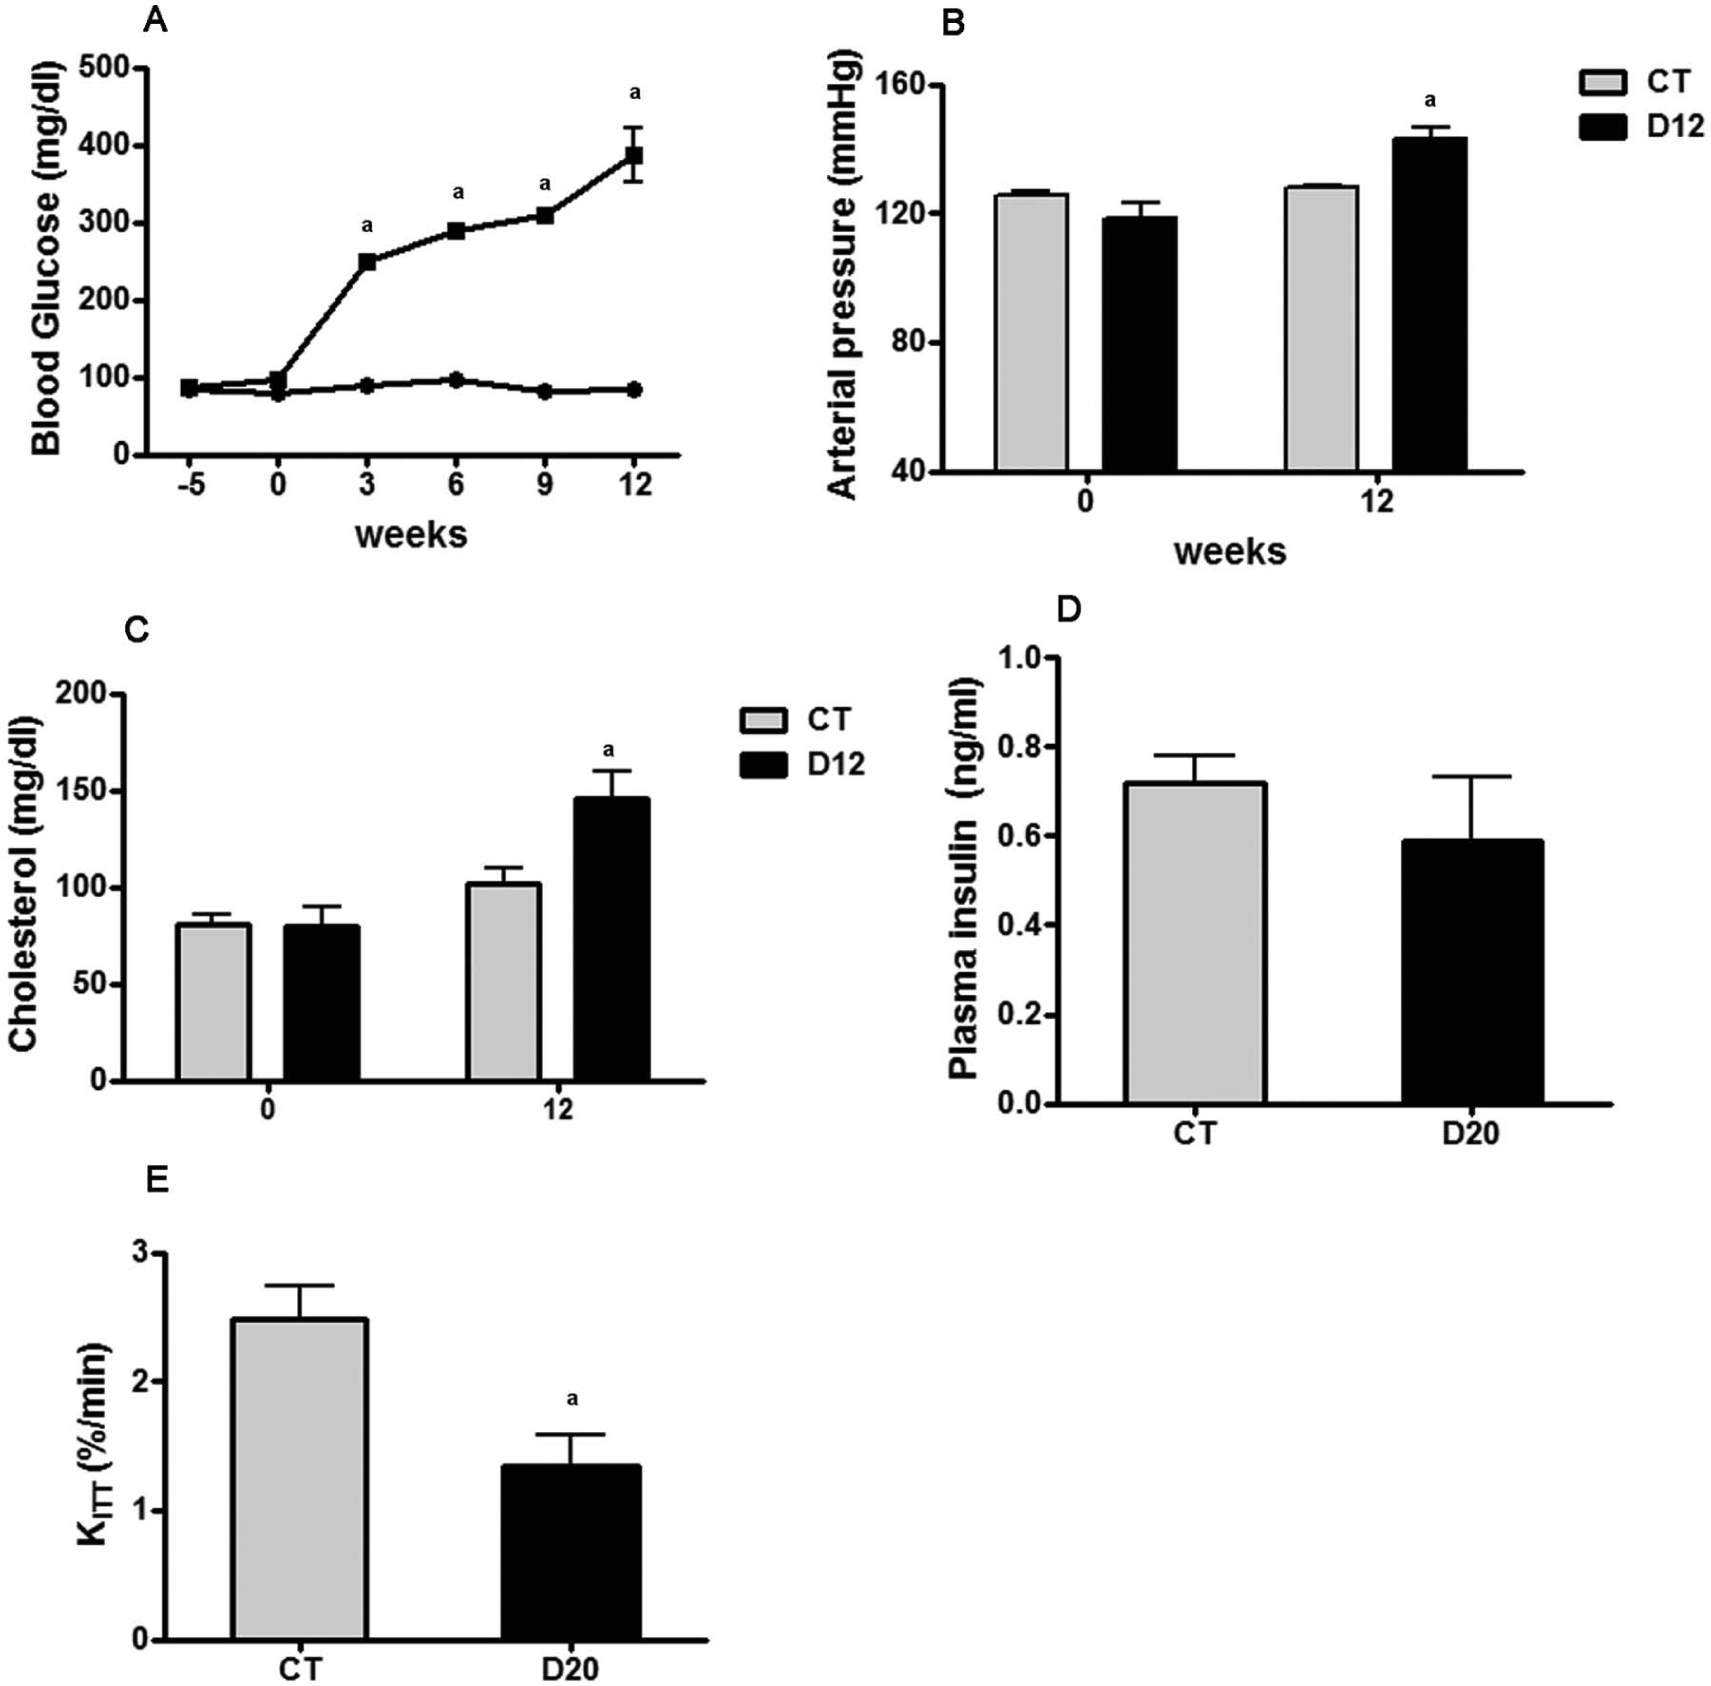
Evolution of blood glucose in groups: (a) control group (CT; filled circle) and 12 weeks diabetes induction (D12) group (filled square); (b) systolic arterial pressure; (c) plasma cholesterol; (d) plasma insulin; and (e) glucose disappearance rate (KITT). CT, n=5; D12:, n=5; D20: untreated for additional 8 weeks, n=7. avs CT, p<0.05.
Renal function was impaired after 12 weeks of diabetes induction, as shown in Figure 2(A), with a significant and progressive increase in proteinuria being detected. Increases in the expression of fibrosis markers and cellular transition were observed in the D12 animals compared with the CT animals (Figures 2(B) and 2(C)). These results indicate that 12 weeks after diabetes induction, there was diabetic nephropathy onset with established tissue injury.

Evolution of proteinuria: (a) protein analyses of fibrosis and (b) cell transdifferentiation markers. Densitometry bands are shown graphically in panel (c) (expressed as a percentage of the control). CT: control group, n=5; D12: 12 weeks diabetes induction, n=5; D20: untreated for additional 8 weeks, n=7. avs CT p<0.05.
Losartan treatment initiated after 12 weeks of diabetes induction did not alter the hyperglycemia (Figure 3(A)), hypercholesterolemia (Figure 3(B)) or body weight (Figure 3(C)) profiles but significantly reduced mean arterial pressure to levels even lower than those of the CT (Figure 3(D)). Losartan also reduced proteinuria to levels that were lower than what was observed during the pre-treatment period (day 14 vs day 12), whereas in the untreated group (D20), proteinuria progressed to high levels (Figure 3(E)).

Effect of losartan on (a) blood glucose, (b) plasma cholesterol, (c) body weight, (d) systolic arterial pressure and (e) proteinuria. CT: control group, n=5; D12: 12 weeks diabetes induction, n=5; D20: untreated for additional 8 weeks, n=7. D20+Los: treated for additional 8 weeks with losartan, n=8. avs CT; bvs D12; cvs D20, p<0.05.
Figure 4 summarizes the histological (HE staining) and immunohistochemical profiles for the markers of EMT (desmin), MFT (αSMA), inflammation (macrophages) and fibrosis (collagen). The graphs on the right side indicate the respective densitometry of each labeled molecule. HE staining showed that the D12 group presented mesangial expansion and tubular hypertrophy, which are typical features of DN. The D20 group showed hypercellularity, intense mesangial expansion and the presence of dilated tubules, together with flattening of epithelial cells. The losartan-treated group presented a more conserved renal structure, although hypertrophic glomeruli were still present. As expected, the D12 group exhibited an increase in TGF-β1 expression in all compartments of the renal cortex; however, with the progression of renal disease (D20 group), TGF-β1 was predominantly found in the tubular cells. Losartan treatment abolished the expression of TGF-β1 in the tubules, but not in the glomeruli, which were strongly labeled in presence of losartan. Because there was a clear difference in the labeling profile of TGF-β1 between the D20 and D20+Los groups, densitometric analysis of TGF-β1 (bar graphs on the right side) was performed for different regions, including the glomerular, tubular and interstitial areas. The examined EMT and MFT markers were significantly increased in the diabetic animals, with stronger labeling being observed in the D20 group. Staining to detect FSP1, a fibroblast marker, showed that it was mainly overexpressed in the tubules of D20 animals. Losartan treatment reduced the expression of FSP1 to levels that were below those found in the D12 group, but still significantly higher than in the CT. αSMA was mainly detected in the periglomerular area in the D12 group, and it was also found in the interstitial space in the D20 group. Losartan reduced the expression of αSMA to levels similar to the D12 group. Desmin was found in the tubular cells of the D12 group. Losartan prevented the increase in desmin expression observed in the untreated D20 animals and maintained a desmin expression level similar to that of the D12 group. There was a significant increase in the number of ED-1-positive cells in the interstitial space, indicating intense macrophage infiltration in the diabetic groups. Losartan caused a decrease in ED-1-positive cells, but the number of cells remained higher than in the D12 group. Collagen deposition increased significantly in the diabetic groups. Losartan treatment reduced collagen accumulation to levels similar to the D12 group.

Histological analysis by hematoxylin eosin staining, fibrosis markers immunolocalization and expression, including TGF-β1, fibroblastic-specific protein-1 (FSP1), α-smooth muscle actin (αSMA), desmin, macrophages infiltration and collagen accumulation. 40× magnification. CT: control group, n=5; D12: 12 weeks diabetes induction, n=5; D20: untreated for additional 8 weeks, n=7; D20+Los: treated for additional 8 weeks with losartan, n=8; avs control group (CT); bvs D12; cvs D20, p<0.05.
In vitro analyses
Stimulation of MCs with a high concentration of glucose and AngII induced overexpression of MFT markers in both periods studied, particularly αSMA. As shown in Figure 5(A), losartan treatment initiated on day 4 induced a dose-response reduction of αSMA and FSP1 mRNA expression indicating that 10−4 M was the most effective dose. At this dose of losartan, the protein expression of FSP1, TGF-β1 and type IV collagen was reduced to levels similar to those in the control cells. The expression of αSMA protein was significantly reduced by losartan, but it remained higher than in control cells (Figure 5(B)). No changes in cell viability were observed in any of the experimental groups (data not shown).

The dose-dependent effect of losartan (los) on the molecular expression of myofibroblastic transdifferentiation (MFT) markers: (a) protein analysis via Western blotting; (b) α-smooth muscle actin (αSMA); (c) fibroblastic-specific protein-1 (FSP1); (d) TGF-β1; and(e) type IV collagen. The results are expressed graphically as a percentage of the mean of the control. Mesangial cells (MCs) were stimulated with high glucose (G, 30 mM) and angiotensin II (AII, 10−7 M) for four or six days, and losartan (L) treatment was started on day 4. avs control group (CT); bvs 4GAII; cvs 6GAII, p<0.05.
The cell transdifferentiation process was also evaluated in terms of the migration capacity of the cells. Figure 6 shows that MC migration was significantly increased when the cells were stimulated with high glucose and AngII, but treatment with losartan completely reversed this phenomenon.

Effect of losartan (a) on the cellular migration capacity, (b) represented graphically based on the number of migrated cells in 20 fields. Mesangial cells (MCs) were stimulated with high glucose (G, 30 mM) and angiotensin II (AII, 10−7 M) for six days, and losartan (L, 10−4 M) treatment was started on day 4. Migration assay was performed using transwell insert. avs control group (CT); bvs 6GAII, p<0.05.
Discussion
Recent publications have discussed the role of the cellular transdifferentiation process as a relevant mechanism of fibrosis induction6,20 as well as the potential of RAS inhibition to promote reversion of this process and, thus, to reduce fibrosis.21,22 In the present study, we observed the involvement of EMT and MFT in the mechanism underlying fibrogenesis using a model of type 2 diabetes. The blockade of the AT1 receptor was able to improve the renal function, but could not induce regression of the pre-existing EMT, MFT and renal fibrosis. In contrast, in vitro study showed that losartan treatment was more effective to reverse the myofibroblastic features acquired by mesangial cells stimulated with high glucose concentration.
The diabetic animals presented typical signs of type 2 diabetes, including hyperglycemia and insulin resistance, paralleled by hypertension and hypercholesterolemia. Although this experimental model has been previously described as a type 2 diabetes model 17 it is important to consider the limitations and the differences between this experimental model and the genesis of human type 2 diabetes, for instance, the necessity of administration of low doses of streptozotocin to animals. In spite of these considerations, 12 weeks after diabetes induction, the animals presented proteinuria, glomerular hypertrophy and interstitial collagen accumulation, indicating the presence of nephropathy. Moreover, the expression levels of the examined cellular transdifferentiation markers increased, suggesting that the mechanism underlying fibrogenesis had already been triggered at this time. The progressive nature of diabetic nephropathy was exemplified by the substantial worsening of renal function observed in the untreated group (D20) compared with what was seen earlier at the 12th week after diabetes induction. The signs of nephropathy, including the expression of the cellular transdifferentiation markers, were clearly exacerbated at the 20th week of diabetes. Although a number of studies raise doubts about the existence of EMT,23,24 this process has become accepted as a mechanism by which injured renal tubular cells can contribute to the development of fibrosis in chronic renal failure. 25 In this study we observed an increase in the expression of αSMA, desmin and FSP1, which are widely recognized as transdifferentiation markers.20,26–28
The presence of myofibroblasts was identified by αSMA labeling in cells that were mainly localized in the periglomerular area and in the interstitial space. However, whether these cells were local activated fibroblasts and/or came from local cells that had undergone transdifferentiation and migrated to the interstitium could not be determined in this study. In contrast, the presence of FSP1 and desmin inside the tubular cells indicated that the cells had undergone EMT. In addition, the most strongly stained tubules were those showing luminal dilatation and flattening of epithelial cells, suggesting that the phenotypic changes caused by EMT resulted in impairment of the tubular reabsorptive capacity.28,29 These results also suggest that cellular transdifferentiation of epithelial cells may contribute to the mechanism underlying fibrogenesis in the present model of diabetic nephropathy. Furthermore, the observed intense infiltration of macrophages and consequent interstitial inflammation constitutes an additional pro-fibrotic factor.
Losartan treatment initiated 12 weeks after STZ injection sharply reduced proteinuria, which regressed to levels that did not differ from those in age-matched controls, suggesting restoration of glomerular barrier proprieties. It has been demonstrated that podocytes can be severely injured by diabetes, which significantly contributes to proteinuria. Huby et al. 12 showed that an AT1 receptor antagonist significantly reduced proteinuria in a model of nephroangiosclerosis in mice, which was attributable to de novo synthesis of podocyte proteins (nephrin and podocin), reorganization of the foot process and restoration of slit diaphragms. Although the reduction in blood pressure certainly contributed to this beneficial effect of losartan, many studies in diabetic patients and in animal models indicate that the renoprotection induced by the decrease in RAS activity in diabetic nephropathy goes beyond to their blood pressure lowering effect 30 by mechanisms that include amelioration of the podocyte injury,31,32 reduction in inflammation, macrophage infiltration 33 and mesangial matrix overproduction. 34
The diabetic animals presented a high expression of TGF-β1, predominantly in the tubular cells of the untreated group. Losartan treatment suppressed the expression of TGF-β1 in these cells, but surprisingly, it resulted in a clear increase in TGF-β1 labeling in the glomeruli. This result suggests that AngII-independent factors could have stimulated TGF-β1 expression in the glomeruli, and these factors were probably activated in the presence of losartan. One of the potential candidates includes the enzyme chymase, that besides the ability to convert AngI to AngII, chymase is also able to induce TGF-β1 production and activation, independent of AngII.35,36 Although chymase activity and expression were not evaluated in this study, it has been shown that chymase, which is classically produced by mast cells, is also produced by glomerular cells, 37 and its expression is increased in high glucose stimulated mesangial cells 38 and in the diabetic human kidney. 39
In contrast to the in vivo results, losartan was able to reduce the TGF-β1 expression, reduced cellular transdifferentiation and efficiently reversed MFT in cultured mesangial cells stimulated with glucose and AngII. This discrepancy may be due to the distinct environments, considering that in in vitro model, cells were growth and maintained in a controlled environment being stimulated exclusively by high glucose and AngII compared with a much more complex ambient observed in vivo. In addition, besides MCs, the podocytes may have a major role in this diabetic nephropathy model through Ang II-TGF-β1 axis and thus the effect of losartan in podocytes stimulated with high glucose must be considered and deserves additional investigation. Taken together, these results suggest that in addition to the established mechanisms of proteinuria, transdifferentiation of glomerular cells toward an abnormal phenotype may contribute to a decrease in glomerular barrier selectivity and, thus, to proteinuria.
The profibrotic effect of AngII is generally mediated by TGF-β1. 40 However, AngII also has independent profibrotic effects, and our results suggest that these effects are, at least in part, mediated by a direct role of AngII in EMT and MFT induction. In fact, it was previously demonstrated that losartan had an inhibitory effect on cellular transdifferentiation in rats with diabetic nephropathy. 41 AngII is able to activate Smad signaling via a TGF-β1-independent process,42,43 Smad proteins participate in AngII-induced EMT.42–45 In addition, AngII stimulates the expression of connective tissue growth factor (CTGF) through a TGF-β1-independent pathway,22,42 and CTGF was shown to be an integral component of Ang-II-induced EMT, as blockade of CTGF attenuated this process. 46
In summary, stabilization of cell transition and fibrogenesis was clearly observed in the losartan-treated group, which presented levels of all markers similar to the pre-treatment values (D12 group), with the exception of proteinuria levels, which reached control values. Thus, an AT1 receptor blocker was efficient in preventing cells from undergoing further transdifferentiation and stopped the progression of renal injury induced by type 2 diabetes. However, this strategy was not sufficient to induce regression of the pre-existing tissue fibrosis. In conclusion, the cellular transdifferentiation process induced by the diabetic condition may play a role in the mechanism underlying renal fibrosis in both AngII-TGF-β1 axis-dependent and independent manners and strategies that interfere with this process would be of clinical interest to treat diabetic nephropathy. The blockade of the AT1 receptor by losartan can prevent the progression of fibrosis via stopping the cellular transition process, but it does not reduce pre-existing fibrotic areas.
Footnotes
Declaration of Conflicting Interests
The author(s) declared no potential conflicts of interest with respect to the research, authorship, and/or publication of this article.
Funding
The author(s) disclosed receipt of the following financial support for the research, authorship, and/or publication of this article: This work was supported by grants from the Fundação de Amparo a Pesquisa do Estado de São Paulo (FAPESP), Conselho Nacional de Desenvolvimento Científico e Tecnológico (CNPq), Fundação Oswaldo Ramos (FOR) and Coordenação de Aperfeiçoamento de Nível Superior (CAPES).