
Abstract
Reducing free-riding is an important challenge for educators who use group projects. In this study, we measure students’ preferences for group project characteristics and investigate if characteristics that better help to reduce free-riding become more important for students when stakes increase. We used a discrete choice experiment based on 12 choice tasks in which students chose between two group projects that differed on five characteristics of which each level had its own effect on free-riding. A different group project grade weight was presented before each choice task to manipulate how much there was at stake for students in the group project. Data of 257 student respondents were used in the analysis. Based on random parameter logit model estimates we find that students prefer (in order of importance) assignment based on schedule availability and motivation or self-selection (instead of random assignment), the use of one or two peer process evaluations (instead of zero), a small team size of three or two students (instead of four), a common grade (instead of a divided grade), and a discussion with the course coordinator without a sanction as a method to handle free-riding (instead of member expulsion). Furthermore, we find that the characteristic team formation approach becomes even more important (especially self-selection) when student stakes increase. Educators can use our findings to design group projects that better help to reduce free-riding by (1) avoiding random assignment as team formation approach, (2) using (one or two) peer process evaluations, and (3) creating small(er) teams.
Keywords
Introduction
Reducing free-riding remains one of the most important challenges for educators who use group projects for student learning (Aggarwal and O’Brien, 2008; Hall and Buzwell, 2013; Strong and Anderson, 1990). A complicating aspect of designing group projects that discourage free-riding is that so many factors play a role that only a limited number of them can be considered at once (Deeter-Schmelz et al., 2002). Several studies therefore offered a practical perspective on how group projects can best be (re)designed by focusing on a small number of highly important group project characteristics (e.g. Aggarwal and O’Brien, 2008; Strong and Anderson, 1990). By making adjustments to these factors, such as using a smaller team size, educators can try to reduce free-riding in a relatively easy way (Aggarwal and O’Brien, 2008). However, not all adjustments in the group project characteristics that help to reduce free-riding will satisfy students. Therefore, educators could consider measuring their preferences and use the resulting preference information as input for the group project’s redesign process.
The use of students’ preferences as a base for course redesign is becoming more and more common (e.g. Dubas and Strong, 1993; Zufryden, 1983), possibly due to the increasing popularity of customer-focused education where students are consumers with their own specific needs and wants (Dubas and Mummalaneni, 1997). For example, Wagar and Carroll (2012) and van den Herik and Benning (2021) investigated students’ preferences for respectively group work evaluation approaches and methods to detect and handle free-riding. However, despite the aforementioned literature, there is no clear-cut answer to the question yet—at least not as far as we know—which group project characteristics that help to reduce free-riding students prefer most. An answer to this question is useful for educators because it would increase their understanding of how a group project can best be (re)designed to reduce free-riding and at the same time keep students satisfied.
From a theoretical perspective, it would also be interesting to know if students’ preferences for group project characteristics change when there is more at stake. More specifically, we hypothesize that students put more weight on characteristics that better help to reduce free-riding if their personal stakes related to the group project increase and explain this expectation by means of vested interest theory (Crano and Prislin, 1995; Sivacek and Crano, 1982). Note that a situation of differences in stake levels is quite common in higher education as universities generally offer a variety of courses in which the group project’s grade weight differs per course (i.e. the group project counts differently toward the final grade of the course). This leads us to the following research questions: (a) “What are students’ preferences for group project characteristics that help to reduce free-riding” and (b) “How are students’ preferences for these group project characteristics affected by how much there is at stake for them in the group project?”
This study contributes to the literature on reducing free-riding in group projects by providing information on the relative importance of group project characteristics that help to reduce free-riding from the students’ perspective and by demonstrating how students’ preferences for these group project characteristics are affected by how high their personal stakes are (operationalized by different group project grade weights). For this purpose, we use a discrete choice experiment—a method which has not been used in this context before. The resulting findings cannot only be used by individual educators who would like to reduce free-riding in their courses, but also by departments that plan to propose best-practice recommendations for the design of group projects (McCorkle et al., 1999).
The remainder of this article is as follows. First, we provide insights in the educational literature on reducing free-riding in group projects and the literature on decision making in case of high stakes. Then, we explain the discrete choice experiment set-up, discuss the sample used, and present the results. Finally, we end the article with a discussion of our findings, the limitations of the study, and practical implications for educators.
Theoretical framework
Reducing free-riding in group projects
Trying to reduce free-riding is an important task for educators who use group projects (Aggarwal and O’Brien, 2008; Hall and Buzwell, 2013; McCorkle et al., 1999; Strong and Anderson, 1990). In this article, we define free-riding as “a behavior pattern wherein an individual working in a group setting fails to contribute his or her fair share to a group effort as perceived by group members” (Aggarwal and O’Brien, 2008, p. 256). Furthermore, we define a group project as “a [number of] graded assignment[s] requiring students to work collaboratively across multiple class periods and involving some time outside the normal class meeting” (Ettington and Camp, 2002, p. 357). The question of how to improve group projects has received much consideration in the literature and the existing possibilities to reduce free-riding in group projects are numerous (e.g. Aggarwal and O’Brien, 2008; McCorkle et al., 1999; Strong and Anderson, 1990). For example, educators could (a) implement teamwork exercises that help students prepare for a successful collaboration (e.g. Deeter-Schmelz et al., 2002; Lancellotti and Boyd, 2008; O’Neill et al., 2017; Scott-Ladd and Chan, 2008), (b) use assignments based on both individual as well as group components (e.g. Beard et al., 1989; Williams et al., 1991), (c) decrease the team size (e.g. Aggarwal and O’Brien, 2008; Strong and Anderson, 1990), (d) change the team formation procedure (e.g. Bacon et al., 2001; Chapman et al., 2006; Harding, 2018, 2020; Lemken and Siguaw, 2021; Pearlstein, 2021; Soetanto and MacDonald, 2017), (e) use peer evaluations (e.g. Beatty et al., 1996; Brooks and Ammons, 2003; Lejk and Wyvill, 2001; O’Neill et al., 2019; Planas-Lladó et al., 2021), (f) let students complete self-evaluations (e.g. Freeman and McKenzie, 2002; Johnston and Miles, 2004; Planas-Lladó et al., 2021), or (g) implement sanctioning mechanisms for free-riders (e.g. Abernethy and Lett, 2005; Maiden and Perry, 2011; van den Herik and Benning, 2021).
The many possibilities to reduce free-riding can make the group project (re)design process a complicating task for educators (Deeter-Schmelz et al., 2002; Strong and Anderson, 1990). Therefore, advice is often based on adjusting a small number of highly important group project characteristics that help to reduce free-riding and that can be changed relatively easily (e.g. Aggarwal and O’Brien, 2008; Strong and Anderson, 1990). For example, Aggarwal and O’Brien (2008, p. 255) selected four “easy-to-implement set-up factors” and investigated the effect of these factors on reducing free-riding by asking students questions related to a group project they had already obtained a grade for. They found that free-riding increases with the project’s scope and the size of the team, and that multiple peer evaluations reduce free-riding, but they did not find a significant effect of the team formation approach on free-riding. Furthermore, Strong and Anderson (1990) provided several suggestions that can help to reduce free-riding and showed that students perceive different possibilities to reduce free-riding as effective such as (in order of importance) the team creation procedure (self-selection), team size (as small as possible), the possibility to expel free-riders, the approval to withdraw from the group, the explanation of the free-rider problem, and the evaluation of team members.
Decision making when stakes are high
The idea of vested interest theory is that the attitudes of individuals toward a particular issue better reflect their behavior in case of high vested interest—that is, when there is clear hedonic relevance (Crano and Prislin, 1995; Sivacek and Crano, 1982). There are several factors that affect individuals’ vested interest in a situation such as stake, salience, certainty, immediacy, and self-efficacy—where stake (which is most important for this study) represents an individual’s beliefs about personal consequences in terms of gains and losses (Crano and Prislin, 1995).
In practice, a group project’s grade weight (i.e. how much the group project counts toward the final grade of the course) is a good indicator for students’ possible personal gains and losses (i.e. stake). In other words, the chance that students perceive a situation as highly vested is higher when a group project counts more. In such a situation of high stakes, students most likely activate a “not in my backyard” mindset that helps them to make logical and consistent choices in line with their personal attitude (Thornton and Knox, 2002)—here the attitude that they dislike free-riding. So, when stakes are high(er), they are likely to use more rational thinking and create thoughts that are specifically relevant for the issue in question (Crano, 1995; Crano and Prislin, 1995; Lehman and Crano, 2002), which will help them to focus more on group project characteristics that better help to reduce free-riding. Therefore, we hypothesize that group project characteristics which are more effective in reducing free-riding become more important for students when their personal stakes increase.
Method
Discrete choice experiment
The discrete choice experiment (DCE) is a frequently used preference elicitation technique in research areas like health economics and environmental economics (Haghani et al., 2021), but less common in the field of education. While completing a DCE, individuals face multiple choice tasks consisting of two or more alternatives which have several attributes (also referred to as characteristics) of which the levels vary (Hensher et al., 2005; Louviere et al., 2000). The fact that individuals need to make choices between the presented alternatives requires them to carefully weigh the benefits of each attribute within an alternative, which makes it possible to obtain useful information about their preferences such as the relative importance of attributes (Hensher et al., 2005).
Attributes and attribute levels
The attributes and attribute levels of the group projects (see Table 1) were selected based on their relevance and ease of use for educators (focus group with five course coordinators familiar with group projects) and their potential for reducing free-riding (literature review). Below, we give a more detailed explanation of the attribute (level) selection process.
Attributes and attribute levels of the DCE and their expected effect on free-riding.
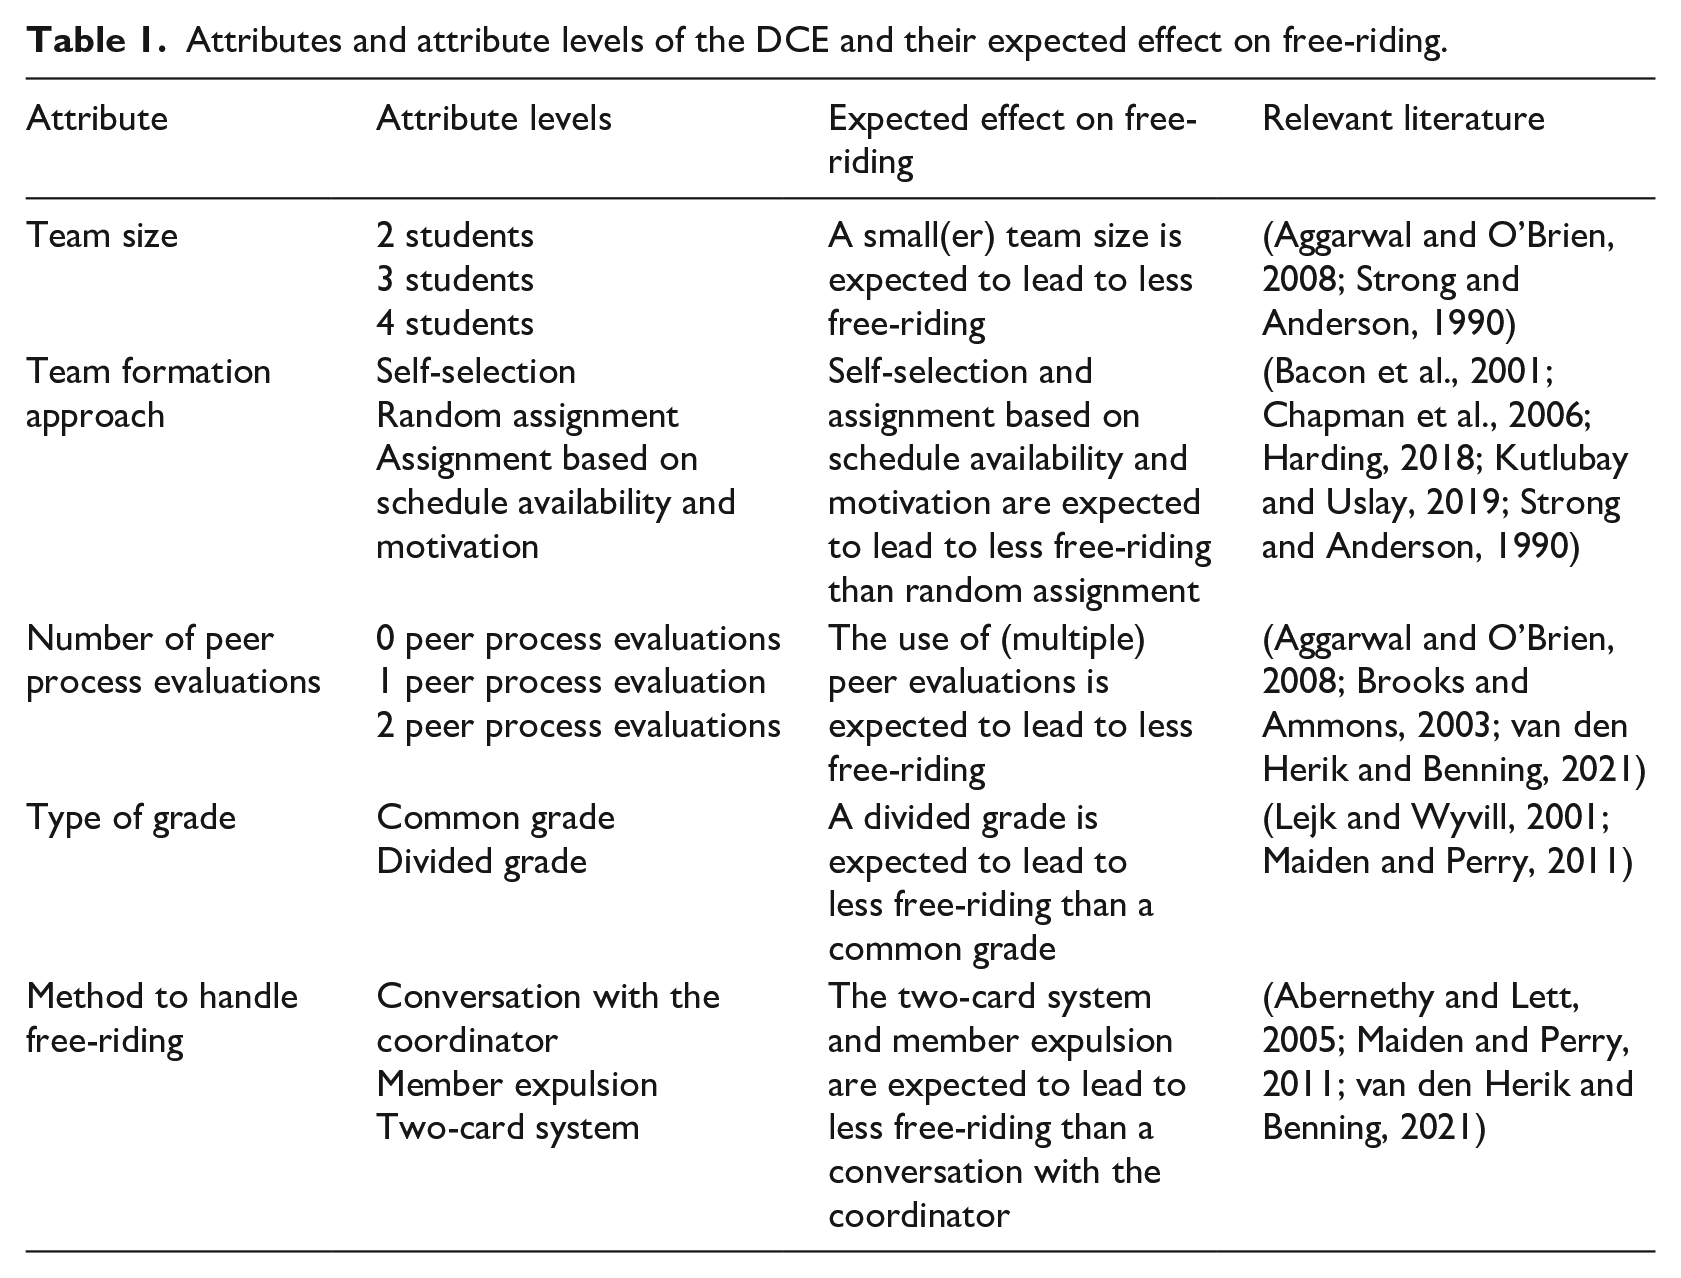
Team size
There are indications in the literature that small(er) team sizes reduce free-riding (e.g. Aggarwal and O’Brien, 2008; Strong and Anderson, 1990). For example, in a preliminary study, Strong and Anderson (1990) found that students perceive a small team size (especially students in teams of two) as highly effective for reducing free-riding. Furthermore, Aggarwal and O’Brien (2008) found that perceived free-riding increases with team size. In our DCE, team size has 2, 3, or 4 students as attribute levels. This is in line with the actual team sizes in the courses of the coordinators and the preference of the bachelor coordinator (personal interview) to restrict the team size to a maximum of four students.
Team formation approach
Several studies recommended the use of self-selection as team formation approach (e.g. Chapman et al., 2006; Strong and Anderson, 1990). For example, Strong and Anderson (1990) found that students perceive self-selection as an effective approach to reduce free-riding. Furthermore, Chapman et al. (2006) strongly recommended self-selection instead of random assignment as it leads to better group dynamics and more positive student experiences, but clear evidence that this method better helps to reduce free-riding is still missing (Aggarwal and O’Brien, 2008; Chapman et al., 2006). See Bacon et al. (2001) and Kutlubay and Uslay (2019) for an overview of advantages and disadvantages of different team formation approaches such as random assignment, self-selection, and instructor assignment. We use self-selection (students need to select the members of their team themselves) and random assignment (students are randomly assigned to a team) as attribute levels for the attribute team formation approach as they are recommended and used in practice by the course coordinators. We also use assignment based on schedule availability and motivation (students with similar schedules and motivation levels are assigned to a team) as attribute level as this (instructor-based) approach led to less free-riding compared with self-selected groups in a quasi-experiment of Harding (2018).
Number of peer process evaluations
The potential of using (multiple) peer evaluations for reducing free-riding was confirmed in several studies (e.g. Aggarwal and O’Brien, 2008; Brooks and Ammons, 2003). However, completing three peer evaluations instead of two did not lead to an additional reduction in free-riding (Brooks and Ammons, 2003). Therefore, the attribute number of peer process evaluations has 0, 1, and 2 peer process evaluations as attribute levels. We use the term “process” evaluations because students give their team members feedback via a short (online) survey in which they rate all team members on process-related aspects like preparation, attendance of group meetings, communication, cooperation, and exerted effort. These peer process evaluations, which need to be shared within the team, offer students insights on how they can improve their teamwork skills, but do not count for a grade (van den Herik and Benning, 2021).
Type of grade
The attribute type of grade has two levels, namely common grade (each team member receives the common group assignment grade given by the tutor) and divided grade (each team member receives an individual group assignment grade based on the common group assignment grade given by the tutor and the student’s relative contribution to the group assignment). The exact procedure of the divided grade—which is based on Lejk and Wyvill’s (2001) holistic peer assessment procedure—can best be explained by an example. Suppose that the common group assignment grade given by the tutor is 75 out of 100. Then, in case of a team of three students, the team members must divide 225 points (3 × 75) among each other. If the team members collectively decide that they all contributed equally, each student should receive 75 points. If they collectively decide that two students contributed more, these students should receive more points (e.g. both 80) and the other student less (e.g. 65). Note that a student cannot receive less than 0 or more than 100 points. Maiden and Perry (2011) found that most of the students who experienced the divided grade approach in a course agreed that it was an excellent way to reduce free-riding.
Method to handle free-riding
There are several possibilities to handle free-riding. For example, Abernethy and Lett (2005) used a method of “firing” free-riders if they, after a warning, failed to deliver their fair share and found support for this method by students. Furthermore, Maiden and Perry (2011) tested different approaches (one in each course) and concluded that students appreciated any approach that helped to reduce free-riding. Moreover, van den Herik and Benning (2021) proposed to select methods for detecting and handling free-riding based on students’ preferences and found that students preferred a method which reduces the grade of free-riders based on a conversation with the course coordinator about each student’s contribution.
The attribute method to handle free-riding has three levels; a conversation with the coordinator to improve the collaboration (which does not impose a sanction on free-riders) (van den Herik and Benning, 2021), member expulsion (the free-rider will be directly expelled from the team and must complete the remaining group assignments alone) (Abernethy and Lett, 2005; van den Herik and Benning, 2021), and the two-card system (the free-rider will first get a lower grade (yellow card) and in case of repeated free-riding will be expelled from the team (red card)) (Maiden and Perry, 2011). The general expectation is that methods which explicitly sanction free-riders help to reduce free-riding (Abernethy and Lett, 2005; Maiden and Perry, 2011; van den Herik and Benning, 2021). We have chosen for the two-card system instead of just a grade reduction so that there is a different and stricter sanction in case of repeated free-riding.
Experimental design
We generated an experimental D-efficient design using the software program Ngene 1.2.1 (Choice Metrics 2018) based on 1000 Halton draws. The design contained three blocks of 12 choice tasks and was “optimized” for the estimation of a multinomial logit model (zero priors). Each choice task had two alternatives and each alternative contained five attributes (see Table 2 for an example choice task). Alternative repetition within choice tasks, exact dominance of attribute levels, and repetition of choice tasks were avoided.
Example choice task.
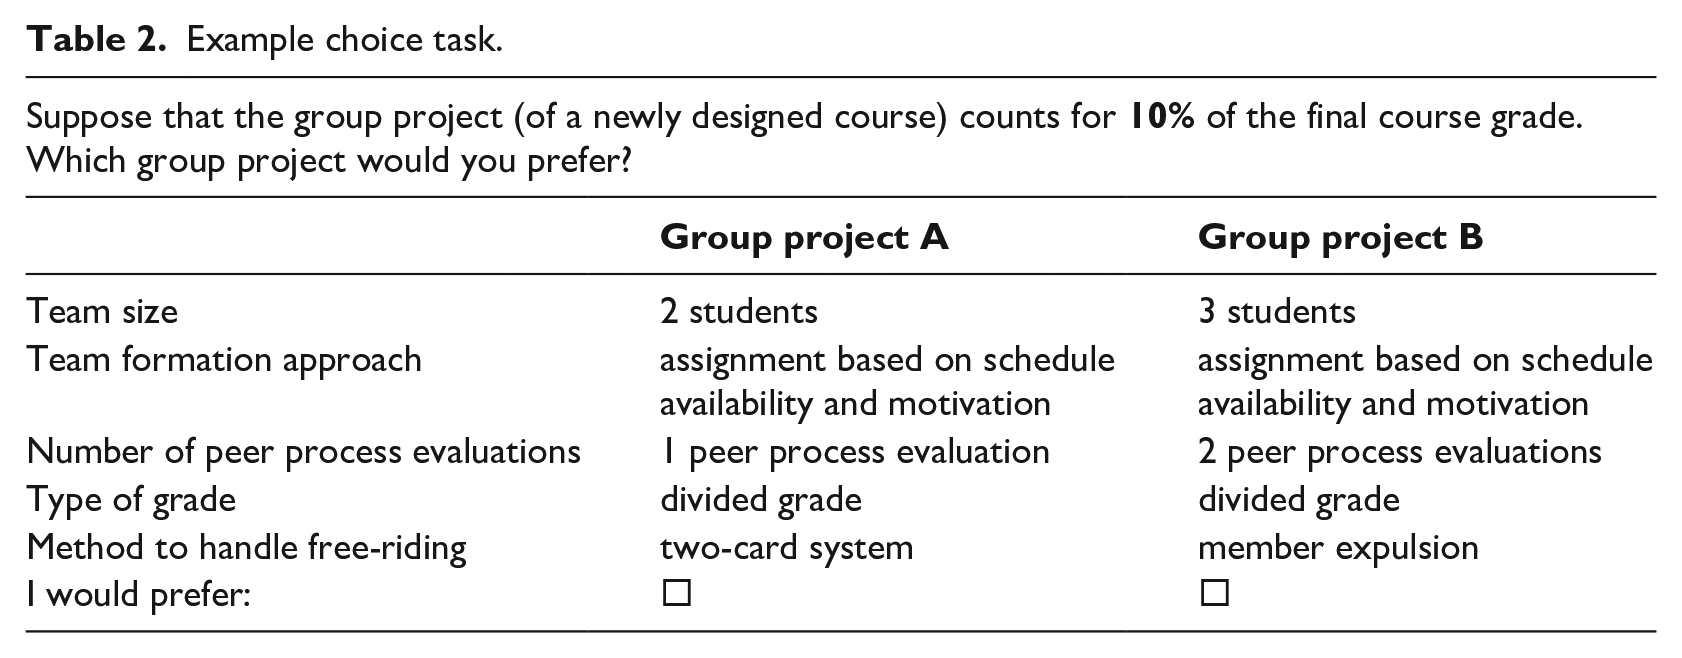
Respondents were presented a different grade weight (i.e. 10%, 30%, or 100%) before each choice task. These grade weights represent how much there is at stake in the group projects and are based on the weights used in the courses of the course coordinators. The reason for not presenting grade weight as an attribute with varying levels between alternatives is that we are particularly interested in how grade weight affects the importance of the five group project characteristics in this study, and not necessarily the direct effect of grade weight on group project choice. Furthermore, course coordinators commonly use group projects with fixed grade weights, which makes it more difficult to change that aspect of a course.
The three blocks of 12 choice tasks were (manually) combined with each of the three different sequences of presenting the grade weights so that (a) all choice tasks of the “full” design of 36 choice tasks were presented once with each grade weight—this resulted in 108 different combinations of choice tasks and grade weights—and (b) every grade weight was presented four times in the 12 different choices between two group projects each respondent had to make.
Questionnaire
Based on the three blocks and three sequences of presenting the grade weights, we created nine online survey versions which were randomly distributed among respondents. After consent for participation in the study and the use of their data, respondents were asked about their gender, age, country of origin, and the course they were participating in. This was followed by an explanation of the group project characteristics and levels used in the survey, and a related “warming-up” exercise about selecting the most preferred level for each characteristic. Then, respondents were presented a scenario that the survey is about measuring students’ preferences for group projects for a possible redesign of courses for next academic year and that the coordinators of these courses believe that knowledge about how the group project can best be designed according to students can be helpful. After the scenario description, respondents were asked to complete an example choice task followed by the 12 main choice tasks. Subsequently, respondents were asked about participation in a future team training, their experience with free-riding (and its most important causes), their attitude toward teamwork, and their degree of individuals/collectivism. Finally, they were offered the possibility to participate in a lottery (with the chance to win one of the 10 prizes of 50 euro) and thanked for their participation.
Data collection
Data was collected at the end of several bachelor one and two courses (called “Academic Skills” and “Research Project”) in which students had to complete a group project. The data (Benning, 2022b) are available in the EUR data repository under restricted access at https://doi.org/10.25397/eur.20342649. A few students pilot-tested the survey before its actual launch. Based on their feedback, several textual adjustments were made. Respondents had access to the survey via a link on the Canvas pages of the courses and gave informed written consent at the start of the survey. The final data collection took 4 weeks, from mid-June to mid-July 2021. The university’s internal review board (section experimental research) approved the study.
Econometric model
We estimated two random parameter logit (RPL) models based on normal distributions for the random parameters and 1000 Halton draws in Nlogit 6.0 (Econometric Software, Inc 2016); a base model and an extension of the base model which also included several two-way interaction effects. The utility function of the extended model is:
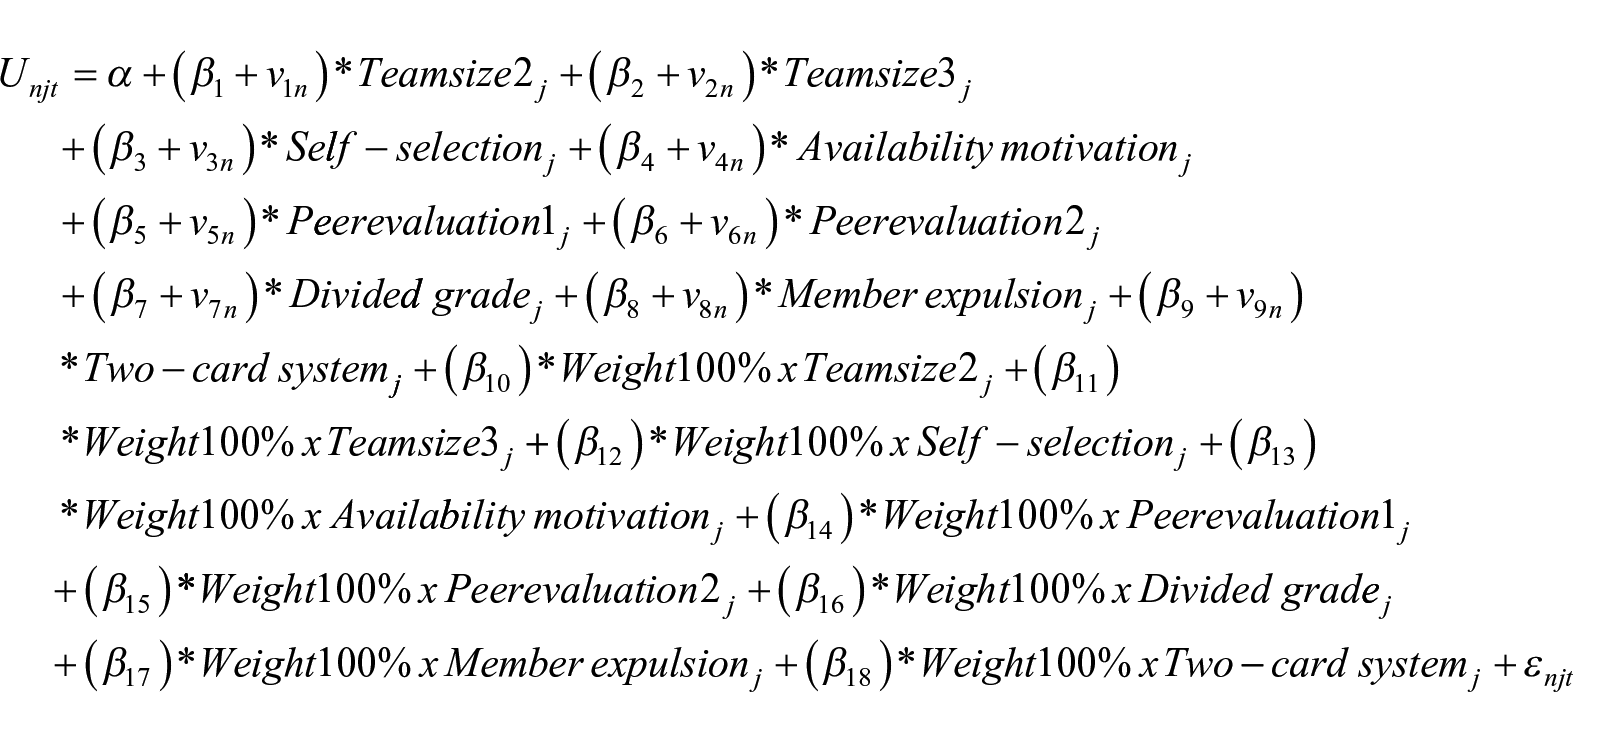
Here,
The dummy variables
Results
Respondents
Of the 357 respondents who started the survey, 262 fully completed it. We removed the data of five respondents who completed the survey unusually fast (i.e. less than 3 minutes). This led to data of 257 respondents for further analysis (response rate of 16.6%). Note that there were no respondents (left) who always chose group project A or B and that there were between 25 and 30 respondents for each survey version.
The average age of the respondents was 19.4 years ranging from 17 to 25 years. There were 147 males (57.2%), 108 females (42.0%), and 2 respondents in the category “other” (0.8%). Respondents came from 39 different countries, but most of them were from The Netherlands (168 students, 65.4%). The specific course students participated in during the block was the Dutch (127 students, 49.4%) or English (83 students, 32.3%) bachelor one Academic Skills course, the English bachelor two Academic Skills course for double degree students (15 students, 5.8%), or the Dutch (18 students, 7.0%) or English (14 students, 5.4%) bachelor two Research Project course. Note that 1 student (0.4%) indicated not to follow any of these courses and that there also was a student who participated in two of these courses at the same time.
The type of group assignments in these courses was diverse. In the Academic Skills course(s), for example, students worked on a research proposal, a peer feedback assignment, an academic research paper, a presentation, and a reflection assignment in a team they were randomly assigned to. The team size was mainly two and sometimes three students. The group assignments counted for 100% toward the final grade of the Academic Skills course(s), except for the academic research paper which counted for 30% toward the final grade of the course Organization and Strategy. Note that the students also had experience with group assignments in earlier modules of the Academic Skills course(s) with emphasis on writing a literature review (block 3) and a research report (block 4). Furthermore, in the (second year) Research Project course(s), students worked on a research proposal, an academic research paper, and a presentation in either a team they created themselves (if their grade for the first individual assignment was a 5.5 or higher) or a team they were assigned to consisting of students with similar grades (if their grade was lower than a 5.5). The team size was mainly four students (and sometimes less). The group assignments counted for 70% toward the final grade of the Research Project course(s). In all courses, the group project was based on zero peer process evaluations, a common grade, and a conversation with the course coordinator as a method to handle free-riding—but there could be a sanction in case of (repeated) free-riding.
There were 92 respondents (35.8%) interested in participating in a team training. In total, 86 respondents (33.5%) indicated that they worked in a team with a free-rider this academic year. This was the case for 1 (0.4%), 6 (2.3%), 25 (9.7%), 33 (12.8%), and 47 (18.3%) respondents in respectively blocks one–five. Note that these blocks represent the university’s block system in which two or more courses are offered in each of the five blocks of a bachelor year. The most important causes of free-riding (partly adapted from Popov et al. (2012) and van den Herik and Benning (2021)) were different motivation and/or skill levels (51 students, 59.3%), different work ethics (e.g. taking initiative) (48 students, 55.8%), different attitudes toward deadlines (46 students, 53.5%), different ambitions (e.g. aiming for a “6” instead of a “9”) (28 students, 32.6%), different style of communication / conflict management (16 students, 18.6%), attitudinal problems (e.g. dislike, mistrust, lack of group cohesion) (15 students, 17.4%), and other causes (9 students, 10.5%). The scores for the three statements related to respondents’ attitude toward group work and the four statements about individualism / collectivism (Payan et al., 2010) were respectively 3.60, 3.07, 3.54, 3.16, 3.26, 2.87, and 3.07 (where strongly disagree = 1 and strongly agree = 5). An overview of the sample characteristics can be found in Table 3.
Descriptive statistics of the sample.
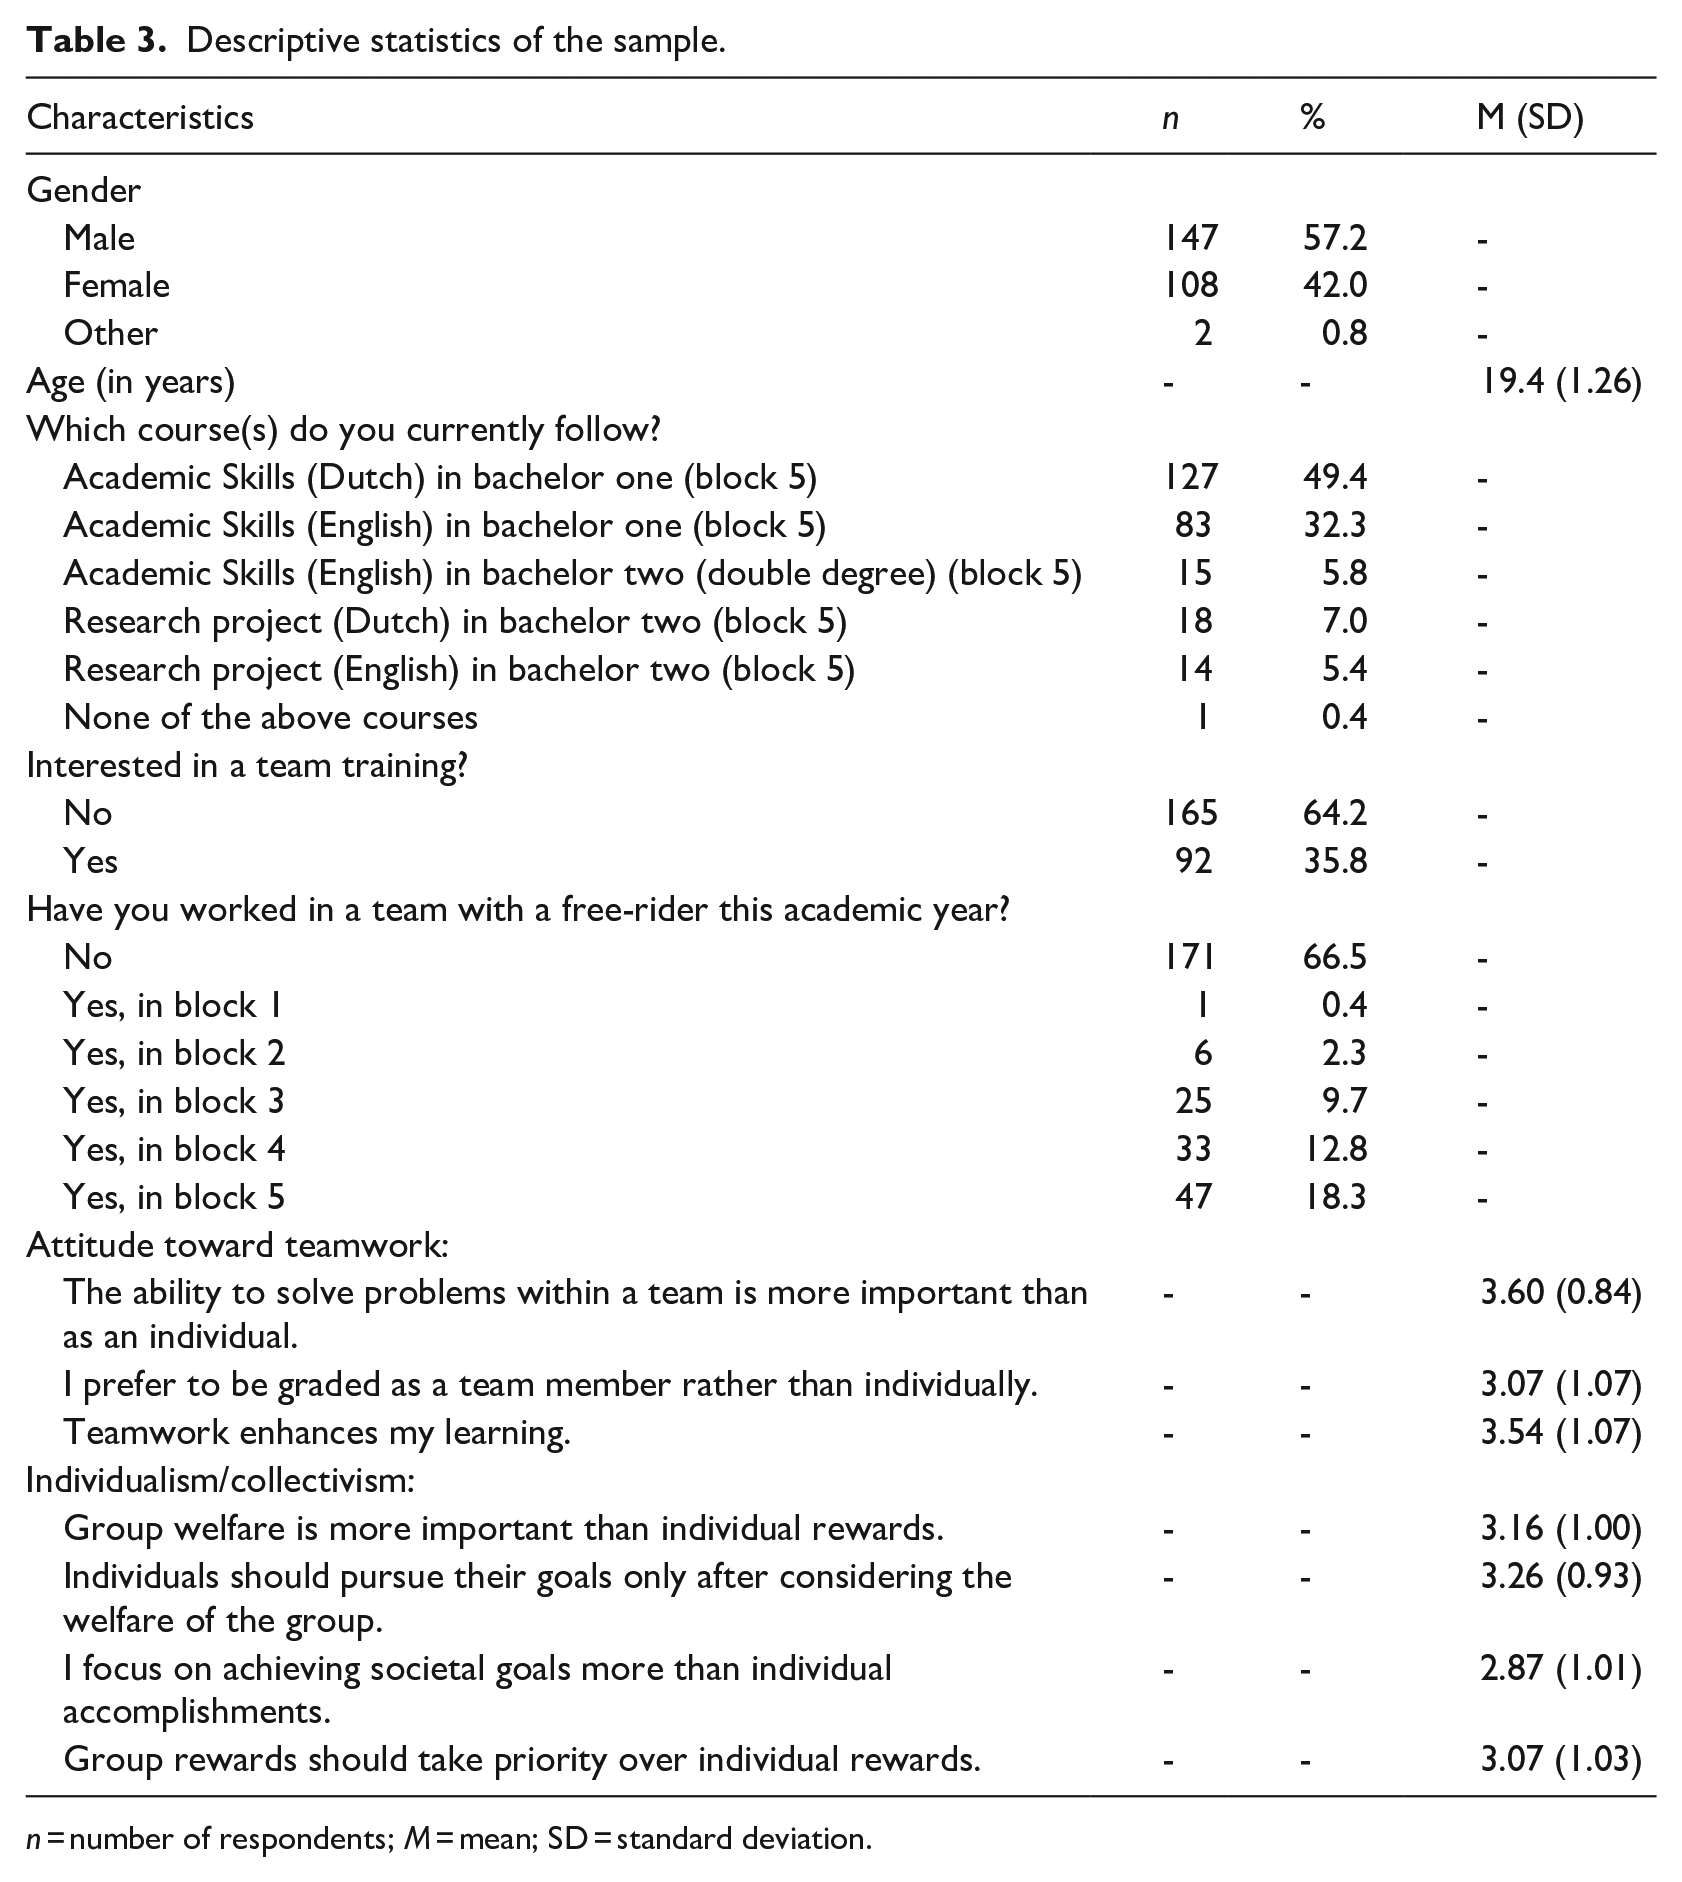
n = number of respondents; M = mean; SD = standard deviation.
Model estimation results
The results of the first RPL model (Table 4—Model 1) provide information on students’ preferences for the five group project characteristics. More specifically, the positive coefficient signs and statistically significant effects of the dummy variables
Random parameter logit model results for group project choice.
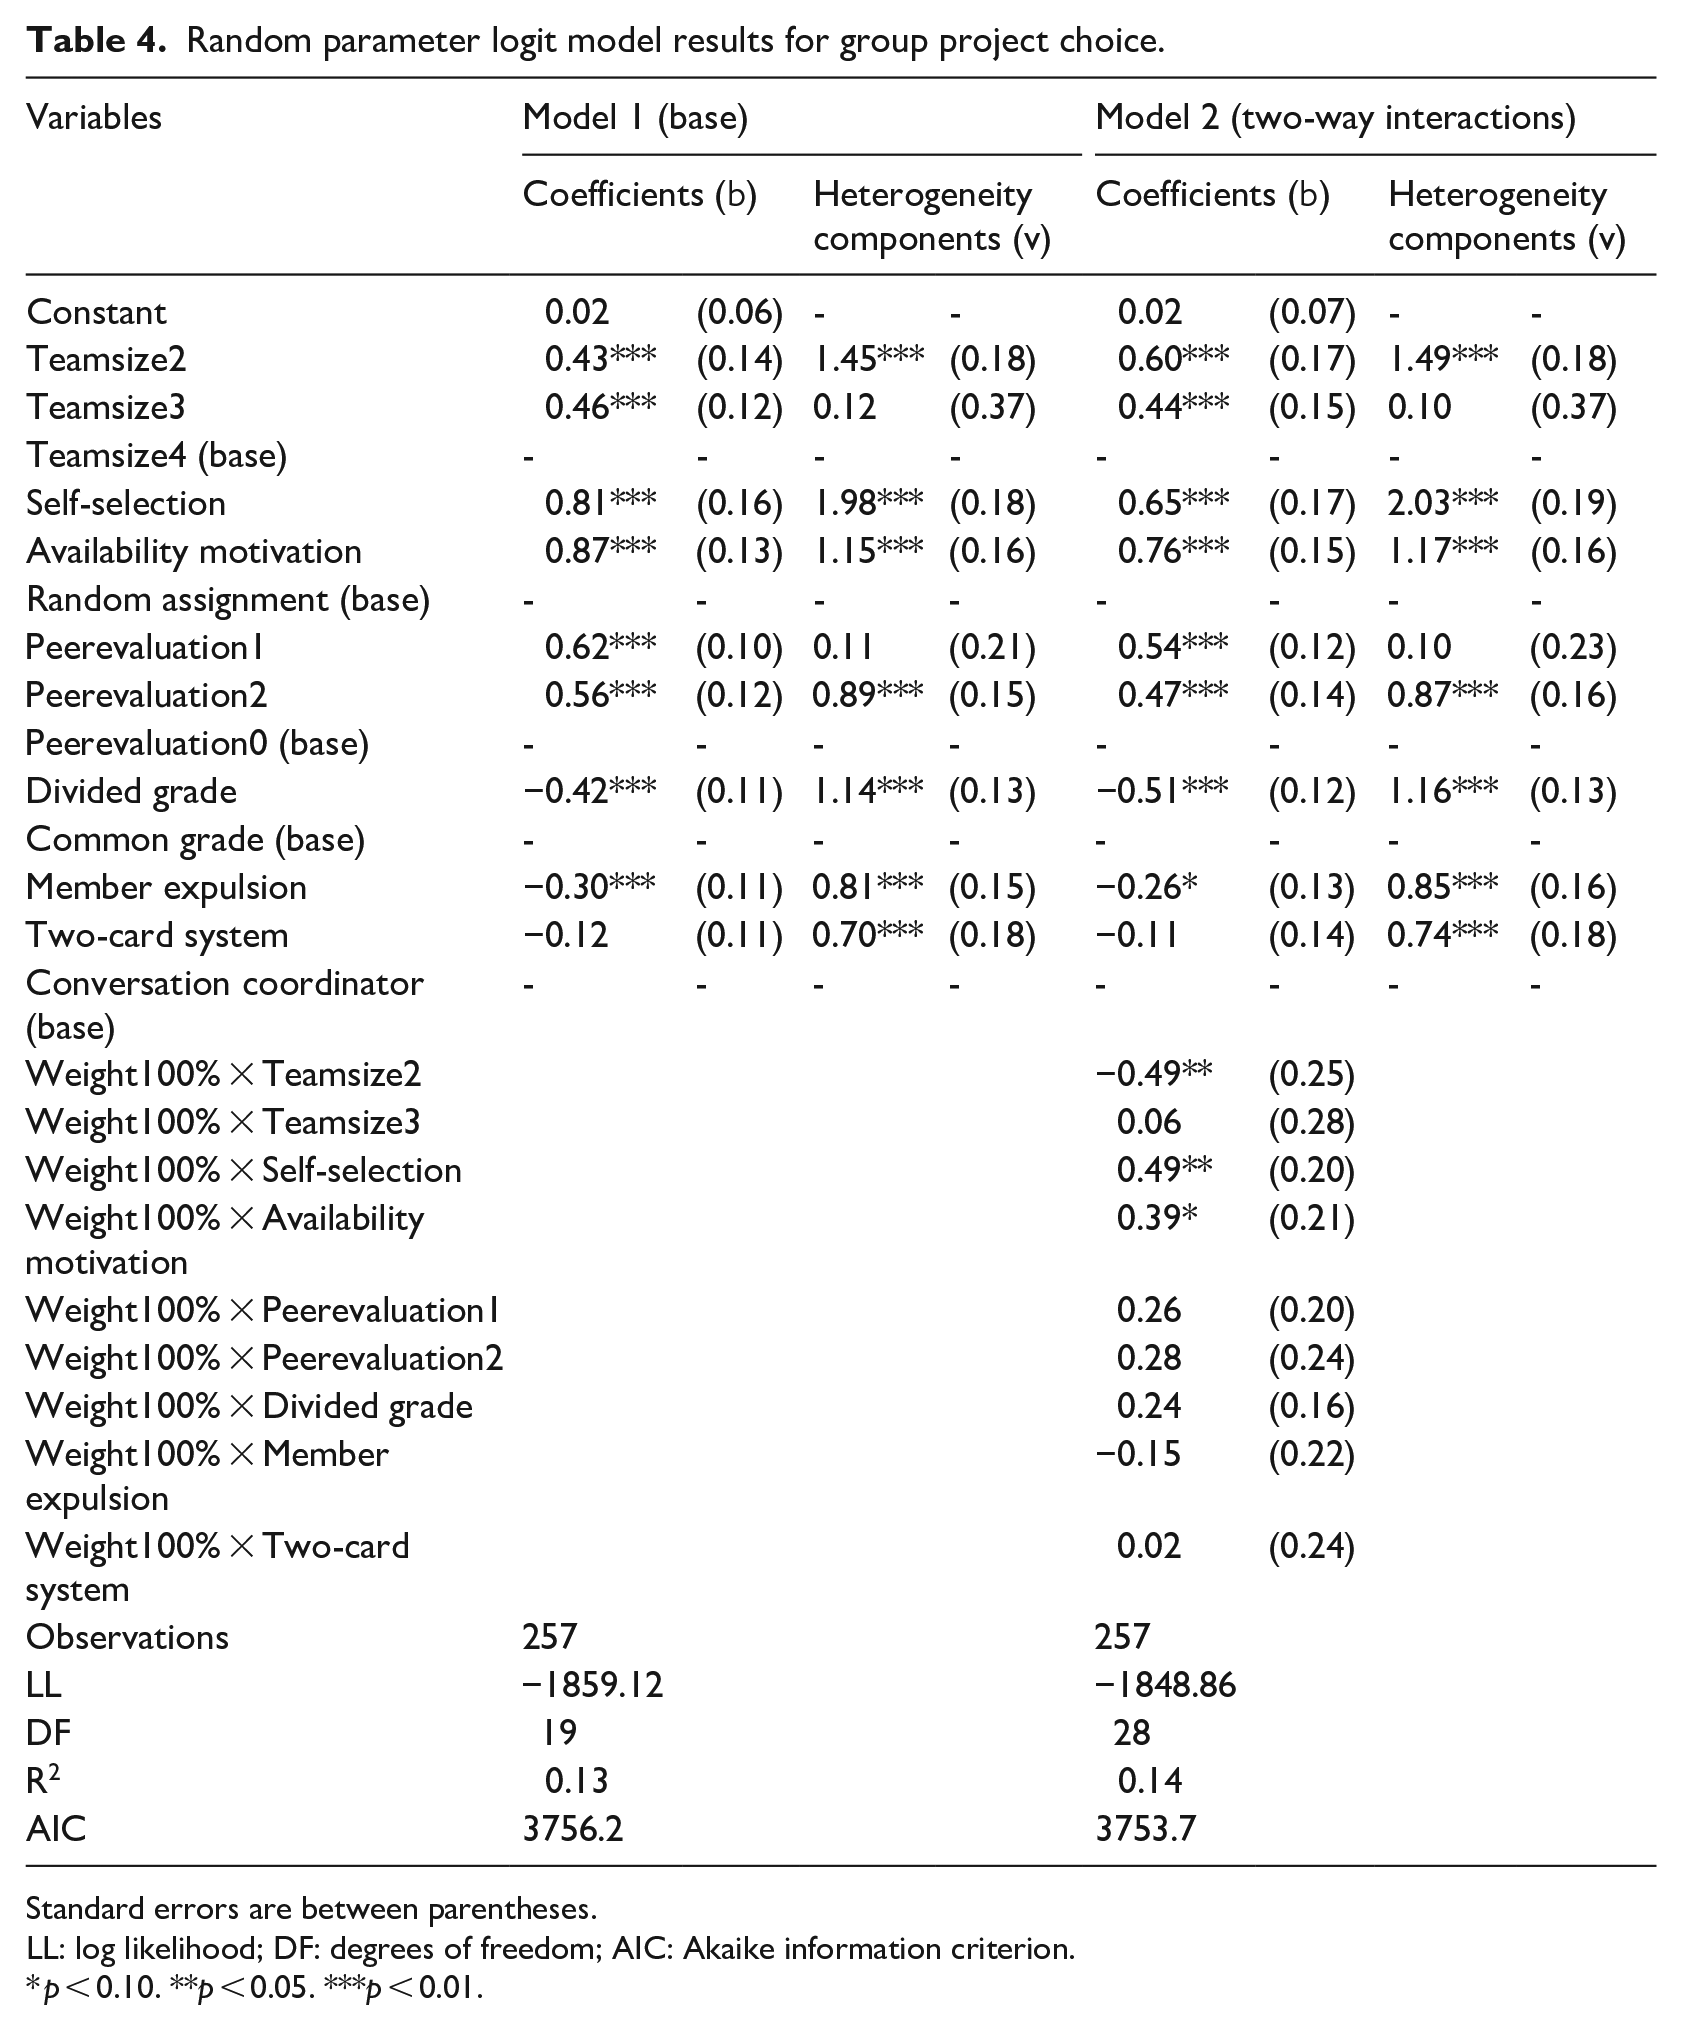
Standard errors are between parentheses.
LL: log likelihood; DF: degrees of freedom; AIC: Akaike information criterion.
p < 0.10. **p < 0.05. ***p < 0.01.
The results of the extended RPL model (Table 4—Model 2) show how stake (operationalized by different group project grade weights) moderates the effect that the group project characteristics have on group project choice. Note that we only include the two-way interaction effects of the group project characteristics with a grade weight of 100% in this model (i.e. not also the two-way interaction effects with a grade weight of 30%) as additional analysis (see https://doi.org/10.25397/eur.20342910) showed that all statistically significant two-way interaction effects (p < 0.05) were based on a grade weight of 100% (Benning, 2022a). Including the two-way interaction effects of the group project characteristics with a grade weight of 30% also did not result in a substantial improvement in model fit.
The statistical significance of the two-way interaction effects
In sum, only the characteristic team formation approach (i.e. self-selection) becomes more important for students in case of a higher grade weight of 100%. This (partly) supports our hypothesis that group project characteristics which are more effective in reducing free-riding become more important for students when their personal stakes increase.
Discussion
Findings and related literature
The current research investigates (a) students’ preferences for five group project characteristics that help to reduce free-riding and (b) how students’ preferences for these characteristics are affected by how much there is at stake for them in the group project. In line with the literature on reducing free-riding, we find that students prefer a small team size (e.g. Aggarwal and O’Brien, 2008; Strong and Anderson, 1990), a team formation approach different than random assignment (e.g. Chapman et al., 2006; Strong and Anderson, 1990), and the use of peer evaluations (Aggarwal and O’Brien, 2008; Brooks and Ammons, 2003). However, based on our results, students do not have a preference for a team size of two instead of three students, while Strong and Anderson (1990) found that students in teams of two (instead of three) had clearly higher perceptions that their group size reduced free-riding—but their sample was small (i.e. only 43 students). Furthermore, students do not have a clear preference for assignment based on schedule availability and motivation instead of self-selection in our study, while Harding (2018) found that—in a quasi-experiment—students reported less free-riding when assignment based on schedule availability and motivation was used as a team formation approach. A possible explanation is that students do not see the additional benefits of this method in contrast with self-selection, which offers more control of whom to work with.
We also find that students prefer (the levels of) two characteristics which are probably less effective in reducing free-riding. More specifically, they prefer a common grade instead of a divided grade as type of grade, and a conversation with the coordinator instead of member expulsion as a method to handle free-riding. An explanation for the finding that students do not always prefer group project characteristics that are expected to be more effective in reducing free-riding is that they may believe other group project characteristics already sufficiently reduce free-riding and/or that other considerations (also) play a role. For example, students dislike of the divided grade may be based on the additional time it would take them to fairly distribute grades between team members and the possible discussion this may lead to. Moreover, students may dislike member expulsion because non-free-riding students need to do even more work when a free-rider is expelled from the team or because they do not see the need for such a strict and direct method.
Some of our findings regarding the method to handle free-riding match and others contradict previous findings from the literature. In line with van den Herik and Benning (2021), we find that students do not like member expulsion. On the other hand, Abernethy and Lett (2005) experienced less complaints of free-riding after implementing their “You are fired!” method (comparable to member expulsion), but they did not test the method against other methods—also not against the situation where no method was used. Furthermore, we find that students clearly prefer a conversation with the coordinator without a sanction, whereas such a method was least preferred by students in van den Herik and Benning (2021).
Finally, we find that self-selection becomes more important for students in case of a high group project grade weight of 100%. This offers some support for our hypothesis that group project characteristics which are more effective in reducing free-riding become more important for students when their personal stakes increase and is in line with the idea of vested interest theory that attitudes of individuals better reflect their behavior in case of high vested interest (Crano and Prislin, 1995; Sivacek and Crano, 1982). However, there are also several group project characteristics that do not become more important for students when their personal stakes increase. It could be that students find specific characteristics less important in general (even if stakes are high) or that there are other considerations which make students less sensitive for higher stakes (e.g. the possible concern that completing peer process evaluations takes a lot of time).
Limitations of the study
This study has several limitations. A first limitation is the relatively low response rate. Further analysis showed that the sample is representative for the population of students who participated in the related courses with respect to age (average of 19.4 vs 19.9 years) and country of origin (65.4% vs 66.3% of the students were Dutch), but the percentage of male students was clearly lower in the sample than in the population (57.2% vs 68.2%).
A second limitation is that there may be students who generally perceive group projects as a context in which stakes are high, irrespective of the presented grade weight. Unfortunately, we do not have information about the perceived stake levels of students for the three grade weights to further investigate this issue.
A third limitation is that there are many other relevant aspects worth investigating which we did not include in the DCE. For example, consider team formation approaches based on learning styles (Soetanto and MacDonald, 2017), a hybrid (two-stage) approach which combines self-selection with other methods (Kutlubay and Uslay, 2019), a shared tendency to procrastinate (Harding, 2020), and team formation exercises (Pearlstein, 2021). Furthermore, a combination of a common grade and a divided grade as a type of grade, instead of using only one type of grade, would also have been interesting to investigate as this is a relatively common approach in practice. Further research could investigate students’ preferences for aspects like these.
Finally, we would like to emphasize that preferences obtained via a discrete choice experiment (i.e. stated preferences) do not perfectly represent individuals’ real-life choices (i.e. revealed preferences) (Hensher et al., 1998). Further research could therefore investigate to what extent students’ real-life choices for group project characteristics differ from their stated preferences.
Implications for educators
The results of the present study offer several practical insights for educators who would like to reduce free-riding and at the same time keep students satisfied. Our recommendations particularly hold for large bachelor one and two university courses in which students have to complete a group project that consists of several group assignments—with a particular focus on writing a full academic (research) paper. More specifically, we propose to reduce free-riding by: (1) using assignment based on schedule availability and motivation or self-selection as team formation approach instead of random assignment (note that self-selection becomes even more important for students when stakes are high—that is, when the group project counts for 100% toward the final course grade), (2) implementing one or two peer process evaluation moments in which students give each other feedback on process related aspects during the block (note that these evaluations just serve as feedback and do not affect student grades), and (3) creating small teams of three or two students (instead of four) and teams of three students in case of high stakes. Furthermore, to keep students satisfied (not to reduce free-riding) we propose: (4) using a common grade instead of a divided grade, and (5) implementing a conversation with the coordinator without a sanction (or perhaps the two-card system) as a method for handling free-riding, instead of member expulsion.
Our advice can also be used by departments that would like to propose best-practice recommendations for the set-up of group projects (McCorkle et al., 1999), but with some caution as students’ preferences for group project characteristics may vary for different types of courses and students (van den Herik and Benning, 2021). We hope that other educators will also measure the preferences of students in their courses and publish the results. This will lead to a better understanding of how free-riding in group projects can best be reduced while keeping students satisfied.
Footnotes
Acknowledgements
The author would like to thank Bas Karreman, Bastian Ravesteijn, Brigitte Hoogendoorn, Dimitrios Tsekouras, Hans van Kippersluis, Max Coveney, Robert Dur, Teresa Bago d’Uva, and Victor Beerkens for their input regarding the group project characteristics, Esther de Bekker-Grob, Joffre Swait, Samare Huls, and Welmoed van Deen for their helpful suggestions related to the set-up of the choice experiment in two Erasmus Choice Modeling Center (ECMC) presentation meetings, and Benedict Dellaert for his feedback related to the experimental design, the reporting of the results, and the first draft of the paper. Furthermore, the author would like to thank the editor and the two anonymous reviewers for their constructive feedback.
Data availability statement
Data supporting the findings of this study are available in the EUR data repository under restricted access at ![]() . Access to the data is subject to the approval of a data sharing agreement due to the personal information contained in the dataset. Requests to have access should be directed to the corresponding author.
. Access to the data is subject to the approval of a data sharing agreement due to the personal information contained in the dataset. Requests to have access should be directed to the corresponding author.
Declaration of conflicting interests
The author declared no potential conflicts of interest with respect to the research, authorship, and/or publication of this article.
Funding
The author disclosed receipt of the following financial support for the research, authorship, and/or publication of this article: This research was funded by the Community for Learning and Innovation (CLI) at the Erasmus University Rotterdam.