
Abstract
Biomaterials are a class of porous materials that have been widely exploited over the past two decades. However, the implications of controlling adsorption by rate-limiting steps are still not adequately established. Identifying the rate-limiting step is a promising approach for the design of adsorption systems. In this review, we study in detail the rate-limiting step of the adsorption of dyes in aqueous media on biomaterials to rationalize the factors governing the rate-limiting step involved in the adsorption process using empirical kinetics and mass transfer models. This knowledge is then applied to identify the best fit of these models to study the rate-controlling step involved in the adsorption process, which is crucial for the design of the adsorption system. This review first studies the limiting step of adsorption of dyes in an aqueous medium on biomaterials. Kinetic modeling is used to better understand the rate control step involved in biosorption. Generally, the equations used are empirical models of kinetics and mass transfer and the biomaterials come from the following categories: agricultural and industrial waste, algae, fungi, bacteria, and plants. In most adsorption studies reported in this review, the pseudo second-order model was found to be best suited for fitting the kinetic data of dyes on biomaterials, indicating that chemisorption is the rate-limiting step that controls adsorption. Concerning the diffusion effects of mass transfer, intraparticle diffusion is among the most often used models to examine the rate-limiting step which is controlled by both film diffusion and intraparticle diffusion. The first takes place when the external transfer is greater than the internal transfer while the opposite occurs in the case of porous diffusion. However, the majority of works do not study the real step of controlling the overall adsorption kinetics, namely, film diffusion or intraparticle diffusion.
Introduction
The elimination of heavy metals and dyes from aqueous industrial streams is of environmental interest due to their persistent nature in the aquatic environment. These pollutants bio accumulate in organic tissues, thus causing several metabolic dysfunctions. Globally, synthetic dyes are widely used in the textile, paper, printing, plastics, leather, food, and cosmetics industries. The elimination of heavy metals and dyes from industrial effluents is of environmental interest due to their persistent nature in the aquatic environment. These pollutants bioaccumulate in organic tissues, thus causing several metabolic dyes functions. Indeed, synthetic dyes are widely used in textile, paper, printing, plastic, leather, food, and cosmetics. An assortment of pollutants such as dyes, degradable organics, surfactants, heavy metals, and pH adjustment chemicals may be established in the textile wastewaters. In addition, colored effluents have a dramatic effect on the photosynthetic processes of the aquatic environment, causing low oxygen levels in the water and in severe cases, leading to asphyxiation of aquatic fauna and flora. 1 An assortment of pollutants such as dyes, degradable organic materials, surfactants, and heavy metals can be established in wastewater. Additionally, colored effluent has a detrimental effect on photosynthesis in aquatic environments, thus causing low oxygen levels in the water which can lead to asphyxiation of flora and fauna. Currently, dyes are the main source of pollution due to their uncontrolled release into water resources. 2 Many technologies have been applied to their removal such as photocatalysis, ultrasonic treatment, biodegradation, membrane separation, advanced oxidation processes (AOPs), coagulation/flocculation, and adsorption.3–10 The latter remains attractive because of the high cost of elimination of organics using activated carbon (AC). Nevertheless, it is still high cost when using commercial carbons and the research is focused on the elaboration of inexpensive biosorbents and biomasses. The pore surface area of the adsorbent was determined by the N2 adsorption-desorption and this has motivated the search for alternative adsorbents such biomaterials. The latter remains attractive due to the low cost of eliminating organic matter using activated carbon (AC). However, the use of commercial coals remains expensive and research focuses on the development of low cost biosorbents and biomasses. The pore surface area of the adsorbent was determined by N2 adsorption-desorption, which motivated the search of alternative adsorbents such as biomaterials. 11 Over the last decade, some studies have been published on different aspects of dye adsorption.12–16 Paï et al. 17 recently discussed the color removal performance of anionic and cationic dyes by nanocomposites while Kathiresan et al. 18 reviewed a number of biological, chemical, and physical methods for the dyes removal along with their effectiveness while Yagub et al. 19 demonstrated factors affecting the dyes adsorption. Zhou et al. 20 have oriented their research on hybrid adsorbents such as clays/zeolites and their composites, biosorbents, and industrial by-products. Kyzas et al. 21 gave a summary of how chitosan works for the removal of various dyes; Bhatia et al. 22 also reviewed biological methods employed to eliminate dyes from wastewater and several research studies continue to emerge in the area of the dyes elimination using biomaterials.
Despite several available works on dye removal, no detailed kinetic studies have been dedicated to providing in-depth insights into the limiting step of dye adsorption. The accuracy obtained from adsorption processes depends on the modeling and interpretation of adsorption kinetics. Linear regression analysis was frequently used to access the quality of adsorption kinetic performance. Nonlinear regression has also been studied where the adsorption reactions take place according to a complex mechanism with the rate determination step (RLS). It is an important factor in influencing adsorption because it can play a role in the kinetics; therefore identifying RLS is essential for designing adsorption. Furthermore, it would be difficult to discuss adsorption mechanisms without knowledge of RLS, and many kinetic studies focus on RLS questions. This concept is important to be introduced to authors exploring the use of adsorbents for the removal of organic molecules in general and dyes in particular. The present work was designed in detail to comprehensively study the RLS that controls the adsorption process by biomaterials such as algae, fungi, bacteria, agricultural and industrial wastes, and plants. Therefore, RLS needs to be explained to authors exploring the use of adsorbents. This review will help the scientific community to strengthen the conceptual knowledge and prediction of RLS for adsorption design and modeling.
Rate-limiting step
One of the major aspects of any adsorption kinetic study is the investigation of RLS, that is, the kinetic that governs the global process 23 and this is difficult for any system. Prediction of RLS is of great importance in the design of any adsorption system, 24 a key information for the evolution of the biosorption. In principle, the rate constant of dye adsorption by a biomaterial can be determined from the set of simultaneous rate equations for the individual steps of the mechanism, one for each step. However, the analytical solution of these differential equations is not always easy. The assumption of a single RLS can greatly simplify the calculation of adsorption. Furthermore, the rate equation of the adsorption mechanism is usually in a simple mathematical form. Using a kinetic model, it is possible to identify RLS of adsorption of dye molecules.25,26
During adsorption, at the solid-liquid interface, a number of steps are involved in the transfer of coloring species from the bulk to the surface of the biomaterial
27
(Figure 1): Adsorption of dye molecules from aqueous solution into the surface interior of the adsorbent.
27
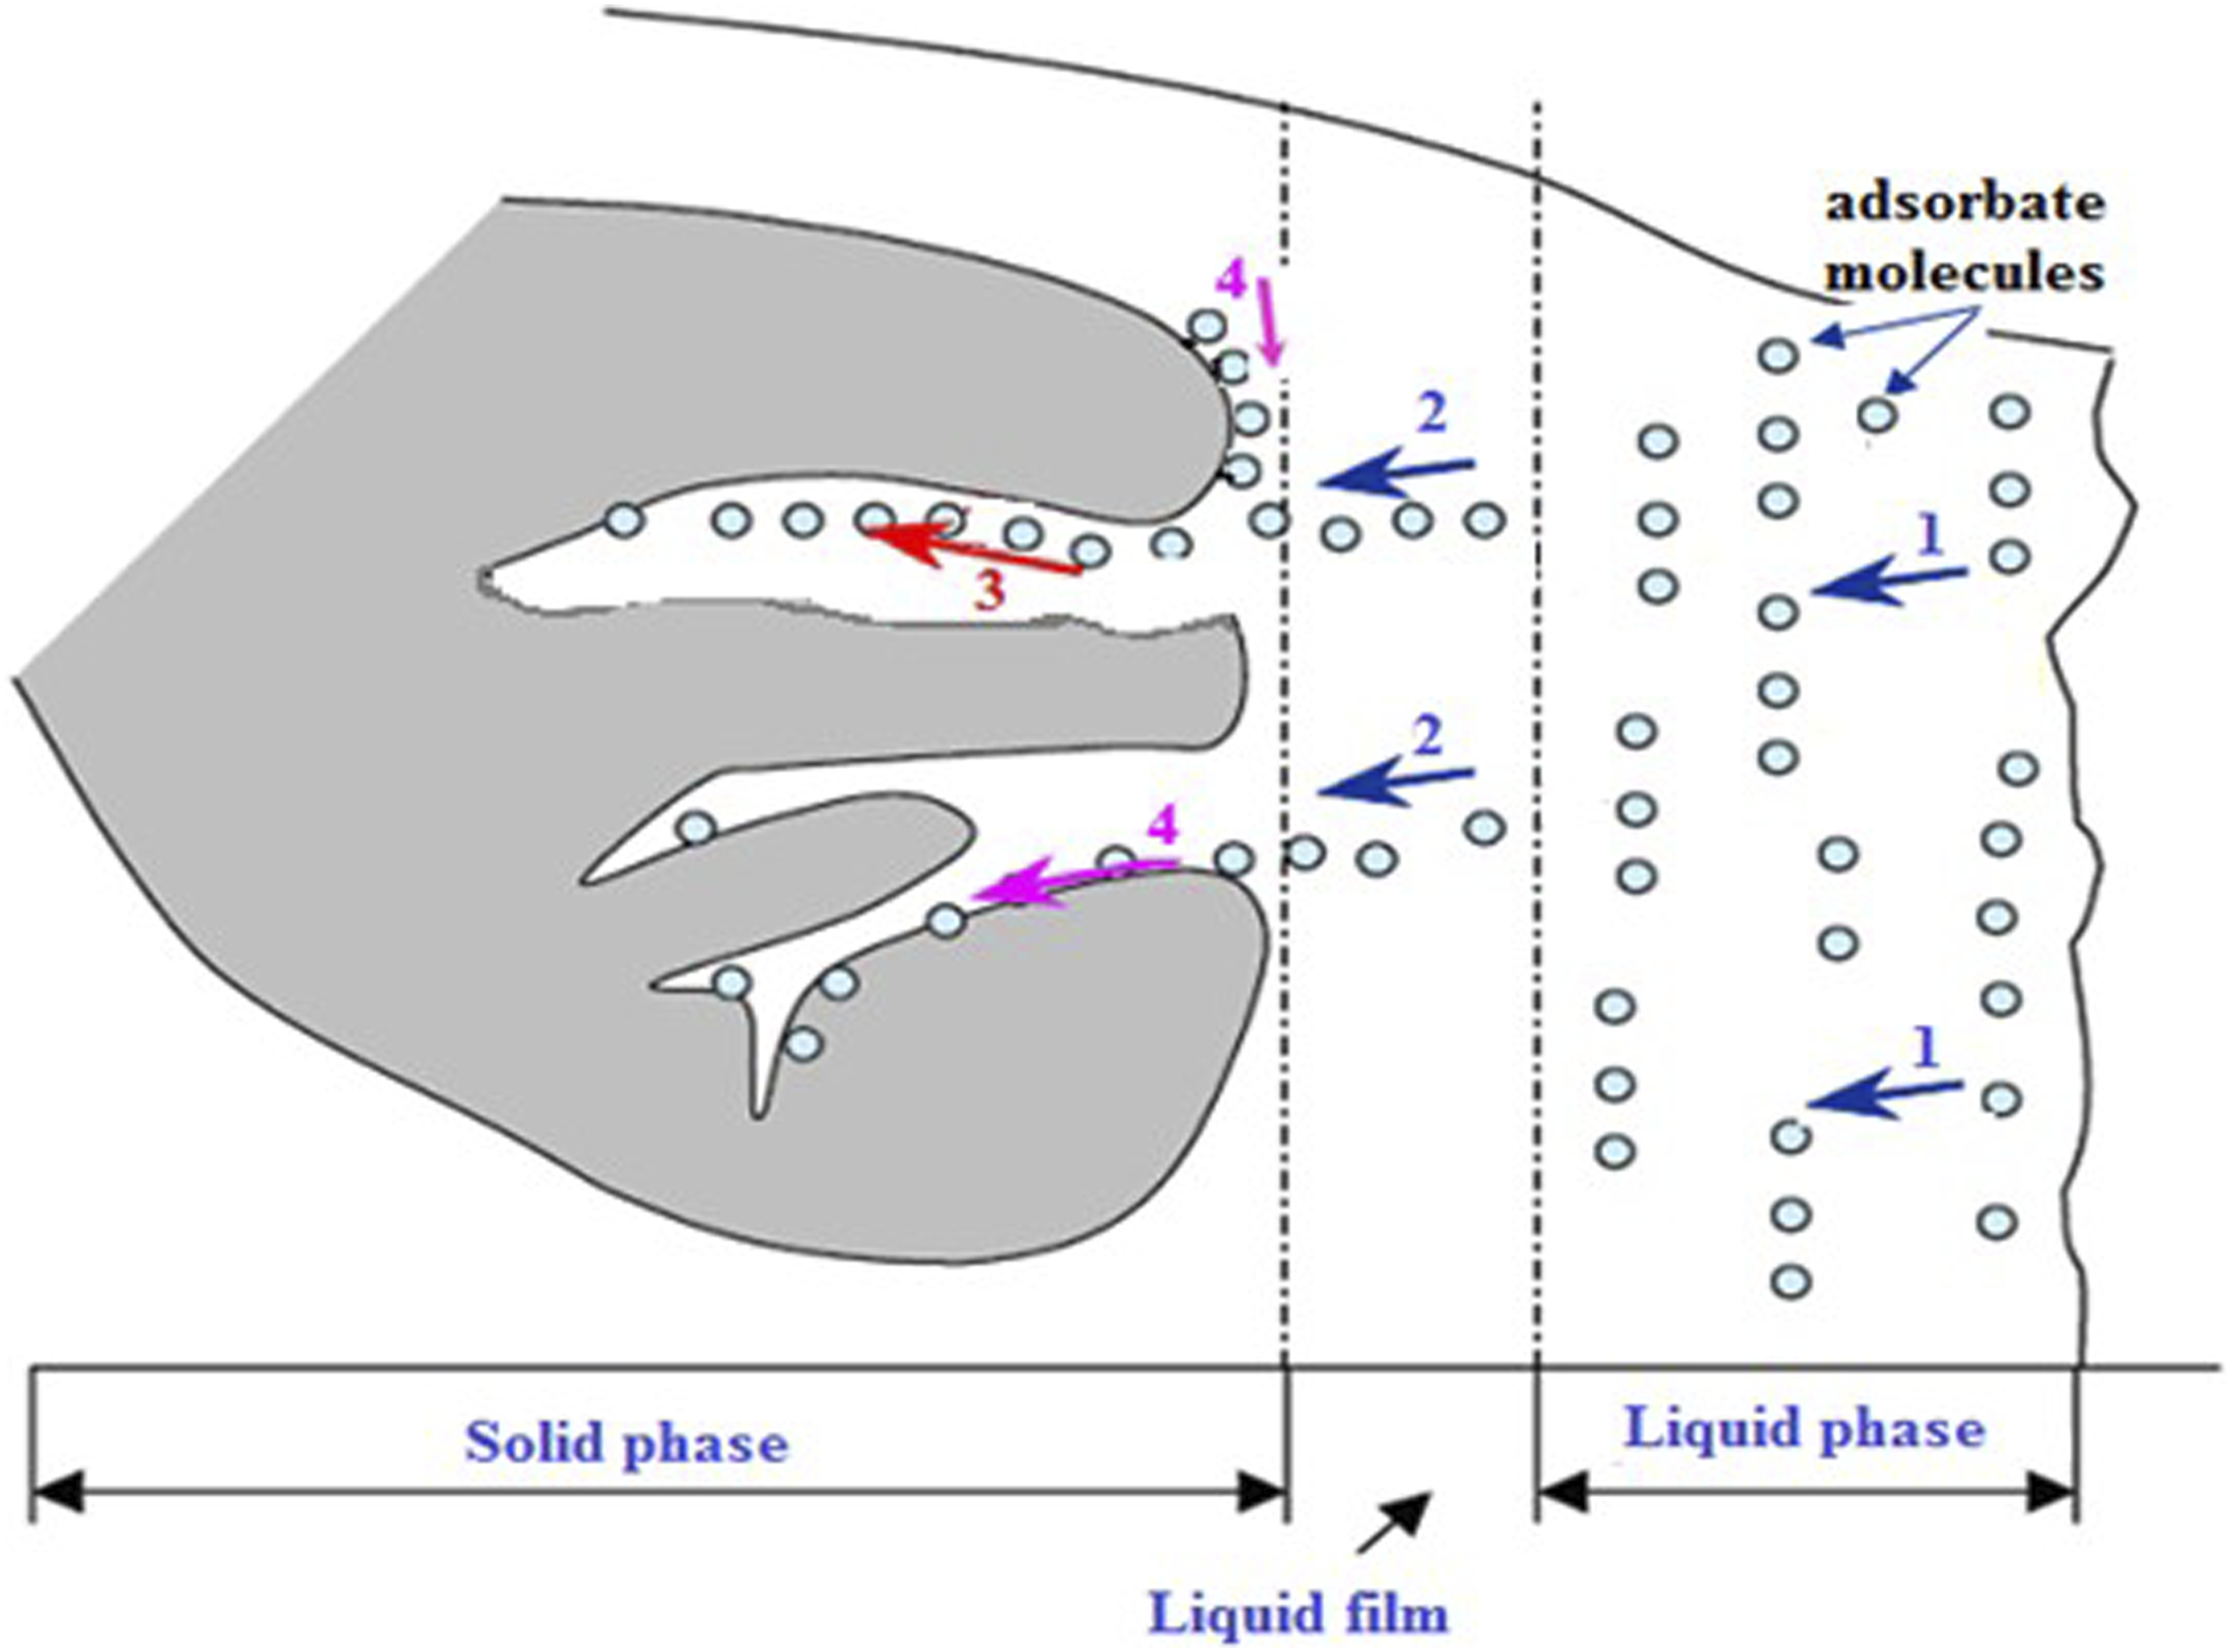
Transport of coloring molecules towards the periphery of the biomaterial
Diffusion of molecules through the liquid film surrounding the absorbing particles (film diffusion)
Dye molecules diffuse inside the intraparticle spaces and pores of the adsorbent (pore diffusion)
Fixation of these molecules on the sites of the adsorbent.
The limiting step corresponds to the overall speed of the process. 28 Previous studies have reported that the first and fourth stages are relatively rapid compared to the second and third stages.29,30 Usually, film diffusion and pore diffusion are the important steps governing sorption rates. One of the two steps or their combination can therefore govern the process. 31 On the other hand, the pore diffusion controls the adsorption process for systems having high initial dye concentration, good mixing, large adsorbent particle size, and low affinity dye/biomaterial. Film diffusion is generally limiting in systems that have poor mixing, dilute dye concentration, low particle size, and high dye/biomaterial affinity. 32 In contrast, porous diffusion controls the adsorption process for systems with high initial dye concentration, good mixing, large adsorbent particle size, and low affinity dye/biomaterial.
Kinetic modeling of adsorption
The main concern of environmentalists today is the presence of hazardous compounds in real effluents, resulting in dangers to many forms of life.1–4 Over the past decades, the use of pharmaceuticals and dyes has increased significantly around the world. Given their implication on human health, their presence in the aquatic environment constitutes an emerging problem, which could have a long-term effect on ecological sustainability. Batch adsorption experiments represent an alternative for environmental protection. Adsorption efficiency is strongly dependent on pH and appears to be the reason why, in any adsorption study, optimizing the absorption rate as a function of pH is essential. Indeed, the pH conditions both the surface charge of the adsorbent as well as its structure. The remaining concentration of dyes was titrated by UV-visible spectrophotometry at the maximum wavelength (λmax) and deduced by linear interpolation. The adsorbed quantity qt (mg/g) and the percentage of dye removal R
t
(%) by the biosorbent were calculated from the following equations


C o is the initial dye concentration, C t is the concentration (mg/L) at time (t), V is the volume of solution (L), and m is the mass of biosorbent (g). Analysis of experimental data at different times becomes feasible to calculate kinetic parameters and obtain information to design and model adsorption processes. 33 The adsorption kinetic is expressed by a graph presenting the variation of adsorbed dye by a biomaterial with contact time. 34 Kinetic modeling of adsorption is used to better understand the rate control step involved in the adsorption process. 35 Generally, the used equations are empirical kinetic models and mass transfer models.
Error function
Linear regression is one of the most pronounced and viable tools, frequently applied for the analysis of adsorption experimental data. The coefficient of determination (R2) minimizes the distribution of errors between the experimental kinetic data and the predicted data. Nonlinear regression also leads to the minimization of error distribution; however, the operation is difficult in the absence of suitable algorithms. Due to the results obtained from the linearization of isothermal models and kinetic models, the determination coefficient R2 is generally insufficient to predict the model which presents the best correlation. Thus, the application of error models, Root Mean Square Error (RMSE), the Sum of Error Squares (SSE), and Chi-Squares (X2) test, equations (3), (4), and (5), respectively, are used as criteria for the quality of fitting. Due to the inherent bias resulting from linearization of the isotherm model and the kinetic model, for nonlinear regression, the coefficient (R2) is insufficient to assess the goodness of fit. Thus, the application of the Root Mean Square Error (RMSE), the test equation of sum of square error (SSE), and chi-square (X
2
), equations (3)–(5), respectively, are used as criteria for the quality of fitting

Empirical kinetic models
Pseudo first-order kinetic model
The equation for pseudo first-order kinetics introduced initially by Lagergren
36
is generally used in the form modified by Ho and McKay

This equation may also be written in the following alternative way

If
Then, one would have in the case of

This model suggests a physisorption with diffusion as the rate-controlling step. 37
Pseudo second-order kinetic model
The pseudo second-order kinetics is generally employed in the form proposed by Ho and McKay
38
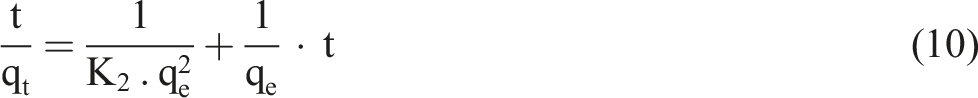


This model assumes that chemisorption is the rate-limiting step in adsorption. Previous studies have shown that the error structure of experimental data is generally changed when transforming adsorption kinetics into their linearized forms. 39 The pseudo second order presents four (4) linear forms. Therefore, there is the need to identify and clarify the usefulness of both linear and nonlinear regression analysis in various adsorption systems. It is against this backdrop that non-linearized regression analysis became inevitable, since it provides a mathematically rigorous method for determining adsorption parameters using original form of kinetic equations.
Elovich equation
The Elovich equation is expressed by the relation
40

Integration of the rate constant leads to the linear form

Mass transfer models
Intraparticle diffusion equation
The intraparticle diffusion equation is given by
41

Bangham equation
The Bangham equation is used to describe the diffusion of the pollutant into the pores of the adsorbent. In this model, dye molecules move from the surface to the interior sites of the particles by diffusion into pores; this model is the generalization of that of Weber and Morris42,43 whose equation is expressed as follows
44

In general, three steps are involved in the adsorption, namely, the extra-granular diffusion, intra-granular diffusion, and interaction of the adsorbate with the active sites of the adsorbent. Among these steps, the third is very fast and therefore is not the limiting step, and the overall adsorption process can be controlled by the first two steps; the Bangham equation is applied in this study to check whether the pore diffusion is the limiting step or not.
Boyd plot
The Boyd kinetic expression is
45


Substituting the value of

The
External mass transfer model
This model describes the evolution of the concentration of the solute C (mg/L) in the solution, as a function of the difference in the concentrations in the solution C and on the surface of the particles Cs (mg/l), according to the following equation
46

β is the mass transfer coefficient (m s−1), and
Hence, at
Kinetic studies in dyes adsorption on various kinds of biomaterials
Many biomaterials have been studied to remove dyes in aqueous environments. For the sake of understanding, biomaterials are subdivided into the following sections:
Algae
The word “algae” refers to a large and diverse group of eukaryotic organisms that contain chlorophyll and carry out oxygenic photosynthesis. 47 Numerous chemical groups are responsible for dye adsorption by algae, for example, amino, carboxyl, sulfate, and phosphate. 48 Algae used for the dye elimination include Spirogyra sp, 49 Sargassum muticum,50,51 Stoechospermum marginatum, 52 Spirulina platensis, 53 Turbinaria conoides, 55 Nostoc comminutum, 56 Cymopolia barbata, 57 Ulothrix sp., 58 and Chlorella sp. 59
Khataee et al. 49 used Spirogyra sp. for the removal of three textile dyes, that is, Acid Orange 7, Basic Red 46, and Basic Blue 3 in batch processes. The pseudo second-order equation showed proper fitting with a high coefficient (R2 >0.990) compared to the pseudo first-order model (R2: 0.870−0.970). The R2 values (0.92−0.98) for the intraparticle diffusion model are far from unity, suggesting that both the film diffusion and intra-particle diffusion are involved in the mass transfer limiting step. Authors stated that RLS is controlled by pore diffusion.
El Atouaniet al. 50 studied the batch sorption of methylene blue (MB) onto Sargassum muticum and the equilibrium was reached within 60 min. The kinetic data fitted well with the pseudo second-order model, indicating that RLS is involved in chemisorption. Sargassum muticum was modified with methanol for the MB removal from aqueous solution 51 showed that the equilibrium was achieved within the range (30–60 min). Adsorption kinetics obeys the pseudo second-order (PSO) model. The plotqt versus t0.5 represents a double linearity, with two well-distinguished stages: the first step is attributed to the boundary layer diffusion effect, whereas the second step is the intraparticle diffusion effect; RLS is the intraparticle diffusion. Daneshvar et al. 52 used macro alga S. marginatum to adsorb three acid dyes, namely, the Acid Blue 25, Acid Orange 7, and Acid Black 1, where the PSO model adequately models the data of their adsorption kinetics. The intraparticle diffusion model did not describe well the acid dyes adsorption onto S. marginatum as, evidenced by the low R2 values, between 0.84 and 0.92. This poor conformity suggests that RLS is affected by both the film diffusion and intraparticle diffusion.
Dotto and Pinto
53
used S. platensis for the removal of FD&C Red N° 40 in batch experiments. From the intraparticle diffusion plot (qt vs t0.5), the adsorption follows two steps (Figure 2 Intra-particle diffusion model plots for the sorption of FD&C red no. 40 by S. platensis at various pH.
53
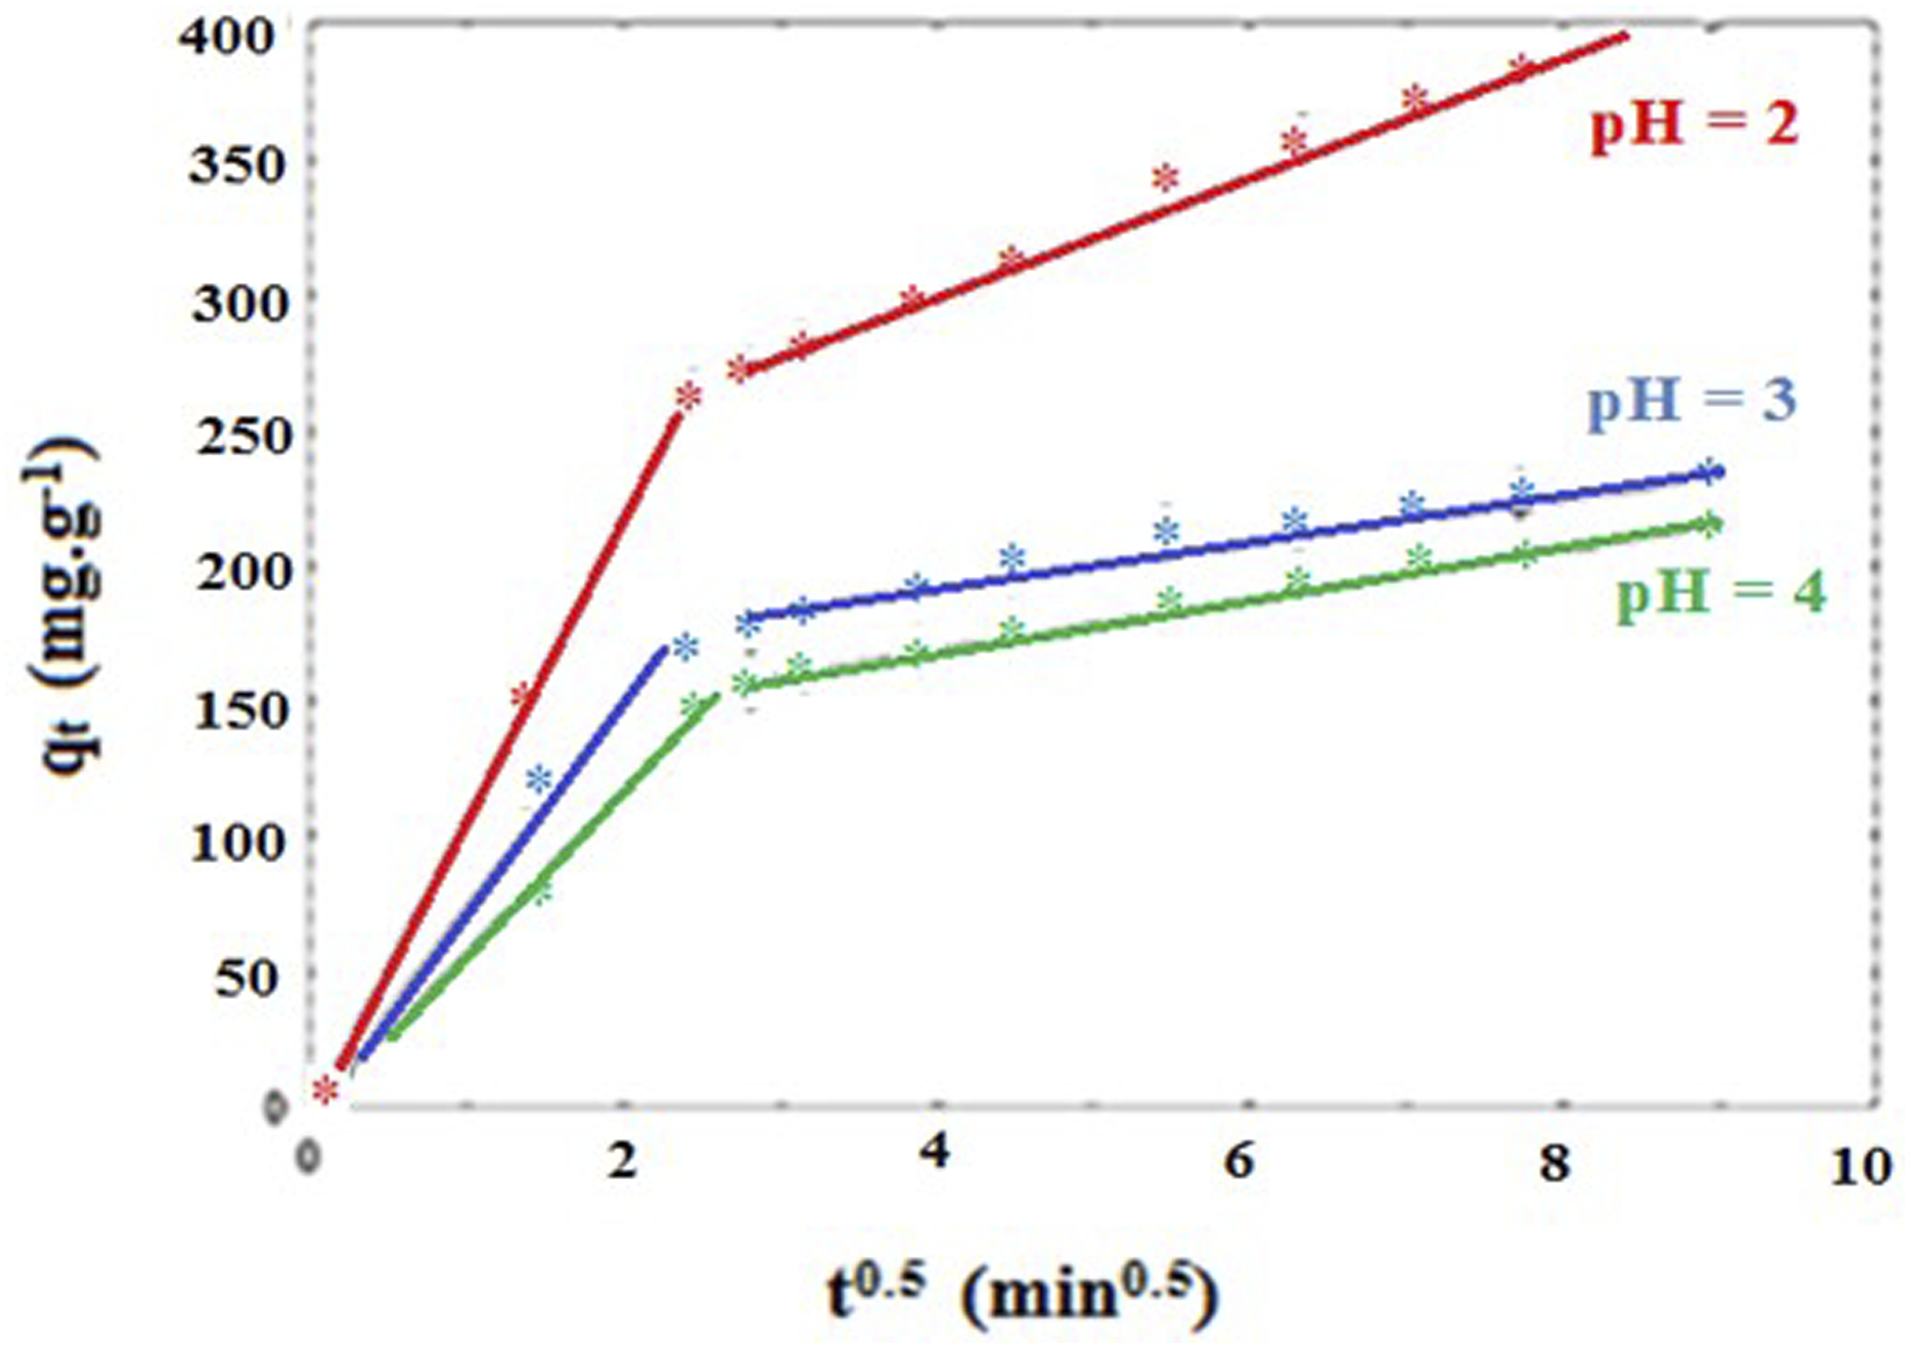
Kinetic studies of sorption of some dyes onto biomaterials.
Mullerova et al. 57 tested the modified macro algae C. barbata for Safranin O removal, where the time to reach the equilibrium did not exceed 90 min. The PSO model yielded the best fit with the coefficient R2 of 0.996, while its value for the intra-particle diffusion model is low (0.836) with a nonlinear plot qt versus t0.5. This clearly indicates that both the intraparticle diffusion and film diffusion are involved in the Safranin O adsorption. The MB biosorption by Ulothrix sp. was studied 58 and the equilibrium was reached after 30 min of contact time where the PSO model exhibits kinetic analysis with R2 coefficient close to unity (=0.998). On the contrary, the intraparticle diffusion model did not show a good fit with the kinetic data (0.751 < R2< 0.976), indicating that interstitial diffusion is not the only limiting step.
Chlorella sp. microalgal biochar could be used to remove MB and Congo red; 59 the dyes were adsorbed at the interface in a longer contact time (120 h) for MB and decreased considerably for Congo red (4 h) and the reason for this is a decrease in the number of sorption sites as well as the initial dye concentration (Co). PFO models well to the kinetic analysis of the two dyes, where the concentration Co increases from 10 to 60 mg/L, which consolidates the physisorption process with diffusion into the pores as the limiting step in the MB adsorption. On the contrary, the diffusion of the film turned out to be the determining step for the adsorption of Congo red.
Fungi
A large number of different fungal organisms are also known for the removal of different anionic and cationic dyes, including Aspergillus wentii, 60 Funalia trogii, 61 Lentinus concinnus, 62 Aspergillus fumigates, 63 Rhizopus arrhizus, 64 Aspergillus carbonarius, 65 Penicillium glabrum, 65 Agaricus bisporus, 66 Rhizopus oryzae, 67 Daedalea Africana, 68 Phellinus adamantinus, 68 Turbinaria citrinoviride, 69 Turbinaria koningiopsis, and Pestalotiopsis sp. 69
Marine A. wentii was used for the elimination of Brilliant Blue G (BBG) 60 and the kinetic study showed that its adsorption increases over time and a complete saturation was reached after 180 min. The PSO model exhibited a better analysis for the kinetic data with a coefficient R2 of 0.991, compared to 0.956 for PFO for the same biomass. However, the intra-particle diffusion plot revealed a multi-linearity pointing out that the film diffusion and intra-particle diffusion occurred simultaneously in the BBG adsorption. Bayramoglu and Arica 61 employed native and transformed Funalia trogii biomasses for the adsorption of Congo red in batch systems; the adsorption equilibrium was reached within 60 min for the two biomasses and both the PFO and PSO equations were used to describe the kinetic data. PSO delineated the absorption kinetics, indicating that chemisorption is RLS, which controls adsorption.
Bayramoglu and Arica 62 employed native and transformed Funalia trogii biomasses for the adsorption of Congo red in batch systems; the adsorption equilibrium was reached within 60 min for the two biomasses and both the PFO and PSO equations were used to describe the kinetic data. The Pseudo second order delineated the absorption kinetics, indicating that chemisorption is RLS, which controls adsorption.. Chaudhry et al. 63 used Aspergillus fumigatu as sorbent for the removal of Acid Violet 49. The kinetic was rapid and a saturation was reached after 30 min; PSO perfectly described the adsorption kinetic data; and the intraparticle diffusion plot presented a multi-linearity with three distinct phases. Therefore, both the film diffusion and intraparticle diffusion were identified to be RLS in the dye of Acid Violet 49. Salvi and Chattopadhyay 64 explored the dead fungal biomass of R. arrhizus for the elimination by adsorption of Amaranth, Fast Red A, Congo red, Tartrazine, Metanil yellow, and Sunset Yellow FCF in batch experiments. The different dyes were removed within the first 100 min of contact time with the biosorbent and the saturation was reached after 4 h. The kinetic findings were best described by the PSO model. The intraparticle diffusion plot presented a multi-linearity indicating that two or more steps take place during the adsorption, which not only enclosed the processes of the liquid film diffusion and pore diffusion, but also the chemical adsorption with electrons exchanged between azo dyes and functional groups on the adsorbent surface. 64
In the dyes adsorption, the point of zero charge (PZC) is an important parameter (Figure 3), especially when electrostatic forces are involved in the adsorption. Bouras et al.
65
examined the ability of A. carbonarius and P. glabrum to adsorb Congo red, an anionic and hazardous anionic dye. The kinetic study indicated that the sorption rates on both biosorbents follow the PSO, and the intraparticle diffusion is not RLS. Pandey et al.
66
reported the biosoprtion of Crystal Violet (CV) and Brilliant green (BG) onto A. bisporus in batch mode, and the equilibrium times were found to be 60 and 40 min, respectively; the authors described the PSO kinetics for the biosorption of both dyes and the adsorption was affected by the boundary layer diffusion and intraparticle diffusion. Dey et al.
67
studied the MB biosorption by live cells of R. oryzae in batch system and evaluated the kinetic study by applying the PSO and intraparticle diffusion models. The former perfectly fits the sorption data with high correlation coefficient (R2 = 0.999). The C-values of the intra-particle diffusion model provide information on the thickness of the boundary layer, and the intercept of the intraparticle diffusion plot indicates a higher effect. The C-values of intra-particle diffusion model were higher than zero (1.35–9.47), suggesting that the mechanism of MB adsorption onto Rhizopu soryzae is not controlled by intraparticle diffusion. Therefore, both the film and pore diffusion are involved in the mass transfer controlling the MB adsorption onto R. oryzae biomass. Sintakindi and Ankamwar
68
carry out batch experiments to explore the kinetics of MB adsorption on Daedalea africana and Phellinus adamantine. The equilibrium time was reached between 150 and 180 min for D. africana and P. adamantine, while the kinetic follows the PSO model. Effect of pH and isoelectric pHPZC on crystal violet adsorption on activated carbon.
15
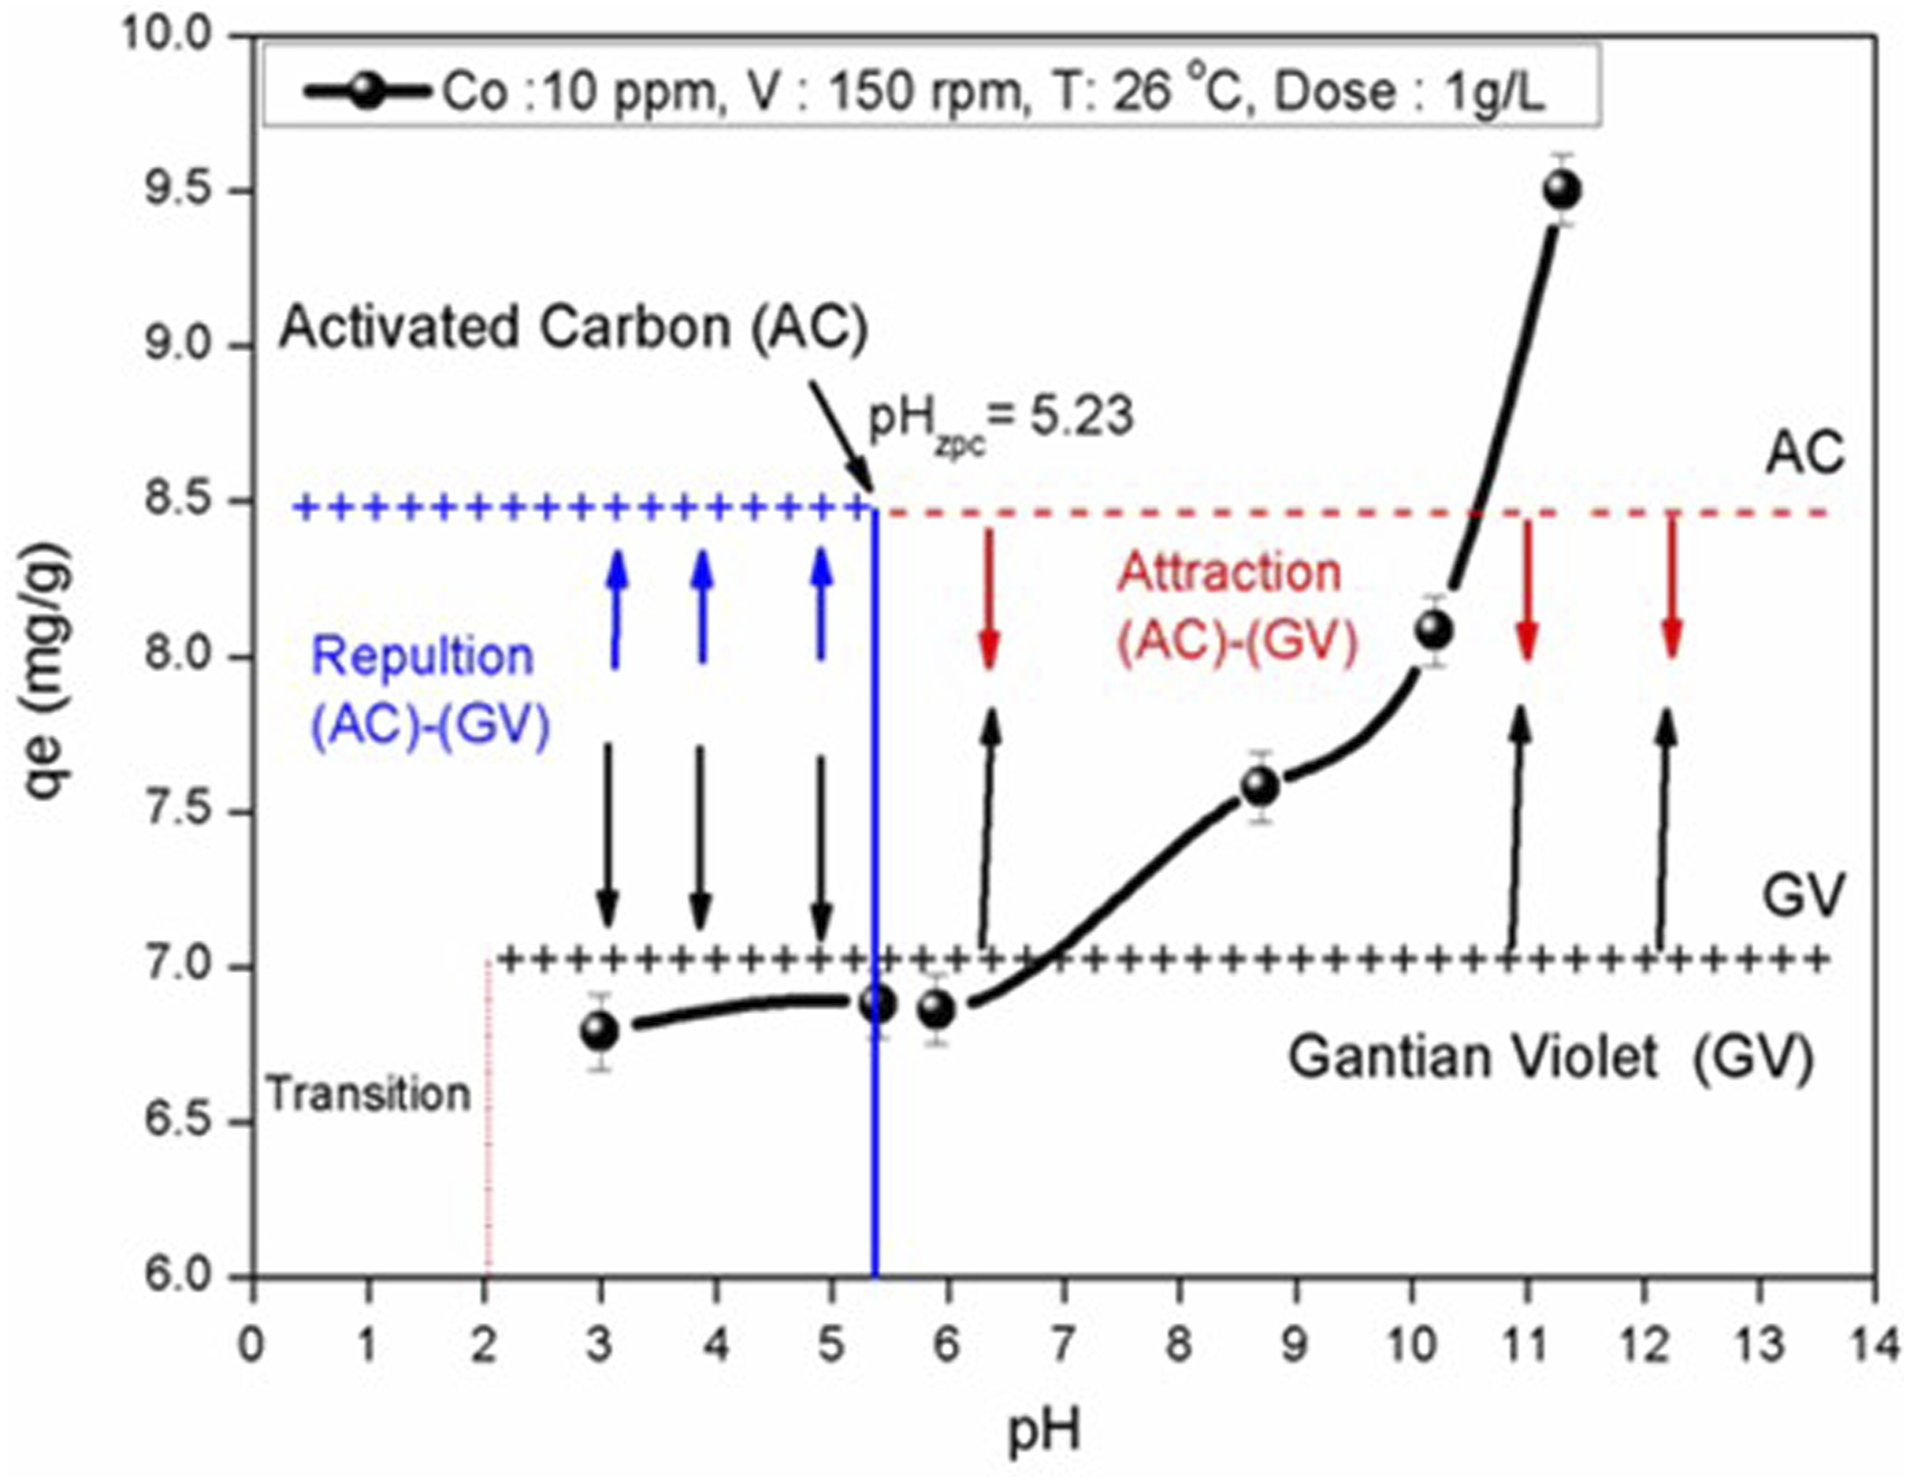
The intraparticle diffusion plots did not show straight lines, indicating that it is not the only rate-limiting step. Fungal strains of T. citrinoviride, T. koningiopsis, and Pestalotiopsis sp have been successfully tested for the adsorption of Remazol Brilliant Blue R, 69 and the fungal strains obey the PSO model. The C-value of intraparticle diffusion model was found in the range (0.063–0.326) for coefficients R2 between 0.80 and 0.94. This points out that the pore diffusion is not RLS and the film diffusion may be concerned in the mass transfer mechanism.
Bacteria
Many authors worked with bacteria biomasses for the removal of dyes; these include Dietzia sp. PD1, 70 Bacillus fusiformis, 71 Paenibacillus macerans, 72 Bacillus amylolique faciens, 73 Bacillus catenulatus, 74 Pseudomonas aeruginosa, 75 Burkholderia vietnamiensis, 76 Bacillus subtilis, 78 and Acetobacter xylinum. 79
Saha et al. 70 used Dietzia sp. PD1 for the removal of CR and Indigo carmine in batch experiments. The coefficients R2 corresponding to the PSO model (0.997 and 0.993) were high compared to the PFO model (0.925 and 0.913) for both dyes, respectively, suggesting that chemisorption is RLS that governs the adsorption. Lin et al. 71 have also found that PSO perfectly described the adsorption kinetic of naphthalene onto immobilized Bacillus fusiformis. Living biomass, namely, P. macerans has been employed to remove Acid Blue 225 (AB225) and Acid Blue 062 (AB062) 72 and the data match well to the PSO model. The intraparticle diffusion model was applied to establish RLS of the adsorption of both dyes. The plots did not pass by the origin and this indicates that the intraparticle diffusion was not the solely rate-limiting step. Both anionic dyes AB225 and AB062 are also adsorbed onto Bacillus amylolique faciens at pH ∼ 1 73 with an equilibrium time of 90 min. PSO provided the best determination coefficients for the adsorption of AB225 and AB062 by Bacillus amylolique faciens for all temperatures; RLS is complex, involving both the boundary layer and intraparticle diffusion.
Bacillus catenulatus strain JB-022 isolated from soil and polluted pond was explored for the Basic Blue 3 (BB3) removal. 74 A batch of experiments were performed. The BB3 adsorption was rapid and more than 80%; BB3 3 adsorption was achieved within 5 min , and the time required for attainment of the equilibrium did not exceed 10 min. The sorption kinetic of Basic Blue 3 follows well the PSO model.
Saravanan et al. 75 examined the potential of bacterium P. aeruginosa for Procion blue 2G removal. Elovich’s model proved to be the best suited and corresponds to a chemisorption process. The low coefficient R 2 (=0.84) of intraparticle diffusion indicates that RLS is controlled by both surface and pore diffusion. The rate constant of intraparticle diffusion and effective diffusion coefficient calculated from the Boyd plot were, respectively, 1.133 mg/gmin0.5 and 4.13 10−14 m2/s for an initial dye concentration Co of 100 mg/L. Zhou et al. 76 used B. vietnamiensis C09 V for the removal of Crystal violet and Cu (II). The Crystal violet removal fitted well to the PFO model, with a physisorption process, involving weak Van der Waals attraction between an adsorbate and adsorbent surface 77 with an enthalpy less than 10 kJ mol−1. Similar findings were published by Binupriya et al. 78 for the biosorption of Reactive Blue 4 by free and immobilized Bacillus subtilis. The kinetics of Direct Blue 15 removal elimination using Acetobacter Xylinum has been investigated in batch configuration. 79 The equilibrium time occurred within 1 h at 45°C and was significantly dependent on the temperature. The PSO model gave a coefficient R2 of 0.999 compared to 0.835 for PFO at 60°C.
Plants
In the open literature, some plants have been used for removal of dyes including Black cumin, 80 Moringa oleifera, 81 Eichhornia crassipes, 82 Cortaderia selloana, 83 Rhizophora mucronata, 84 Azolla pinnata, 85 Soya Bean, 85 Caesalpinia ferrea, 86 Haloxylon recurvum, 87 Cabbage, 88 Prosopis juliflora, 89 Sphagnum peat moss90, Phragmites australis, 91 Ananas comosus, 92 Lawsonia inermis, 93 and Ficus carica. 94
Siddiqui et al. 80 employed black cumin for the MB sorption and the effect of contact time showed a rapid kinetic with a complete saturation within 30 min. The kinetic experiment was described by the PSO model, where the plot qt versus the square root of the contact time (t0.5) does not pass by the origin. Therefore, the intraparticle diffusion is not RLS, and a boundary layer control may be involved in the biosorption. The Boyd equation was employed to prognosticate the slow step involved in the adsorption; the plots are linear but do not pass through the origin, thus confirming that the film diffusion is RLS. The adsorption of Reactive Red 120 on M. oleifera seed follows the Logistic and PSO model. 81 The time to reach equilibrium did not exceed 30 min for an initial dye concentration in the range (10–100 mg/L), adsorbent dose 0.5 g/L, and pH 1. Wanyonyi et al. 82 studied the elimination of CR by biosorption using the roots of E. crassipes. The sorption equilibrium reached 96% removal within 90 min. Kinetic data fit the PSO model well. The potential of C. selloana flower spikes as adsorbent for the MB removal was also reported. 83 The PSO model showed the data analysis (R2 = 0.997), followed by PFO and Elovich equations. The intraparticle diffusion model did not fit suitably the kinetic data (R2 = 0.822), indicating that the diffusion mechanism did not play the predominant role in the command of kinetics. R. mucronata bark was used for the CV elimination 84 and an optimum removal of 99.8% was reached within 60 min. The PSO model exhibited a better analysis for the kinetic data (R2 = 0.9998) compared to 0.9768 for PFO. Therefore, RLS is a chemical reaction between the dye CV and binding sites. In addition, the non-zero intercepts of the intraparticle diffusion plots demonstrate that the intra-particle diffusion in the adsorption is not RLS for the adsorption of CV and BG dyes on fungal biomass.
Kooh et al. 85 tested Azollapinnata and soya bean wastes in the removal of Acid Blue 25 (AB25). The equilibrium was reached within 3 h for both adsorbents, and the data follow the PSO model. Weber and Morris plots do not pass by the origin, suggesting the non-validity of the intraparticle diffusion in the AB 25 adsorption and is not the only RLS. The authors analyzed the kinetic data also by using the Boyd model which displays linear profiles and does not pass by the origin, and this means that the film diffusion is RLS in the process. The MB removal by C. ferrea fruits was also explored, 86 and the kinetic study showed that the PSO model is appropriate with a good coefficient R2 (=0.9828) compared to R2 of 0.9766 and 0.9361 for the Elovich and PFO models, respectively. The intraparticle diffusion plot presents a multi-linearity with three distinct stages, where the adsorption was controlled by the boundary diffusion at the earlier stage followed by the pore diffusion. Hassan et al. 87 used H. recurvum plant for the removal of Acid brown and an optimal contact time for Acid brown of 50 min was determined; the adsorption obeys a PSO model and RLS is controlled by the pore diffusion. Wekoye et al. 88 examined cabbage waste powder for the CR removal in batch mode. The PSO and Elovich models supported the adsorption results while Kumar and Tamilarasan 89 reported the Victoria B uptake on modified P. juliflora in batch experiments with an equilibrium time of 40 min. The PSO model proved to be the most suitable model, and RLS is governed by the boundary layer diffusion and intraparticle diffusion. Hemmati et al. 90 investigated the kinetic of Malachite green (MG) onto Sphagnum peat. The equilibrium time was attained after 90 min with PSO as the best fitting (R2 > 0.9994) compared to R2 (0.9656−0.9711) for the PFO model. The plot qt versus t0.5 presents a multi-linearity with two distinct phases. With the constant kid1 (=7.7901 mg/g min0.5, MG = 20 mg/L) as the diffusion rate constant of the exterior surface of the particle (film diffusion) and kid2 (=0.0393 mg/g min0.5, MG = 20 mg/L) as the diffusion rate constant of the internal surface of the particles (intraparticle diffusion). RLS is controlled by the slowest step (intraparticle diffusion) in this case (kid2 < kid1).
Kankılıçet al. 91 examined raw and modified P. australis as biosorbents for the MB upotake where the equilibrium time is between 90 and 120 min, respectively, and the MB adsorption follows the PSO model. Chan et al. 92 performed a series of batch experiments for the removal BB3 and CR by A. comosus plant stem. Practically 60–70% of the adsorption capacity was reached during the first 15 min of contact for both dyes and adsorption equilibrium was established over a longer period (120 min). The adsorption is best represented by the PSO kinetic model. For the intraparticle diffusion, the equation is not linear and does not by the origin for both dyes (0.77 < R2 < 0.94), indicating that the adsorption of both dyes is rather complex, composed simultaneously of the boundary layer and intraparticle diffusions. The kinetic data fit the external mass transfer model well, and the film diffusion is the true RLS.
Modified Law Sonia inermis was used to eliminate the Brilliant green, a hazardous dye; 93 the uptake equilibrium was achieved within 3 h and the PSO model showed a better modeling of the adsorption kinetic. The intraparticle diffusion plots disclosed that the C-values increase from 2.4 to 6 mg/g with increasing the concentrations Co from 25 to 100 mg/L. Raising the dye concentration C o favors the boundary layer diffusion, thus implying that the film diffusion is the rate-controlling step.
Gupta et al. 94 endeavored to understand the mechanism of MB uptake by the modified Ficuscarica. Batch experiments were carried out, and the equilibrium time for the MB elimination was 210 min. The comparison of correlation coefficients of PFO (R2 = 0.953), PSO (R2 = 0.998), and intraparticle diffusion (R2 = 0.956) kinetic models indicate that PSO best represents the mechanism and rate of the MB uptake. On the other hand, the film diffusion and pore diffusion are involved in the mass transfer controlling of MB molecules onto Ficuscarica plant.
Agricultural and industrial wastes
Agricultural and industrial wastes have been practiced as adsorbents for the dyes adsorption from water. The most commonly used adsorbents include coffee husk waste, 95 sago waste, 96 corn silk, 97 peanut husk, 98 breadnut peel, 99 Moringa seeds waste, 100 banana peels, 101 cucumber peels, 101 potato peels, 101 rice husk, 102 sugar beet pulp, 103 Abelmoschus esculentus, 104 palm-date stones, 105 Aleppo pine-tree sawdust,106,108 Raphia hookerie, 109 pine cone powder, 110 Enterolobium contortisiliquum, 111 areca nut husk, 112 and almond shell. 113
Tran et al. 95 investigated the batch experiment of the MB sorption onto the coffee husk waste and found that the equilibrium time increases with augmenting the MB concentration C o . Optimal times were found to be 30, 120, 300, and 420 min for C o -concentrations of 200, 300, 400, and 500 mg/L, respectively. PSO describes better the kinetic data based on the coefficient R2 (=0.999) against the PFO model (0.911−0.985). The authors also found that the adsorption rate decreases with increasing C o . Sago waste, a by-product obtained during the production of starch from tapioca was successfully tested to adsorb Alizarine Red-S; 96 the percentage removal increases with increasing the contact time and the best performance was observed within 100 min. The PSO model presents a high coefficient R2 (=0.9983) compared to 0.9509 and 0.9558 for the PFO and intraparticle diffusion model, respectively. The coefficient R2 (<1) means that intraparticle diffusion is not the only rate-limiting step, but consisting simultaneously of the boundary layer and intraparticle diffusions.
The adsorption potential of corn silk was explored for the removal of RB19 and RR218. 97 The kinetic data were well fitted by the PSO model; the greater R 2 values (∼1) confirm that the Bangham model is compatible with the kinetic data, suggesting that RLS is the pore diffusion. The potential of the adsorbent peanut husk to adsorb Indosol Yellow BG from water was described elsewhere. 98 The elimination is rapid (∼30 min) for a concentration C o in the range (10–200 mg/L) with an adsorbent dose of 2 g/L. The PSO kinetic model assumed the best fit for the kinetic experiments, while the intraparticle diffusion model provided a poor fit (R 2 = 0.413). This means that RLS is distributed between the film diffusion and intraparticle diffusion. The MB removal by breadnut peel was examined, 99 and the equilibrium was reached within 60 min; RLS is affected by both the boundary layer diffusion and intraparticle diffusion, and the adsorption kinetic followed the PSO model.
The adsorption capacity of Moringa seeds waste was used for the adsorption of Dispersed Red 60 (DR60) and CR from waters. 100 As expected, the percentage removal increases with increasing the contact time; the equilibrium was established within 45 min for both dyes, and the PSO model provided the best correspondence for their adsorption. The smaller R 2 values (0.5084–0.6843) confirm that the intraparticle diffusion model is inadequate to fit the kinetic data, and RLS is dispersed between the film diffusion and intraparticle diffusion.
Banana, cucumber, and potato peels were assessed as adsorbents to extract MB and Orange G from water. 101 The PSO model revealed a better agreement for both dyes, evidenced by the kinetic study. The high C values of the intra-particle diffusion model (7.09–78.65) prove the contributions of the film and intraparticle diffusion steps in the biosorption. The ability of rice husk to eliminate the anionic dyes, namely, Diamine Green B, Acid Black 24, and CR by adsorption was also studied, 102 and the kinetic data of the three dyes were modeled by the PSO model. The intra-particle diffusion linear plots showed three slopes which means that the intraparticle diffusion is not the only RLS.
Sugar beet pulp was modified by NH4Br to prepare a novel sugar beet pulp adsorbent named SMSBP 103 and its adsorption capability for Reactive Red 2 was investigated; it exhibits a rapid kinetic with saturation reached beyond 20 min. The high R2 values (0.996−0.999) appeared that the fixation of Reactive red 2 on the SMSBP follows rather the PSO equation, compared to PFO (R2:0.892−0.924) with a limiting step dominated by the intraparticle diffusion.
Biosorption of Acridine orange by Abelmoschuses culentus was also studied, 104 and the analysis of kinetic data gave the values of R2, HYBRD, RMSE, MPSD, ARE, APE, and chi-square χ2. They are equal to (PFO: 0.8847, 265.4035, 22.6253, 8.8192, 12.5824, and 69.9021, 890.0836), (Elovich: 0.8387, 2.0464, 1.8620, 0.0825, 0.9543, 5.3017, and 1.9992), (Bangham: 0.9031, 0.6609 0.9981 0.0293, 0.4647, 2.5815, and 0.6289), (Modified-Freundlich: 0.8096,2.8477, 2.2643, 0.1062, 1.1056, 6.1420, and 2.8434), and (PSO: 0.9983, 1.2144 1.3206, 0.0561, 0.6234, 3.4635, and 1.1121). The greater R2 (0.9983), smaller values of HYBRD (1.2144), smaller RMSE (1.3206), smaller MPSD (0.0561), smaller ARE (0.6234), smaller APE (3.4635), and smaller chi-square χ2 (1.1121) indicated more suitability of PSO than the PFO, Elovich, Bangham, and modified-Freundlich models. The linear plot of intra-particle diffusion revealed two slopes, indicating that RLS is mainly controlled by external and internal mass transfer.
The biosorption of Basic Violet 3 and Basic Red 2 onto palm-date stones has been examined using the batch mode process. 105 The PSO equation presents a well kinetic analysis for both dyes with a high coefficient R2 (>0.968). Regarding the high C values of the intra-particle diffusion model (35.68-51.00, > 0), this reveals that diffusion in the film and intraparticle diffusion contribute to the rate-limiting stage.. The pore diffusion is not the unique RLS, and the external mass transfer also controls the adsorption process in the first period.
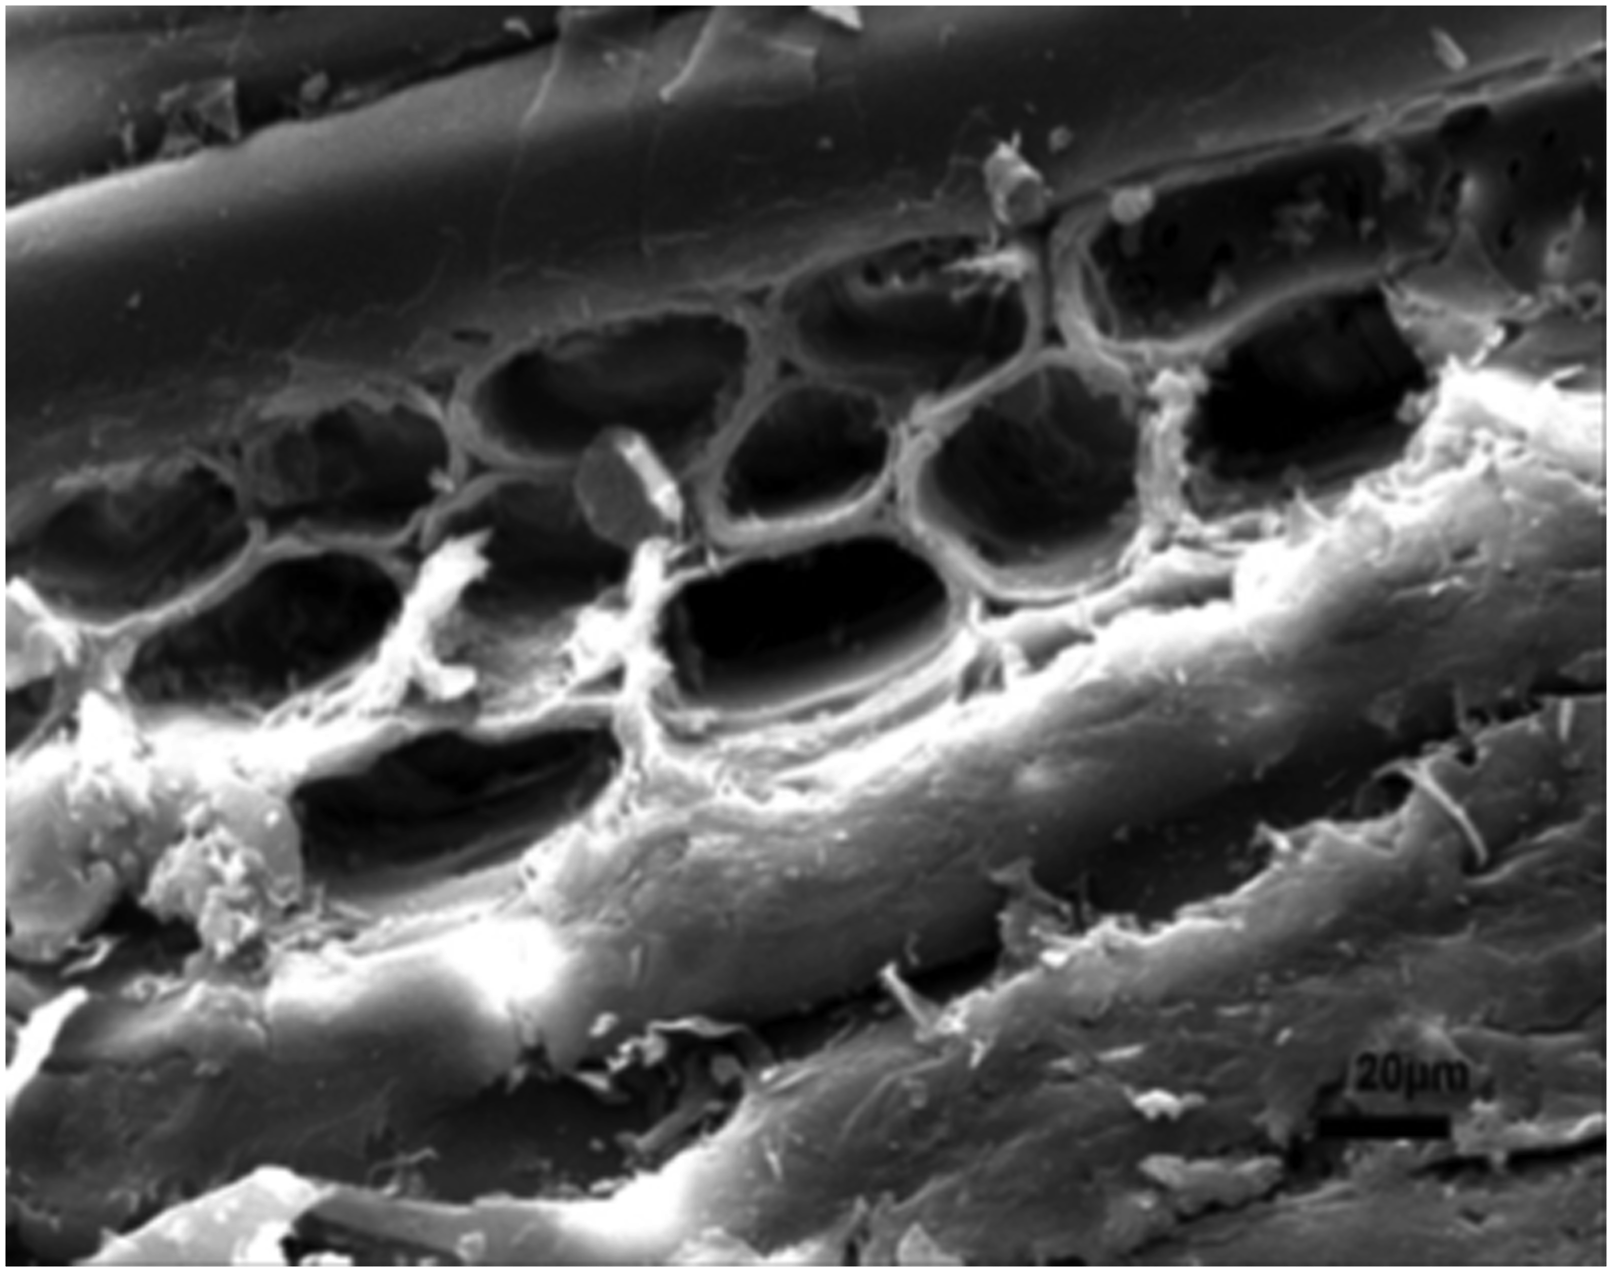
Sahmoune and Ouazene
106
used the Aleppo pine-tree sawdust (APTS) for the Astrazon yellow uptake; APTS has been exploited to adsorb hazardous dyes due to its porous structure (Figure 4 Scanning electron microscope image of Aleppo pine tree sawdust.
106
Inyinbor et al. 109 obtained similar results in the adsorption of Rhodamine B (Rh B), which is a calcitrant and stable dye, onto Raphiahookeriefruit epicarp. The PSO model better fits the adsorption kinetics. Rh B is a cationic dye soluble in water and belongs to the anthraquinone family; its mesomeric effect makes it difficult to eliminate by chemical and/or biological methods. The authors used the Bangham model, and the intraparticle diffusion model allows interpreting the slow step that could occur in the current adsorption system; however, the results revealed that the kinetic data do not fit well with the Bangham model. Therefore, the diffusion of Rh B molecules into pores of R. hookerie was not the only RLS; it also depends on the boundary layer diffusion and intraparticle diffusion plot is composed by two linear portions with the constants kid1 (=10.28) and kid2 (=3.73 mg/g min0.5)for Rh B concentration of 100 mg/L. The constant kid1 is higher than kid2, and this signifies that the uptake of Rhodamine B onto R. hookerie is mainly controlled by the pore diffusion
Dawood and Sen 110 examined the adsorption of CR by pine cone powder and the equilibrium time is 100 min and the kinetic data follows a PSO model. The intraparticle diffusion plot exhibits two distinct stages viz. film diffusion followed by a pore diffusion meaning that the CR molecules are transported to the external surface of the pine cone particles through the film diffusion; after wards the molecules are moved in pine cone particles by the intra-particle diffusion through the pores with a diffusion coefficient of 3.63 × 10⁻⁹ cm2/s for an initial CR concentration of 50 mg/L.
Lima et al. 111 reported the kinetic of the MB biosorption onto E. contortisiliquum. Equilibrium time of 180 min was reached for a MB concentration in the range (10–40 mg/L), and the limiting step is governed by both the film diffusion and intraparticle diffusion. The Biot number (Bi) was used to investigate the real rate-controlling step involved in the overall adsorption system, that is, the film diffusion or intraparticle diffusion. The Bi values are in the range (0.04–0.1) for an initial MB concentration (10–50 mg/L; a low Bi value (<1) which indicates that RLS is controlled by the film diffusion. Baidya and Kumar reported the application of areca nut husk for the elimination of Brilliant green, a hazardous dye from water; 112 an equilibrium time of 120 min was determined. Their kinetic data were fitted by the PSO model with a high coefficient R2 of 0.999; these authors used the intraparticle model and Boyd plot to verify the RLS, and a nonlinearity is observed in the intraparticle diffusion plot. This implies that two processes (film and pore diffusion) limit the global adsorption rate, and the real RLS was analyzed by the Boyd plot which showed a linear behavior but does not pass by the origin, confirming that the external mass transfer is the slowest step. Arfi et al. 113 employed almond shell to eliminate Eriochrome Black T (EBT) and Malachite green (MG) from aqueous solutions. Contact time to reach equilibrium was reached after 300 min for both dyes and the PSO model predicted the best correspondence for the adsorption by almond shell. The authors further found that the film and pore diffusions are the rate-limiting steps in the adsorption onto this bio adsorbent.
Conclusions and future directions
The rate-limiting step (RLS) can play an important role in the uptake kinetic of dyes and is important for designing the adsorption system. Indeed, it is difficult to discuss the adsorption mechanism without the knowledge of RLS and where almost all kinetic studies have been directed towards the question of the rate-limiting step. The present work focused on the study of the limiting step which controls the sorption of organic matter in general and dyes in particular by different biomaterials such as algae, fungi, bacteria, agricultural, and industrial waste and plants.
Many kinetic models have been reported to study RLS in biosorption, such as pseudo first order, pseudo second order, Elovich, intraparticle diffusion, Bangham, external mass transfer, and Boyd. Generally, the pseudo second order (PSO) is capable of describing almost all kinetic data arising from the interactions of dyes with biomaterials. Thus, the dye adheres to the functional groups present on the surface of the biomaterial by chemical bonding where the adsorption rate depends on the absorption capacity and not on the initial concentration of the dye. The advantage of this model is that it allows the equilibrium adsorption capacity to be calculated. It is easy to understand that the adsorption of dyes onto biomaterials is complex and involves diffusions into both pores and films in the rate-limiting step.
Film diffusion takes place when external transfer is greater than internal transfer, while the opposite effect occurs in the case of porous diffusion which did not investigate the real rate-controlling step involved in the global adsorption, that is, the film or intraparticle diffusions. Until now, no kinetic model has proven generally suitable for determining the true flow limit step. However, the Boyd and intraparticle diffusion models are sufficient to analyze which is the true limiting step, filmic or intraparticle diffusion. Although RLS involved in dye adsorption has been studied for many years, the mechanism is not fully understood. So, our future direction to understand the adsorption mechanism is to discuss the rate-limiting stage where we will try to find a relationship between the thermodynamic parameters and the rate-limiting stage. Our perspective is to discuss the rate-limiting stage where we will try to find a relationship between the thermodynamic parameters and the rate-limiting stage.
Footnotes
Acknowledgements
The authors gratefully acknowledge support from the Laboratory of Applied Chemistry and Materials (LabCAM), University of M’hamed Bougara of Boumerdes, Avenue de l'Indépendance Boumerdes, 35000. Algeria. Laboratory of Coatings, Materials and Environment, University M’hamed Bougara (UMBB), Algeria. Laboratory of Storage and Valorization of Renewable Energies, Faculty of Chemistry (USTHB) Algeria. This research did not receive any specific grant from funding agencies in the public, commercial, or not-for-profit sectors.
Declaration of conflicting interests
The authors declared no potential conflicts of interest with respect to the research, authorship, and/or publication of this article.
Funding
The author(s) received no financial support for the research, authorship, and/or publication of this article.