
Abstract
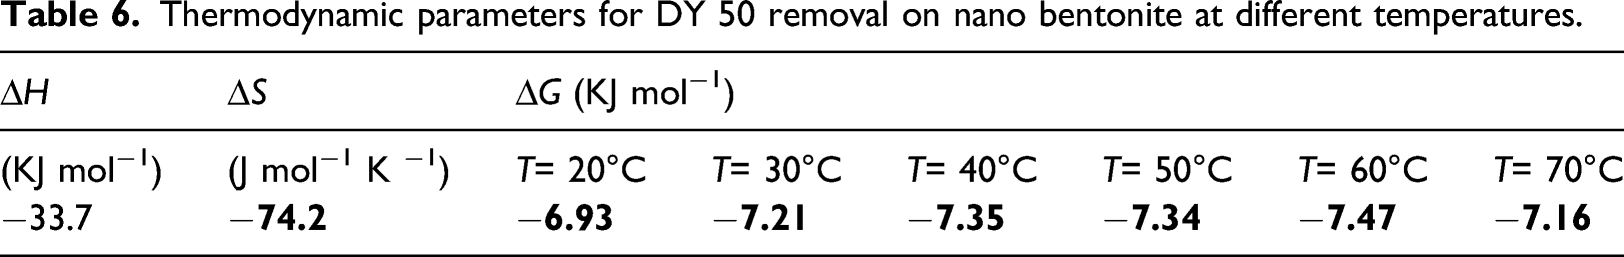
Developing countries suffering from the toxicity of different industrial effluents especially dyes. This study successfully prepared and characterized nano-bentonite for anionic dye removal (DY 50). The prepared nanoparticles were characterized by X-Ray Diffraction (XRD), X-ray Fluorescence (XRF), Scanning Electron Microscope (SEM), EDAX analysis, FT-IR, and TGA and the obtained results indicated the formation of nanoparticles with an average size of 15 nm. The effect of different operating conditions was studied using different pH, dose, contact time, temperature, and initial DY 50 concentrations. The obtained results indicated that nano bentonite was able to adsorb about 78.3 and 100% for initial concentrations of 100±8.1 and 20 ±1.62 mg/L, respectively. The optimum removal conditions were observed at acidic media (pH 3) using sorbent material dosage 1 g/L for 45 min and 30°C. The adsorption isotherm, kinetic analysis, and thermodynamic behavior were studied by using linear equation form, and the adjusted R2 was compared to detect the preferred models. The adsorption isotherm indicated that heterogeneous, as well as multilayer adsorption, plays an important role in the removal of dye. Kinetic studies indicated the chemisorption interaction between sorbed and adsorbed molecules. Thermodynamic behavior indicated the reaction is exothermic with ∆H equal to −5.24 KJ/mol and ∆S equal −74.2 J/K.mol. Finally, this study strongly recommended using nano bentonite for DY 50 removal from an aqueous solution. The RSM relations show significant relations in all removal models with p-value <0.001. The ANN results indicated that the most effective operating conditions are the effect of nano bentonite dose followed by the pH effect.
Introduction
Water is the most important polar solvent all over the world. 1 So, it can carry out a wide range of inorganic and organic pollutants. The reuse of wastewater is the most important solution to overcome water scarcity problems. 2 Soluble organic contaminants are the most hazardous pollutants that all countries faced and have difficulties getting red from these contaminants in economic and fast ways.3,4 Different types of organic contaminants may affect water quality such as color, pesticides, carbon, nitrogen, and sulfur pollutants.5–8 Color contaminants are one of the most common water and wastewater contaminants. The presence of color in water and wastewater indicated the presence of a high number of organic carbons in water or wastewater. 5
Colors may be present in row water as the colloidal form produced from the presence of some particles such as lignins, humic acids, tannins, textiles, acids such as fulvic acids, and other similar compounds.9,10 Industrial projects affect watercolor and cause color pollution such as the yellow color of fermented washing, dark color of bottling plant, and brown color of spent wash. 11 The presence of harmful strains of cyanobacterial algal that formed cyanotoxins also affects water quality by creating unwanted colors. 12 There are different contaminated sites by color all over the world and the most popular contaminated site in China is the yellow color which comes from chromium slag produced by Lvliang Chemical Industry. 13 Also, Egypt has different color polluted areas such as red color in temporary Borg El-Arab industrial drain area, Alexandria and green color in the industrial Badr city, Egypt. The color of industrial wastewater is often a significant characteristic, especially in the textile, paper, food, and clothing industries. 14 The coloring of industrial wastewater is produced by ions of chrome, copper, nickel, and iron salts. Metal ions can release green and yellow colors in case of the oxidation state of chrome, blue and green in case of copper and nickel, and yellow and brown in different oxidation states of iron. Also, the soluble anionic or/and cationic dyes and insoluble dyes used in the textile, paper, and leather industries produce very intense colors that linger even after repeated dilution.15–17 The coloring of wastewater can also be caused by suspensions of colloidal and non-soluble substances and lubricants.18,19 In other cases, the color may develop in the water because of the effect of mixing different types of wastes.20–22 The release of these pollutants without proper treatment poses a significant threat to both the environment and public health. Thus, their treatment becomes inevitable.23,24 Direct yellow 50 is one of these contaminants that may affect the quality of water. 25
Different technologies were used to remove organic contaminants. 8 The coagulation, degradation, and adsorption techniques are the most common treatment processes used for organic contaminants removal.26–29 Chemical coagulation, electrocoagulation, biodegradation, and filtration are also used for moderate organic and color removal.28,30–32 Wastewater physicochemical treatment processes are the most visible in the primary treatment process in a wastewater treatment plant.33,34 Although the primary treatment processes in different wastewater treatment plants are the commonest, they include several types of other physicochemical processing that may be classified into a small number of units during the operating process.35,36 Physicochemical processes in the primary treatment of industrial wastewater are designed to remove particulates and other common materials from the effluent before the secondary treatment processes.37,38 The separated solids are used in both aerobic and anaerobic digesters.39,40 In the primary treatment, exclusive physicochemical processes are employed to isolate suspended solids, oil, and greases from wastewater.41,42 The primary treatment of wastewater usually includes screening, flocculation, flotation, sedimentation, and granular sand filtration.43,44 In a conventional wastewater treatment plant, wastewater is regularly taken in a tank for some hours to allow settling to the bottom and the greases to float to the top.45–47 The solids picked from the bottom and floated oil in the top were received, and the purified raw wastewater continues to the next step of the treatment.48,49 The exact progression of unit operations is mainly dependent on the wastewater characteristics, objectives of treatment, and local environmental laws and regulations.50–52 Recently, nanotechnologies are commonly been used for organic removal from wastewater.1,53,54
Nano bentonite has a strong ability to adsorb a wide range of water and wastewater contaminants due to high surface and reactivity. 55 Joshi et al. (2004) studied color removal from textile effluent using different techniques and indicated the ability of bentonite to adsorb basic dyes. 56 Mukhopadhyay et al. (2019) studied bicarbonate and nitrite removal from wastewater using nanoparticles (Iron Oxide and bentonite) and the obtained results indicated that Fe-exchanged nano-bentonite can adsorb 29.33 mg/g after 120 min with significantly less than 0.05. 57 Jana et al. (2019) studied the efficient removal of cationic organic dye using nanocomposite incorporated bentonite. 58 Chinoune et al. (2016) studied reactive dyes removal from aqueous solution using dirty bentonite and the obtained results indicated that the B–Mg(OH)2 has strong ability to adsorb a wide range of dye concentration reached ∼50 mg/g at acidic media after 3h from contact time. 59
This study attempts to examine the removal of DY 50 from aqueous solutions using nano bentonite. The prepared nano bentonite was well characteristic for DY 50 removal. The effect of different operating conditions was conducted to optimize the effective conditions. Finally, the adsorption isotherms, kinetic studies, and thermodynamic behavior were designed to describe the reaction mechanism, equilibrium state, and spontaneity of the reaction. Also, the RSM relation was obtained using linear regression analysis to detect the significance of the adsorption process and produce the general DY 50 removal % equation not only for optimum conditions but also for all experimental results. Finally, the artificial intelligence neural network was conducted to predict the importance of each operating parameter and to predict the relations between calculated and experimental removal efficiency.
Materials and methods
Chemical and reagents
The following chemicals were used in the current study: Pure Egyptian Bentonite powder, DY 50 powder (C35H24N6Na4O13S4, 98.5%, Pub-chem), Sodium hydroxide (NaOH, 99% pure, Oxford Co.), and Sulfuric Acid (H2SO4, 98%, Honeywell - Fisher Co.).
Preparations
Preparation of nano bentonite
Nano bentonite was prepared by using flotation and sedimentation techniques. The Pure Egyptian Bentonite Raw was softened and dried at 105°C for 2 hours, cooling the bentonite powder was well mixed with deionized water by a ratio of 1:1, shaking at 300 rpm for 3 min, soaked for 24 h, shaking again at 100 rpm for 30 min, and settling for 2h. The floated nanoparticles were filtrated by using Whatman filter paper No. 1 (150 mm), dried at 105°C, and stored in a glass bottle. The structure of the DY 50 powder sample is presented in Supplementary Fig. 1.
Preparation of standard DY 50 dye aqueous solution
About 1.02 g of pure DY 50 powder was dissolved in 1L of deionized water to prepare 1000 ppm from standard DY 50 solution. The prepared standard solution was scanned by a Uv-Vis scanning spectrum with a range between 190 and 1000 nm for 20 min to optimize the suitable wavelength of the experiment to build the calibration curve. Three identified peaks were observed and the maximum peak was observed at λ = 412 nm after scanning was completed. Different dye concentrations were prepared to build the calibration curve, quality control, and uncertainty measurements. The selected concentrations for the calibration curve were 1±08, 3±0.24, 5±0.41, 7±0.81, 10±0.81, 15±1.21, 20±1.62, and 30±2.43 mg/L. 60
Point of zero charge of nano-bentonite
About 7.455 g of KCL was dissolved in 1 L of deionized water to prepare 0.1 m from KCl solution. Exactly 200 mL from the prepared DY 50 solution was added directly into a 1L Erlenmeyer flask and the pH values were adjusted to 2, 3, 4, 5, 6, 7, 8, 9, 10, 11, and 12 by using 1 N H2SO4 and 1 N NaOH (pHi). About 0.1 g of dried nano bentonite was added separately into the adjusted flasks and left 24 h at room temperature. The final pH was measured by using AD 8000-Adwa pH meter (pHf). Averaged values of pH changes after nano bentonite modifications were obtained from 3 measurements and all standard deviation values were within ±0.05. The point of zero charges of nano bentonite was calculated by plotting the relation between ΔpH values (final pH − initial pHi) and initial pH values (pHi). 61
Uncertainty measurements
Two main steps were optimized for uncertainty calculations. First, the uncertainty of standard DY 50 was calculated by calculating the relative uncertainty of all expected errors. The square root of relative uncertainty of salt purity, balance, pipte, and the volumetric flask was calculated to estimate the combined uncertainty. The expanded uncertainty was calculated to cover 95% of the results. The final uncertainty of 1000 mg/L of DY 50 was ±17.809 mg/L. Second, the uncertainty calculations of calibration curve combined with standard DY 50 uncertainty, Uv-Vis spectrophotometer uncertainty below and above abs. 1.000. The final relative uncertainty was 8.104%.
Characterization
The prepared nano bentonite powder sample was investigated using x-ray diffraction patterns (XRD), XRF, SEM, EDAX analysis, and particle size distribution. A Philips XRG 3100 diffractometer manufactured by Philips Electronics Company, the Netherlands, was utilized for performing XRD analysis. It uses copper K-alpha radiation and a graphite monochromator to generate x-rays with a wavelength of 1.5418 A⁰. The X-Ray current and voltage are 40 kV and 40 mA, respectively. XRF analysis was conducted by using Axios Max DY 2063, PANalytical. The XRD and XRF analyses were conducted at certified iso 17025 material institute, Housing and Building National Research Center, Egypt. The prepared nano bentonite powder sample was placed in a stainless steel holder and scanned for a range from 5⁰ to 80⁰ with a rate of 0.0167⁰/sec due to the absence of any peak before 35⁰.2,4 A Philips Quanta 250 FEG manufactured by Philips Electronics Company, USA, was utilized for performing the SEM analysis. The SEM instrument operates at a magnification of 120,000x and a voltage of 20 KV. FTIR was analyzed before DY 50 treatments by nano bentonite using FT/IR-6100typeA, S/N A009061020 with a standard light source and TGS detector. The FTIR resolution was 8 cm−1 and the 10000 Hz filter. The SEM and FTIR instruments were placed at the National Research Center (NRC). Particle size distribution analysis was conducted for dried samples by using Microvision (particle size measurement) located at CID Company for pharmaceutical industries, Egypt, using µ u-tech production, and model VGA-410 France.
Experimental setup


Batch experiments at different operating parameters.
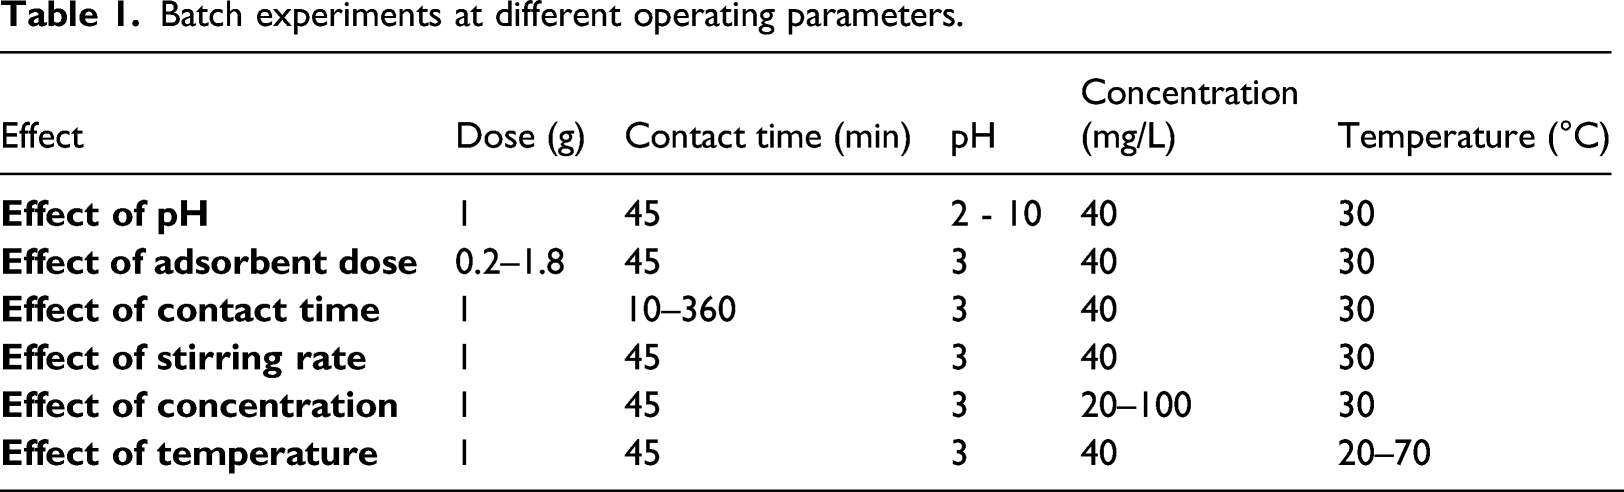
Through the adsorption experimentations, the amount of the DY 50 filtered and removed at multiple interludes was evaluated using equation (2)
Isotherm studies
Nonlinear two and three isotherm models were utilized to explain the adsorption behavior of anionic dyes represented in DY 50 dye from an aqueous solution onto the solid phase of nano bentonite at equilibrium environments at a constant temperature. These models include two-parameter isotherm models as Freundlich, Langmuir, and Jovanovich, and three-parameter isotherm models as Redlich–Peterson, Hill, Sips, Khan, Toth, and Koble–Corrigan. The nonlinear equation for both two parameters and three parameters isotherm model and its description are presented in Supplementary Table S1.27,65,66
Kinetic studies
The kinetics adsorption of anionic dyes represented in DY 50 onto nano bentonite was calculated using nonlinear kinetic models. These models include pseudo-first-order (PFO), pseudo-second-order (PSO), Avrami, Elovich, and Intraparticle models. The nonlinear equations for all kinetic models are presented in Supplementary Table S2.
Validation of adsorption isotherms and kinetics
Five design error functions were calculated to explain the better fit of kinetic and isotherm nonlinear equations to evaluate the model results. These error equations include Chi errors, Marquardt’s percent standard deviation (MPSD), a Composite Fractional Error Function (HYBRD), the Sum of the Squares of the Errors (ERRSQ), the Sum of the Absolute Errors (EABS), and Average Relative Error (ARE). 51 The error functions are presented in Supplementary Table S3, and the lowest error type was used for preferred model estimation.
Thermodynamic behavior
Different thermodynamic parameters were calculated to describe thermodynamic behaviors after interaction between sorbed and adsorbed molecules as Gibbs free energy (∆G), enthalpy (∆H), and standard entropy (∆S). The thermodynamic results can be calculated by using equations (4–6)


Neural network structure
An artificial intelligence networks technique was a familiar technique to estimate the removal efficiency, the importance of each operating parameter, and predict the relations between predicted and measured values. The ANN model combined the input covariable (pH, dose, contact time, temperature, and DY 50 concentrations) with hidden layers (weight and bias) and the final output removal layer. The estimated ANN structure for DY 50 removal using nano bentonite was expressed as 5 – 3 – 1 as shown in Figure 1. The network name is “Multilayer perceptron (MLP),” this function used a feedforward backpropagation style and can have multiple hidden layers. It is one of the most regularly used ANN techniques before designing a full-scale model.1,66 ANN of 5 – 3 – 1 structure used for the prediction of Cr removal efficiency.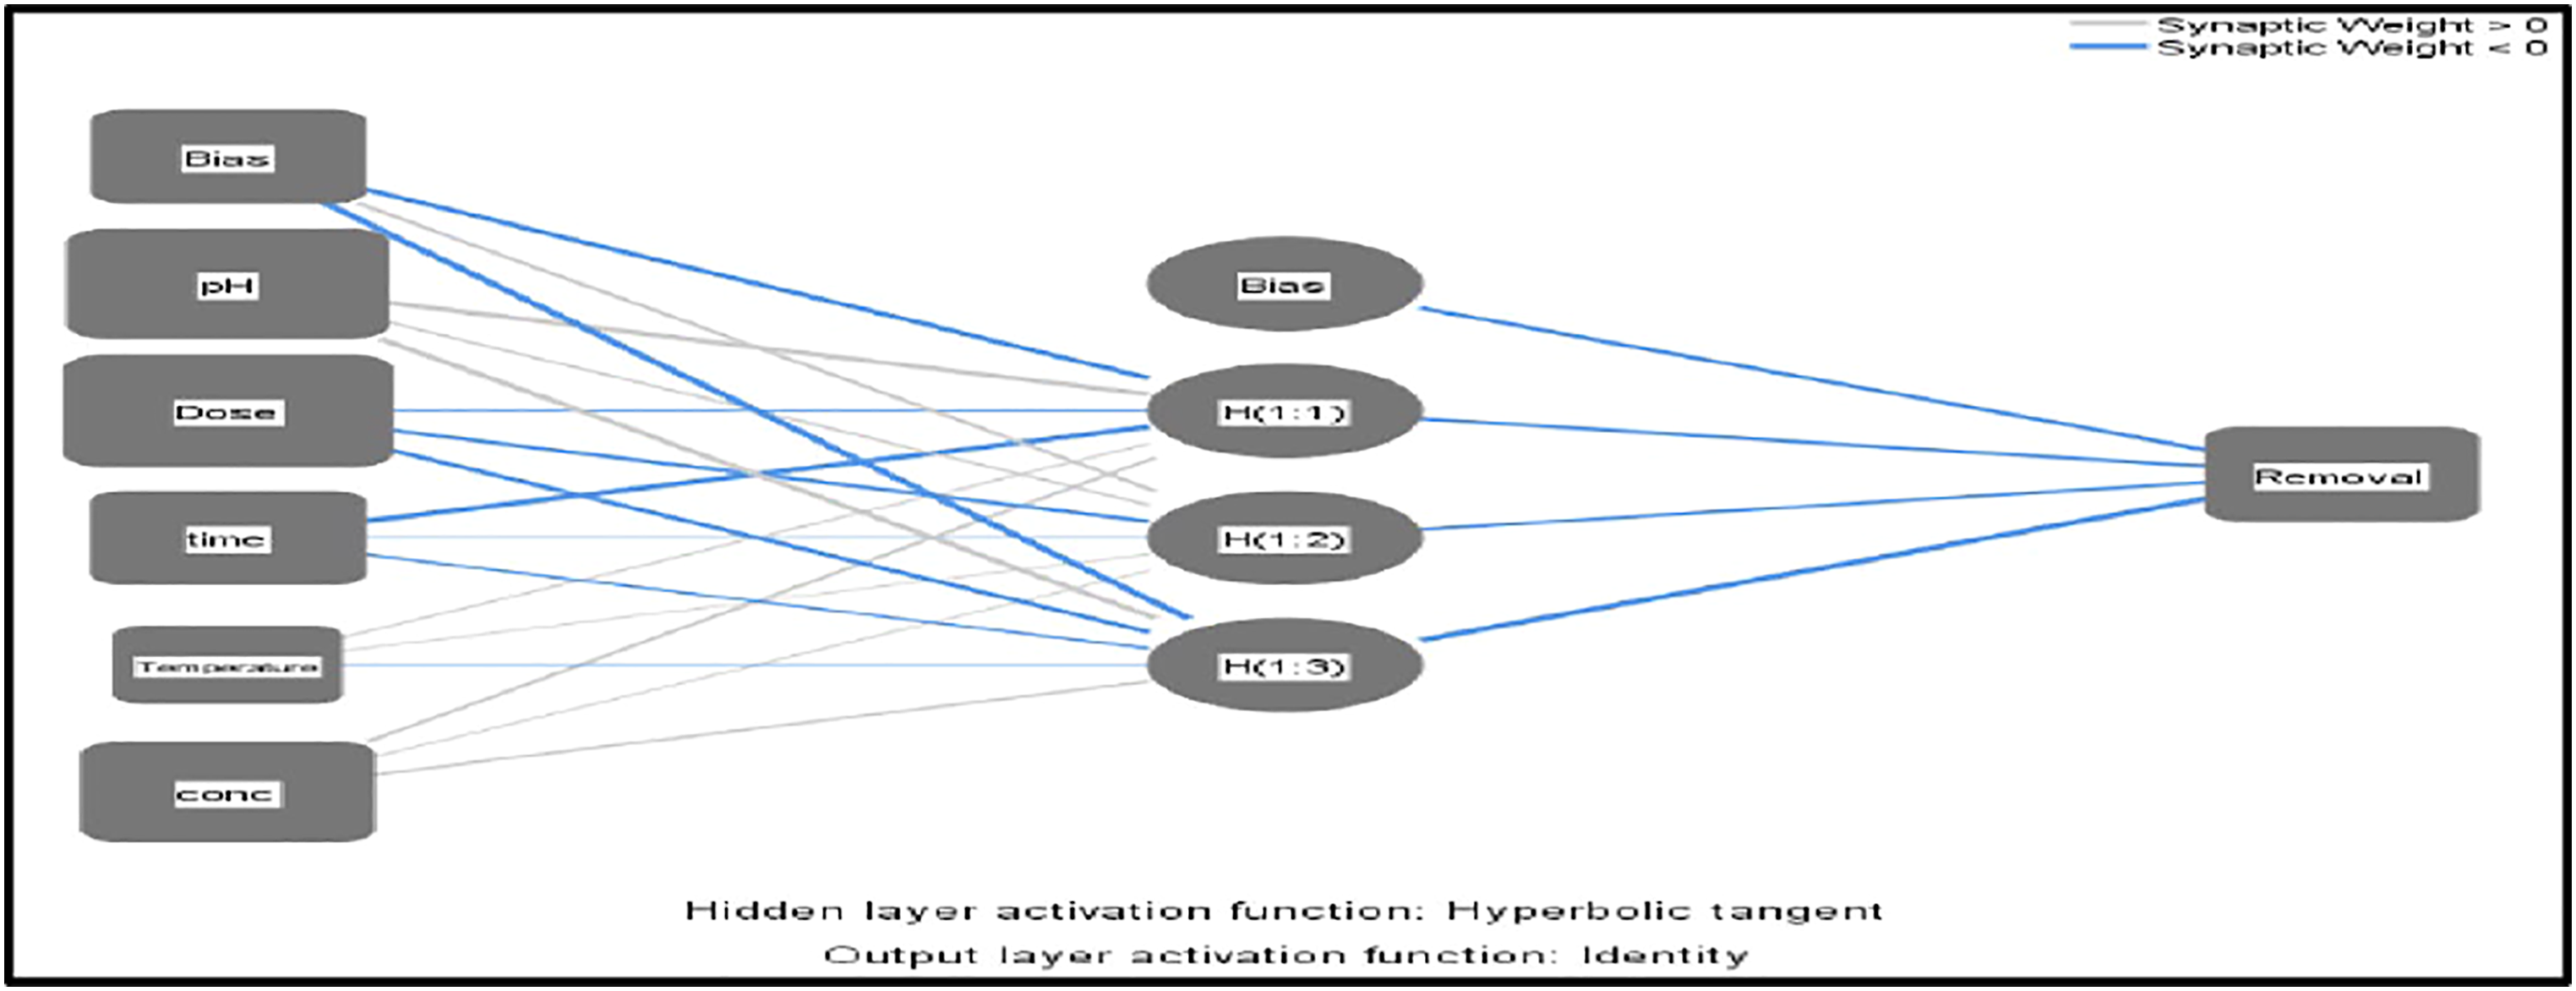
Response surface methodology
A pure linear regression equation was employed to determine the relationship between operating conditions (pH, contact time, adsorbent dose, temperature, and concentration) on anionic DY 50 removal efficiency (Equation (7)). All significant values were used to predict the parameters of the model.
57
The coefficient of determination statistical measure (r2 value) and the p-value of the predicted model were used to evaluate the accuracy of the model. Finally, the t-test results were used to assess the final statistical significance
Results and discussion
Characterization
Nano bentonite was characterized by using X-Ray diffraction (XRD), Scanning Electron Microscope (SEM), EDAX analysis, and FT-IR. The obtained results indicated the formation of nano bentonite and showing agreement with the previous studies.69–71
XRD and XRF characterization
Figure 2 shows XRD analysis of nano bentonite indicated that about 87% of the nano-bentonite structure contains Si, Al, and Fe. The presence of alfa iron (Fe) was identified by two identified peaks at 2θ equal 44.65°, 64.98°, and 82.53° that fit well with the body-centered structure of iron, presence of aluminum (Al) was identified by three identified peaks at 2θ equals 38.57°, 65.27°, and 78.68°, and presence of silicon (Si) was identified by one main peak at 2θ 28.441° with (111) coordination. Also, the XRD pattern indicated the formation of small quantities of calcium (Ca), chloride (Cl), titanium (Ti), potassium (K), and manganese (Mn). X-Ray diffraction of dried nano-bentonite sample.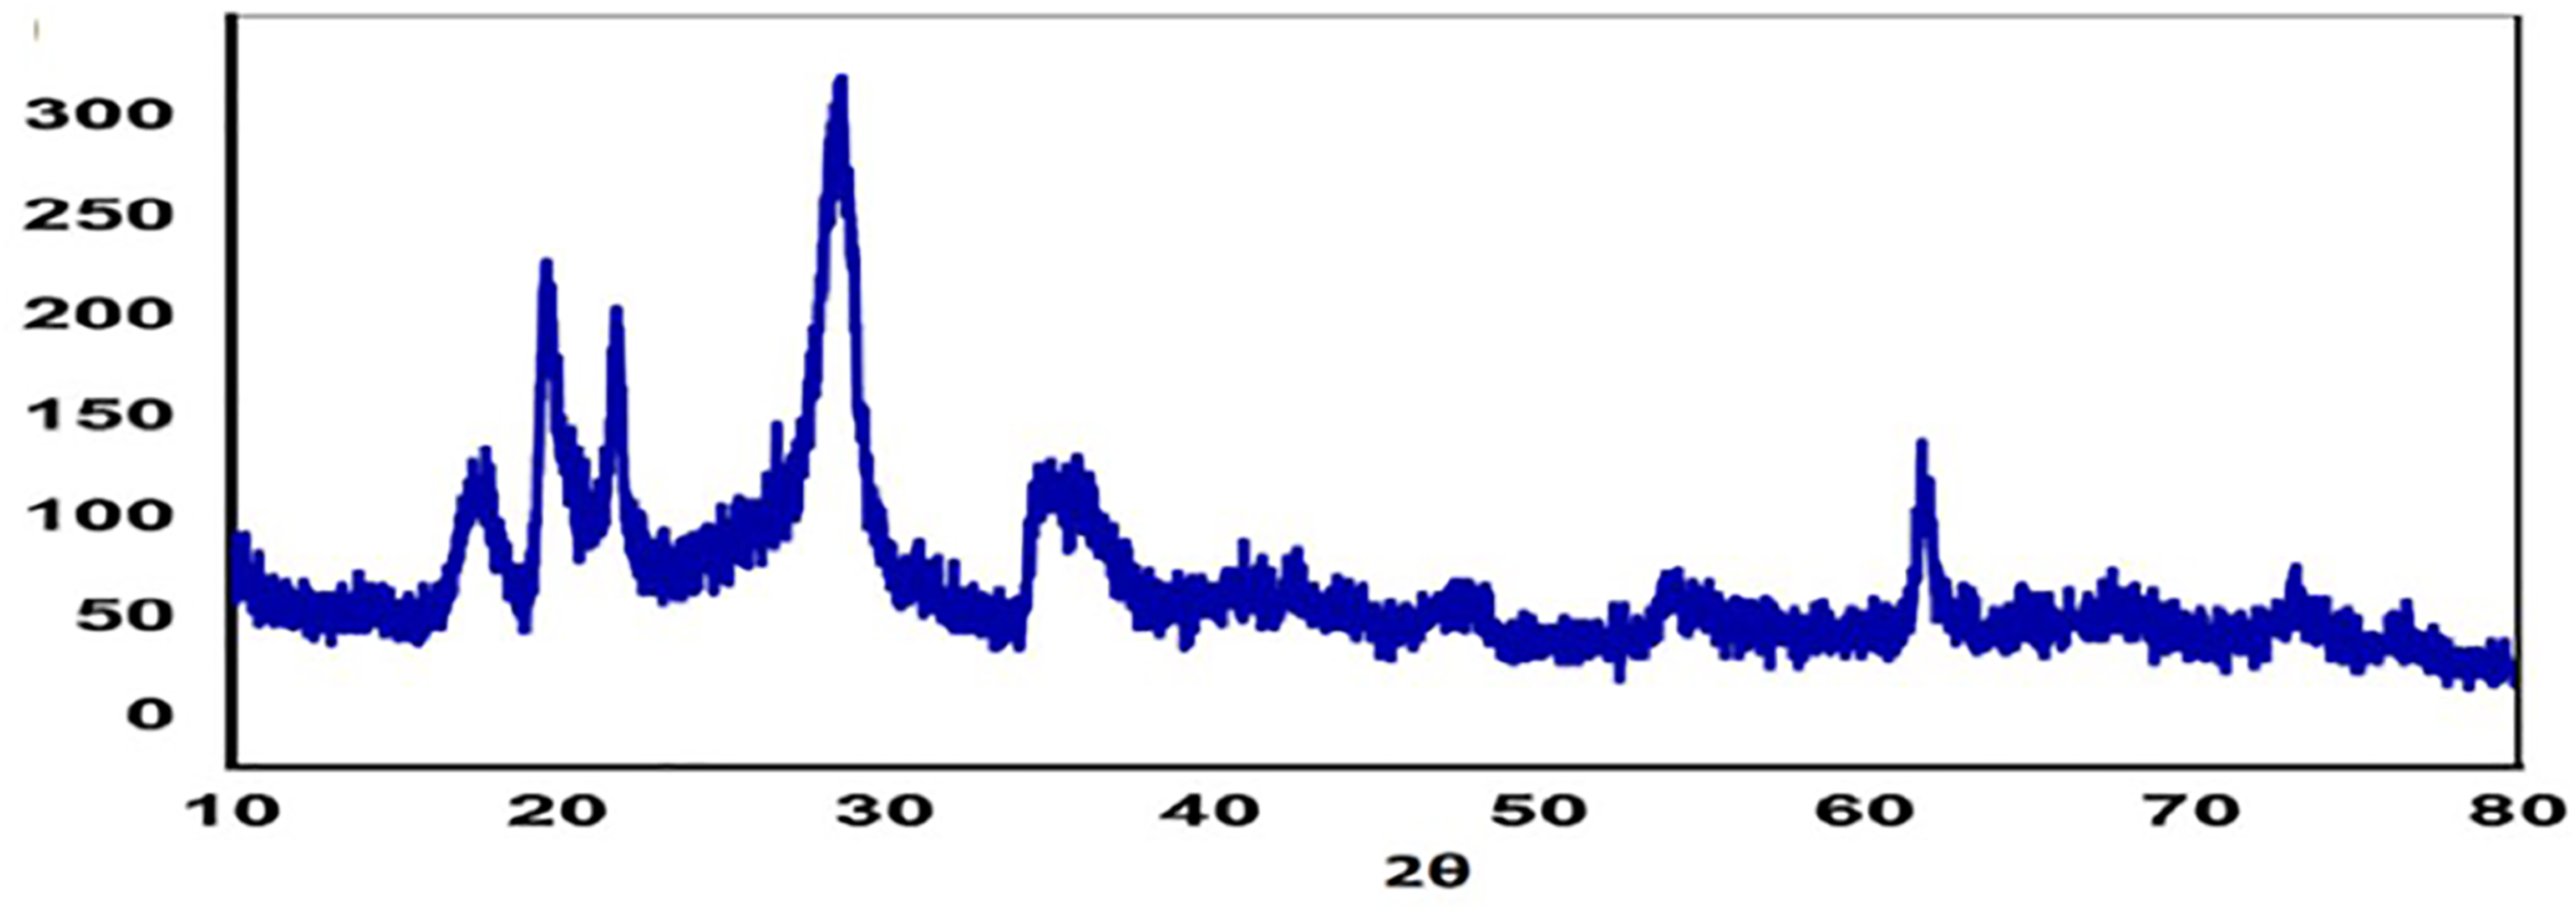
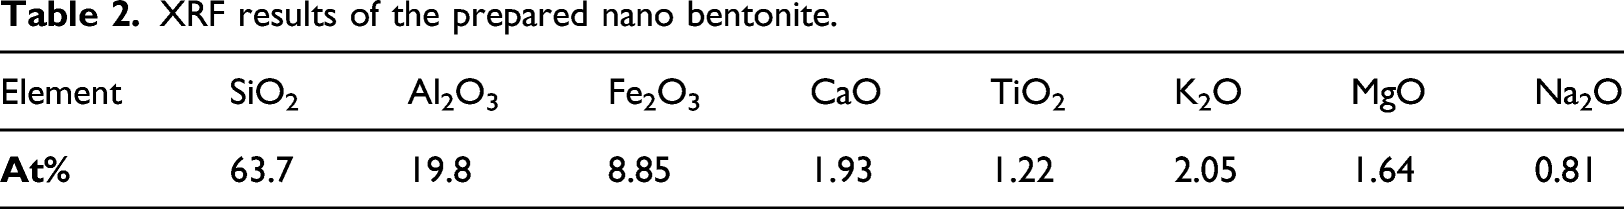
XRF results of the prepared nano bentonite.
SEM and EDAX characterization
Scanning Electron Microscope (SEM) with EDAX analysis was tested for nano-bentonite samples. Figure 3(a) shows the formation of nano bentonite with equal size ranged between 10 and 22 nm. Figure 3(b) shows the EDAX element determination map indicating the domination of Si, Al, and Fe in the nano-bentonite sample. Also, the results indicated the presence of oxygen, silicon, iron, aluminum, calcium, and magnesium in the bentonite sample showing agreement with the XRD, XRF results, and previous studies. (a) Nano bentonite with scale 1 µm, and (b) EDAX element determination map.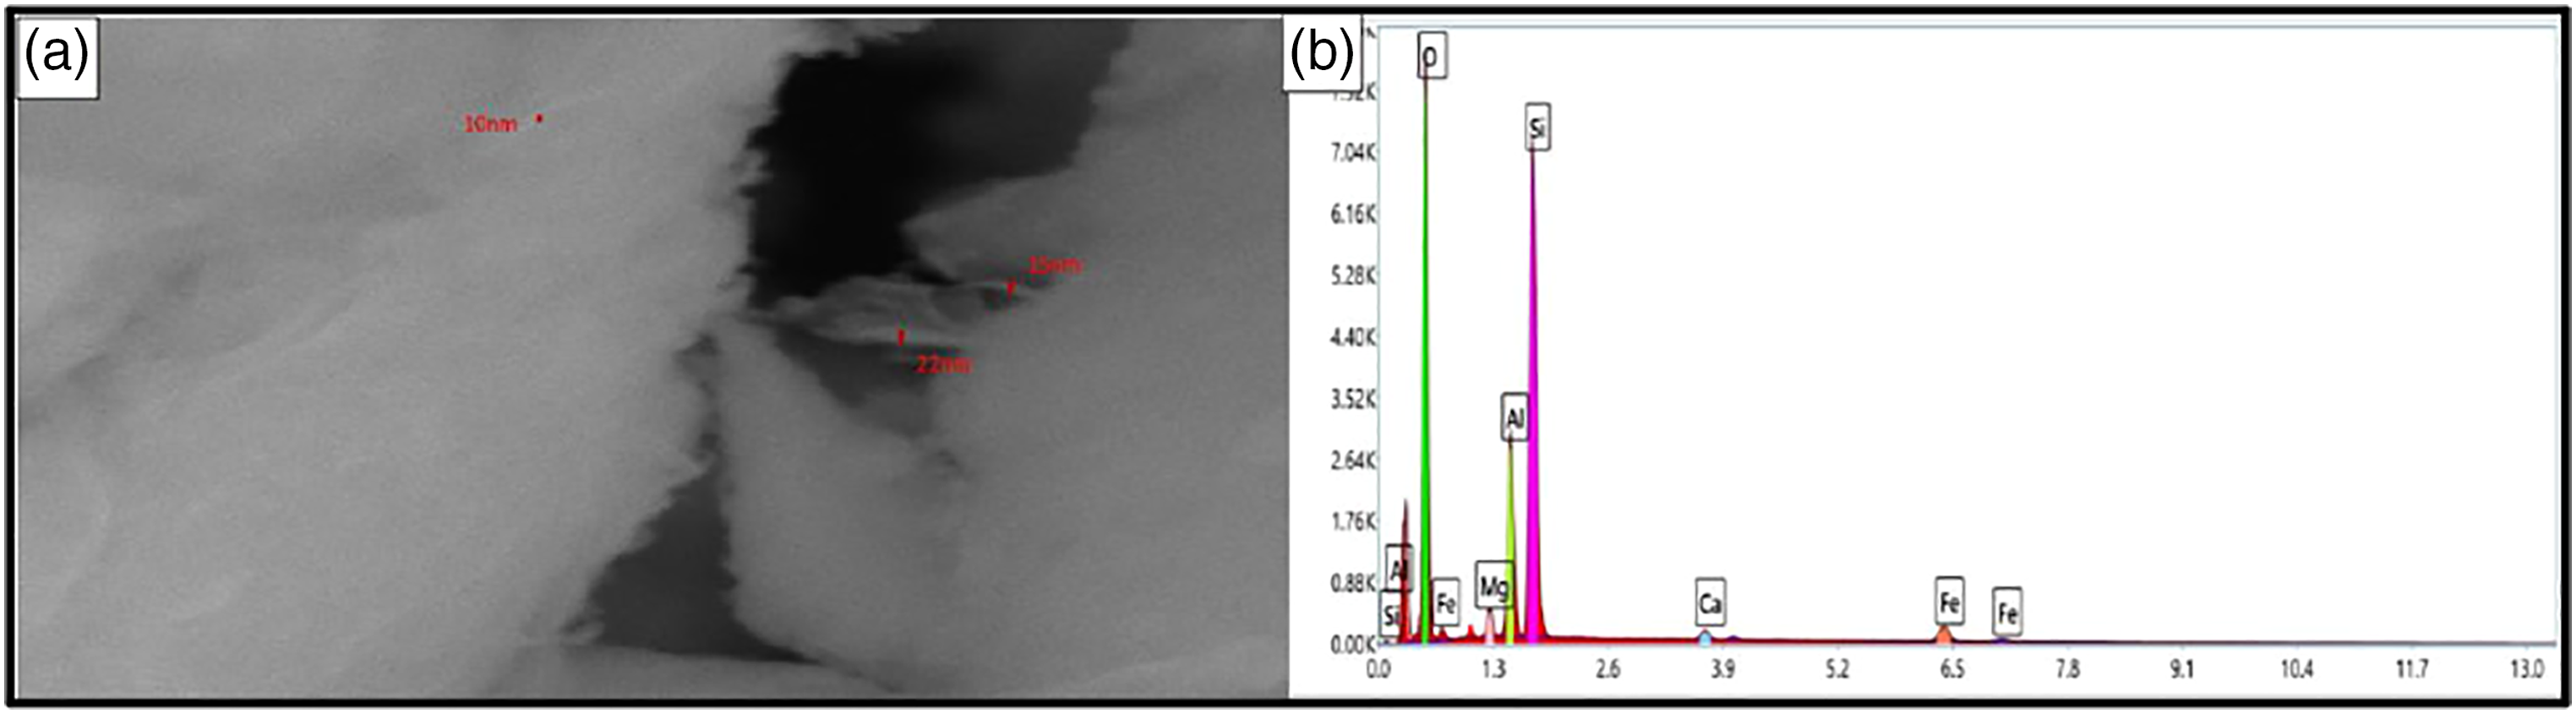
Particle size distribution and point of zero charges (PZC)
Particle size distribution was tested for nano-bentonite samples from 0 to 30 μm by a rate of 0.02 μm as shown in Figure 4(a). The obtained results indicated that 94% of nano-bentonite powder was 50 nm. The point of zero charges (pzc) values for nano bentonite was about 7.85 as shown in Figure 4(b). Khatamian et al., 2019 determined the pHPZC of Fe3O4/ bentonite nanocomposite using the same technique and the obtained results indicated the pHPZC was 7.3.
72
Dehgani et al., 2020 determined the pHPZC of modified zero-valent iron and the obtained results indicated that PZC was 8.2.
73
Naghizadeh et al., 2017 determined the pHPZC of bentonite and the obtained results indicated that the PZC was 7.4.
74
At the point of zero charges, the nanopowder tends to be zero, and below this point can help to chemically adsorb anionic dyes from aqueous solutions. (a)Particle size distribution of the nano-bentonite sample and (b) point of zero charge estimation.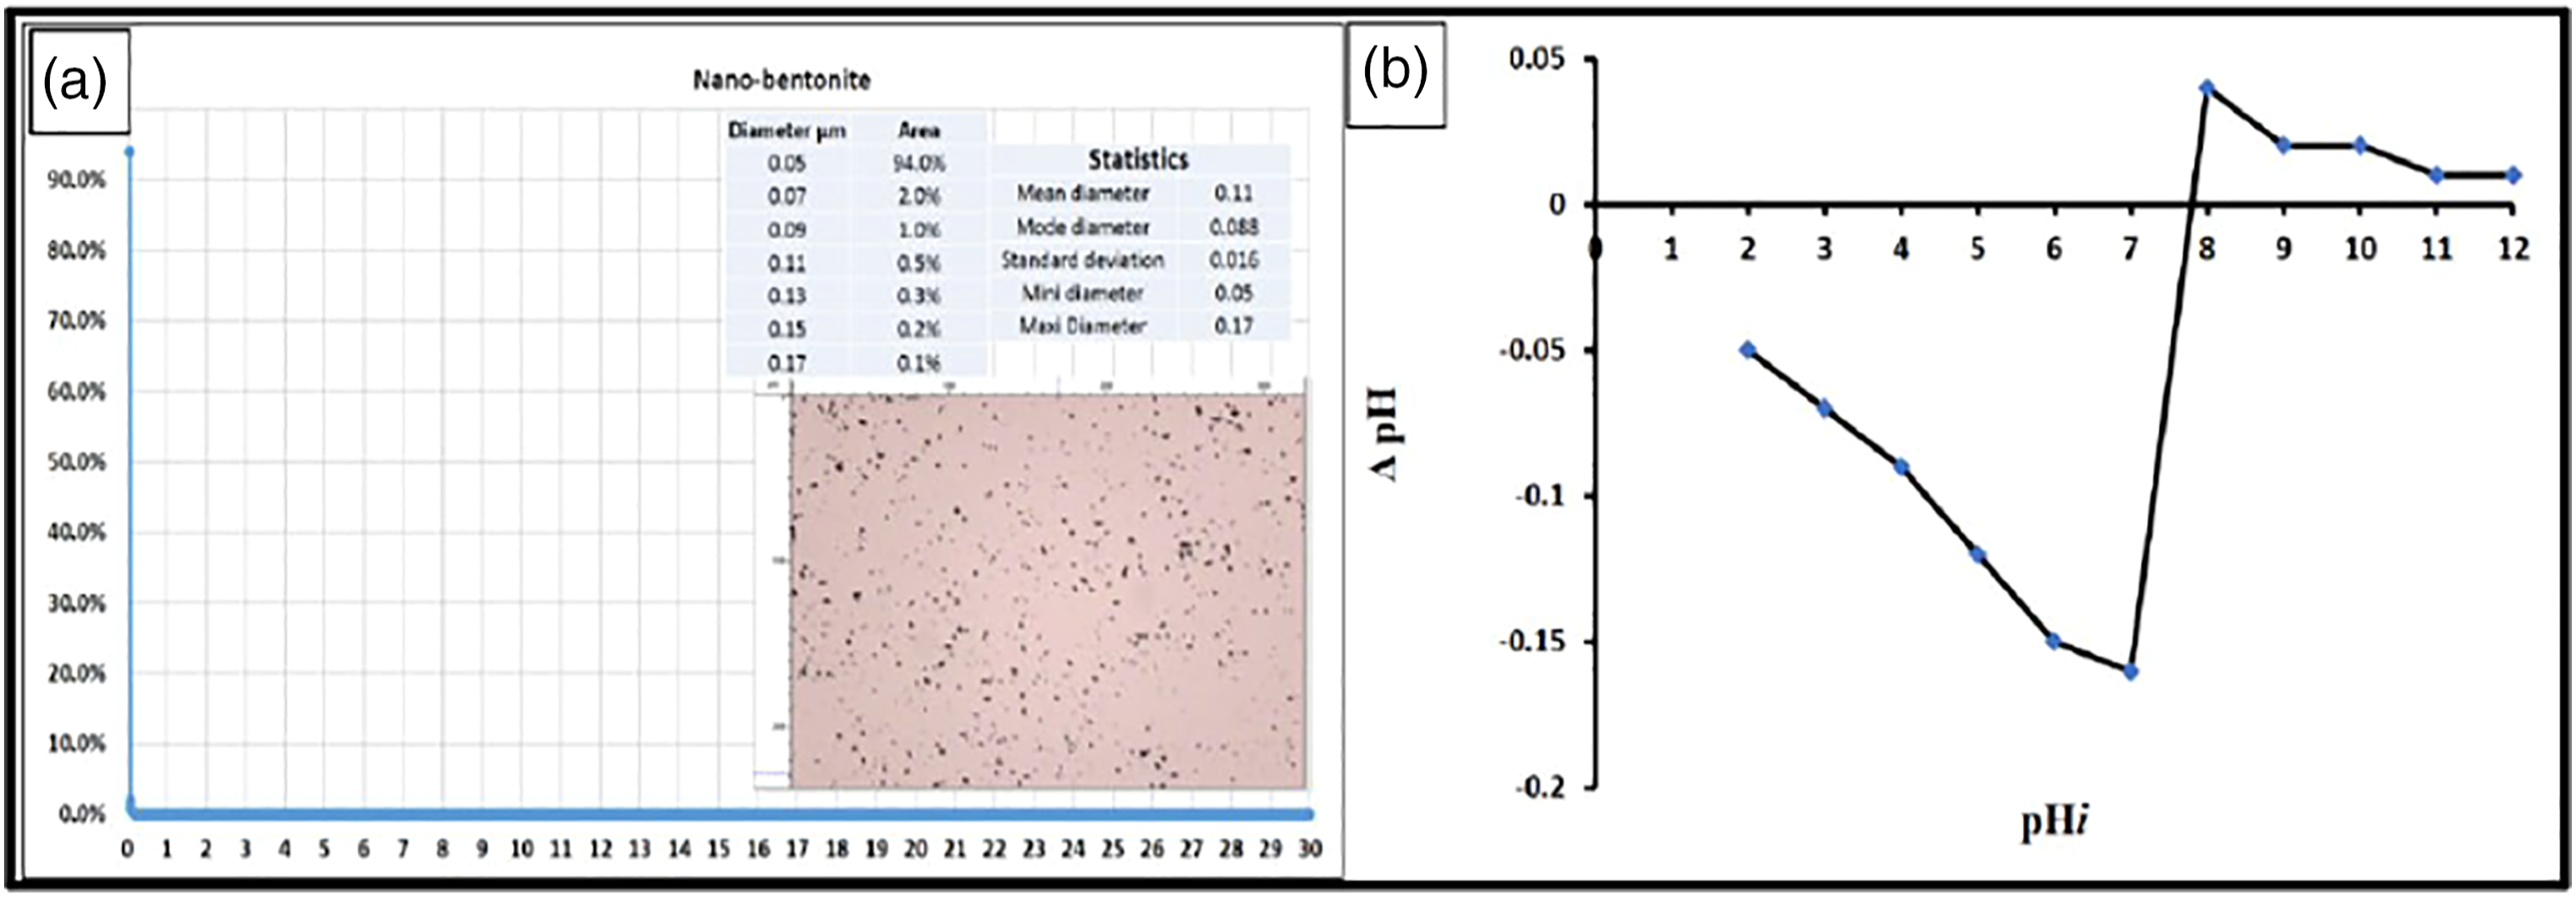
FT-IR and TGA Characterization
Figure 5(a) shows the FT-IR results of the prepared samples showing O-H vibration band between 3600 and 3300 cm−1, Si-O stretching vibration band at 1035 cm−1, Si–O bending vibration band between 526 and 471 cm−1, and Al–O–Si stretching vibration band at 800 cm−1. The obtained FT-IR results agree with the previous nano bentonite characterization studies.70,75 Figure 5(b) shows the TGA results of the prepared nano-bentonite sample at a temperature between 20 and 1200°C and the obtained results showing weight loss between 16.78°C and 15.23°C with loss percent 2% at 600°C and 9.2% at 1200°C.
70
(a) FT-IR of nano-bentonite sample, and (b) TGA analysis of nano-bentonite sample.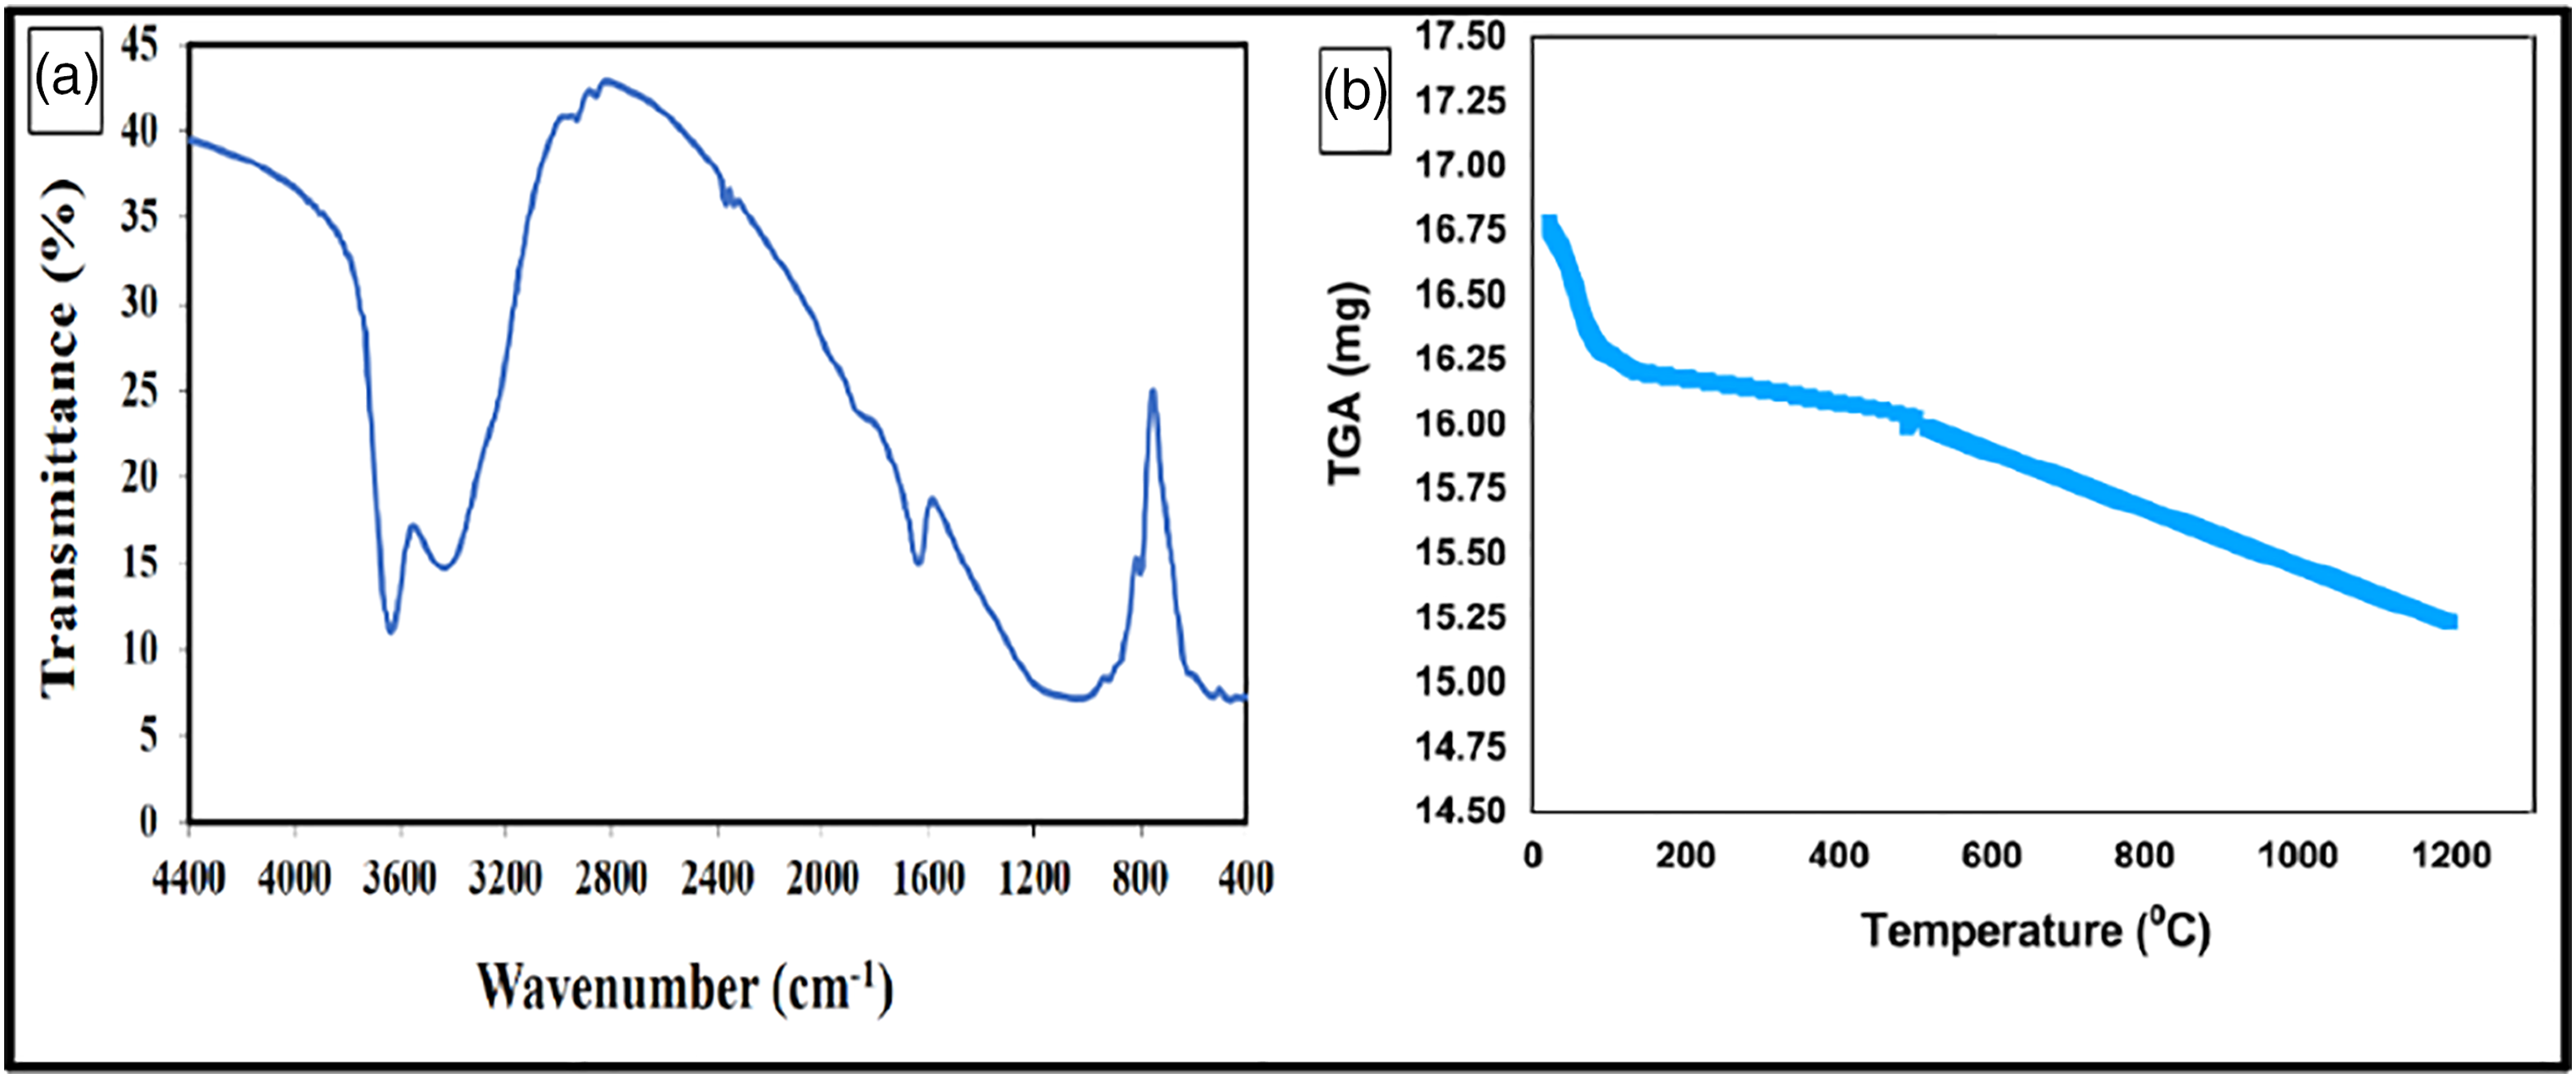
Effect of operating conditions
Effect of pH
The effect of pH was studied at different pH ranges from pH 2 to pH 10. The results indicated that the effective pH at acidic pH 3 and the removal percentage was 94.6. At pH 2, the removal percentage was 89.9%. At pH 4, 5, 6, 7, 8, 9, and 10, the removal percentages were 92.3, 85.7, 82.5, 80.1, 77.1, 75.6, and 72.3%, respectively, as shown in Figure 6(a). Joshi et al. (2004) studied a review for decoloring from the textile effluents and mentioned that the optimum pH was 3 after using Fenton’s reagent, pH 3.5 better than 7 for chlorination technique, and pH 3–4 after using chitin and chitosan showing agreement with the obtained results.
56
Jabli et al., 2017 studied DY 50 adsorption by the modified waste of palm date fruits with dimethyl diallyl ammonium chloride and diallylamin co-polymer and the obtained results indicated that maximum DY 50 removal occurred at pH 4. At acidic pH, the amount of H+ increased in the solution and the surface of sorbent material tends to be positively charged and can be able to adsorb the negatively charged dye (-SO3-)by chemisorption process showing agreement with the kinetic studies.
76
(a) Effect of pH, (b) effect of dose, (c) effect of contact time, and (d) effect of temperature.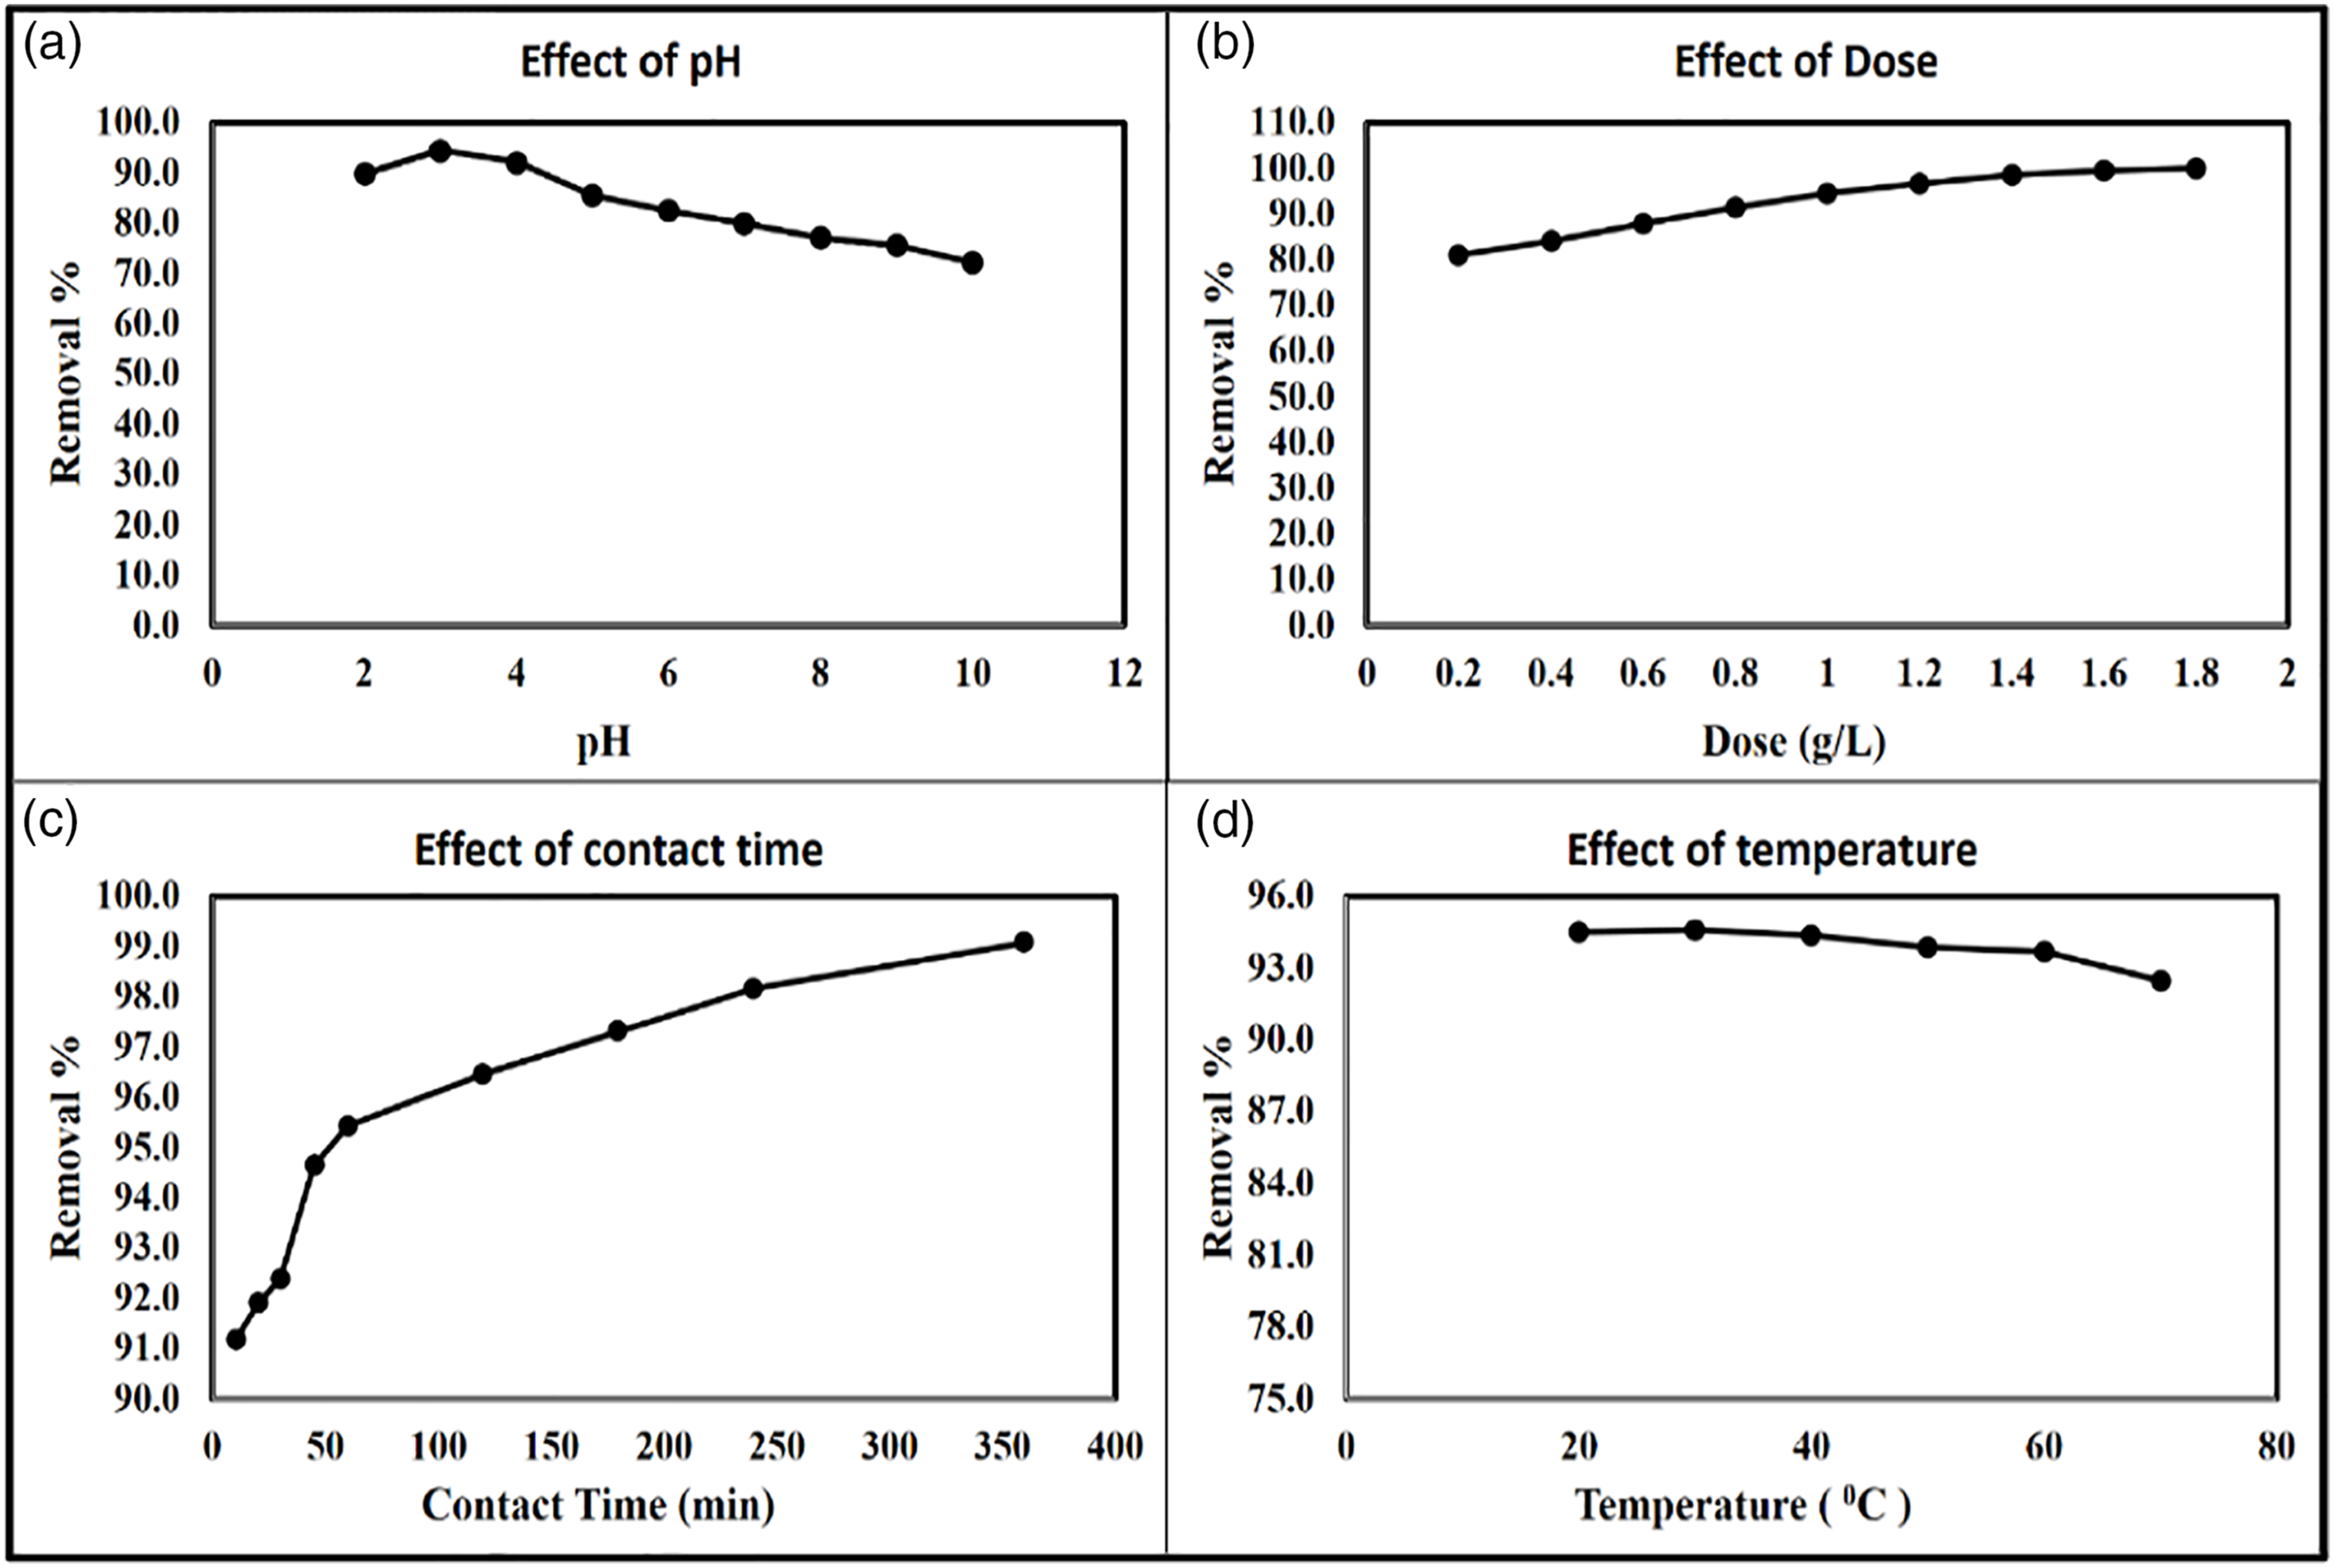
Effect of dose
The effect of nano bentonite dose was studied using different doses, namely, 0.2, 0.4, 0.6, 0.8, 1.0, 1.2, 1.4, 1.6, and 1.8 g/L and the removal percentages were 81.2, 84.3, 88.1, 91.5, 94.6, 96.8, 98.6, 99.6, and 100%, respectively, as shown in Figure 6(b). As the dose increases, the vacant sites increase and the removal percentages increase, and the minimum effective dose was 1 g/L. Mahmoud et al. (2019) studied soluble organic matter removal using nano Zero Valent Aluminum (nZVAl) and the obtained results indicated that the removal percentages increased as dose increase and the minimum effective dose was 0.6 g/L with efficient removal percentages of 73%. 1 Different studies were conducted for DY 50 adsorption using different materials such as Organoclay adsorbent, Sugarcane bagasse biomass, and Sugarcane bagasse biomass treated with polyethyleneimine and the maximum uptake was observed at pH 3, 2, and 2, respectively.67,77,78
Effect of contact time
The effect of contact time was studied at different times (10, 20, 30, 45, 60, 120, 180, 240, and 360 min). The obtained results indicated that the removal efficiency increased with time and the minimum effective time was 45 min with a removal percentage of 94.6% as shown in Figure 6(c). In the beginning, the removal percentages exceeded 90% due to the high surface area and reactivity of nano bentonite, and the removal percentages were 91.2, 91.9, 92.4, 94.6, 95.4, 96.5, 97.3, 98.2, and 99.1 at times 10, 20, 30, 45, 60, 120, 180, 240, and 360 min, respectively. Enaas 2015 studied DY 50 removal using Natural Clay and Organoclay and the obtained results indicated that the maximum time was 40 min after using bentonite and modified bentonite as sorbent materials. 77
Effect of temperature
The textile industry produces high temperature wastewater which may affect chemical and biological treatment. The effect of temperature was studied at different temperatures, namely, 20, 30, 40, 50, 60, and 70°C and the removal percentages were 94.5, 94.6, 94.4, 93.9, 93.7, and 92.5%, respectively. The obtained results indicated that the most effective temperature was 30°C.
Effect of concentration
The effect of initial concentration was studied at different DY 50 concentrations. The removal percentages were 100, 94.6, 89.5, 83.8 and 78.3% for initial concentrations 20, 40, 60, 80 and 100 mg/L, respectively, as shown in Supplementary Figure 2(a). The removal percentages decreased as the initial concentration increased and the selected most suitable concentration for the selected nano bentonite dose was 40 mg/L as shown in Supplementary Figure 2(b).
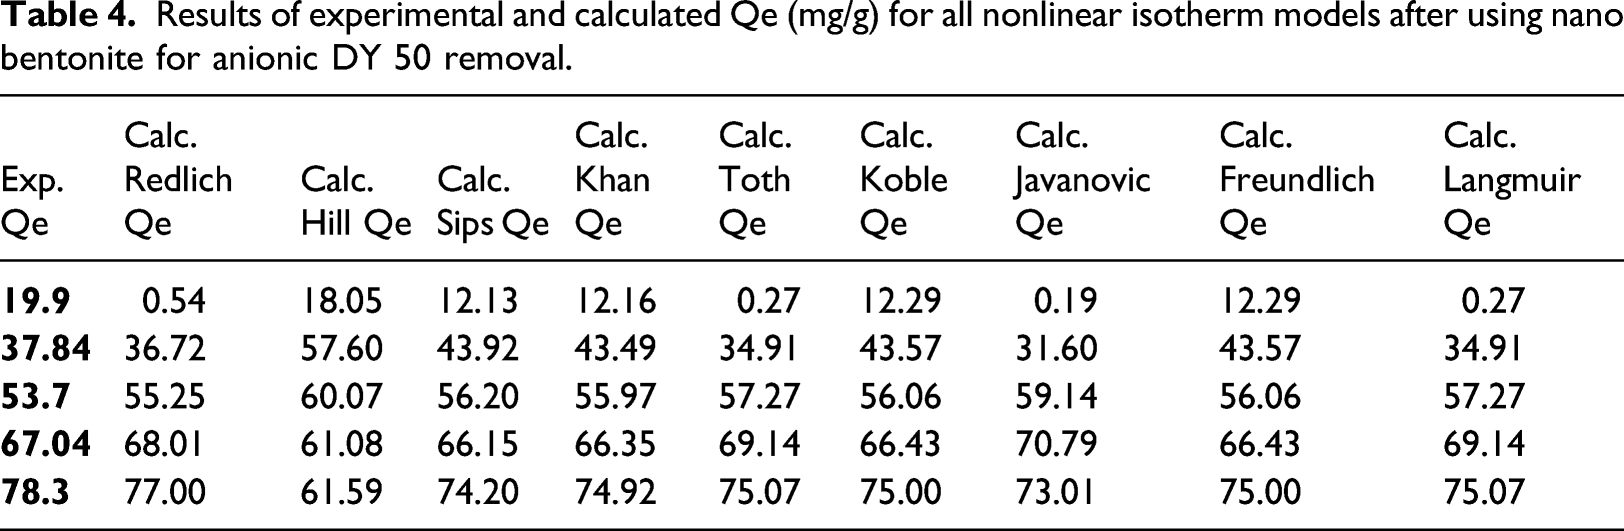
Adsorption isotherm
Results of isotherm models after using nano bentonite for DY 50 removal.
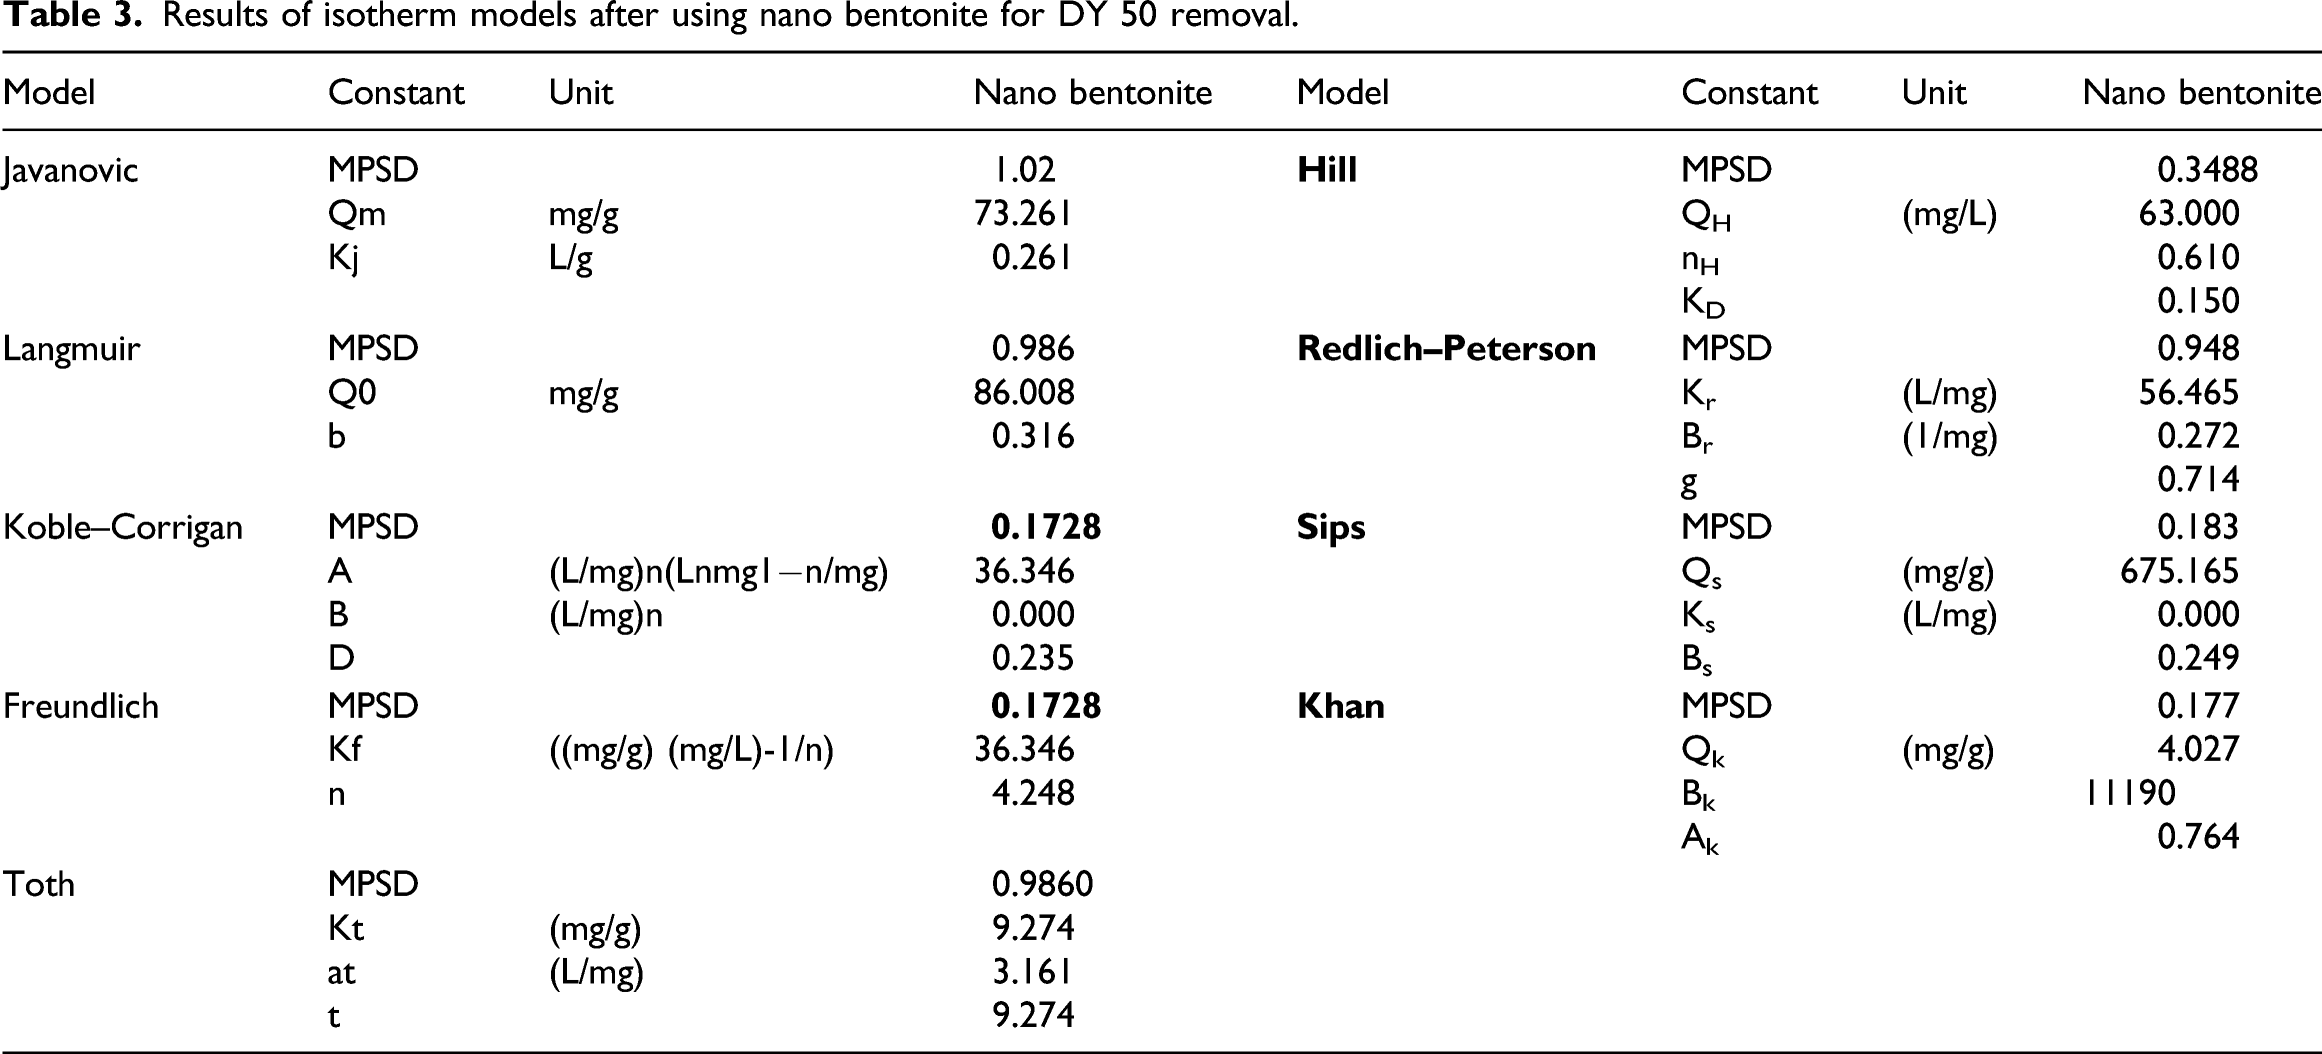
Results of experimental and calculated Qe (mg/g) for all nonlinear isotherm models after using nano bentonite for anionic DY 50 removal.
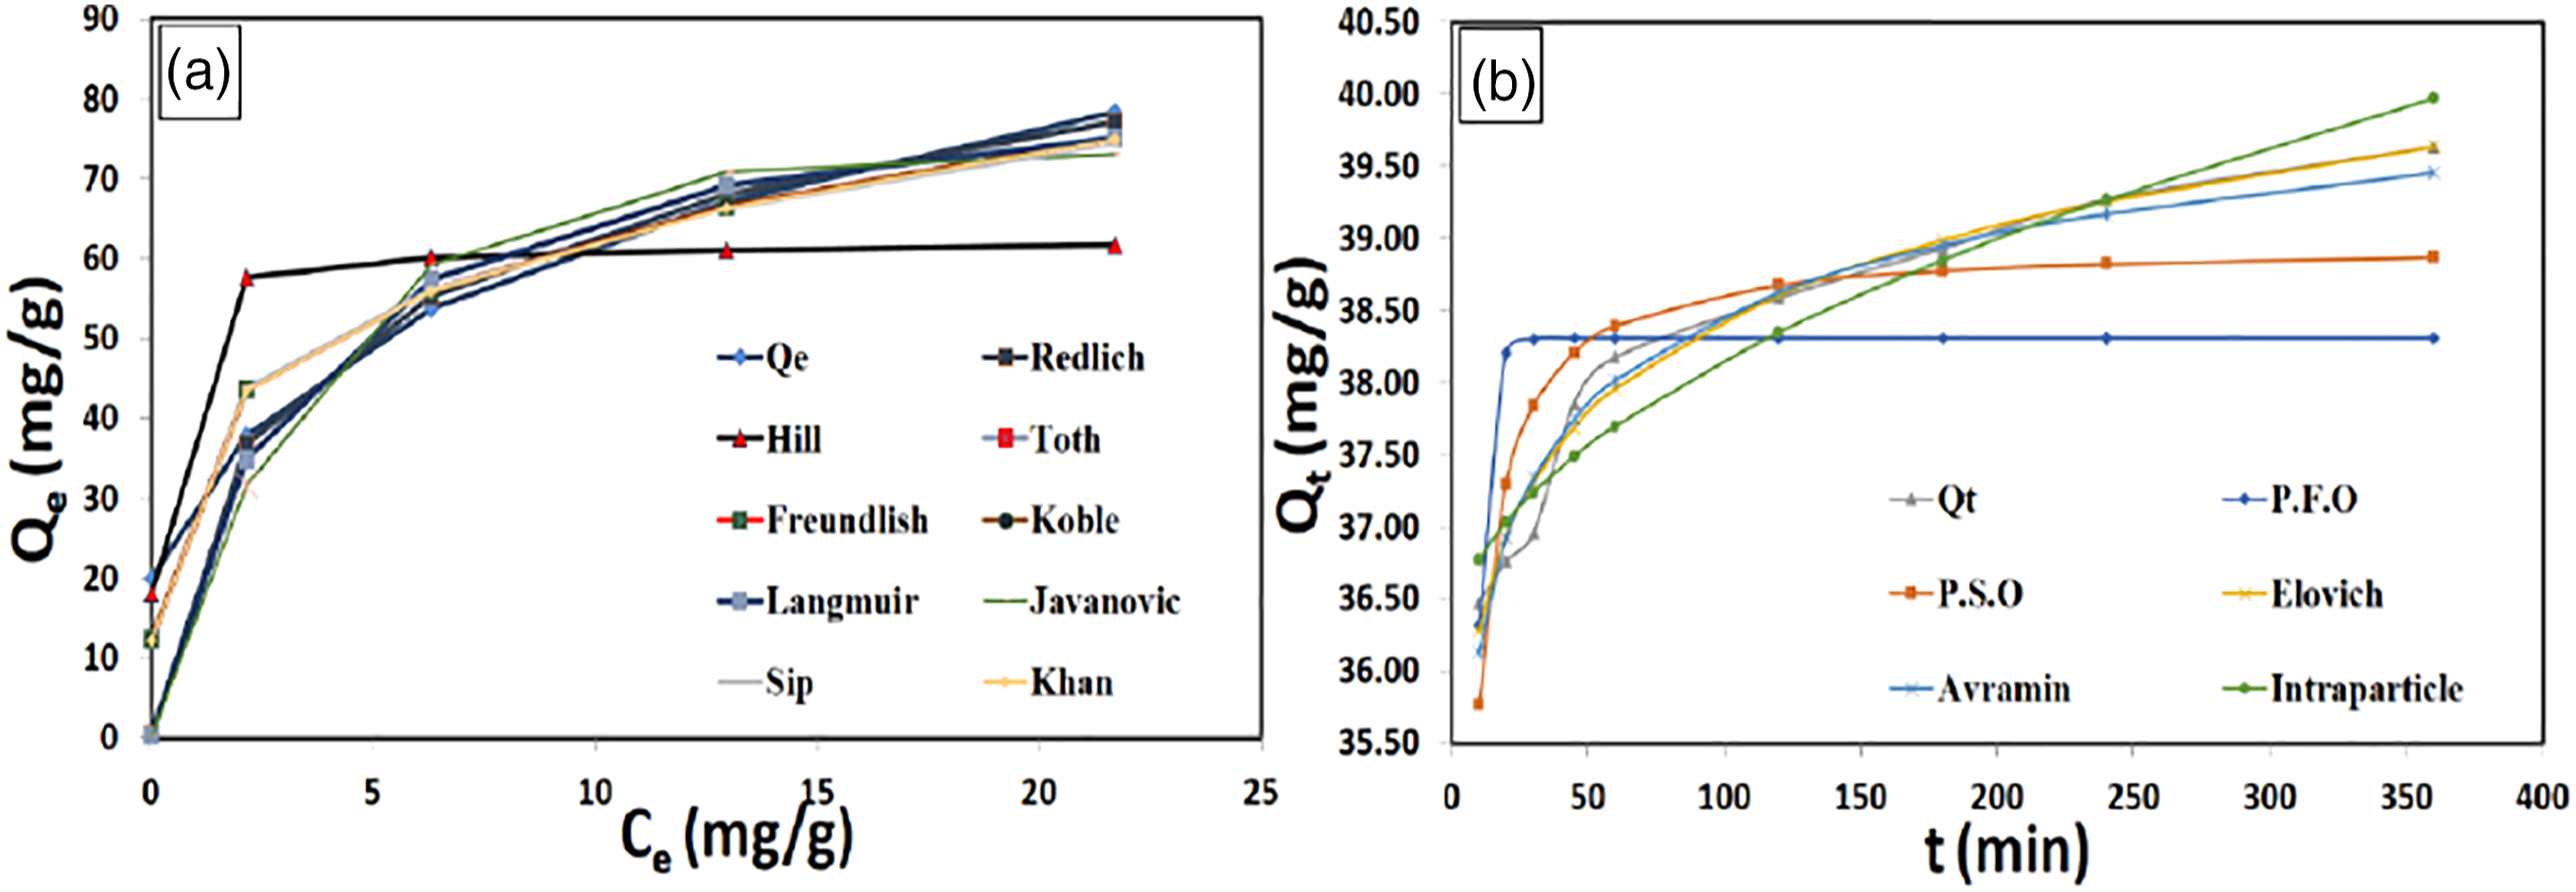
(a) Adsorption isotherm and (b) kinetic studies.
Kinetic Studies
Results of kinetics model after using nano bentonite for DY 50 removal.
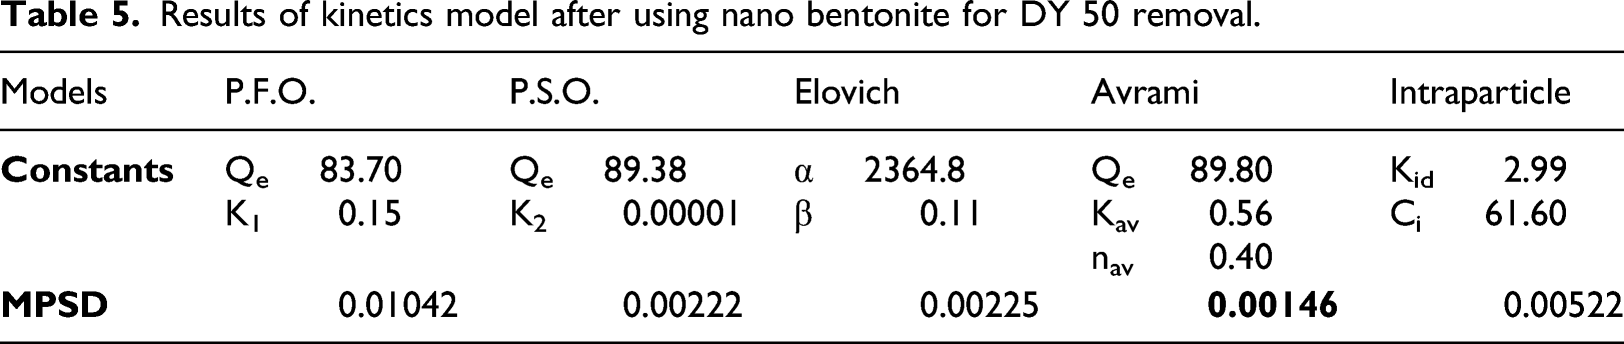
Figure 7(b) describes the relation between experimental and calculated Qt (mg/g) and time (min), indicating the small deviations between experimental and calculated Qt especially in the case of the Avrami model.
Thermodynamic analysis
Thermodynamic parameters for DY 50 removal on nano bentonite at different temperatures.
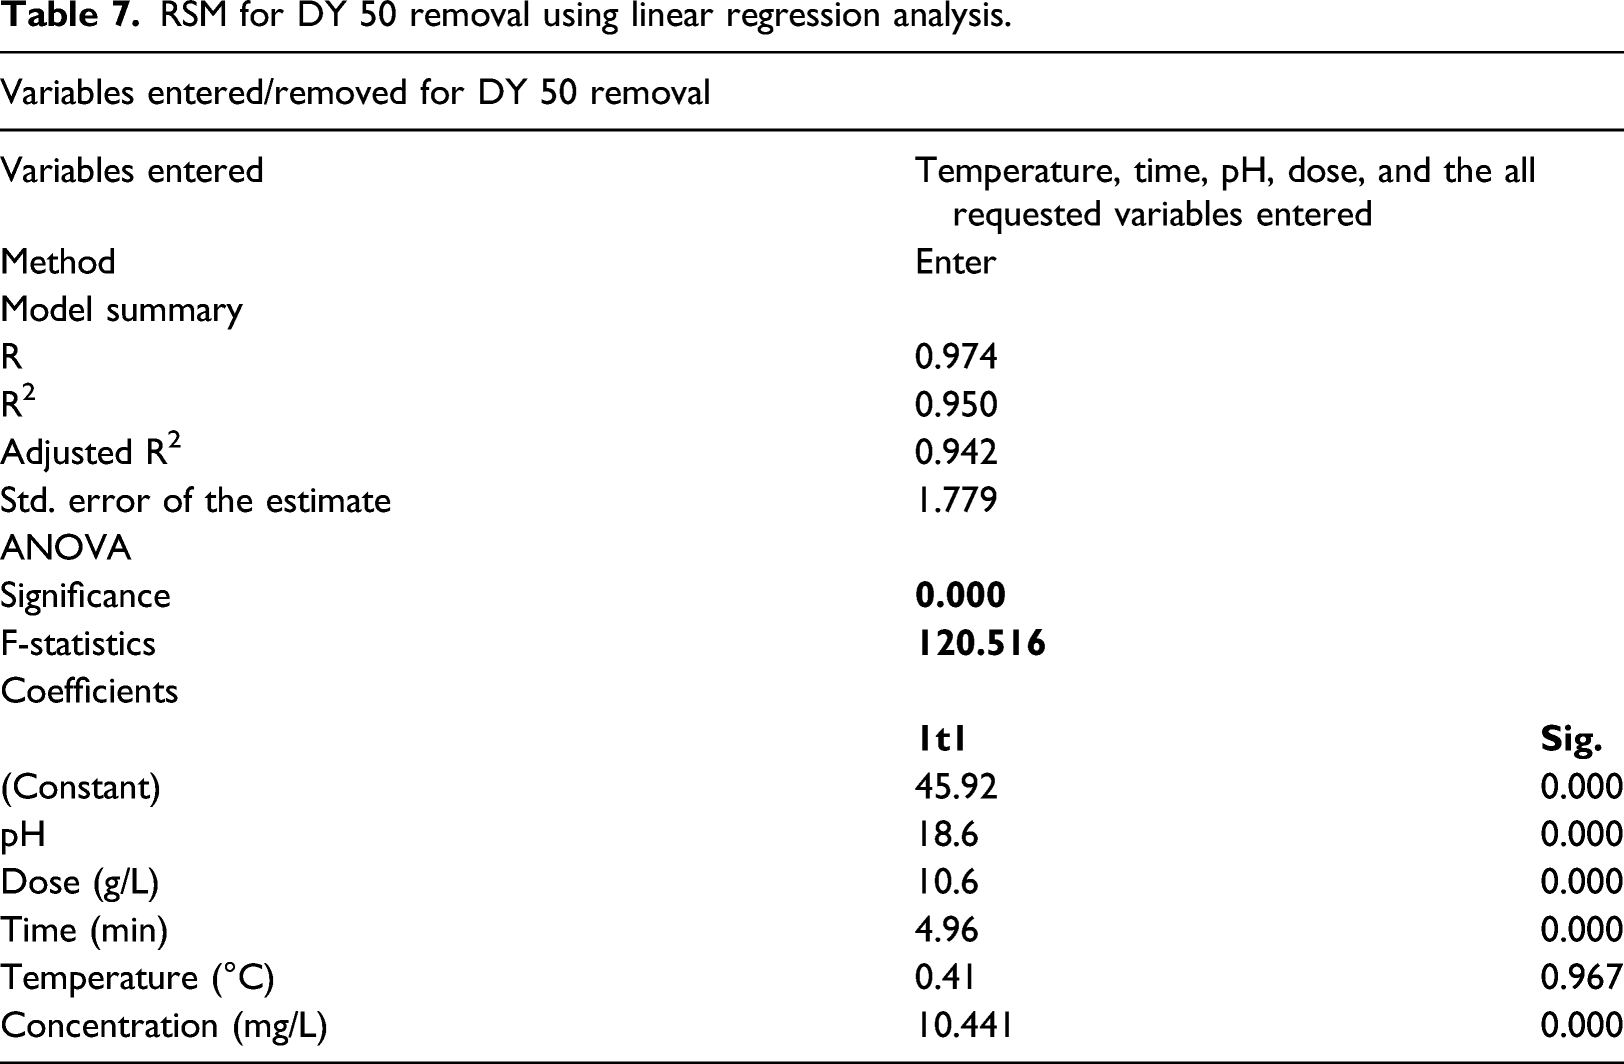
Response surface methodology
RSM for DY 50 removal using linear regression analysis.
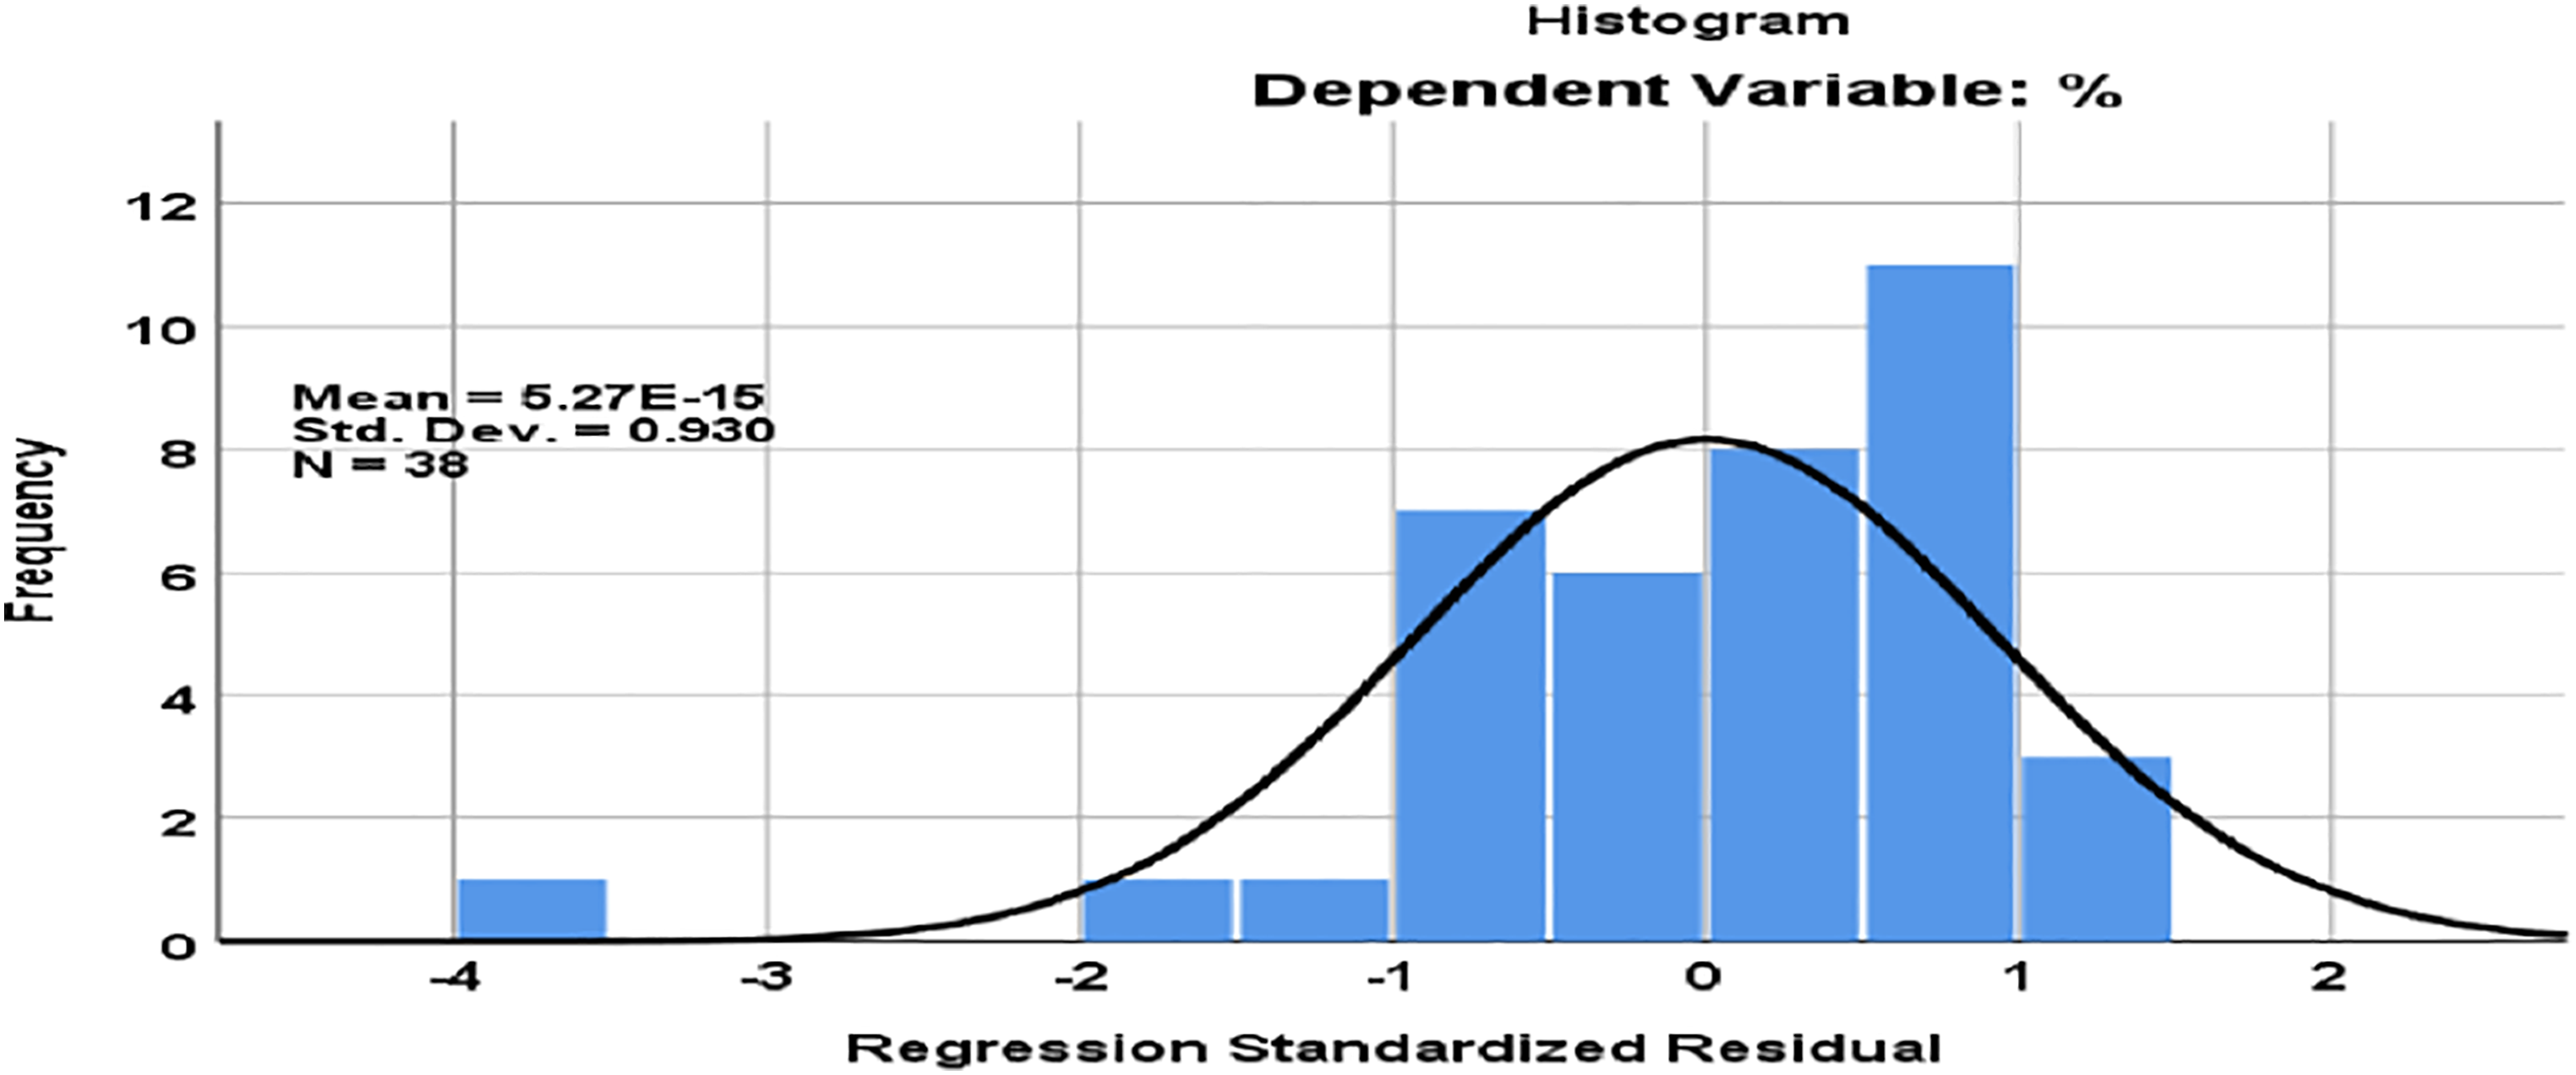
(a) Histogram for DY 50 removal using nano bentonite.
The coefficient of determination between measured data and simulated results (R2) and adjusted R2 existed in Table 7. By applying equation (7), the estimated removal equation is produced
Artificial intelligence neural networks (ANNs)
ANNs for wastewater treatment after using nZVAl by using multilayer perceptron.
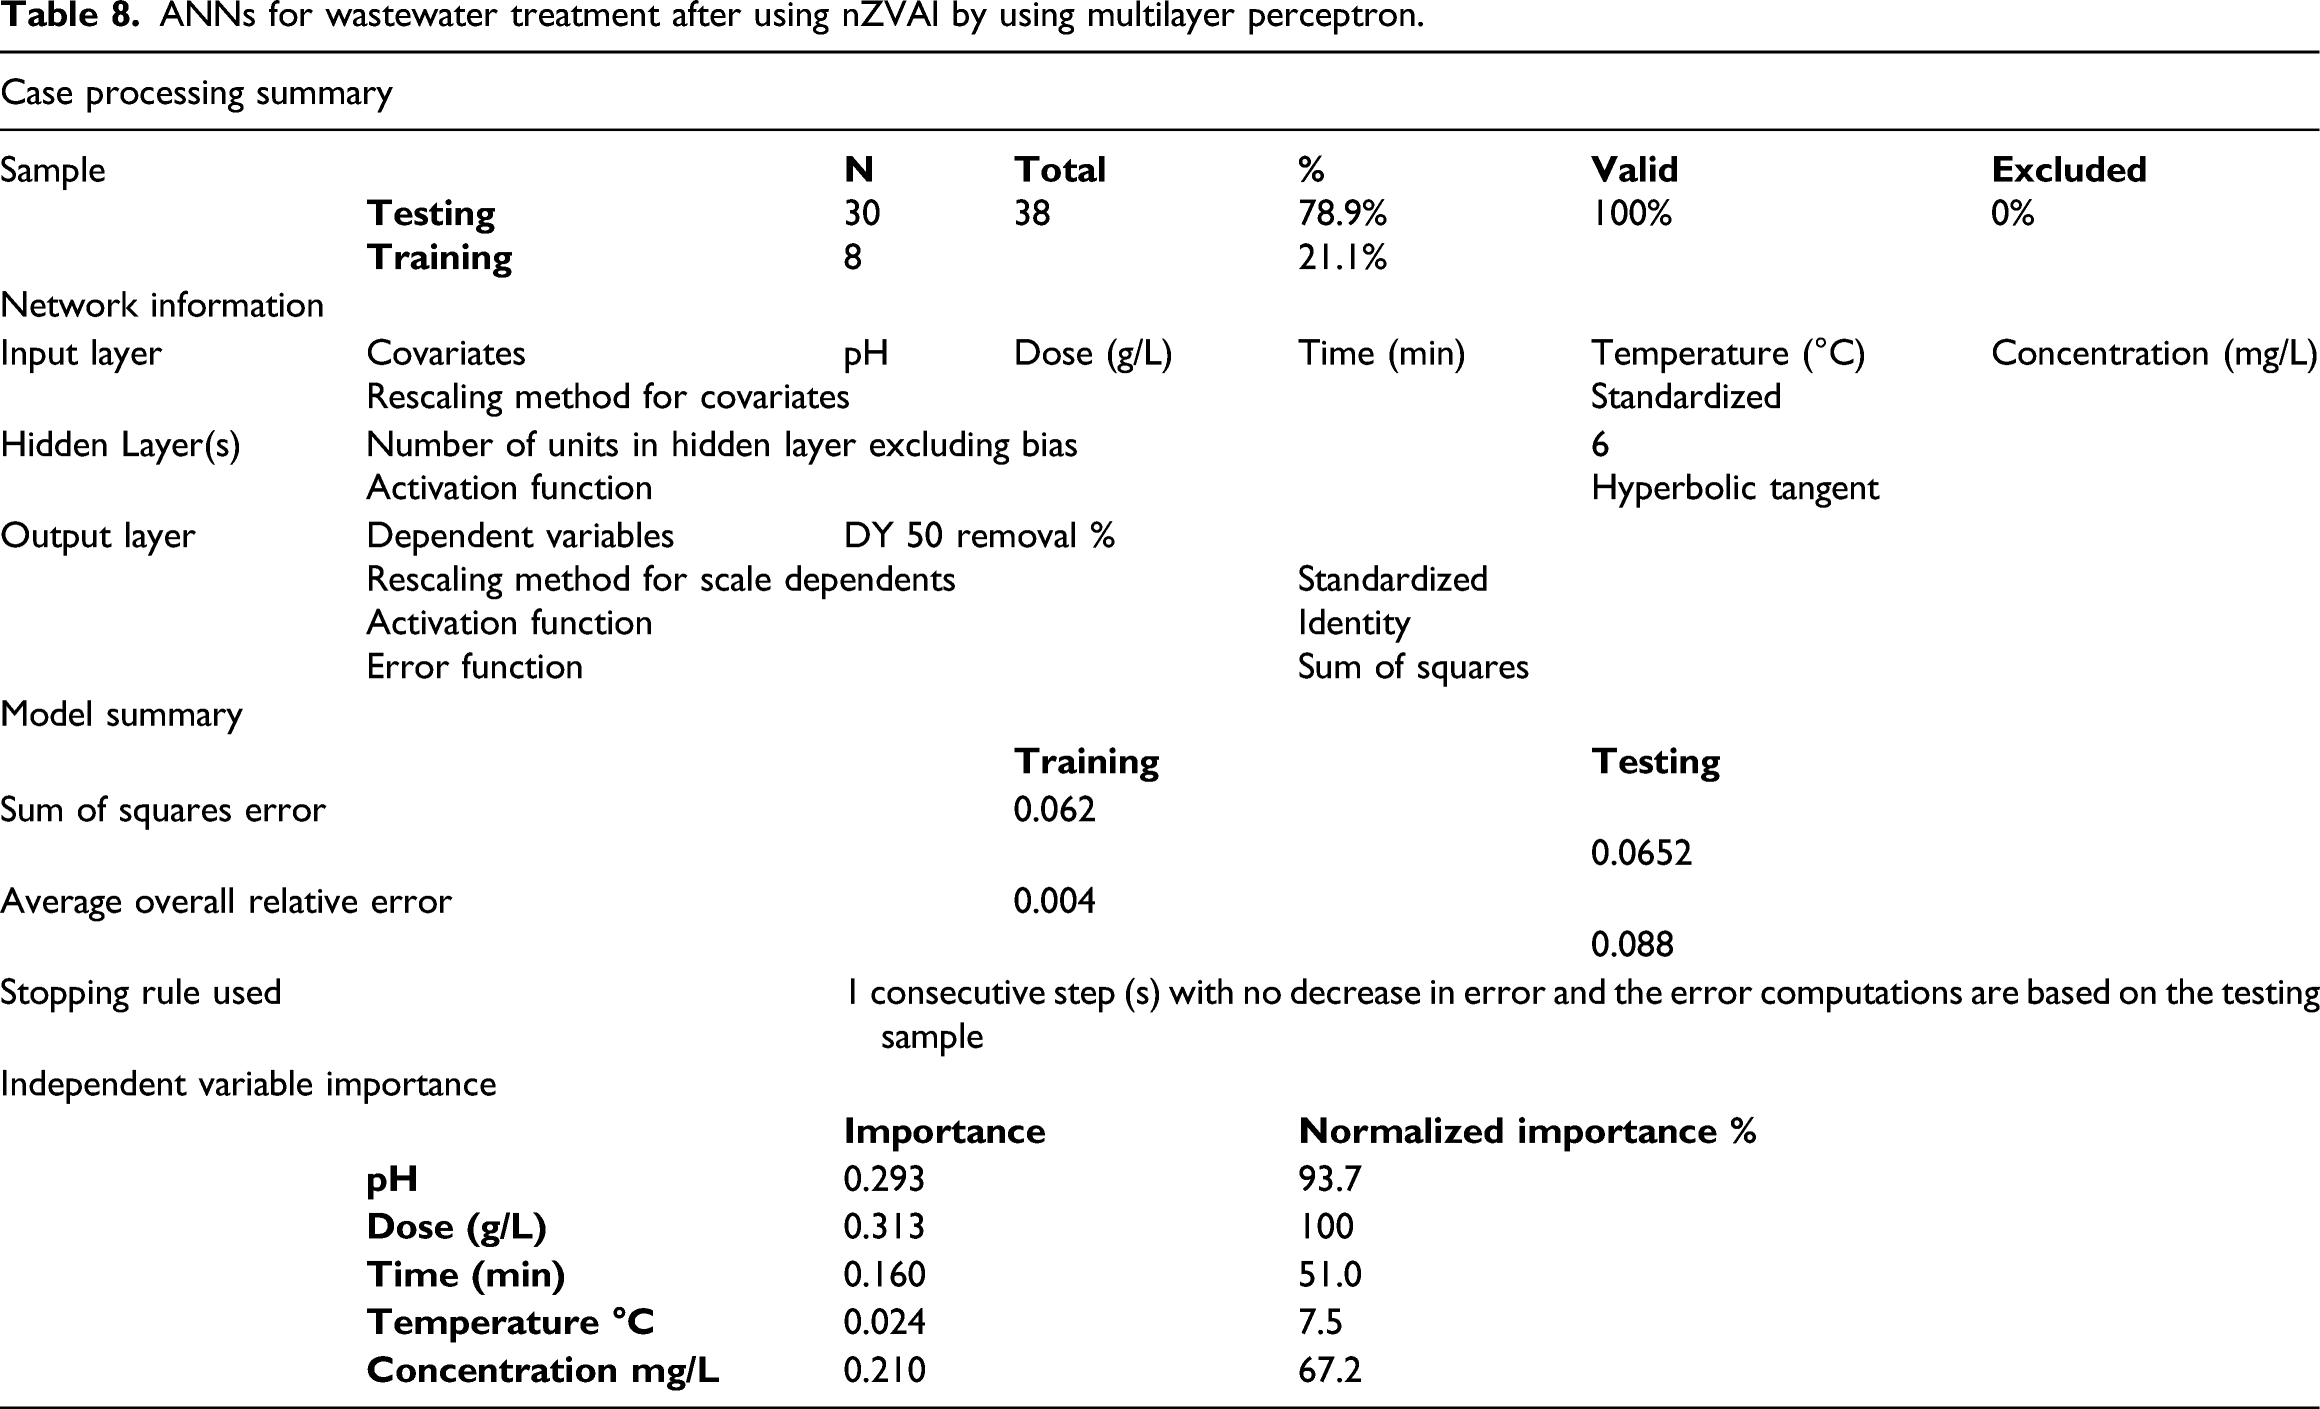
The sample was trained 30 times and tested 8 times without excluding any result with a total number of 38 runs using network structure 5-3-1 as shown in Figure 1. The results indicated that the most significant operating parameter is the effect of dose 100% followed by the effect of pH 93.7% as shown in Figure 9 and Table 8. The ANN results indicated that there is a small deviation between the predictive and actual results as shown in Supplementary Figures 4 and 5. So, the residual percent between actual removal % and predicted removal % was between (−2.5, +2.5%). The obtained ANNs results agree with RSM, Kinetic, and thermodynamic results. Importance and normalized importance for DY 50 removal using nano bentonite.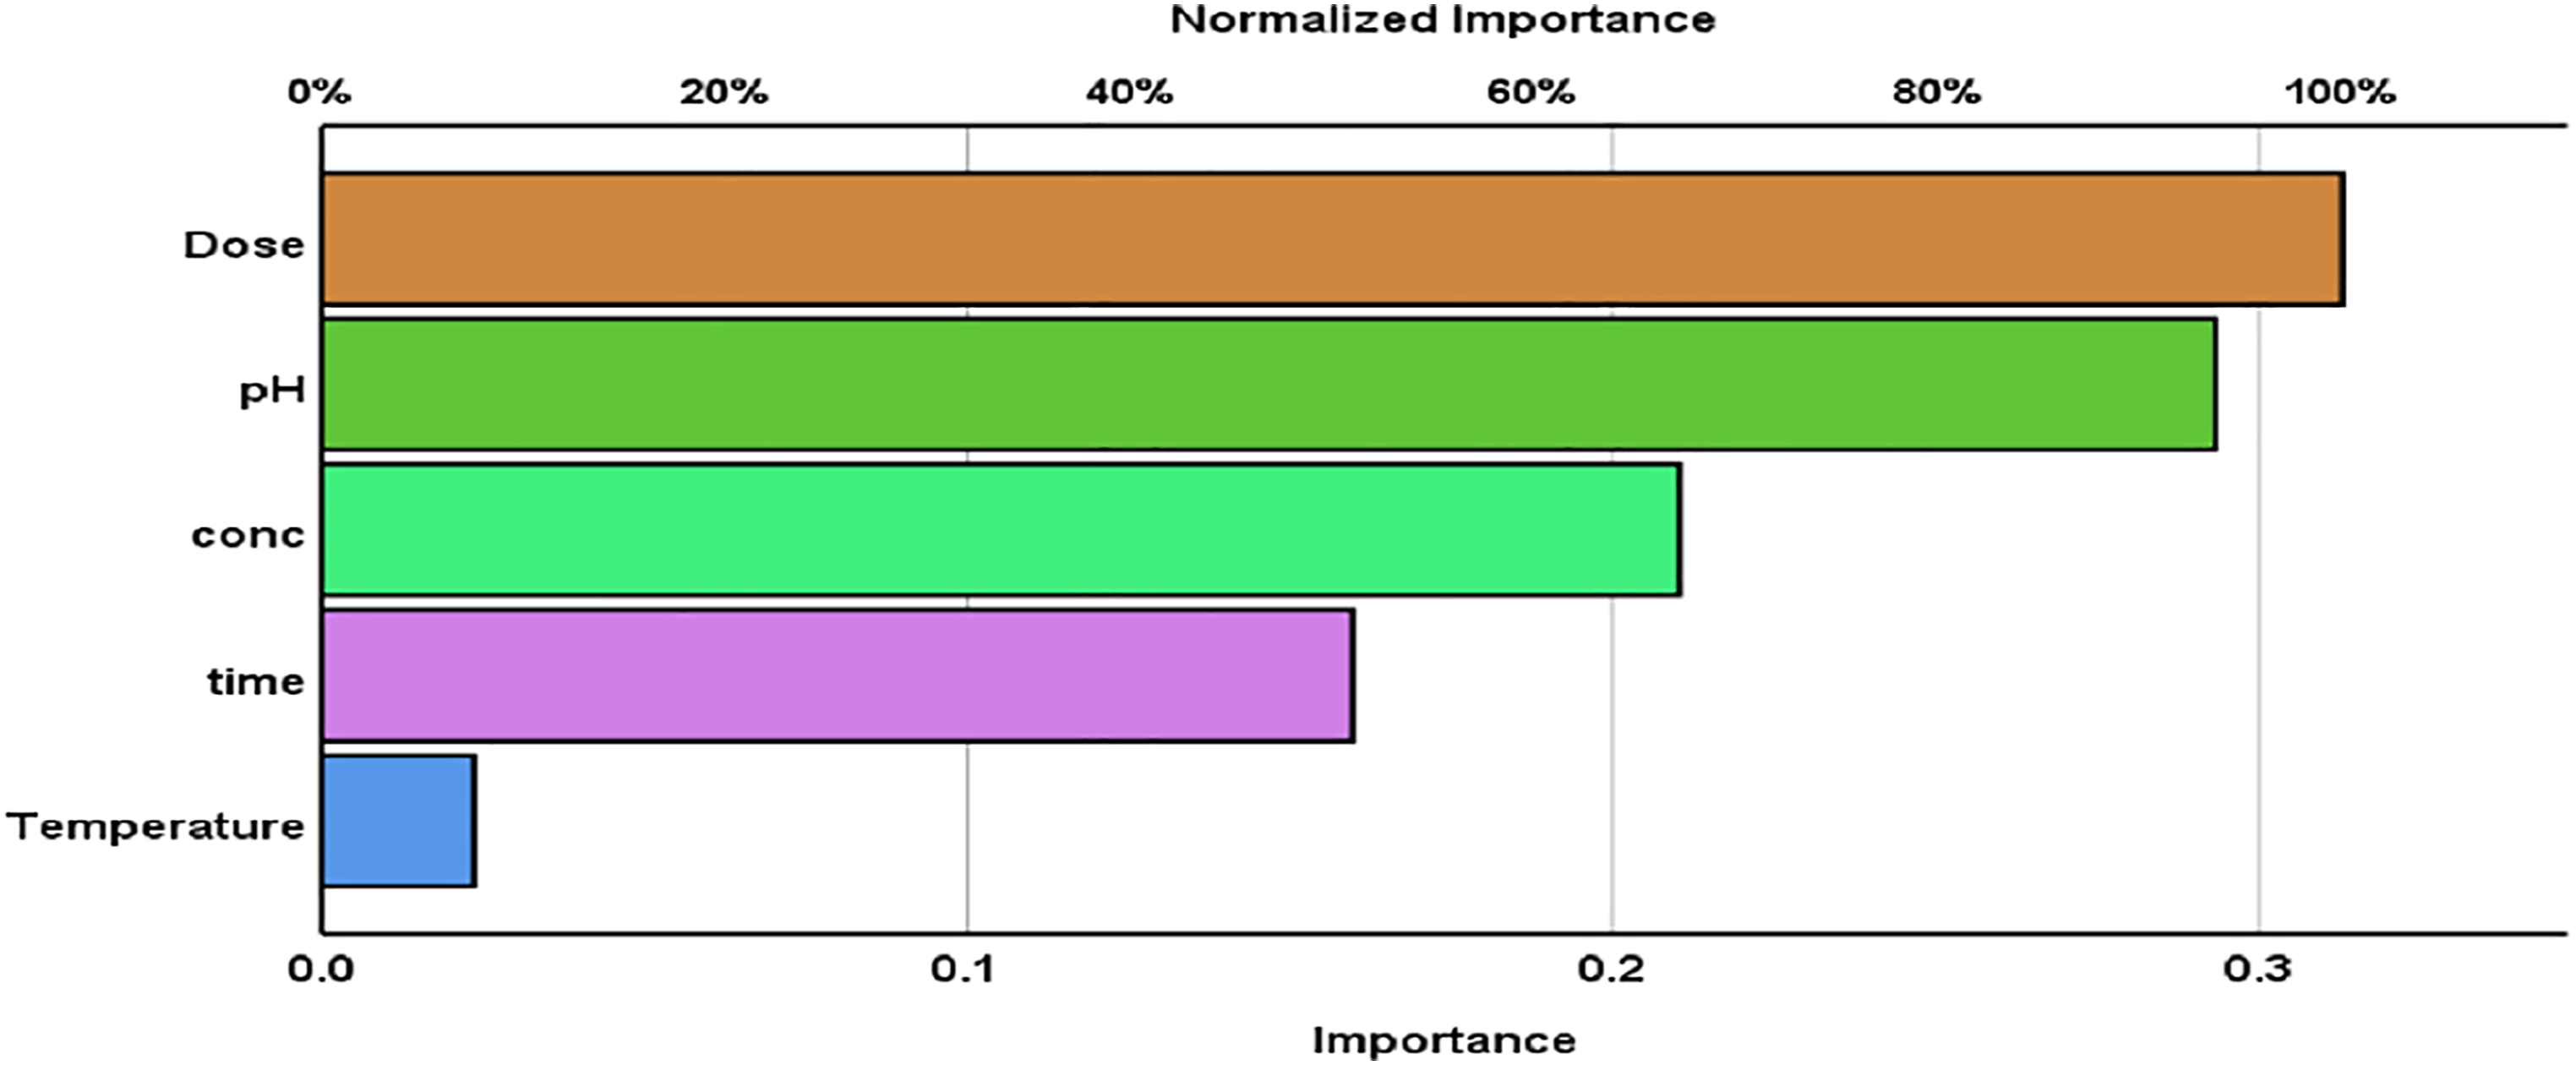
Adsorption of DY 50 from aqueous solutions by various adsorbents
Adsorption of DY 50 from aqueous solutions using various adsorbents.
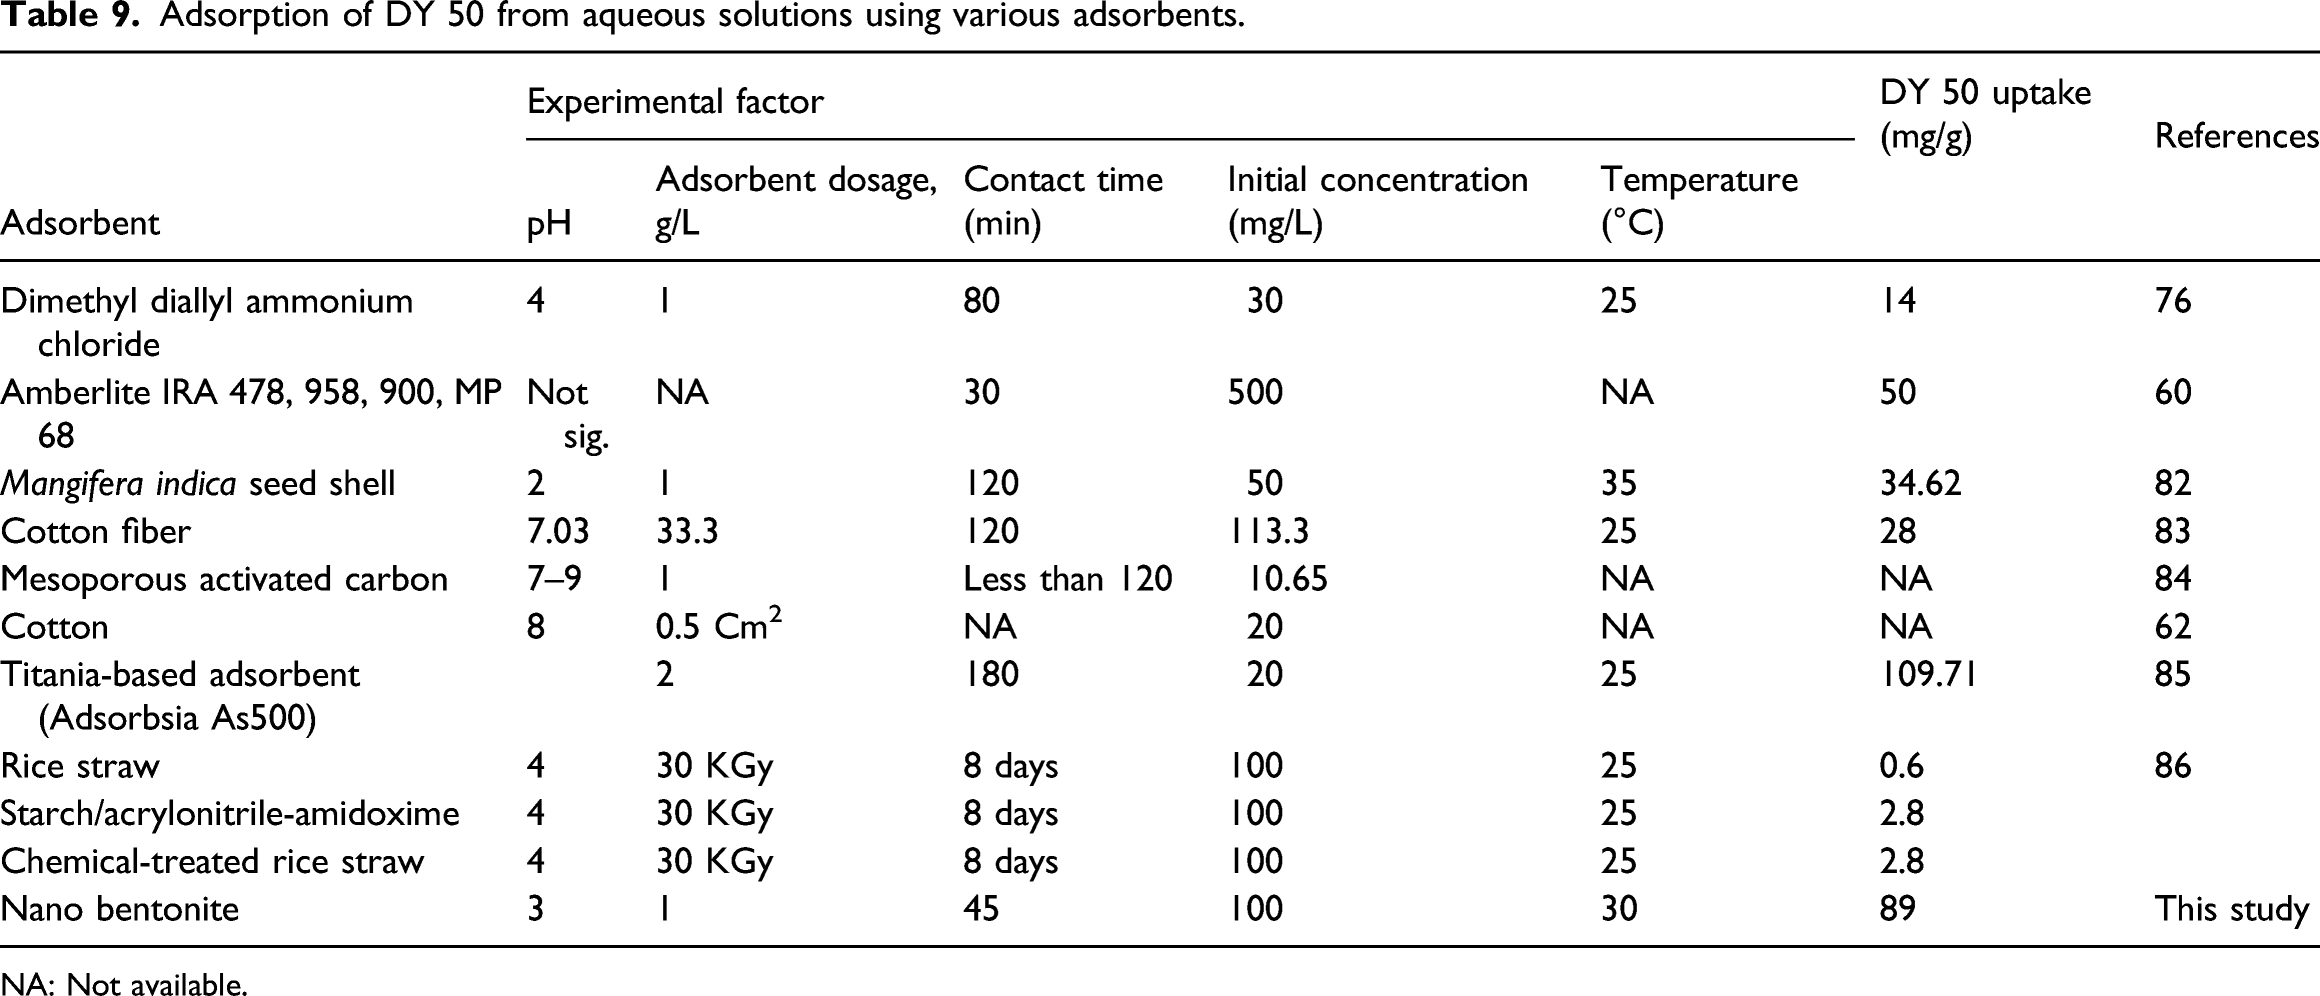
NA: Not available.
Conclusions
This study showed that the nano bentonite was appropriate for the adsorption of DY 50 from aqueous solutions. The prepared nano bentonite was characterized using SEM, EDAX, XRD, XRF, TGA, and FT-IR indicating the formation of nano bentonite with an average size less than 50 nm. The effect of the operating parameter was conducted at different pH (2–10), dose (0.2–1.8 g/L), contact time from 10–360 min, at temperature 20–70°C, and initial DY 50 concentrations from 20–100 mg/L. The removal percentages were 100, 94.6, 89.5, 83.8, and 78.3% for initial concentration 20, 40, 60, 80, and 100 mg/L, respectively. The removal occurred at pH 2, using 1 g from nano bentonite, 45 min from contact time, and 30°C. Adsorption isotherm indicated that the adsorption mechanism was fitted to Freundlich and Koble–Corrigan models with the same lowest error sum of 0.1728 and showing a heterogeneous adsorption mechanism. Kinetic models indicated the adsorption process fitted to Pseudo-Second-Order. Thermodynamic behavior indicating that the adsorption behavior was exothermic with a spontaneous adsorption process. The RSM relations showing significant relations in removal models with a p-value <0.001 and all operating variables are significant except effect of temperature. The ANN results indicated that the most effective operating conditions are the effect of dose followed by the pH effect.
Supplemental Material
Supplemental Material - Effect of nano bentonite on direct yellow 50 dye removal; Adsorption isotherm, kinetic analysis, and thermodynamic behavior
Supplemental Material for Effect of nano bentonite on direct yellow 50 dye removal; Adsorption isotherm, kinetic analysis, and thermodynamic behavior by Ahmed S Mahmoud in Progress in Reaction Kinetics and Mechanism.
Footnotes
Declaration of conflicting interests
The author(s) declared no potential conflicts of interest with respect to the research, authorship, and/or publication of this article.
Funding
The author(s) disclosed receipt of the following financial support for the research, authorship, and/or publication of this article: This study was supported by the Egyptian Housing and Building national Research Center (HBRC) and Nanotechnology Laboratory and Environmental services, Scientific Research Development unit (SRD), Egyptian Russian University (ERU).
Supplemental Material
Supplemental material for this article is available online.
References
Supplementary Material
Please find the following supplemental material available below.
For Open Access articles published under a Creative Commons License, all supplemental material carries the same license as the article it is associated with.
For non-Open Access articles published, all supplemental material carries a non-exclusive license, and permission requests for re-use of supplemental material or any part of supplemental material shall be sent directly to the copyright owner as specified in the copyright notice associated with the article.