
Abstract
A series of APTMS ((3-aminopropyl)trimethoxysilane)-modified silicate MCM-41 adsorbents (x-APTMS/MCM-41, x is the volume of APTMS per 1 g of silicate MCM-41) with different APTMS contents was prepared, and the effects of APTMS content on the desulfurization performance of the APTMS/MCM-41 adsorbents were studied in a fixed adsorption bed using H2S and N2 mixture as a model gas. The as-prepared adsorbents were characterized by X-ray diffraction analysis, N2 adsorption–desorption, Fourier transform infrared spectroscopy, transmission electron microscopy, scanning electron microscopy, and energy-dispersive spectroscopy. The results showed that all the APTMS-modified x-APTMS/MCM-41 adsorbents retained the mesoporous silica structure of MCM-41. The Brunauer–Emmett–Teller-specific surface area of x-APTMS/MCM-41 increased slightly with increasing x at first and then decreased with further increasing APTMS content. The H2S removal performances of x-APTMS/MCM-41 adsorbents decreased in the order 0.6-APTMS/MCM-41 > 0.7-APTMS/MCM-41 > 0.5-APTMS/MCM-41 > 0.4-APTMS/MCM-41 > 0.8-APTMS/MCM-41. At x = 0.6, the maximum H2S removal rate of 54.2% and H2S saturated capacity of 134.4 mg g−1 were observed. The regeneration experiment of 0.6-APTMS/MCM-41 adsorbent after three times regeneration at 423 K for 3 h in nitrogen confirmed that it possessed a good regenerability.
Introduction
H2S and other S-containing chemicals are ubiquitous in natural gas and other industrial hydrocarbon feedstock. 1 H2S is one major noxious industrial gas in the atmosphere. 2 Finding more efficient technologies to remove H2S has been under increasing pressure to mitigate the negative environmental impact of the petrochemical process and utilization of fossil-based resources.3,4 Currently, methods applied to H2S in natural gas are mainly wet and dry desulfurization. Wet desulfurization is also known as the solvent absorption method, in which solvents or solutions are used to absorb H2S and other S-containing chemicals from the mixture gas, for example natural gas and flue gas, etc. According to the mode of absorption, the solvent absorption method can be classified into chemical absorption and physical absorption. Wet desulfurization is used for high H2S concentrations. Despite its large capacity, it still has inevitable disadvantages of large investment and high operational cost.
However, dry desulfurization employs solid adsorbents with less energy consumption and a small footprint aimed at low H2S concentrations. Furthermore, it has an excellent effect.5,6 However, the low adsorption capacity of solid adsorbents requires frequent landfilling of spent adsorbents, which is one of the major environmental concerns. 4 H2S removal favors the development of regenerable solid sorbents in several processes, such as use in small concentration capture technologies for oil and natural gas processing units to avoid the poisoning effect of sulfur on catalysts. Factors such as grain growth, sorbent underutilization due to diffusion-limited gas–solid reaction, mechanical attrition, and formation of thermodynamically stable and non-regenerable side products have been suggested as the leading causes for loss of performance in metal oxide-based adsorbents. 5 For such reasons, we are looking for a way to avoid the occurrence of such limiting factors.
Extensive research has been conducted regarding technological development based on H2S adsorption on molecular sieves,3,4,7–10 zeolites, 11 activated carbon,12,13 clays,14,15 and inert metal oxides.16–18 Each support for H2S removal has been studied with excellent results. As a significant development, with a uniform hole structure, large specific surface area, and beneficial material, MCM-41 (Mobile Composition of Matter No. 41) was discovered in 1992. 19 However, physical adsorption provides the main part in the adsorption of unmodified MCM-41, which is poor in desulfurization. Recently, amine-functionalized solid sorbents were found with great promise for CO2 capture. As reported, organic amines supported on MCM-41 adsorbents showed a much higher desulfurization performance for CO2. 20 The wet impregnation method was proposed and studied experimentally to prepare the amine-functionalized adsorbent. Thus, we planned to impregnate organic amine into MCM-41 for H2S removal. With the grafting method, amine groups were anchored atop MCM-41, forming chemical bonds using (3-aminopropyl)trimethoxysilane (APTMS), 21 which is a silane coupling agent.
In this work, a series of APTMS-modified MCM-41 adsorbents with different APTMS contents was prepared, and the effect of APTMS content on the desulfurization performance of the APTMS/MCM-41 was studied. The main objective was to evaluate the efficiency of amine-modified MCM-41 adsorbents with different APTMS contents for H2S removal.
Experimental
Preparation of adsorbent
The adsorbent was prepared by a reported method.22,23 First, 1 g of calcined MCM-41 (all-silicon, Nankai University Catalyst Factory) was suspended in 30 mL of toluene in a round-bottomed flask, followed by the dropwise and cautious addition of 0.6 mL of organic amine, APTMS (>97%, Aladdin Reagent (Shanghai) Co., Ltd). After 8 h of refluxing, the mixed solution received was centrifuged to separate the objective product from the solvent. The objective product was filtered carefully first with ethanol (Harbin Chemical Reagent Factory) and then with distilled water, followed by drying at room temperature for 12 h. By varying the amount of APTMS from 0.4 to 0.8 mL, we obtained different amine-modified MCM-41 adsorbents, named as x-APTMS/MCM-41 (where x is the volume of APTMS per 1 g of silicate MCM-41, varying from 0.4 to 0.8).
Characterization of adsorbent
The low-angle X-ray diffraction (XRD) analysis of all adsorbents was recorded on a Netherlands Panalytical diffractometer at 40 kV and 30 mA using monochromatized Cu-Kα radiation. The patterns were measured over the 2θ range from 0.5 to 10. The typical physicochemical properties of support and adsorbents were analyzed using a NOVA2000e (Quantachrome Instruments) apparatus. All the adsorbents were outgassed at 180°C until the vacuum pressure was 6 mm Hg. The adsorption isotherms for nitrogen were measured at −196°C (liquid N2). The surface area (SBET) of each adsorbent was calculated from the adsorption isotherm data using the Brunauer–Emmett–Teller (BET) equation at a relative pressure (P/P0) between 0.05 and 0.35. The total pore volume (Vtotal) was assessed from the volume of nitrogen at P/P0 = 0.99. Fourier transform infrared (FTIR) spectra of the adsorbents were recorded on a Bruker Tensor 27 FTIR spectrometer. The spectra were measured at room temperature. Before measurement, the adsorbents needed to be mixed with dried potassium bromide powder and tableted to obtain the test adsorbents. Morphological analysis was carried out using transmission electron microscopy (TEM) on a JEOL 100S microscope at low resolution and on a JEOL 2010 microscope at high resolution. Adsorbents for both TEM analyses were prepared by adding 1 mg of reduced sample to 5 mL of methanol followed by sonication for 10 min. A few drops of suspension were placed on a hollow copper grid coated with a carbon film made in the laboratory. Scanning electron microscope (SEM) images and energy-dispersive spectroscopy (EDS) were obtained on a SIGMA scanning electron microscope instrument (Carl Zeiss AG) in vacuum conditions with an accelerating voltage of 100 V to 30 kV to magnify the sample 2000–10,000 times.
Desulfurization performance tests
Measurements of adsorbent activity were conducted in a fixed-bed reactor. The fixed-bed reactor, which consisted of a quartz glass tube of internal diameter 10 mm and length 300 mm, was positioned vertically in a clam shell furnace; 0.2 g of the prepared adsorbent was loaded into the central region of the reactor. The up and down sides of the adsorbent were filled with quartz sand. The model fuel gas from a feed tank passed through a reducing valve and entered into the reactor at a flow rate of 20 mL min−1. Residual H2S gas in the effluent gas would be absorbed by the liquid in the absorption bottle, and the H2S content of the absorption liquid was determined by iodometry at intervals of 5 min. The saturated H2S capacity and H2S removal rate were calculated according to the concentration of sulfur in the absorption liquid after the experiment.
The saturated H2S capacity is defined as the amount of adsorbed H2S per gram of adsorbent when the H2S concentrations in the effluent and in the initial gas are the same. It can be calculated as follows

where qm is the saturated H2S capacity (mg g−1),
The H2S removal rate

Results and discussion
Adsorbent characterization
Low-angle XRD
The low-angle X-ray patterns (Figure 1) show that x-APTMS/MCM-41 adsorbents with different APTMS contents have one characteristic peak at 2θ of 2.2° attributed to the (100) plane and three peaks with less intensity attributed to the reflections of planes (110) at 3.8°, (200) at 4.4°, and (210) at 5.7°, characteristic of the hexagonal mesoporous structure of MCM-41.24,25 A dispersion peak due to mesoporous silica is evident in the XRD patterns of each of the adsorbents, demonstrating that they retained the mesoporous silica structure. 26 In addition, the diffraction intensity decreased significantly by loadingx-APTMS for all the APTMS/MCM-41 adsorbents. This results possibly because APTMS molecules can enter pores during modification, which causes structure collapse and thereby reduces the diffraction intensity. 27 The crystallographic parameters for MCM-41 calculated using the Debye–Scherrer and other equations from XRD applied to the (100) reflection are given in Table 1. Also, the reflection position migrated to lower angle (or higher d-value), indicating the expansion of unit cell parameter resulting from the introduction of the complexes within the MCM-41 pores. However, when a small amount of APTMS was introduced into the framework of MCM-41, the intensities of the XRD patterns were gradually weakened, suggesting the mesoporous structure of MCM-41 was nearly unchanged upon the APTMS loading, but the long-range order was weakened considerably.28,29 As more molecules could enter the pores after modification, the structures collapsed rapidly, and the diffraction intensity decreased.
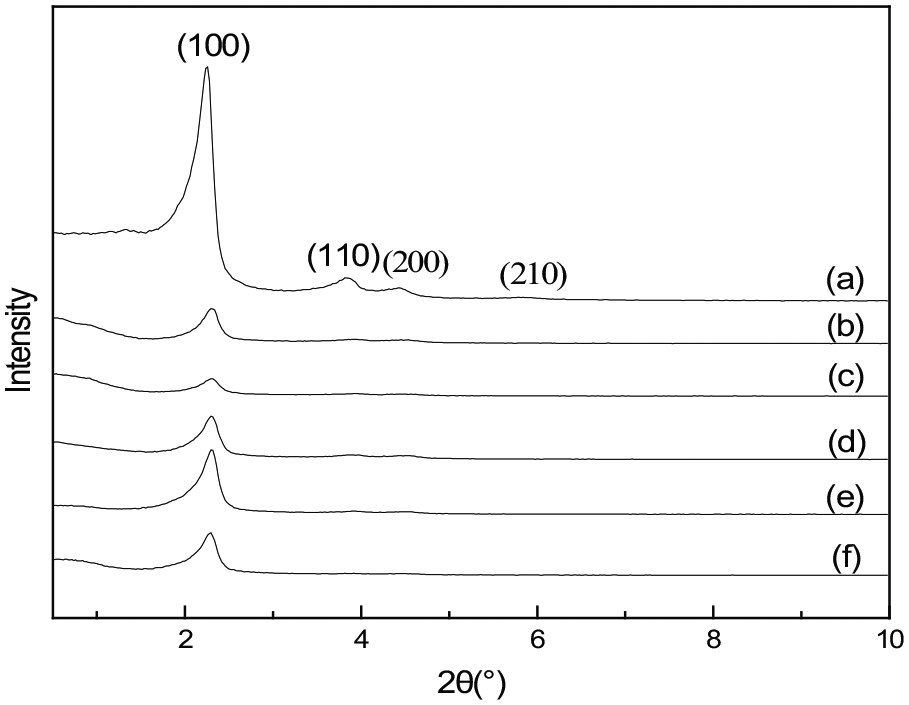
Low-angle X-ray diffraction patterns of x-APTMS/MCM-41 with x = (a) 0 (bare MCM-41), (b) 0.4, (c) 0.5, (d) 0.6, (e) 0.7, and (f) 0.8.
Structural parameters of x-APTMS/MCM-41 with x = 0 (bare MCM-41), 0.4, 0.5, 0.6, 0.7, and 0.8.
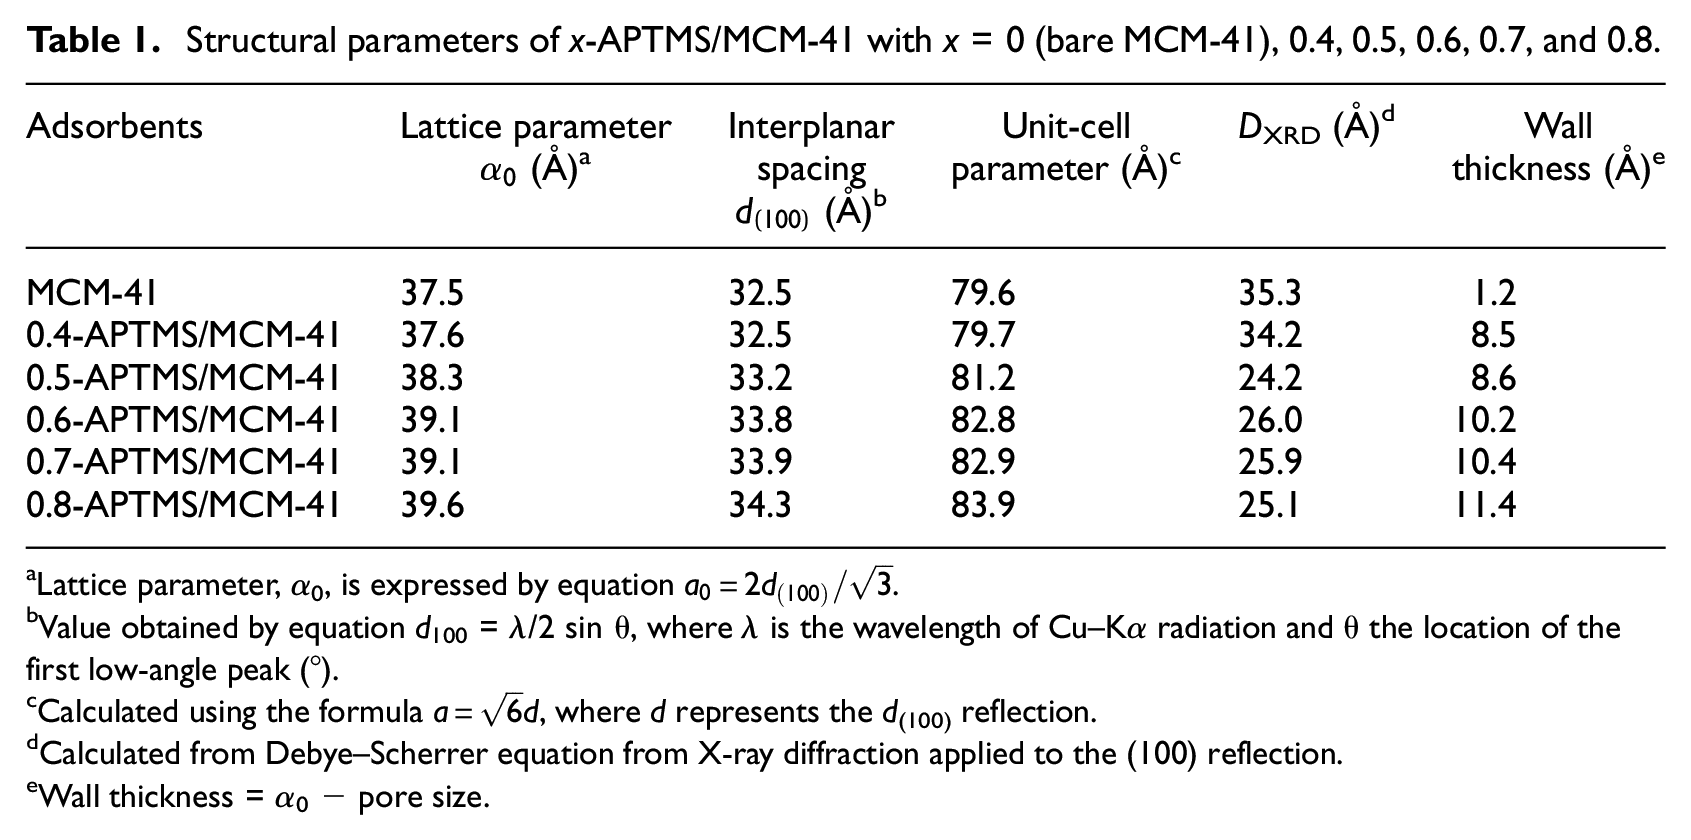
Lattice parameter, α0, is expressed by equation
Value obtained by equation d100 = λ/2 sin θ, where λ is the wavelength of Cu–Kα radiation and θ the location of the first low-angle peak (°).
Calculated using the formula
Calculated from Debye–Scherrer equation from X-ray diffraction applied to the (100) reflection.
Wall thickness = α0 − pore size.
Nitrogen adsorption–desorption isotherms
Figure 2 shows the N2 adsorption–desorption isotherms and Barrett–Joyner–Halenda (BJH) pore size distributions of MCM-41 and adsorbents with different APTMS contents, and Table 2 lists the textural data of the adsorbents. On the basis of IUPAC classification, all adsorbents display type IV adsorption isotherms 30 with hysteresis loops. The results indicated that the organized network of MCM-41 was preserved in x-APTMS/MCM-41 adsorbents with different APTMS contents, which is in accordance with the XRD results (Figure 1). The H1-type hysteresis loop at P/P0 > 0.9 is due to N2 condensation and evaporation with interparticles.23,28 The nitrogen adsorption increases linearly at relatively low relative pressures due to monolayer adsorption before the steep nitrogen uptake inside the mesopores. Accordingly, micropore filling occurred at low relative pressure, while a sharp pore condensation stage was observed at higher pressures in the extended multilayer zone. The steep gas uptake is due to the capillary condensation of nitrogen inside the mesopores, implying that MCM-41 has a narrow pore size distribution. This observation is consistent with the XRD experiments.
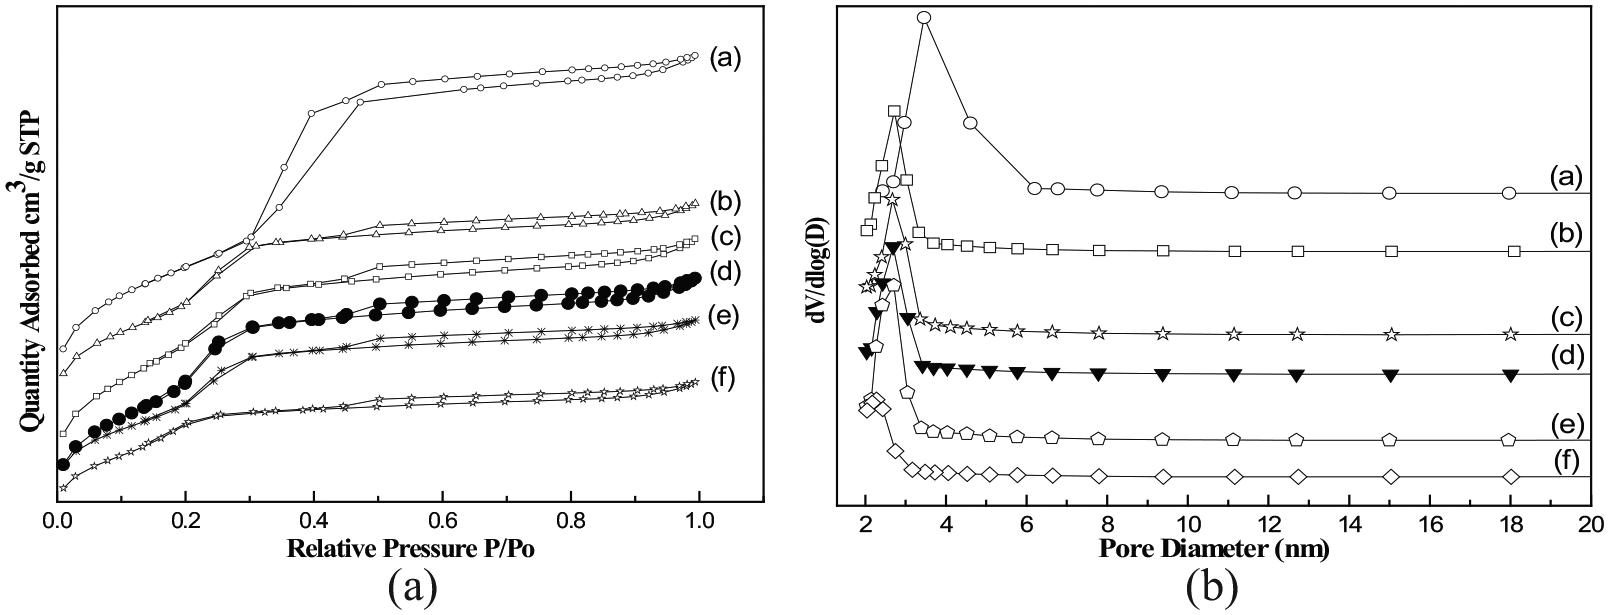
Nitrogen adsorption–desorption isotherms and BJH pore size distribution curves of x-APTMS/MCM-41 with x = (a) 0 (bare MCM-41), (b) 0.4, (c) 0.5, (d) 0.6, (e) 0.7, and (f) 0.8.
Surface properties of x-APTMS/MCM-41 with x = 0 (bare MCM-41), 0.4, 0.5, 0.6, 0.7, and 0.8.
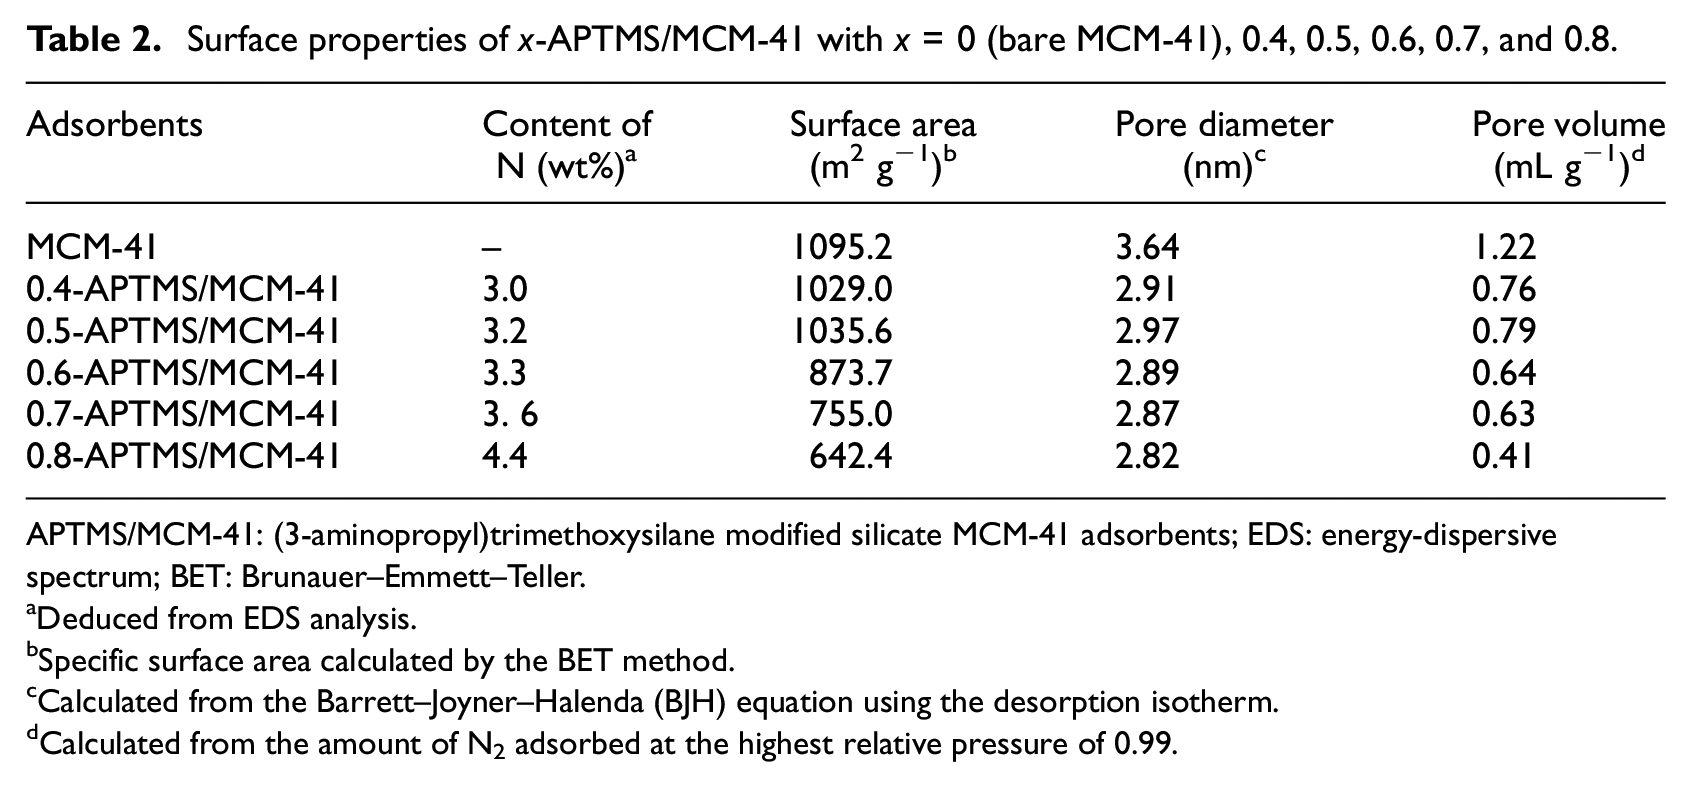
APTMS/MCM-41: (3-aminopropyl)trimethoxysilane modified silicate MCM-41 adsorbents; EDS: energy-dispersive spectrum; BET: Brunauer–Emmett–Teller.
Deduced from EDS analysis.
Specific surface area calculated by the BET method.
Calculated from the Barrett–Joyner–Halenda (BJH) equation using the desorption isotherm.
Calculated from the amount of N2 adsorbed at the highest relative pressure of 0.99.
The BJH pore size distribution of all adsorbents in Figure 2 was mainly in the range 2–6 nm, which indicates that each adsorbent has excellent mesoporous ordering and a narrow pore size distribution. The bare MCM-41 had a high specific surface area (1095.2 m2 g−1) and a pore volume up to 1.22 mL g−1. The BET-specific surface area (SBET) increased slightly on increasing x from 0.4 to 0.5 and then decreased with further increasing APTMS content. At low APTMS content, increasing APTMS content means more APTMS deposited on the external surface, which would somehow increase the surface area. However, with further increase of the APTMS content, the external surface tends to be saturated and more APTMS would enter the pores of the mesoporous MCM-41, which caused the blockage of the pores and therefore led to the decrease in surface area. 28 This was evidenced by the decrease in pore size on increasing the APTMS content. The total pore volume and pore diameter of the adsorbents changed in the same trend as the surface area. This also indicates that the surface generated by APTMS is negligible. The important losses of both SBET and Vtotal observed for 0.6-APTMS/MCM-41 could be attributed to a pore blocking of the reaction products due to the high loading of APTMS (Table 2).
FTIR analysis
The FTIR spectra of MCM-41 and adsorbents with different APTMS contents are shown in Figure 3. The FTIR spectra of all adsorbents were similar and featured the absorbance peaks at the same wavelengths, indicating that the types of functional groups were not changed for all the x-APTMS/MCM-41 adsorbents. The bands at ν = 1063 and 808 cm−1 can be ascribed to asymmetric and symmetric stretching vibrations of Si−O−Si.31,32 The absorption band at 1634 cm−1 is attributed to the bending vibration of H–O–H in water. An N–H bending vibration near 690 cm−1 and an –NH2 symmetric bending vibration at 1532 cm−1 were observed in the APTMS-modified MCM-41 with different APTMS content, indicating the organic amine was successfully grafted onto the surface of MCM-41.33,34 The broad band at 3100–3600 cm−1 is attributed to the adsorbed water molecules. APTMS/MCM-41 showed a typical peak at 2935 cm−1 corresponding to the asymmetric vibration of –CH2 in the propyl chain of the silylating agent. 35
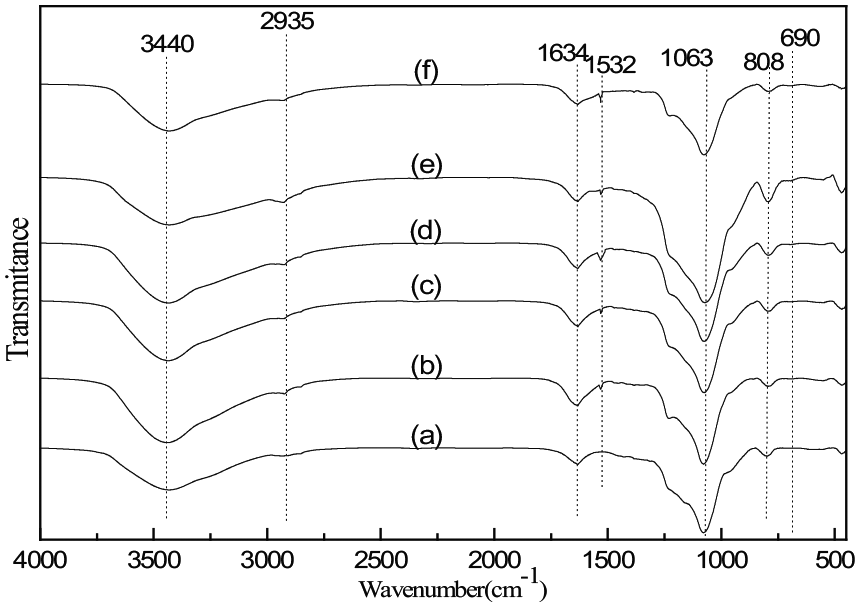
FTIR spectra of x-APTMS/MCM-41 with x = (a) 0 (bare MCM-41), (b) 0.4, (c) 0.5, (d) 0.6, (e) 0.7, and (f) 0.8.
TEM
The morphologies and particle sizes of MCM-41 and 0.6-APTMS/MCM-41 adsorbents can be seen in the TEM images of Figure 4. Figure 4 shows evidence of hexagonal structure on the MCM-41 and APTMS/MCM-41. The TEM image of MCM-41 shows the very rational and orderly channels observed on its surface (Figure 4(a)), with a pore diameter of about 3 nm. The TEM observation is consistent with the results reported for the XRD. Figure 4(b)–(d) clearly shows that the APTMS particles are uniformly distributed on the MCM-41 support. However, the APTMS particles are larger than the average pore diameter of MCM-41. The APTMS particles appear either on the external surface walls of the pores or inside the pores of APTMS, indicating strong interactions were formed between APTMS and MCM-41.
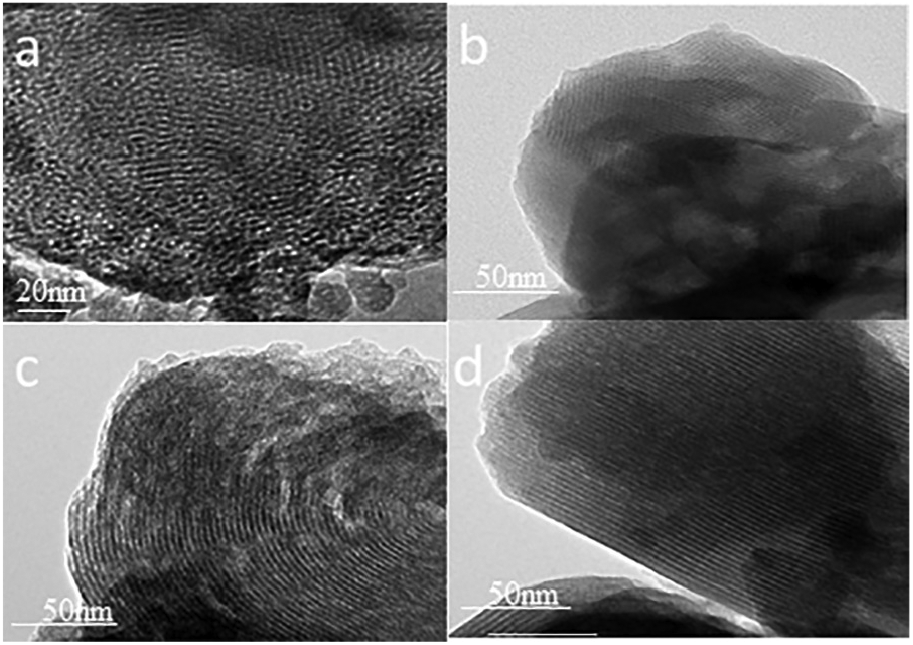
TEM analysis of (a) MCM-41 and (b, c, and d) 0.6-APTMS/MCM-41.
Scanning electron microscopy and EDS
Figure 5 shows the SEM diagrams of MCM-41 and 0.6-APTMS/MCM-41. The SEM images show various particle shapes and sizes. Figure 5(a) and (b) shows that the surface of MCM-41 is relatively smooth with different sizes and relatively sparse channels. The particles of 0.6-APTMS/MCM-41 are somehow worm-like (Figure 5(c) and (d)). A significant difference exists between MCM-41 and 0.6-APTMS/MCM-41, indicating that the surface properties have changed after modification with APTMS. APTMS is uniformly distributed over MCM-41, but an agglomeration of APTMS was observed. The surface channel distribution of MCM-41 is dense, and the holes are filled with active component, and during the loading pore-forming was completed, although the channels increase, enlarging the pore volumes. This result is consistent with the results of BET analysis.
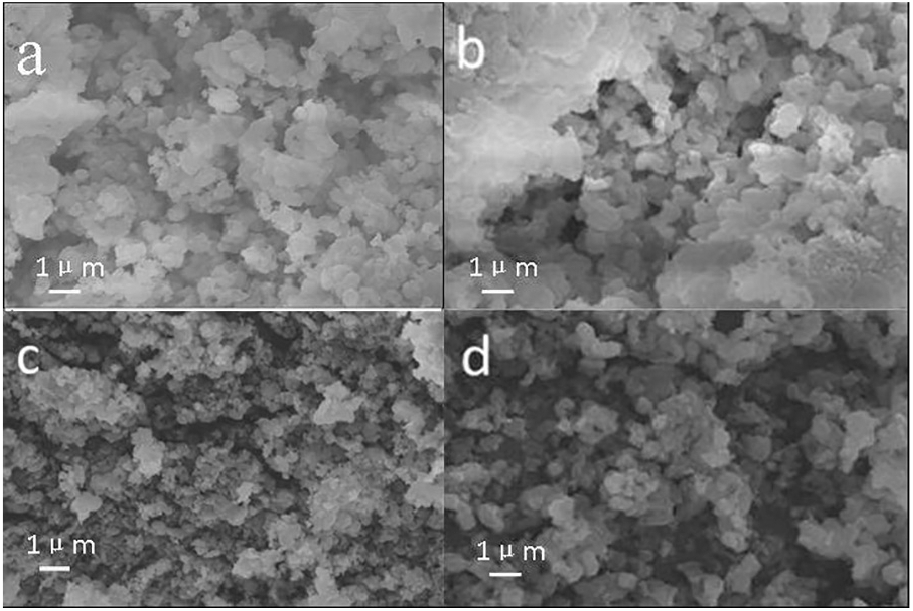
SEM analysis of (a and b) MCM-41 and (c and d) 0.6-APTMS/MCM-41.
EDS can quickly provide qualitative and quantitative analyses for all the elements in the micro-region Be-U of materials. The percentages of C, Si, and N were calculated from EDS (Figure 6 and Table 3). Theoretically, the C/N ratios for complete ethoxy group hydrolysis and 0.6 mL amine are 3 and 5.28, respectively, which indicates a complete hydrolysis of ethoxy groups. The C/N ratio of the adsorbents increases with APTMS content, and it is above 3 for adsorbents containing >0.6 mL amine. This may be explained by the presence of some unhydrolyzed ethoxy groups in the adsorbent. 36 The corresponding elemental mapping is shown in Figure 6(b), from which the approximate quantity of the element can be seen.
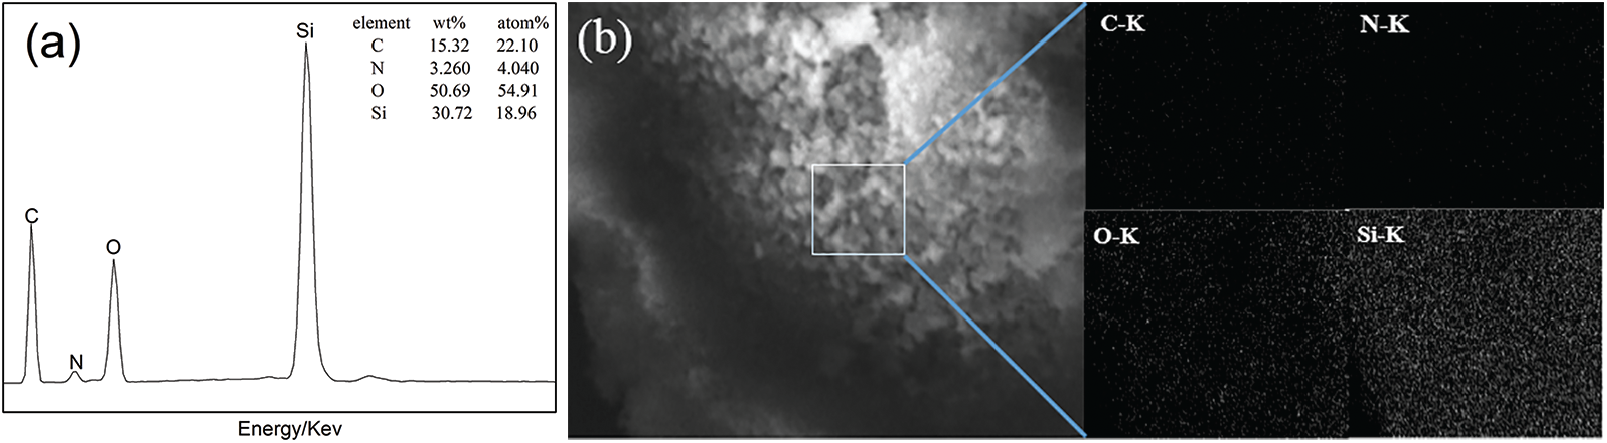
(a) EDS spectrum and (b) corresponding elemental mapping of 0.6-APTMS/MCM-41 adsorbent.
EDS analyses and C/N ratio observed.
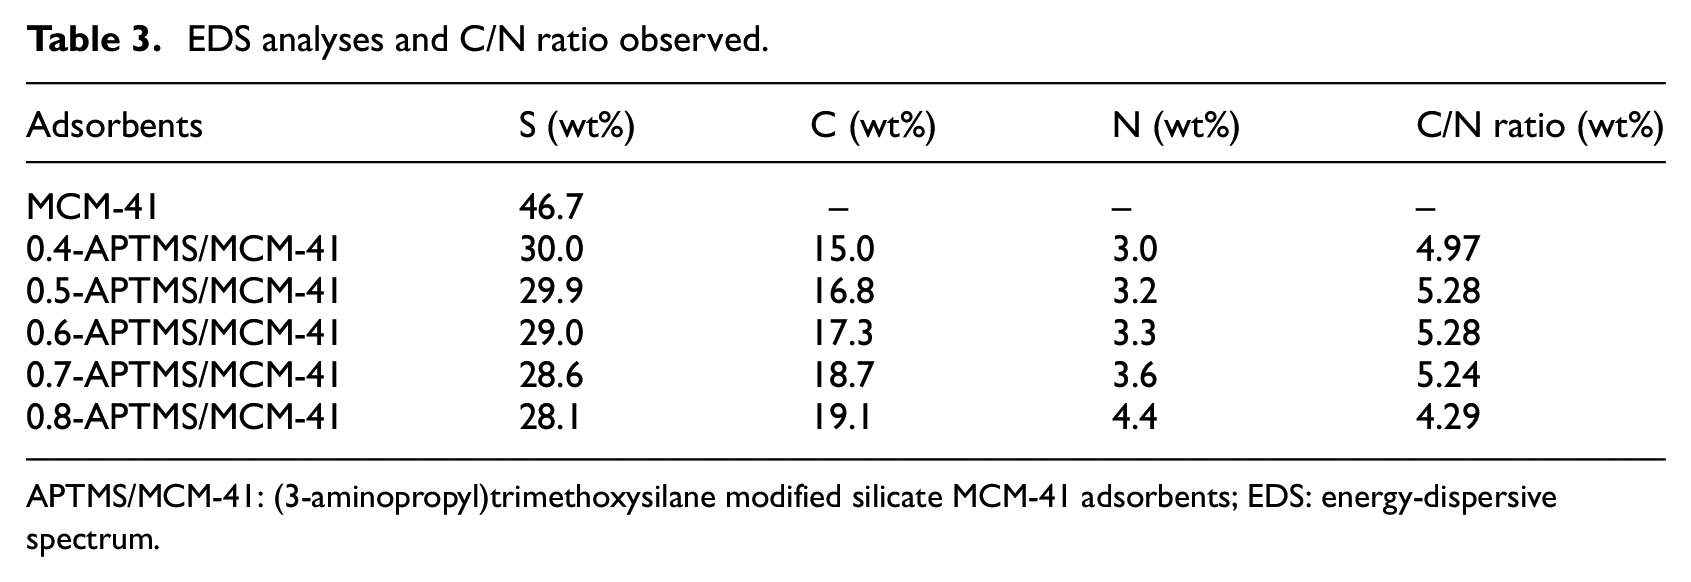
APTMS/MCM-41: (3-aminopropyl)trimethoxysilane modified silicate MCM-41 adsorbents; EDS: energy-dispersive spectrum.
Mechanism of adsorbent formation
The organosilane was distributed more evenly on the silica surfaces in the case of sufficient blending in a constant-temperature oil bath. The high activity of the MCM-41 adsorbent was due to the presence of alkoxy anions in the pore cavity. Some possible mechanisms underlying the trend of reactivity are illustrated in Scheme 1. There are three possibilities for the connection of APTMS to MCM-41. However, the band for –OCH3 was evident in the FTIR spectra (Figure 3). Thus, the second possible mechanism may be appropriate for the formation of the adsorbent. This result accords with those of Titinchi and co-workers. 37
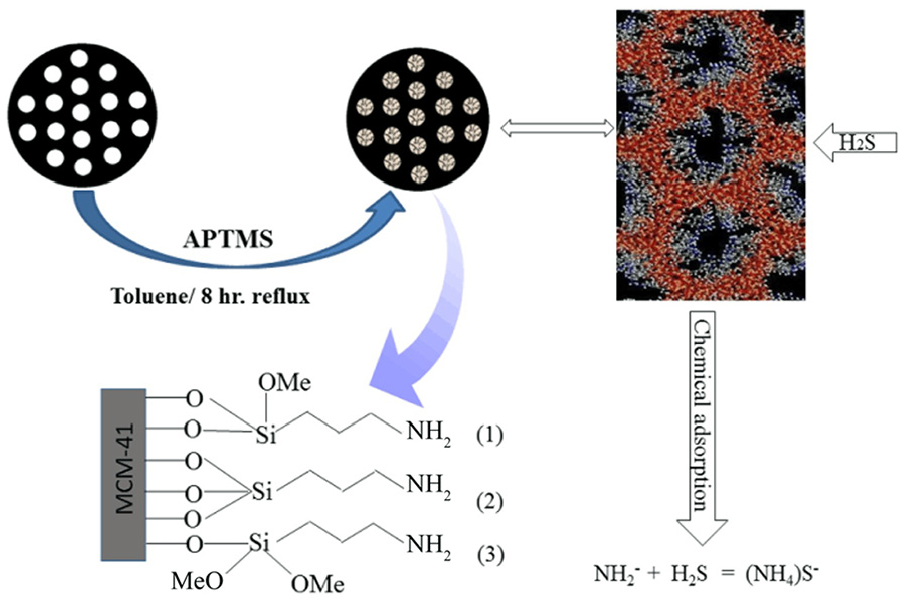
Possible mechanism of formation of APTMS/MCM-41 adsorbent.
Desulfurization performance of adsorbent
All of the adsorbents were evaluated at room temperature (298.15 K) at a gas flow rate of 20 mL min−1 in a fixed-bed reactor. The results are shown in Figure 7 and Table 4. The H2S removal performances of the adsorbents were improved significantly after modification by different APTMS contents over MCM-41. The H2S removal performance first increased and then decreased with increasing APTMS content, and the best H2S removal performance originated from 0.6-APTMS/MCM-41. This is because, at low APTMS content, fewer active sites were formed on MCM-41, which would lead to poor H2S removal performance of the adsorbent. However, excessive loading of APTMS would reduce the surface area by blocking pores and active sites of the adsorbent, which would decrease H2S removal performance of the adsorbent. The desulfurization performances of the adsorbents decreased in the order 0.6-APTMS/MCM-41 > 0.7-APTMS/MCM-41 > 0.5-APTMS/MCM-41 > 0.4-APTMS/MCM-41 > 0.8-APTMS/MCM-41. For 0.6-APTMS/MCM-41, its desulfurization performance with saturated adsorption time of 186 min was higher than that with all of the other modified adsorbents. The saturated H2S capacity and H2S removal rate maximized to 134.4 mg g−1 and 54.2%, respectively, at an APTMS content of 0.6 mL (for 1 g of MCM-41).
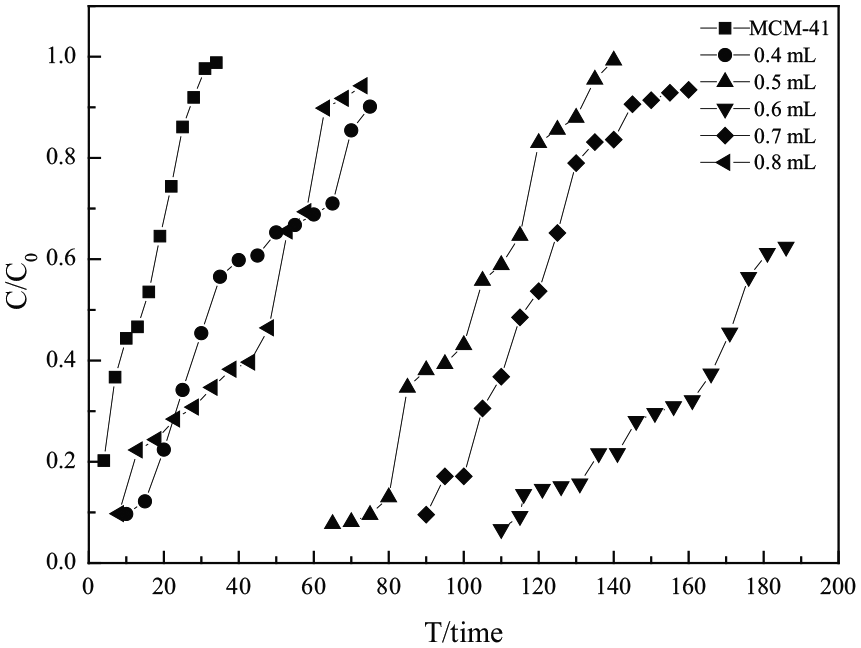
Breakthrough curves of x-APTMS/MCM-41 adsorbents with x = 0.0, 0.4, 0.5, 0.6, 0.7, and 0.8.
Desulfurization performance of x-APTMS/MCM-41 adsorbents with x = 0.0, 0.4, 0.5, 0.6, 0.7, 0.8.
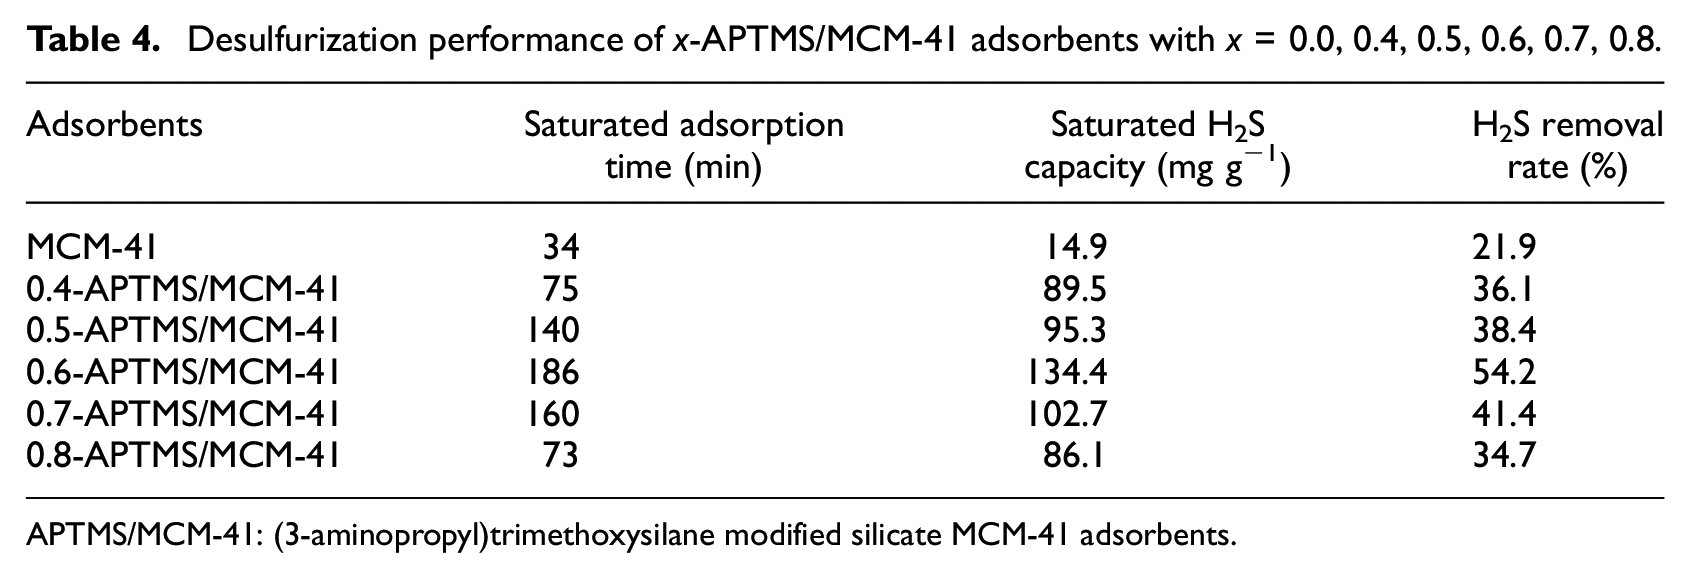
APTMS/MCM-41: (3-aminopropyl)trimethoxysilane modified silicate MCM-41 adsorbents.
Regeneration of adsorbent
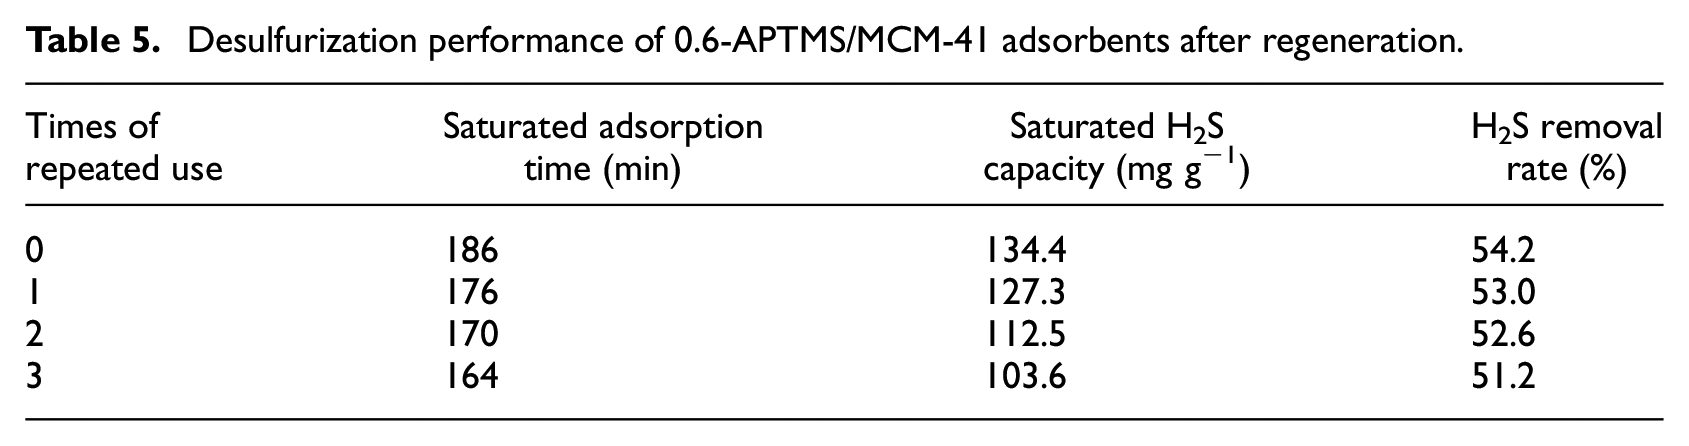
Regeneration experiments were also performed in the fixed-bed reactor. The adsorbent was purged in a flowing nitrogen gas and heated to 423K at a rate of 3 K min-1. Regeneration was then achieved by maintaining it at 423 K for 5 h in nitrogen. The breakthrough curves of the 0.6-APTMS/MCM-41 adsorbent after regeneration are shown in Figure 8 and the data are given in Table 5. The saturated H2S capacity for 0.6-APTMS/MCM-41 after the third regeneration decreased from 134.4 to 103.6 mg g−1. The recovered saturated H2S capacity of 103.6 mg g−1 for 0.6-APTMS/MCM-41 after the third regeneration was still much higher than that of MCM-41, showing that the 0.6-APTMS/MCM-41 possessed a good regenerability.
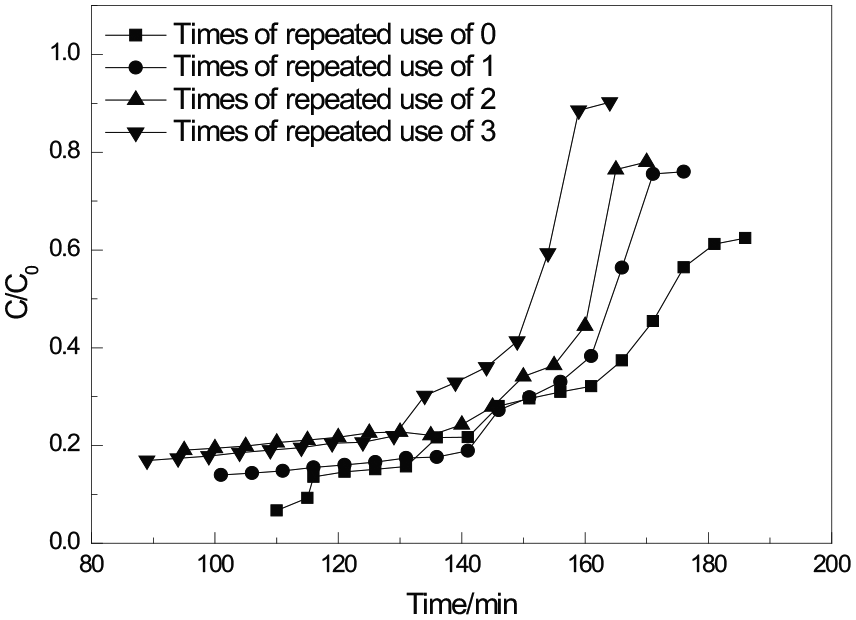
Breakthrough curves of 0.6-APTMS/MCM-41 adsorbents after regeneration.
Desulfurization performance of 0.6-APTMS/MCM-41 adsorbents after regeneration.
Conclusions
A series of APTMS-modified MCM-41 adsorbents with different APTMS contents was successfully prepared. XRD analysis demonstrated that all the APTMS-modified x-APTMS/MCM-41 adsorbents retaining the mesoporous silica structure of MCM-41. The expansion of the unit cell parameter resulting from the introduction of the APTMS within the MCM-41 pores was also observed. The BET-specific surface area of x-APTMS/MCM-41 increased slightly on increasing x from 0.4 to 0.5 and then decreased with further increasing APTMS content. All the x-APTMS/MCM-41 adsorbents exhibited a decrease in surface area accompanied with decrease in pore size owing to the entering of APTMS in to the pore channels of MCM-41. The fixed-bed adsorption desulfurization experiments showed that the H2S removal was improved significantly after modification with APTMS. The H2S removal performance first increased and then decreased with increasing APTMS content. The best H2S removal performance originated from 0.6-APTMS/MCM-41. The saturated adsorption time was 186 min with total gas volume of 3720 mL, and the maximum saturated H2S capacity and H2S removal rate reached 134.4 mg g−1 and 54.2%. The experimental results of 0.6-APTMS/MCM-41 adsorbent after three times of regeneration confirmed that it possessed a good regenerability.
Footnotes
Declaration of conflicting interests
The author(s) declared no potential conflicts of interest with respect to the research, authorship, and/or publication of this article.
Funding
This research was supported by the Mentoring Project of China Petroleum and Chemical Industry Federation (2016-09-27) and the Natural Science Foundation of Heilongjiang Province (QC2017005).