
Abstract
Previous hydrogen researchers have demonstrated the great potential of hydrogen as a zero-carbon fuel and its wider operational ability to directly replace the existing fossil-fuelled internal combustion engines (ICE). Hydrogen direct-injection technology can operate at stoichiometric combustion conditions, fully eliminating the intake backfire phenomena, which has the benefit of low airflow requirements and is a suitable solution for naturally aspirated ICE platforms. However, significant challenges must be addressed when operating an H2 ICE at or near stoichiometric. These include rapid pressure rise rate, high in-cylinder gas pressure and temperature and the consequential higher engine-out NOx emissions. This study provides a comprehensive experimental analysis of the effect of water injection on a light-duty H2 engine’s performance, efficiency, burn durations and NOx emission. The engine was modified to operate with hydrogen via a centrally-mounted direct H2 injector and an intake port-mounted water injection system. The study included water vapour measurements, NOx concentrations and other exhaust gases. The practical implications of these findings are significant. The results demonstrated that the NOx emissions were reduced by 79% when the water was injected at a rate of 5 kg/h at 10 bar IMEP and 2000 rpm. This reduction in emissions, coupled with the observed decrease in cylinder pressure and the rate of pressure rise, could substantially improve engine performance and efficiency. At higher load regions, the water injection extended the maximum engine load to 24 bar IMEP and increased the engine torque output by 10%. The maximum Indicated Thermal Efficiency (ITE) increased from 41% at 16.5 bar IMEP to 42.5% at 18 bar IMEP at a lower lambda, with a corresponding reduction in the intake-air-boost pressure requirement. Of particular note, the use of water injection decreased the engine-out NOx emissions under high-load conditions by more than 55%, even at richer AFR compared to pure hydrogen operation.
Introduction
As global efforts intensify to combat climate change and reduce greenhouse gas emissions, the transport and off-grid power generation industries face increasing pressure to develop cleaner and more efficient propulsion technologies. Hydrogen, with its high gravimetric energy density and zero-carbon content, has emerged as a promising alternative fuel for internal combustion engines (ICEs). 1 Unlike conventional hydrocarbon fuels, pure hydrogen combustion produces only water vapour, eliminating carbon dioxide (CO2), carbon monoxide (CO), hydrocarbons (HC), and particulate matter (PM) emissions. This makes hydrogen an attractive solution for achieving significant reductions in vehicular emissions and contributing to a more sustainable transportation sector. 2 Hydrogen’s role in reducing carbon emissions extends beyond its application in ICEs. As part of a broader energy strategy, hydrogen can be produced from renewable sources, such as water electrolysis using wind or solar power, leading to a truly sustainable and carbon-neutral fuel cycle. The integration of hydrogen as a primary fuel in transportation and power generation systems can significantly contribute to global efforts to mitigate climate change and reduce dependency on fossil fuels. Production of Hydrogen using renewable electricity can also perform an important role as an energy storage vector, helping to even out inherently dynamic renewable electricity production and consumption profiles.
Hydrogen’s unique thermochemical characteristics present both opportunities and challenges for its use in ICEs. As the lightest molecule, hydrogen exists in a gaseous state, resulting in a lower density compared to liquid fossil fuels. 3 This necessitates a larger volume of hydrogen to store an equivalent amount of energy. Hydrogen’s high diffusivity facilitates rapid mixing yet poses challenges for injector sealing.4,5 Its viscosity, one to two orders lower than conventional fossil fuels, complicates efforts to reduce friction and dampen the injector needle. 6 However, hydrogen’s faster-burning velocity and wide flammability range enhance stable combustion across a wide range of air-to-fuel ratios, reducing concerns about partial burning and misfire.7–9 This characteristic improves overall efficiency and enables near-zero NOx emissions through ultra-lean-burn combustion. 9
Despite these advantages, hydrogen’s low ignition energy increases the risk of pre-ignition or backfire.10,11 Additionally, hydrogen leakage into the crankcase can lead to risk of ignition. A potential solution is to minimize blowby to keep hydrogen concentrations below the flammability limit, which can be achieved through improved ring pack designs and additional crankcase air scavenging to dilute the mixture. 10 Hydrogen’s high laminar flame speed, while beneficial for rapid combustion, can lead to high peak cylinder pressures and rapid pressure rise rates during high-load operations.12,13 When used in ICEs, hydrogen has been shown to demonstrate superior efficiency, combustion stability, and ultra-low NOx emission due to its lean-burn capabilities when compared to any other fossil fuels.14–17 As a non-toxic and carbon-free gas, hydrogen eliminates emissions of unburned hydrocarbons and carbon oxides, significantly reducing pollution from ICEs. 18
Water injection (WI) technology offers a promising solution to the challenges posed by hydrogen combustion in ICEs. 2 By introducing water into the combustion chamber, the water increased the specific heat capacity of the charge and absorbs heat as it vaporizes, leading to lower peak combustion temperatures. This cooling effect can mitigate NOx formation, reduce the risk of knock, and enhance overall engine efficiency. 19 Water injection (WI) technology can be categorized based on installation positions and methods: intake injection before or after the turbocharger, fuel-water emulsions injection, and in-cylinder direct water injection (DWI). 20 Each method affects engine performance differently and requires distinct structural configurations. Compared to other methods DWI offers precise control over injection timing and mass, yielding better cooling and volumetric efficiency.21,22
Recent studies have underscored the benefits of water injection in various hydrogen-fuelled engine configurations. Xu et al. 23 examined the impact of direct water injection on a hydrogen-fuelled spark ignition engine, demonstrating significant reductions in NOx emissions and improvements in indicated thermal efficiency across different excess air ratios and ignition timings. Their findings highlighted the potential of water injection to optimize combustion characteristics and emission profiles in hydrogen-fuelled engines. Similarly, Boretti 24 explored multiple water injection strategies, including intake port water injection (IPWI), direct water injection (DWI), and exhaust manifold water injection (EMWI), in a high-boost, high-compression-ratio, turbocharged hydrogen internal combustion engine. The study revealed that IPWI effectively reduces the intake air temperature and the temperature of the charge within the cylinder, while EMWI is more effective at lowering the exhaust gas temperature at the turbine inlet. DWI was found to have variable effects depending on the timing and amount of water injected, influencing both in-cylinder temperatures and turbine inlet temperatures. These strategies collectively contribute to enhanced engine performance and reduced thermal stress on engine components. Moreover, Mortimer et al. 25 provided experimental and numerical insights into a hydrogen-fuelled, direct-injected spark-ignition engine with water injection, demonstrating that the technique can extend the knock limits, enable higher compression ratios, and subsequently improve engine performance while maintaining low emission levels. This aligns with the findings of Shi et al., 26 who reported substantial decreases in NOx emissions with increased water injection rates, without compromising thermal efficiency.
This study aims to advance the understanding and application of WI in hydrogen ICEs, by a comprehensive analysis of the effects of water injection across a wider range of operating conditions in a boosted spark-ignition (SI) engine than the previous studies. It identifies the optimal water injection quantity within a broad lambda operating range and explores the potential for achieving higher indicated mean effective pressure (IMEP) with water injection. Additionally, this study uniquely measures steady-state and ultra-fast emissions, hydrogen slip, and engine-out water quantity under different operating conditions. By systematically analysing these parameters, this work seeks to provide a comprehensive framework for optimizing hydrogen combustion engine operations, potentially setting a new standard for sustainable and efficient automotive technologies. This comprehensive approach enables engineers and researchers to better understand the dynamics of hydrogen combustion with water injection, facilitating the development of next-generation hydrogen engines that are both sustainable and efficient.
Experimental setup
The experimental engine testing facility for hydrogen requires significant modifications to the fuel supply and engine test-cell. The proper operation of engines in a test-cell using hydrogen necessitates a safe, long-term, and permanent location for storing hydrogen bottles outside the test cell in a secure space without a ceiling and surrounded by fire shields. Furthermore, all supply line accessories, including pressure regulators, flow metres, and shutdown valves, are also installed outside the test cell. This approach significantly minimizes the potential risk of leakage within the test cell by reducing the number of connections. The engine test cell has an additional ATEx ventilation system with a flexible hood placed directly above the engine, preventing any hydrogen built-up in the room. Besides, the engine test cell has hydrogen sensors linked to an automated shutdown Programmable Logic Controller (PLC) system. This system is designed to respond automatically by interrupting the hydrogen supply line and purging the line with nitrogen if any hydrogen sensors detect levels exceeding 3%. The automated shutdown PLC can also be activated by a thermal fuse in the engine intake in case of backfire during H2 Port Fuel Injection (PFI) operations. This automated shutdown is also linked to a hydrogen sensor that detects the potential accumulation of hydrogen in the crankcase ventilation system. A double pipe installation, for the main injector Hydrogen feed, with an integrated nitrogen purging system, ensures that any leaked hydrogen remains uncontaminated within the test cell environment. A pressure sensor is connected to the PLC to facilitate this process, activating a purging nitrogen system.
Engine setup
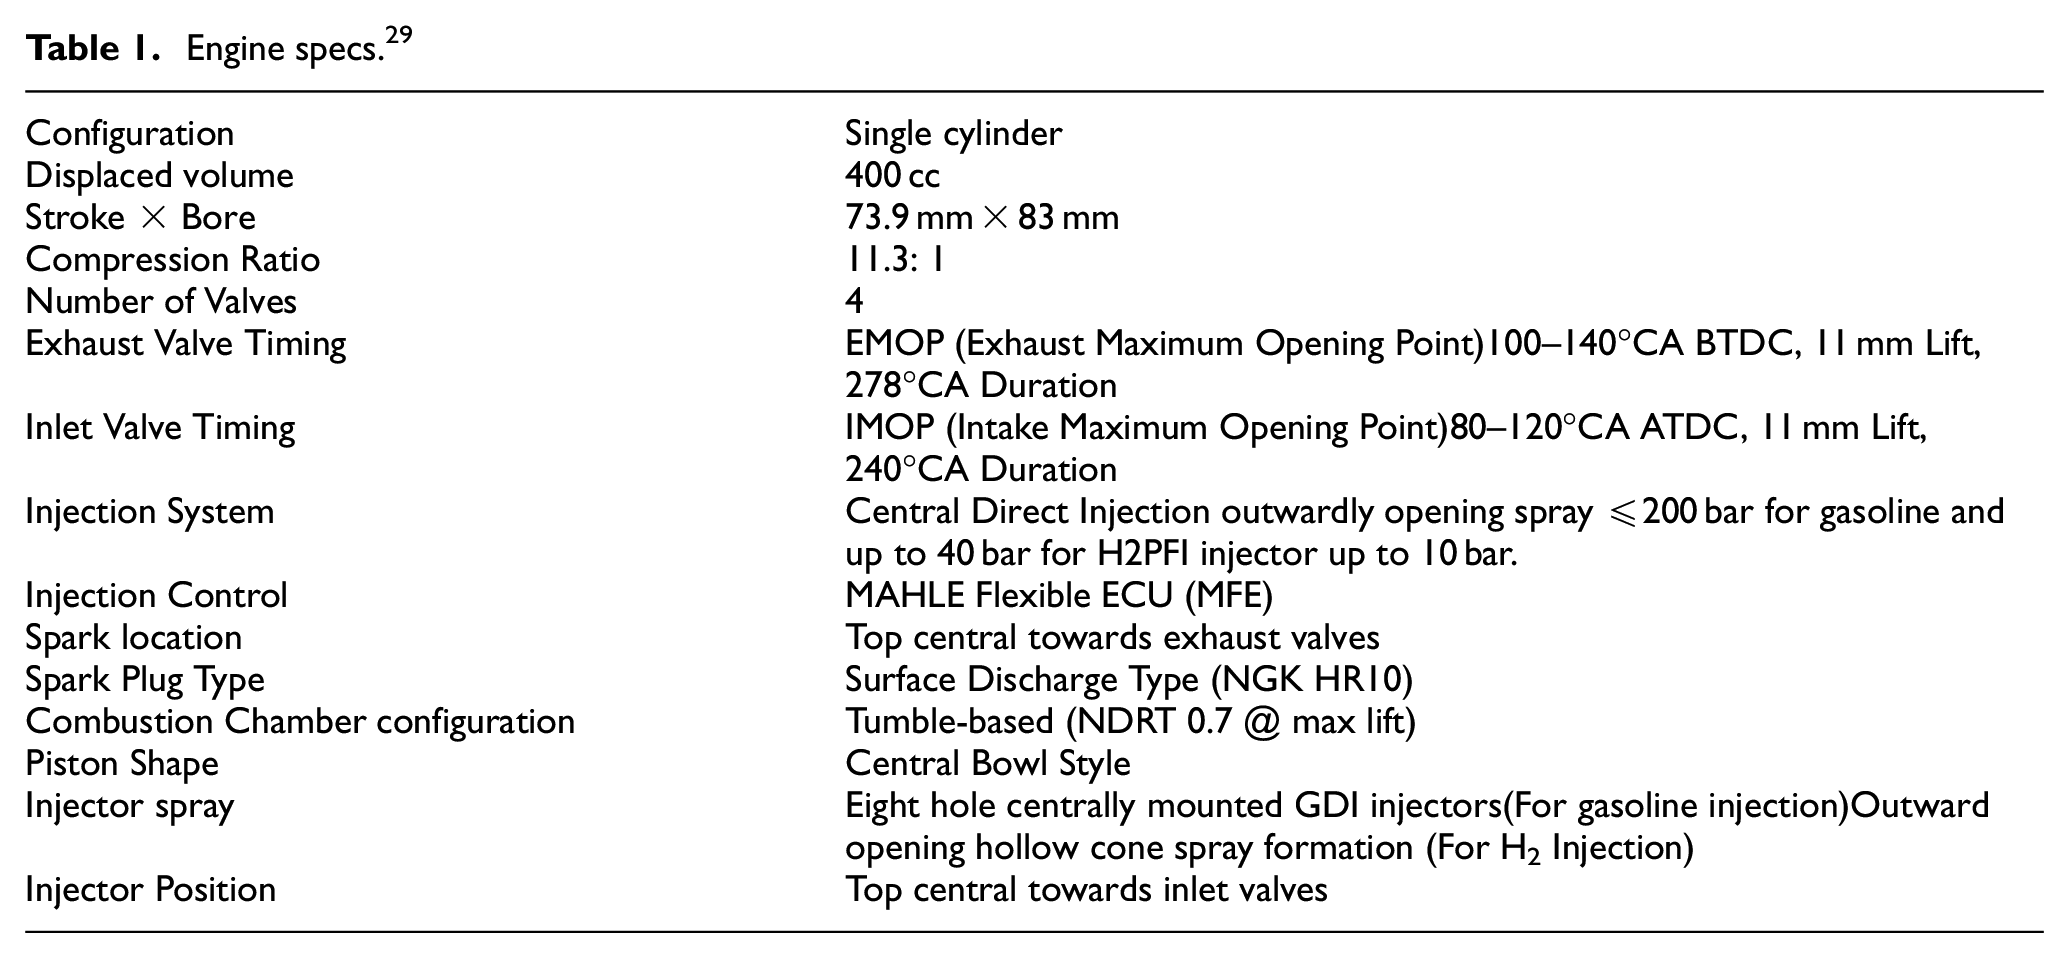
This study was carried out on a SI single-cylinder engine based on MAHLE Powertrain’s highly downsized 3-cylinder engine. The engine can be operated with both port fuel injection and direct hydrogen injection with either a centrally mounted or sided mounted injector. By means of MAHLE Powertrain’s own adaptable electronic control unit (ECU), the enigne can be operated with either gasoline or hydrogen without significant control system adjustments. The DI-CHG10 injector from Phinia was utilized for H2 engine operation, capable of hydrogen injection from 2 to 10 bar in the PFI system and 10–40 bar in the DI system. To ensure safety, a forced ventilation system with a hydrogen sensor was implemented in the crankcase ventilation system, which automatically reduces the hydrogen supply if the hydrogen concentration exceeds 3%. The engine is also equipped with fully variable valve timing (VVT) on both intake and exhaust camshafts, enabling flexibility in determining the optimal overlap configuration for each injection system. The ECU allows adjustment of the injection time and pressure, providing the ability to modify the start or end of the injection process as needed. The engine intake air is supplied by an external compressor and regulated by an external proportional integral derivative (PID) pressure controller and an air heater, both accurately controlling the intake pressure and temperature. The engine’s main specifications are presented in Table 1, and Figure 1 illustrates the configuration of the central DI. Also, Figure 2 shows the combustion chamber configuration.
Engine specs. 29
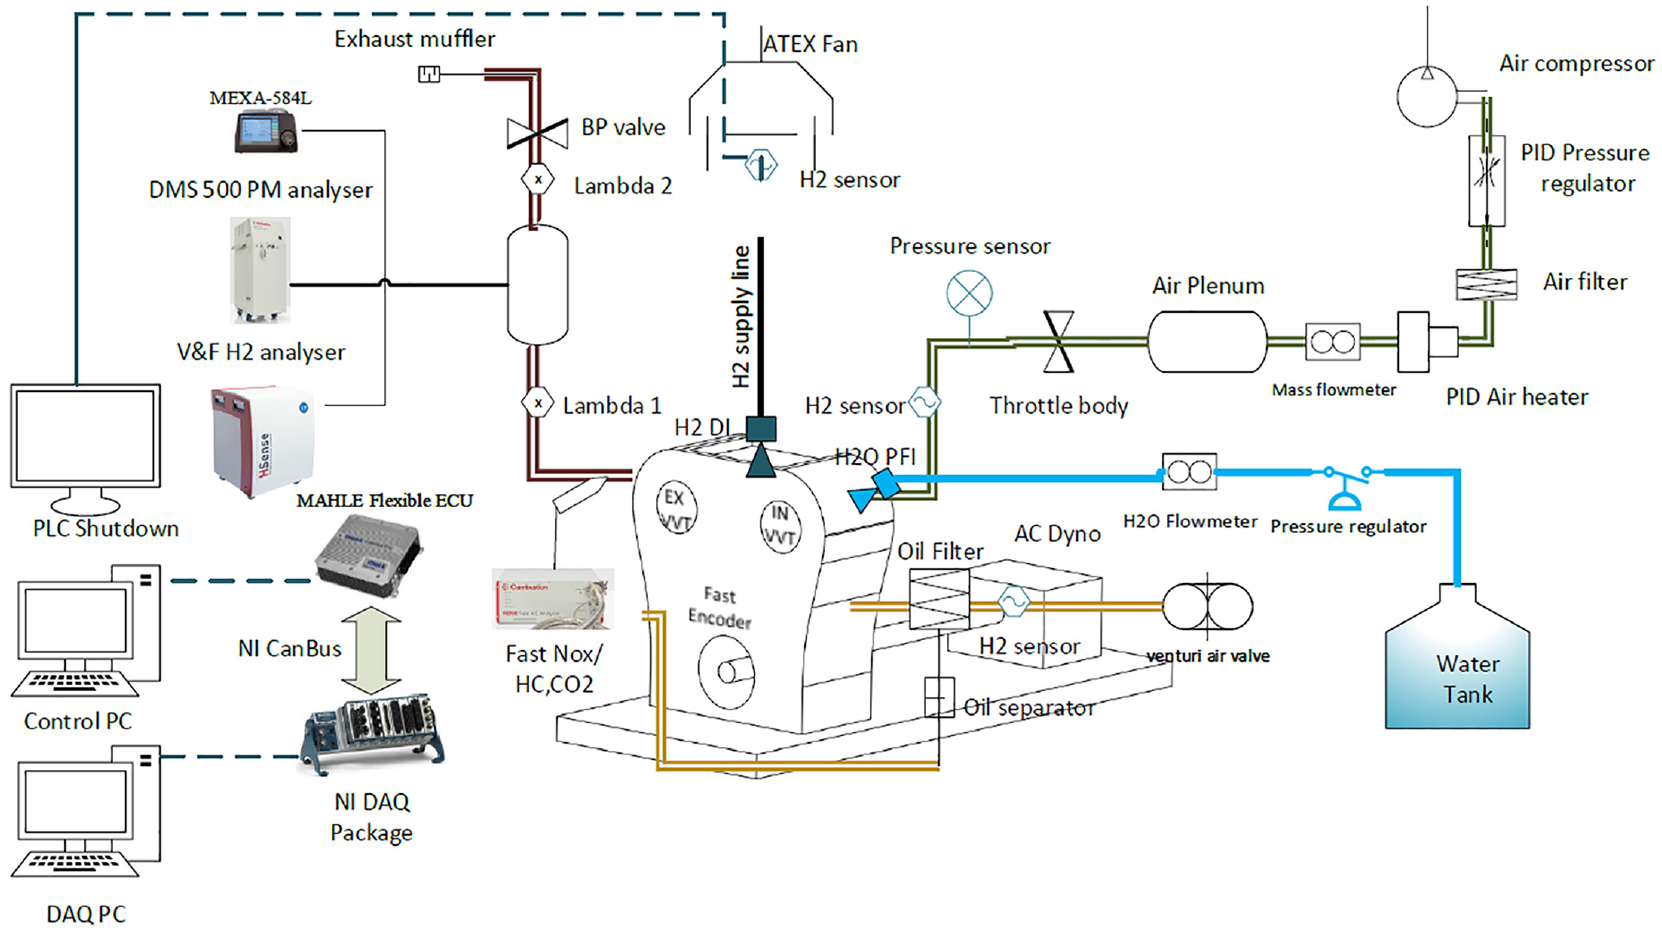
Testbed schematic. 27
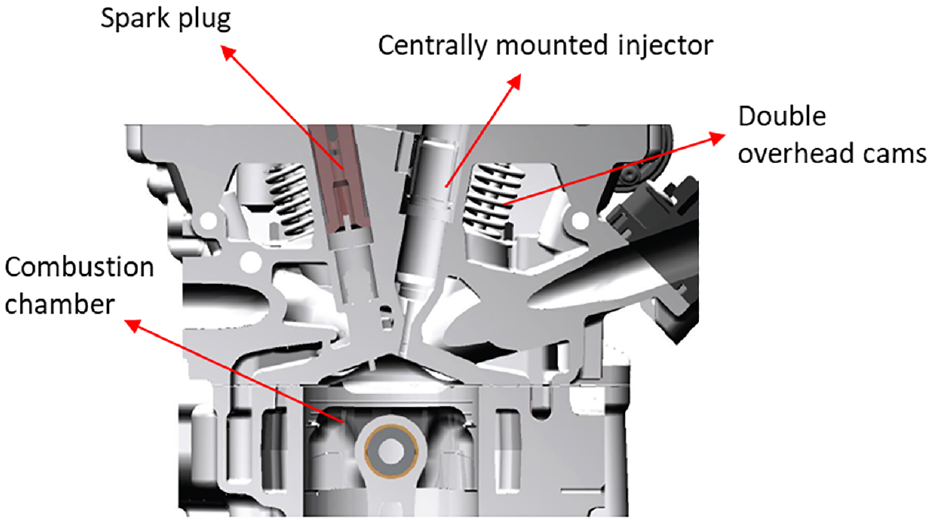
Combustion configuration. 28
Fuel system and properties
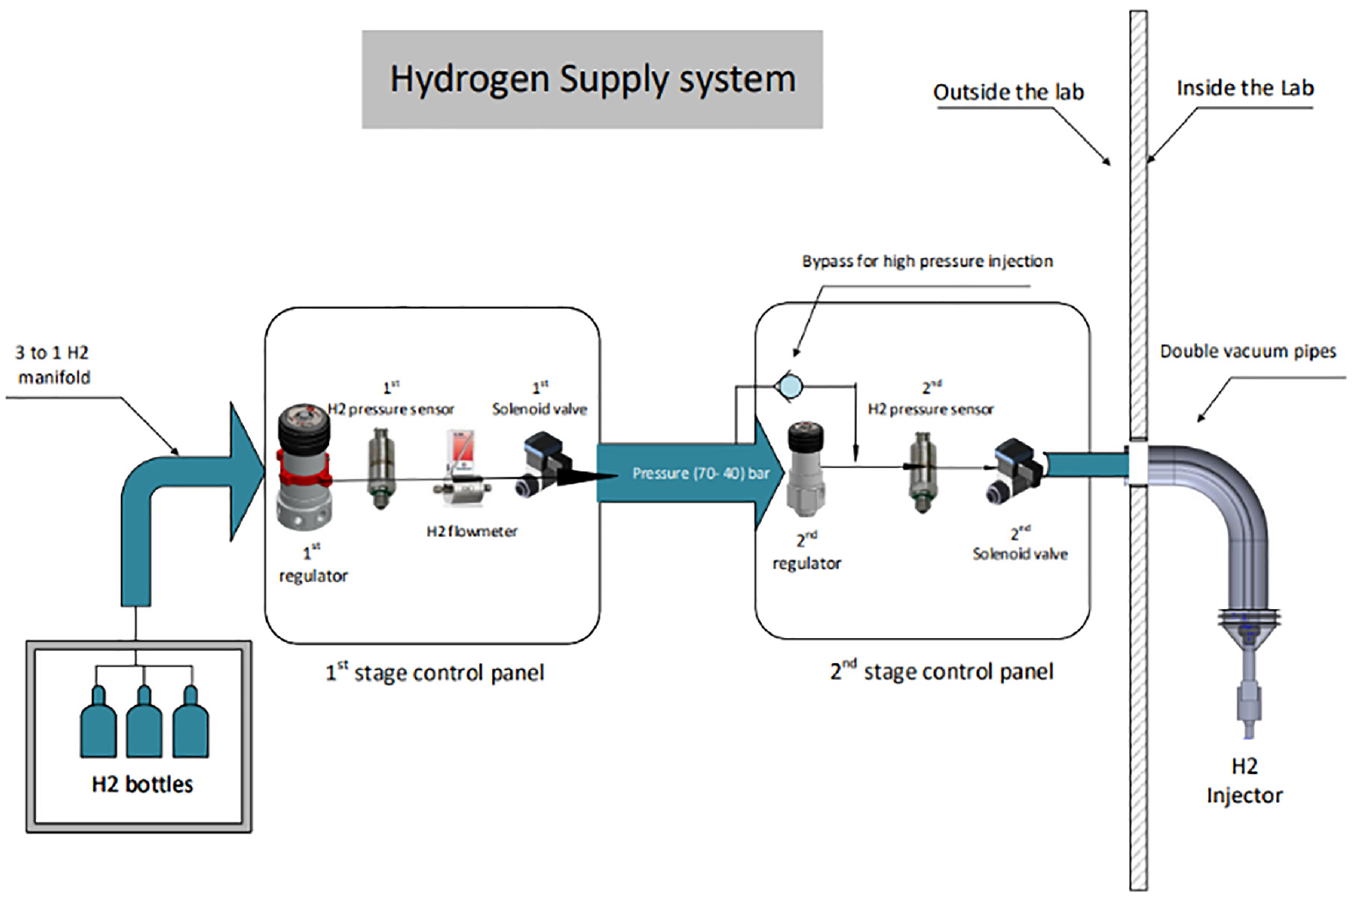
The hydrogen supply line configuration is shown in Figure 3. A pressure regulator in the first control panel reduces the gas pressure to 40–70 bar. The hydrogen gas then passes through a pressure sensor and safety solenoid shut-off valve before reaching a hydrogen flowmeter. In the next stage, the pressure is reduced to 2–30 bar by another pressure regulator. The flowmeter is placed upstream of the second stage to prevent any potential impact on the final pressure delivered to the injector. The second panel includes an additional pressure sensor and a safety solenoid valve to isolate the line and minimize hydrogen slip in case of leakage. An additional tube encloses the hydrogen line within the test cell to maintain a vacuum and prevent any hydrogen leakage into the external environment. The double pipe section has a pressure sensor that triggers an automatic nitrogen purge, ensuring complete isolation of the hydrogen line.
Hydrogen supply line. 30
The water supply system uses a pressurized tank with a controlled air regulator to maintain the tank pressure at 6 bars. The water then passes to the filter stage, followed by the final pressure regulator. It then moves through the water flowmeter, which measures the flow rate of the water, and on to the water injector. The Mahle ECU controls the water injection, ensuring a constant injection per cycle. The injector, positioned for port fuel injection, has an injection angle of 48° into the intake port, using a gasoline 12-voltage port fuel injection Bosch injector 968.
Data acquisition system (DAQ)
In total, outputs from 138 sensors need to be monitored and recorded. The sampling rate for each sensor is determined based on its priority and the value of the reading it produces. The instantaneous in-cylinder, intake, and exhaust pressures are recorded at a high sampling rate of four samples per crank angle in the crank angle domain. In contrast, the outputs from static pressure and temperature sensors are sampled much more slowly in the regular time domain with a frequency of 200 Hz. A hybrid selection of fast and standard USB NI cards are utilized to accommodate this, which can auto-synchronize with the Ni-based combustion analyser Vieletech Combustion Analysis Toolkit. 31 Furthermore, the NI-to-CanBus communication card was used to transfer signals from the ECU.
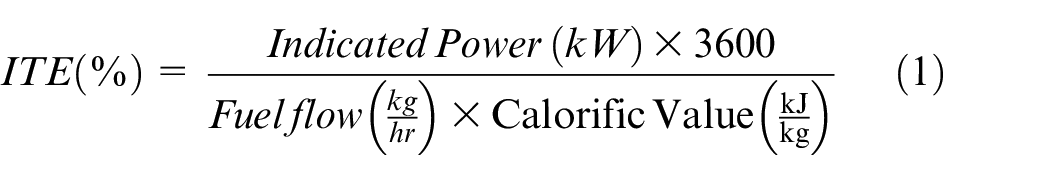
To determine the indicated thermal efficiency, the fuel’s lower heating value is multiplied by the fuel’s flow rate, the indicated power is then divided by the product. The in-cylinder pressure readings dictate the indicated power, averaged over 300 cycles, as shown in equation (1).
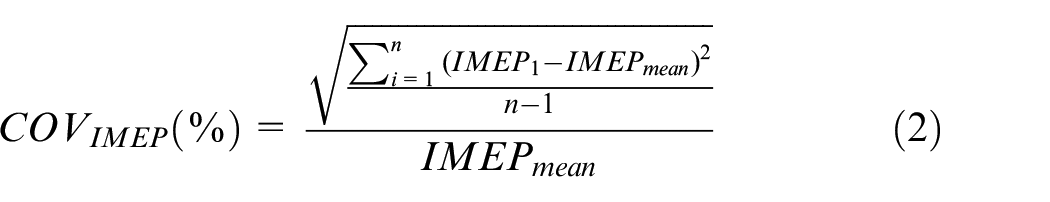
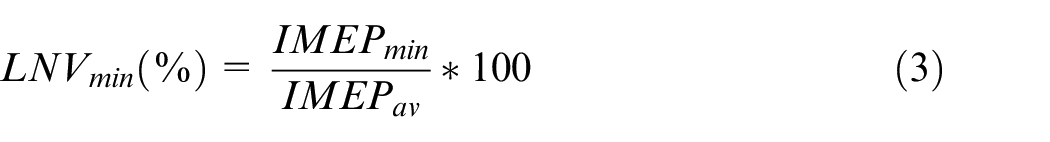
The cycli variation is measured by COVIMEP, the coefficient of variation of the indicated mean effective pressure over 300 cycles using equation (2). The lower net value (LNV) is introduced to indicate the occurrence of partial combustion or misfiring events. The calculation of LNV is based on the ratio of the Peak in-cylinder gas pressure to the average peak pressure for 300 cycles, as shown in equation (3).
Emission analysers
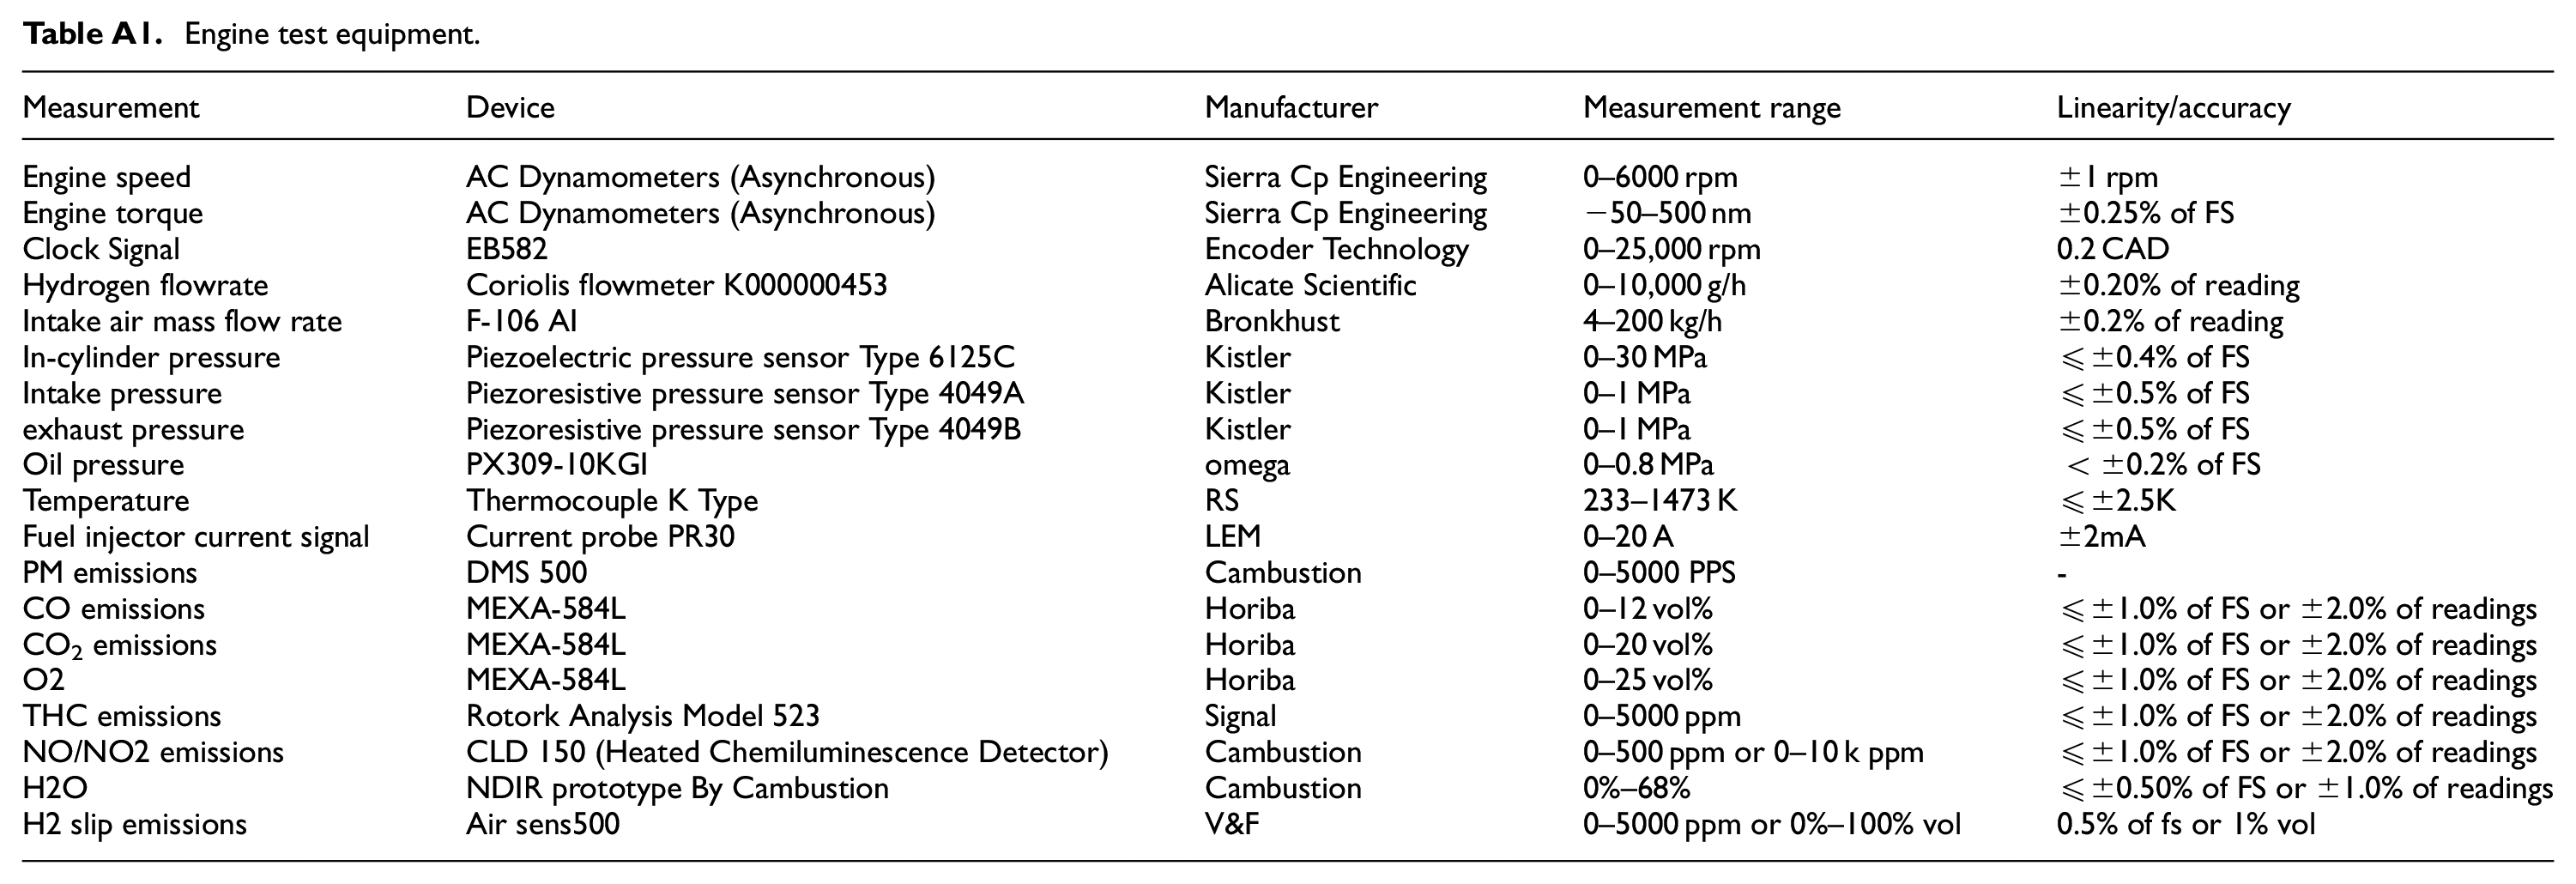
Monitoring engine-out emissions is crucial for capturing and understanding the engine’s emission patterns. Steady-state CO, CO2, and O2 emissions were measured using a Horiba multi-rack Signal Analyser. 32 Unburned hydrocarbons (HC) and NOx emissions were detected by flame ionization detection (FID) and chemiluminescence methods, respectively. Additionally, a fast-response Cambustion NOx analyser was employed for rapid NOx emission measurements by sampling exhaust gases directly from the back of the exhaust valves, using a 1.2-m emission pipe to minimize delay in detecting NO and NO2. 33 To determine lambda values, two wide-band lambda sensors were positioned in the exhaust line. These sensors were calibrated using O2 measurements from the Horiba analysers, and their readings were cross-verified with those calculated from the exhaust gas analysers. For the H2 ICE experiments, a prototype non-dispersive infrared (NDIR) analyser by Cambustion was used. We replaced the CO optical filter with an H2O optical filter, allowing simultaneous measurement of CO2 and H2O. The linearization function for the H2O measurements was carefully calibrated to ensure linear output. Finally, a V&F H2 analyser was installed to measure hydrogen concentrations in the engine exhaust and the ventilated crankcase line. 34 Table A1 in the appendix shows the full equipment list and measurement uncertainties.
Test methodology
The hydrogen spark ignition engine was tested with a centrally mounted DI injector. An inline air heater with PID control maintained a constant intake temperature of 38°C. Additionally, the oil and water coolant temperatures were kept constant at 90°C with the help of external heaters.
Two methods were used to detect the Top Dead Centre (TDC): the encoder clock synchronized with the Peak in-cylinder pressure during the motoring phase and a hall-effect sensor attached to the crankshaft, which the ECU used to regulate the cam timing.The pegging pressure was measured by determining the intake pressure value at the valve opening stage, which was then offset in the in-cylinder pressure live data obtained from the DAQ system.
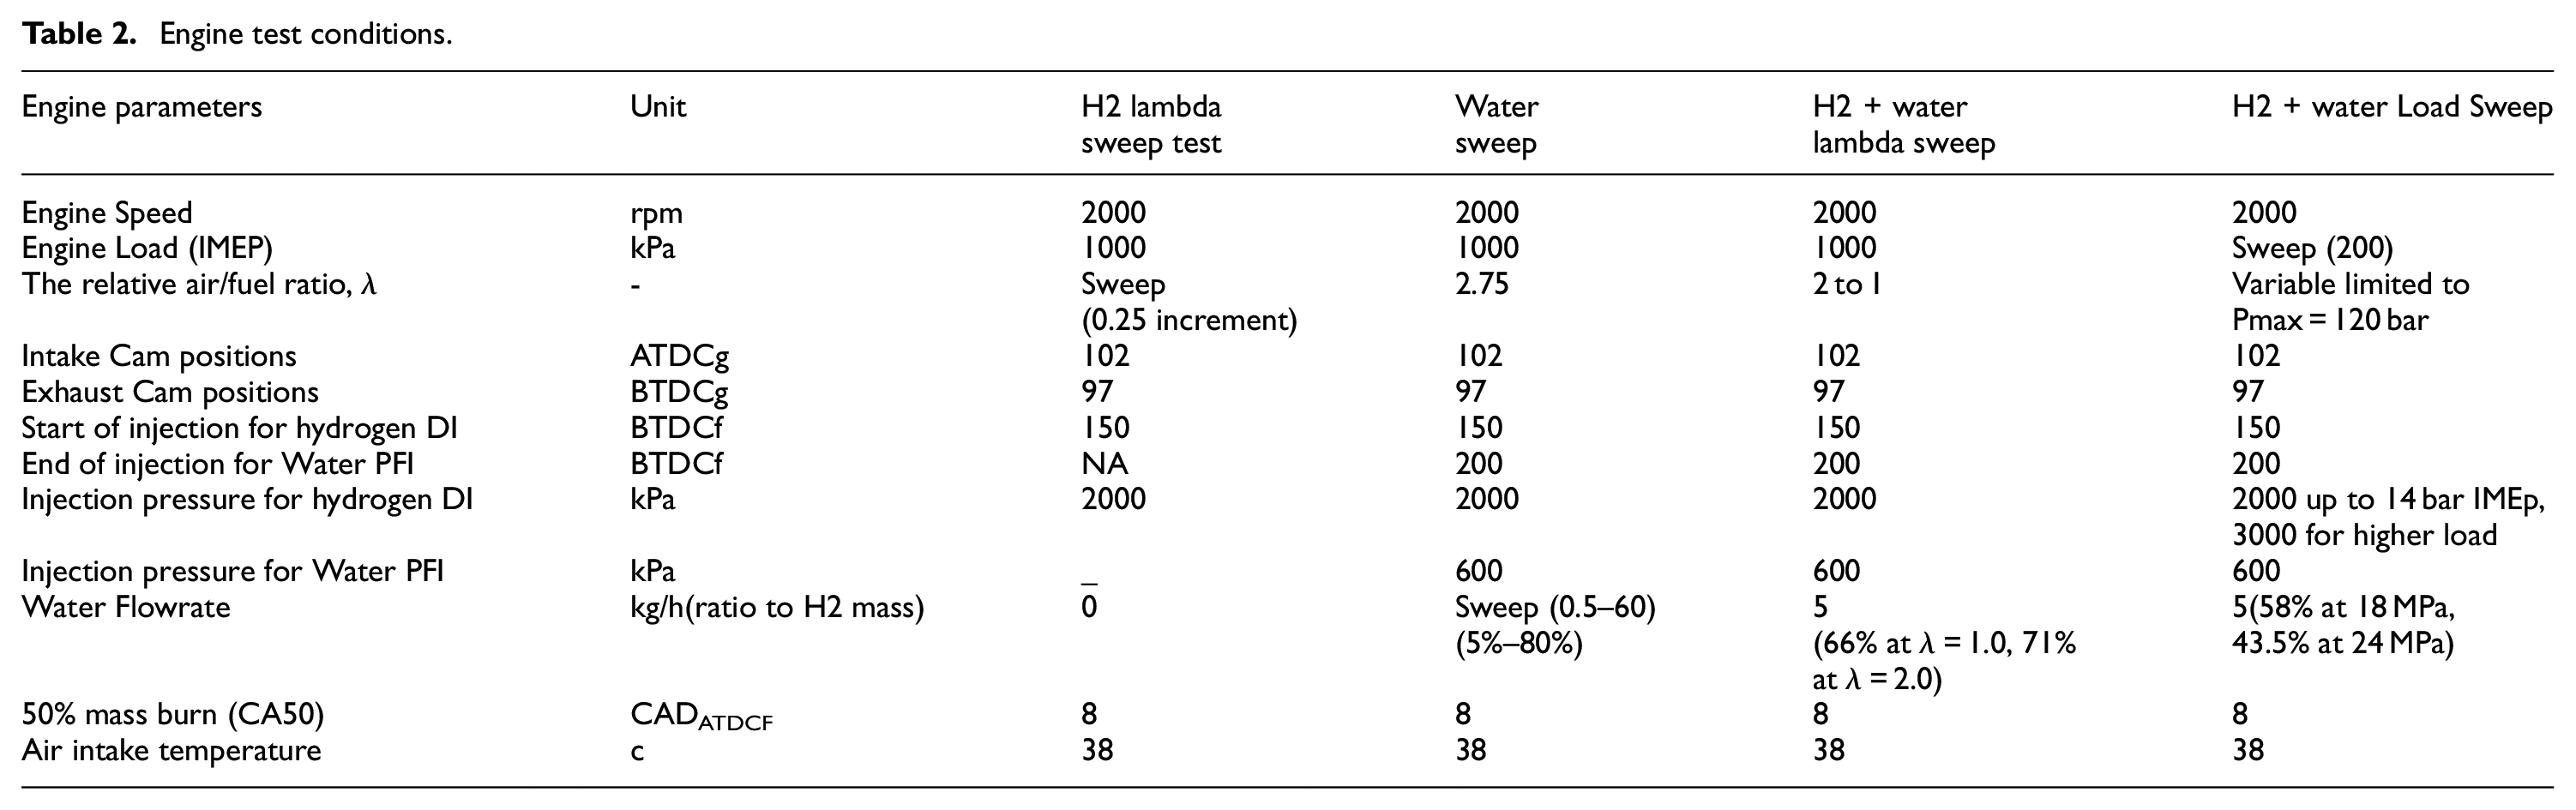
As shown in Table 2, the first set of experiments were carried out at a fixed load of 1000 kPa IMEP and a constant speed of 2000 rpm, representing the mid-load and speed of the engine operating map at different relative AFRs. The combustion phasing (50%MB/CA50) was adjusted to occur between 8 and 10 CADATDCg by setting the spark timing to the maximum brake torque (MBT). A lambda value of 2.75 was then chosen for the water injection experiments with different quantity of water (Water-Sweep), because this lean-burn condition allowed the engine to operate at high thermal efficiency and ultra-low NOx emission. The third experiment was performed with a fixed water injection of 5 kg/h at different lambda values. The fourth one studied the effect of water injection at different engine loads at 2000 rpm.
Engine test conditions.
Results and discussions
The results section begins with evaluating the performance, burn characteristics, and emissions from the baseline DI H2 operations at different lambda values. The second part of the study will analyse the impact of varying water mass flow on combustion characteristics and emissions. This will be followed by a detailed investigation into the effects of optimized water injection at low (less lean) lambda settings. Finally, the study will demonstrate potential peak load gain with water injection.
DI H2 engine performance and exhaust gas analysis at different lambda
In this experimental study, the main focus will be on providing the full performance and burn characteristics analysis of the baseline hydrogen direct injection spark ignition engine, along with the full assessment of the engine-out emissions including H2O, at different relative air-to-fuel ratios. The test was carried out at a fixed speed and load of 2000 rpm and 10 bar IMEP, which represents a mid speed and mid load operating condition for this engine. Figure 4 illustrates that this engine, when using a centrally mounted DI H2 injector, without water injection, could be operated from lambda 1 stoichiometric to lambda 4.5 ultra-lean combustion with acceptable combustion stability. The indicated thermal efficiency (ITE) increases with the relative air/fuel ratio and reached its peak value of 43% at lambda 4.25 with a compression ratio of 11.3. However, further increase in the air/fuel ratio leads to a drop in ITE due to the increased cyclic variation, as indicated by the COVimep going above the limit of 3% and the LNV falls under 90%, which indicates partial burns over the 300 cycles. It is noted that the engine was operated with MBT spark timing by fixing 50% mass burn to 8° ATDCf when the lambda was higher (leaner) than 1.8. As the mixture became richer than lambda 1.8, the 50%MFB point needed to become more retarded due to the need to keep the Rmax (rate of pressure rise) to be below the durability limit of 600 kPa per crank angle, as shown in Figure 4.
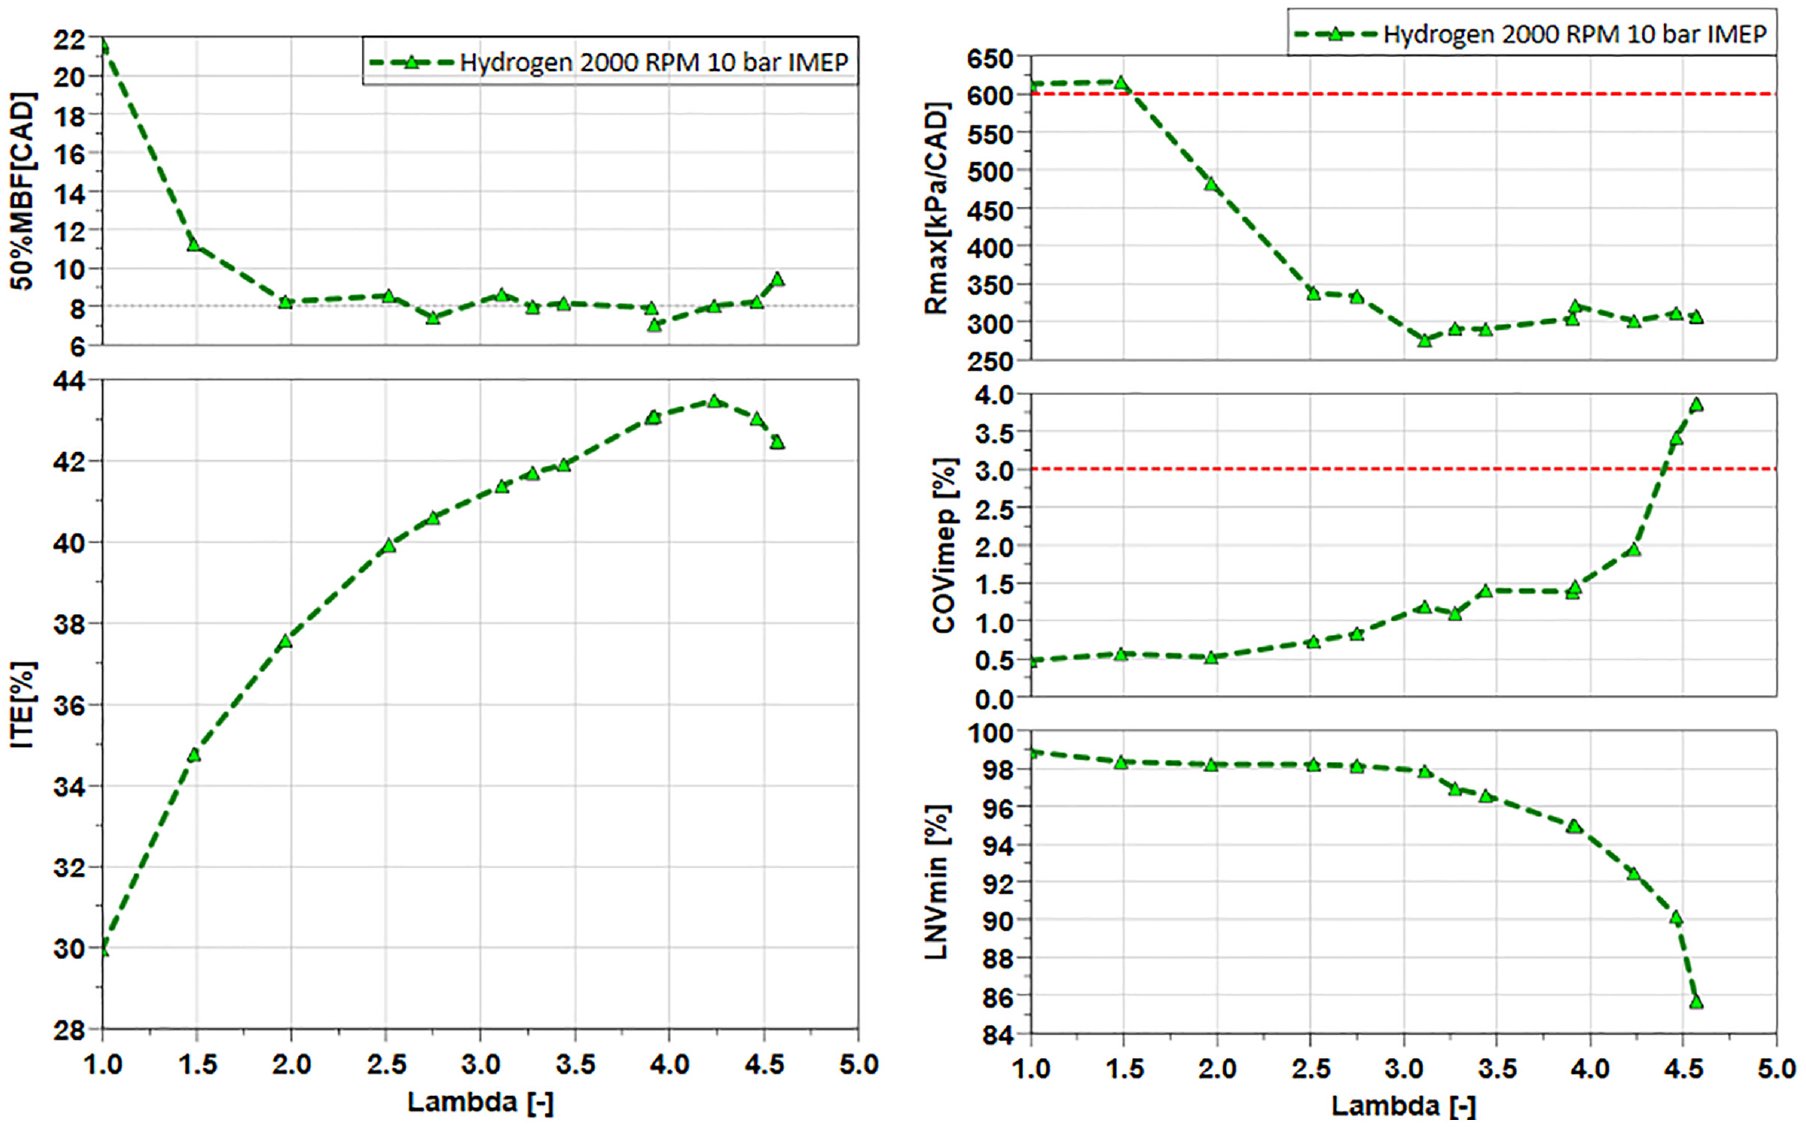
Baseline H2 engine results of 50% mass fraction bruned (MFB), ITE, Rmax, COVimep, and LNVmin.
Figure 5 shows that both the maximum in-cylinder pressure and intake air pressure increased with lambda in order to maintain the same engine output with ultra-lean burn operation. As a result, the adoption of the ultra-lean operation at a higher load can be very challenging as the engine has to be designed to withstand much greater peak in-cylinder pressure as well as the ability to provide the higher boosting pressure and air flow. Additionally, the exhaust temperature and hence the energy available to drive a turbocharger may become too low at ultra-lean operations. Thus, the adoption of the ultra-lean operation may require a complex boosting system to achieve high performance.
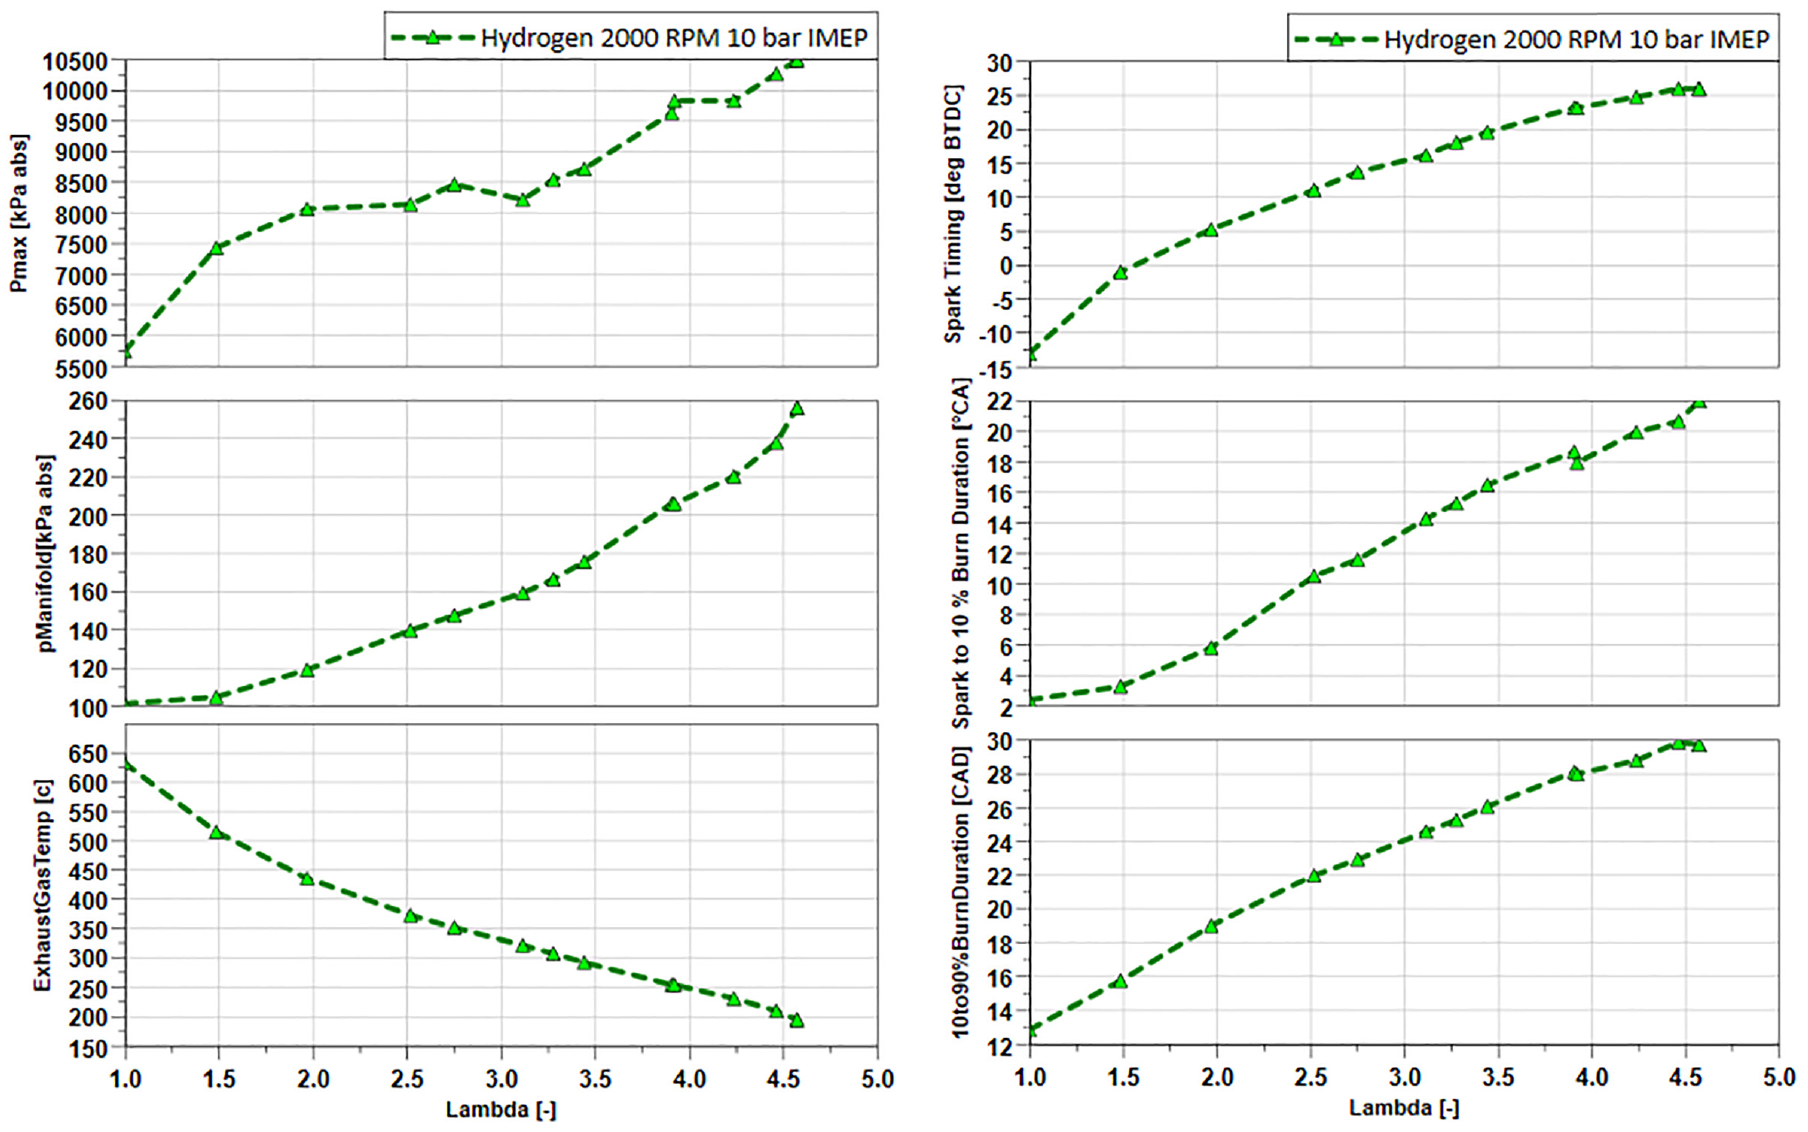
Baseline H2 engine results of Pmax, intake pressure, exhaust gas temperature, spark timing and combustion durations.
Figure 5 also shows the spark timing and combustion durations. The spark timing was advanced with leaner mixture to maintain the operation at MBT and fix the CA50 at 8° ATDCf due to the slower burning velocity of leaner mxitures. It’s worth mentioning that the spark was retarded from the MBT spark timing to ATDCf when at lambda 1 and lambda 1.5 to maintain Rmax within its limit as shown in Figure 4.
Figure 6 illustrates the main engine-out emissions of the baseline DI H2 SI engine at 10 bar IMEP and 2000 rpm. The graph shows the variation in hydrogen slip, NOx, O2, CO2, and H2O emissions across different lambda values. As the mixture becomes leaner, the hydrogen slip initially decreases, reaching a minimum at lambda 1.5, where NOx, emissions are at their peak due to higher combustion temperatures and sufficient oxygen availability. It is noted that the sudden rise of the H2 slip with the ultra-lean mixture coincided with the pronounced increase in the cyclic variability (COVimep) and partial burn (LNVmin), indicating the incomplete combustion of H2 as the main source of H2 in the exhaust under the lean burn conditions. The higher H2 slip at lambda 1 is more likely to be caused by the presence of fuel rich mixtures due to incomplete mixing of direct injected hydrogen.
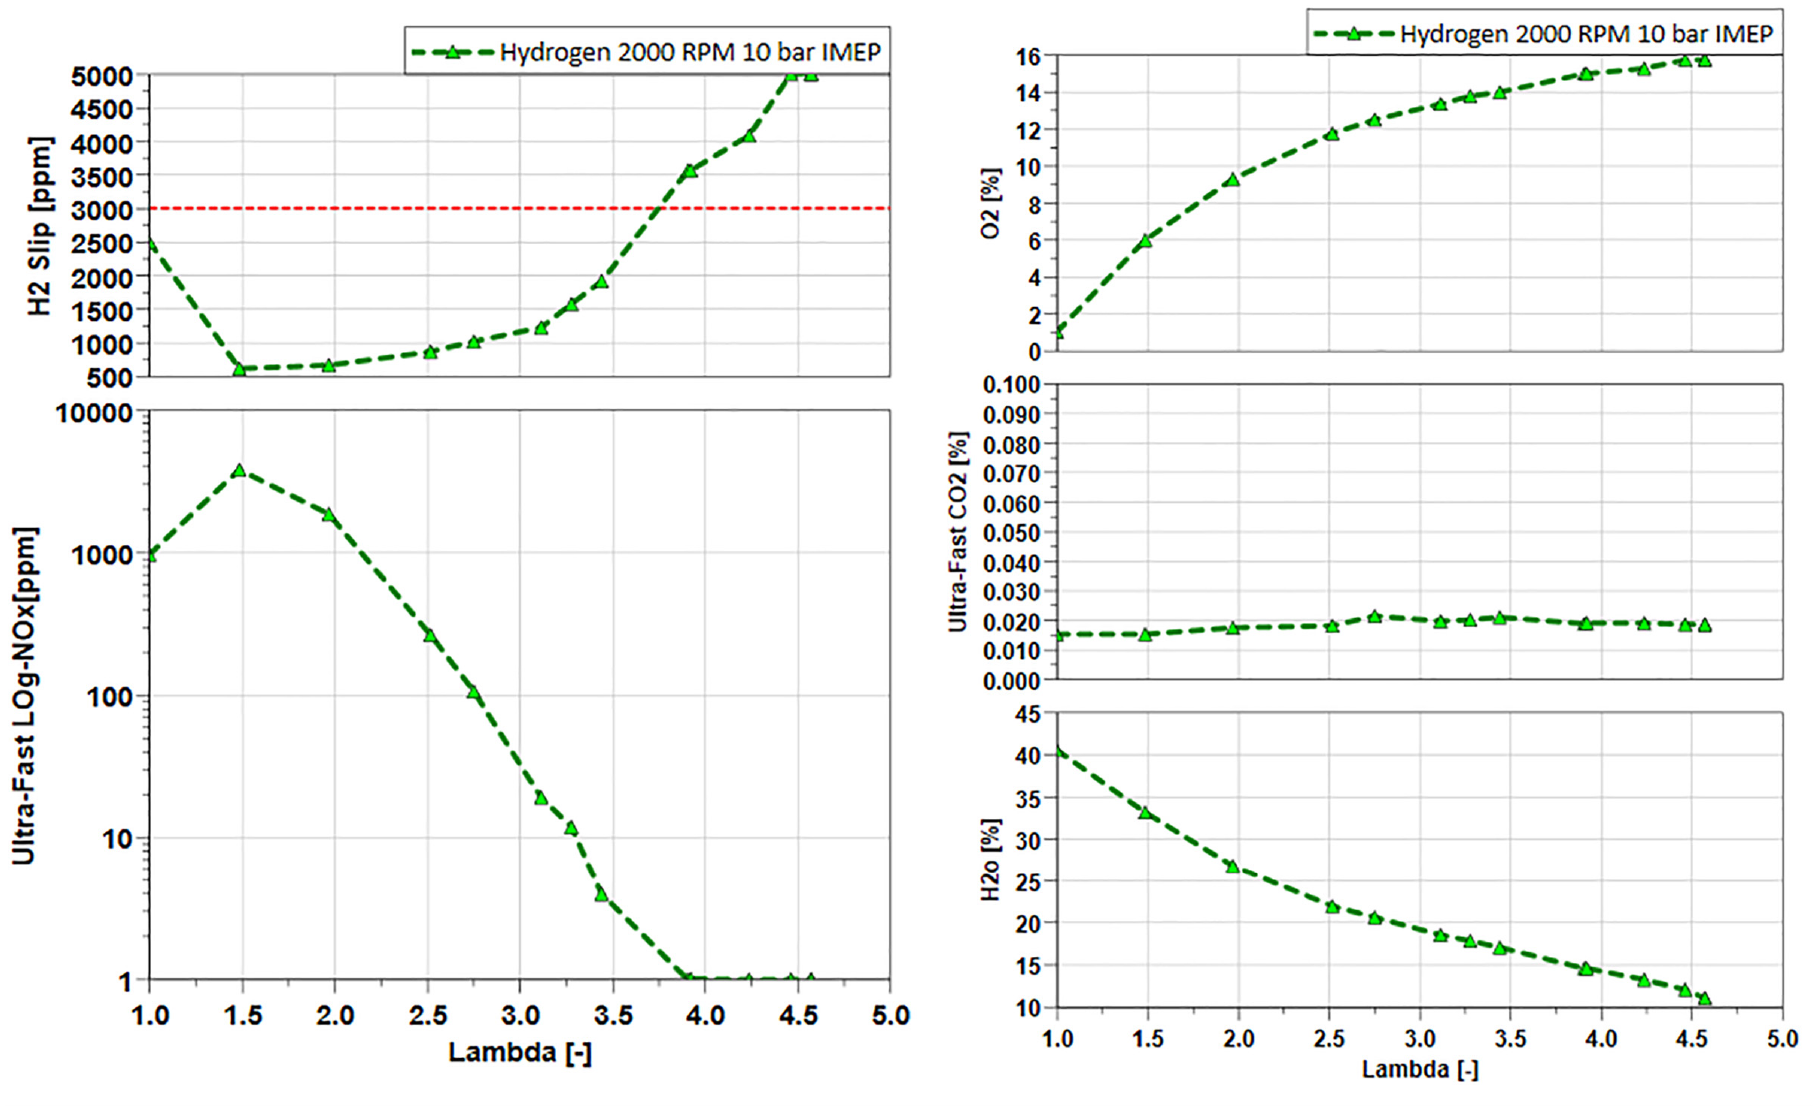
Baseline H2 engine emissions of H2 slip, Nox, O2, CO2, and H2O.
At lambda 1.5, the H2 slip reached its minimum and NOx emission was at its peak, due to the high combustion temperature and sufficient oxygen availability. The NOx emission was measured using a Cambustion fast analyser that’s capable of measuring per quarter crank angle degree. Both averaged readings and cyclic variations over 300 cycles were obtained. The Logarithmic NOx graph shows that the NOx could be reduced to be less than 10 ppm when lambda was higher than 3.5. The NOx exponentially increased from 100 ppm at lambda 2.75–3500 ppm at lambda 1.5. The higher in-cylinder mass achieved as a result of the additional air introduced when running at leaner set points, effectively reduces in cylinder combustion temperatures by virtue of its higher specific heat capacity, reducing thermal NOx formation and diluting the exhaust gas mass flow.
The O2 concentration increased to 16% at the maximum lambda of 4.5. The standard CO2 analyser did not detect the presence of CO2 whilst the reading of averaged CO2 concentration from a Cambustion fast CO2 analyer was 0.019% which was at the detection limit of the equipment. Finally, the bottom right graph shows the H2O concentration in the exhaust measured by a prototype Cambustion fast analyser. The water concentration increased from 10% at lambda 4.5%–42% as the mixture appoached stoichiometric and the exhaust gas mass flow became less diluted.
Overall, this test set the baseline profile and engine emissions characteristics, highlighting the burn duration of using 100% hydrogen DI and operating at MBT. Also, this baseline has shown multiple challenges and the potential of 100% hydrogen adoption to a SI engine, such as the higher Rmax near stoichiometric conditions due to the rapid flame speed of the hydrogen and higher boost pressure required to achieve both high efficiency and engine output. Also, it has shown that NOx emission in the engine exhaust can be reduced to negligible levels by running ultra-lean mixtures. However, the ultra lean-burn operation will not only require very high boost pressure but also lead to greater in-cylinder pressure, requiring a more complex boosting system and stronger engine design to achieve the same performance as, for example, a gasoline SI engine. However, the production of significant water from near stoichiometric hydrogen combustion offers the possibility to explore the alternative approach to achieve high-performance and high efficiency by adopting water injection, collecting and using the water present in the engine exhaust gas.
Impact of the water injection on H2 SI engine at fixed load and lambda
This section will primarily focus on assessing the impact of water injection on the H2 DI engine’s performance and emissions at fixed load, speed, and lambda of 10 bar IMEP, 2000 rpm, and 1.8, respectively. The water was injected using a PFI injector, with the end of injection fixed at 200° BTCDf to ensure that the injection ends during the intake valve open phase. The test was conducted by keeping the engine load and speed constant at lambda 1.8 while varying the water injection flow rate from 0.5 to 6.5 kg/h. All data points were collected with MBT spark timings by setting the 50% Mass mass-fraction burned (MFB) to 8° After Top Dead Centre (ATDCf).
As shown in Figure 7, both the peak in-cylinder pressure and the maximum rate of pressure rise steadily decreased as the water injection rate increased up to 3.6 kg/h. The Indicated Thermal Efficiency (ITE) remained nearly constant with small quantities of water injection, showing a slight decrease of about 0.5% at 3.6 kg/h. Meanwhile, COVimep and LNVmin showed a slight increase, indicating some rise in cyclic variation. Beyond this point, further increases in the water injection rate had little effect on the peak pressure and rate of pressure rise. However, ITE decreased by an additional 1% at 5 kg/h, primarily due to the presence of partial-burn combustion, as evidenced by the noticeable drop in LNVmin and the rise in COVimep.
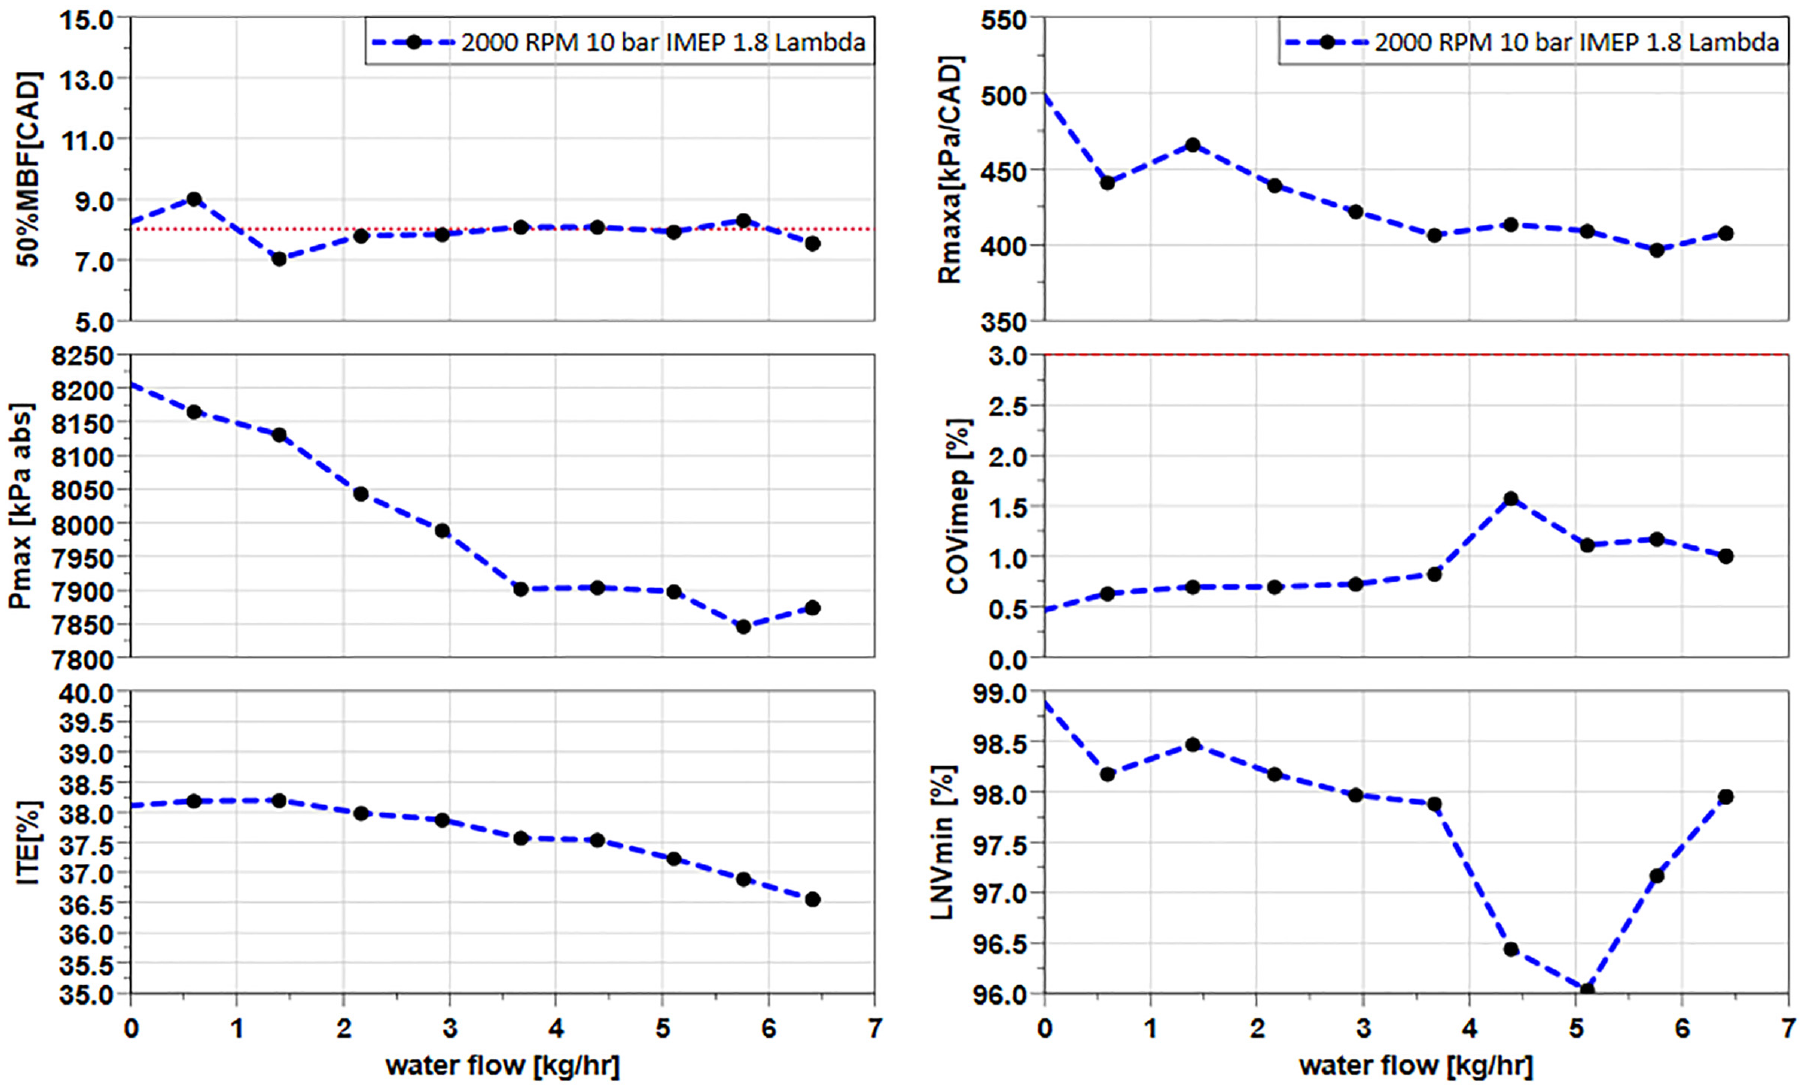
Effects of water injection on 50% MFB, Pmax, ITE, Rmax, COV, and LNV at lambda 1.8, 20,000 rpm, 10 bar IMEP.
The data presented in Figure 8 demonstrates the influence of water injection on combustion burn characteristics, particularly highlighting the substantial reduction in NOx emissions and the increase in excessive water in the exhaust. With increasing water injection, there was a maximum 6° advancement in spark timing, primarily attributed to the effect of water injection on slowing down both initial and main burn durations. Notably, the most rapid spark timing increase occurred at 1.5 kg/h water injection, while from 3.6 to 6 kg/h water injection, the spark advance only increased by 0.5°. Additionally, ignition delay and burn duration increased as water injection increased, with the latter showing a three-degree increase at 5 kg/h water injection. However, the burn duration declined with a drop in indicated thermal efficiency (ITE), necessitating increased hydrogen injection to maintain the same load.
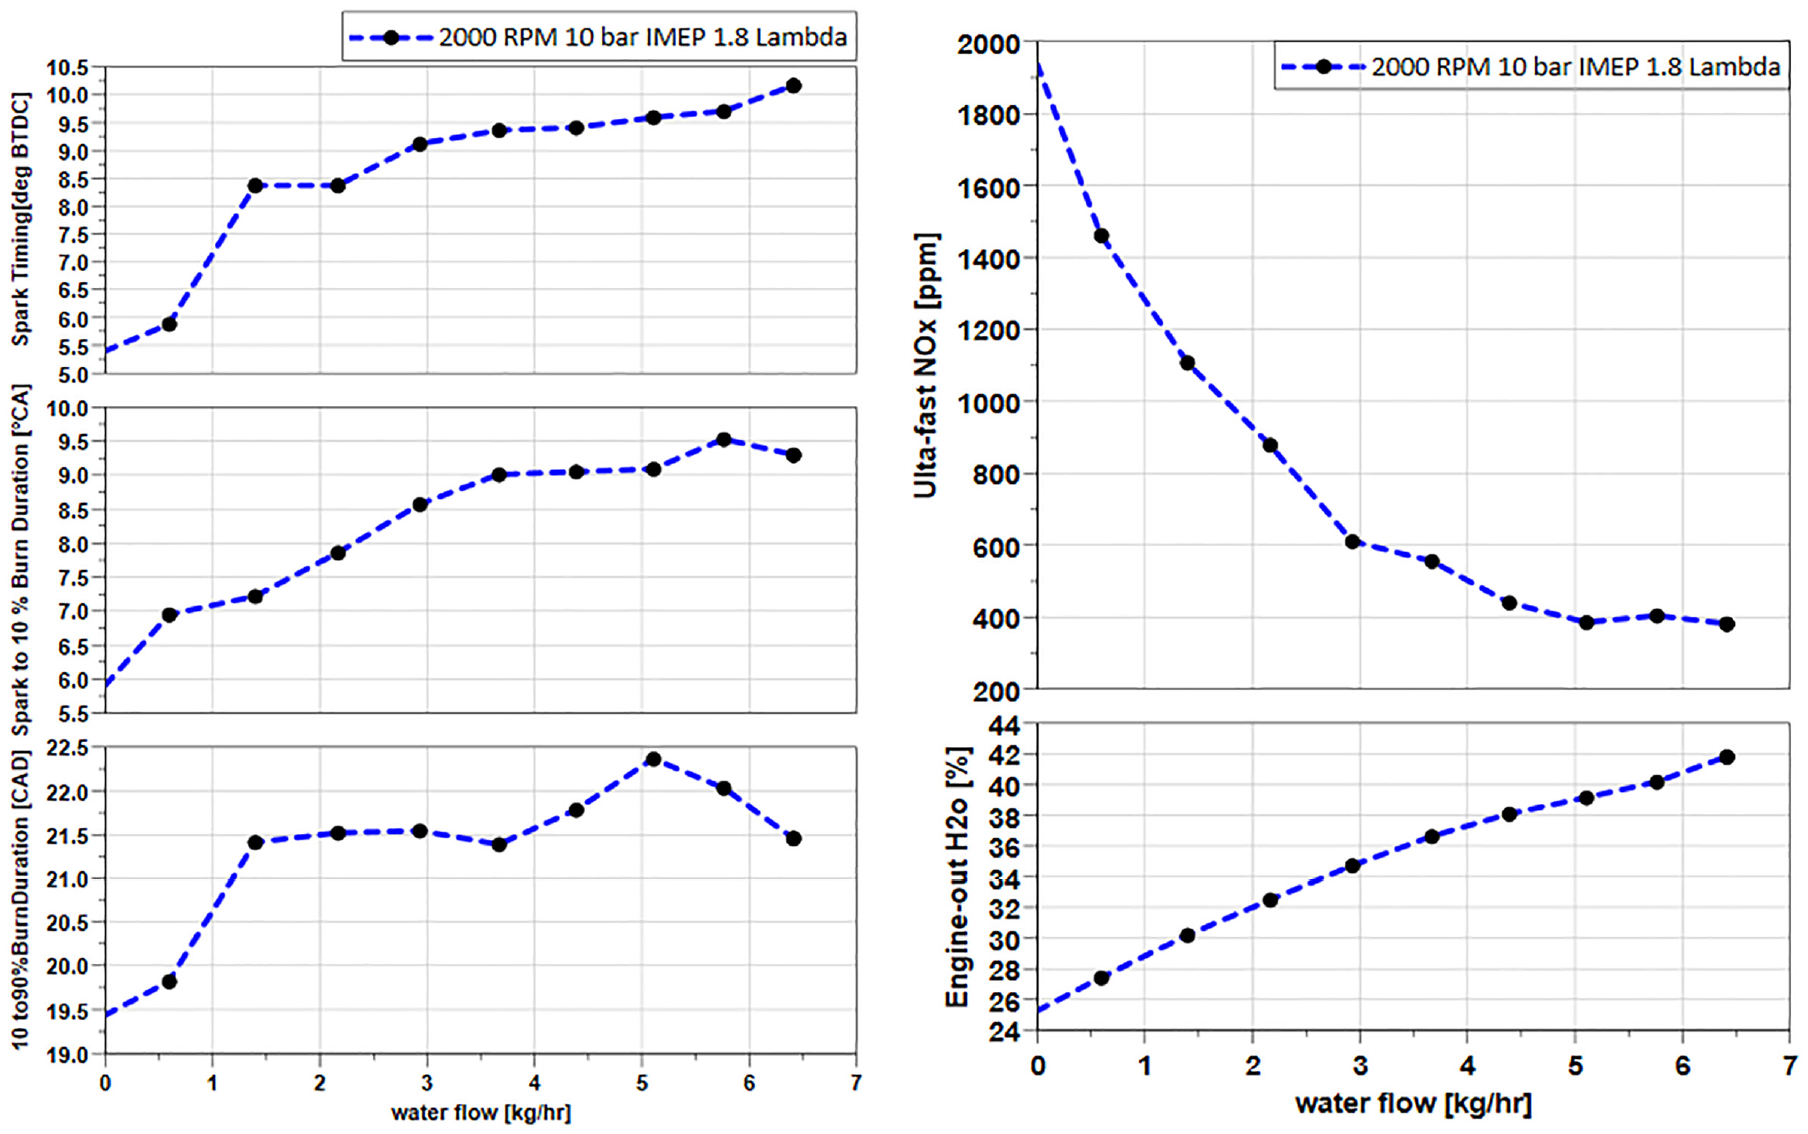
Effects of water injection on combustion, NOx and water concentrations in the engine-out exhaust.
The most significant impact noted was on NOx emissions, with a noteworthy drop from approximately 2000–400 ppm at 5 kg/h water injection due to the lower flame temperature stemming from the presence of water vapour during combustion. This reduction in NOx emissions coincided with an 86% increase in exhaust water vapour, pointing to the potential benefits of adopting exhaust gas recirculation (EGR) systems with water injection.
The water sweep test revealed that water injection can be an effective means to improving H2 engine performance at lambda 1.8. This was evidenced by a decrease in the pressure rise rate and Pmax with water injection, allowing for an extended maximum engine load. A higher water quantity of 5 kg/h is necessary to reduce NOx emissions significantly. This quantity led to a 79% decrease in NOx emissions and a 3° increase in burn duration at the same water flow rate. Based on these findings, further tests at a fixed water injection of 5 kg/h were carried out to evaluate the impact of water injection at different air/fuel ratios. Figure A1 in the appendix compares the in-cylinder pressure with different water injection quantities in the crank domain.
Effect of water injection at different air/fuel ratios
During this test, the water flow rate was kept constant at 5 kg/h, while the relative air-fuel ratio (lambda) was adjusted between 2 and 1 with a 0.25 set change. The purpose is to explore the potential for advancing the spark timing and operating at the minimum advance for best torque (MBT) under the same load and speed conditions, specifically at 10 bar indicated mean effective pressure (IMEP) and 2000 rpm.
Figure 9 compares the H2 SI engine results without and with water injection at a 5 kg/h flow rate. The figure demonstrates that the engine could be run at lamda 1 with the MBT spark timing when water injection was applied, as evidenced by the constant 50%MFB at 8 CA ATDC. In comparison, the spark timing had to be retarded without water injection in order to avoid too rapid pressure rise and too high in-cylinder pressure. The overall burn duration of stoichiometric combustion was prolonged by 8° with water injection. As a result, the indicated thermal efficiency (ITE) at lambda 1was increased from 30% to 32% thanks to water injection.
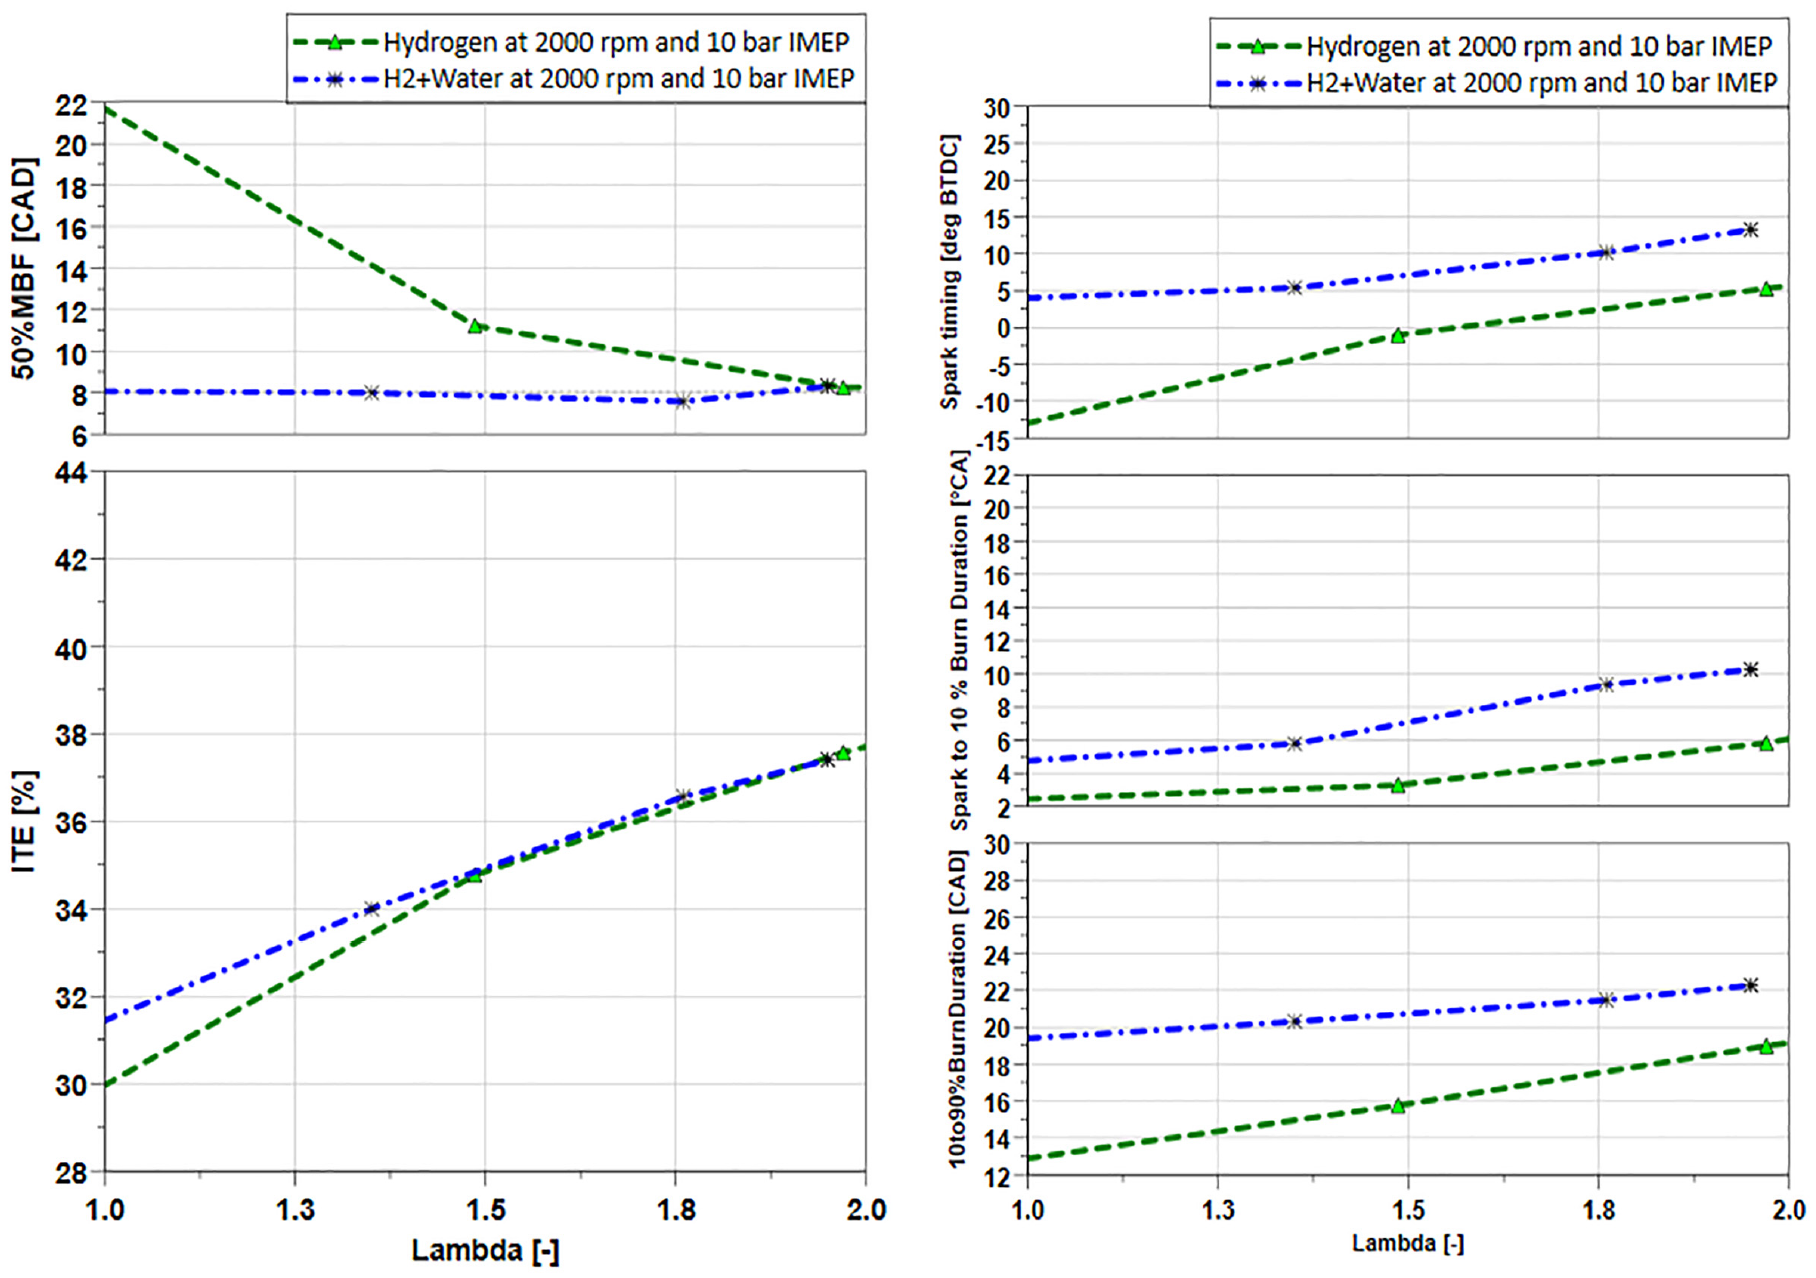
Effects of water injection on 50% MBF, ITE, Spark timing, ignition delay, and 10%–90% burn durations versus lambda.
Figure 10 illustrates the significant reduction in NOx, engine-out emissions across the entire lambda range from 2 to 1 with the implementation of water injection. The peak NOx, emissions dropped from 3500 ppm at lambda 1.5–820 ppm with water injection. Additionally, up to 58.7% water was found in the exhaust gases at lambda 1. This increase in water vapour contributed to a decrease in the pressure rise rate (Rmax), allowing operation at lambda 1 without the need to retard the spark. Although the engine exhibited slightly increased cyclic variation, both the coefficient of variation (COVimep) and LNVimep remained under 1.5%. Despite a decrease in partial burns to 95%, this performance still surpasses that of stoichiometric gasoline SI engines. 28
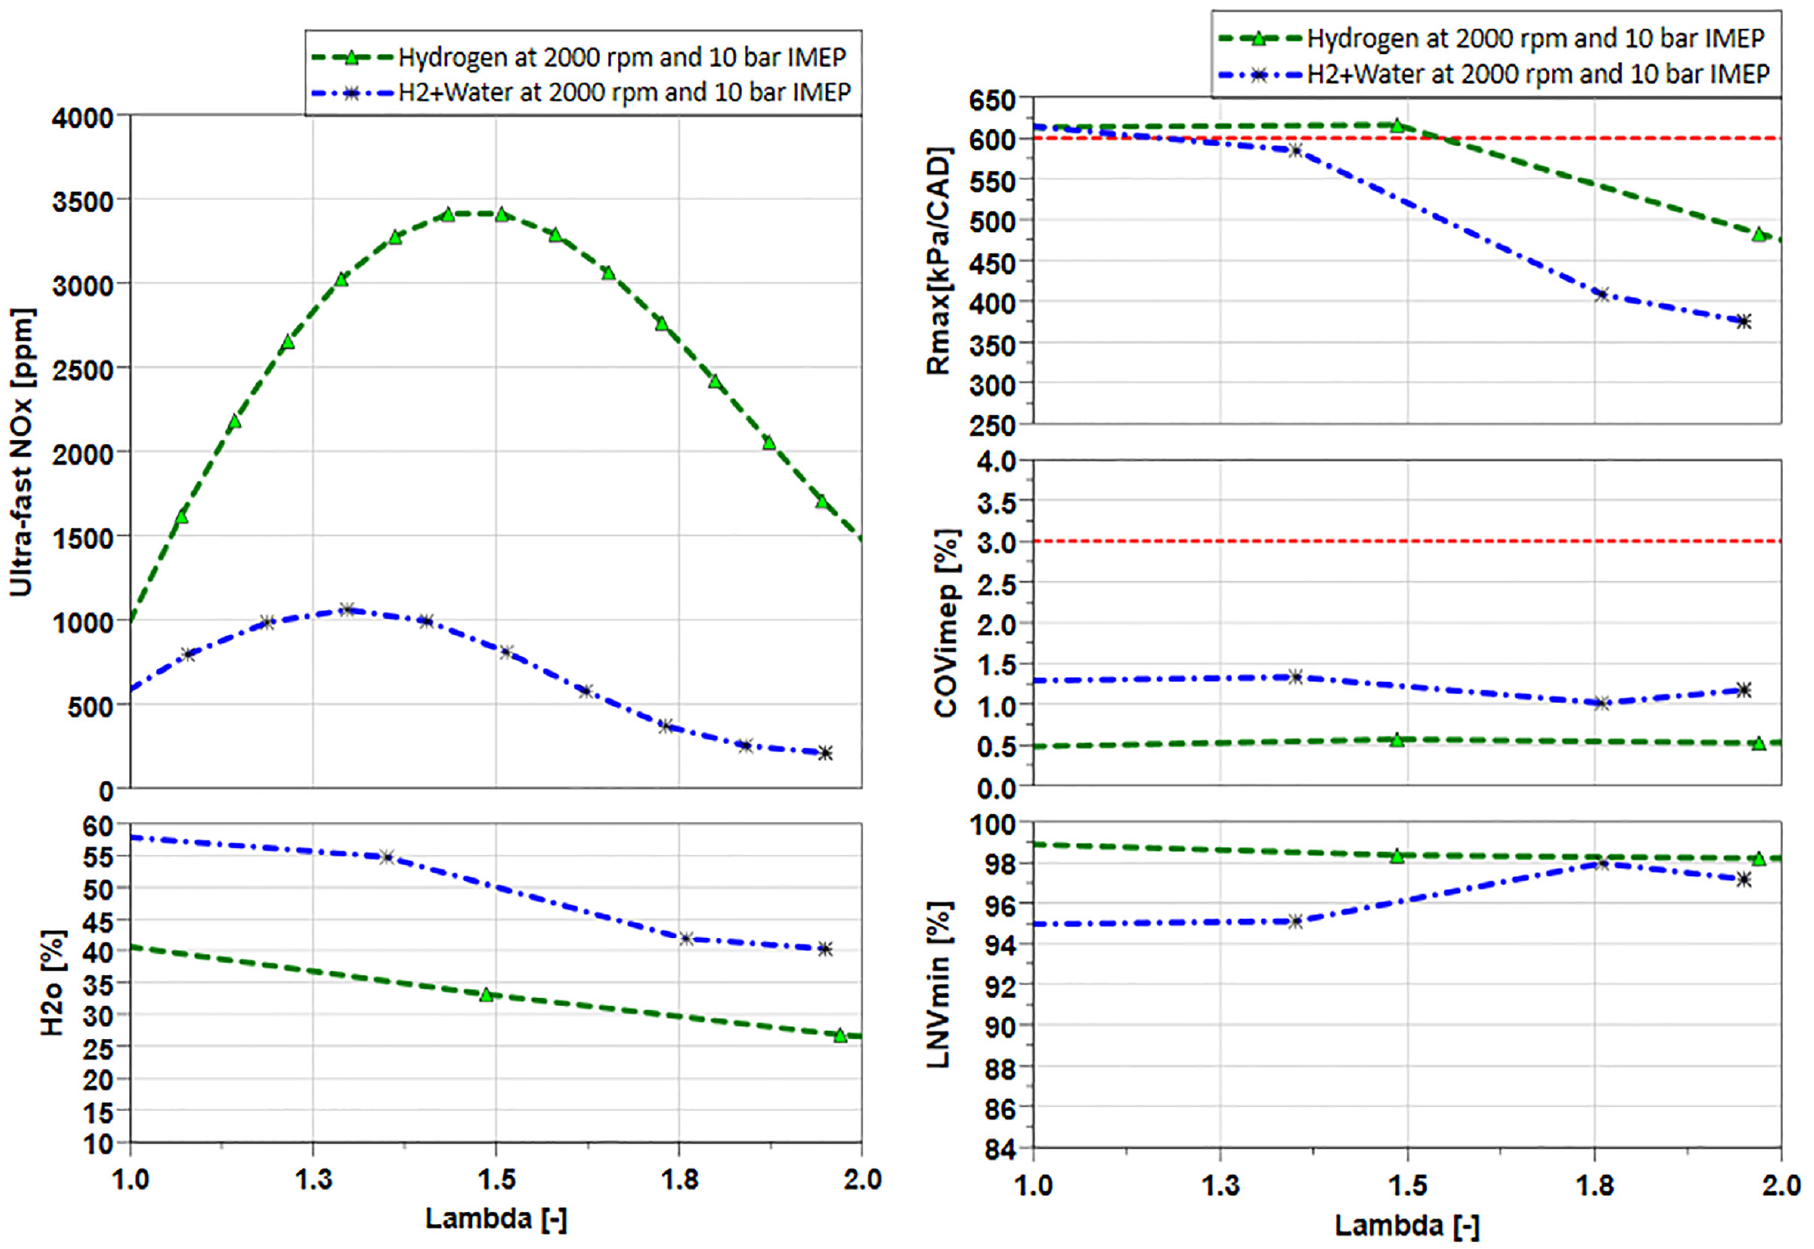
Effects of water injection on NOx, H2O, Rmax, COV, and LNV versus lambda between 2 and 1.
The potential of load increasing with water injection
This study investigated the impact of water injection under very high load operations. The engine speed was fixed at 2000 rpm with a baseline lambda of 2.8 which was selected for the minimal required boosting for minimum NOx emissions. As previous tests show, running pure hydrogen under lean conditions resulted in higher peak in-cylinder pressure. In this test, the lambda value was held constant at 2.8 until the Pmax of 120 bar was reached at MBT sparking at each load. The control strategy was then changed to operate engine with a richer mixture down to lambda 1.8 and adjusting the spark timing until the engine reached the maximum pressure rise rate of 600 kPa.
The hydrogen start of injection timing was set at 150 BTDCf, and the injection pressure was 20 bar up to a load of 14 bar IMEP. At higher load operations, the injection pressure was increased to 30 bar to reduce the total injection duration and keep the end of injection nearly constant. Water injection was applied at the higher load operations above 18 bar IMEP to keep the cylinder pressure below the Pmax limit. In this test, the water injection flow rate was fixed at 5 kg/h, and the end of the injection was fixed at 200 BTDCf to minimize the wall wetting by adopting an open valve injection strategy.
As shown in Figure 11, when the engine was operated at 4–16.5 bar IMEP, the lambda was fixed at 2.8 and spark timing set at MBT with the 50% MBF maintained at around 8° ATDC. As the Pmax was reached at 18 bar IMEP, the spark timing was retarded and the lambda value reduced to run slightly rich, so that the engine operation could be extended to 21.78 bar IMEP, limited by the maximum Pmax and Rmax conditions. In comparison, when the water injection was applied from 18 bar IMEP, the engine could be operated up to 24 bar IMEP.
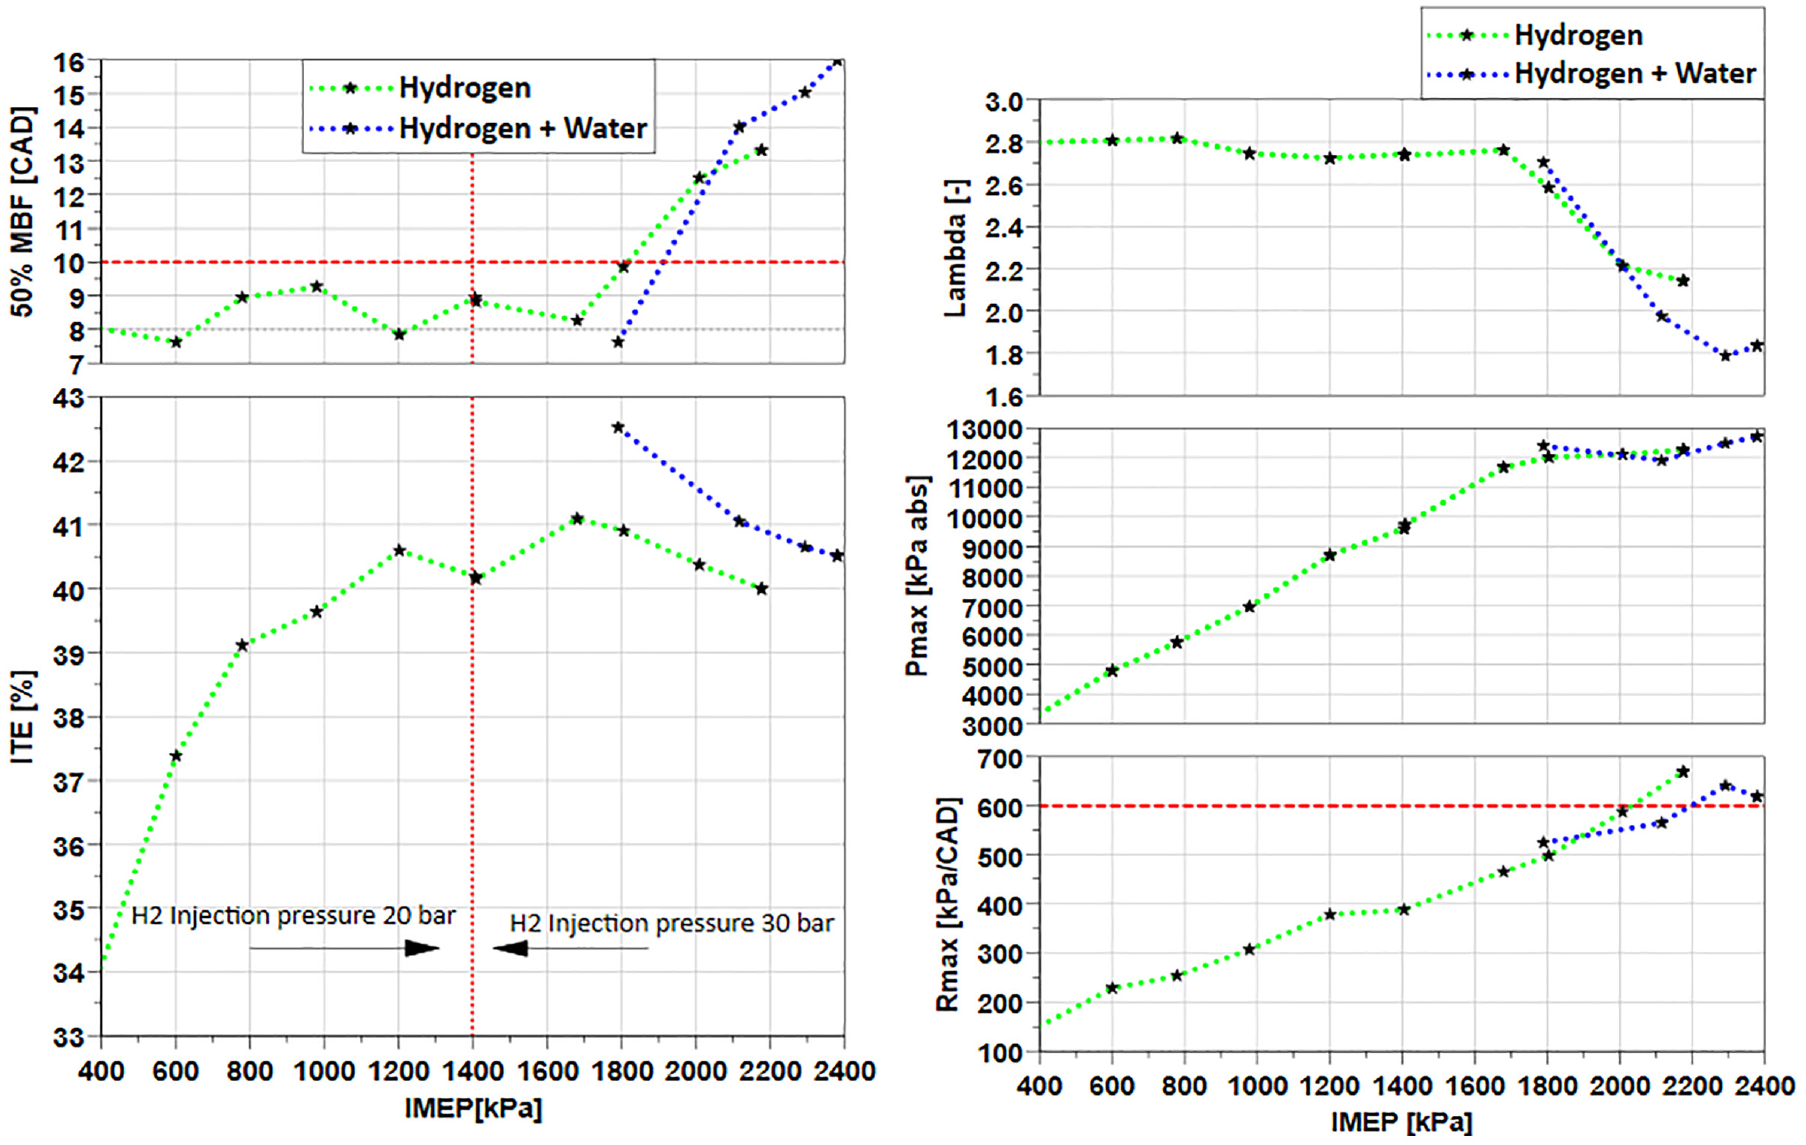
Impact of water injection on H2 engine performance and efficiency at 2000 rpm.
Without water injection, the H2 engine achieved a peak ITE of 41% as the load was increased to 16.5 bar IMEP, before it started to decline under higher loads due to spark retardation and richer lambda operation. However, introducing water injection enhanced the maximum ITE to 42.5% at a slightly higher load of 18 bar by extending the burn duration and advancing the spark timing by 7°.
Figure 12 depicts the burn characteristics of hydrogen under different loads, along with the impact of water injection on burn duration and spark advance. It is noted that introducing water injection did not significantly alter the engine stability metrics, COV and LNV. Higher instability at the lowest load of 4 bar IMEP was found to be linked to slightly larger cyclic variation of the injector as the flow rate was approaching its minimum. However, water injection led to significant increase in the combustion durations. The total burn duration was increased by 6° at 18 bar due to the water injection.
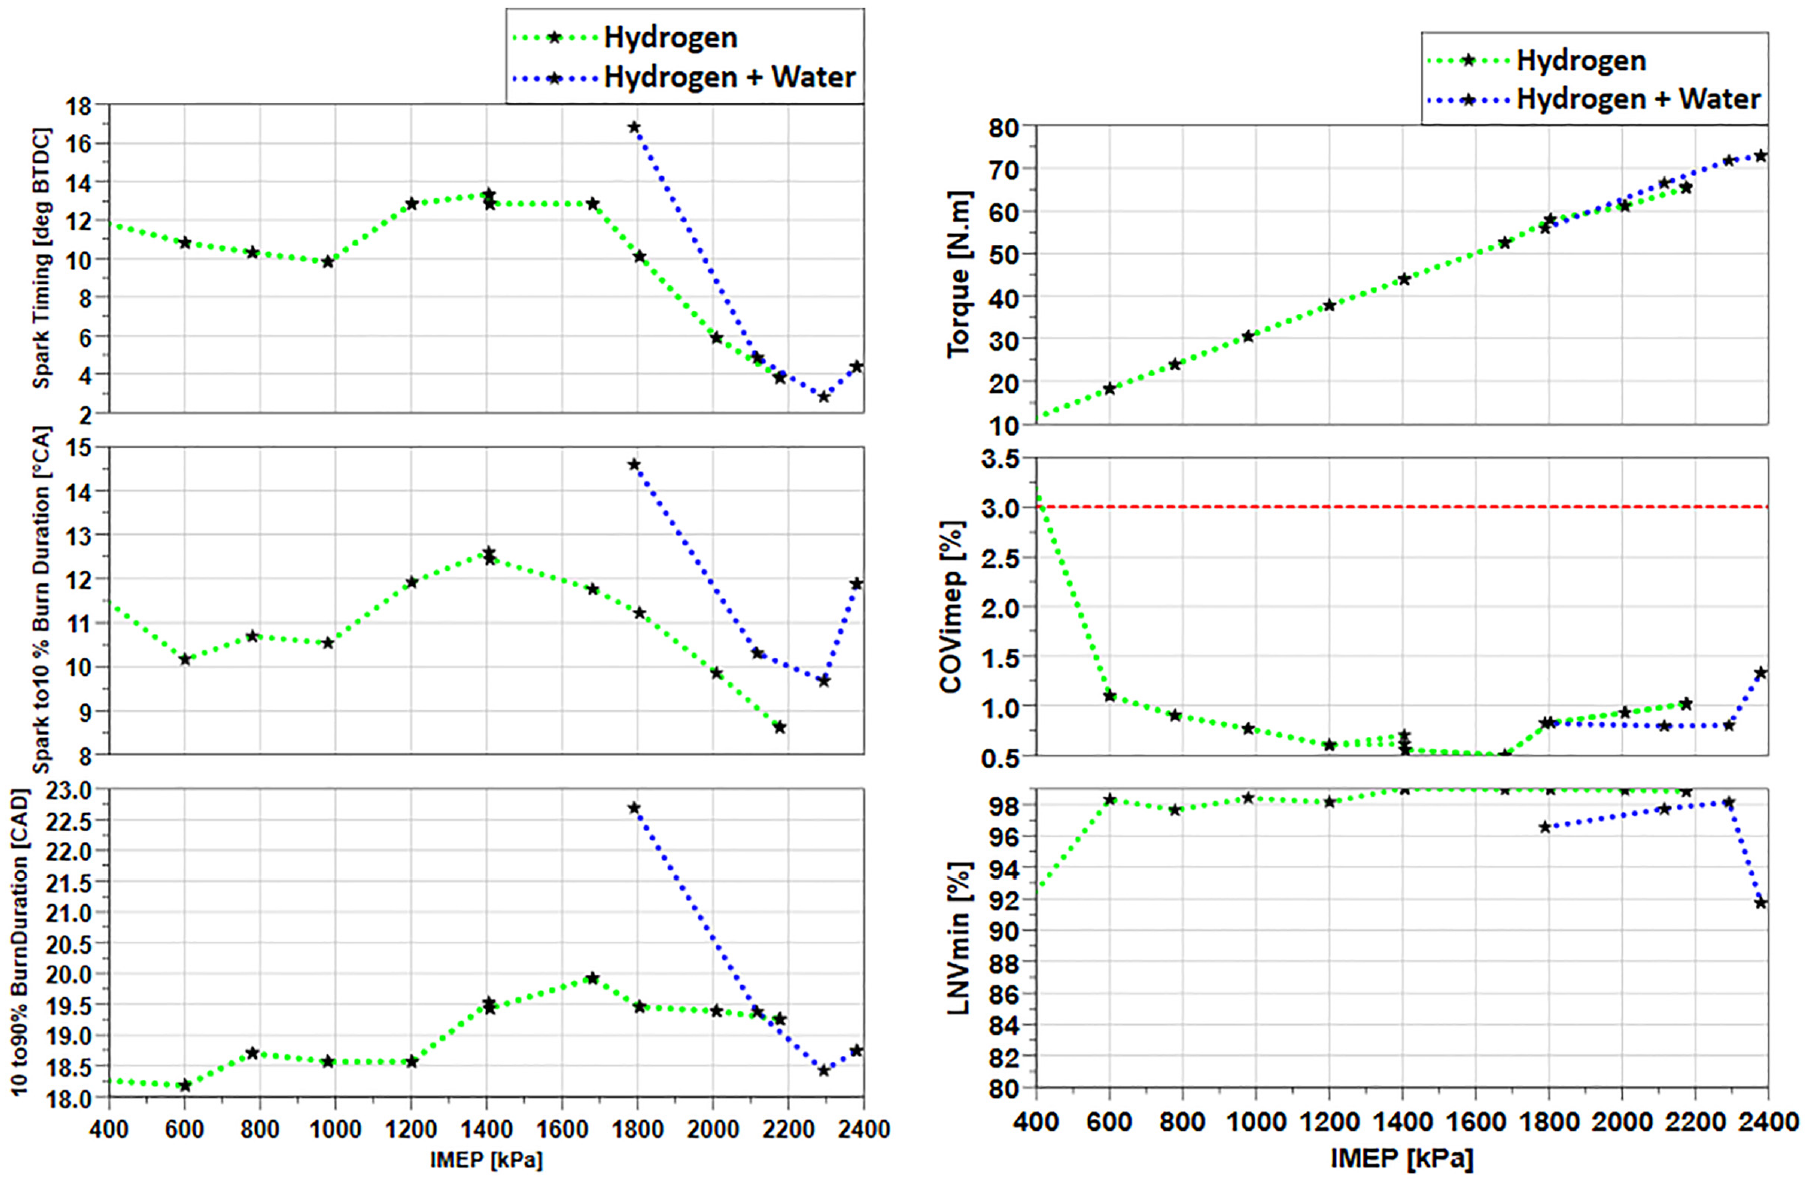
Effect of water injection on spark timing, burn durations and combustion stability at 2000 rpm.
Figure 13 illustrates the hydrogen slip and NOx engine-out emissions. Introducing water injection at high loads resulted in a slight increase in hydrogen slip while maintaining the hydrogen slip at a very low level. The NOx engine-out emission increased rapidly when the load was increased above 16.5 bar IMEP without the water injection due to enriched mixture operation ( see top right graph in Figure 11). However, NOx emission was dropped by more than 57% with water injection, even at lower lambda values and higher loads.
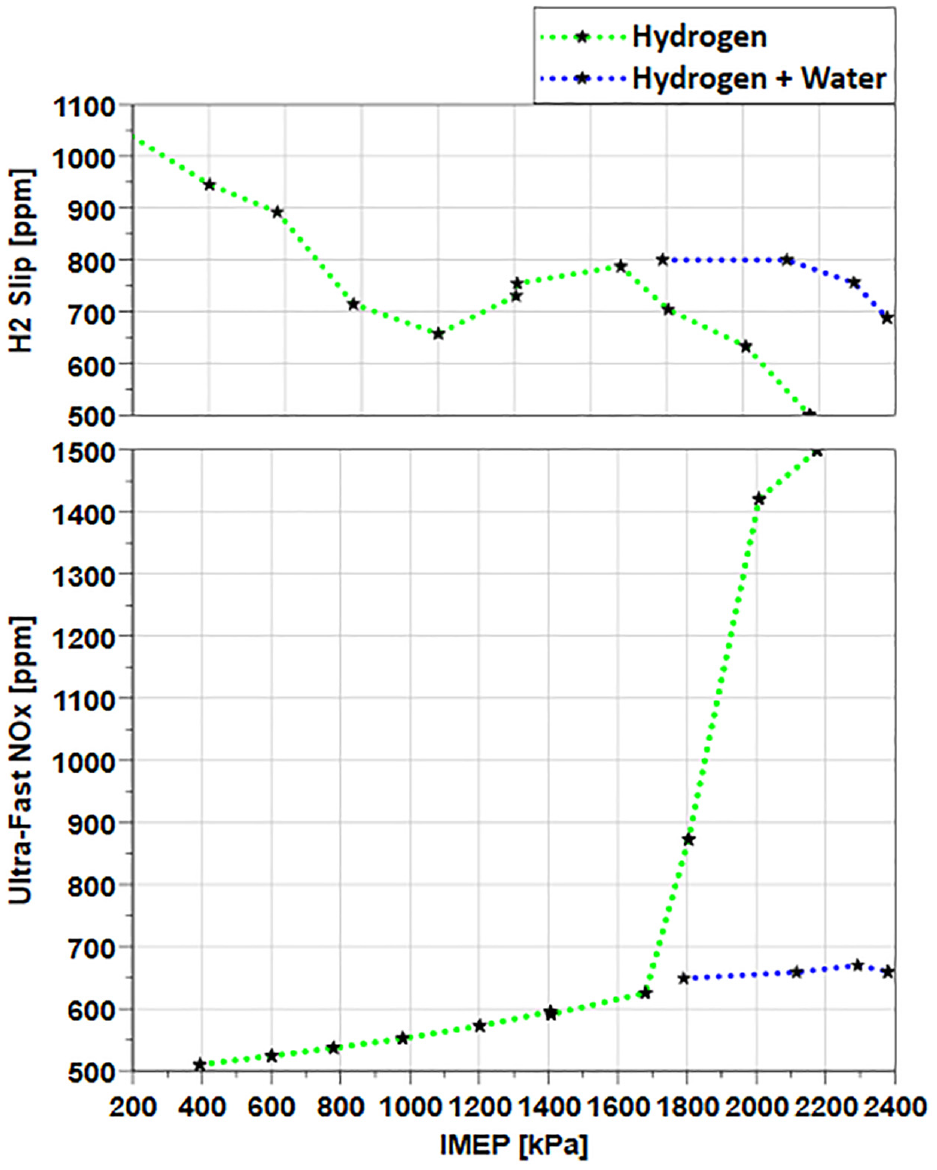
NOx and H2 slip engine-out emissions versus load sweep.
The above results have clearly demonstrate that water injection is an very effective means to improve the H2 engine’s high load performance and Emissions. These benefits encompass the expansion of engine load and peak torque output, coupled with an enhancement in Indicated Thermal Efficiency (ITE), thus enabling the operation at leaner conditions with decreased necessity for boosting to attain higher loads. Additionally, these favourable outcomes can be achieved together with a substantial reduction in NOx emission.
Conclusion
In this study, a comprehensive assessment of the water injection on H2 SI engine’s performance, efficiency and NOx emission was performed on single cylinder boosted direct injection H2 engine. The study commenced by establishing the baseline performance of the DI H2 engine with a centrally mounted DI injector at an injection pressure between 20 and 30 bars. The results demonstrated that a H2 IC engine could achieve zero carbon emission with ultra-low NOx emissions through ultra-lean burn combustion up to lambda 4.0.
The outcomes are clear when it comes to identifying the water’s impact on the combustion characteristics. The burn duration and the spark advance were significantly influenced by even the smallest amount of water injected at 1.5 kg/h. However, the maximum NOx reduction of 79% was achieved at a higher water injection rate of 5 kg/h at a lambda value of 1.8.
The water injection allowed the engine to run with the stoichiometric mixture without boosting and improved the ITE by 2%, with an average drop of NOx emissions by 74%. Also, the maximum water concentration in the exhaust increased to 58%.
At higher load regions, the water injection extended the maximum engine load to 24 bar IMEPand increased the engine torque output by 10%. The maximum ITE was increased from 41% at 16.5 bar IMEP to 42.5% at 18 bar IMEP at a lower lambda value and hence less boosting. In particular, water injection dropped the NOx emissions at the extreme load conditions by more than 55%, even at lower AFR in comparison to the pure hydrogen at higher lambda.
The above findings have clearly demonstrated the signicant potential of water injection in improving H2 engine’s performance and efficiency as well as keeping the H2 engine’s NOx emission at ultra-low levels. Additionally, the high water vapour concentration in the engine’s exhaust gas provided the opportunity to obtain sufficient in-situ water for water injection into the engine’s intake without external additional water supply.
Footnotes
Appendix 1: Uncertainty in measurements
Engine test equipment.
| Measurement | Device | Manufacturer | Measurement range | Linearity/accuracy |
|---|---|---|---|---|
| Engine speed | AC Dynamometers (Asynchronous) | Sierra Cp Engineering | 0–6000 rpm | ±1 rpm |
| Engine torque | AC Dynamometers (Asynchronous) | Sierra Cp Engineering | −50–500 nm | ±0.25% of FS |
| Clock Signal | EB582 | Encoder Technology | 0–25,000 rpm | 0.2 CAD |
| Hydrogen flowrate | Coriolis flowmeter K000000453 | Alicate Scientific | 0–10,000 g/h | ±0.20% of reading |
| Intake air mass flow rate | F-106 AI | Bronkhust | 4–200 kg/h | ±0.2% of reading |
| In-cylinder pressure | Piezoelectric pressure sensor Type 6125C | Kistler | 0–30 MPa | ≤±0.4% of FS |
| Intake pressure | Piezoresistive pressure sensor Type 4049A | Kistler | 0–1 MPa | ≤±0.5% of FS |
| exhaust pressure | Piezoresistive pressure sensor Type 4049B | Kistler | 0–1 MPa | ≤±0.5% of FS |
| Oil pressure | PX309-10KGI | omega | 0–0.8 MPa | <±0.2% of FS |
| Temperature | Thermocouple K Type | RS | 233–1473 K | ≤±2.5K |
| Fuel injector current signal | Current probe PR30 | LEM | 0–20 A | ±2mA |
| PM emissions | DMS 500 | Cambustion | 0–5000 PPS | - |
| CO emissions | MEXA-584L | Horiba | 0–12 vol% | ≤±1.0% of FS or ±2.0% of readings |
| CO2 emissions | MEXA-584L | Horiba | 0–20 vol% | ≤±1.0% of FS or ±2.0% of readings |
| O2 | MEXA-584L | Horiba | 0–25 vol% | ≤±1.0% of FS or ±2.0% of readings |
| THC emissions | Rotork Analysis Model 523 | Signal | 0–5000 ppm | ≤±1.0% of FS or ±2.0% of readings |
| NO/NO2 emissions | CLD 150 (Heated Chemiluminescence Detector) | Cambustion | 0–500 ppm or 0–10 k ppm | ≤±1.0% of FS or ±2.0% of readings |
| H2O | NDIR prototype By Cambustion | Cambustion | 0%–68% | ≤±0.50% of FS or ±1.0% of readings |
| H2 slip emissions | Air sens500 | V&F | 0–5000 ppm or 0%–100% vol | 0.5% of fs or 1% vol |
Appendix 2: In-cylinder pressure and heat release data for hydrogen and water injection
Declaration of conflicting interests
The author(s) declared no potential conflicts of interest with respect to the research, authorship, and/or publication of this article.
Funding
The author(s) received no financial support for the research, authorship, and/or publication of this article.