
Abstract
To investigate the influence mechanism of the light-off characteristics and secondary pollutants (N2O and NH3) of the Pd/Rh catalytic converter for natural gas engines, a global model of the catalytic converter and a more comprehensive catalytic reaction mechanism were first established. Further, the model and the catalytic reaction mechanism were validated by using experimental data. Then, the effects of exhaust temperature and exhaust composition (H2O, O2, and H2 concentrations) on the catalytic converters were investigated. The results showed that a higher temperature reduced the light-off time t50 of NO and CO. The production of N2O decreased to 0 at high temperatures due to the reduction reactions of R14 (N2O+H2 = H2O+N2) and R16 (N2O+CO = CO2 + N2). NH3 would form at the temperature above 825 K, and the required H2 originated from SR and WGS reactions. Increasing the H2 concentration promoted the conversion of NO and CO. When the temperature exceeds 600 K, increasing the H2 concentration decreases the production of N2O. H2O has the opposite effect on the production of N2O and NH3 at high temperatures. Increasing the content of H2O increased the conversion of NO and inhibited the conversion of CO. O2 concentration at 4000 × 10−6 is beneficial to reduce secondary pollutants of N2O and NH3. At the condition of 730–820 K and 4000 × 10−6 O2, the productions of N2O and NH3 were reduced to 0. This study contributes to the efficient application of Pd/Rh catalytic converters and further enhances the emission reduction of natural gas engines.
Introduction
To alleviate energy and environmental problems, adopting natural gas as a vehicle fuel has become one of the effective ways to adjust the energy consumption structure of vehicles and reduce emissions. 1 The advantages of natural gas are lower greenhouse gas emissions and almost no particulate formation. 2 The natural gas engines with three-way catalytic converters (TWC) have become the dominant technology. 3 However, pollutants such as CO and NOx would generate greenhouse gas N2O and toxic corrosive gas NH3 in the catalytic converter, which has received more attention in the latest emission standards. 4
The core of the TWC is a multi-channel ceramic or metal honeycomb structure with a layer of precious metals (Pt, Pd, Rh) coated on the inner walls of the channels. 5 Precious metals are active sites and act as catalysts for oxidation and reduction. 6 The precious metal Pd is the most widely used in the after-treatment system of the natural gas engine, because of its good CH4 oxidation capacity at low temperatures. 7 However, compared to the Rh catalyst, the self-poisoning of hydrocarbon molecules leads to poor NOx reduction of the Pd catalyst. 8 Furthermore, Rh plays an important role in enhancing NOx reduction and contributes to the suppression of NH3 emissions. 9
The performance of catalytic converter for CO oxidation and NO reduction is correlated with exhaust temperature, active metal composition and oxygen storage capacity (OSC), 10 as demonstrated in the existing studies. Sadokhina et al. 11 found that NO promoted the oxidation of CH4 in the presence of H2O. H2O can produce H2 and form HNO2 through an H2-NO reaction at high temperatures, the HNO2 is easy to react with CH4. Gärtner et al. 12 found that H2O inhibited CH4 oxidation. The steam resistance activity can be obtained when added Pt to the Pd catalyst. Wang et al. 13 found that NH3 was generated by the hydrogen drop reaction of hydroxyl molecules. The hydroxyl-induced WGS reaction led to the formation of NH3 on the Rh-CeO2 catalyst. The hydroxylation induced by H2O could promote the formation of NH3. Wang et al. 14 inferred that NH3 was mainly generated in the 250°C–550°C range via ion molecular reaction mass spectrometry. The decrease of λ and OSC leads to the increase of NH3 generation selectivity. The key of reducing NH3 emission is to improve the OSC of TWC and control λ close to 1.0 under rich conditions. Adams et al. 15 investigated the influence of temperature and cerium content on NH3 formation through static and transient flow reactor experiments. The results showed that NH3 formation is slightly delayed in the samples when the temperature is higher than 350°C, and N2O is formed earlier than NH3 when the temperature is lower than 175°C.
From the above studies, it can be noticed that most of the existing studies are based on single-metal catalytic converters and rarely deal with the reaction mechanism of Pd/Rh combination catalytic converters. Furthermore, natural gas engines have high exhaust temperatures and large H2O content in the exhaust. 16 The current studies seldom focus on the contribution pattern of H2O, O2 and H2 to N2O and NH3 generation on Pd/Rh catalytic converters at high temperatures. To investigate the light-off performance of NO and CO and the influence mechanism of N2O and NH3 production in Pd/Rh catalytic converters at high temperatures, a global model of the catalytic converter and a more comprehensive catalytic reaction mechanism suitable for natural gas engines were first established. Further, the model and the catalytic reaction mechanism were validated by using experimental data. Then, the influence of exhaust temperature and composition (H2O, O2 and H2 concentrations) on Pd/Rh catalytic converters were investigated. This study contributes to the efficient application of Pd/Rh catalytic converters and further enhances the emission reduction of natural gas engines.
Methods and mechanism
Reaction kinetics equation and mechanism
The reaction kinetics equation is shown in equations (1) and (2) of the Supplemental material. As shown in the reaction kinetics equations, the reaction mechanism of the different catalysts is different. To ensure the accuracy of the calculation, the chemical reaction kinetics analysis is required. Furthermore, the parameters of
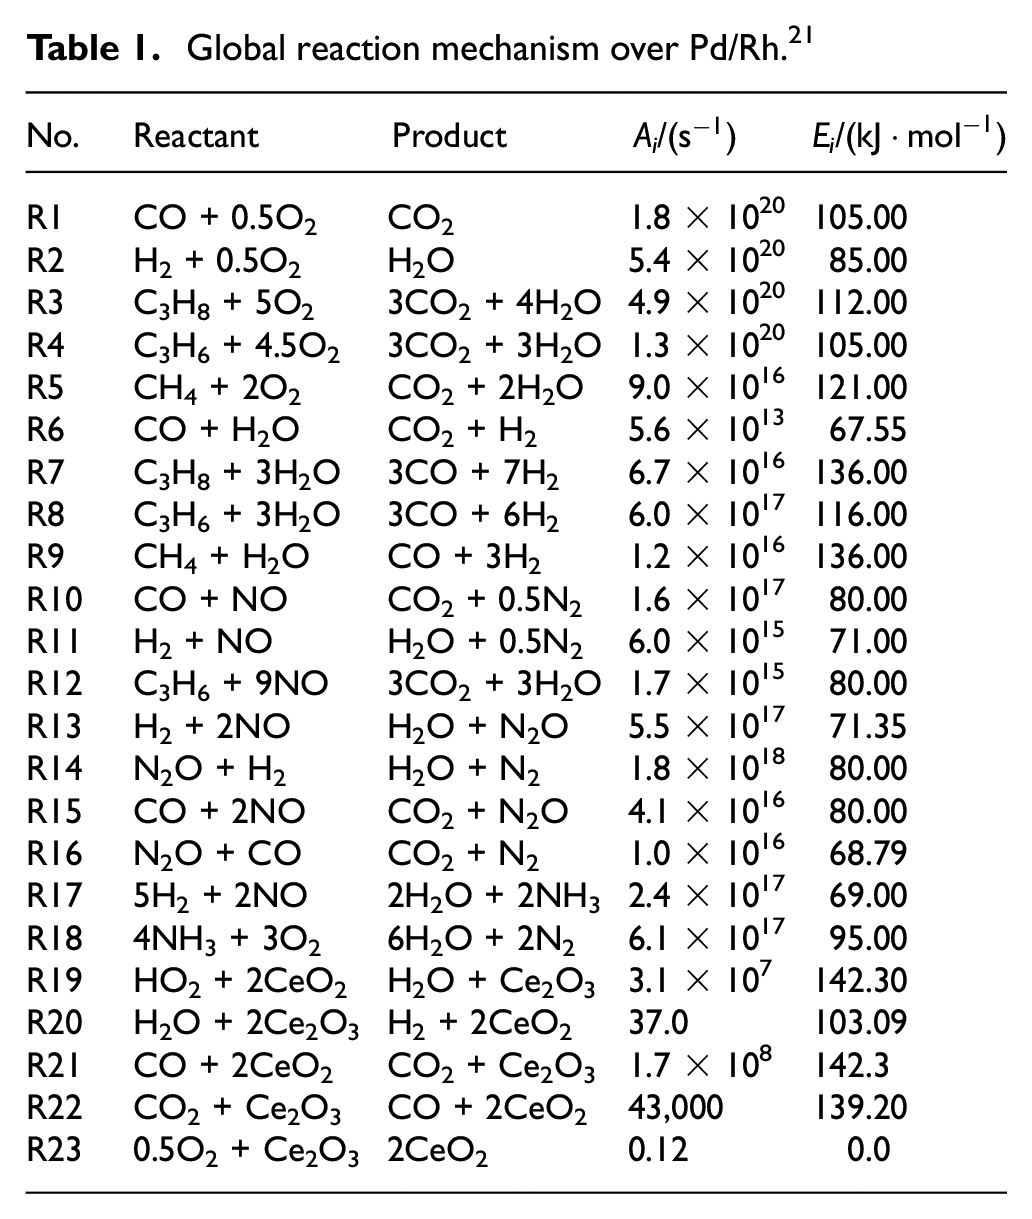
Combined with the reaction mechanism of the Pd/Rh catalyst in the software database and literature, the mechanism used in this study was established, which mainly included 10 gas-phase species and 23 reactions. Table 1 shows the global reaction mechanism over Pd/Rh catalyst, which covers the chemical reactions such as CH4 oxidation and NO reduction. The mechanism of NO reduction considered the formation of NH3, N2, and N2O. Defoort et al. 17 noted that NO2 was not found in the catalytic converter, thus the reactions involving NO2 emission were not evaluated in this study. It is believed that both NH3 production and oxidation reactions would occur in the catalytic converter. Figure 1 shows the reaction network of ammonia selective oxidation, which includes three detailed oxidation routes: (1) Direct catalytic oxidation method, 18 (2) Indirect catalytic oxidation method, 19 and (3) Internal selective catalytic reduction method. 20 From the three oxidation pathways of NH3, it can be concluded that NH3 will eventually be converted to N2 and H2O, as shown in Table 1 R18: 4NH3 + 3O2 = 2N2 + 6H2O. Therefore, the reaction is used as the mechanism of NH3 oxidation in this study.
Global reaction mechanism over Pd/Rh. 21
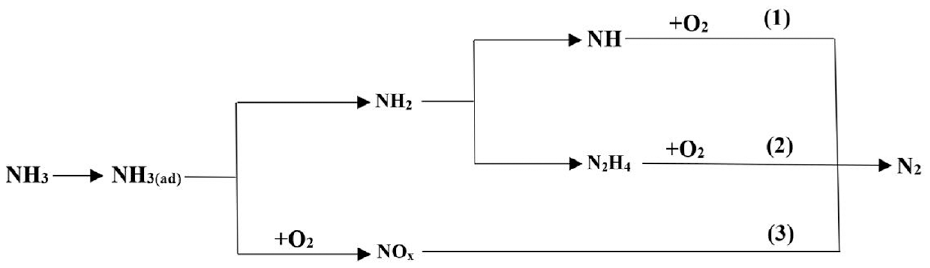
Selective oxidation of ammonia.
TWC model
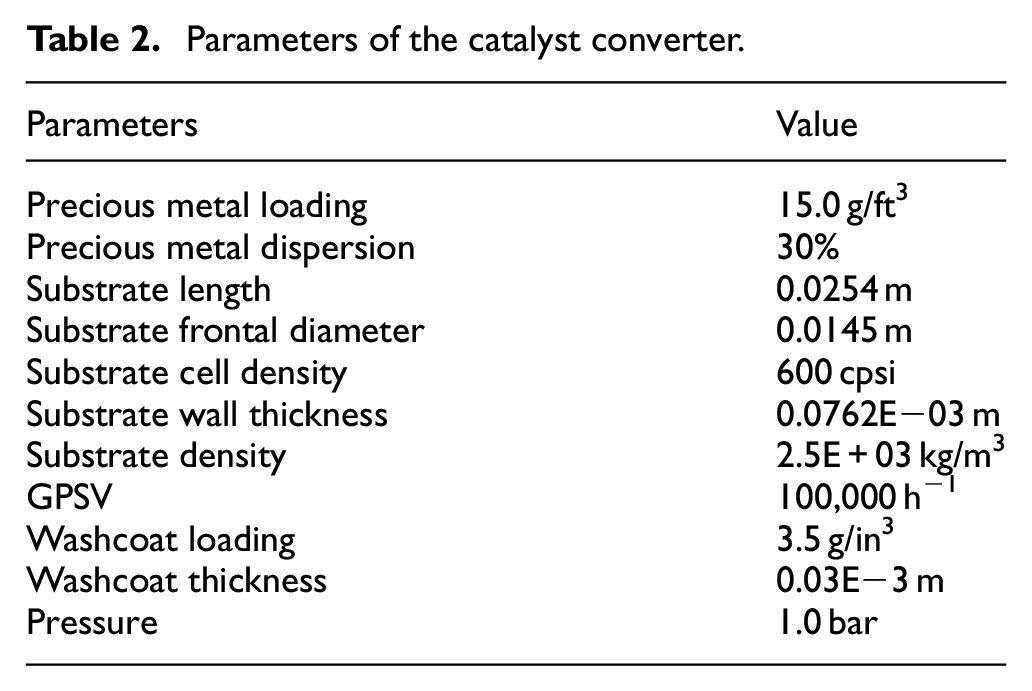
Figure 2 illustrates the test model and the structure of the catalytic converter, which is built by GT-Suite software. The test model consists of the reaction gas input and output modules, and the catalytic converter parameters module, as shown in Figure 2(a). The catalytic converter without considering the heat transfer losses is shown in Figure 2(b). Furthermore, the catalytic converter temperature was considered only along the axis variation, neglecting the variation along the radial direction. The diffusion effect of the model in the coating was not considered. The catalytic converter followed the three material conservation equations. In addition, the temperature of the catalytic converter varied in the axial direction, but not in the radial direction, and the diffusion effect within the coating was not considered. The structure parameters of the catalyst converter are shown in Table 2.
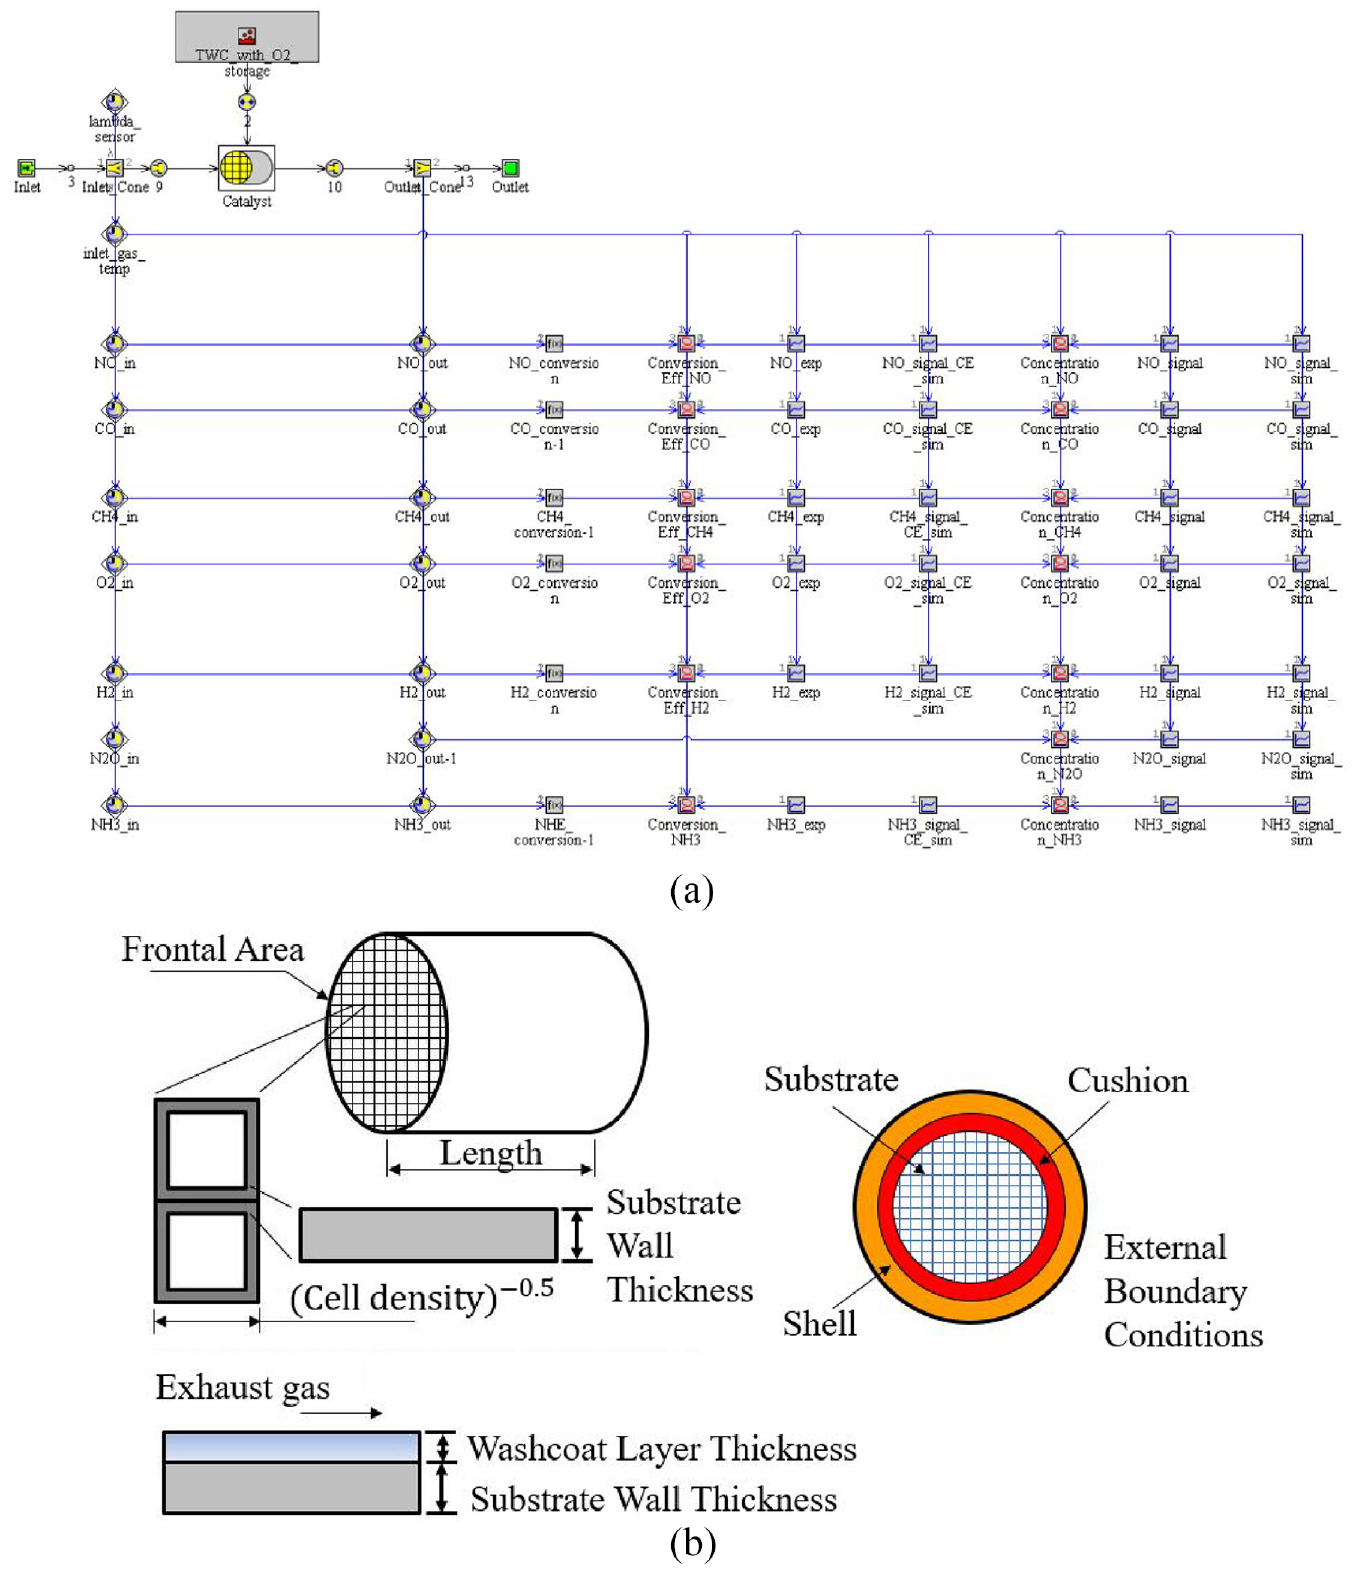
TWC test model (a) and catalytic converter structure (b).
Parameters of the catalyst converter.
The temperature of the catalytic converter varied in the axial direction, but not in the radial direction, and the diffusion effect within the coating is not considered.
Validation
Based on the established test model and catalytic converter parameters, preliminary calculations were developed. To verify the reliability of the test model, the calculated N2O and NH3 formation and NO and CO conversion were compared with the experimental data of Kang et al. 22 as shown in Figure 3. The composition of the exhaust was as follows: 0.47% CO, 0.14% H2, 0.25% NO, 9.25% CO2, 18% H2O, and balanced N2. The selectivity of N2O and NH3 formation and the conversion of reactants were shown in equations (3) and (4) of the Supplemental Material. Notably, the trends of the simulated and experimental data were in general agreement, and the maximum relative error of the result was less than 5%. This is because the catalytic converter model only considers the main reaction processes and ignores the reactions that have little effect. In addition, it is feasible to carry out subsequent studies on the Pd/Rh catalytic converter model.
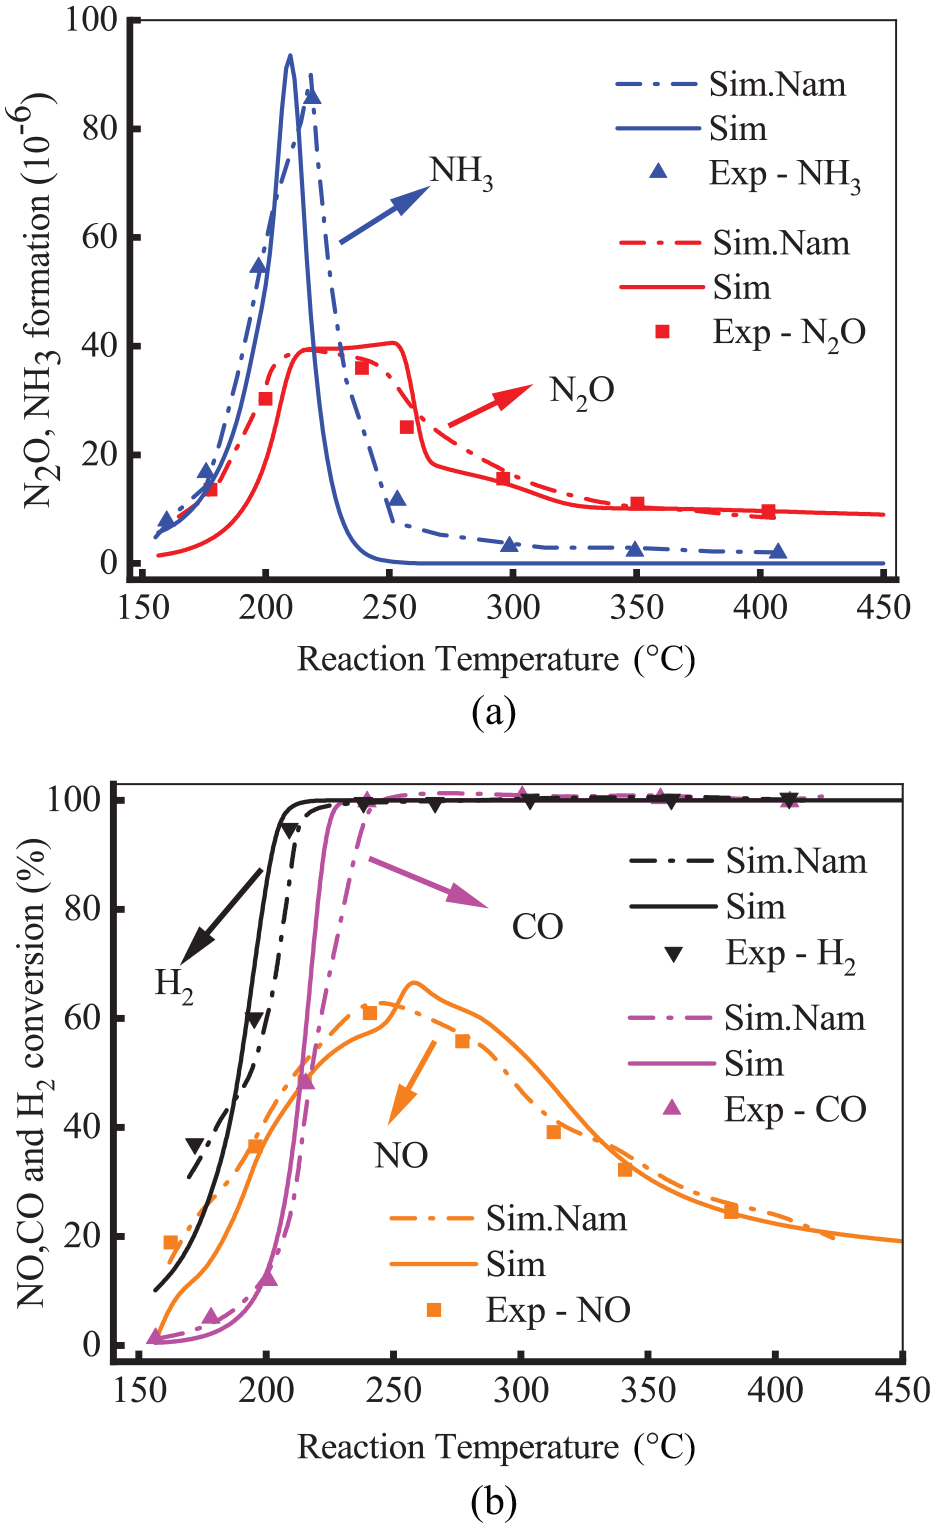
Comparison of the formation of N2O and NH3 (a) and the conversion of NO and CO (b) experimentally and numerically.
Results and discussions
Effect of the temperature on light-off characteristics and secondary pollutants
The light-off characteristics of NO and CO
Figure 4 shows the conversion efficiency of NO and CO under different initial temperatures. The t50 denotes the light-off time, and the t90 signifies the complete conversion time. As shown, the t50 and t90 of NO and CO decreased with the increase of initial temperature. Compared with that of 373.15 K, the light-off time for NO and CO at 473.15 K advanced about 600 s. As we know, the higher initial temperature was conducive to the catalytic reaction. Notably, the conversion efficiency of NO first rose and then declined. This is because the NO reduction reaction is weakened due to the reactions of CO-O2 (R1: CO + 0.5O2 = CO2) and H2-O2 (R2: H2 + 0.5O2 = H2O) at this temperature. As the temperature increased, CH4 generated CO and H2 through the SR reaction, leading to a decrease in CO conversion. However, the generated CO and H2 participated in the NO reduction reaction, resulting in another increase in NO conversion.
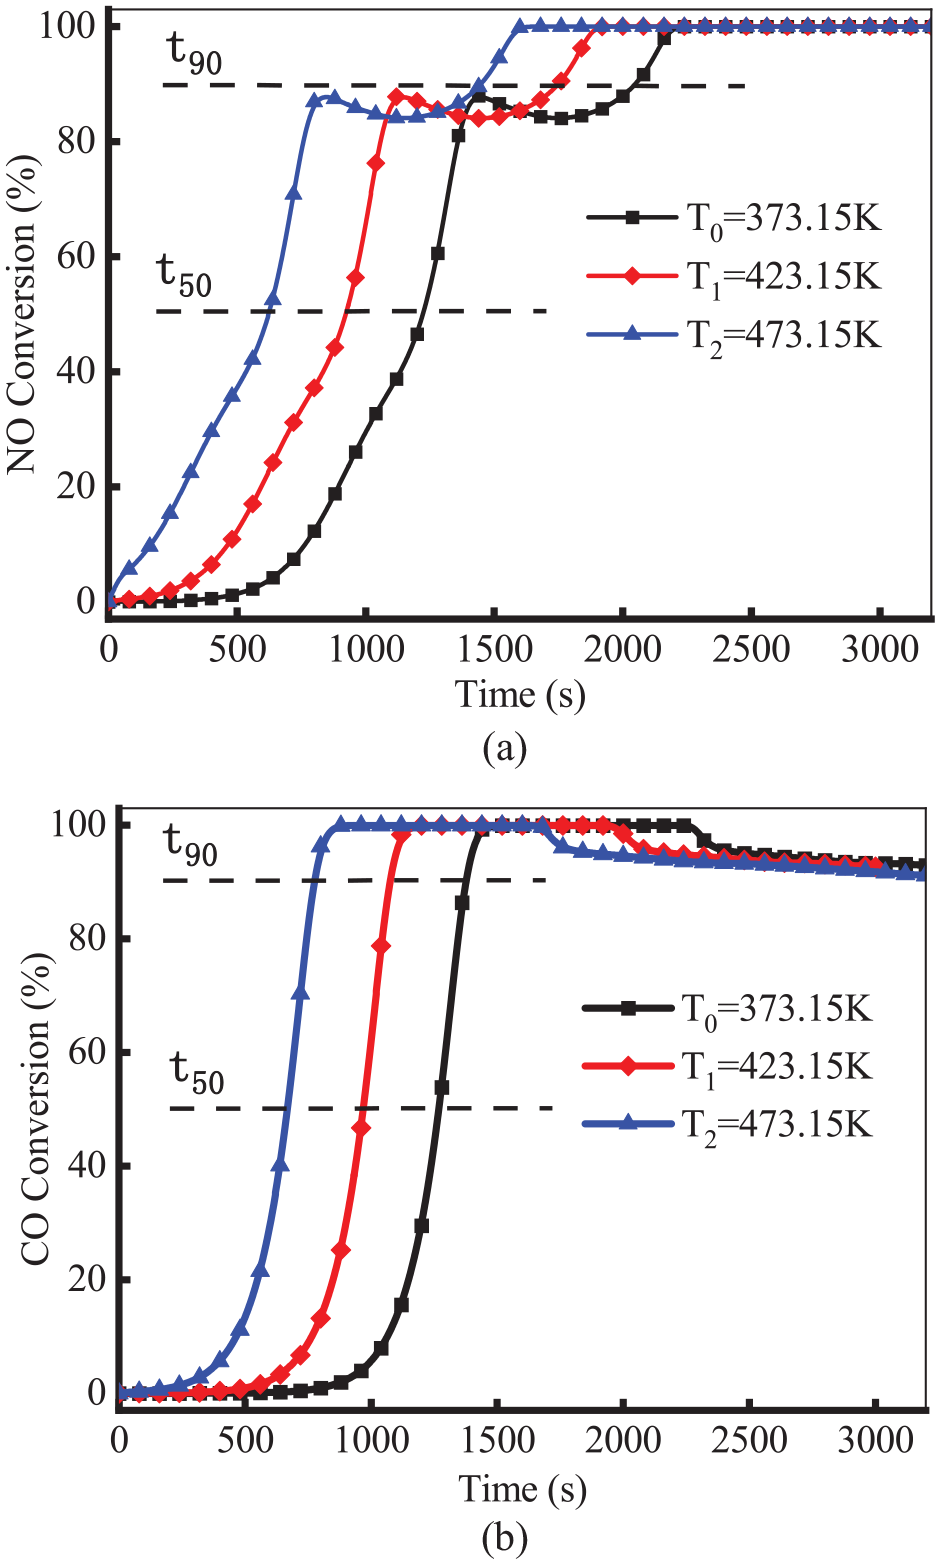
Conversion efficiency of NO (a) and CO (b) at different initial temperatures.
The selectivity of N2O and NH3
Figure 5 shows the formation of N2O and NH3 at different inlet temperatures. As shown, the H2-NO reaction proceeded in preference. This is because its activation energy is lower than that of the CO-NO reaction. At the temperature of 450 K, the concentrations of H2 and NO decreased, which demonstrated that the H2-NO reaction started at the stage. This results in the production of N2O and NH3. As the temperature rose, the reaction of CO-NO started at the temperature of 500 K, which also increased N2O and NH3 components. The production of NH3 first increased and then decreased, which reached a peak of 268 × 10−6 at 546 K. There was almost no NH3 formation when the temperature reached 620 K. The N2O concentration increased slowly, reaching a peak concentration of 215 × 10−6 at 586 K. There was almost no N2O and NH3 formation at the temperature above 740 K. The reason is the occurrence of N2O reduction and NH3 oxidation reactions. Further, H2 reacted with O2 at high temperatures, thus CO served as the main reducing agent when the temperature reaches 550 K. It can be deduced that in the light-off period, the CO-NO reaction produces N2O through the reaction of R15: CO + 2NO = CO2 + N2O. Besides, CO and H2 concentrations increased at 745 K, which might be attributed to the reaction of R9: CH4 + H2O = CO + 3H2 and R6: CO + H2O = CO2 + H2. H2 reacted with NO, which generated NH3 again at 845 K. This increased the formation of NH3, which finally stabilized at 135 × 10−6. However, there was no N2O at this stage. This is because, at high temperatures, N2O is readily transformed into N2 through reduction reactions. This was similar to the results of Huai et al. 23 who stated that more than 95% of N2O emissions would be formed between 523 and 723 K.
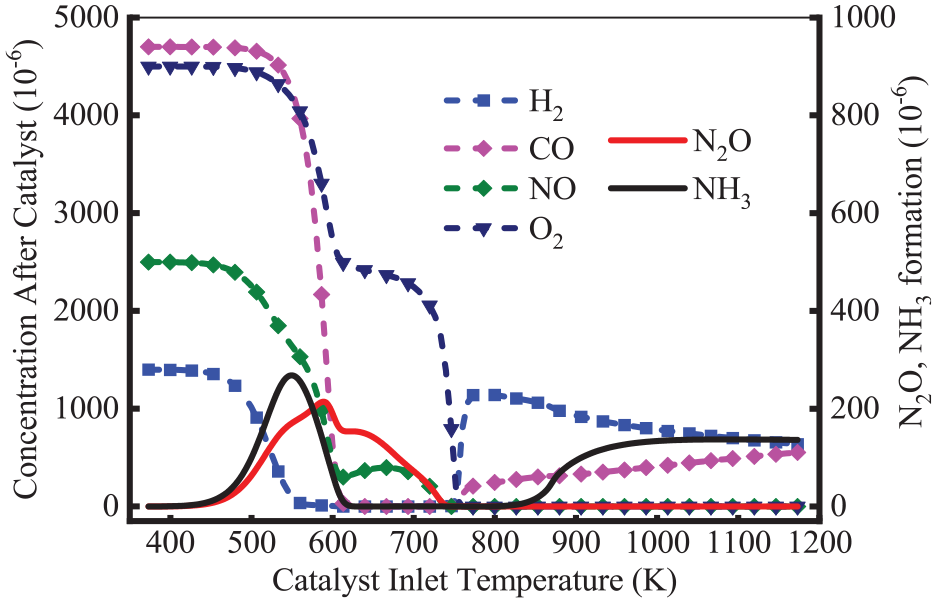
Variation of the concentrations of H2, CO, NO and O2 and the formation of N2O and NH3 at different inlet temperatures.
Figure 6 shows the variation of the production and selectivity of N2O and NH3 at different inlet temperatures. As shown, the selectivity of N2O was always higher than that of NH3 in the range of 350–740 K. As the temperature increased, the selectivity of N2O and NH3 declined to 0 in 740–825 K. This is because the production of N2O and NH3 is inhibited. Furthermore, the NH3 selectivity increased slightly at the temperature of 825 K, and its concentration reached 135 × 10−6 when was above 980 K. At this stage, the selectivity of NH3 stabilized at about 5%, while the N2O selectivity was 0. The presence of NH3 in 720 and 900 K was reported by Heeb et al. 24 who also pointed out that H2 was the key factor in the production of N2O and NH3.
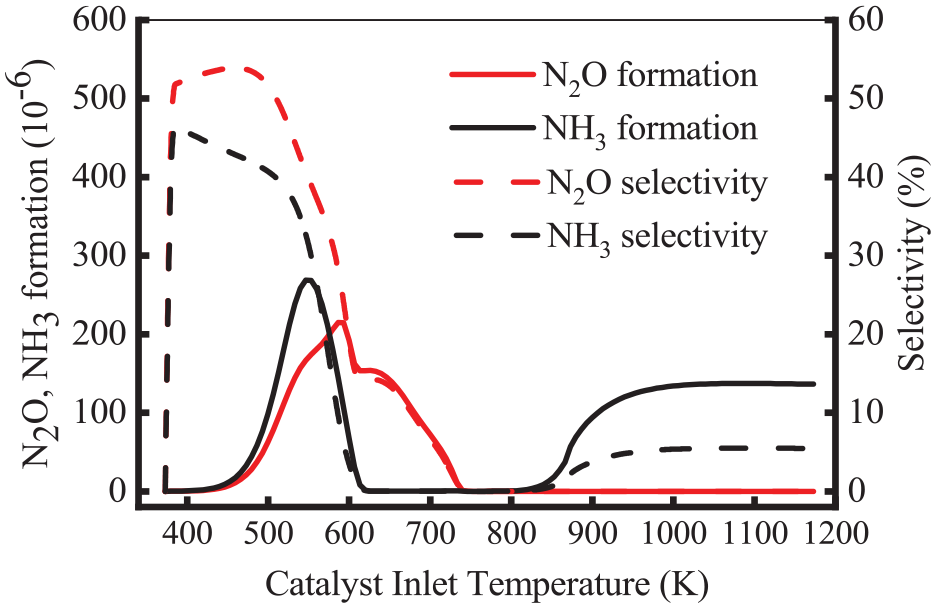
Variation of the formation and selectivity of N2O and NH3 at different inlet temperatures.
In a word, in the range of 450–740 K, N2O is primarily formed by the reduction reaction of NO-CO. NH3 is mainly formed via NO-H2 reduction reaction in the range of 450–620 K. Further, NH3 can be formed at a temperature above 825 K, and the required H2 in the stage originates from SR and WGS reactions. Besides, there is almost no N2O formation at high temperatures. This is because N2O is easily converted into N2 again by the reactions of R14: N2O + H2 = H2O + N2 and R16: N2O + CO = CO2 + N2.
Analysis of N2O and NH3 reaction pathways
The formation of N2O and NH3
Figure 7 shows the variation of the production of N2O, H2, and NH3 and the conversion of NO, CO, and H2. The inlet flow of dry full feed signifies 0.25% NO, 0.14% H2, and 0.47% CO, while the wet full feed is 0.25% NO, 0.14% H2, 0.47% CO, and 18% H2O. As illustrated in Figure 7(a), the production of N2O increased at 395 K and reached the peak of 220 × 10−6 at 553 K under dry full feed. In this stage, H2 concentration gradually declined to 0, but the concentration of CO changed less. This means the start time of the NO-H2 reaction is earlier than the CO-NO reaction. NH3 was first found at 420 K and then reached a peak of 406 × 10−6 at 526 K under dry full feed. The NH3 concentration declined to 270 × 10−6 at 624 K. This means that NH3 is the mainly side-product at high temperatures, and the production of N2O decreases to 0. As shown in Figure 7(b), the production of N2O reached the peak of 212 × 10−6 at 540 K, while it was lower than that without H2O addition. Further, the time corresponding to the peak was earlier than that without H2O addition. As the temperature increased, the production of N2O sharply declined to 0. This means adding H2O can reduce the formation of N2O. As the temperature increased, the production of NH3 increased, which reached the peak of 970 × 10−6 at 700 K. Compared with that without H2O addition, the peak increased significantly at high temperatures. Furthermore, the formation of NH3 decreased to 880 × 10−6. This is because NH3 is formed into N2 via decomposition or oxidation reaction (R18) at high temperatures. Therefore, the productions of N2O and NH3 are closely related to H2 conversion for Pd/Rh catalysts.
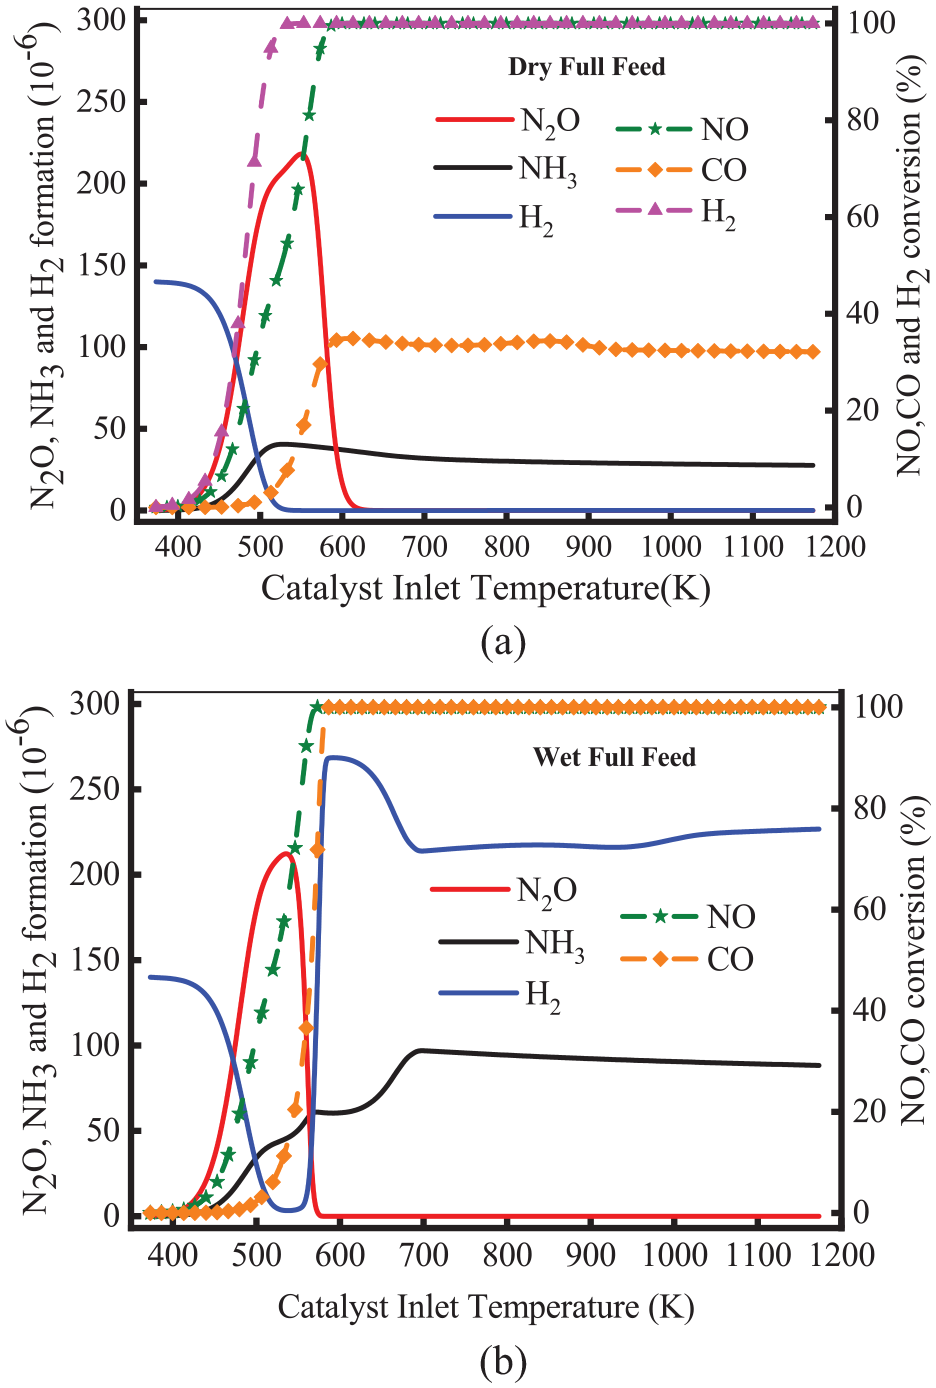
Variation of the formation of N2O, H2, and NH3 (a) and the conversion of NO, CO, and H2 (b).
As for the conversion of NO, CO and H2, a lower CO conversion was observed at the temperature above 550 K in Figure 7(a), which remained at 32%. A higher H2 conversion was also observed at the temperature above 550 K, which remained at 100%. The reason is that without H2O addition, WGS and SR reactions cannot occur. As illustrated in Figure 7(b), the production of H2 rose sharply at 550 K. As the temperature increased, H2 production decreased and then slowly increased. The conversion of CO increased sharply and finally stabilized at 100%. This means WGS and SR reactions occur at high temperatures. Therefore, the formation of NH3 increases sharply with adding H2O. The simulation results of CO and H2 in this paper are consistent with the experimental data. For example, in the range of 473–573 K, OH et al. 25 found the conversion efficiency of CO and H2 remained almost unchanged. However, a higher conversion was observed with H2O addition and higher temperature.
Steam reforming and water gas shift reactions
A detailed simulation of SR and WGS reactions is performed on Pd/Rh TWC, and the results are shown in Figure 8. As shown, the WGS and SR reaction started at about 540 and 650 K, respectively. For the WGS reaction, H2 was mainly produced at low temperatures. SR reaction was the main source of H2 at high temperatures. This means that at high temperatures, the Pd/Rh catalyst would generate H2. As presented in Figure 5, the production of N2O and NH3 increased sharply at 540 K because of the reaction of WGS. At 650 K, the production of H2 and the conversion of CH4 increased in the SR reaction. The amount of H2 and the conversion of CH4 reached a maximum at 840 K, which promoted a series of reactions such as H2-NO and CO-NO. This is consistent with the result that NH3 generates in large quantities when the temperature reaches 845 K. It indicates that the reactions of SR and WGS for the Pd/Rh catalyst are the main sources of H2. A similar result was also noted by Nevalainen et al. 26
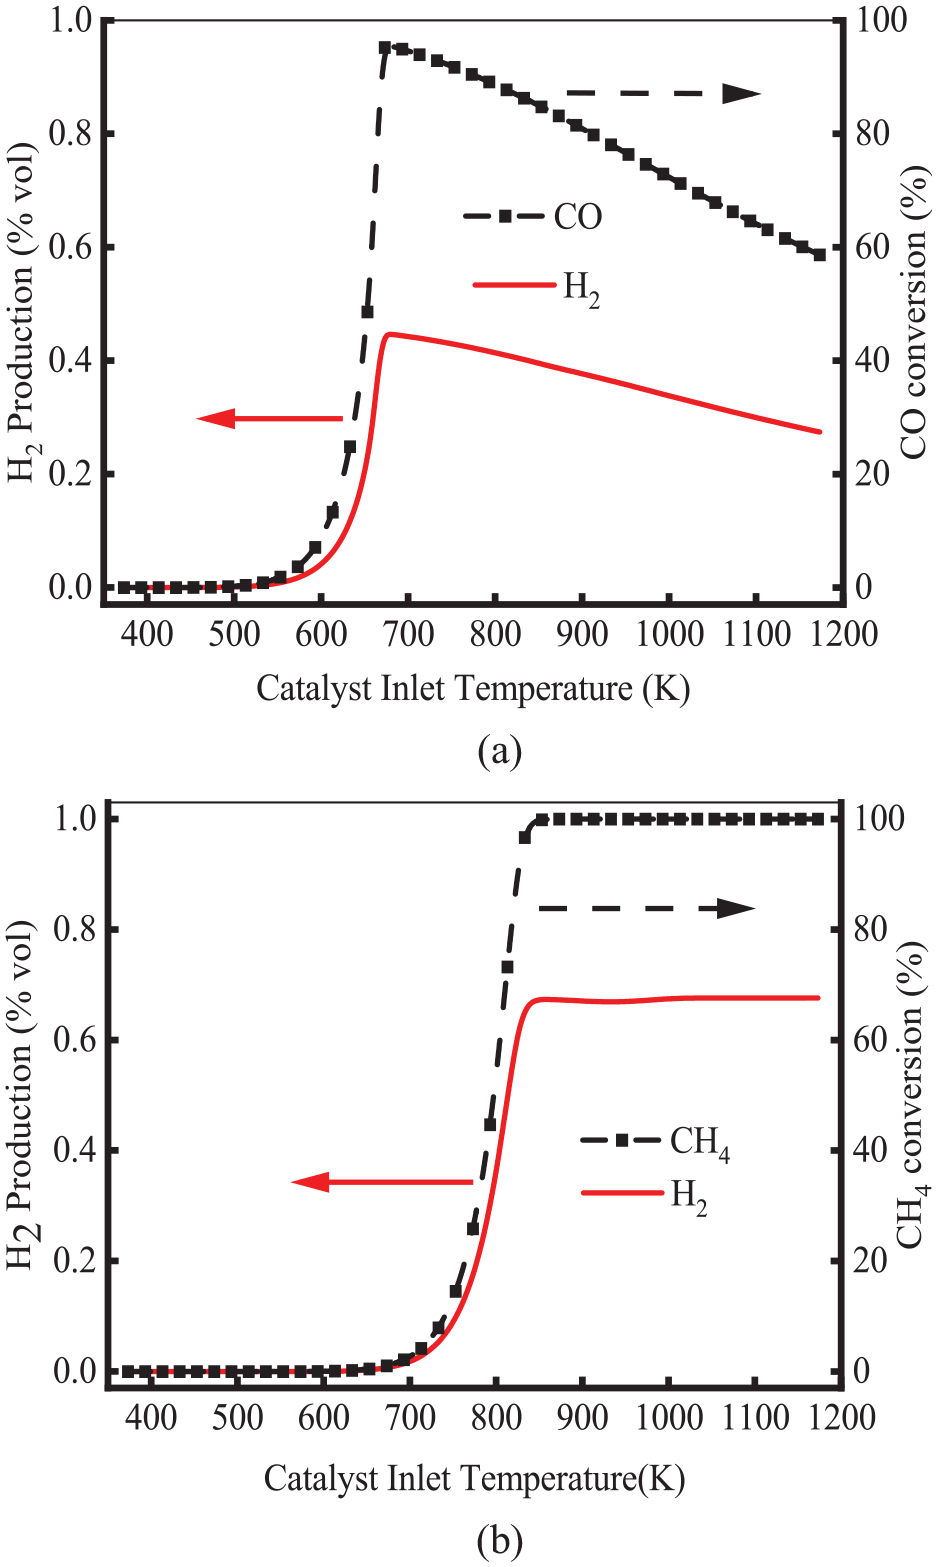
Production of H2 and conversion of CO and CH4 for the reaction of WGS and SR: (a) WGS reaction and (b) SR reaction.
Effect of exhaust composition on light-off characteristics and secondary pollutants
Effect of H2O content on light-off characteristics of NO and CO
Many studies have found that H2O (up to 10%) in exhaust gas plays an important role as an oxidant for unburned hydrocarbons. Stotz et al. 27 investigated the effect of H2O on catalyst activity and micro-kinetic mechanism, but the influence of H2O on NH3 and N2O formation was still not well understood. Figure 9 shows the conversion efficiency of NO and CO at different H2O contents. As shown in Figure 9(a), at a temperature below 620 K, the content of H2O showed less effect on the NO conversion. The reason is that the temperature does not reach the reaction conditions. As the temperature increased, the NO conversion decreased. In the presence of H2O, the NO conversion rate first dropped and then rose to 100%. The conversion of NO increased with the increase of H2O content. The reason is that H2O can diffuse, absorb and dissociate to the catalyst surface, which forms O(s). The O(s) may react with CH4 and produce CO and H2. As shown in Figure 9(b), at a temperature below 620 K, the content of H2O has less effect on the CO conversion. As the temperature increased, the CO conversion of 9% H2O increased and reached 100% at 626 K. However, in the cases of 18% and 27% H2O, CO conversion efficiency declined and then rose. This means increasing H2O content inhibits CO conversion within a certain range. The excess H2O will react with CO through WGS reaction, which inhibits the conversion of CO at higher H2O content.
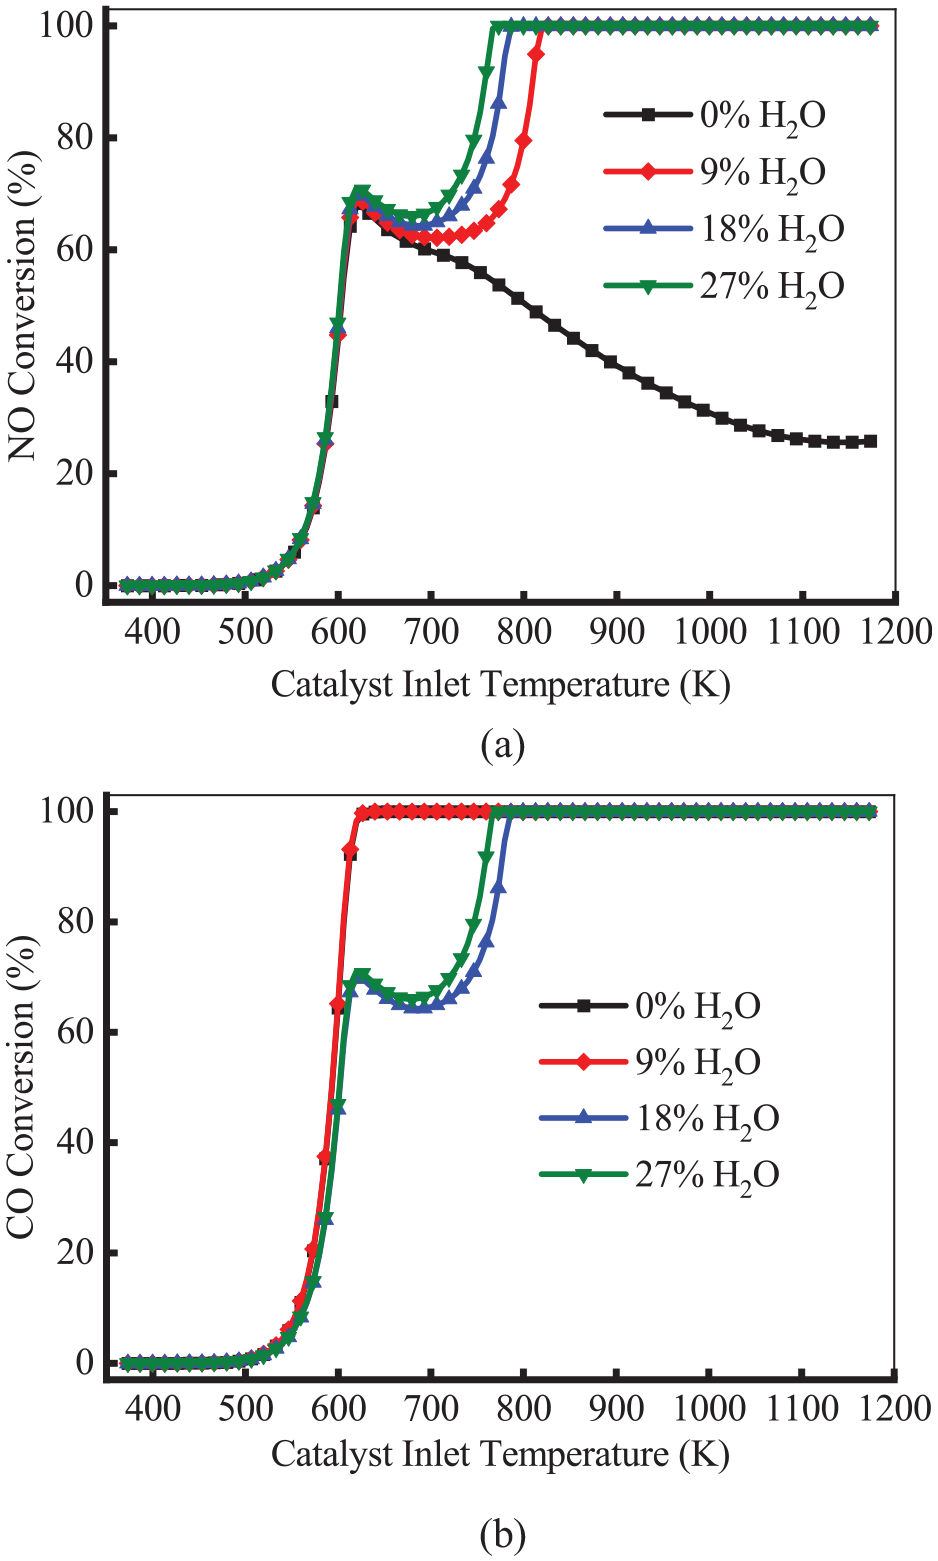
Conversion efficiency of NO (a) and CO (b) at different H2O contents.
Effect of H2O content on the formation of N2O and NH3
Figure 10 shows the variation of the production of N2O and NH3 at different H2O contents. To further investigate the relationship between H2O content and the production of N2O and NH3, H2 was not set in the inlet fraction. Furthermore, the catalyst deactivation effect caused by H2O was also ignored. As shown in Figure 10(a), the formation of N2O was not affected by H2O content in the range of 375–620 K. The N2O concentration decreased at 620 K, and it eventually dropped to 0 in the presence of H2O. The formation of N2O declined to 0at 773 K in the case of 27% H2O, while it existed at high temperatures in the case of 0% H2O. This means H2O could inhibit the formation of N2O. The reason is that the addition of H2O induces SR and WGS reactions, and these reactions produce CO and H2 at high temperatures. The CO and H2 reduce with N2O (R14: N2O + H2 = H2O + N2&R16: N2O + CO = CO2 + N2), which results in a decrease in the N2O formation. As illustrated in Figure 10(b), the production of NH3 was 0 in the case of 0% H2O. As the H2O content increased, the peak of NH3 concentration increased. For example, the peak of NH3 concentration of 27% H2O increased by 30 × 10−6 compared with that of 9% H2O. The reason is that H2O generates H2 through SR and WGS reactions, which is beneficial to produce NH3 through the H2-NO reaction (R17: 5H2 + 2NO = 2H2O + 2NH3). However, NH3 is easily oxidized to N2 under high temperatures and oxygen-rich conditions. This results that NH3 concentration dropping to 0 at 630 K for all cases.
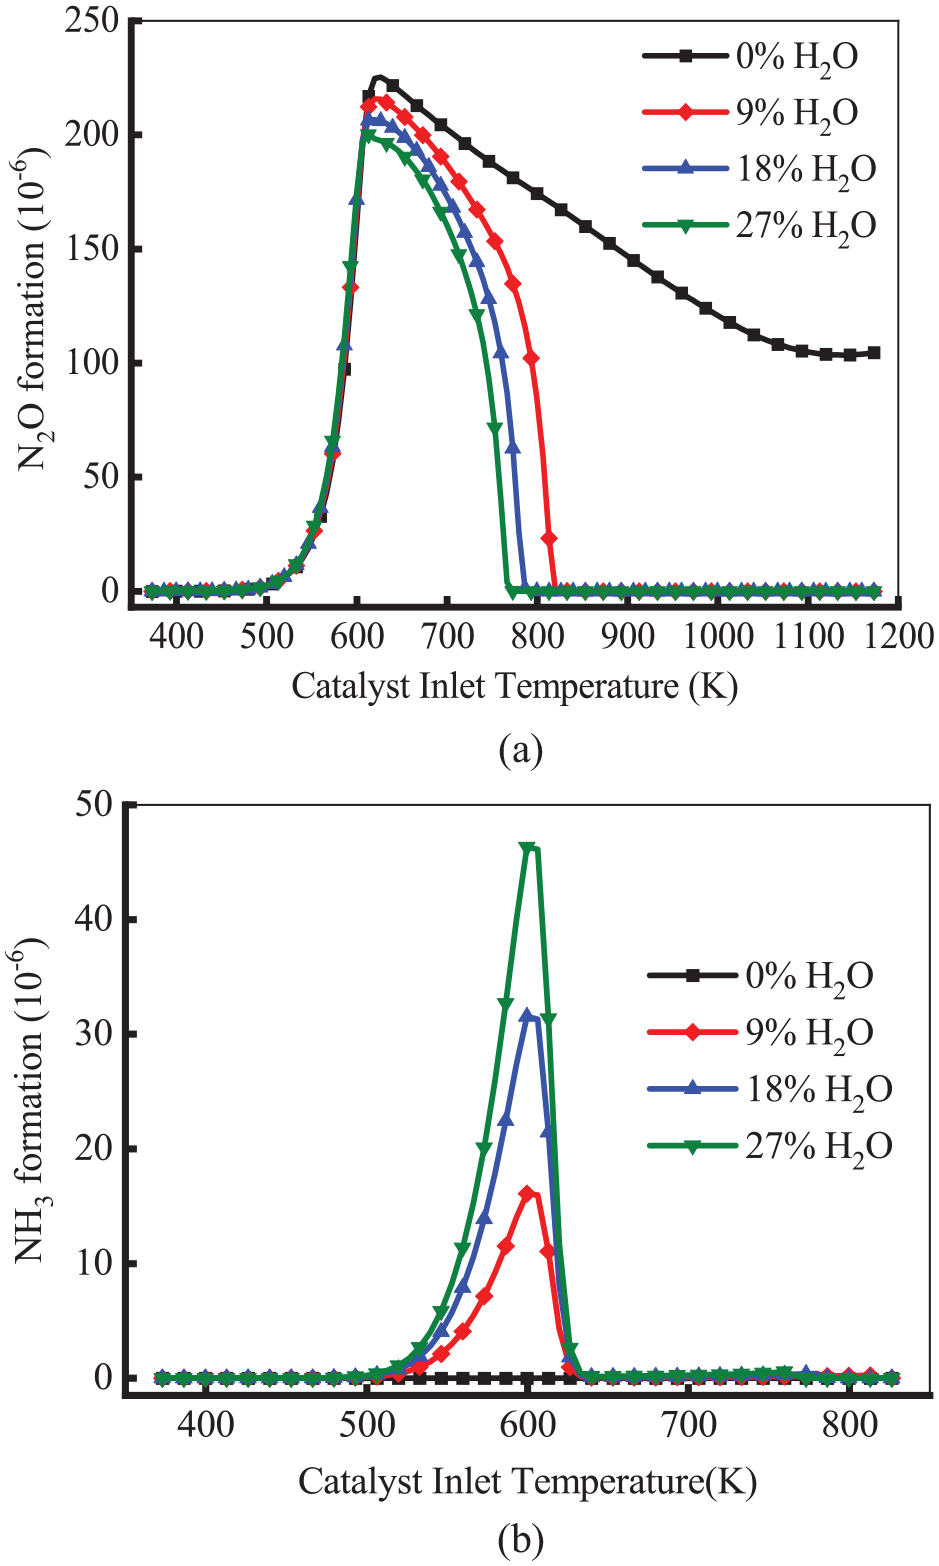
Variation of the formation of N2O (a) and NH3 (b) at different H2O contents.
Effect of O2 concentration on light-off characteristics of NO and CO
Figure 11 shows the conversion efficiency of NO and CO at different O2 concentrations. As shown in Figure 11(a), the conversion of NO was not affected by O2 concentration at a temperature below 600 K. As the O2 concentration increased, the NO conversion efficiency decreased at a temperature above 600 K. It means a higher O2 concentration may result in a great decrease in NO conversion efficiency as the temperature rises, the NO conversion efficiency decreases more significantly at higher O2 concentrations. Thus, the reduction reaction NO is inhibited by O2 concentrations. The literature 28 believed that too much O2 occupied the vacant sites on the catalyst, resulting in less N-O on the adsorption sites. This decreased the NO reaction rate. As shown in Figure 11(b), the T50 and T90 of CO decreased with the increase in O2 concentration. This means the conversion of CO is promoted. At a temperature above 673 K, the conversion efficiency of CO decreased with the decrease of O2 concentration. This means the conversion efficiency of CO is also inhibited under high temperatures and anoxic conditions.
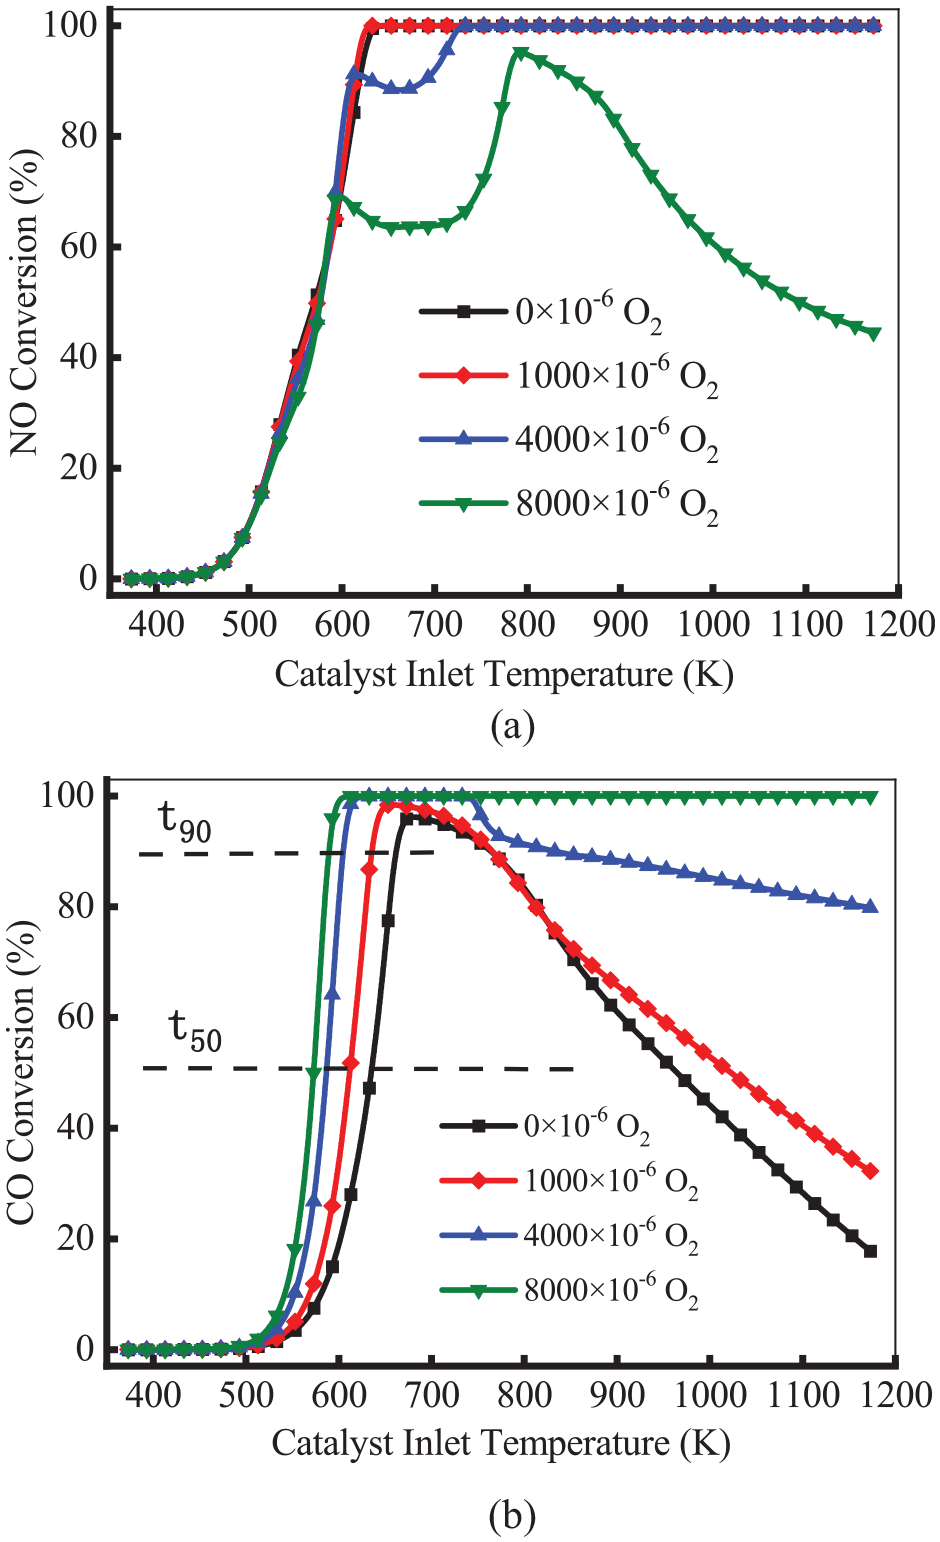
Conversion efficiency of NO (a) and CO (b) at different O2 concentrations.
Effect of O2 concentration on the formation of N2O and NH3
Figure 12 shows the variation of the production of N2O and NH3 at different O2 concentrations. As illustrated in Figure 12(a), the production of N2O increased and then declined. At the temperature below 593 K, the formation of N2O was not affected by O2 concentration for all cases. At the temperature above 593 K, the production of N2O declined to 0 in the cases of O2 concentration lowering 4000 × 10−6. Notably, in the cases of 8000 × 10−6 O2, there was still N2O formation at temperatures above 730 K. This means the consumption of H2 could not affect N2O formation under high O2 concentrations and high temperatures. Therefore, CO plays a major role in N2O formation at high temperatures, and N2O is generated through R15. As shown in Figure 12(b), at a temperature below 583 K, the formation of NH3 was not affected by O2 concentration for all cases. At the temperature above 583 K, the curves of NH3 concentration and O2 concentration showed an overall downward trend. As the temperature increased, the production of NH3 declined to 0 in the case of 8000 × 10−6 O2. However, there was NH3 formation at a temperature above 820 K in other cases. This means the formation of NH3 is inhibited under high-temperature and oxygen-enriched conditions. Notably, at high temperatures, there was an amount of NH3 formation in the cases of 0 × 10−6 O2 and 1000 × 10−6 O2. This is because, at high temperatures, the H2 produced by the SR and WGS reactions cannot be consumed under low O2 conditions, which generates NH3 through NO reduction reaction. NH3 oxidation reduces at low O2 concentrations. The decomposition degree of NH3 is low at high temperatures under rich steam conditions. This result was also reported in the study by Fujimoto et al. 28 The results showed that the production of NH3 was hindered under enrichment conditions. Therefore, increasing the O2 concentration is effective in reducing the production of N2O and NH3. In this study, the production of N2O and NH3 was reduced to 0 in the range of 700–800 K under the condition of 4000 × 10−6 O2.
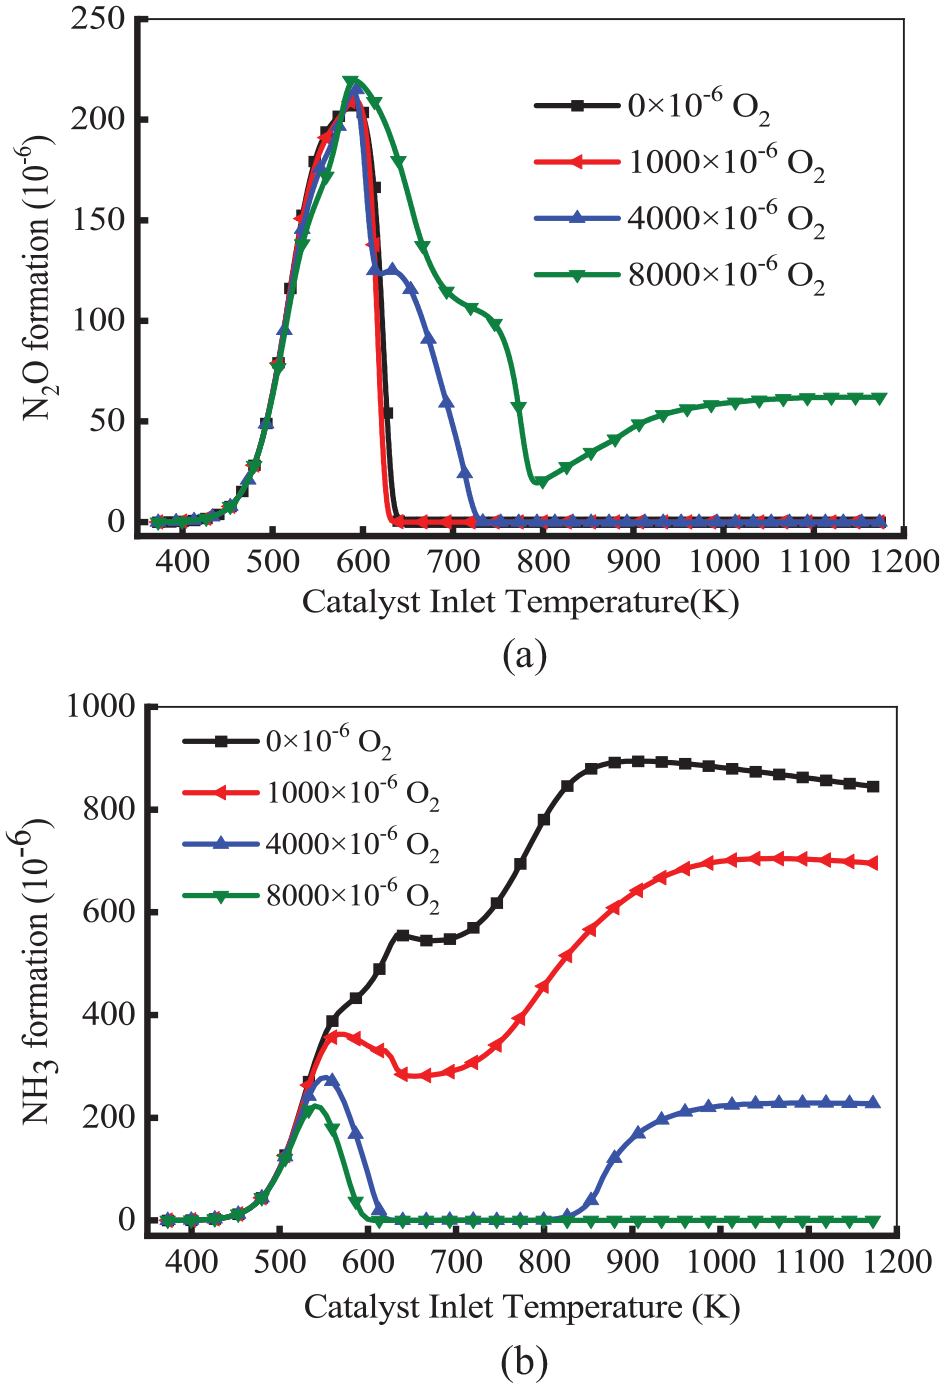
Variation of the formation of N2O (a) and NH2 (b) at different O2 concentrations.
Effect of H2 concentration on light-off characteristics of NO and CO
H2O in the exhaust gas induces SR and WGS reactions, and the reaction product H2 significantly affects the conversion efficiency of NO and CO and the production of N2O and NH3. To visually analyze the effect of H2 concentration, the effect of H2 concentration on N2O and NH3 production was investigated. Figure 13 shows the conversion efficiency of NO and CO at different H2 concentrations. As shown in Figure 13(a), as the H2 concentration increased, the conversion efficiency of NO increased. As the temperature increased, the conversion of NO first increased and then decreased, which reached the peak at 613 K. This means rising H2 concentration can increase the conversion efficiency of NO at high temperatures. As shown in Figure 13(b), for all cases, the conversion efficiency of CO was not affected by H2 concentration with the increases of temperature.
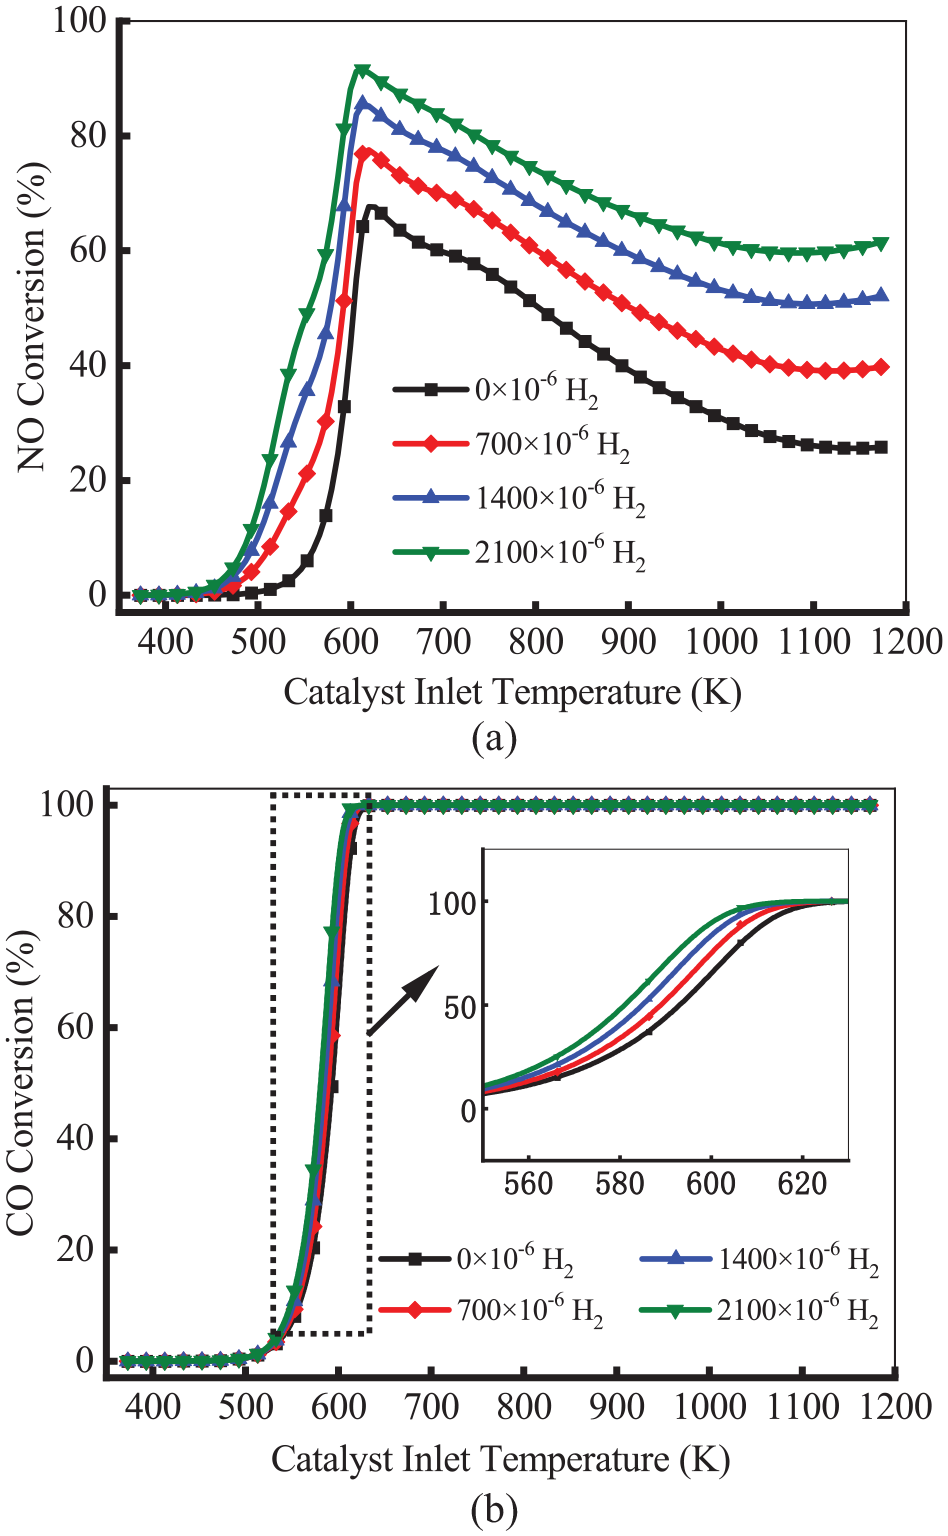
Conversion efficiency of NO and CO at different H2 concentrations.
Effect of H2 concentration on the formation of N2O and NH3
Figure 14 demonstrates the variation of the production of N2O and NH3 at different H2 concentrations. As shown in Figure 14(a), for all cases, the formation of N2O first increased and then declined. As the increase of H2 concentration, the production of N2O increases at the temperature below 600 K. In the case of 2100 × 10−6 H2, the formation of N2O reached the peak at 590 K, which was lower than 35 K of 0 × 10−6 H2. This means that H2 can promote the production of N2O at low temperatures. due to the participation of H2 as a reducing agent in the reaction, which participates in the N2O generation reaction. Furthermore, as the H2 concentration increased, the production of N2O decreased at the temperature above 600 K. The reason is that excessive H2 can react with N2O, which generates N2 at high temperatures. As demonstrated in Figure 14(b), there was no NH3 formation in the absence of H2. This means NH3 is mainly generated by the H2-NO reaction. As the H2 concentration increased, the production of NH3 increased. Compared with700 × 10−6 H2, the peak of NH3 formation increased by about 245 × 10−6 in the case of 2100 × 10−6 H2. This means that H2 is beneficial in promoting the production of NH3. The production of NH3 decreased to 0 at the temperature above 620 K. This is because NH3 generates N2 through the decomposition or oxidation (R18: 4NH3 + 3O2 = 6H2O + 2N2) at high temperatures.
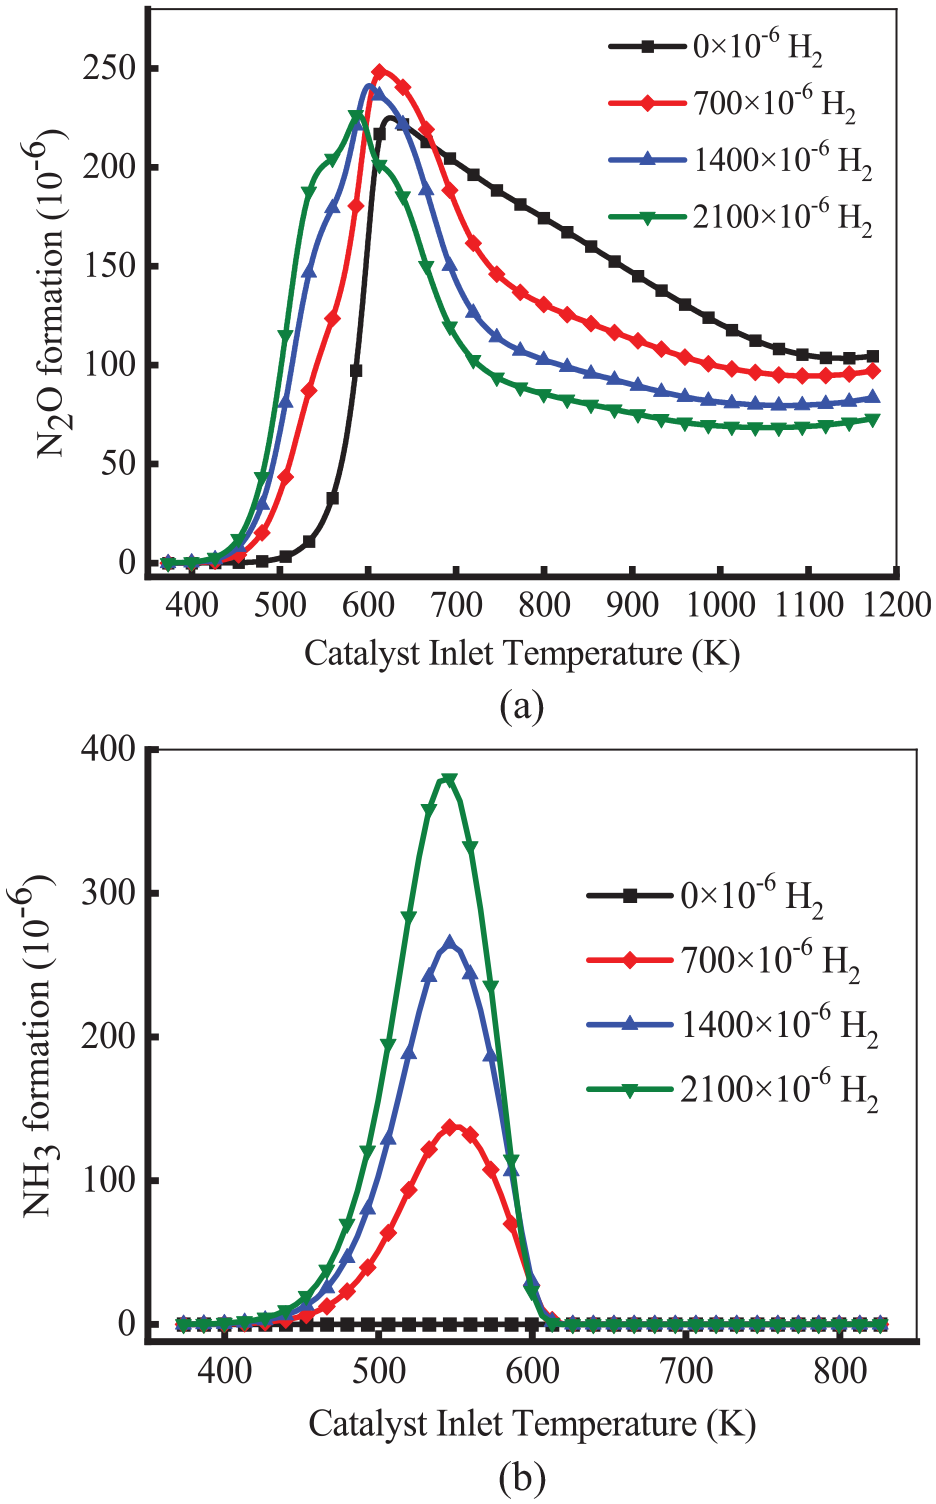
Variation of the formation of N2O (a) and NH3 (b) at different H2 concentrations.
Conclusion
In this study, a global model of the catalytic converter and a more comprehensive catalytic reaction mechanism suitable for natural gas engines were first established. Further, the model and the catalytic reaction mechanism were validated by using experimental data. Then, the effects of exhaust gas temperature and exhaust gas composition (H2O, O2, and H2 concentrations) on the catalytic converters were investigated. The study concluded the following:
(1) The light-off characteristics and secondary pollutants are closely related to the temperature. A higher temperature reduced the light-off time t50 of NO and CO. N2O was mainly generated through the CO reduction of NO reaction at temperatures of 450–740 K, while at high temperatures, the production of N2O decreased to 0 due to the reduction reactions of R14: N2O + H2 = H2O + N2 and R16: N2O + CO = CO2 + N2. NH3 would form at the temperature above 825 K, and the required H2 originated from SR and WGS reactions.
(2) H2O has an opposite effect on the production of N2O and NH3 at high temperatures. When the temperature was above 600 K, increasing the content of H2O reduced the production of N2O and increased the production of NH3. Increasing the content of H2O increased the conversion of NO and inhibited the conversion of CO.
(3) O2 concentration at 4000 × 10−6 is beneficial to reduce secondary pollutants of N2O and NH3. At the condition of 730–820 K and 4000 × 10−6 O2, the productions of N2O and NH3 were reduced to 0. When the temperature was above 600 K, increasing O2 concentration decreased the NO conversion efficiency and increased the CO conversion efficiency.
(4) Increasing the H2 concentration promoted the conversion of NO and CO. When the temperature exceeds 600 K, only N2O is produced, and increasing H2 concentration decreases the production of N2O. This provides further insight into light-off characteristics and secondary pollutants production of natural gas engines.
(5) For future research directions, the ratios of Pd/Rh catalysts are worth exploring. Based on the current findings, it is instructive to perform the loading and proportioning of noble metals on the catalytic converter light-off characteristics and secondary pollutant production.
Supplemental Material
sj-docx-1-jer-10.1177_14680874231197855 – Supplemental material for Investigation of the light-off characteristics and secondary pollutants production mechanism in Pd/Rh catalyst for natural gas engines
Supplemental material, sj-docx-1-jer-10.1177_14680874231197855 for Investigation of the light-off characteristics and secondary pollutants production mechanism in Pd/Rh catalyst for natural gas engines by Yejian Qian, Xiaofei Wei, Fei Tang and Shun Meng in International Journal of Engine Research
Footnotes
Declaration of conflicting interests
The author(s) declared no potential conflicts of interest with respect to the research, authorship, and/or publication of this article.
Funding
The author(s) disclosed receipt of the following financial support for the research, authorship, and/or publication of this article: The work in this study received financial support from Science and Technology Major Project of Anhui (China) (Grant No.202003a05020023), National Natural Science Foundation of China (Grant No.51676062), Major R&D projects of key technologies of Hefei (J2020G33).
Supplemental material
Supplemental material for this article is available online.
References
Supplementary Material
Please find the following supplemental material available below.
For Open Access articles published under a Creative Commons License, all supplemental material carries the same license as the article it is associated with.
For non-Open Access articles published, all supplemental material carries a non-exclusive license, and permission requests for re-use of supplemental material or any part of supplemental material shall be sent directly to the copyright owner as specified in the copyright notice associated with the article.