
Abstract
The advancements in digital twins when combined with the use of the machine learning tools can facilitate the effective health assessment and diagnostics of safety critical systems. This study aims at developing a framework to address the health assessment of marine engines utilising digital twins based on first-principles. This framework follows four distinct stages, with the former two including the marine engine digital-twin set up by customising the required thermodynamic models, as well as its calibration using tests trials data representing the engine healthy conditions. In the third stage, measurements from actual operating conditions are corrected and subsequently employed to develop the digital twin representing the prevailing conditions. The fourth stage deals with the engine health assessment by assessing health metrics derived from the developed digital twins. This framework is demonstrated in a case study of a large marine four-stroke nine-cylinder propulsion engine. The results demonstrate that three cylinders are identified to be underperforming leading to an average increase of the engine Brake Specific Fuel Consumption (BSFC) by 2.1%, whereas an average decreases of 6.8% in Indicated Mean Effective Pressure (IMEP) and 6.1% in the Exhaust Gas Temperature (EGT) are exhibited for the underperforming cylinders across the entire operating envelope. The developed digital twins facilitate the effective mapping of the engine performance for the entire operating envelope under several health conditions, providing enhanced insights for the current engine health status. The advantages of the proposed framework include the use of easily obtained data, and its application to several engine types including two and four-stroke engines for both propulsion and auxiliary use.
Keywords
Introduction
Shipping is responsible for over 90% of the world transport, 1 and is therefore an essential element of the global trade. Due to its importance and extensive reliance on fossil fuels, the shipping industry has been facing several challenges imposed from stringent regulations and ambitious targets for reducing the industry’s carbon footprint. 2 In response, an emergence of various digital tools is taking place, with emphasis on machinery condition and health assessment 3 which can facilitate a considerable reduction of emissions and cost savings. 4 Amongst the machinery with the greatest potential in operational performance improvement, is the ship’s main engine. This is the largest shipboard fuel consumer, and often operates in sub-optimal or degraded conditions, as a result of the harsh marine environment and demanding operational profiles. 5
Considering the importance and criticality of the ship’s propulsion and auxiliary engines, digital representations of these machinery (along with their systems and components) can provide essential information for supporting their health assessment process. In this respect, several types of modelling tools were reported in the pertinent literature, the use of which leads to the development of appropriate digital twins. In specific, data-driven approaches have been experiencing significant uptake for marine machinery applications, and include the collection of critical measurements, such as exhaust gas temperatures, lubricating oil temperatures and jacket cooling water temperatures. These can be analysed using Artificial Neural Networks (ANNs),6–8 support vector machines 9 and various unsupervised learning techniques,10,11 to detect abnormal deviations. More elaborate approaches include condition forecasting and prognostics, such as prediction of the Indicated Mean Effective Pressure (IMEP) changes using Deep Belief Networks (DBNs), 12 prognostics of turbocharger condition using Long-Short Term Memory (LSTM) networks 13 and prediction of the remaining useful life of critical machinery using Convolutional Neural Network (CNNs).14,15
The data-driven approaches described above can capture the complexity and realism of the machinery operation. However they heavily rely on the collection of large data sets from sophisticated sensor networks, which the majority of the world fleet does not have the infrastructure to obtain. 16 Furthermore, such approaches do not provide adequate physical insight into the machinery operation due to the black-box mathematical models that are utilised.
Alternatively, the use of first-principles approaches can support the engine health assessment. These rely on the utilisation of governing equations derived from laws of physics, and semi-empirical or empirical formulations, 17 to simulate the engine operation, predict the engine performance as well as emissions parameters. In addition, crankshaft dynamics models were utilised in few applications for large diesel engines to derive cylinder performance information, which is subsequently used to perform diagnostics.18,19 However, despite the strong link between the engine mechanical and thermodynamic performance, thermodynamics models offer a more direct approach in gaining insight into the engine operation and performing health assessment. Furthermore, by considering the most recent model formulations and computational advancements, thermodynamics models have demonstrated their effectiveness in developing fast-running digital twins of marine engines with predictive capabilities. 20 Consequently, a series of faults and degradations have been effectively simulated by thermodynamics models, spanning from typical degradation such as turbocharger fouling and injector faults,21,22 to severe failures such as scavenge air receiver fire. 23
However, the pertinent literature reports only few instances of health assessment by using fault and degradation simulation by first-principles thermodynamics models. Specifically, the utilisation of a first-principles digital twin with exhaust gas temperatures to establish relationships and indicators of faulty and degraded engine conditions was discussed in.24,25 In addition, more rigorous approaches employed quasi-linear 26 and non-linear 27 system identification techniques by comparing measurements with first-principles digital twins outputs, to identify faults in the intake system and injectors of marine engines. Furthermore, the most recent applications underpinning the suitability and widespread use of first-principles thermodynamics models, utilise them as virtual test beds to verify diagnostic tools, 28 and methods. 29
Therefore, thermodynamics fist-principles digital twins are commonly utilised to effectively simulate the operation of critical systems such as the ship’s engines. However there only exist few instances of direct implementation for engine diagnostics and health assessment purposes, despite their advantages of enhanced physical insight and fewer data requirements. This is due to the widely disparate challenges of thermodynamics models which include: (a) large physical and mathematical complexities as well as considerable computational effort, (b) determination of the various unknown model constants and (c) the correction of physical measurements utilised for validation. 30
Regarding the first challenge, the complexity of the thermodynamic model formulation and setup requires a number of staged processes to ensure that the healthy as well as the current engine operating conditions are captured effectively. 31 However, in the pertinent literature such challenges are not systematically addressed, where typically only the essential governing equations are provided, followed by validation via comparison using measurements at limited engine operating points.32–36
In addition, to address the second challenge, limited efforts have been pursued regarding the determination of the unknown model constants and inputs, which is primarily due to the reduced availability of manufacturer data and measurements. In particular, these include engine geometric data, turbocharger performance maps and constants for the required semi-phenomenological combustion models (e.g. the Wiebe 37 and Woschni-Anisits combustion models 17 ), which greatly affect the simulation results accuracy. As a result, for large two-stroke engines the calibration of various constants pertinent to the combustion and fuel injection processes was achieved, by using linear techniques and utilising in-cylinder pressure and fuel injection pressure measurements.38,39 Additionally, advanced optimisation methods, including genetic algorithms have been utilised to calibrate combustion parameters,40,41 as well as more sophisticated mesh-adaptive direct search optimisation algorithms. 42 However, the detailed steps and challenges of the above calibration approaches are not explicitly highlighted.
The third challenge of processing the raw data obtained from physical measurements, to subsequently support the validation process, is particularly prominent given the large uncertainty exhibited. In particular, measurements such as the in-cylinder pressure require correction, which is typically not included as part of an integrated approach. 43
To address the identified gaps from the preceding literature review, this study aims to develop a systematic framework for comprehensively addressing the setup, calibration and validation processes required to develop digital twins for marine engines. This framework is demonstrated in the case study of a four-stroke marine diesel engine, and subsequently the developed digital twin is employed for supporting the engine health assessment, providing the required rigour and accuracy.
The novelty of this study stems from the proposal of a framework for the marine engines health assessment based on digital twins representing the current engine operating conditions for the entire operating envelope. This is performed using minimal and easily obtained data, and can be extended to any engine configuration. Another contribution includes the transparent combination of a rigorous engine calibration procedure along with the measurement correction process, which is part of the developed framework for addressing the systematic setup of digital twins for marine engines.
Engine health assessment framework
The engine health assessment framework of this study consists of four stages as shown in Figure 1. The first stage includes the thermodynamics engine model setup. This is performed by collecting the necessary engine geometric data, valve profiles and turbocharger maps. Subsequently the single-cylinder engine model is set up utilising the formulations and equations described in Section Single-Cylinder Thermodynamics Model Description. The turbocharger maps scaling takes place according to the methodology proposed in Mizythras et al. 44 The engine manifolds model setup is performed, followed by expanding the formulation of the single-cylinder engine model to the multi-cylinder engine model as described in Section Multi-Cylinder Thermodynamics Model Description.
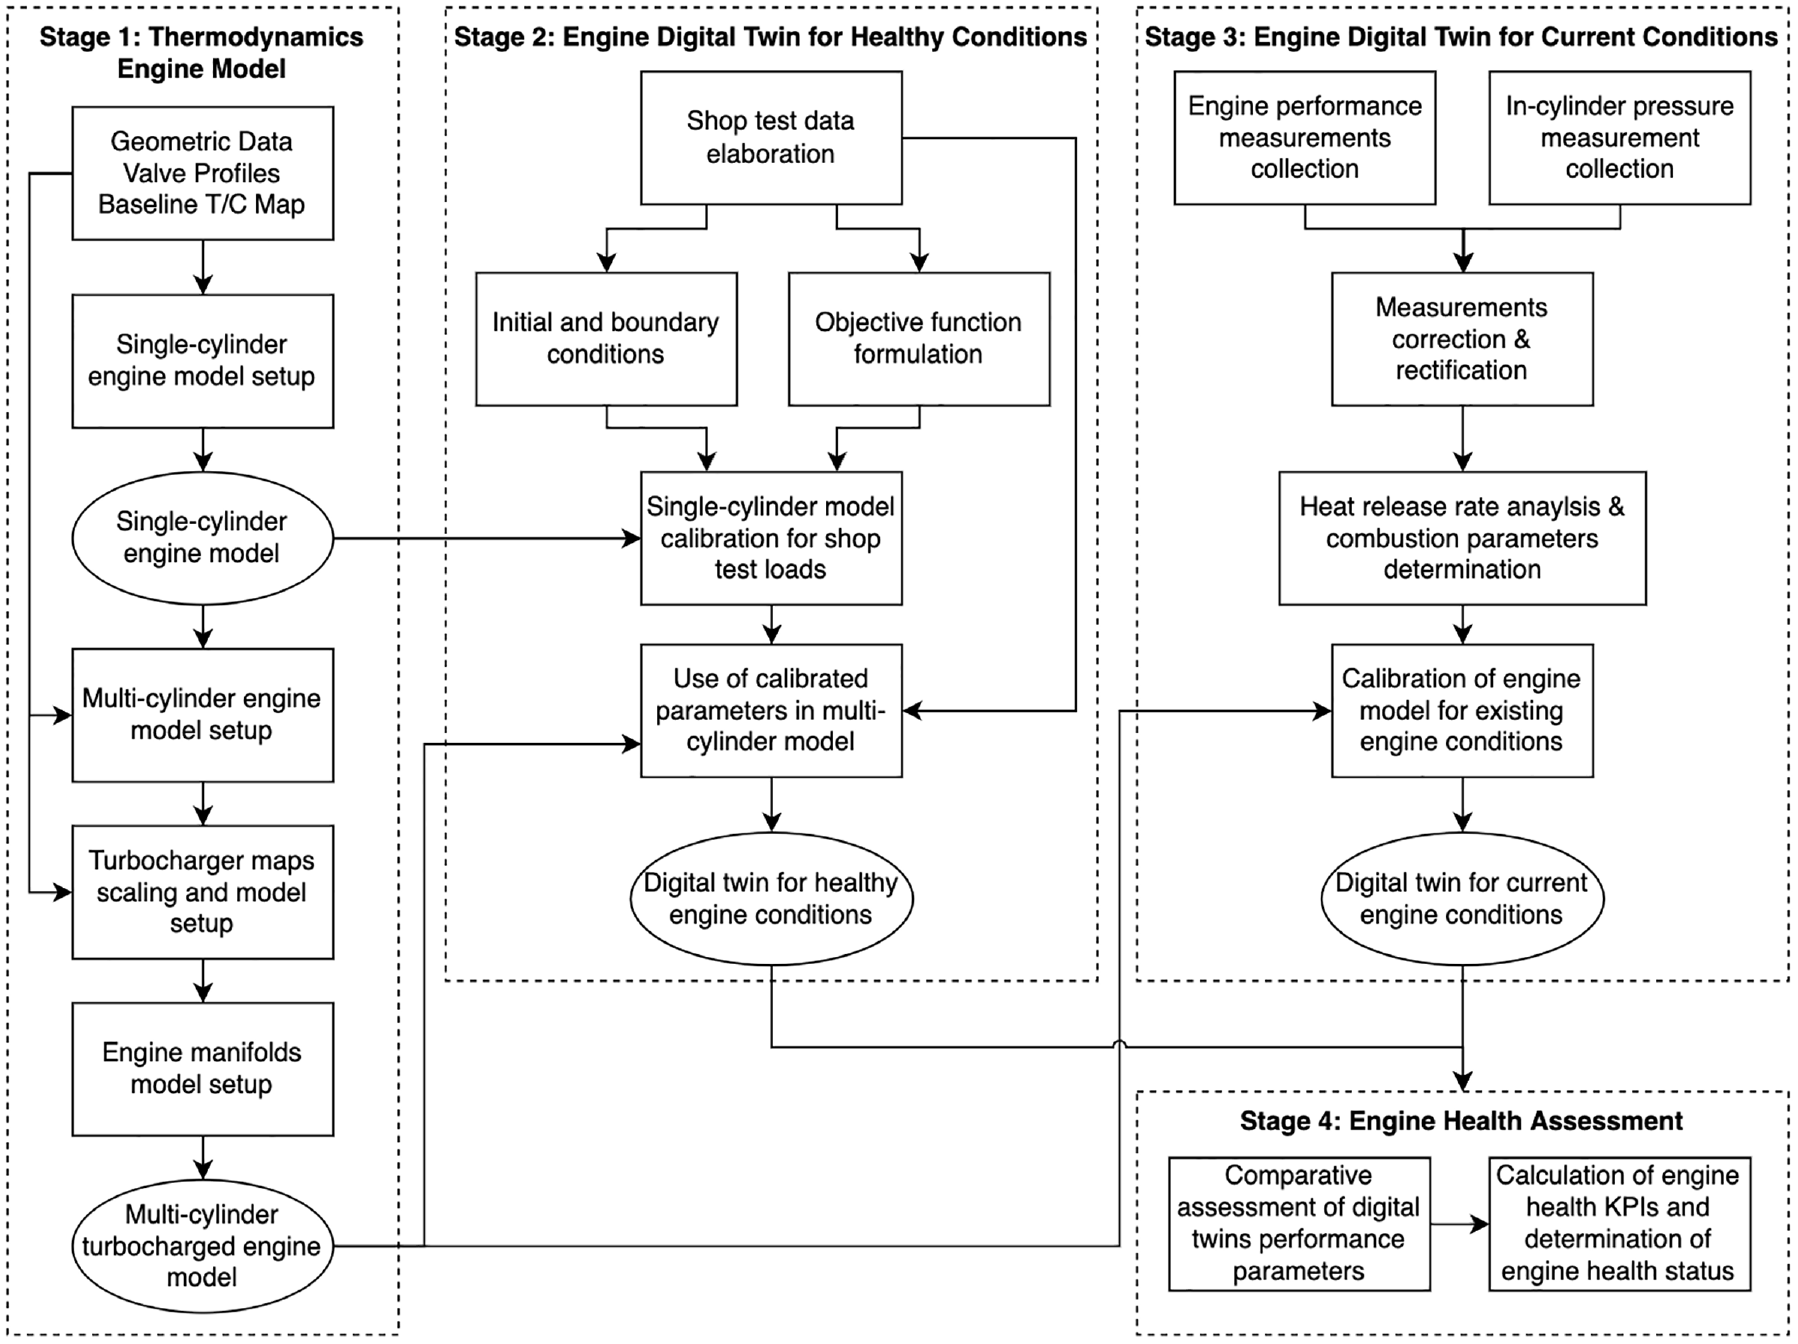
Framework for the health assessment of marine engines.
The thermodynamics model governing equations are considered mildly stiff nonlinear differential equations when applied to medium and slow speed engines, 45 as a result their solution does not pose particular challenges. Consequently, they are solved in MATLAB using the default stiff solver ODE23tb, which can easily handle the mild stiffness as well as the slight non-linearities. Furthermore, its higher order numerical scheme allows for employing larger time steps whilst maintaining accuracy for this type of equations. 46
In stage 2, the computational simplicity of the single-cylinder engine models formulation from stage 1 is exploited, to perform the combustion model parameters calibration for healthy conditions. In specific, the boundary conditions at the inlet and exhaust manifolds obtained from the shop test data are provided as input to the single-cylinder thermodynamics model, as described in Section Single-Cylinder Thermodynamics Model Description.
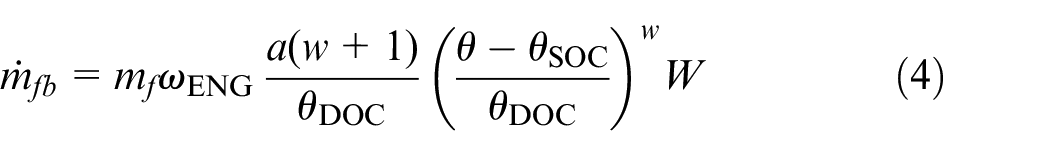
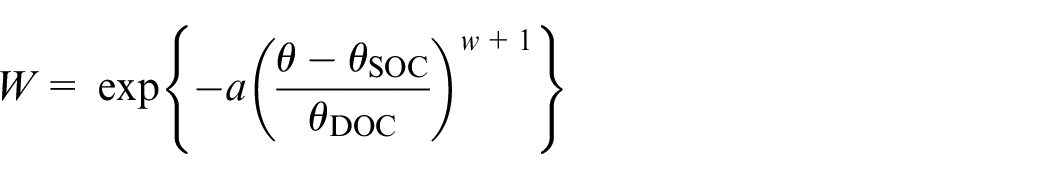
Furthermore, the experimental values of the Break Specific Fuel Consumption (BSFC) and in-cylinder peak pressure obtained by the engine shop tests are employed to formulate the objective functions. These are subsequently used for the optimisations employed to calibrate the single-cylinder thermodynamics model parameters for the shop test loads. This process takes place in two steps. In the first step, the calibration focuses on the following parameters of the single cylinder model at the engine reference operating point: combustion duration, Wiebe exponent, and friction mean effective pressure calibration factor. The engine reference operating point is chosen from the shop tests corresponding to the engine most frequent operation. The second step involves the calibration of the Woschni-Anisits combustion model constants at all the shop test operating points. As the Woschni-Anisits combustion model is specifically developed to predict the combustion process over a wide operating range, the robustness of the calibration results can be improved by considering several operating points.
Both steps of the calibration process utilise the MATLAB default particle-swarm optimisation algorithm, which is most effective in determining a global minimum, particularly since the Wiebe function utilised to model combustion, is known to yield similar results with widely different combinations of parameters. 42 Consequently, the gradient-free algorithm employed herein is suitable in overcoming the local minima encountered. The objective functions of two-step calibration process are shown in Appendix I. Due to the stochastic nature of the algorithm, to ensure that a consistent minimum is returned, 47 three separate runs were conducted for each calibration step. Subsequently, the derived results were averaged to provide the final estimation of the calibrated parameters. Following the two step calibration process, the calibrated parameters are deployed in the multi-cylinder thermodynamics model, thereby providing the digital twin representing the healthy engine conditions.
In stage 3, engine performance parameters measurements are collected additionally to the in-cylinder pressure measurements. The in-cylinder pressure measurements can be collected at any engine operating point. However, it is important that they are obtained at, or close to the engine reference operating point used in the first step for the single-cylinder model calibration, as explained in stage 2. The in-Cylinder pressure measurements are subsequently corrected as mentioned in Section In-cylinder Pressure Measurements Correction. This is followed by heat release rate analysis and combustion parameters determination according to Gatowski et al., 48 which specifically identifies the Wiebe exponent, combustion duration, and the percentage of total fuel mass injected in each cylinder. Subsequently, the identified parameters from the heat release rate analysis are deployed in the multi-cylinder thermodynamics model, to produce the digital twin representing the current engine conditions.
In stage 4, the engine health assessment takes place by means of comparison of the performance parameters derived from both the healthy and the current conditions digital twins. In specific, this is performed via parametric runs covering the entire engine operating envelope, and obtaining the most prominent indicators of the engine health status and performance as outputs. Subsequently, the following vital metrics are employed to quantify the engine health status over its entire operating envelope:
(i) Brake specific fuel consumption percentage difference between healthy and current engine conditions.
(ii) Peak in-cylinder pressure percentage difference between healthy and current engine conditions.
(iii) IMEP percentage difference between healthy and current engine conditions.
(iv) Cylinder EGT at the exhaust valve percentage difference between healthy and current engine conditions.
Reference system and available data
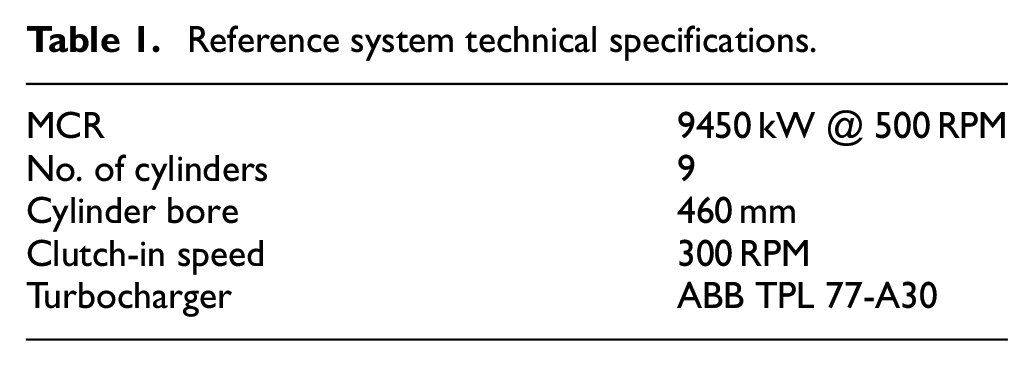
The engine health assessment framework was demonstrated in a case study of a marine four-stroke Wärtsilä 9L46C engine. In particular, the engine is installed in a RoPax ferry, as part of a dual engine arrangement driving a controllable pitch propeller and a power take-off generator through a gearbox. The engine main characteristics are listed in Table 1.
Reference system technical specifications.
The engine shop test data were employed to address stage 2 of the health assessment framework, regarding the engine digital twin for healthy conditions. These included seven operating points as shown in Figure 2. The reference operating point as described in Section Engine Health Assessment Framework was chosen to be at 4725 kW at 400 RPM since. This is located amongst the most frequent engine operating envelope, which is at 4000–6500 kW based on acquired ship operational data.
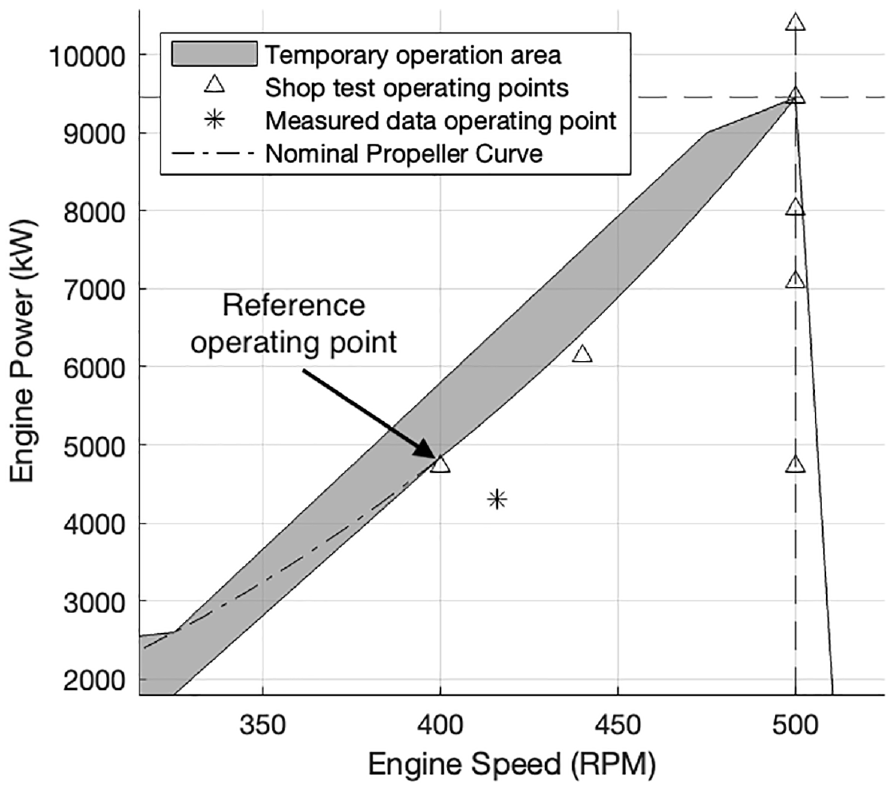
Engine operating envelope with operating points.
Measured data was obtained to address stage 3 of the health assessment framework, regarding the engine digital twin for current engine conditions. During the data acquisition, it was ensured that the engine was operating at steady state conditions for at least 20 min. The acquired in-cylinder pressure measurements were obtained at an operating point close to the reference operating point, as depicted in Figure 2 and are shown in Figure 3.
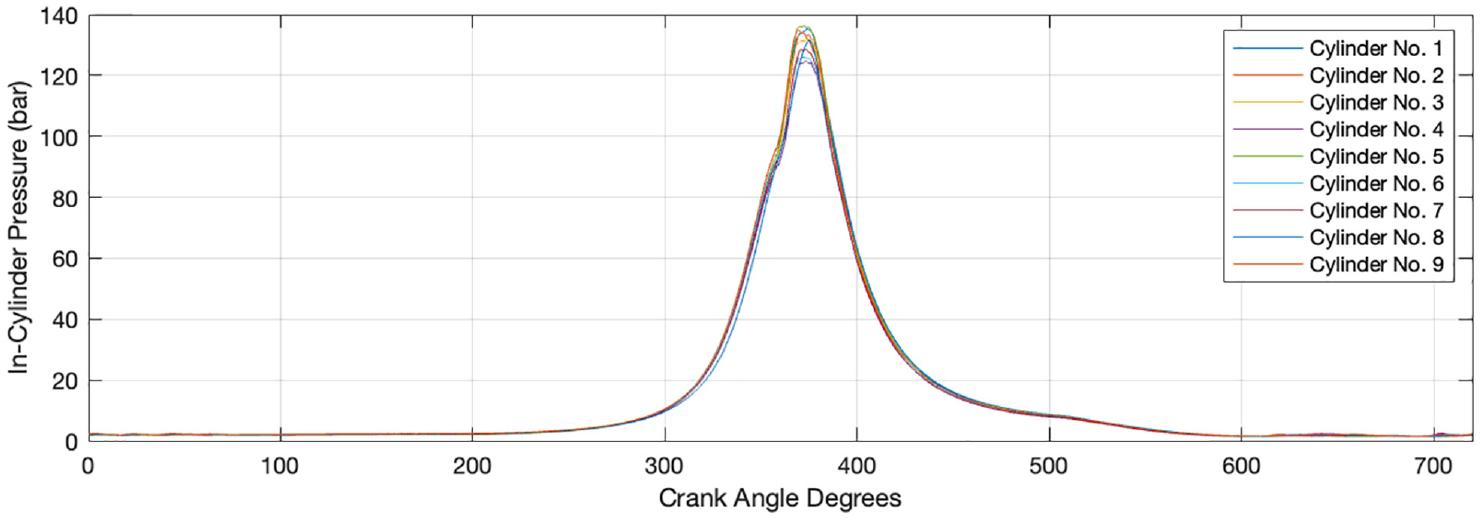
Measured in-cylinder pressure diagrams for indicated power 4305 kW at 416 RPM.
The in-cylinder pressure analyser with a Kistler 6619AP35 pressure sensor was employed for conducting these measurements. The reference point for the minimum pressure of the pressure analyser was set to the engine inlet manifold pressure, whereas the crank angle reference point was set at an arbitrary angle due to flywheel access difficulties. As a result, the in-cylinder pressure measurements require correction in both the pressure and crank angle axes, as described in Section In-Cylinder Pressure Measurements Correction.
Digital twin development
Single-cylinder thermodynamics model description
The thermodynamics model developed and deployed in this study utilises a zero-dimensional approach. This employs the energy and mass conservation equations along with the ideal gas equation for the calculation of the cylinder working medium properties as described in the authors’ previous study. 49 In specific, a system of nonlinear ordinary differential equations is solved for the unknown state variables of the in-cylinder pressure, temperature and burnt fuel fraction. Furthermore, to model the entire thermodynamic cycle for a four-stroke engine, a one-zone approach was employed which is able to provide sufficient accuracy for the in-cylinder pressure diagram prediction, 40 that is one of the key model outputs. The formulation of the developed single cylinder thermodynamics model employs the system of differential equations presented in equation (1):

where:
and
The specific internal energy
where
The cylinder total mass time derivative is described by the mass conservation according to equation (3):

where the inlet and outlet mass flow rates
where:
and the coefficient
where

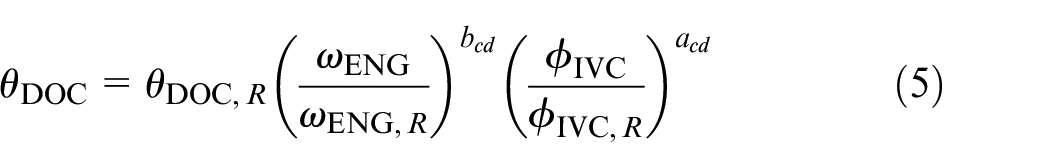
where the start of injection
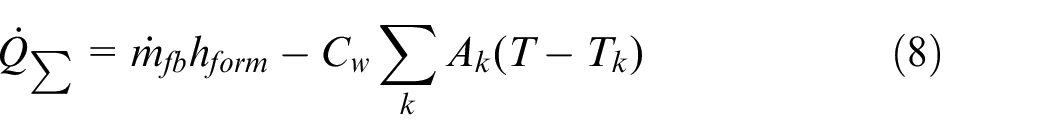
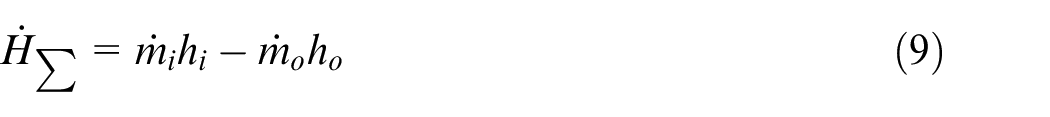
The sum of the heat transfer and heat release rates is calculated by equation (8) considering the burnt mass rate obtained by equation (4). The sum of enthalpy flow rates is calculated by equation (9), considering the valve inlet and outlet mass flow rates.
where
The engine brake power of an individual cylinder is calculated by utilising the in-cylinder pressure, according to equation (10).
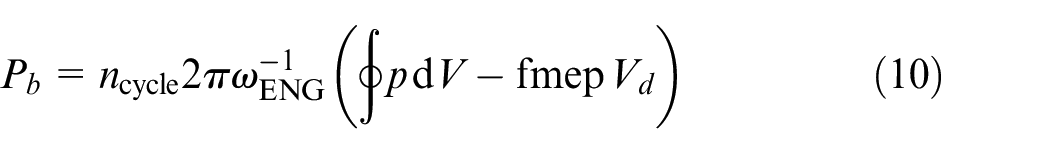
where

The constants
Multi-cylinder thermodynamics model description
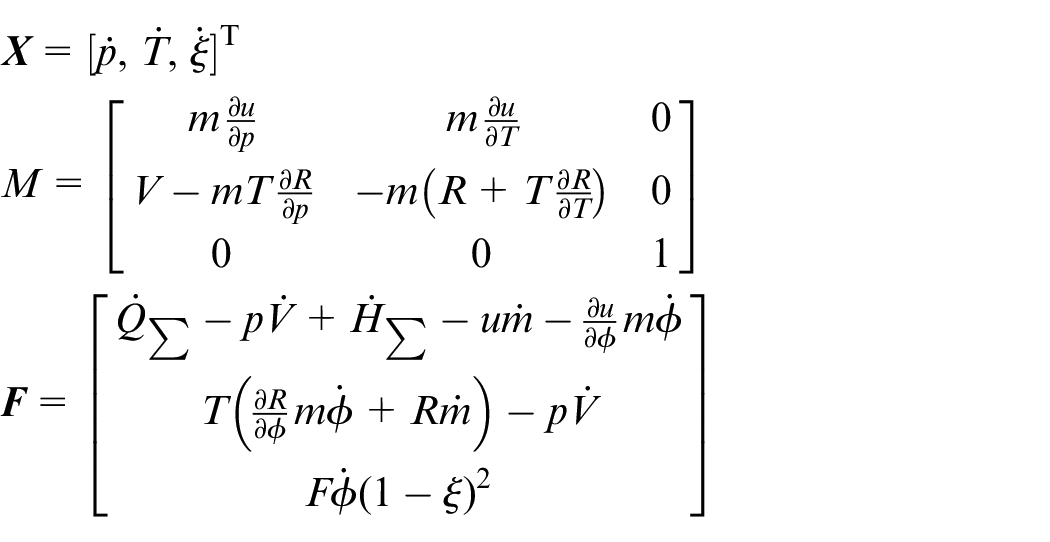
The multi-cylinder thermodynamics model consists of the engine block with all engine cylinders, the inlet and exhaust manifolds, as well as the turbocharger and the air cooler. Firstly, equation (1) has to be solved for all engine cylinders of the reference system, which can be performed compactly by solving the system of differential equations according to equation (12):
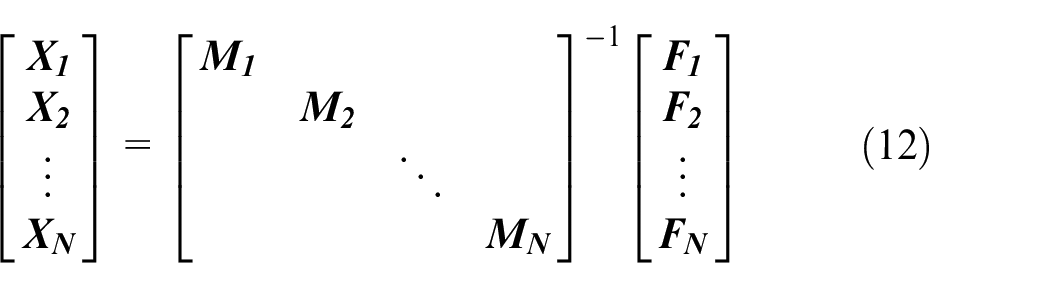
where
Secondly, for a turbocharged engine, an additional system of differential equations needs to be introduced that simulates the turbocharger speed, inlet and exhaust manifold mass flow rates and temperatures, as well as the exhaust manifold burnt fuel fraction. These are derived from the angular momentum conservation as well as the mass and energy conservation, respectively. These equations are presented in detail in Appendix I. Subsequently the turbocharger and manifold equations are gathered in a matrix system according to equation (13).

where:
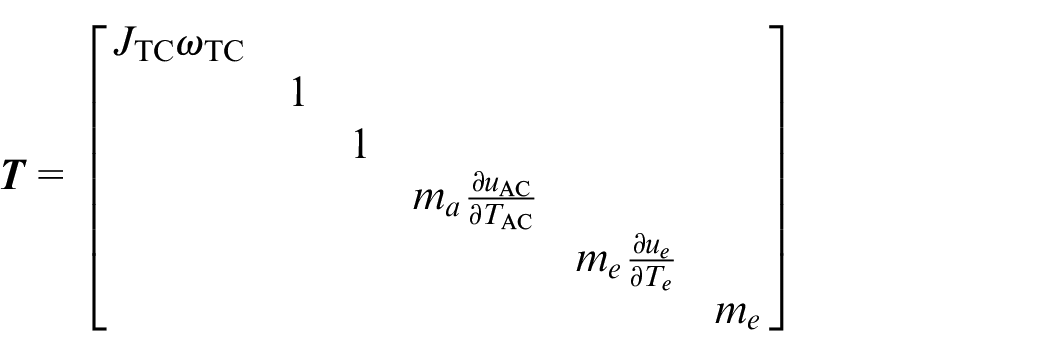
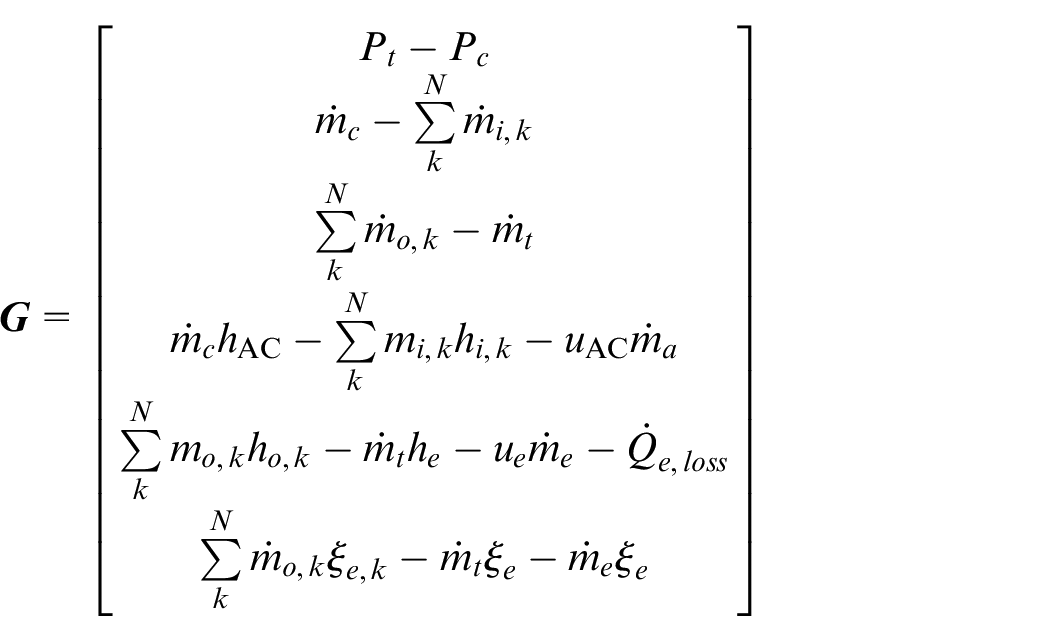
where in the matrix
Subsequently, equation (13), can be combined with the multi-cylinder model formulation in equation (12), to provide the thermodynamics model formulation of a turbocharged engine with
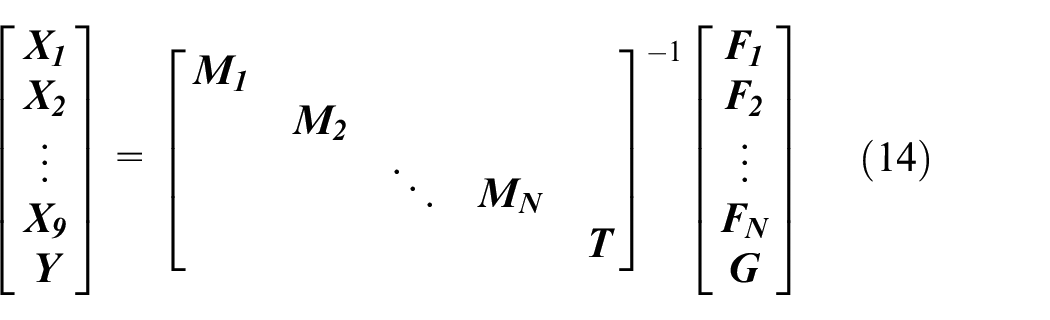
Turbocharger model
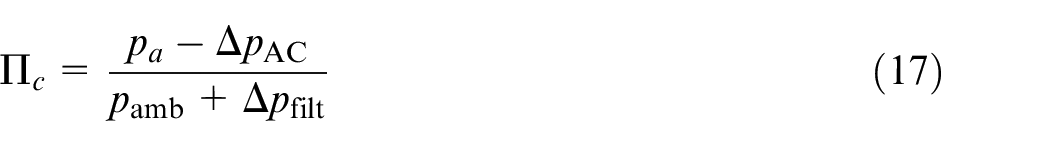
The turbocharger compressor and turbine power required in the multi-cylinder thermodynamics model based on equation (14), can be calculated according to equations (15)–(16). 54
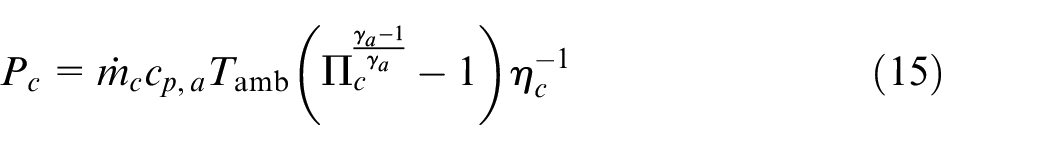
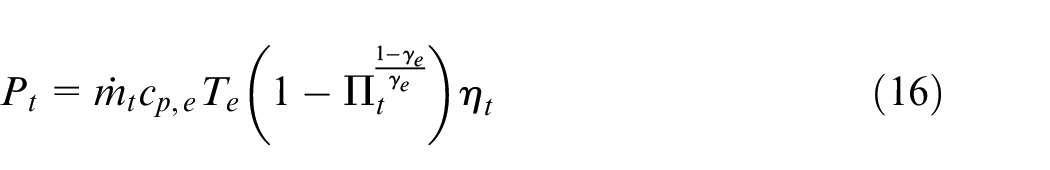
where
where
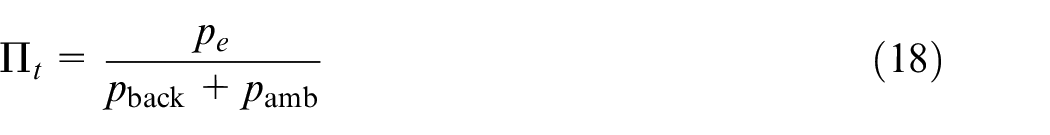
The turbocharger mass flow rates and efficiencies are calculated using the respective performance maps available in digital format. It is therefore preferable to convert these maps to continuous surfaces using analytic equations, which reduces computational effort and enhances accuracy, as compared to interpolation. 35 However, particularly for the compressor, it is challenging to determine an analytic function dependent on the pressure ratio and turbocharger speed that adequately represents its performance map. To aid that process, the compressor mass flow rate and efficiency are defined as functions of four non-dimensional parameters, which are the blade tip speed, non-dimensional head, inlet Mach number and non-dimensional flow coefficient, respectively. These can be calculated according to equations (19)–(22).
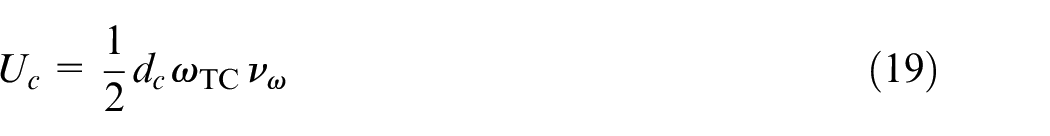
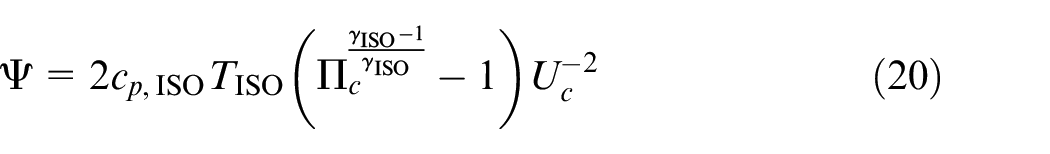
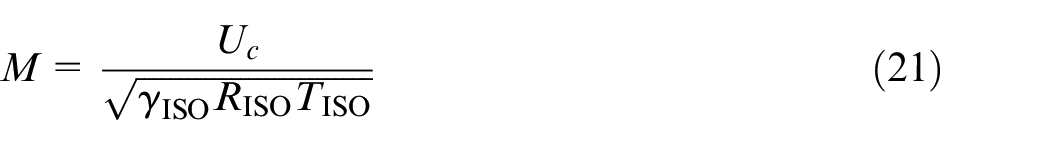
where
The compressor mass flow rate can be subsequently calculated using the above non-dimensional parameters, according to equation (23). 55
where
with constants
The compressor isentropic efficiency utilised in equations (16)–(15) is calculated by considering the non-dimensional flow coefficient, according to equation (24).
where constants
The turbine mass flow rate and isentropic efficiency utilised in equations (33) and (34) and (16) are calculated using the turbine expansion ratio according to equations (25) and (26):
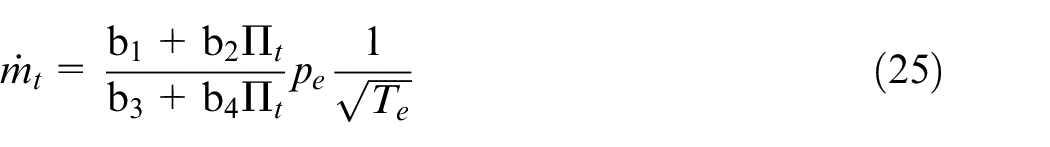

where the constants
In-cylinder pressure measurements correction
The in-cylinder pressure measurements require correction for two reasons. Firstly the in-cylinder pressure analyser provides the in-cylinder pressure diagram with its minimum value automatically set equal to the scavenge air (inlet manifold) pressure, which is inserted manually at the time of the measurement. This is an approximation facilitating only the non-scientific use of the acquired measurements by qualitative comparison. As this approach introduces uncertainty, the in-cylinder pressure diagram requires correction (offset) on the measured pressure (y-axis). Secondly, the in-cylinder pressure analyser uses a crank angle sensor, which utilises a reflective tape on the flywheel to mark the first cylinder Top Dead Center (TDC). In many cases, however, the TDC mark on the flywheel is either not visible or not accessible. Therefore, the reflective tape is adhered to an arbitrary angle, and subsequently the in-cylinder pressure diagram requires correction (offset) on the crank angle (x-axis).
The first step in correcting the in-cylinder pressure measurement includes modelling the compression process at the specific operating point. The engine compression process can typically be modelled with high accuracy.17,33 This task is accomplished by employing the single-cylinder thermodynamics model (equation (1)), and setting the mass of fuel injected per cycle
The second step is to derive the compression part of the measured in-cylinder pressure diagram. This is performed by identifying the point of the combustion start. This can be identified as the first local minimum in the gradient of the in-cylinder pressure diagram, as shown in Figure 4.
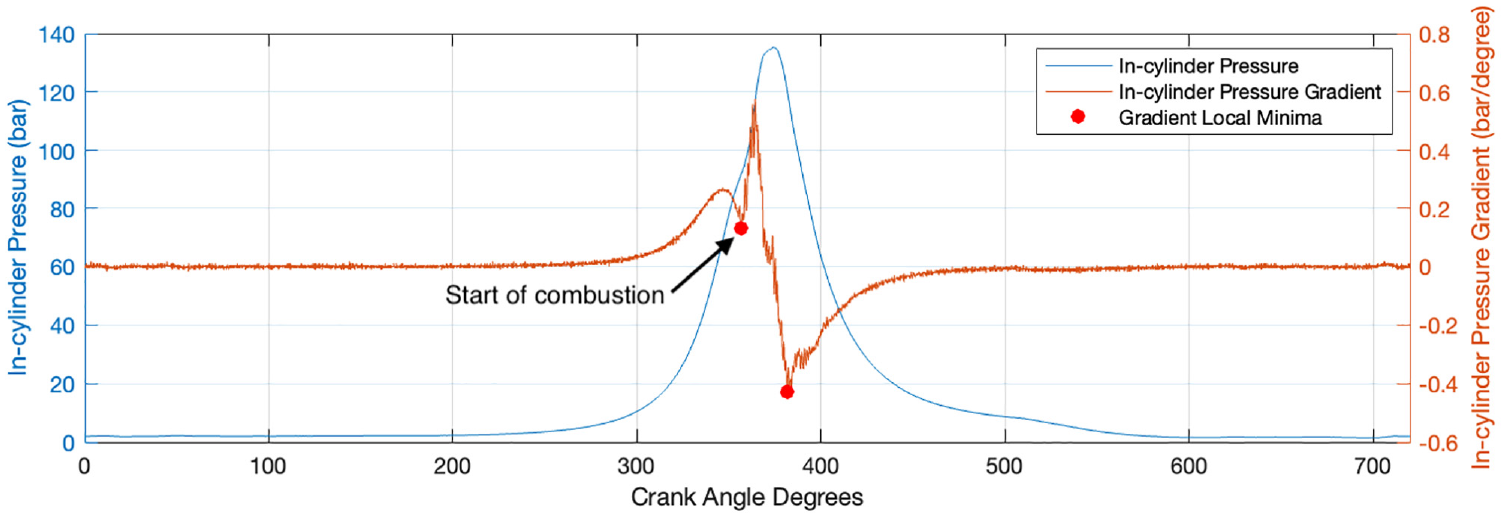
Start of combustion identification in measured in-cylinder pressure diagram.
Having obtained the simulated compression curve from step one, and the measured compression curve from step two, step three includes the correction of the in-cylinder pressure measurement using the results of the above two steps. This is accomplished by employing a Levenberg-Marquardt optimisation algorithm to perform a least squares curve fitting considering the simulated and measured compression pressure curves. This optimisation process includes the minimisation of the objective function provided by equation (27).
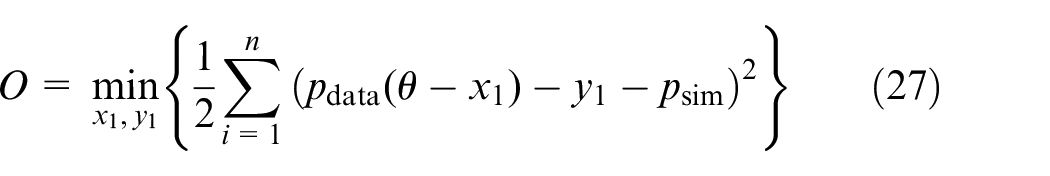
where
Results and discussion
Engine digital twin for healthy conditions
The first step of the calibration involves the determination of the combustion and friction mean effective pressure parameters for the reference operating point. This is followed by the second step of the calibration that determines the values of the Woschni-Anisits model constants by considering all the remaining shop test operating points as described in Section Engine Health Assessment Framework. Overall, the particle-swarm optimisation employed in the calibration process demonstrated its consistency, as inferred from the small deviation of the calibrated values for every run, which are provided in Appendix I. Furthermore, the results listed in Table 2, demonstrate that the calibrated parameters values lie well within the ranges reported in the pertinent literature for the same engine type,17,40,56 with the exception of the two engine speed constants of the Woschni-Anisits model.
Digital twin calibration parameter values.
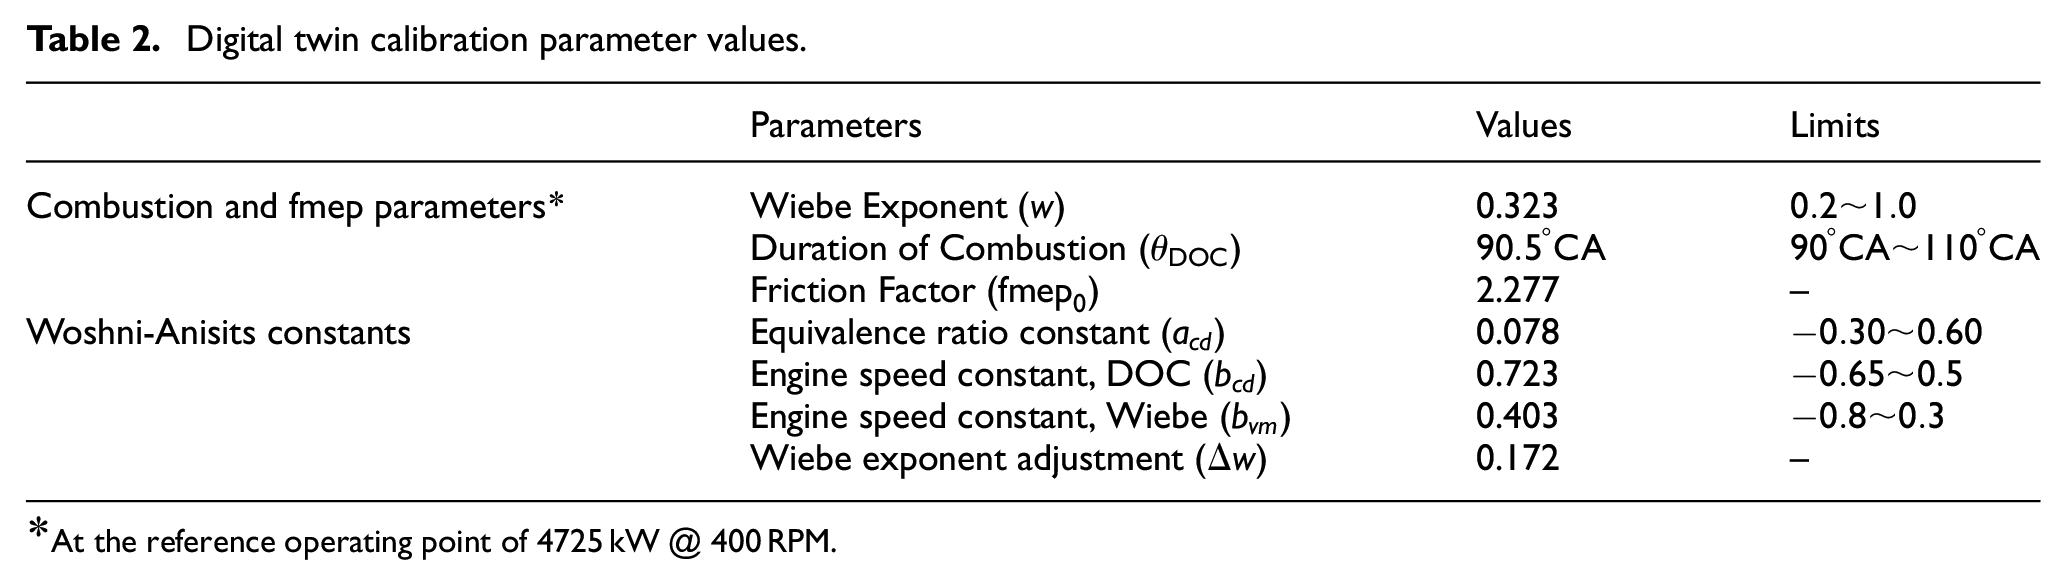
At the reference operating point of 4725 kW @ 400 RPM.
However, when restricting the particle swarm optimisation algorithm to within the engine speed constants limits specified in the literature, a less optimal solution is obtained. Therefore, considering the few sources in the literature are considered as not strict, and therefore values beyond these can be allowed.
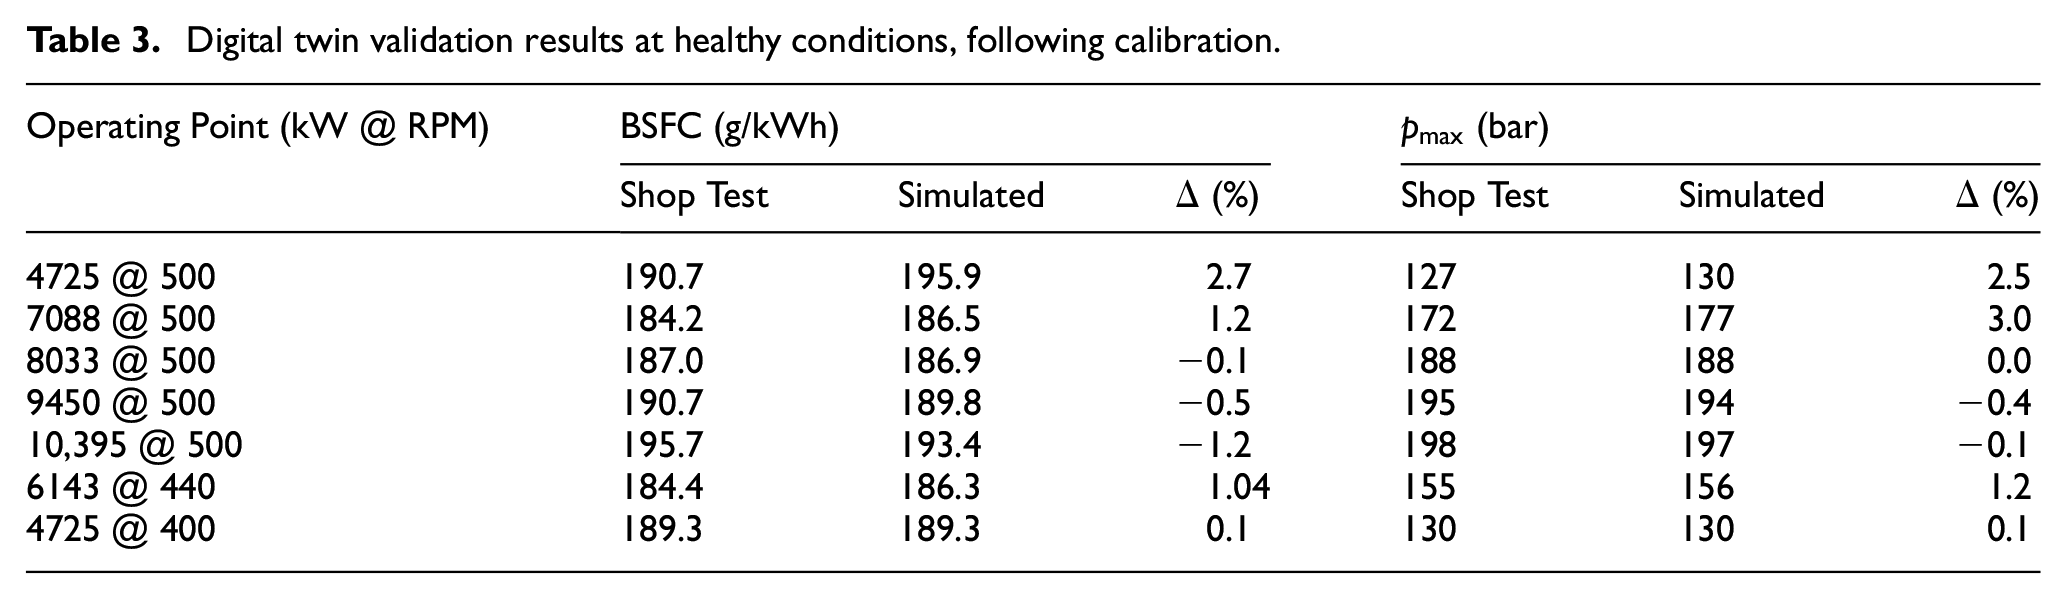
Having obtained the model calibration parameters from Table 2, the thermodynamics digital twin was subsequently validated by comparing the derived BSFC and peak in-cylinder pressure (
Digital twin validation results at healthy conditions, following calibration.
The calibrated digital twin was used to simulate the engine operation for a wide operating envelope, thereby deducing engine performance parameters maps and qualitatively verifying the engine performance as shown in Figure 5. Figure 5(a) to (c)) provide the BSFC, equivalence ratio at the exhaust manifold, and boost pressure at the inlet manifold. Figure 5(d) to (f)) include the average values from all nine cylinders of the maximum in-cylinder pressure, IMEP and EGT at the exhaust valve. However, since the digital twin simulates healthy conditions, there are no deviations in the values of the three aforementioned parameters between the cylinders.
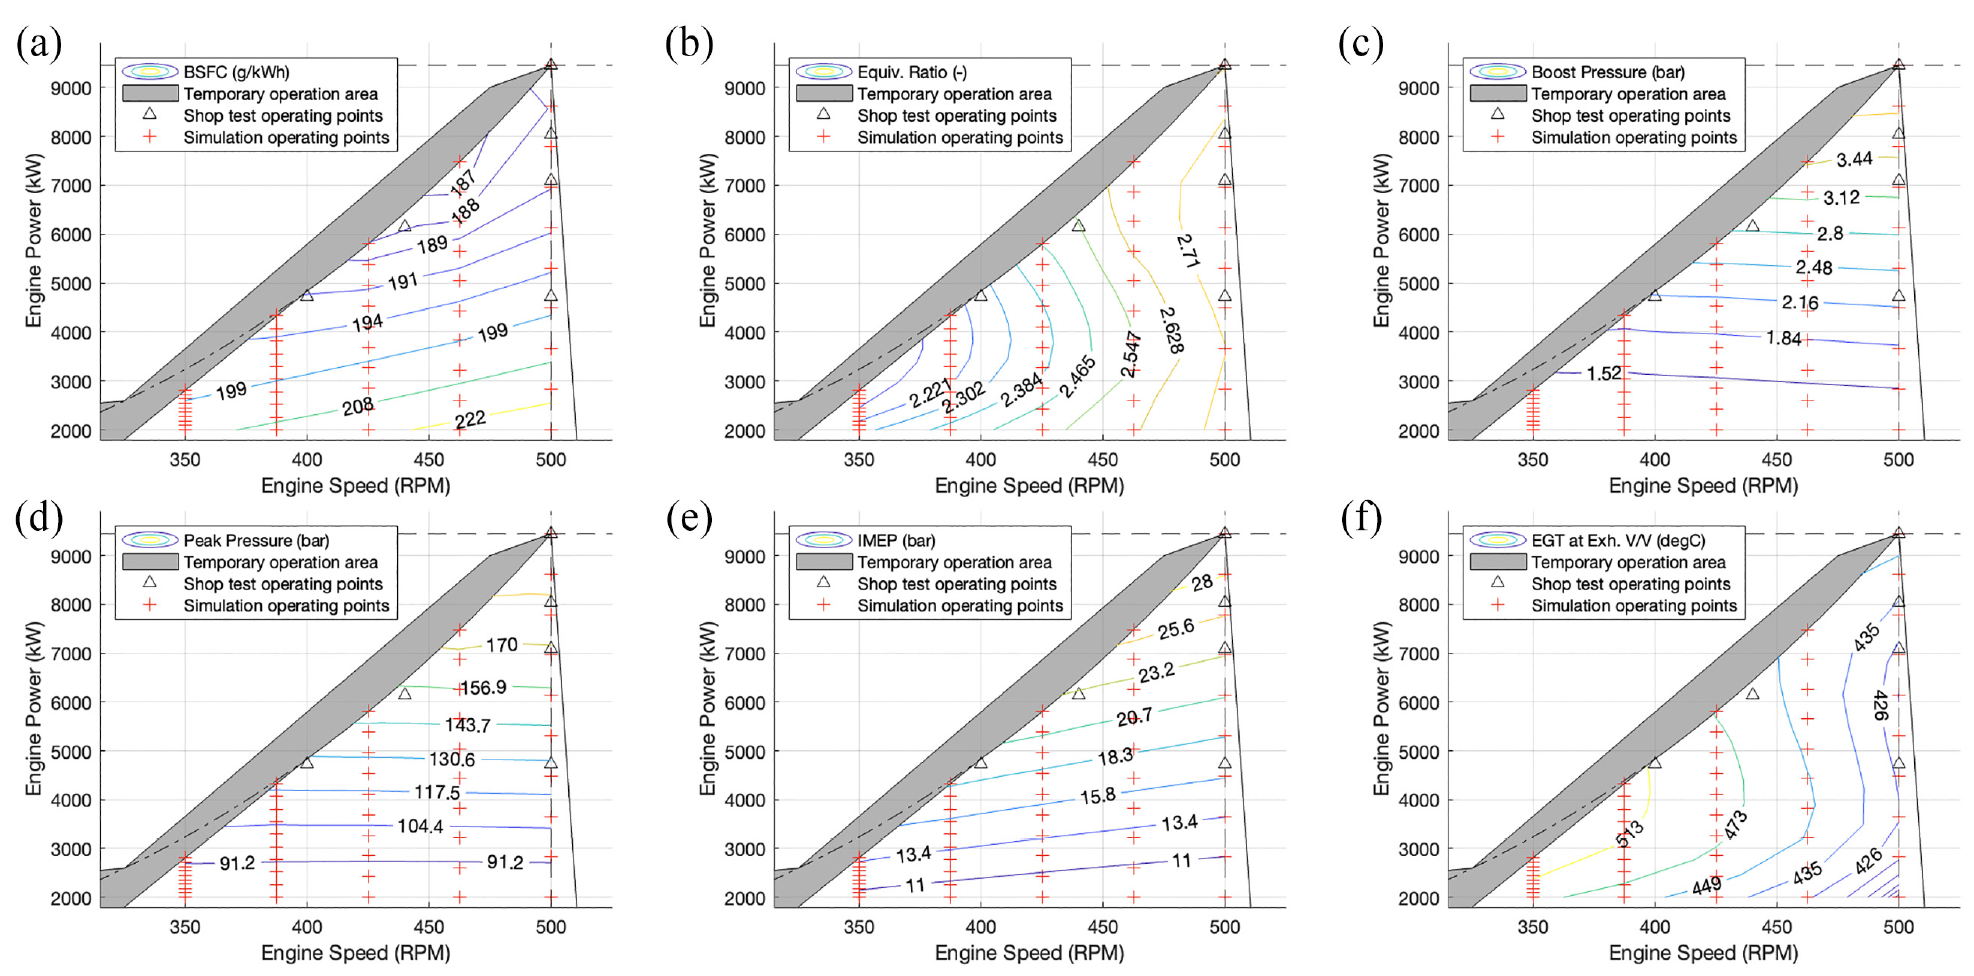
(a) BSFC map for healthy engine conditions. (b) Equivalence ratio map for healthy engine conditions. (c) Boost pressure map for healthy engine conditions. (d) Peak pressure map for healthy engine conditions. (e) IMEP map for healthy engine conditions. (f) Exhaust gas temperature at exhaust valve map for healthy engine conditions.
Figure 5(a)) demonstrates that the engine BSFC exhibits a minimum near 80% load on the lower boundary of the temporary operation range shown in grey, similar to the manufacturer reference map. 57 The rapid increase of the BSFC away from the minimum of up to 10 g/kWh for loads close to 4000 kW, enforces the importance of matching the actual vessel operation as close to the engine design point as possible, or de-rating the engine to achieve better fuel efficiency at lower loads if the vessel operational profile changes significantly. Figure 5(b)) demonstrates that the equivalence ratio values exceeds 2, indicating lean combustion conditions, which are typical of large four-stroke diesels, resulting lower NOx emissions. 58
Figure 5(c) and (d)) demonstrate that the boost pressure and peak in-cylinder pressure vary almost exclusively as a linear function of the engine load, as expected. 59 Furthermore, Figure 5(e)) illustrates that the IMEP varies linearly both as an increasing function of the engine load and rotational speed. Comparing the IMEP to the peak in-cylinder pressure map, it is deduced that the latter is not an inclusive indicator of the cylinder performance, since distinct in-cylinder pressure curves with the same peak pressure can result in different IMEP values.
Figure 5(f)) shows that the EGT at the exhaust valve exhibits a minimum near 5000 kW (45% load) on the lower boundary of the engine temporary operation range. The map contour lines follow approximately the direction of the lower boundary of the engine temporary operation, which is consistent with the literature, 59 thus adequately capturing the thermal loading and subsequently defining possible operational limits of the engine.
Engine digital twin for current conditions
In-cylinder pressure measurements correction and heat release analysis
The in-cylinder pressure measurement calibration offsets the in-cylinder measured pressure curve in both the x and y-axis, as described in Section In-Cylinder Pressure Measurements Correction. The results of this step are listed in Table 4. The offset for the pressure diagram crank angle (x-axis) was estimated in the range 3.7–5°CA (average of 4.5°CA). This indicates that the TDC marker on the flywheel was not placed accurately. Furthermore, since the TDC marker was not re-positioned following the measurement of each cylinder, the variation between the x-axis correction factors between subsequent measurements can either be explained as the error of the calibration process itself, or flexing of the crankshaft during rotation which could be up to ±1°CA for large engines. 60
In-cylinder pressure measurement correction results; values of
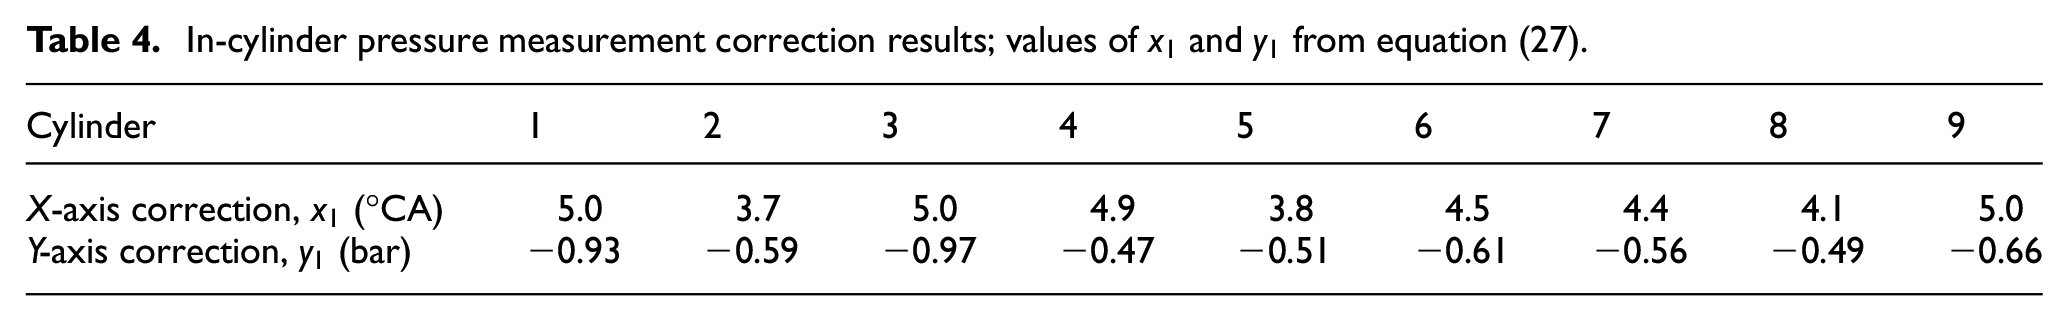
As mentioned in Section Reference System and Available Data, the in-cylinder pressure minimum value was set equal to the inlet manifold pressure at the pressure analyser. The pressure offset (y-axis) was estimated in the range from −0.47 to −0.97 bar (average of −0.64 bar). This is agrees with the pertinent literature, since the minimum point of the in-cylinder pressure curve occurs during the intake stroke, where the pressure in the cylinder is below that of the inlet manifold. 51 Consequently, considering the offsets for both axes, the errors of the in-cylinder pressure measurement process appear to be captured accurately, providing higher accuracy and demonstrating the usefulness of such measurement correction procedure.
Following the in-cylinder pressure measurements correction, the corrected in-cylinder pressure curves are utilised to derive the heat release curves for each cylinder, which are shown in Figure 6. Subsequently, the heat release curves were fitted using a single Wiebe function to estimate the combustion duration, the Wiebe exponent, and the fuel injected mass, as well as to calculate the indicated power of each cylinder, which is provided in Table 5.
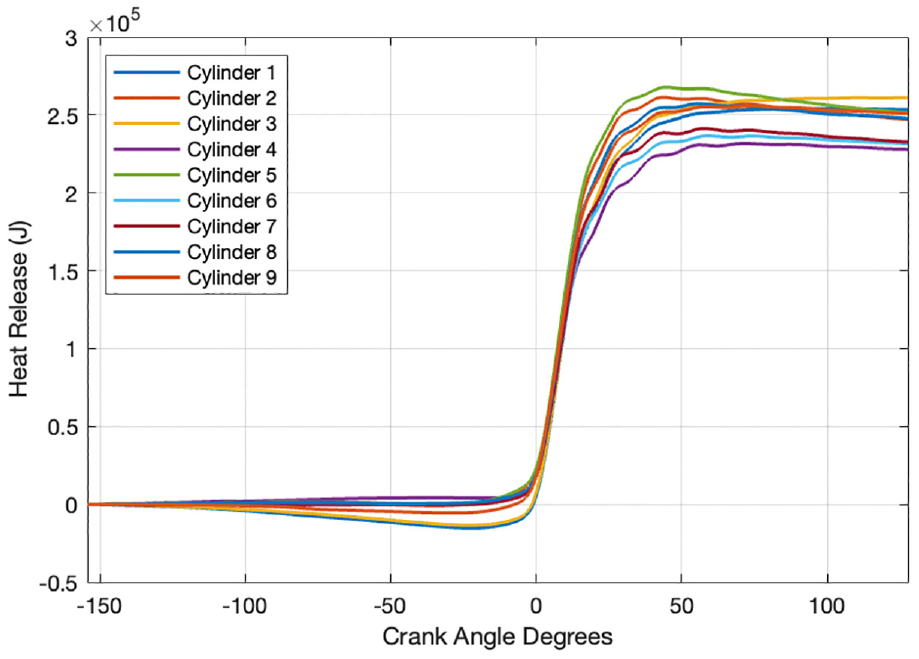
Heat release curves for 4305 kW indicated power at 416 RPM.
Heat release analysis results at 4305 kW indicated power at 416 RPM; highlighted rows correspond to cylinders with reduced performance.
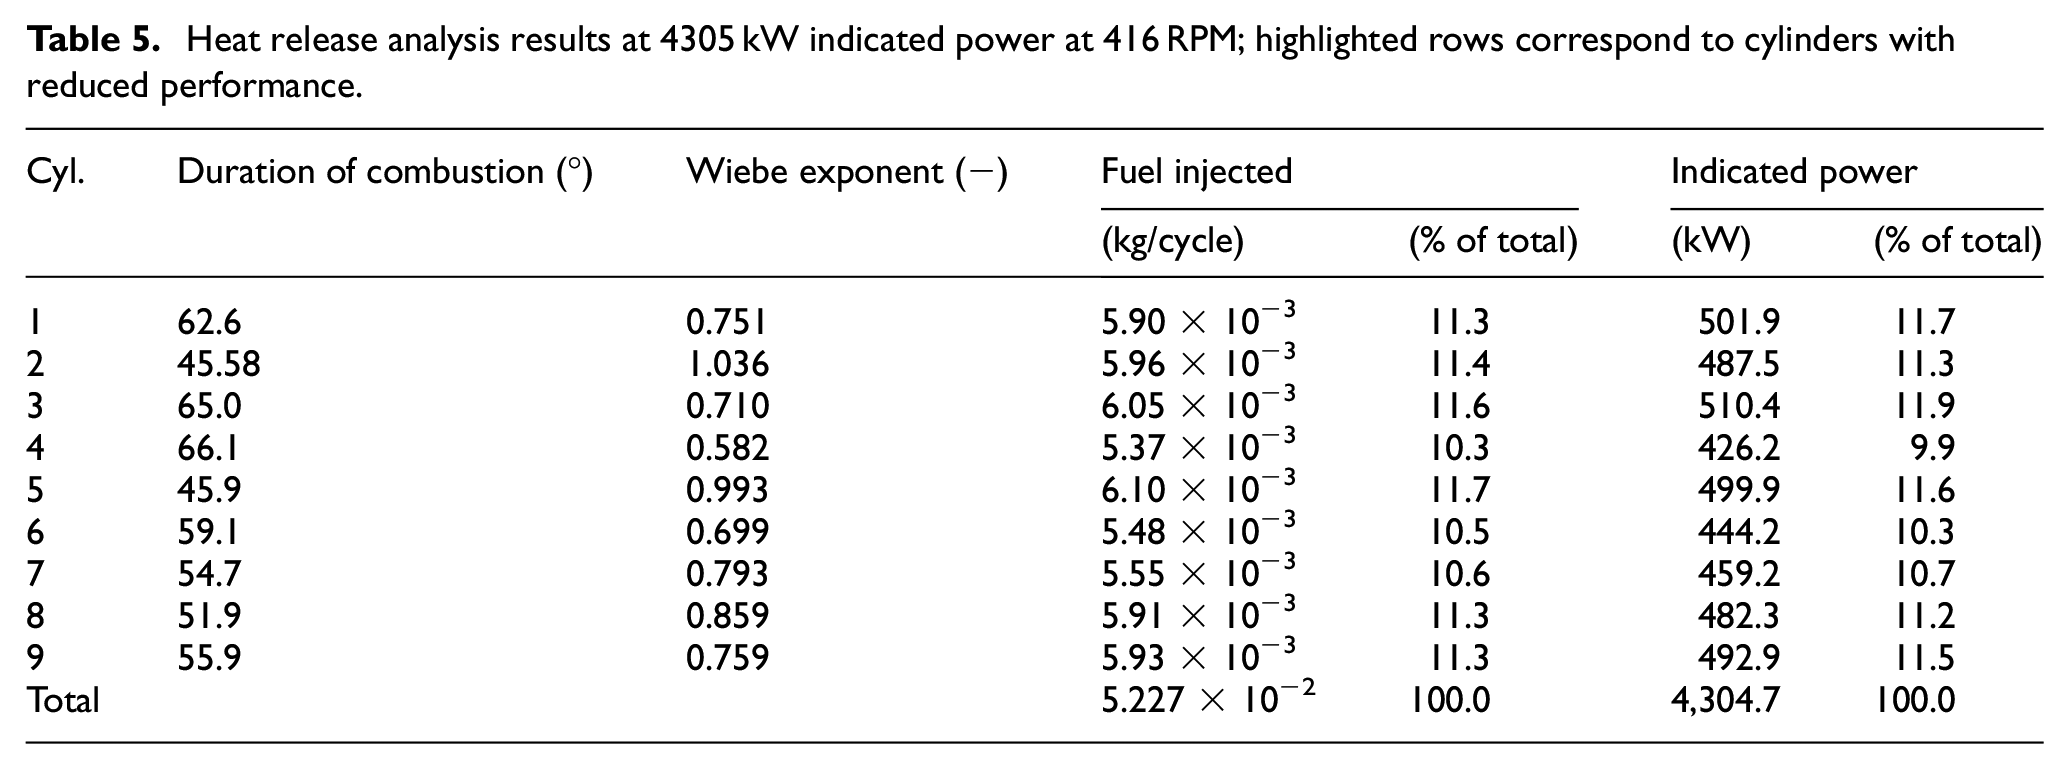
The results of the heat release analysis demonstrate that cylinders 4, 6 and 7 are underperforming, as highlighted in Table 5, with reduced quantity of fuel injected per cycle. Furthermore, it is observed that the average duration of combustion and Wiebe exponent in the healthy cylinders is 54.5°CA and 0.851, respectively for an operating point of 4305 kW (indicated power) at 416 RPM. This is significantly different from the 90.5°CA and 0.323 calculated for the healthy engine conditions for a very similar operating point of 4725 kW (brake power) at 400 RPM in Section Engine Digital Twin for Healthy Conditions.
This may be attributed to engine faults and degradation for the existing engine when the measurements were acquired. This result should be treated cautiously, as inaccuracies are observed in the heat release curves of Figure 6. In specific, the heat release curves should be monotonically increasing functions in theory, however a large decrease to negative values is observed before TDC for cylinders 2, 3 and 8, in addition to an oscillating pattern from 30° to 50°CA. Furthermore, a decreasing rate is observed for all heat release curves at crank angles exceeding 50°CA. This could be either due to human error by faulty mounting of the sensor on the indicator valve, imperfect seal with the indicator valve, fouling of the indicator valve, sensor error, or error in the estimation of the heat transfer rate.
Engine digital twin for current engine conditions
Following the heat release analysis, the combustion parameters of duration of combustion, Wiebe exponent and percentage of total fuel injected per cylinder are utilised as input to the multi-cylinder thermodynamics model, thereby calibrating the digital twin to simulate the current engine operating conditions, as described in Section Engine Health Assessment Framework. The performance of individual cylinders are summarised by plotting the mean peak in-cylinder pressure, IMEP, and EGT at the exhaust valve for all cylinders in Figure 7(a) to (c)), as well as the standard deviations of the respective parameters considering the variations from all cylinders in Figure 7(d) and (e)).
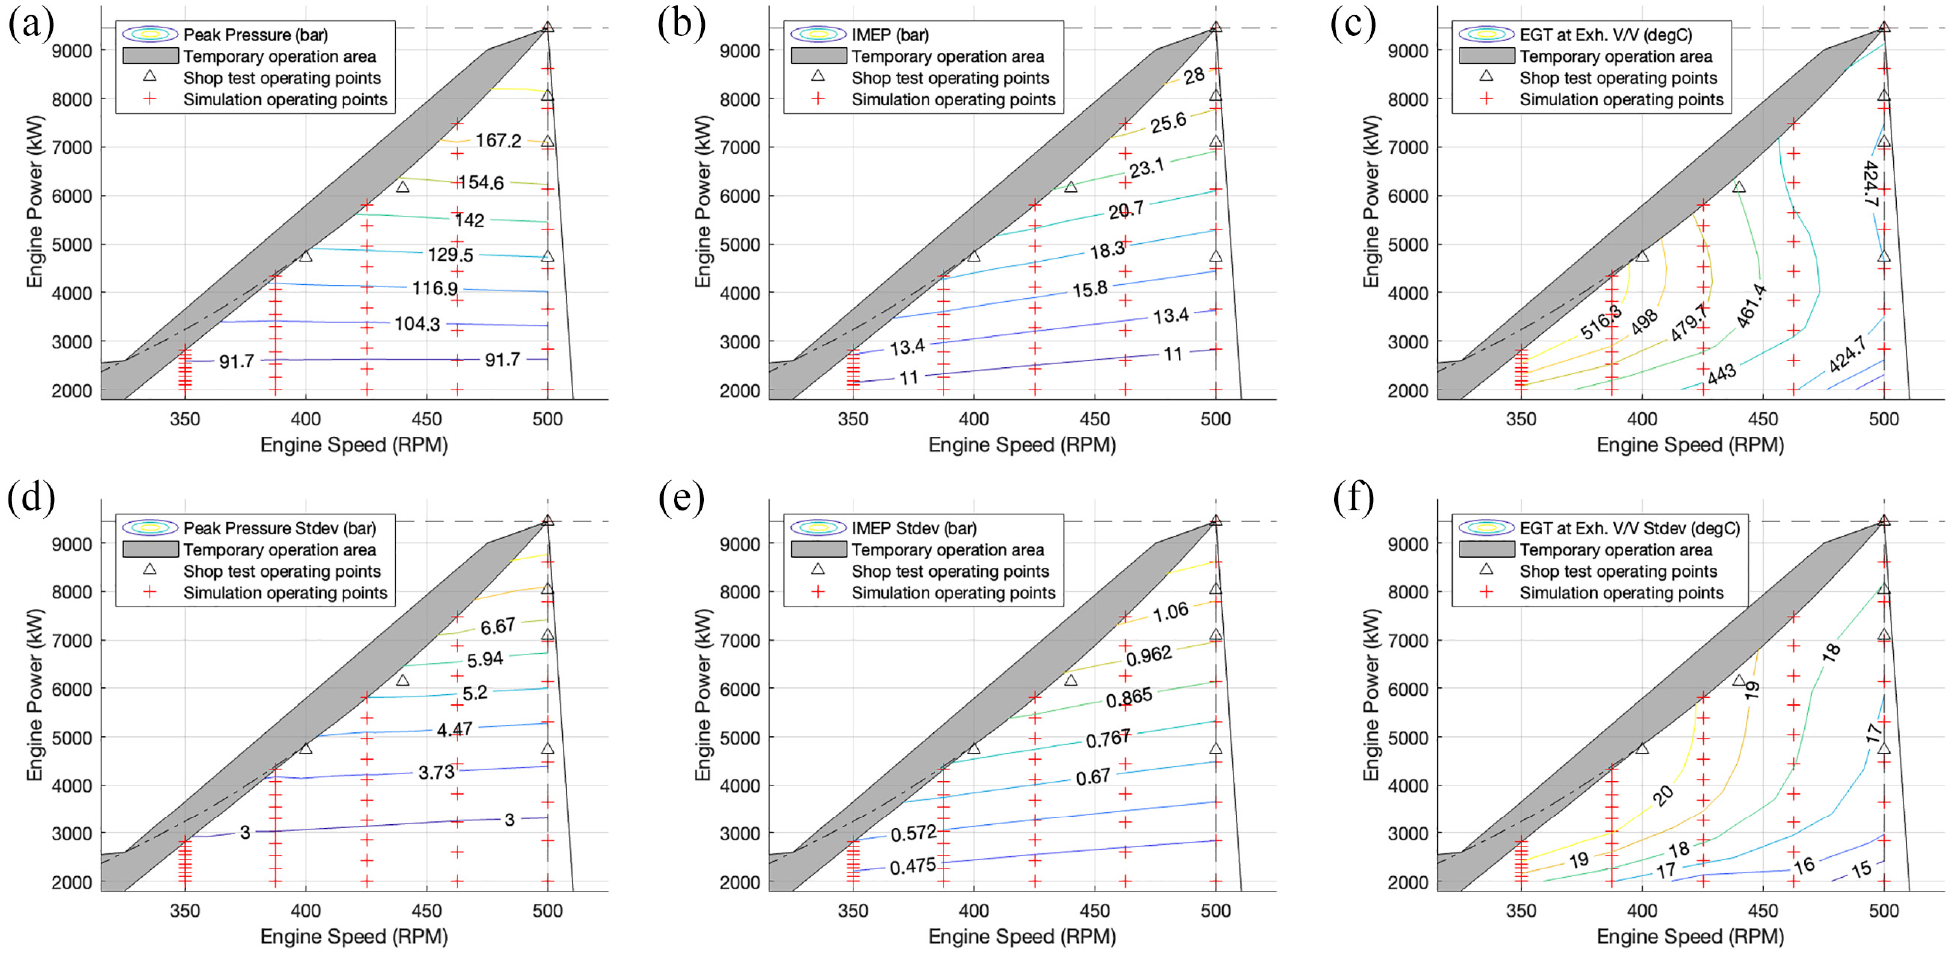
(a) Average peak pressure map from all engine cylinders for current operating conditions. (b) Average IMEP map from all engine cylinders for current operating conditions. (c) Average EGT at exhaust valve from all engine cylinders for current operating conditions. (d) Standard deviation of peak pressure from all engine cylinders for current operating conditions. (e) Standard deviation of IMEP from all engine cylinders for current operating conditions. (f) Standard deviation of EGT at exhaust valve for current operating conditions.
All standard deviation parameter maps have similar shapes to their counterparts for the mean parameter values. This indicates that differences between cylinders gets magnified as the respective parameters increase in value. In specific, Figure 7(a) and (d)) show that as the peak in-cylinder pressure increases to 167 bar, the standard deviation between all cylinders also increases to 6.7 bar; the same trend is observed for the IMEP presented in Figure 7(b) and (e)). Regarding the EGT at the exhaust valve outlet, the standard deviation between all cylinders reaches a maximum of 20°C in line with the maximum mean EGT of 516°C presented in Figure 7(c) and (f)), respectively.
Engine health assessment
The engine health assessment is conducted by comparing vital metrics, which quantify the engine health status over the entire operating envelope, as described in Section Engine Health Assessment Framework. In specific, the BSFC map (derived by using the current engine conditions digital twin) was compared to the healthy conditions BSFC map, as shown in Figure 8, from where an overall increase in the BSFC by 2.1% on average is observed for the entire engine operating envelope. This demonstrates that the efficiency of the engine at the time of the measurement is reduced compared to its healthy state for the entire operating envelope, with a more pronounced efficiency drop occurring for operating points closer to the lower boundary of the temporary operation area.
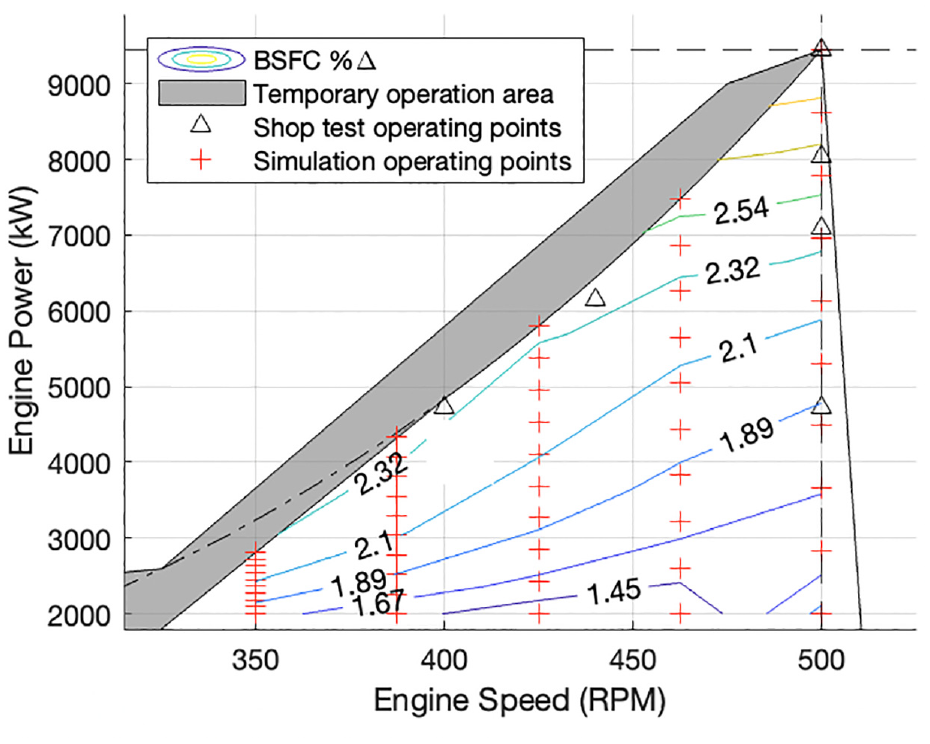
BSFC percentage difference of current engine conditions with reference to healthy conditions.
The EGT at the exhaust valve is a vital engine parameter from the engine health assessment. The comparison of the digital twins results corresponding to the current conditions and the healthy conditions are shown in Figure 9(a) to (c) for the cylinders with reduced performance identified from Table 5. Additionally, the same comparisons for another three randomly chosen engine cylinders are provided in Figure 9(d) and (e). The presented results demonstrate that the cylinders 4, 6 and 7 with reduced performance exhibit a very similar temperature decrease by 6.1% on average compared to the healthy conditions, with similarly shaped contours. This is attributed to the reduced quantity of fuel injected in the underperforming cylinders. Hence, for the engine to retain its power output, the remaining cylinders need to burn more fuel, and as a result an average temperature increase of 1.5% is observed for cylinders 2, 8 and 9, as illustrated in Figure 9(d) and (e). However, this increase is considered reasonably small, hence the engine in its current condition can run comfortably at higher loads without danger of thermal overload.
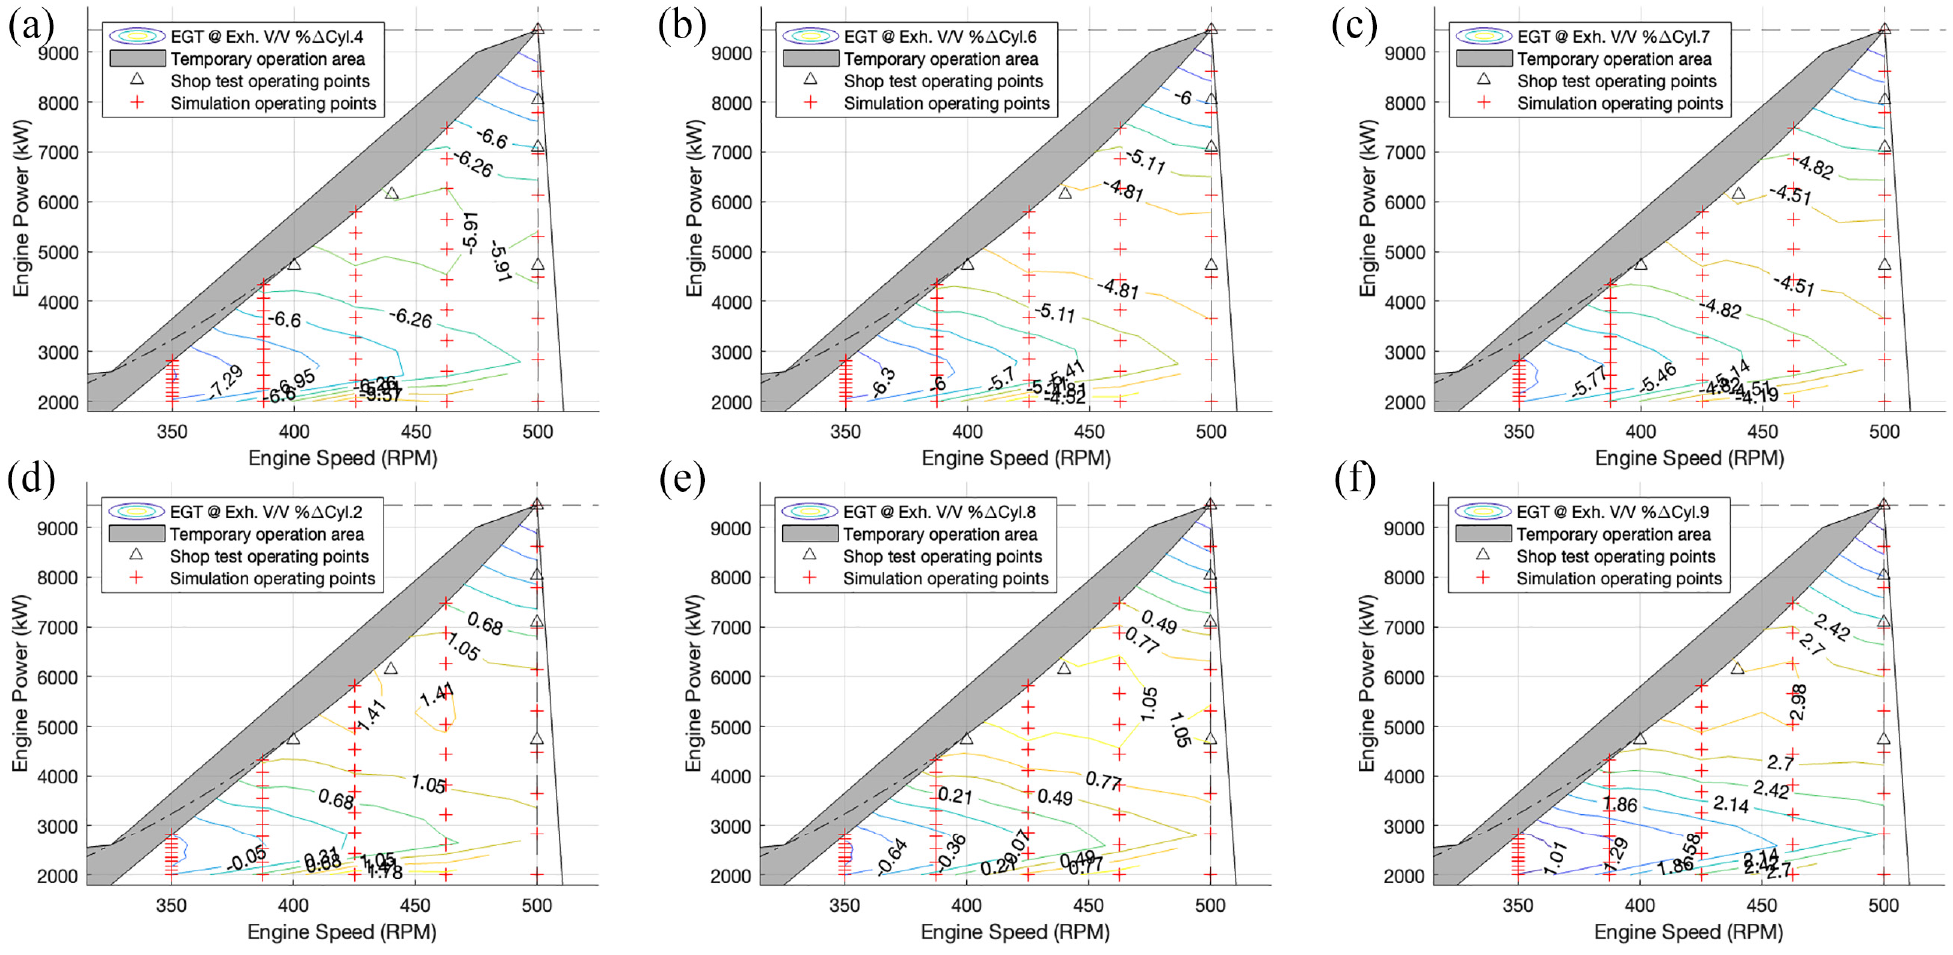
Cylinder exhaust gas temperature percentage difference of current engine conditions with reference to healthy conditions of (a) cylinder 4, (b) cylinder 6, (c) cylinder 7, (d) cylinder 2, (e) cylinder 8, (f) cylinder 9.
The IMEP comparisons are shown in Figure 10. The presented results demonstrate significant reduction for the underperforming cylinders 4, 6 and 7 by an average of 6.7%, 4.8% and 3.7% respectively, as shown in Figure 10(a) to (c). Thus, to retain the engine power output, the cylinders 2, 8 and 9 demonstrate average increases of 3.0%, 1.8% and 3.1% respectively, as shown in Figure 10(d) and (e).
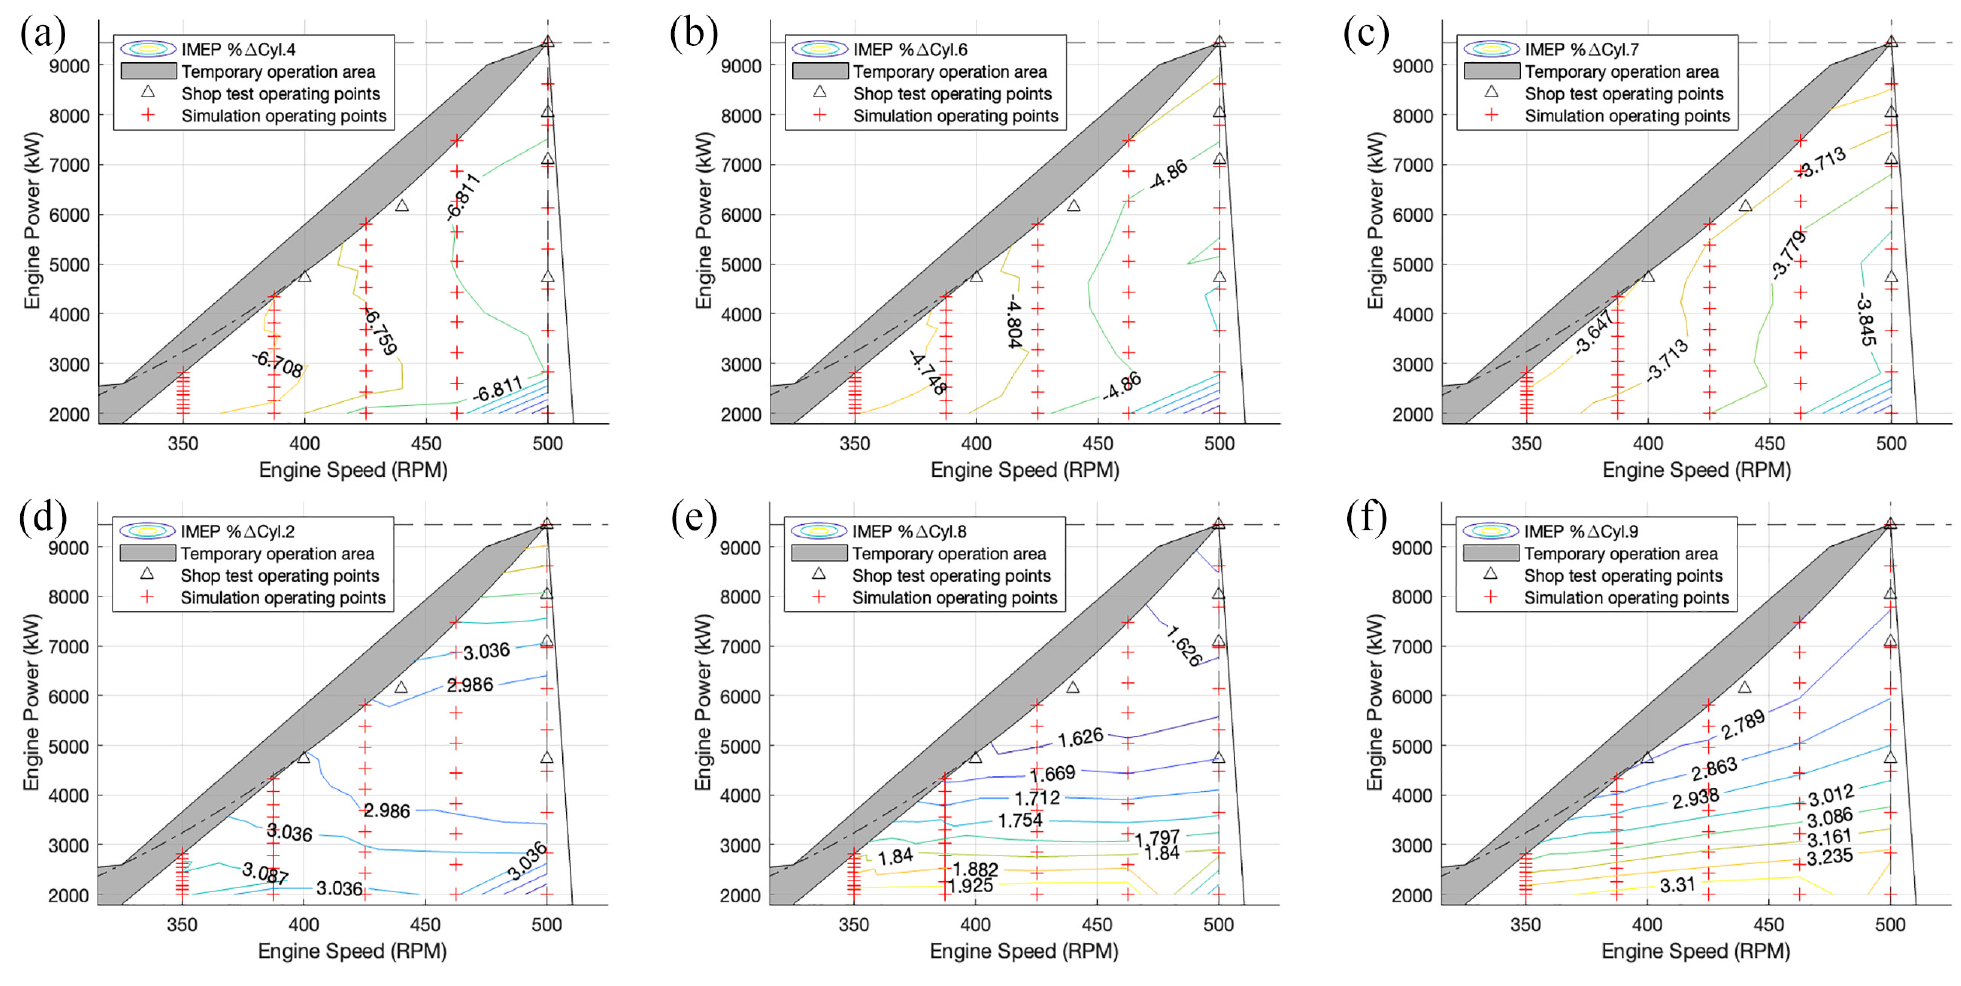
Cylinder IMEP percentage difference of current engine conditions with reference to healthy conditions of (a) cylinder 4, (b) cylinder 6, (c) cylinder 7, (d) cylinder 2, (e) cylinder 8, (f) cylinder 9.
An identical trend with IMEP is exhibited for the peak in-cylinder pressure, where the encountered differences (between the current and healthy conditions results) are less than 2% (which is classifies as minor or marginal difference). As a result, the peak in-cylinder pressure may not be reflect directly to the engine power output, on the contrary to IMEP. Nonetheless, it is useful to monitor the peal in-cylinder pressure (especially for engines using variable injection timing technologies), as it is directly linked to the mechanical stresses on the engine components, and it also effects the BSFC. Moreover, large deviations in the peak in-cylinder pressure may indicate faults in the relevant components, 22 whereas high peak pressure levels may jeopardise the engine integrity.
Conclusions
A framework for health assessment of marine engines enabled by digital twins was developed and demonstrated in the case study of a marine four-stroke diesel propulsion engine. This systematically addresses the challenges of digital twin setup and calibration, including the correction of engine performance-related measurements.
In summary, from the comparison of the simulation results derived by employing the digital twin set up for both the current and the healthy operating conditions, it was deduced that the engine is in a acceptable condition. The exhibited slight increase in the engine BSFC by an average of 2.1% across the entire operating envelope was deemed as reasonable for a 20-year old engine. Furthermore, the exhaust gas temperature (EGT) at the exhaust valves outlet exhibited remarkable decrease by an average of 6.1% for underperforming cylinders, and an increase by 1.5% for the rest cylinders. When expanding this to the entire engine operating envelope, there exists no danger of thermal overload or any operational restrictions. Significant reduction in the IMEP of underperforming cylinders was observed by a maximum of 6.8%, which particularly affects the higher load areas over 6000 kW. Finally, the peak in-cylinder pressure was not found to be the most effective engine health indicator for this case study, since only minor differences were exhibited between the underperforming and the other cylinders.
The usefulness of the digital twin for the current engine conditions was demonstrated, since the engine overall efficiency could be evaluated at its entire operating envelope, linked with its current health status. Furthermore, the individual cylinders health was effectively quantified via the BSFC and exhaust gas temperatures, and IMEP, whereas potential thermal overload and restricted operational areas can be revealed for severely degraded engines.
The prediction of the BSFC does not only provide an overall outlook on current engine efficiency for the entire operating envelope, but can also be utilised as a tool to predict fuel consumption for degraded engine conditions. Subsequently, an accurate life cycle cost assessment of the engine and the ship operation can be performed, providing decisions support to the designers and ship owners/operators. Finally, the proposed framework relies on analysing the engine performance in isolation of other components, such as the gearbox, propeller or alternator, by using typically acquired measurements. Consequently, this tool can be deployed on power plants with limited connectivity requiring only adjustments on the formulation of the thermodynamics model, for the cases of other engine types and configurations.
Future research can focus on the combination of this framework with the novel in-cylinder pressure prediction approach using the engine instantaneous torque previously developed by the authors. 19 This is expected to provide a significantly larger field of in-cylinder pressure data, by deploying only a low-cost torque metre sensor. Therefore, it can allow for timely assessing the current engine conditions, expanding the overall health assessment process presented within this framework.
Footnotes
Appendix I
Appendix II
Declaration of conflicting interests
The author(s) declared no potential conflicts of interest with respect to the research, authorship, and/or publication of this article.
Funding
The author(s) disclosed receipt of the following financial support for the research, authorship, and/or publication of this article: The authors also gratefully acknowledge the financial support of Innovate UK Smart Grants (project number 99958), for the work reported in this article.