
Abstract
This study extends the literature on big data applied to tourism by validating the significance of point-of-sale (POS) electronic transactions, which have received little attention within tourism literature, as a reliable and effective alternative to surveys on guests stays at tourist accommodation establishments. Compared with official statistics on occupancy of tourist accommodation establishments, data on POS transactions tend to exhibit greater volatility and a less adverse year-on-year variation during the COVID-19 pandemic in Portugal. Still, both data sources reveal the same underlying trend. POS electronic payments, namely, at lodging establishments, deliver timely data for most municipalities in Portugal, filling in significant data gaps in many low-density areas, where statistical confidentiality is imposed in tourism indicators. This supports POS data’s effectiveness to analyse regional inequalities at the municipal level, allowing to gain a clearer understanding of the impacts of COVID-19 in domestic tourism.
Introduction
During 2020, domestic tourism helped moderate the worst tourism crisis on record, with international arrivals plummeting by 74% (UNWTO, 2021). Though it provided an important contribution to mitigate the effect of the pandemic, it must be acknowledged that the recovery led by domestic demand was territorially asymmetric and uneven, being more intense in regions less dependent on international tourists, and more capable to attract a demand reoriented from outbound tourism (Arbulú et al., 2021). In the case of Portugal, Marques et al. (2021) show that, during the Summer season of 2020, just a few regions registered a positive year-on-year change in nights spent by domestic tourists. This trend was arguably influenced by their stronger supply of rural tourism accommodation, and consistent with an expected shift of preferences towards rural tourism experiences, purportedly avoiding urban areas and large-scale hotels (Aiello et al., 2020).
However, Marques et al. (2021) rely on data aggregated at the NUTS level 3 (see Eurostat, 2020), which may fail to note sub-regional heterogeneity. Monthly data on nights spent in tourist accommodation, broken down by origin of the guest, are undisclosed for most municipalities. To circumvent this limitation, the present study resorts to alternative data, namely, on electronic payments at point-of-sale (POS), which barely have been applied within tourism research, to verify: first, if domestic demand recovered during the summer season, when mobility restrictions were eased; and second, if the recovery was more pronounced in municipalities with more intense rural tourism, as claimed by Marques et al. (2021). The purposes of this note are thus twofold: to show that POS data may be a valid and timely alternative to the statistics on occupancy of tourist accommodation establishments; to present a more detailed picture of uneven recovery, at the municipal level.
Data on electronic payments at POS
The advent of big data created an enduring and overwhelming flood of data, yielded by heterogenous sources, and accelerated by technological advancements along with the proliferation of smart devices (Oussous et al., 2018). A constant flow of digital footprints left by tourists (Demunter, 2017) is a new resource challenging and moderating the dominance of official and traditional statistics, which mostly delivers asynchronous data, with time lag issues, supported on conventional more expensive methods based on surveys (Cortina García et al., 2018). Therefore, big data provides improved quality information for better decisions, not only with more diverse information, but also with enhanced and finer geographical granularity (Demunter, 2017). These dimensions encapsulate the initial definition of big data sustained on the 3V’s paradigm (volume, variety and velocity), later extended by Gantz and Reinsel (2011) by including ‘value’, to emphasize its reliability and effectiveness (Li et al., 2018).
Tourism research has joined this new era of big data, which represents a huge opportunity to capture more precisely the tourists’ socio-spatial behaviour (Li et al., 2017; Asakura and Iryo, 2007). The importance of big data within tourism research has been consolidated by factors such as (Li et al., 2018): (1) the development of the internet, which allowed to expand user-generated platforms; (2) the advancement of the Internet of things (IoT), that permitted to track tourist movements and capture significant spatial-temporal big data; (3) and finally the complexity of the tourism system, which comprises numerous operations generating relevant transactional data.
Specifically, big data analytics can provide data-driven tourism market research, including behavioural patterns, emotions and sentiment analysis, satisfaction, and other metrics very helpful for developing tailored tourism experiences, forecasting tourism demand and planning and managing destinations (Ferreira, 2019; Li et al., 2018; Xiang and Fesenmaier, 2017; Yang et al., 2015). Particularly POS data, which has an enormous potential to estimate different economic tourism indicators, such as economic value, growth, innovation, productivity and efficiency (Burson and Ellis, 2014), has been applied to a limited extent and only a few studies have been carried out to test its robustness, due to its sensitivity (Demunter, 2017).
Within the wide range of transaction sources, payment card data constitutes a relevant resource to capture tourists’ physical and monetary flows. During the last 20 years, card payment systems became increasingly important, generating individual consumer raw data (Lauer, 2020). This enabled organizations such as banks and retailers to develop internal big data analytics and data processing systems, producing valuable market intelligence. Compared to traditional tourism statistics, data on electronic payments can be a reliable timelier proxy for tourism flows and demand, with new layers of knowledge, namely, monetary, spatial and temporal. Notwithstanding this source’s vast possibilities, only a few applications have been made in tourism given the sensitivity of the data (Demunter, 2017).
Therefore, the pertinence of electronic payments at POS is even more acute nowadays given the current context of uncertainty due to the COVID-19 pandemic (Kraenzlin et al., 2020; Campos-Vazquez and Esquivel, 2021), which determined a sharp decrease in discretionary spending as well as reductions in cash usage (Wisniewski et al., 2021). This is also particularly important when addressing tourism consumption in low-density regions where tourism statistics are often limited by statistical confidentiality as happens in Portugal.
Methods
This study fully relies on secondary data publicly available. Data on nights spent at tourist accommodation establishments used by Marques et al. (2021), at the NUTS level 3, is retrieved from Statistics Portugal (INE, 2021, Apr 27, personal communication). The electronic payment data is obtained from the SIBS Analytics Portal (SIBS, 2021), specifically the monthly value of payments performed with bank cards issued in Portugal in the municipalities of mainland Portugal. The POS data is broken down by sectors of economic activity and only the POS terminals attributed to the accommodation sector were selected. Accommodation establishments are classified according to the Portuguese Standard Industrial Code (CAE), corresponding to the groups 55.1 and 55.2 of the statistical classification of economic activities in the European Community (NACE Rev. 2), which roughly match the same establishments inquired to estimate the nights spent at tourist accommodation establishments. The year-on-year change in the two types of data is compared and correlated to assess if both reflect the same underlying phenomenon. POS data at the NUTS level 3 is obtained by aggregating the absolute values from the respective municipalities.
The year-on-year change in POS payments is further related to an index expressing the intensity of rural tourism supply. Following Marques et al. (2021), this index is obtained by the first Principal Component of these three ratios: share of rural in total accommodation capacity; rural accommodation capacity by population and rural accommodation capacity by area. Area and population are retrieved from the same sources as Marques et al. (2021) data (DGT, 2020; INE, 2020). Accommodation capacity, however, comes from a different source, given that the data obtained from the survey of accommodation establishments (INE, 2021, Apr 27, personal communication) is undisclosed for most municipalities, due to statistical confidentiality. In the present study, accommodation capacity is aggregated at the municipal level from the National Tourism Registry, available from the Georeferenced Open Data Platform of the Portuguese national authority on tourism (Turismo de Portugal IP, 2021).
Findings
Comparing POS data with overnights
The first objective of this study is to exemplify the use of POS data as a straightaway and inexpensive alternative to surveys on guests stays at touristic accommodation establishments. The comparison of year-on-year change computed from these two different data sources is represented on Figure 1(a)) with aggregated data from continental Portugal. This figure shows that both curves display the same underlying phenomenon. However, from June to December, the line representing POS data is systematically above the other. Assuming that the change in number of the nights spent is the target variable, one may conclude that POS data estimates that variation with a positive bias, which may be due, in part at least, to guests avoiding cash and resorting more intensely to cashless payments during the COVID-19 pandemic (Wisniewski et al., 2021). Year-on-year change of accommodation demand – comparison between POS data and overnights.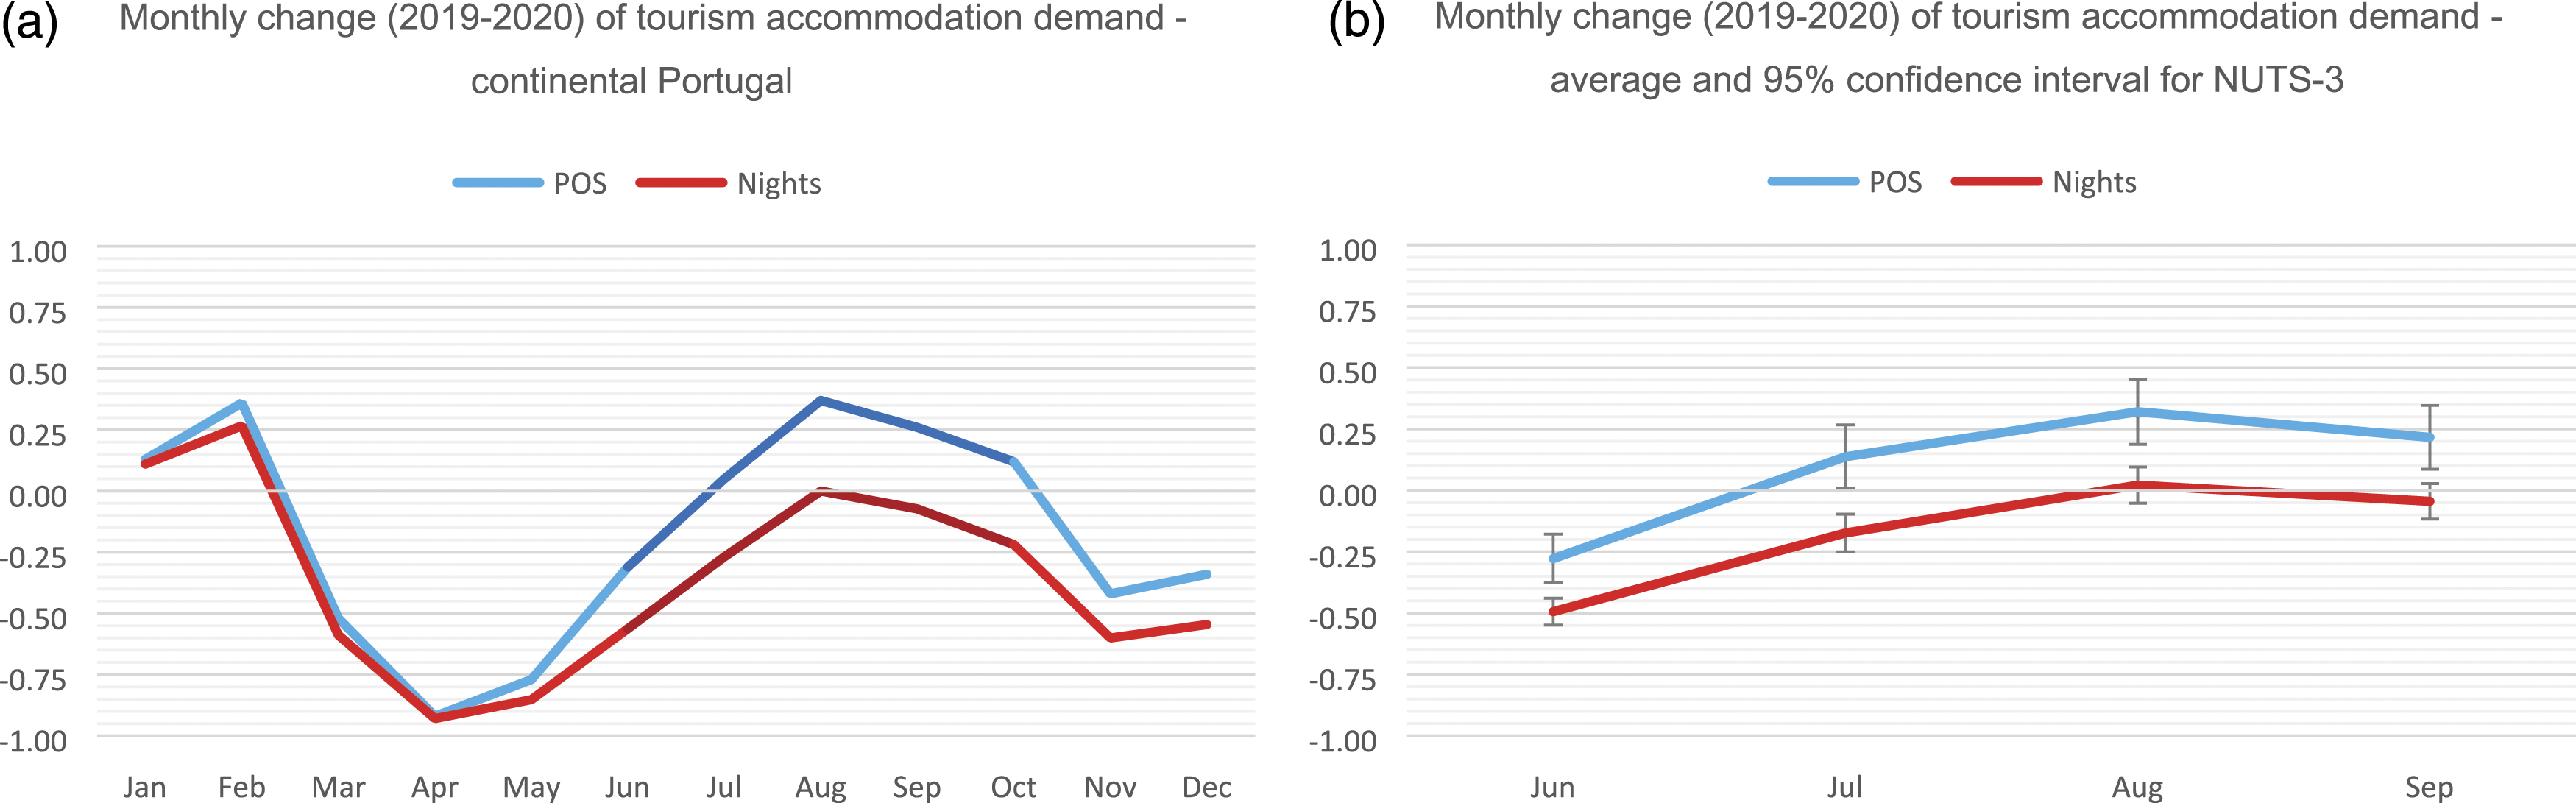
Heterotrait and monotrait correlations between POS and overnights (year-on-year change measured at NUTS level 3).
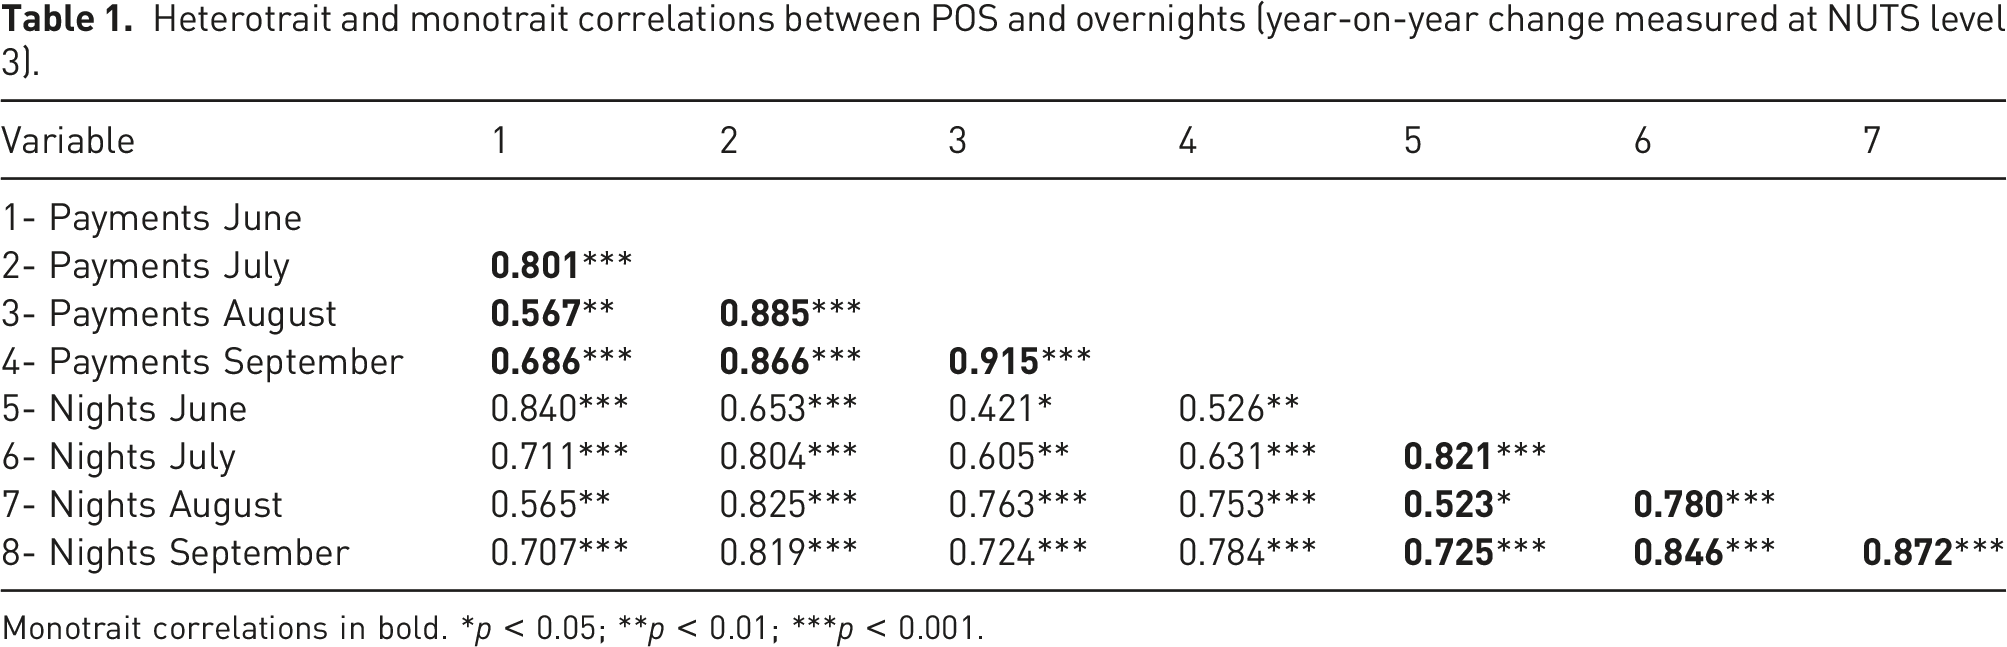
Monotrait correlations in bold. *p < 0.05; **p < 0.01; ***p < 0.001.
It may thus be concluded that, concerning the data used by Marques et al. (2021), at the NUTS level 3, to reveal the uneven and limited recovery of the Portuguese accommodation sector during the summer of 2020, the timelier and inexpensive POS data indicates the same results, but with a positive systematic bias, possibly due to avoidance of payments in cash. Having shown that both data express the same phenomenon, POS data may be used to analyse regional disparities at the municipal level, where data from the surveys on accommodation occupancy is undisclosed for a vast majority of the country. The next section reports this analysis, and discusses Marques et al. (2021) argument that the limited summer recovery in domestic demand favoured those regions with a more intense supply of rural tourism accommodation.
Analysing regional disparity in POS data
To describe the regional disparity of change in POS data and relate it with the intensity of rural accommodation supply, the municipalities of continental Portugal were classified by the two-step cluster algorithm available in the IBM SPSS statistics suite (Chiu et al., 2001), according to their performance in the variables measuring change in payments in the 5 months from June to October. From the 278 municipalities, 36 were excluded either because data is missing for at least 1 month or because the case is an outlier with extreme change values. The remaining 242 are grouped into four clusters (Figure 2): Losers (83 cases) keep losing POS revenue during the entire period; Recovering (79 cases) start with a negative change in June, recording almost an even pace in July, and marking positive changes from August on; Gainers (60 cases) disclose a small positive change in June and keep gaining about 50% between July and October; Heavy gainers (20 cases) double POS revenue in June and triple it between July and September. Change (2019–2020) in POS payments, per cluster.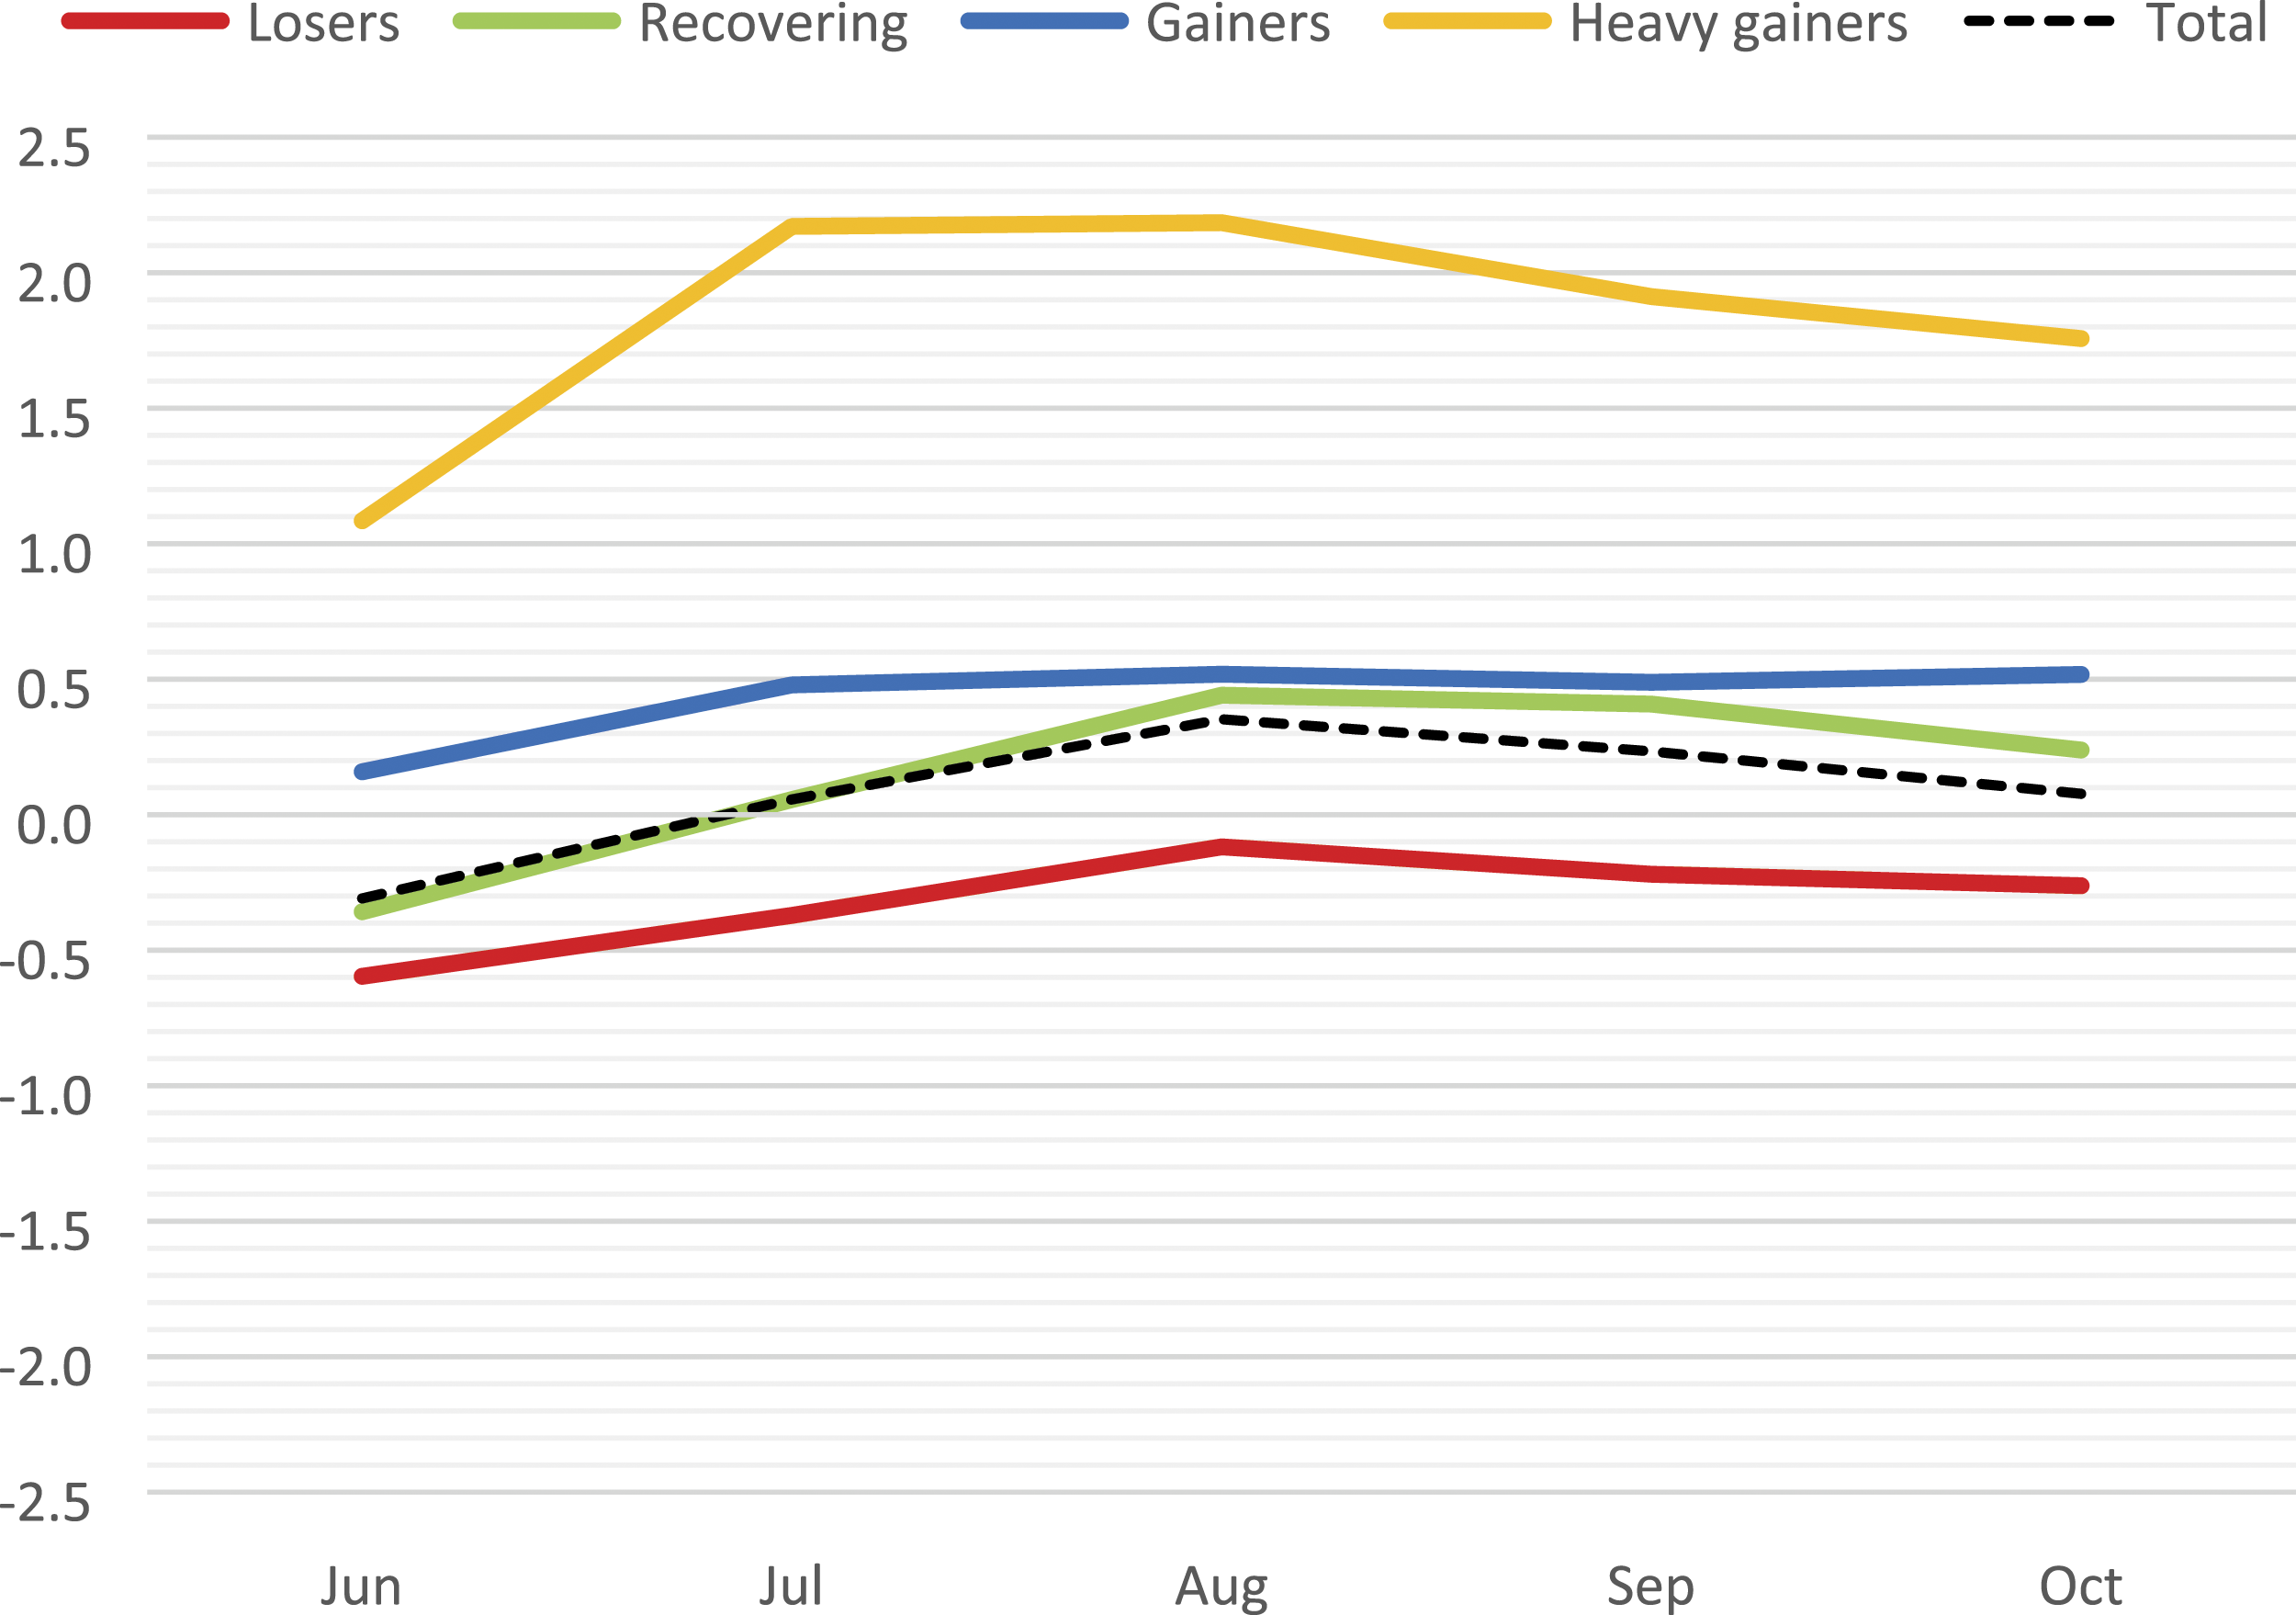
The distribution of the index of rural tourism accommodation intensity is compared between the four clusters by analysis of variance. The null hypothesis is rejected at p < 0.001 (F = 6.23 with 3, 235 d. f.). There is an asymptotic relationship between rural accommodation intensity and positive change in POS (Figure 3). Post-hoc comparisons show that both groups of gainers have more intense rural tourism supply, comparing with Losers. The index of rural tourism intensity correlates positively with each of the five variables representing year-on-year change in electronic payments from June to October. The Pearson coefficients range from 0.168 in August (p = 0.007) to 0.247 in October (p < 0.001). Average and 95% confidence interval of the index of rural accommodation intensity, per cluster.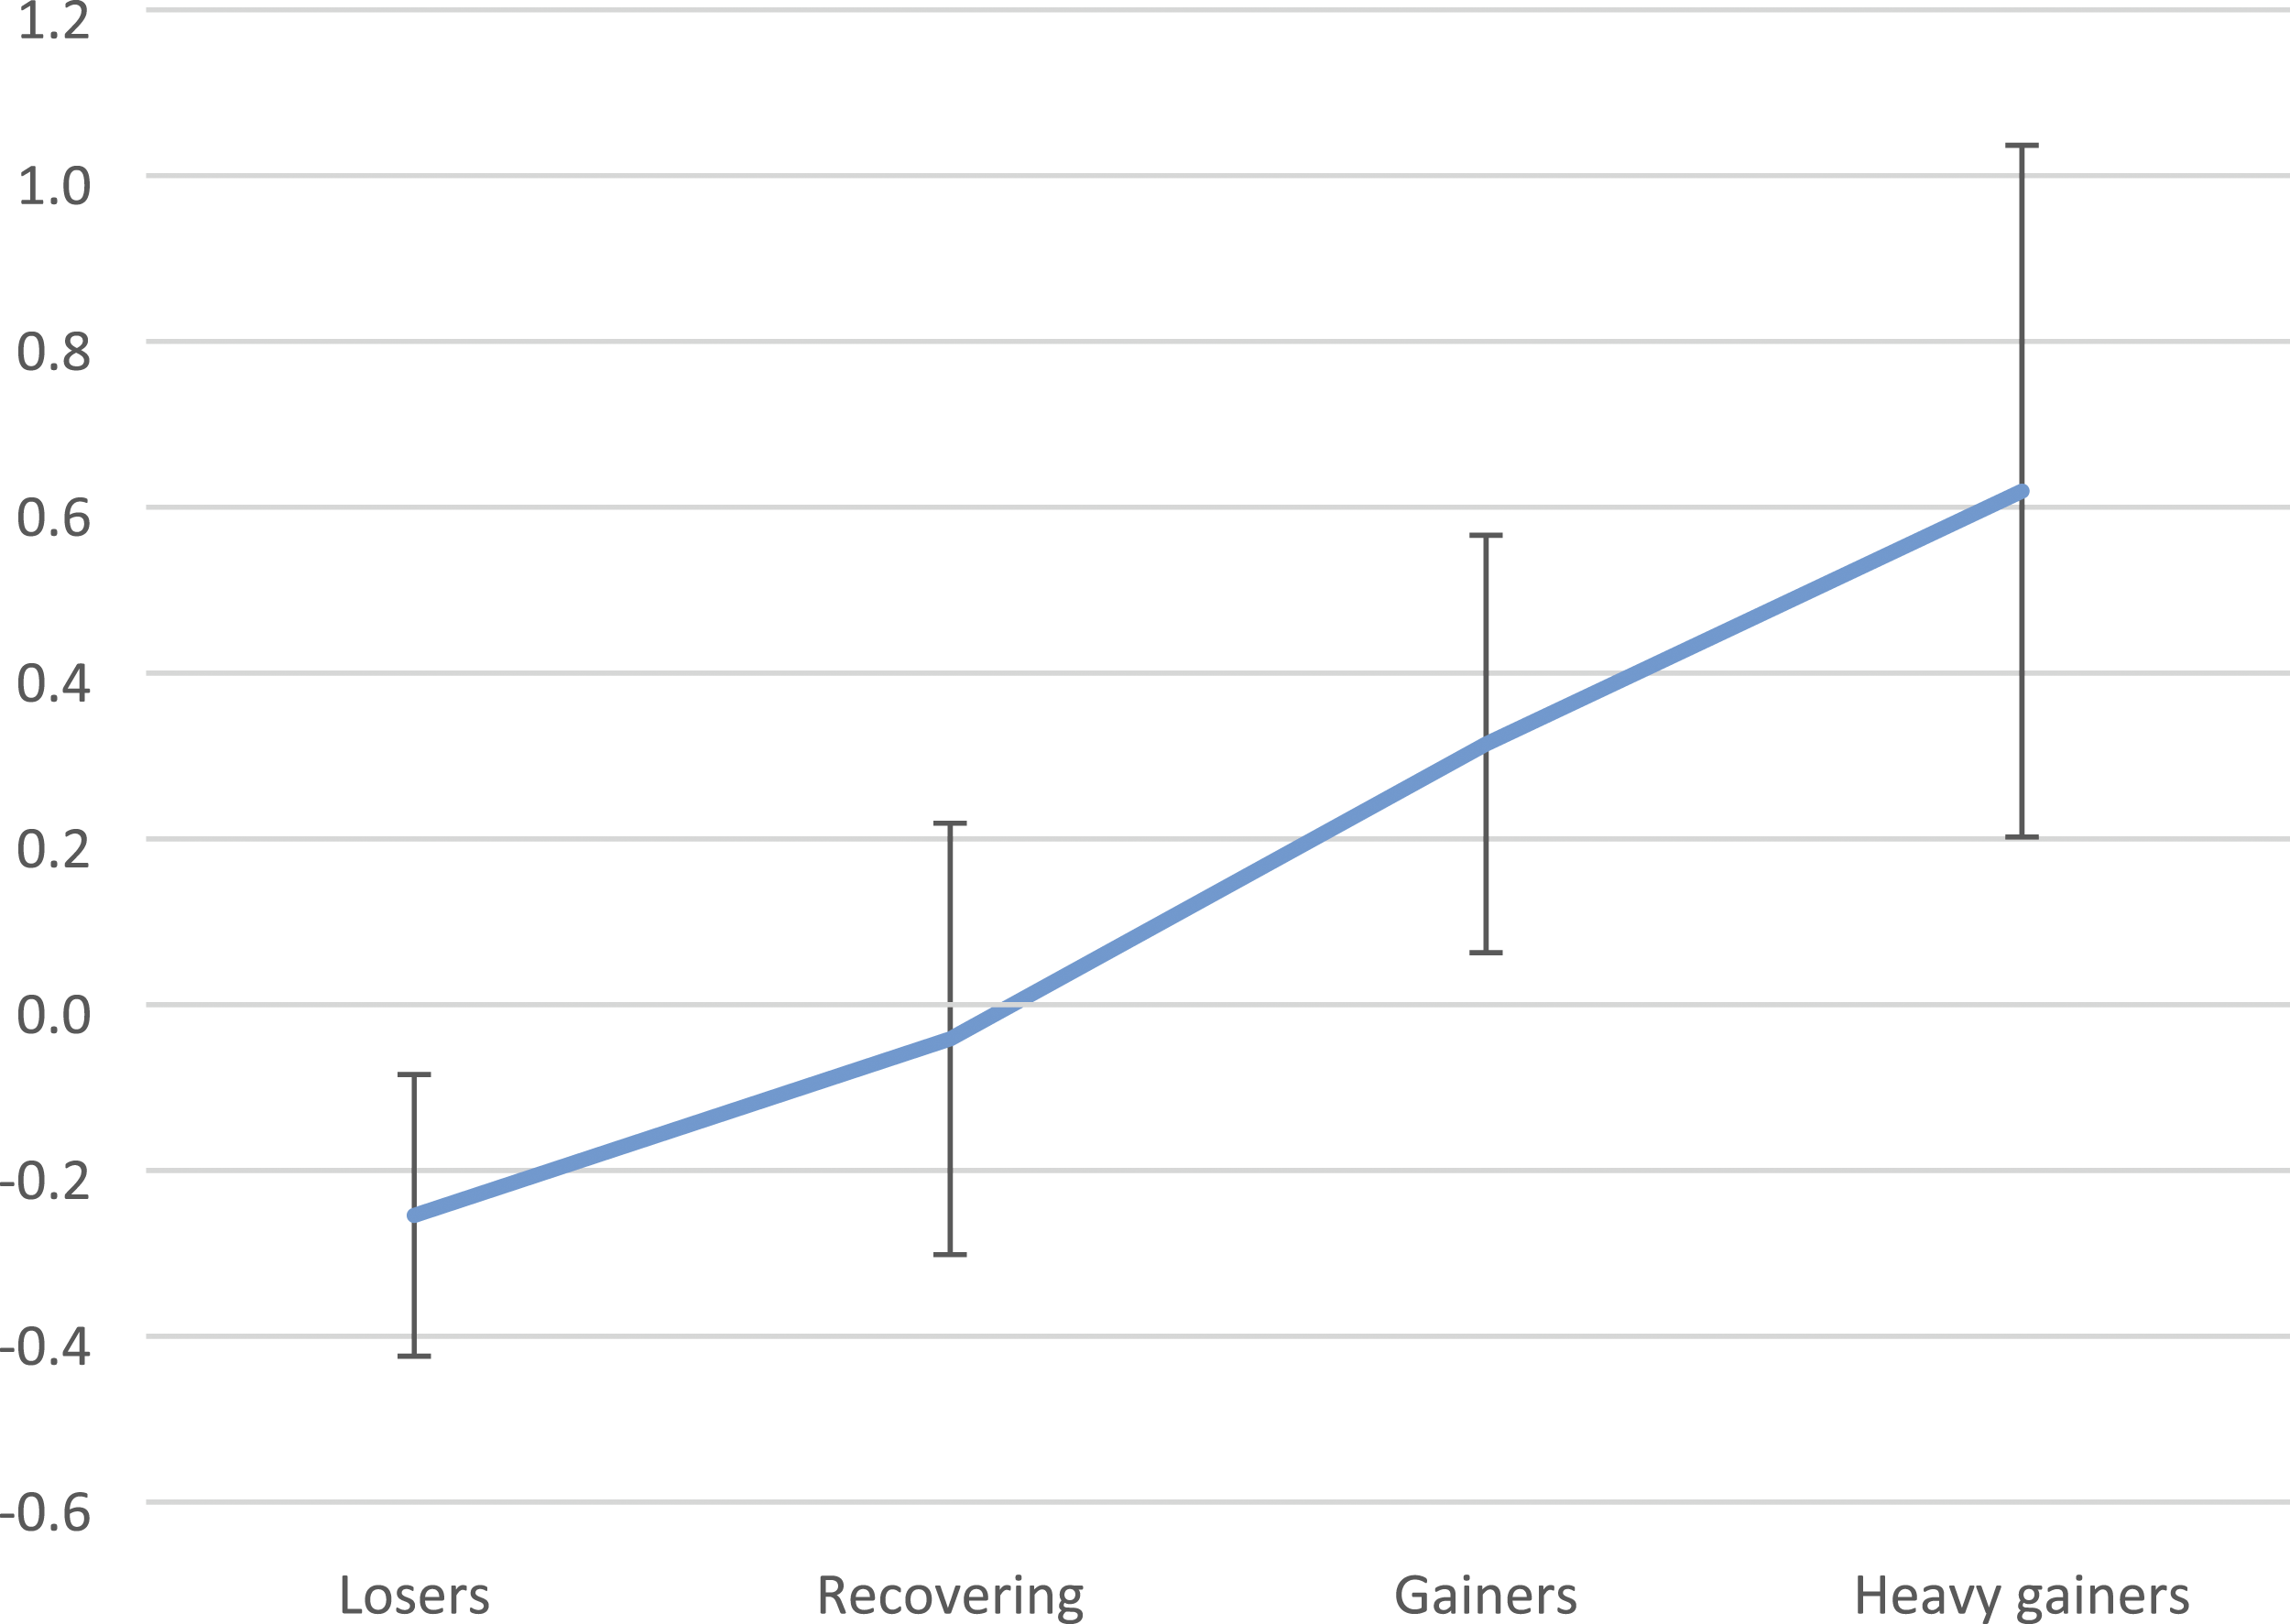
These results confirm a relationship between the rural character of accommodation supply and the recovery from the domestic demand, although the correlations are weaker than those reported by Marques et al. (2021). This may suggest that using different data sources (POS instead of overnights and total accommodation capacity instead of available capacity) may reduce the correlations, or that using disaggregated data, at the municipal level, presents a more complex picture where rural accommodation intensity, per se, has less predictive power. Following the latter assumption, the clusters are mapped in Figure 4, helping visualizing regional disparities. Eight of the 20 Heavy gainers are in the banks of Douro River. Another five are found in the central area of the country, near the mountains of Estrela and Lousã. The largest contiguous gaining area is Alentejo, south of Lisbon. Municipalities from continental Portugal, per cluster.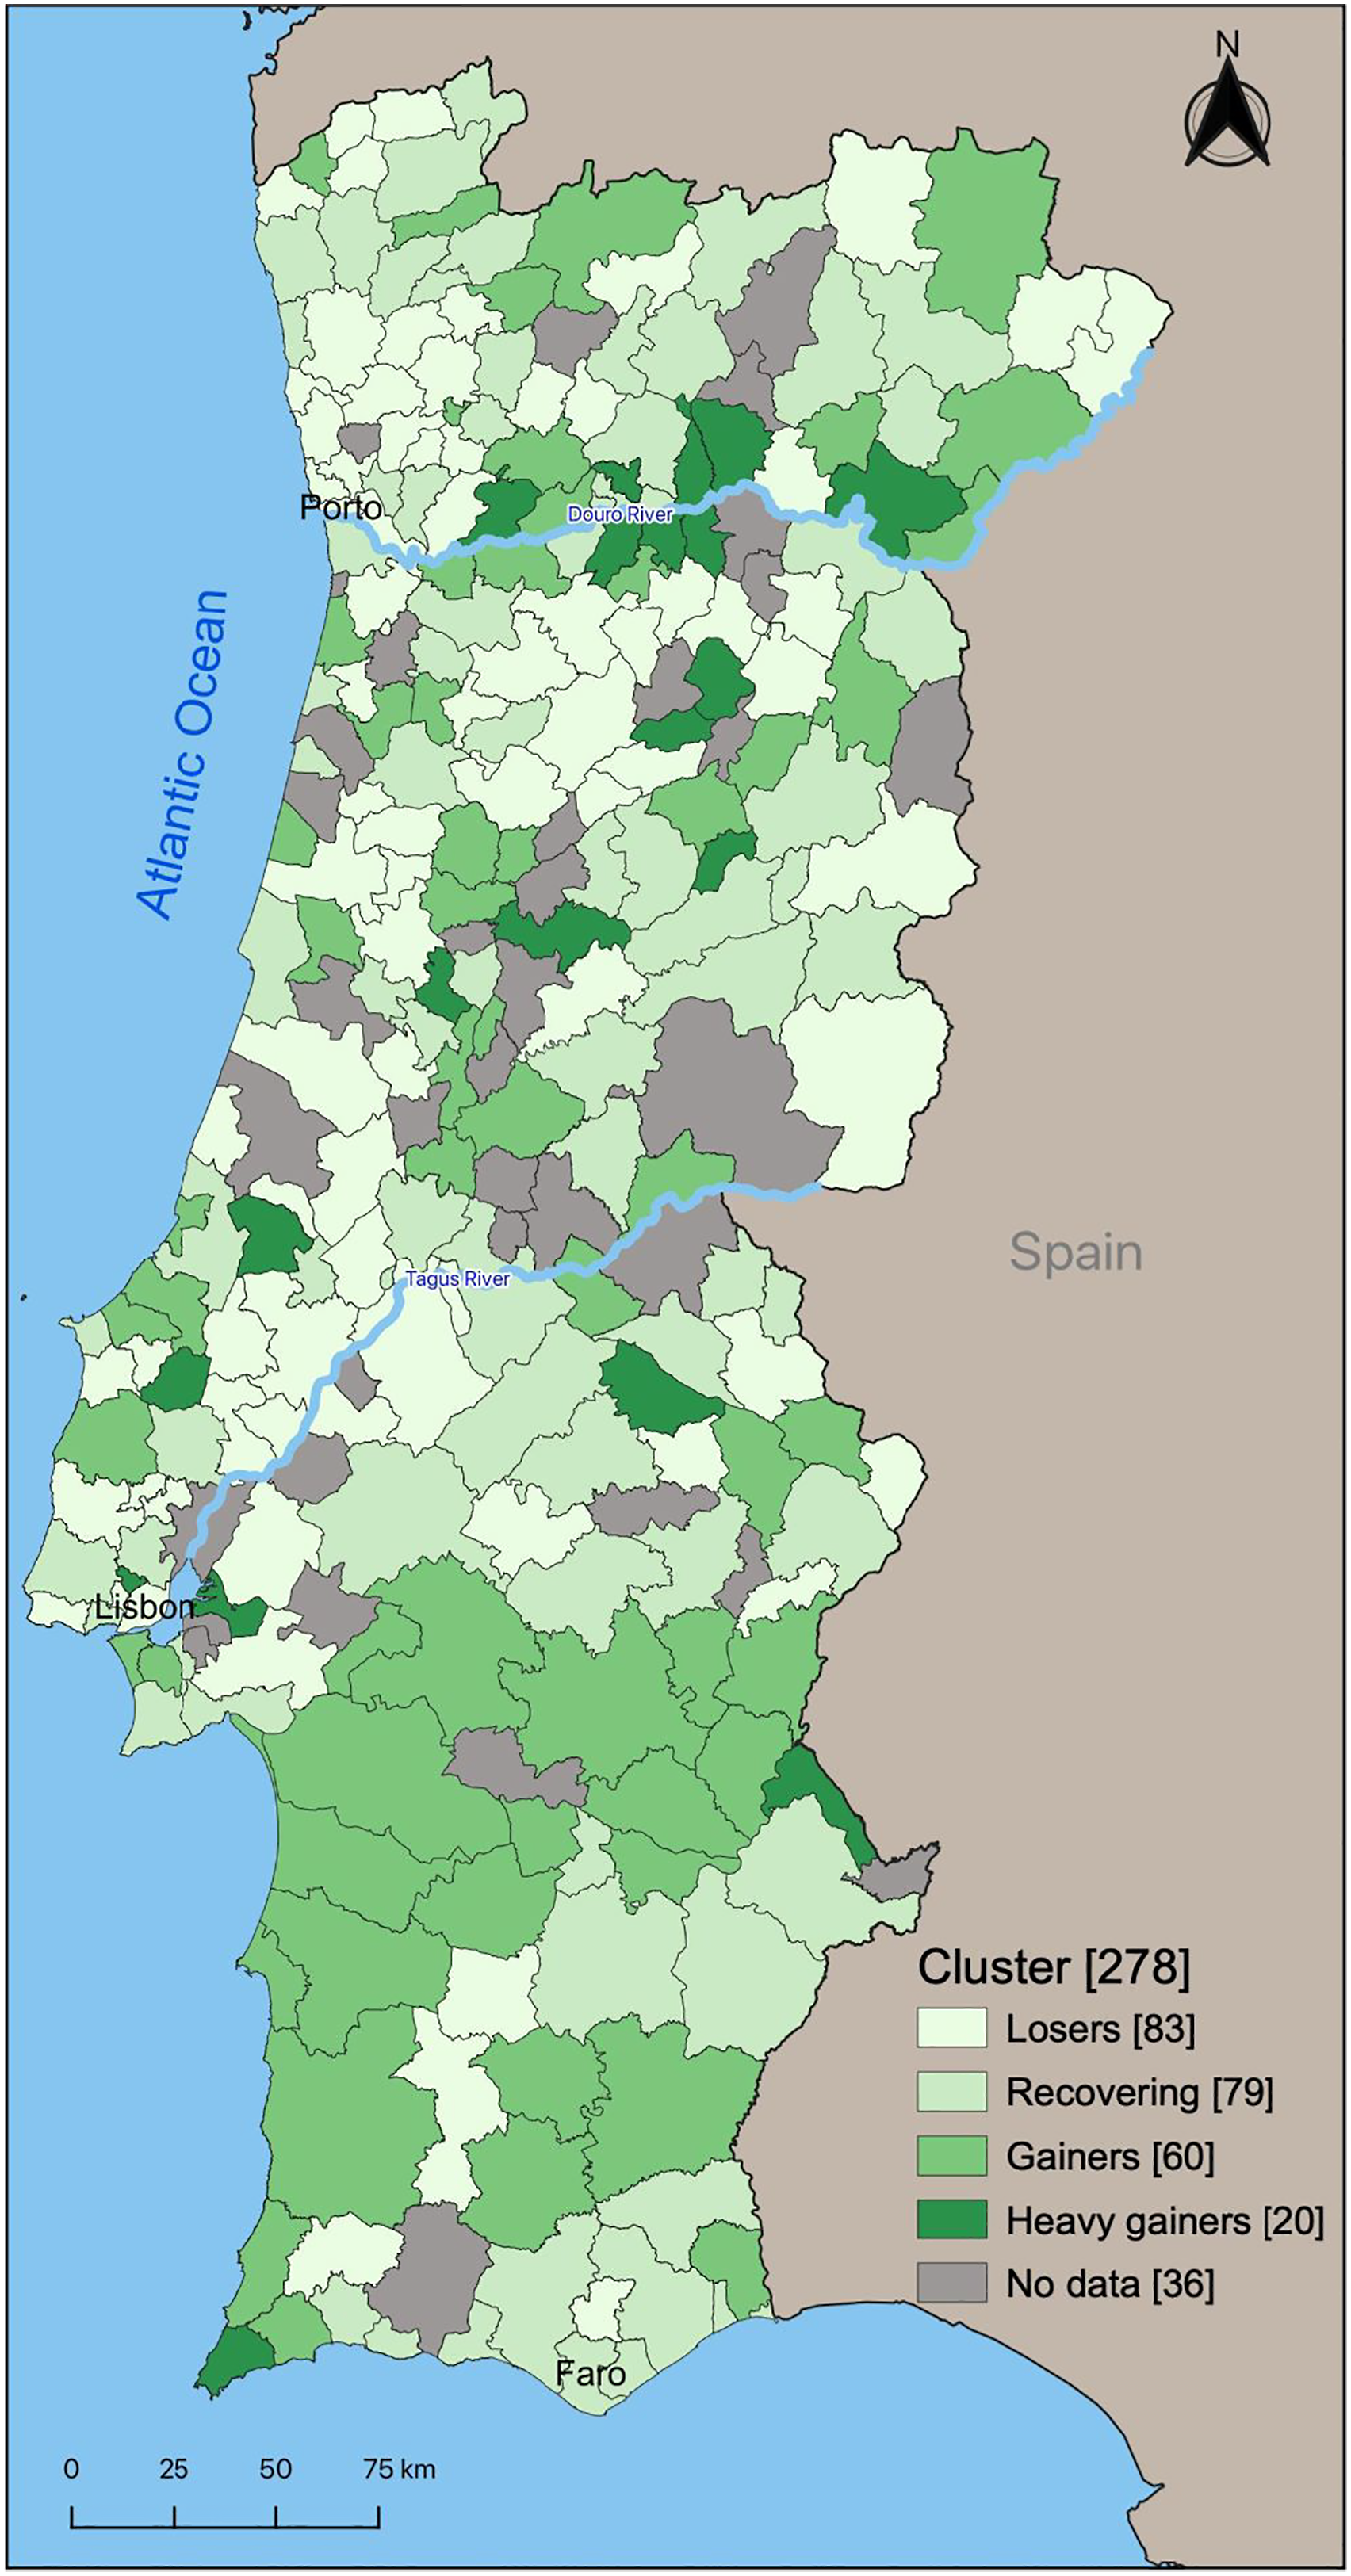
Compared with the maps presented by Marques et al. (2021), Figure 4 shows that the recovery is uneven within the NUTS level 3 regions and that, besides the intensity of rural accommodation supply, there may be important attraction factors favouring some establishments. Such factors may be marketing-driven, or they may depend on shifting preferences for some specific locations, such as natural protected areas or particular agricultural landscapes (Albaladejo and Díaz-Delfa, 2020).
Conclusions
This research provides an important contribution to literature by validating the significance of POS electronic payments data as a reliable and effective proxy for tourism flows, which have been scarcely used within tourism research. Its sheer volume, finer geographical granularity and dispersion, allows a more accurate representation of regional disparities and uneven recovery from COVID-19, at the municipal level. Electronic payments at POS fill an important data gap due to enforced statistical confidentiality in many low-density municipalities, which in this study acquires added significance. Likewise, point-of-sale electronic transactions provide a more precise interpretation of tourism demand behaviour in a cashless society, now more pronounced due to the pandemic.
The findings have important implications for future policymakers and industry alike, as they demonstrate POS data’s robustness and usability, which can be adopted by both with limited complexity. This study provides evidence that POS data is a reliable source. Governments can take advantage of it to develop regionally specific barometers providing timely updates on the amount of cash being spent on certain products and services by the traveller either disaggregated by destination or origin. This may assist local tourism stakeholders in the regions to make knowledgeable planning, investment and management decisions. Yet, a methodology should be developed which tests POS results against several other regional indicators so that it addresses the requirements of the industry, researchers and policymakers.
The results conveyed herein should be considered in light of some limitations. Despite the undisputed quality of the data that was used in this study and an unquestionable trend towards a cash-lite society in Portugal, paper money is still a significant means of payment particularly in rural areas and undeveloped places in the world where the informal economy proliferates. Its application depends on infrastructure required to support cashless transactions, which are frequently non-existent or deficient in remote areas. Therefore, both active and passive forms of resistance to digital transactions and mobile banking could challenge further investigation of tourism flows in rural areas and could hinder future studies applying similar methodologies in undeveloped economies where informality predominates. Despite this limitation, this is still an emergent research topic and therefore further studies are warranted at different geographical scales and contexts, extending this methodology to examine POS results in comparison to other tourism indicators.
Footnotes
Declaration of conflicting interests
The author(s) declared no potential conflicts of interest with respect to the research, authorship, and/or publication of this article.
Funding
The author(s) disclosed receipt of the following financial support for the research, authorship, and/or publication of this article: This work is supported by the FCT – Portuguese Foundation for Science and Technology under the project UIDB/04011/2020.
Author Biographies
Carlos P Marques, Phd, is Associate Professor of Tourism Marketing at the University of Trás-os-Montes and Alto Douro. His research interests include attitudes and behaviours of tourists, tourism flows, and management of rural tourism.
Alexandre S Guedes, is an Assistant Professor at the University of Trás-os-Montes and Alto Douro (UTAD), having earned his PhD in New Resources and Sustainability in Tourism from the University of Salamanca. His research interests include tourism planning, spatial analysis, cultural tourism, wine tourism, and river tourism.
Ricardo Bento, PhD, is Assistant Professor of Spatial Planning at the University of Trás-os-Montes and Alto Douro. His research interests include urban and regional planning, spatial analysis methods and GIS applied to transport and mobility.