
Abstract
This study proposes as a key cause of the high failure rates in the implementation of analytical projects for marketing decisions, the discrepancy in the information quality (DIQ) perceived between producers (information technology [IT]) and users (marketing) of knowledge. Given that the DIQ between agents is a determining factor in the success of the ability to data analytics, this study focuses on examining this concept and its causes, specifically the resources related to data analytics that influence DIQ. The results of the surveys carried out with the IT and marketing managers of 95 companies in Spain, analyzed with a comparative methodological approach (dyadic), reveal the sources of the discrepancy, namely, the quality of the data, the technological capabilities, the talent, Chief Executive Officer (CEO) support, and alignment of the data plan with the marketing plan.
Introduction
The data analytics capacity, and especially that of big data, is considered an increasingly important component for companies in advanced economies (Ren et al., 2017). Its usefulness in the decision-making based on quality information has the potential to transform the economy and growth (Manyika et al., 2011). Data analytics capacity is broadly defined as the ability to provide business knowledge through the conjunction of a series of organizational factors (Kiron et al., 2014) or also as the extraction of hidden information about consumer behavior (Erevelles et al., 2016). In this context, it is pertinent to distinguish between data and information (Riesener et al., 2019): the data represent the source of information (Aamodt & Nygård, 1995), and the information emerges as a result of an analytic oriented to decision-making. In short, information has a higher hierarchy than data (Rowley, 2007).
The data analytics literature also warns of the existence of a high rate of failures in the implementation of analytical projects, over 70% (CISCO, 2017; White, 2019); very few companies have achieved a great impact through big data analytics (Akter et al., 2016). Executives are aware of this problem, they know that the industry is young, and they attribute the origin of errors to quality problems, inexperience, and immaturity relative to the factors that determine data analytics capacity (Davenport, 2014; Davenport & Harris, 2007). According to Mithas et al. (2013), failures in data analytics derive from unique requirements that entail the articulation of different organizational factors of a data analytics capacity.
A key cause of the existence of a high rate of analytical project implementation failures reported by the data analytics literature is the discrepancy in the perception of information quality (IQ) between producers (IT) and information users (marketing; Fosso Wamba, Akter, Trinchera, & De Bourmont, 2019). In fact, previous research, for example, Karimi et al. (2004) and Wixom and Todd (2005) on satisfaction in IS (information systems), argue that the discrepancy of information quality (DIQ) is decisive in the satisfaction of the user of the information, and by default in the organizational performance. Other research maintains that the alignment of organizational resources determines the DIQ and determine the level of satisfaction of information users (Forrester Research, 2011; Gackowski, 2013). Therefore, we propose DIQ as a source of failures in projects that generate quality of information, and then we analyze the causes of this failure.
Thus, DIQ is a determining factor in the success of data analytics capacity, and this study focuses on analyzing this concept and its causes, specifically the resources related to data analytics that influence discrepancies on the quality of information for marketing decisions. To this end, this research has as its main objectives: first, validate our central assumption of this research, which is the existence of a discrepancy between IT and marketing regarding the requirements of the information generated, that is, regarding the quality of the information produced, and second, establish determinants of this discrepancy. Therefore, an explanatory model, based on the resource-based theory (RBT) and the discrepancy theory, proposes various organizational factors as determinants of the DIQ. By pursuing these goals, we expand the theoretical and practical knowledge around the data analytics literature and respond to the challenges of the world stage. According to Akter et al. (2016), researchers must delve into the configuration of organizational resources and determine the origin of poor performance in data analytics.
Specifically, the main contribution of this study is the understanding of the factors that influence the discrepancy within the organization regarding the role that an information system should play and what defines the quality of the information provided. This aspect is essential, since the success of an analytical approach first requires clear criteria on the contribution to be made in the decision-making process, that is, it is essential that the different managers involved share the same point of view regarding the approach and contribution to be made by data analytics. This study is in line with the significant gap declared by Fosso Wamba, Akter, Trinchera, & De Bourmont (2019) and Petter et al. (2013) on the need for studies that further explore the factors that affect the quality of information for marketing decision-making.
The results were obtained on the basis of 95 pairs of managers (IT/Marketing), corresponding to 190 matching responses. We present our methodology, the analysis, and the results, which conclude with theoretical and practical contributions of the study, as well as the limitations and suggestions for future research.
Conceptual framework and research hypotheses
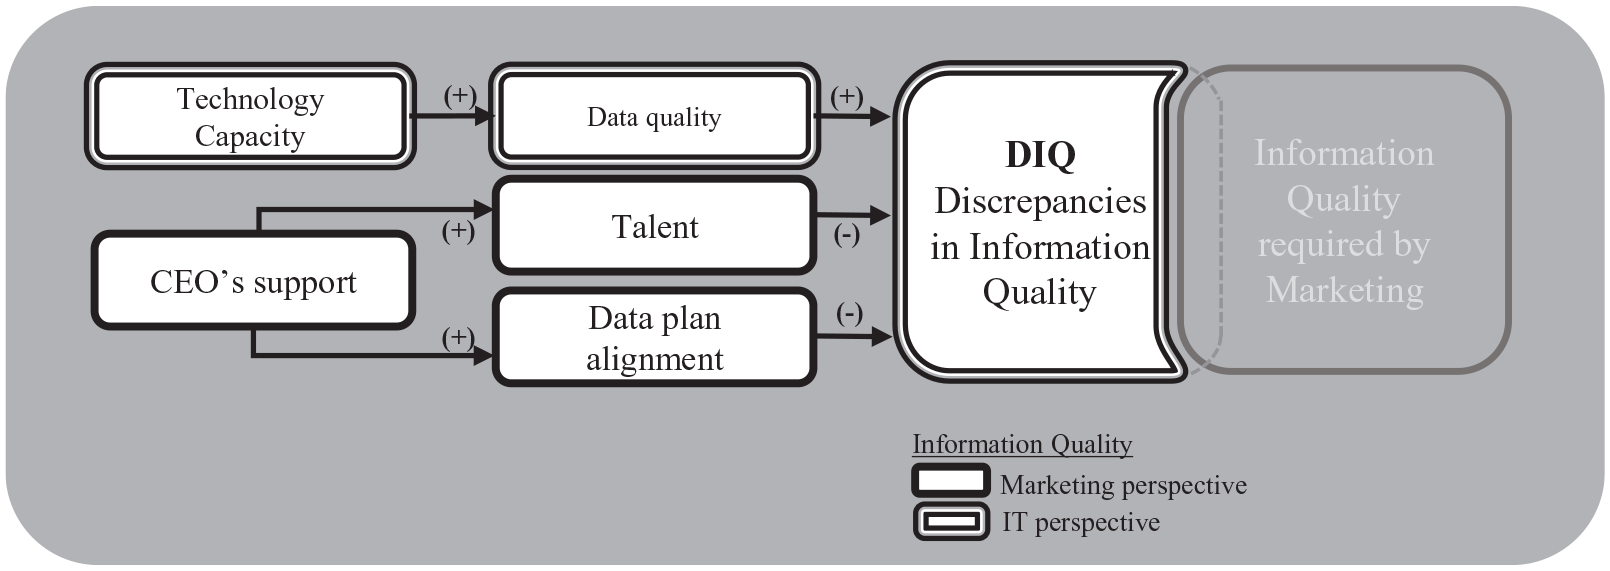
Figure 1 graphically summarizes the proposed conceptual model. The sequence of arguments begins by justifying, through the discrepancy theory and other related ones, why there are differences in the perception of information quality between information producers and consumers. Next, the RBT makes it possible to explain how various analytical resources have been identified as determinants of the information quality discrepancy. Finally, concrete hypotheses are argued regarding the relationships established in the model.
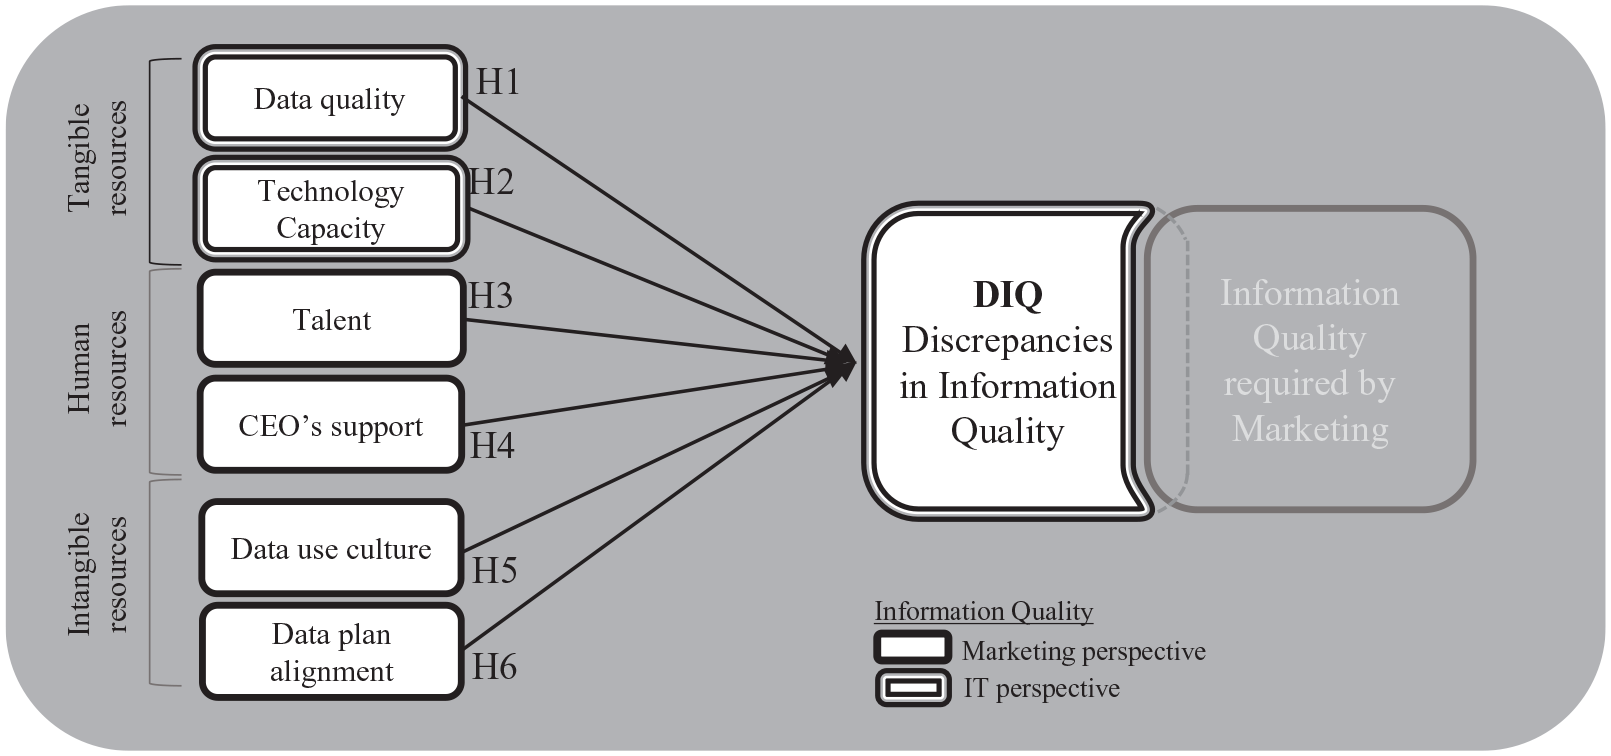
Conceptual model.
Intraorganizational discrepancy
According to Tesch et al. (2003), Locke’s (1976) discrepancy theory establishes that people’s satisfaction is conditioned by the differences that result from the psychological comparison of current experiences with personal standards of comparison.
Therefore, the satisfaction of the individual regarding the quality of the information will be determined by the magnitude and direction of the difference between the information generated versus that requested (Tesch et al., 2003). Both the direction and the magnitude of the difference can be crucial in determining satisfaction, and consequently on the discrepancy (Klein et al., 2009).
Two additional theories allow us to understand the origin of the individual perception about the quality of an organization’s information. First, the asymmetric information theory of Tversky (1977), two agents, even if they are employees of the same company, can develop different perceptions of the same object, for example, definitions of information quality (Garvin, 1984). According to Barney and Wohlin (2009), information quality is defined depending on the perspective; the user defines quality as fit for purpose, and the producer defines quality as conformance to specification. Therefore, discrepancies in their assessments of the quality of the information can easily create problems (Barney & Wohlin, 2009). Second, the theory of perceptual confirmation biases of Kahneman (2011), where a cognitive bias that encourages us to continue in accordance with our beliefs to avoid contradicting ourselves. Each agent also processes the quality of the information according to its underlying machinery, so that it applies her own knowledge structure, which in turn affects her perceptions, information processing, learning, and decision-making, all of which can lead to perceptual confirmation biases (Kahneman, 2011).
Finally, the strategic alignment literature helps us understand the origin of DIQ within data analytics. As we have mentioned two agents, they can develop different perceptions or their own cognitive prejudice of the same object, in this case about the information, and if it is not aligned, it generates discrepancies on its quality. Following the same nature, Bass and Bass (2008) indicate that leaders and managers must align both objectives and their subordinates, on which management will depend on organizational resources, and by default, performance levels. In the present investigation, we expand the discrepancy literature by developing a new dimension (DIQ), this time linked to the perception of the quality of information between two agents.
Sources of discrepancy
For a better understanding of our research model, RBT has been incorporated to explain the strategic alignment of resources in the information quality discrepancy. This theoretical basis (RBT) has been used previously to explain the relationship between alignment and organizational performance, for example, Aboobucker et al. (2019) and Gerow et al. (2016). In addition, it has been shown that the RBT theoretical framework is a useful theory in various disciplines, insofar as it allows explaining the relationship between resources and organizational performance (Gupta & George, 2016), including management (Barney et al., 2011; Newbert, 2007; Priem & Butler, 2001), IS (Aboobucker et al., 2019; Chae et al., 2014; Gu & Jung, 2013; Newbert, 2008), and big data analytics (Fosso Wamba, Akter, & de Bourmont, 2019; Gupta & George, 2016). The RBT considers an organization as a collection of resources; therefore, it represents a powerful framework to understand the vicissitudes of each one, which in turn can be combined to generate a competitive advantage (Palmatier et al., 2007).
According to Marr (2016), RBT is key to understand how the resources that generate a competitive advantage are articulated. In this study, the competitive advantage is the quality of the information generated by the data analytics capacity. Data analytics capacity was defined as the extraction of hidden information about consumer behavior (Erevelles et al., 2016) through a series of organizational factors (Kiron et al., 2014). Therefore, from the perspective of the RBT, the organizational factors represent the resources associated with the generation of said advantage. In this context, and according to the discrepancy theory and the alignment literature, it is possible that IT and marketing may develop different perceptions or their own cognitive bias on the quality of the information, thus generating the DIQ. Consequently, considering that the data analytics literature has previously identified the organizational factors that generate the quality of the information, it is logical to propose the same factors as determinants of the DIQ.
Finally, and for methodological purposes, we highlight that the RBT does not explicitly distinguish between resources and capabilities (Gupta & George, 2016). The RBT recognizes the existence of tangible and intangible resources and declares that only those that are valuable, rare, inimitable, and nonsubstitutable can generate a competitive advantage (Barney, 1991). Within the context of RBT, there are several types of resources that have been suggested in the literature, for example, financial, physical, human, and organizational (Barney, 1995); tangible, human, and intangible (Grant, 2016). This last classification has been actively used in the literature on IS capabilities (Chae et al., 2014; Santhanam & Hartono, 2003) and recently in data analytics (Gupta & George, 2016). In this study, the same classification of resources used actively in the IS and data analytics literature is followed, that is, tangible resources, human resources, and intangible resources.
Research questions and hypotheses
This research compiled previous studies to develop a research model that evaluates the organizational factors that impact DIQ (see Figure 1). Common organizational factors that have been postulated in the model have been identified from the data analytics literature (see Table 1). These factors have been classified following the RBT literature (tangible, human, and intangible). Then, each of the organizational factors has been developed to postulate a hypothesis that explains their effect on the DIQ. The DIQ variable represents the difference in perception about the quality of the information between each manager (IT and marketing), that is, the disagreement that exists about the quality of the information between generators and consumers of the information.
Summary of prior studies on information generation based on data analytics capacity.
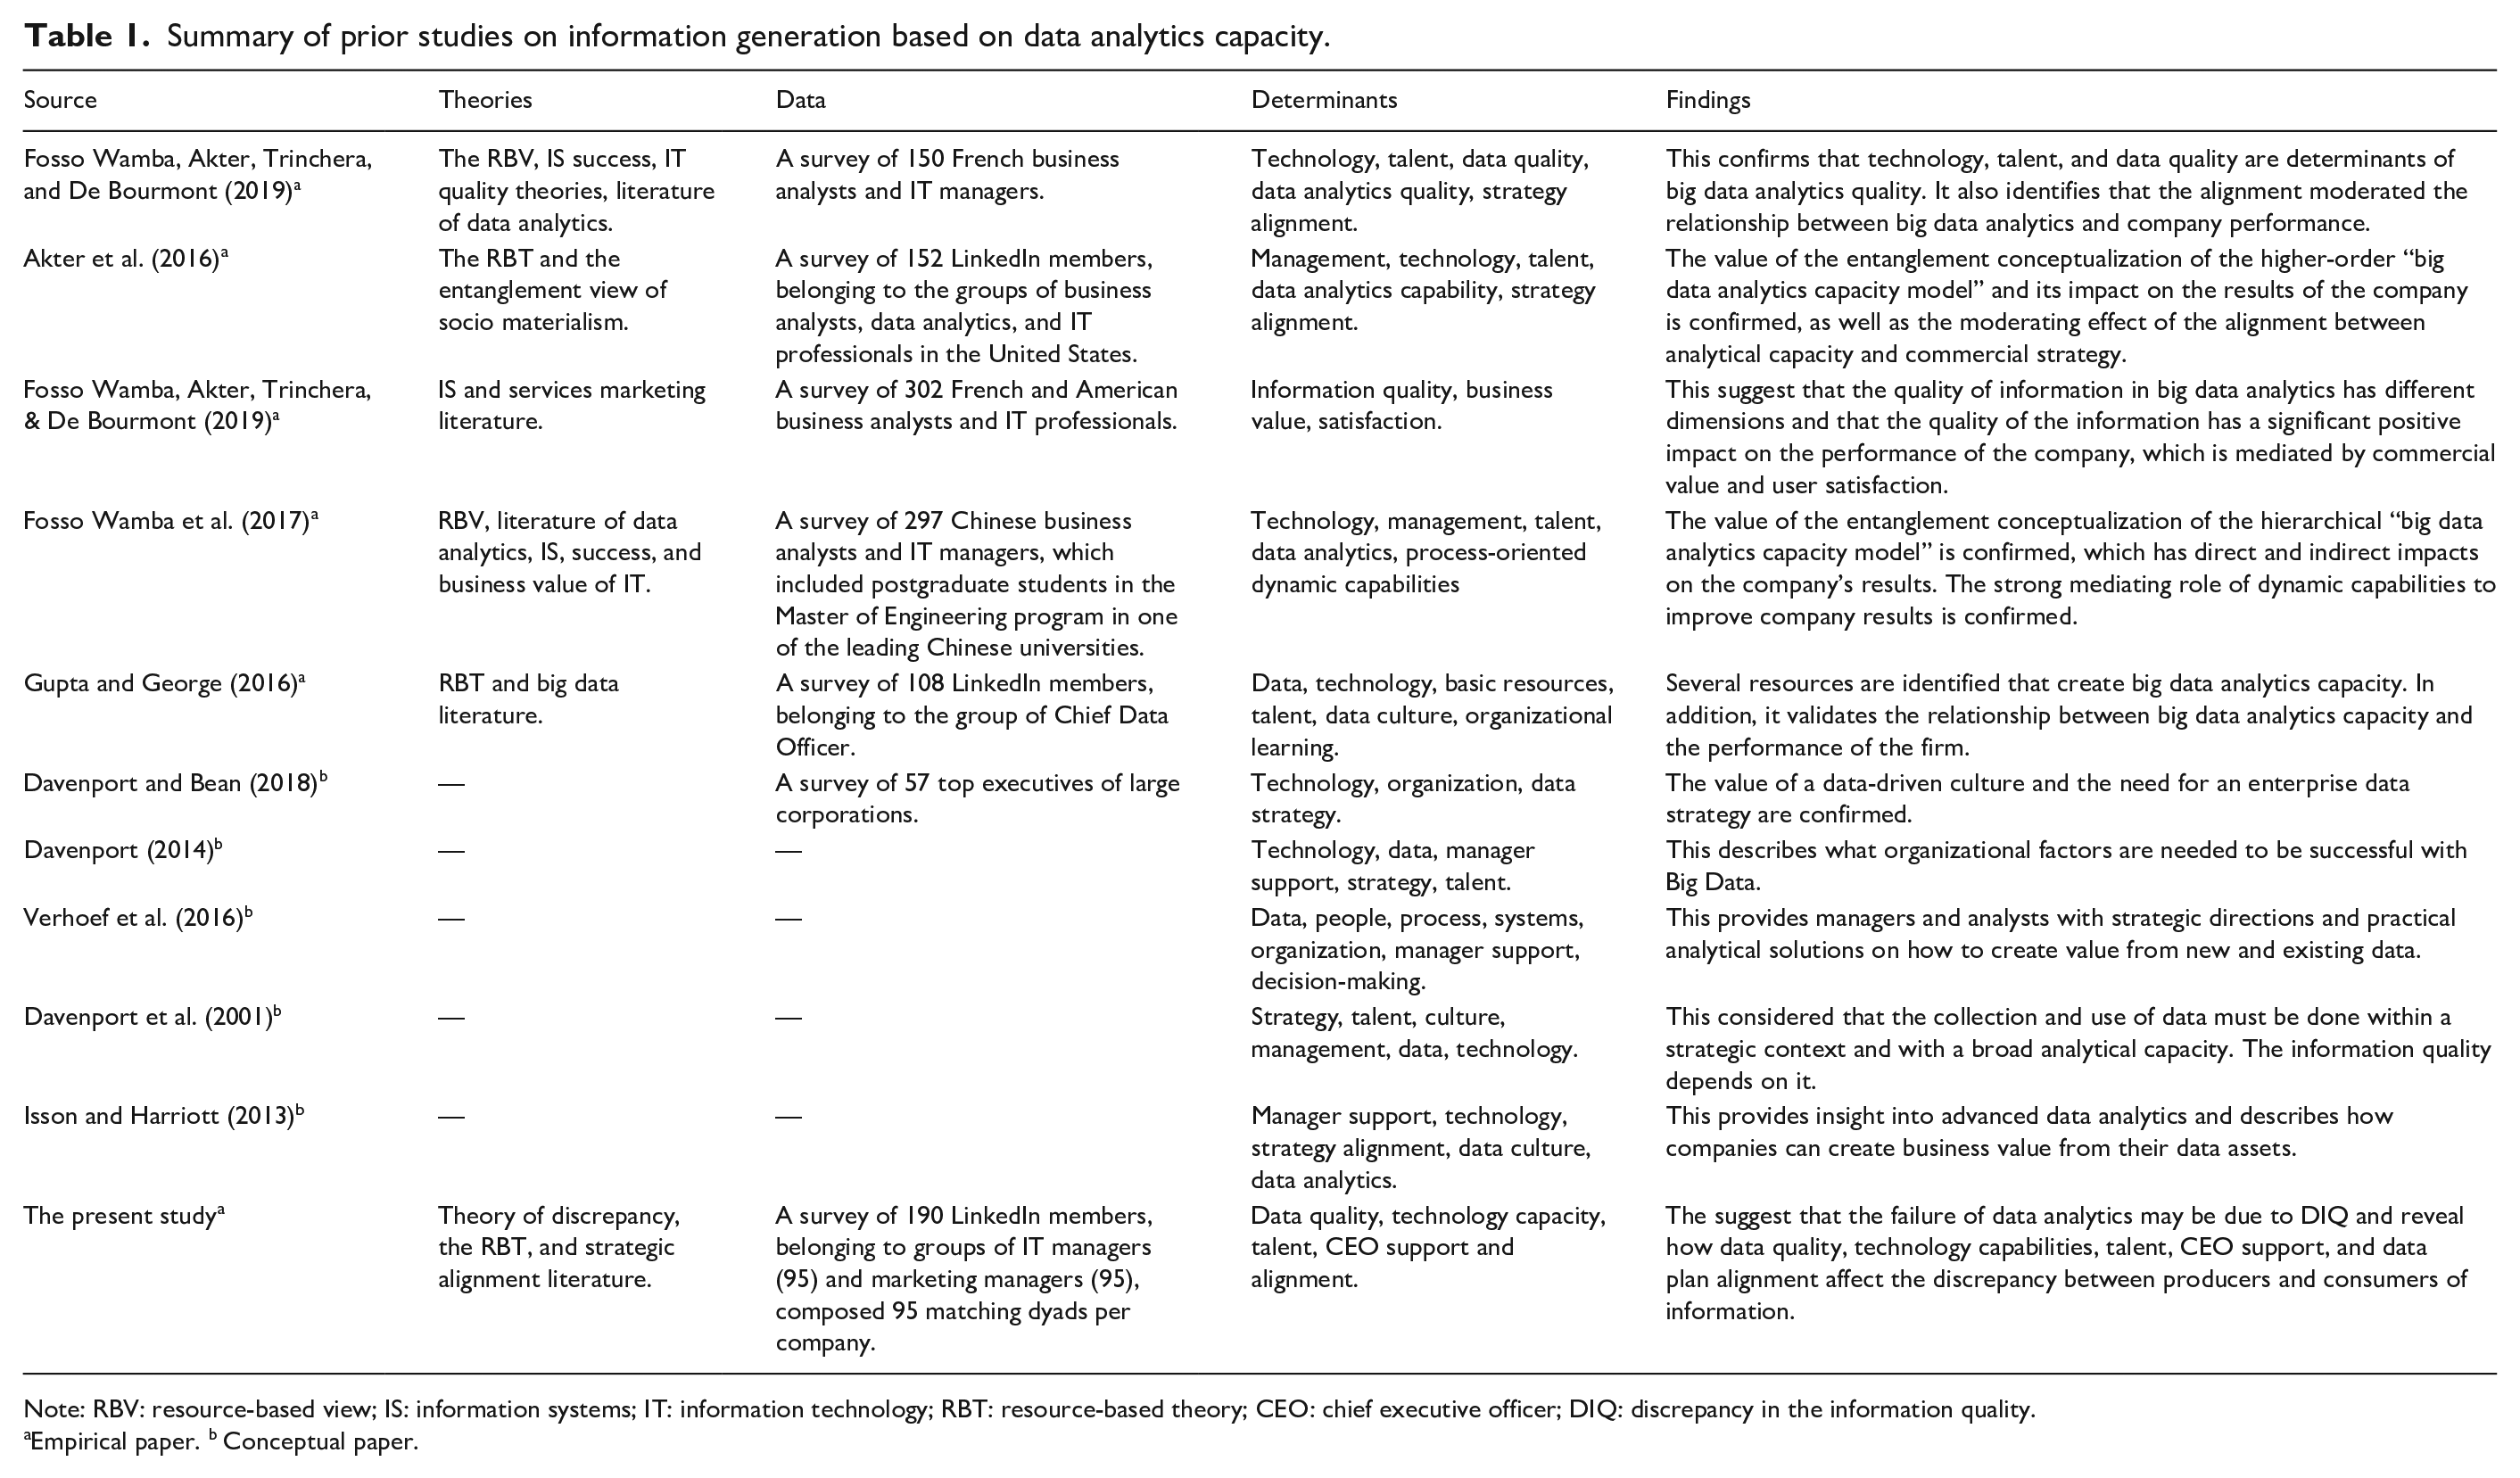
Note: RBV: resource-based view; IS: information systems; IT: information technology; RBT: resource-based theory; CEO: chief executive officer; DIQ: discrepancy in the information quality.
Empirical paper. b Conceptual paper.
Data quality, technological capacity, and DIQ. The data are often described as signs, which are placed in a specific order, that is, a syntax (Heinrich et al., 2014); they are small syntactic entities (Aamodt & Nygård, 1995), which, when processed, generate information. They are the most important raw material for creating and implementing successful analytical solutions (Isson & Harriott, 2013). Its quality is determined by a series of dimensions that characterize it (see Table 2). For its part, technology capacity has been identified as a key component of data analytical capacity (Akter et al., 2016; Fosso Wamba et al., 2015), capable of differentiating the performance of the company (Davenport, 2006; Davenport et al., 2012). Technological capability is understood as the flexibility of the data analytics platform (cross-functional data connectivity, multiplatform compatibility, modularity in model building, etc.) in relation to enabling data analysts to develop, rapidly deploy, and support a company’s resources (Davenport, 2014). Isson and Harriott (2013) and Pérez-Aróstegui and Barrales-Molina (2015) indicate that, investment in technological capacity, to capture, process, analyze and manage data, is not enough, and it is necessary to manage the transformation of data into quality information; otherwise, returns associated with technology and data deteriorate. For their part, Ashraf et al. (2017) declare that, nowadays, most IT projects fail, under a concept coined as the “IT productivity paradox.” This paradox indicates the existence of an inverse relationship, which refers to the impossibility of establishing a positive relationship between IT investments and the productivity of the company (Roach, 1987). Consequently, and considering the current level of failures, 80% according to White (2019), we postulate technological capacity and data quality as resources currently subject to the paradox of technological productivity. Our argument is based on two concepts from the literature: first, the “illusion of control” of Langer (1975), which is defined as an expectation of an inappropriately higher probability of personal success than the objective probability would justify. This means that managers faced with the difficulty of having real performance measures (without alignment), value through perceived performance, which can lead to deviations from the required quality (Raghunathan, 1999). Second, the assimilation theory of Ausubel (2000) indicates that people tend to assimilate preexisting characteristics. This means that managers, faced with the difficulty of having real performance measures (without alignment), may be biased by the context (Lee & Suk, 2010). In particular, the quality of the information and the quality of the data, in some contexts, are impossible to distinguish (Hongwei et al., 2014) because information systems provide the means to capture and process data to generate information (Langefors, 1977). In consequence, if the IT department perceives a greater technological capacity or a higher quality of the data, it will probably also value the quality of the information more, due to the “illusion of control” or the assimilation of the context, which can increase the DIQ. This means that the positive effect of data quality and technological capacity on DIQ arises fundamentally because the perception of information quality from IT tends to be overvalued with respect to marketing, increasing the discrepancy between the producer and consumer agent of information. Formally,
Constructs and definitions.
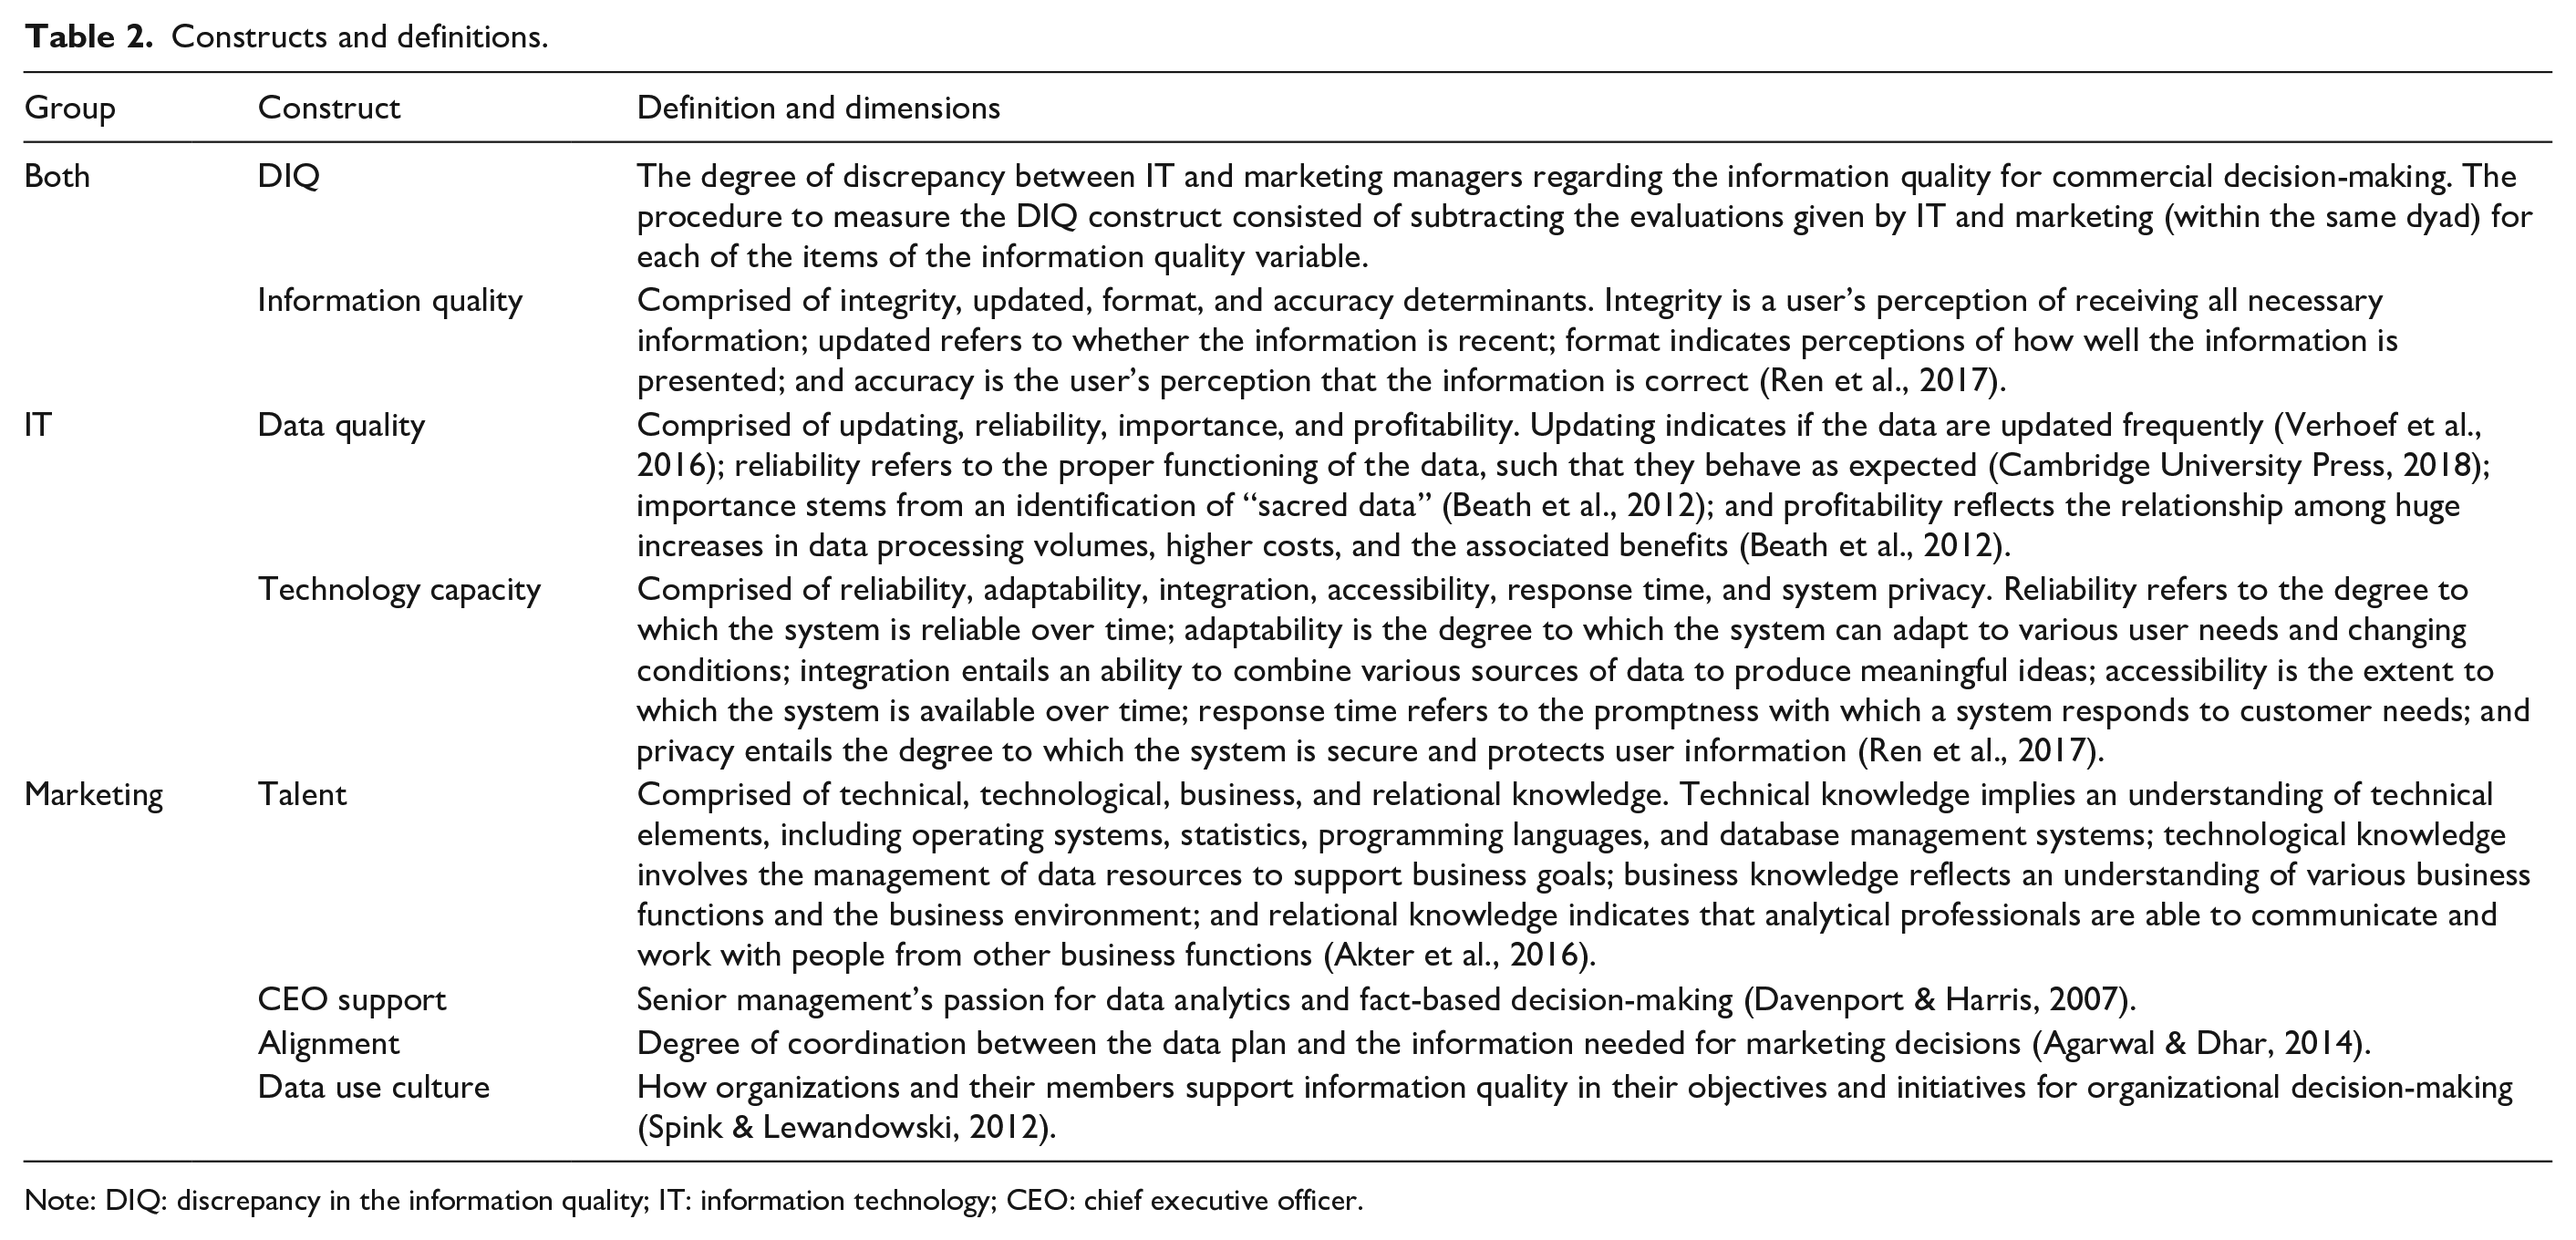
Note: DIQ: discrepancy in the information quality; IT: information technology; CEO: chief executive officer.
Talent and DIQ. When they possess analytical talent, employees can synthesize and extract the “truth” from data (Phillips, 2016), especially if that talent is focused on marketing needs. Analytical talent is understood as the ability of an analytical professional (e.g., someone with analytical skills or knowledge) to perform the tasks assigned in the data analytics environment (Akter et al., 2016). Accordingly, Hagen et al. (2013) cite talent as the most relevant capacity for supporting data analytics, and Constantiou and Kallinikos (2015) argue that abilities and skills primarily generate competitive advantages. In data analytics literature in particular, talent has been identified as a success factor for marketing efforts (Akter et al., 2016). According to Grover et al. (2018), to take advantage of investments in data and analysis, the most critical element is the infrastructure of human talent. Therefore, from senior management down, different skills must be coordinated within the organization to obtain the maximum benefit from the quality of information (Hagen et al., 2013). After all, experience is needed to design and implement data analytics strategies; without the right group of experts, it is impossible to develop and carry out a project of this nature (Grover et al., 2018). Therefore, to the extent that organizational talents converge on a predefined analytical path, the resulting information should be well oriented to supporting marketing decision-making, and therefore, there may be less DIQ. In other words, the negative effect of talent on DIQ arises fundamentally because the perception of information quality from analytical talent tends to be closer to the needs of commercial information, reducing the discrepancy between the producer and consumer of the information. According to this reasoning,
CEO support and DIQ. CEO support refers to the passion exercised by the CEO over the implementation of a corporate strategy for analysis and decision-making based on facts (Verhoef et al., 2016), and it is, in this direction, that the management of production information processes requires the support of the CEO (Thomas et al., 2002), which can ensure the synchronization of objectives between a data analytics project undertaken by IT and marketing objectives. Young and Jordan (2008) argue that senior management support is the most important success factor for data analytics projects. Raghunathan (1995) suggests that a CEO involvement can improve certain aspects of the information system, such as its alignment with organizational plans, perceived importance, and effectiveness. This means that the data strategy will be subject to information quality objectives, which in turn respond to the initiatives established by the CEO, such as data provision, modeling, and organizational transformation (Barton & Court, 2012). In particular, generating high-quality information requires distinctive management support to increase the chances that an information system plan will succeed (Sauer, 2003). Ultimately, it is the CEO who is responsible to determine whether the correct objectives are being accomplished (Hinton & Kaye, 1996) and then to synchronize the data analytics capacity with those functional goals and objectives (Akter et al., 2016). Therefore, when the CEO manages the organizational factors of the data analytics capacity effectively, that is according to an aligned data strategy, then it is very likely that the marketing information needs will be met, thus reducing the DIQ. In other words, the negative effect of the CEO Support in relation to the DIQ arises basically as a result of the CEO’s perception of the quality of information that tends to be closer to the corporate information needs, thus reducing the discrepancy between producer and user of information. Formally,
Culture of data use and DIQ. A culture of data uses is defined as values, beliefs, norms, and ways of thinking embraced by members of the organization that emphasize the ability to understand data-based processes and the dynamic risks associated with them (Owens, 2007). A culture of data use can be an asset that facilitates the exploitation of information quality (Swaan et al., 2014), given its ability to generate economic benefits (Garcia-Perez, 2018). A culture of data usage fosters efficient information generation by aligning marketing to recognize and understand data-driven processes and the adjacent value opportunities that analytics offers (Owens, 2007). A culture of data use also creates multiple opportunities to access potentially valuable data (Beath et al., 2012). Lack of a data culture could be fundamentally detrimental to identifying and generating the potential value of data analytics (Grover et al., 2018). A report by Manyika et al. (2011) on big data suggested that a company’s “data-driven mindset” would be a key indicator of the value of data analytics for companies (Barney, 2001). For that reason, a culture of data use can generate collaborations between IT and marketing that, from a strategic alignment point of view, makes it easier to manage your information production processes and reduces discrepancies. In other words, the negative effect of the culture of data use on DIQ arises essentially from the perception of the quality of information by the members of the organization, who recognize analytics as a critical success factor and therefore tend to respond to corporate information needs, thus reducing the discrepancy between the producer and user of the information. Therefore,
Alignment of the data plan and DIQ. As anticipated, the business environment is changing; consequently, the strategic plans vary, and with this appears the need for constant alignment between the various organizational factors that determine business performance (Kaplan & Norton, 2016). In other words, data plan alignment is defined as the extent to which IT’s information quality objectives are aligned with the information needs defined in the overall strategy of the organization (Akter et al., 2016). Although companies invest heavily in improving analytics-based information, the information generated is often disconnected from corporate strategy (Fosso Wamba, Akter, & de Bourmont, 2019). The alignment of the data plan with the marketing needs seeks to neutralize the DIQ. According to the goal-setting theory (Donovan, 2001), DIQ can be controlled by setting goals and objectives about the organizational factors responsible for information quality (data, technology, talent, top management support, and data use culture), that is, a synchronization of all organizational factors to achieve the information needs for marketing decisions. This theory predicts that human actions mainly reflect existing goals, so that individual goals regulate human action (Locke et al., 1986). Such alignment helps the organization achieve its strategic objectives, through either achieving critical productivity improvements or offering better services (Raghunathan, 1995). Therefore, the success of information quality analytics depends on the inclusion of the data strategy in the long-term commercial strategy of a company and the mechanisms established to facilitate commercial alignment with this strategy (Grover et al., 2018). This means that the negative effect of organizational alignment on DIQ arises fundamentally because the perception of information quality of the members who understand the corporate strategy tends to respond to the needs of commercial information, reducing the discrepancy between the producer agent and consumer of information. In consequence,
In summary, the raised hypotheses are postulated as drivers that increase or decrease DIQ. H1 and H2 propose an increase in DIQ because the explanatory factors involved provoke an overvaluation in the producer agent (IT) that differs from the consumer agent (marketing); H3 and H6 propose a reduction of DIQ, since the explanatory factors involved cause a convergence of the perception of IT toward marketing in terms of useful information for decision-making, that is, in terms of information quality; and H4 and H5 propose a reduction in the DIQ because the explanatory factors involved have an approach effect both in the perception of IT and in the perception of marketing, in addition to giving adequate prominence to data analytics for making business decisions.
Method
Research context and design
The data were collected using a convenience sampling procedure. When conducting research targeting dyads (IT and marketing), where the manager pair must belong to the same organization with more than 200 employees, sampling is a major issue. According to Emerson (2015), the possibility of random sampling is usually too expensive and cumbersome for researchers, especially when studying a population with high access restrictions and characteristics. To reduce the biases that arise from convenience sampling, this study used a database with thousands of managers from all over Spain, LinkedIn. According to Gupta and George (2016), given the proliferation of social media, IS scholars have been exploring online sources such as LinkedIn to collect data to test their hypotheses (e.g., Schmiedel et al., 2014; Tambe, 2014; Wenting et al., 2019). Specifically, within the data analytics literature, two studies were found that use the LinkedIn database, Akter et al. (2016) and Gupta and George (2016), with 152 and 108 members surveyed, respectively. Therefore, the use of LinkedIn and convenience sampling has been used in previous data analytics research, as shown in Table 1.
LinkedIn, a division of Microsoft, is the largest professional network in the world, with more than 13 million members in Spain (LinkedIn, 2019), this is more than 50% of the users of social networks in Spain (IAB Estudio, 2020). Based on Shadish et al. (2002), as it is a free professional network with an extensive national presence, the relationships revealed are also valid in other populations, which increases the ability to adequately address the study subjects. Without detriment to the above, and to reduce biases arising from convenience sampling, the researchers ensured that all respondents were within the research profile. This was confirmed, in parallel, when comparing the data of the interviewees, which sought to validate whether both respondents (dyad) were from the same company.
Before the main data collection, 26 companies were subjected to a pilot questionnaire for this research. This resulted in 52 validly issued responses, that is, 26 dyads (26 IT managers and 26 marketing managers). The questionnaires contained common elements that both managers had to answer, as well as differentiated elements for IT and marketing managers (see Table 3). Specifically, IT managers evaluated the factors that reflect a perspective of tangible resources (data quality and technological capacity), while the marketing managers covered factors related to human resources (quality of talent and CEO support) and intangibles (alignment and culture of data use).
Measurement scale.
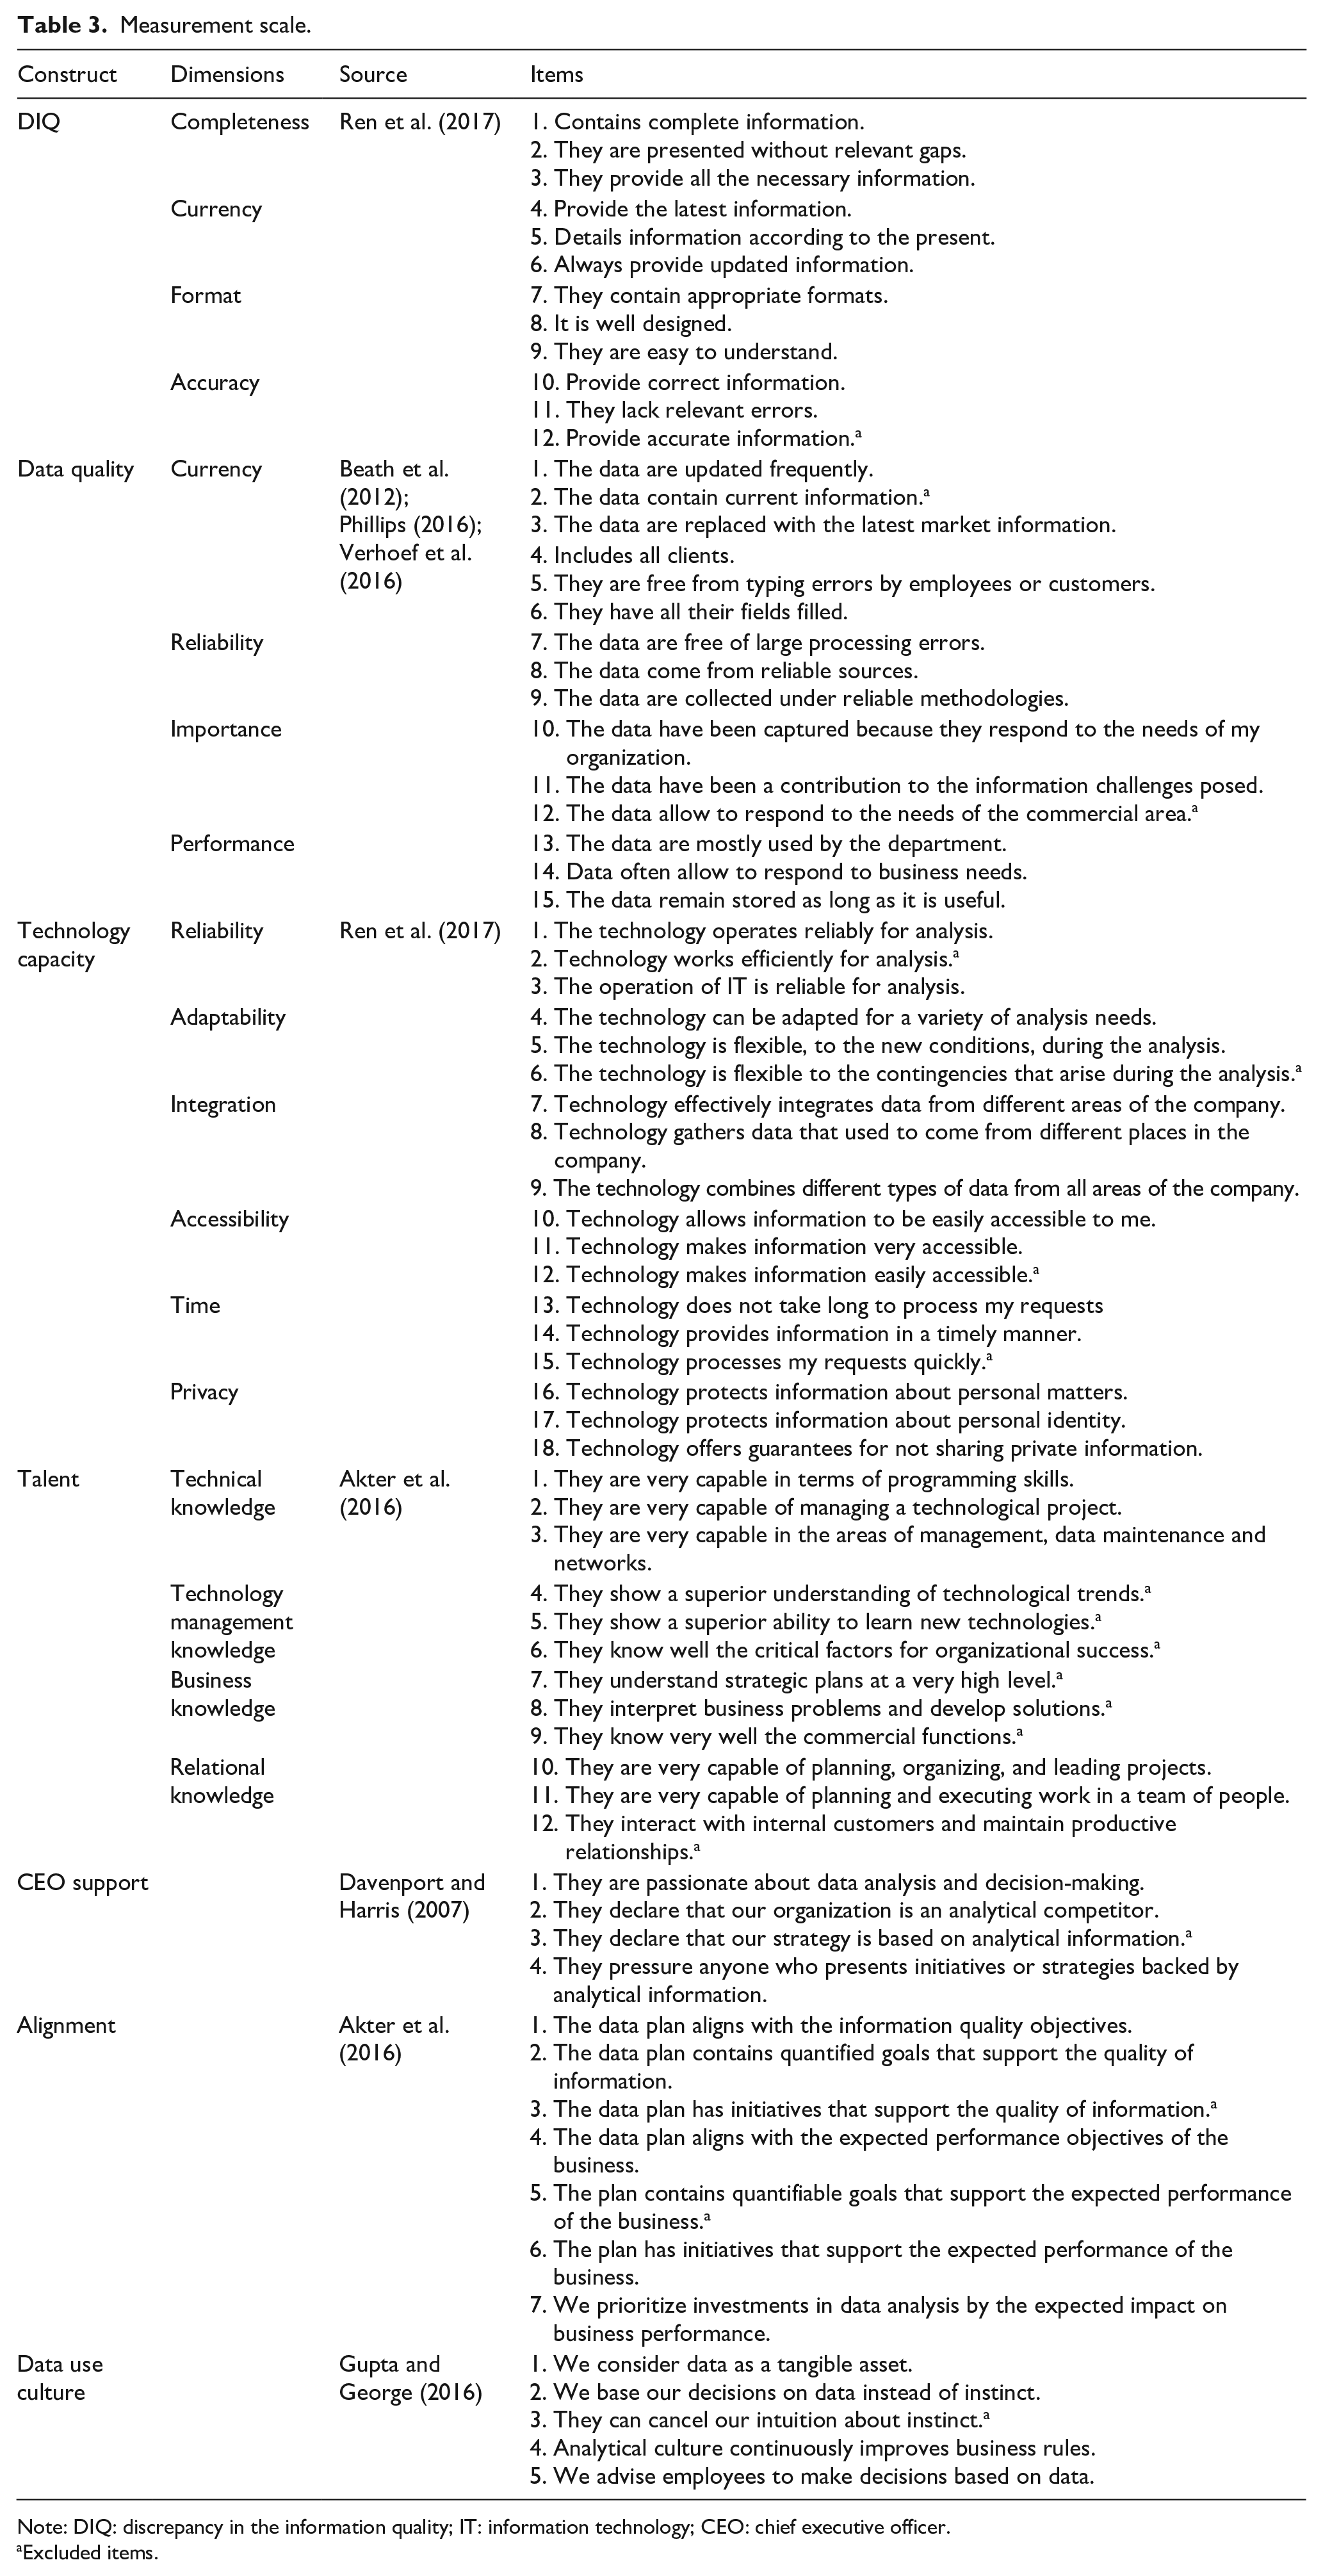
Note: DIQ: discrepancy in the information quality; IT: information technology; CEO: chief executive officer.
Excluded items.
Later, 4,168 executives from all over Spain were randomly invited. Of these, 450 agreed to participate in the study, representing 355 companies. Of the 450 surveys sent, only 401 (89.1%) were answered, and only 95 companies formed a dyad (an IT manager and a marketing manager from the same company). Therefore, only 190 (42.1%) surveys met the study sample specification. The 190 surveys equate to 95 companies, that is, 95 dyads (95 IT managers and 95 marketing managers).
The survey design was carried out through Qualtrics, which is one of the most widely used market research platforms in the World (Qualtrics, 2019). The responses represent 22 provinces of Spain. Regarding the location of the headquarters of each company associated with the research, a total of 13 countries are represented, and Spain represented 63.3% of the sample. Regarding the majority of the property of the companies that make up the research, 59.3% is Spanish capitals. Regarding the type of management, 57.3% belongs to a business group. Regarding the organizational structure, 72.6% is nonfamily companies. The average age of the companies is 42.5 years. Finally, the sample represents 17 industrial sectors in Spain.
This study covers both traditional analytics and big data. The above is based on the statement by Davenport (2011); Davenport and Harris (2007, 2017) state that although both analytics have their own characteristics, in terms of organizational factors, both analytics are equivalent, that is, both have an approach based on their analytical capacity throughout the organization, a complete and full automated analytical architecture integrated into the processes. All in all, the statistics say that users use big data in 68.1% and traditional 31.9%. All respondents (100%) stated that data analysis was a critical competitive advantage.
Measurement model
The questionnaire includes constructs defined by previously published data analytics literature, as detailed in Table 2. The items to measure these constructs all relied on 7-point Likert-type scales (1 = strongly disagree to 7 = strongly agree), as detailed in Table 3. The calculation of the DIQ variable involved subtracting, for each item related to the quality of the information, the perception ratings given by the IT manager and by the marketing manager. This operation is carried out on the basis of the direction and magnitude of the individual perception of each manager (Jiang et al., 2012; Klein et al., 2009). This relationship between components and judgment is a crucial aspect of the discrepancy theory (Jiang et al., 2012). Consequently, and according to the theory, it is to be expected that the perception of IT (as responsible for generating data) will be more favorable than Mkt (as mere users), and the data collected demonstrate this.
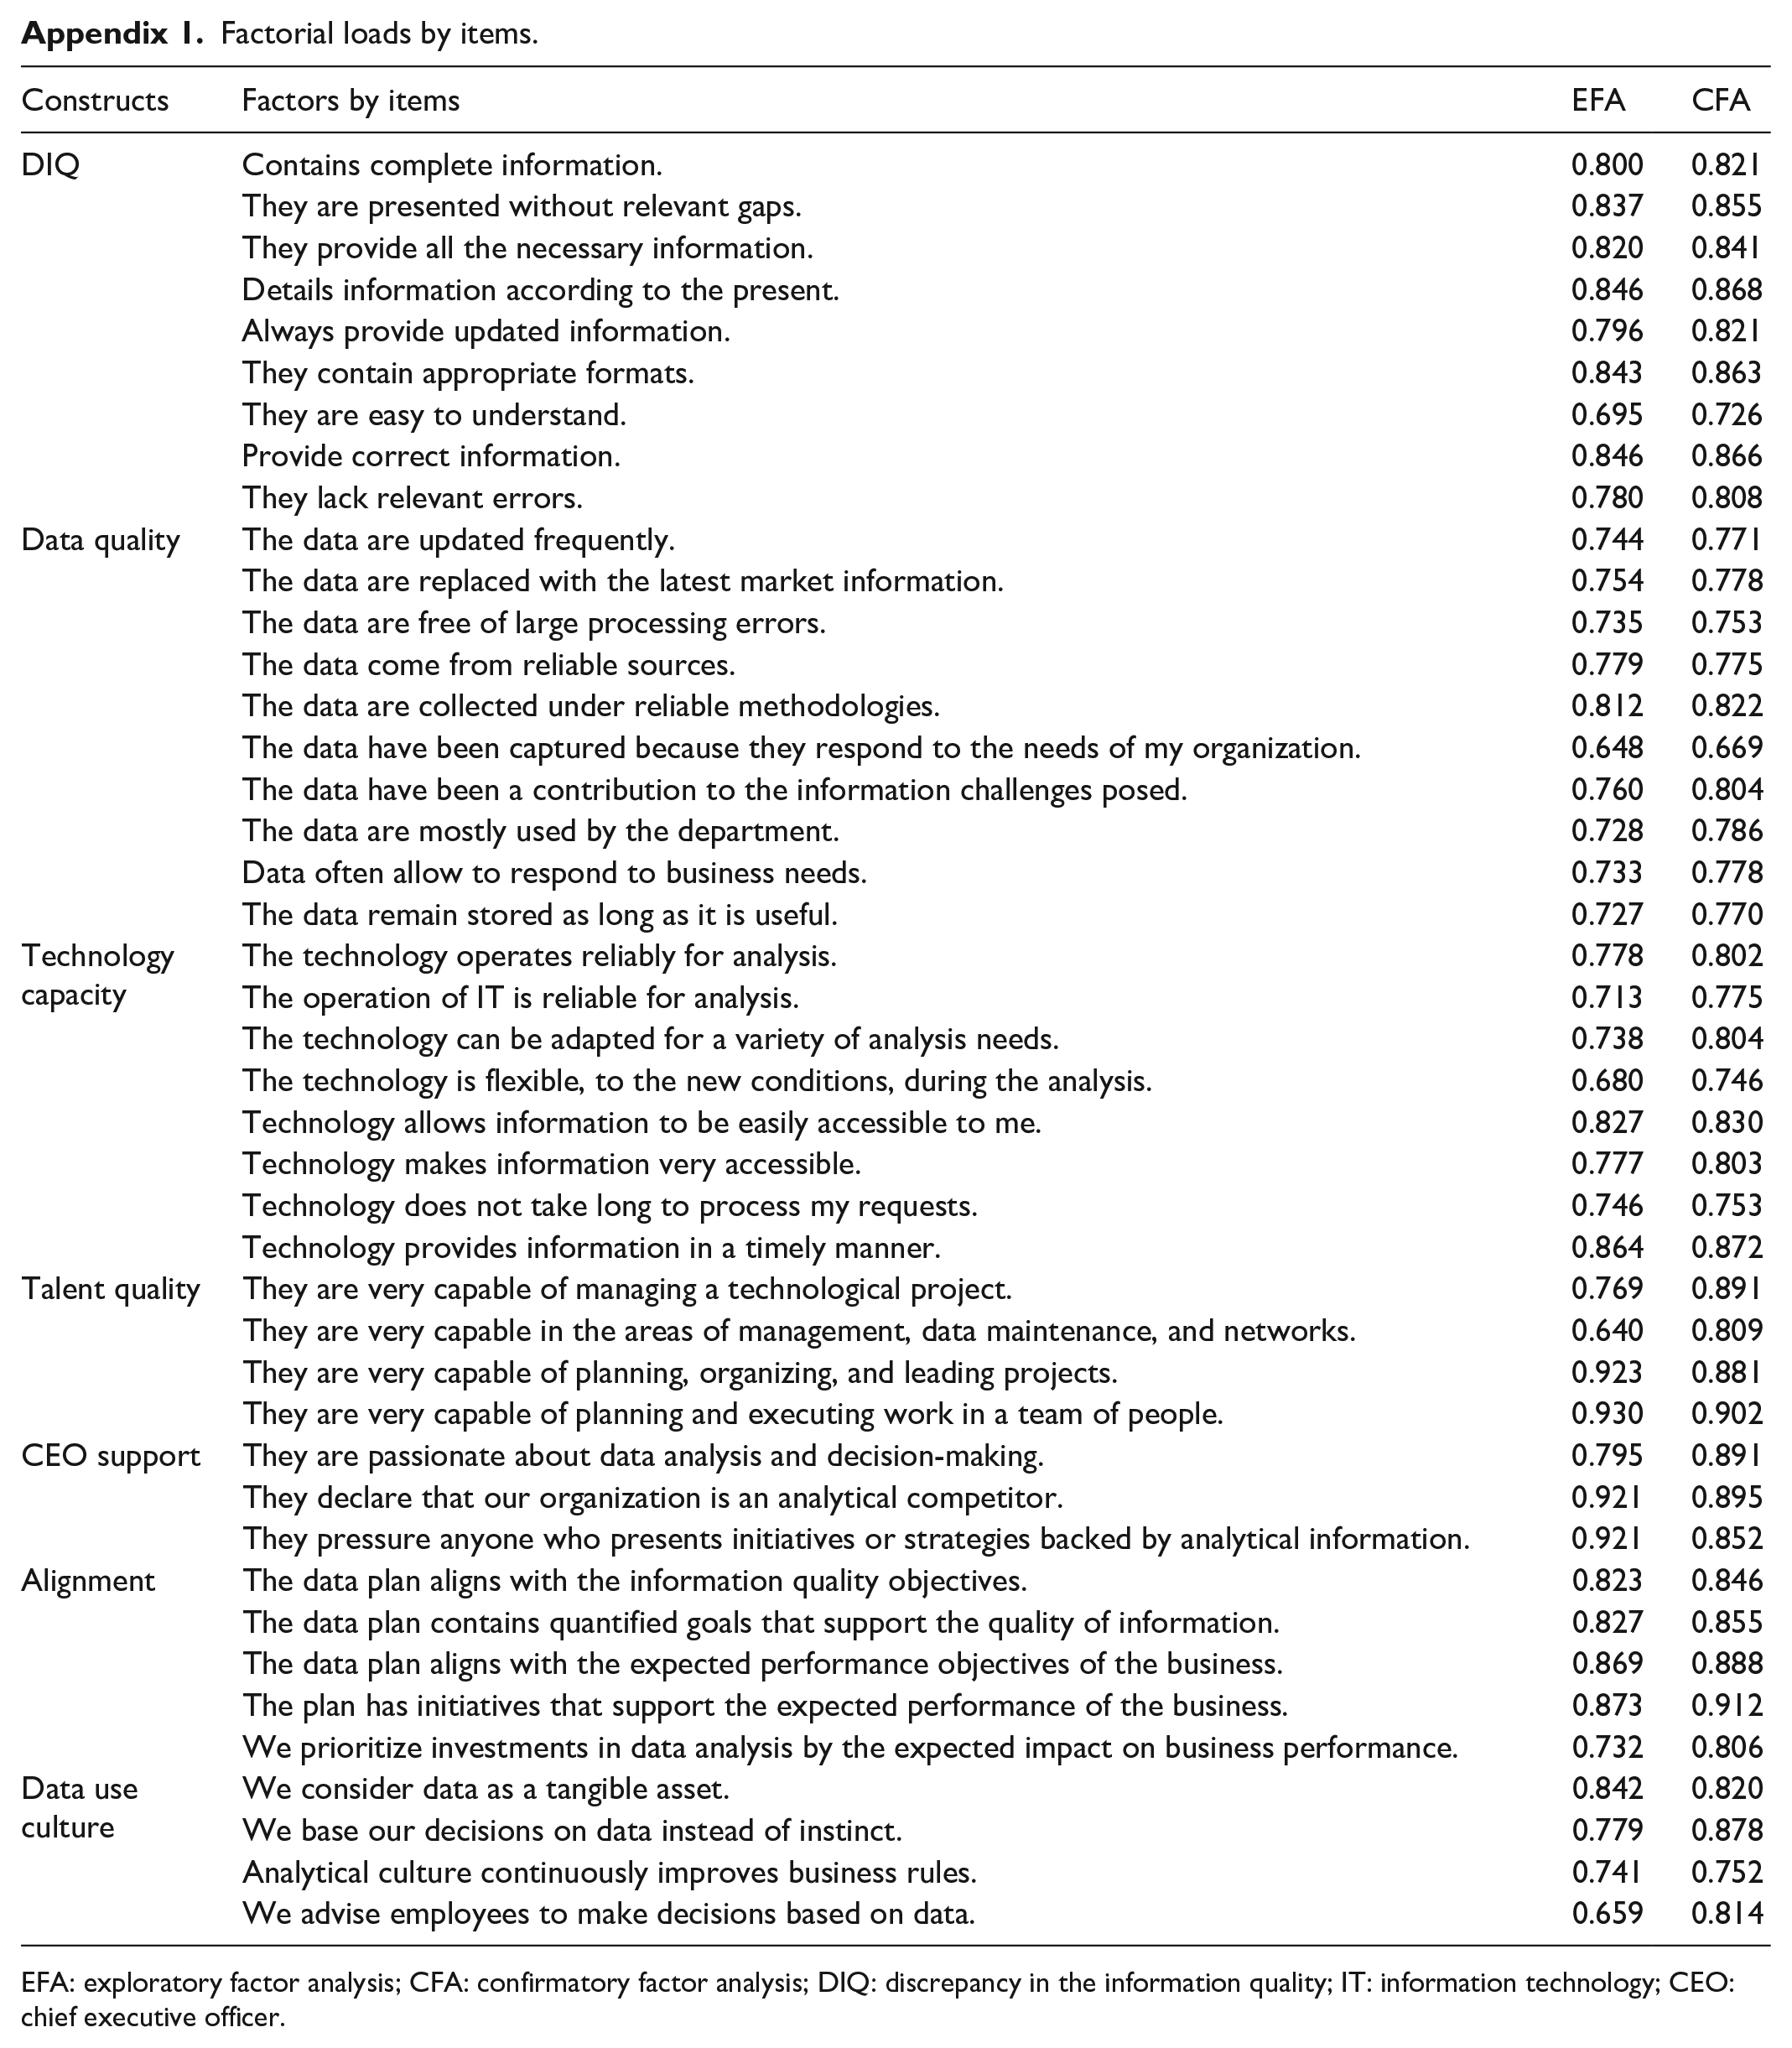
An exploratory factor analysis (EFA), conducted in SPSS, version 25, produced the results in Table 4. The detail of the factors for each item is available in Appendix 1. First, to avoid possible multicollinearity problems, a correlation analysis performed for each construct eliminated any items with low values (r < ±.30) or high values (r > ±.90). The resulting determinant values were all greater than 0.00001 (Haitovsky, 1969), indicating an absence of multicollinearity. Second, the Bartlett sphericity test confirmed the relationships among the variables (p < .001). Furthermore, the Kaiser–Meyer–Olkin (KMO) measures indicated values greater than (0.7), which is considered good (Hutcheson & Sofroniou, 1999). The diagonal element of the anti-correlation matrix of all the variables achieved values greater than 0.59, which is adequate (Hair et al., 2019). Only items with communalities greater than 0.4 were used, so this step eliminated four items, associated with the data quality, talent, and data use culture constructs. In support of its good fit, the model has less than 50% nonredundant waste with absolute values greater than 0.05 (Yong & Pearce, 2013). The factor loadings exceeded 0.7, with the exception of three items for which the values were greater than 0.6, which is adequate for scales in the early stages of development (Chin, 1998). Two items for which the loadings were below 0.6 were discarded. This process of dimension reduction yielded only one-dimensional constructs, whereas originally, three of the initial constructs were multidimensional.
Exploratory factor analysis results with SPSS.
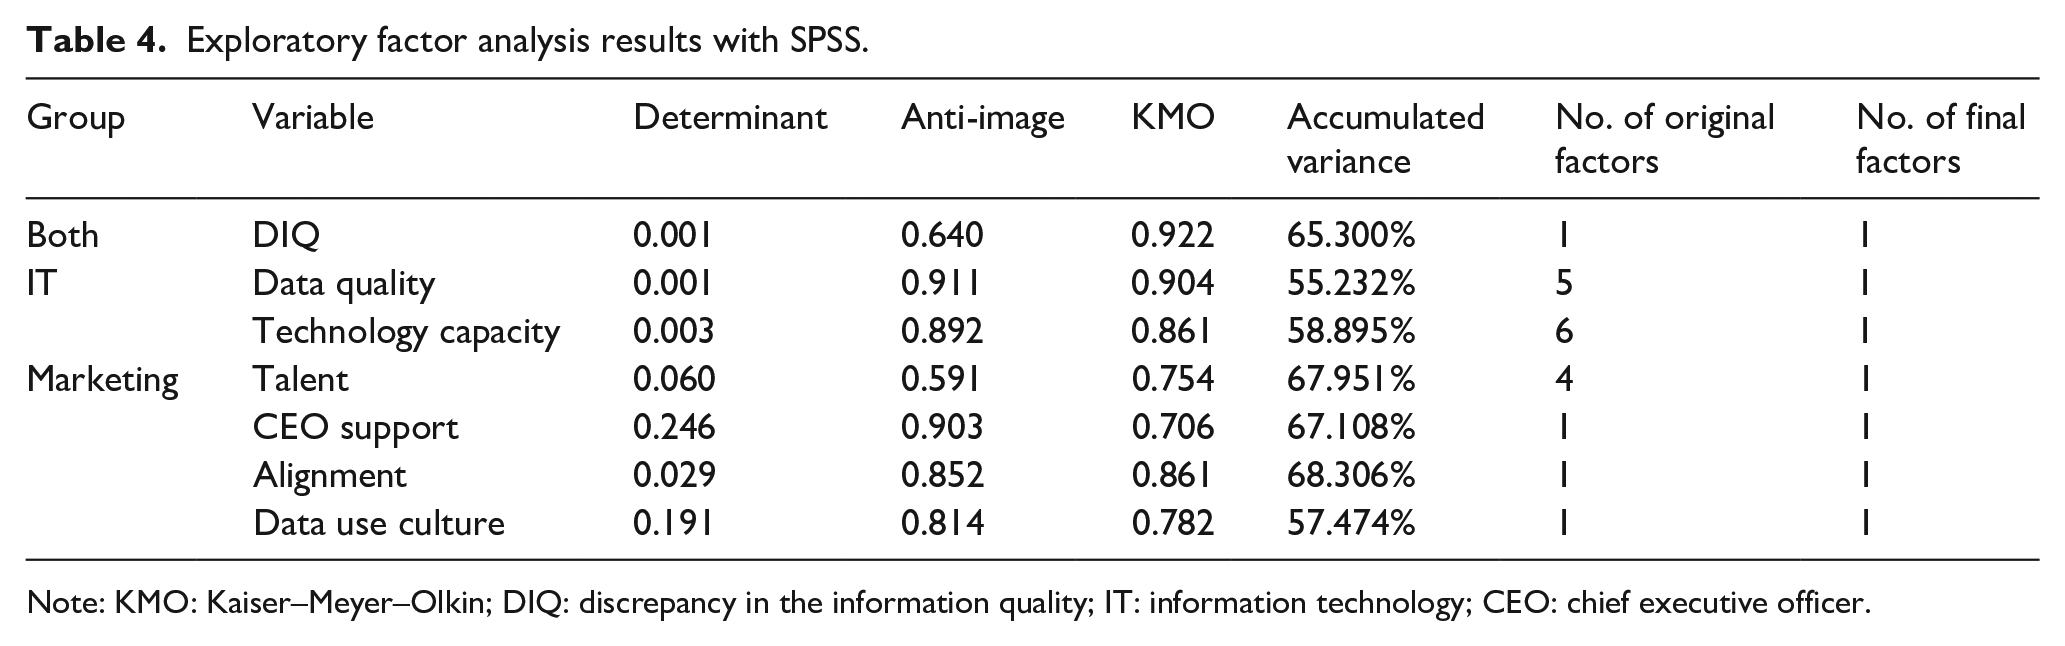
Note: KMO: Kaiser–Meyer–Olkin; DIQ: discrepancy in the information quality; IT: information technology; CEO: chief executive officer.
With the complete model obtained from the EFA, a confirmatory factor analysis (CFA) in SmartPLS 3.2.9 checked for the validity of the constructs and factors in the proposed model. The detail of the factors for each item is available in Appendix 1. All the variance inflation factors (VIFs) were below 5 (Iversen et al., 1989); specifically, the highest VIF was 4.562, indicating that multicollinearity is not a concern. To assess the reliability and validity of the constructs, this study relies on Cronbach’s alpha, the composite reliability, and the average variance extracted (AVE), obtaining the values listed in Table 5.
Construct reliability and validity.
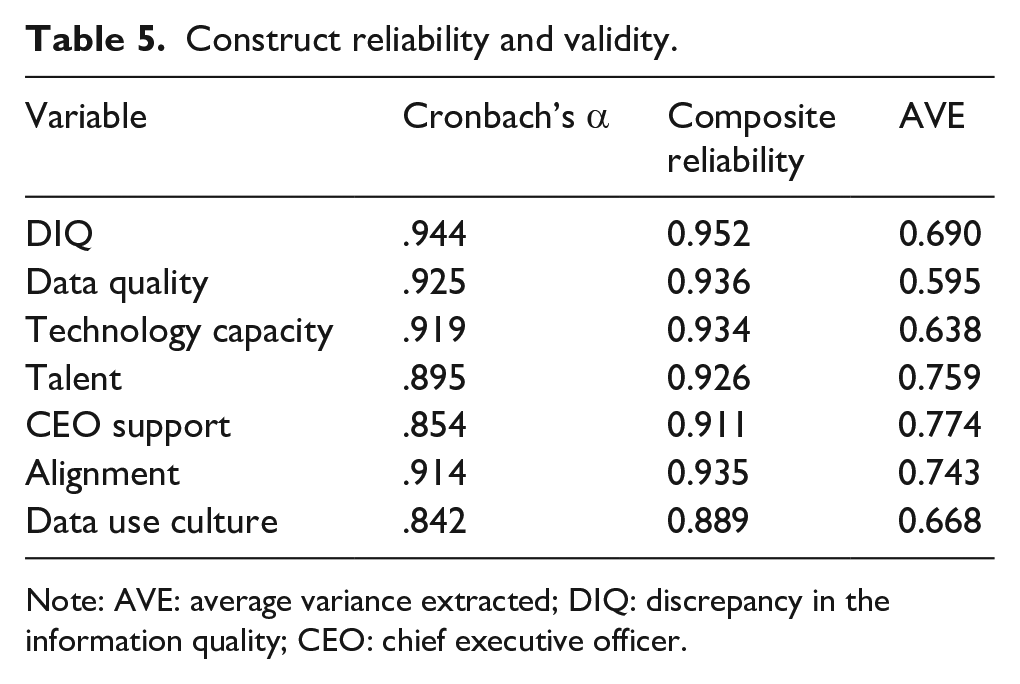
Note: AVE: average variance extracted; DIQ: discrepancy in the information quality; CEO: chief executive officer.
Because the Cronbach’s alpha values exceed .8, the results indicate a satisfactory level of reliability (Carmines & Zeller, 1979). The composite reliability values also are acceptable and greater than 0.8 (Nunnally, 2010). Finally, the AVE values exceed the recommended threshold of 0.5 (Fornell & Larcker, 1981). According to the discriminant validity test (Table 6), the items meet the Fornell–Larcker criterion because the square root of the AVE is greater than any interconstruct correlations. For the measurement model adjustment, the standardized root mean residual (SRMR) equals 0.073, so it meets the criterion that SRMR should be less than 0.08 (Hu & Bentler, 1998, 1999). This combined evidence indicates the adequacy of the measurement model.
Discriminant validity.
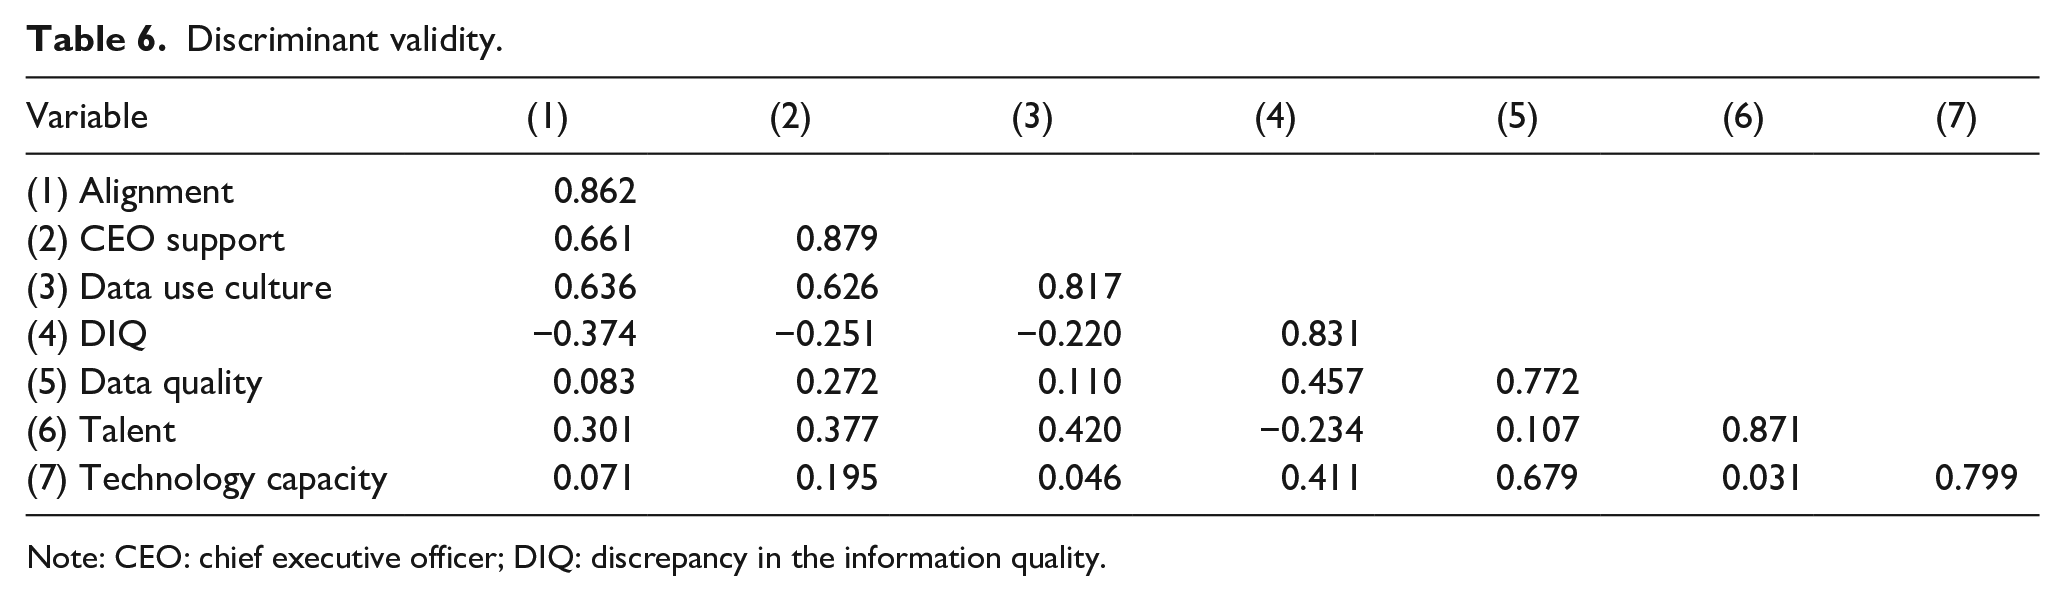
Note: CEO: chief executive officer; DIQ: discrepancy in the information quality.
Results and discussion
Information quality
Three analyses, carried out with SPSS on the concept of information quality, provide support for the central assumption of this research, on the existence of DIQ between IT and marketing. An EFA is performed first, then a mean comparison test, and finally a correlation analysis between groups. The EFA is applied to the IQ variable of both groups (IT/Mkt). The result reveals that, considering eigenvalues greater than unity as a dimension selection criterion, the groups of managers do not coincide in the number of dimensions included in the quality of the information. According to Table 7, IT managers recognize two dimensions of information quality, while Mkt only one dimension.
Dimensions and total variance explained by group.
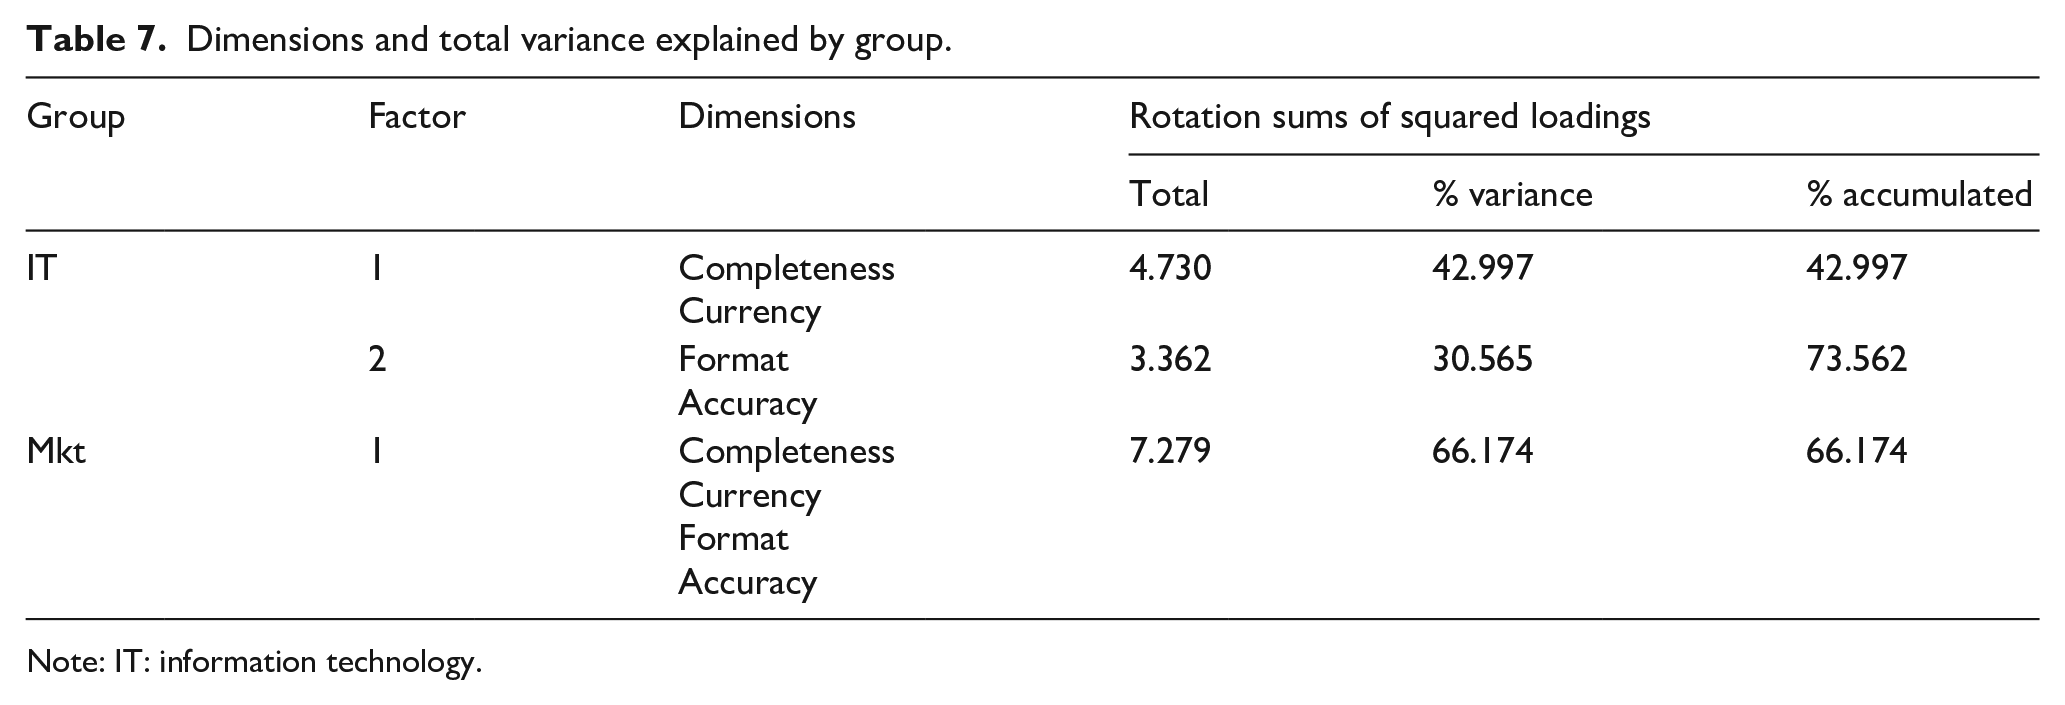
Note: IT: information technology.
The comparison of the test of means also indicates a higher valuation expressed by the IT directors (Table 8). Furthermore, the t test for independent samples rejects the equality of means, with the exception of Item 7.
Average per items, IT, and marketing, according to intergroup item correlations.
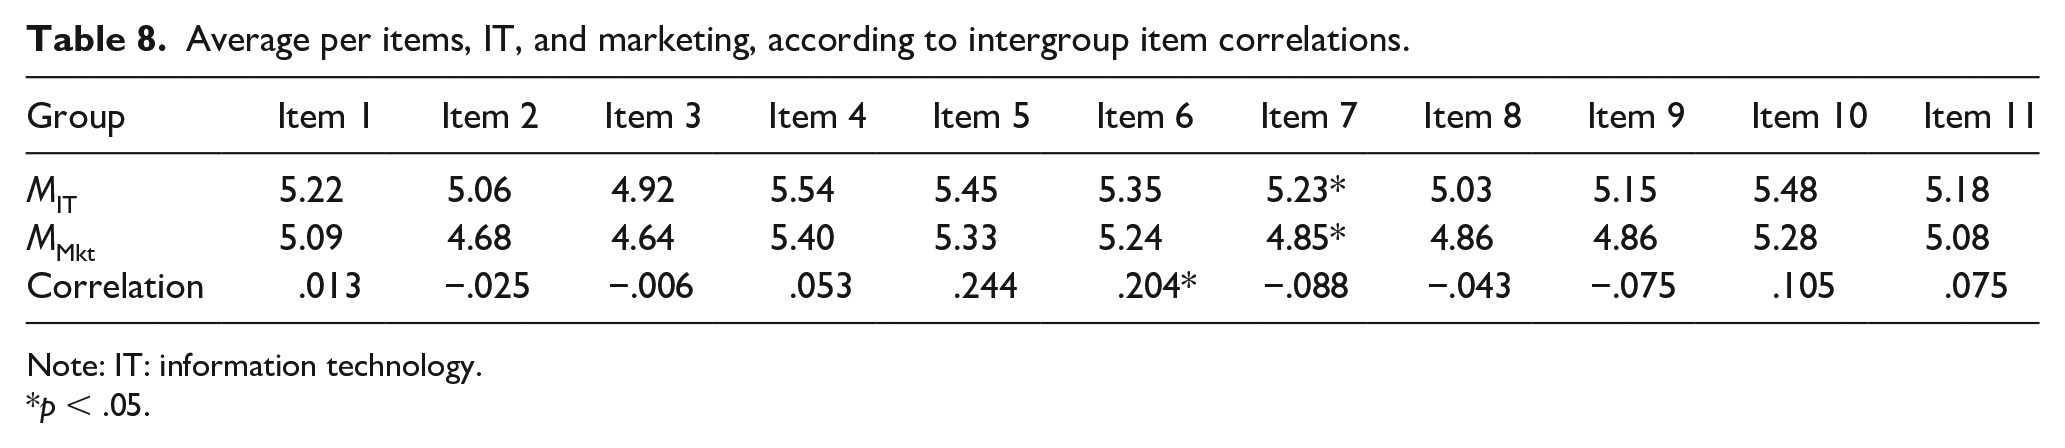
Note: IT: information technology.
p < .05.
These results pertaining to the means can be expected because the producers of information should have better assessments than users. Finally, most of the intergroup correlations are not significant; only Item 6 reaches a significant correlation of .204 (p < .05). The relationships of the responses by both groups thus are mostly null; IT and marketing managers do not express the same perceptions of information quality (Table 8). Therefore, this combined evidence supports our assumption, that is, that there is a discrepancy in the IT and marketing perspectives regarding the quality of the information.
Determinants of DIQ
To test the hypotheses about the probable determinants of this discrepancy, and considering that our dependent variable (DIQ) is metric, this study is based on a linear regression analysis in SPSS. To validate the existence of probable mediations, we used two steps, based on the fact that the variable-to-variable analysis differs from the all-variable analysis. That is, in the first step, it is evaluated whether each of the antecedent variables, in isolation, has significant effects on the DIQ, and in the second step, it is measured if the significance of the relationships found differs from the analysis with all the variables (simultaneously).
First step. Table 9 details the results of the estimates, in which DIQ is the dependent variable, and the other factors are independent variables, analyzed in isolation, together with a model constant. The variables reveal significant coefficients, with the exception of data use culture (−0.198; p > .05), such that all the hypotheses except for H5 receive support. According to Davenport and Harris (2007), the senior management team establishes the data analytical culture of an organization, so perhaps the data use culture already is reflected in the CEO support variable.
Regression analyses with one independent variable, model constant, and DIQ as the dependent variable.
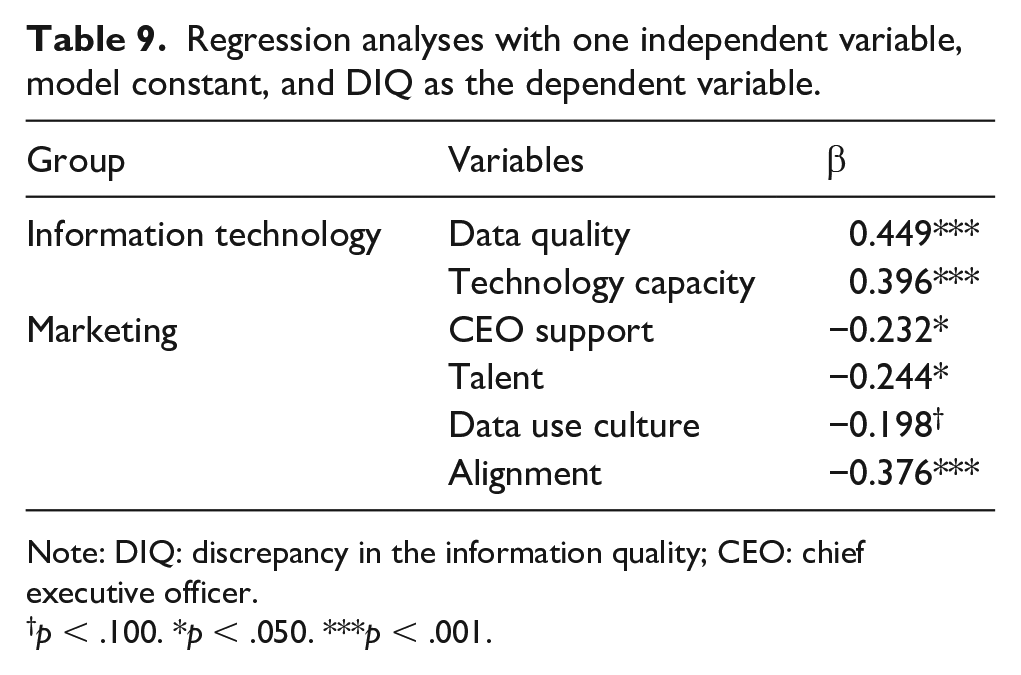
Note: DIQ: discrepancy in the information quality; CEO: chief executive officer.
p < .100. *p < .050. ***p < .001.
Second step. Using these identified determinants with significant coefficients (data quality, technological capacity, talent, CEO’s support, and alignment), a linear regression that incorporated all of them indicated that the explanatory power of the model (i.e., R2 value) was .338, greater than the threshold of .1 (Falk & Miller, 1992). That is, the model offers good explanatory power. The observed R2 value also is similar to the adjusted R2, which indicates good cross-validity for the models. The Durbin–Watson statistic is 2.031, or close to 2, which indicates that the residual errors are not correlated (Savin & White, 1977). Again, the VIFs are below 5, and the tolerance values (1 / VIF) are greater than 0.2, so multicollinearity is not a concern (Myers, 1990). The estimation results and VIF values are detailed in Table 10.
Regression analysis, all variables simultaneously, model constant, and DIQ as dependent variable.
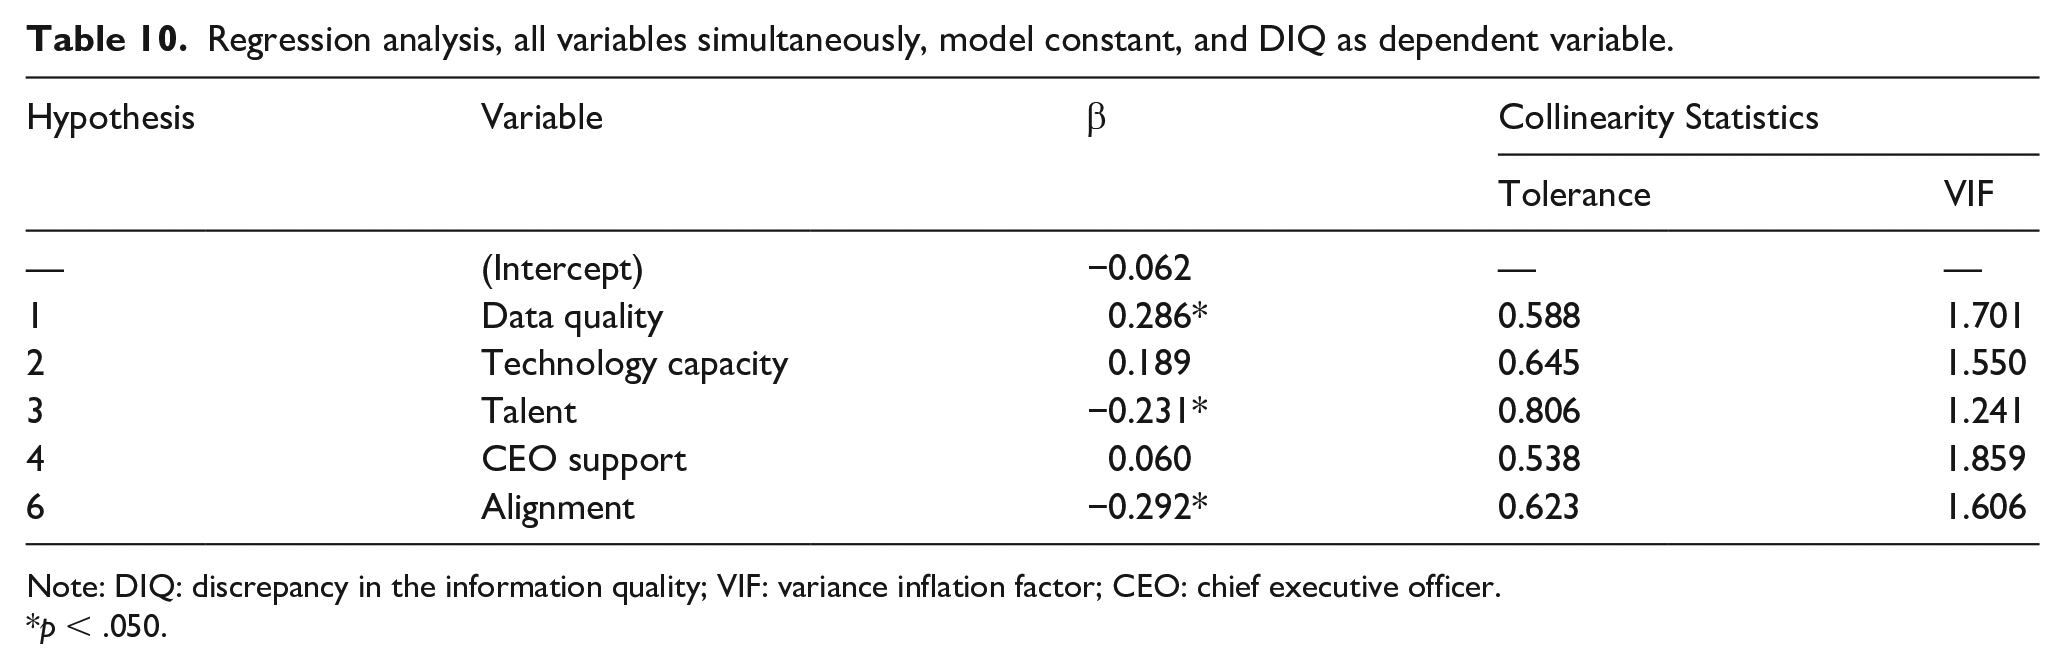
Note: DIQ: discrepancy in the information quality; VIF: variance inflation factor; CEO: chief executive officer.
p < .050.
Main results. The regression results show that data quality, talent, and alignment have statistically significant effects on the DIQ, in support of H1, H3, and H6, respectively. The strongest coefficient (standardized) pertains to data quality (0.319, p < .05), followed by alignment (−0.310, p < .05) and then talent (−0.267, p < .05). The positive effects of these variables increase the DIQ; thus, data quality (H1) increases discrepancies due to overvaluations of information quality, in line with illusion of control by Langer (1975) and the assimilation theory (Ausubel, 2000). Talent (H3) instead reduces discrepancies by generating information that reflects business objectives, in line with the prediction (Erevelles et al., 2016) that greater analytical talent facilitates competitive advantages by providing the expected knowledge. For its part, alignment (H6) reduces discrepancies, by bringing the results of data analysis efforts closer to business needs (Davenport & Harris, 2007), which is a critical strategic requirement. Furthermore, the results indicate that two variables of the model are not statistically significant: technological capacity (H2) and CEO support (H4). Both effects are diluted in the serial analysis of the variables.
To determine the possible causes of these statistically nonsignificant results, additional analyses were performed to the main model.
Additional results. An analysis of the statistically nonsignificant results (H2 and H4), using the strategy proposed by Baron and Kenny (1986) and applying the macro PROCESS proposed by Hayes (2018), determined the existence of mediations for both hypotheses (Models 4 and 6, respectively; see Table 11).
Mediation analysis results.
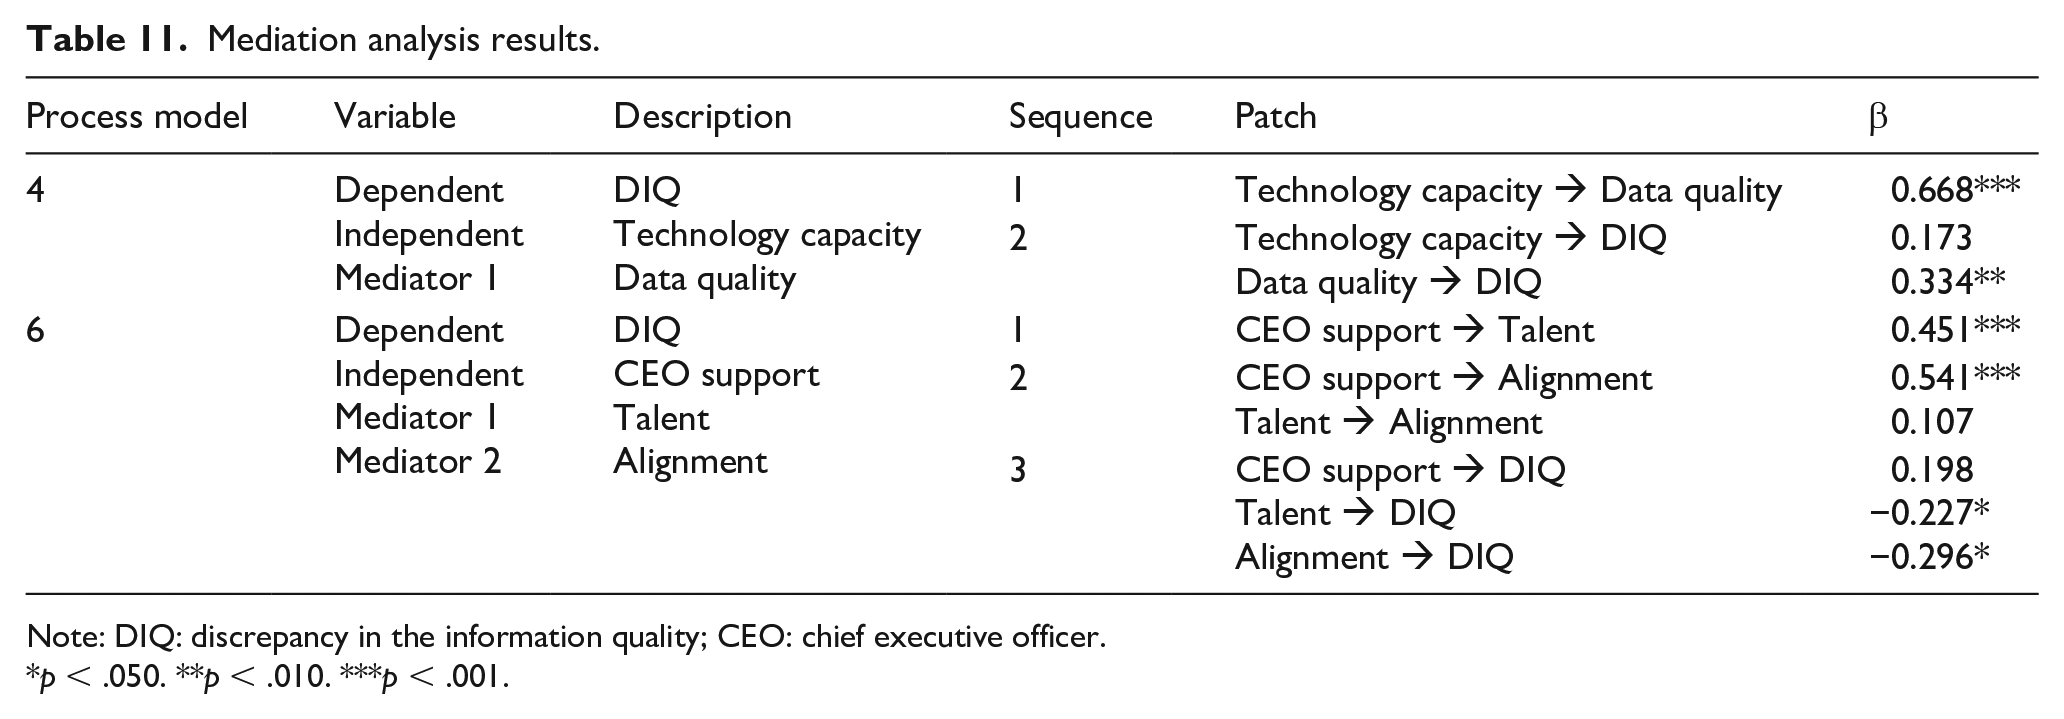
Note: DIQ: discrepancy in the information quality; CEO: chief executive officer.
p < .050. **p < .010. ***p < .001.
For Model 4 (macro PROCESS), the results indicate the mediation of the quality of the data, over the relation technological capacity and the DIQ (see Figure 2). That is, there are statistically significant indirect effects on DIQ, through the quality of the data (0.223) (p < .05). This mediation is in line with Davenport and Kudyba’s (2016) study on the importance of technological capabilities for data processing. According to Manyika et al. (2011), data analytics continues to evolve, driven by innovation in technologies, which is decisive for data management. Data are the glue that connects everything (Davenport, 2014). According to Isson and Harriott (2013), investment in technology capacity is necessary to manage the transformation of data to quality information; otherwise, the performance associated with technology and data deteriorates. The technological capacity allows companies to obtain valuable data, to implement analytical models for decision-making (Barton & Court, 2012). According to Mata et al. (1995) and Tippins and Sohi (2003), there are many companies that have begun to develop strategies that understand information technology (IT) as a resource that facilitates the acquisition of data and generation of quality information.
Empirical model after regression.
For Model 6 (macro PROCESS), the results indicate two mediators of the support of the CEO, the quality of the talent and the alignment of the data plan with the business plan, both with statistically significant influences on DIQ (see Figure 2). A contrast of these indirect effects does not identify any difference in their statistical significance. That is, both mediators are decisive for the CEO’s support, with a total indirect effect of −0.277 in DIQ (p < .05). In general terms, both relationships are founded in Barton and Court (2012), where the authors indicate that the main business leaders must support the organizational factors to have a favorable impact on the mission of the organization.
Regarding the mediation of analytical talent, Verhoef et al. (2016) indicate that the CEO’s vision should establish the type of talent necessary for a data analytics project, as it is a key organizational factor for organizational success. Peiran et al. (2019) indicate that large companies must carefully select human resources and must be employed in the presence of high levels of support from the CEO. Other studies emphasized CEO support in terms of allocating appropriate resources to IS projects, conflict resolution, and resistance to change (Davenport, 1998; Nah et al.,2003). In this sense, the support of the CEO plays a fundamental leadership role (Verhoef et al., 2016). Eichhorn and Towers (2015) agree that the support of the CEO is key in the execution of the alignment and construction of goals and incentives, so that they integrate and motivate their talent.
Regarding the mediation of the alignment of the data plan with the business plan, the literature establishes that managers must pay attention to it and develop more complete action plans to achieve a better strategic business-IT alignment, as well as translate the alignment into superior effects of IT on company performance (Aboobucker et al., 2019). One of the main advantages that senior managers can discuss with their subordinates, the planning of their IT projects, is that all corporate divisions improve strategic alignment (Peak & Guynes, 2003). According to Aboobucker et al. (2019), it is important that senior executives are more attentive to the dimensions of strategic alignment, as these are vital for long-term existence and to compete in the changing business world. The process of aligning the data plan with the need for information quality depends on the support provided by the CEO, as he is responsible for leading the implementation and monitoring of the corporate strategy (Kaplan & Norton, 2008). Such alignment will likely require a clearly defined analytical roadmap by top management, specifying the expected performance on each organizational factor, in pursuit of achieving the company’s business objectives (Isson & Harriott, 2013; Kaplan & Norton, 2016).
The empirical model obtained from these regressions is summarized in Figure 2.
Given the availability of information, in relation to culture of data use, type of management, organizational structure, age of the companies, and industrial sector, this research analyzed the individual significance (linear regression) of possible control variables on DIQ. The incorporation of the control variables into the analysis, both individually and simultaneously, did not yield statistically significant results.
Conclusions and implications
The main purpose of this study was to identify the organizational factors that generate DIQ. The results show that all the causal organizational factors postulated by our model, except for the culture of data use, are compatible. According to our evidence, among all the dimensions of the DIQ, technological capabilities (β = 0.223) and data (β = 0.334) are those that increase the discrepancies between IT and marketing, while the support of the CEO (β = −0.277), analytical talent (β = −0.227), and strategic alignment (β = −0.296) are the factors that reduce the discrepancies. Although we identify differences in the meaning and magnitude of each factor, when measuring the importance of the dimensions on DIQ, we observe that the differences are relatively small, so that all dimensions should have the same importance in aligning the quality of the information for marketing decision-making.
Theoretical implications
First of all, on the basis of Whetten (1989), we declare that this research constitutes a theoretical contribution, since it has been shown that through the DIQ, our understanding of the origin of failures in data analytics projects is significantly altered; consequently, our proposal reorganizes our causal maps by recognizing which organizational factors generate the discrepancy.
Second, our study contributes to the discrepancy theory, since the theory of asymmetric information of Tversky (1977) and the theory of perceptual confirmation biases of Kahneman (2011) are postulated as means of understanding about the origin of the individual perception of the quality of an organization’s information.
Third, responding to the call of Akter et al. (2016) on that researchers must delve into the configuration of organizational resources and determine the origin of poor performance of data analytics, DIQ is recognized as a cause of data analytics failures, and a collection of organizational resources are identified as determinants of the discrepancy.
Fourth, the study contributes to the literature on strategic alignment by advancing the theoretical understanding of the role of alignment and identifying it as a key organizational factor for the success of data analysis projects. This finding is consistent with the previous data analytics literature, which identifies the importance of alignment in critical organizational outcomes (Akter et al., 2016; Fosso Wamba, Akter, & de Bourmont, 2019).
Finally, this research expands the data analysis literature by integrating the final consumer of the information (marketing) as an informant, who defines the quality requirements in relation to the context of its application (Riesener et al., 2019). In general, previous literature has used the information generator (IT) as an informant, relating the data analytics capacity with the company’s results (value for the customer and value for the company), forgetting about the information consumer (marketing), perhaps the “Missing link” between analytical capabilities and company performance (Akter et al., 2016).
Managerial implications
There are several practical implications of this study, due to the potential improvement of the quality of information for marketing decisions. First, the study identifies DIQ as a probable cause of failure in the data analysis projects. Second, the analysis shows that an excellent data analytics capacity, without the alignment between IT and marketing on resources (tangible, human, and intangible factors), is not enough to offer quality information. Third, the organizational factors used in the study could be used as a useful roadmap to identify and resolve problems of discrepancies in the quality of information. Fourth, the results highlight that information quality problems arise from misalignment, which in turn leads to an overestimation of technological capacity and data quality. Business–IT Strategic Alignment has always been considered one of the main confrontations faced by executives of organizations and IT professionals (Luftman et al., 2013). Fifth, in line with Gartlan and Shanks (2007), a greater participation of CEOs is required in training and alignment of IT strategy, since it is necessary to address the biases that overvalue the performance of some organizational factors. The role of the CEO also transcends the selection and accompaniment of analytical talent, since the quality of the information is determined by the talent. Finally, there must be a constant alignment of the strategic objectives on the quality of information, data, and technology; good business performance depends on it. We recognize that the idea of recommending that organizations adopt these practical implications, where the alignment of the data plan with the Marketing plan is critical, may seem very theoretical. However, this conclusion is based on our findings from the data.
Limitations and further research
This study has some limitations that should be recognized. First, the measures included in this study are based on the responses of individual IT and marketing managers and are therefore subject to individual-level subjectivity. Second, a 7-point Likert-type scale has been used to measure all the items, which can introduce the so-called “acquiescence bias” (Chin et al., 2008). Third, the analysis includes only companies from a single-country context. Future research could extend this study to countries with different cultural backgrounds (e.g., level of economic development, protection of personal data) and could also consider other contextual dimensions, such as highly digitized economies, which could influence the determinants of the DIQ. Another challenge for future research is testing our model using panel data to investigate its stability. Finally, we recommend that future research combine the data sources. Using objective data to further verify the proposed research model is a great challenge. However, the originality of this study is not an affront to the existing literature, but an opportunity for data analytics academics to include DIQ in their future research.
Footnotes
Appendix
Factorial loads by items.
| Constructs | Factors by items | EFA | CFA |
|---|---|---|---|
| DIQ | Contains complete information. | 0.800 | 0.821 |
| They are presented without relevant gaps. | 0.837 | 0.855 | |
| They provide all the necessary information. | 0.820 | 0.841 | |
| Details information according to the present. | 0.846 | 0.868 | |
| Always provide updated information. | 0.796 | 0.821 | |
| They contain appropriate formats. | 0.843 | 0.863 | |
| They are easy to understand. | 0.695 | 0.726 | |
| Provide correct information. | 0.846 | 0.866 | |
| They lack relevant errors. | 0.780 | 0.808 | |
| Data quality | The data are updated frequently. | 0.744 | 0.771 |
| The data are replaced with the latest market information. | 0.754 | 0.778 | |
| The data are free of large processing errors. | 0.735 | 0.753 | |
| The data come from reliable sources. | 0.779 | 0.775 | |
| The data are collected under reliable methodologies. | 0.812 | 0.822 | |
| The data have been captured because they respond to the needs of my organization. | 0.648 | 0.669 | |
| The data have been a contribution to the information challenges posed. | 0.760 | 0.804 | |
| The data are mostly used by the department. | 0.728 | 0.786 | |
| Data often allow to respond to business needs. | 0.733 | 0.778 | |
| The data remain stored as long as it is useful. | 0.727 | 0.770 | |
| Technology capacity | The technology operates reliably for analysis. | 0.778 | 0.802 |
| The operation of IT is reliable for analysis. | 0.713 | 0.775 | |
| The technology can be adapted for a variety of analysis needs. | 0.738 | 0.804 | |
| The technology is flexible, to the new conditions, during the analysis. | 0.680 | 0.746 | |
| Technology allows information to be easily accessible to me. | 0.827 | 0.830 | |
| Technology makes information very accessible. | 0.777 | 0.803 | |
| Technology does not take long to process my requests. | 0.746 | 0.753 | |
| Technology provides information in a timely manner. | 0.864 | 0.872 | |
| Talent quality | They are very capable of managing a technological project. | 0.769 | 0.891 |
| They are very capable in the areas of management, data maintenance, and networks. | 0.640 | 0.809 | |
| They are very capable of planning, organizing, and leading projects. | 0.923 | 0.881 | |
| They are very capable of planning and executing work in a team of people. | 0.930 | 0.902 | |
| CEO support | They are passionate about data analysis and decision-making. | 0.795 | 0.891 |
| They declare that our organization is an analytical competitor. | 0.921 | 0.895 | |
| They pressure anyone who presents initiatives or strategies backed by analytical information. | 0.921 | 0.852 | |
| Alignment | The data plan aligns with the information quality objectives. | 0.823 | 0.846 |
| The data plan contains quantified goals that support the quality of information. | 0.827 | 0.855 | |
| The data plan aligns with the expected performance objectives of the business. | 0.869 | 0.888 | |
| The plan has initiatives that support the expected performance of the business. | 0.873 | 0.912 | |
| We prioritize investments in data analysis by the expected impact on business performance. | 0.732 | 0.806 | |
| Data use culture | We consider data as a tangible asset. | 0.842 | 0.820 |
| We base our decisions on data instead of instinct. | 0.779 | 0.878 | |
| Analytical culture continuously improves business rules. | 0.741 | 0.752 | |
| We advise employees to make decisions based on data. | 0.659 | 0.814 |
EFA: exploratory factor analysis; CFA: confirmatory factor analysis; DIQ: discrepancy in the information quality; IT: information technology; CEO: chief executive officer.
Declaration of Conflicting Interests
The author(s) declared no potential conflicts of interest with respect to the research, authorship, and/or publication of this article.
Funding
The author(s) disclosed receipt of the following financial support for the research, authorship, and/or publication of this article: The research was partially supported by the Ministerio de Economía, Industria y Competitividad, Grant ECO2017-82107-R (Spain).