
Abstract
Thermoset composites need time to cure. In additive manufacturing contexts, this prevents achieving full laminate consolidation in a single step. This work investigates the behaviour of a representative Out-Of-Autoclave (OOA) carbon fibre epoxy prepreg, in which air channels were intentionally left to facilitate air evacuation during compression, to explore new processing possibilities. Samples were consolidated through Ply-By-Ply (PBP) compaction cycles under a pressure of 1 bar, at test temperatures ranging from 30°C to 210°C. An oven heat treatment was then applied, to compare the “before and after secondary heating” states of the samples, which indicated the suitability of the material to the one-step process. It was found that the PBP processing temperature and the secondary heating step both had distinct effects on the analysed factors: thickness, voidage and microstructure. Thickness and voidage levels were evaluated via X-ray Computed Tomography (CT), and the final state microstructures were compared via optical microscopy. With preprocessing temperatures above 90°C, voidage appears to drop to a stable level (under 2%), but sample thicknesses still decrease, showing more than 0.1 mm change after the secondary heating. This ultimately demonstrates that despite an improvement in preform quality thanks to a better control of the process parameters, this category of conventional curing epoxy prepregs with air pathways in the fibre tows does not enable a single-step on-line consolidation. Future research for in-situ manufacturing with OOA thermosets should focus on faster curing material systems to allow consolidation in a single step.
Introduction
In the aerospace sector, the current conventional course of action to repeatably manufacture large and mildly contoured composite parts with reduced material waste is to deposit the material on a mould via Automated Fibre Placement (AFP) and to cure it in an autoclave. Indeed, the combination of high temperature and pressure available in autoclave processing offers the desirable levels of consolidation needed to produce defect-free components.1,2
In-situ manufacturing, nevertheless, has a very attractive potential as a way to eliminate the autoclave bottleneck and costs in the production workflow. On one hand, this manufacturing method can already be implemented for thermoplastics,3,4 and their features can even be predicted thanks to modelling studies. 5 On the other hand, some studies indicate that in-situ AFP curing of thermosets may not yet be possible, due to the time needed to cure the initially liquid polymer into a rigid glassy solid. 6
However, materials and methods specifically designed for Out-Of-Autoclave (OOA) applications have been studied.7,8 They have been deemed to be a suitable alternative to autoclave materials and are now widely used. It then becomes of interest to verify whether these materials, although being thermosets, can be used with the same on-line consolidation methods used for thermoplastics (i.e. lower deposition speed but higher temperature), enabling a one-step manufacturing approach.
The particular focus of this paper is the analysis of the evolution of the thickness and voids in the Ply-By-Ply (PBP) deposited OOA material. A representative thermoset prepreg (pre-impregnated fibre bed) has been selected to conduct the material characterisation tests and assess its suitability to the considered on-line consolidation process, leading to in-situ manufacturing.
For parts intended to be manufactured additively using an on-line consolidation process, monitoring the heat input and the thickness change is indeed vital.9,10 The control of these factors is an important part of the manufacturing of composite components with prepregs, as it guarantees the quality of preforms for the steps before cure, and then ensures the production of reliable parts after cure. For these reasons, this study focused on varying the test temperatures over a selected range and on monitoring the thickness of the created samples through the manufacturing steps.
Furthermore, the defect levels were assessed, as they are important to be considered in the development of novel manufacturing methods,11,12 especially defects such as voids 13 and resin-rich regions. 14 X-ray Computed Tomography (CT)15,16 is a reliable technique that not only allows the detection of voids in the samples17,18 but also helps to understand their formation mechanisms 19 and the effect on material properties.20,21 This method was used to characterise the prepared samples.
Materials and equipment
Materials
The material selected for this study was the M56/35%/UD268/IM7-12K OOA prepreg, manufactured by Hexcel. 22 It is representative of the high-performance epoxy/carbon fibre prepregs class, developed for OOA curing for composite aircraft structures and suitable for automated processing.
According to the datasheet, the prepreg is nominally 394 gsm, and the nominal cured ply thickness of this prepreg was 0.253 mm with a theoretical volume fraction of 58.8% of carbon fibre in each ply. The recommended curing cycle is to heat the material under vacuum in an oven at 180°C for 2 h, with a dwell at 110°C for 1 h.
This material has been characterised in different configurations in previous studies,23,24,25 showing that the IM7 fibre is a polyacrylonitrile-based intermediated modulus carbon fibre for structural applications and that the mechanical performance of the OOA M56 epoxy matrix is comparable to that of the autoclave cured 8552 matrix. The final prepreg contains dry regions in the middle of the fibre tows, meant to act as air evacuation channels during the compaction steps.
Equipment
Compaction tests were performed on an INSTRON™ 5969 machine equipped with a 50 kN load cell, on which custom-made heater plates were installed. The characteristics of these plates are presented in previously published compaction studies. 26 The testing equipment is shown in Figure 1, along with the sample placement and the embedded thermocouples positioning. For the CT analysis, the scans were performed on a Nikon™ XTH 225L X-ray scanner. For microstructure analysis, the samples were cut, potted and polished before being observed under a Zeiss Axio Imager M2 optical microscope.
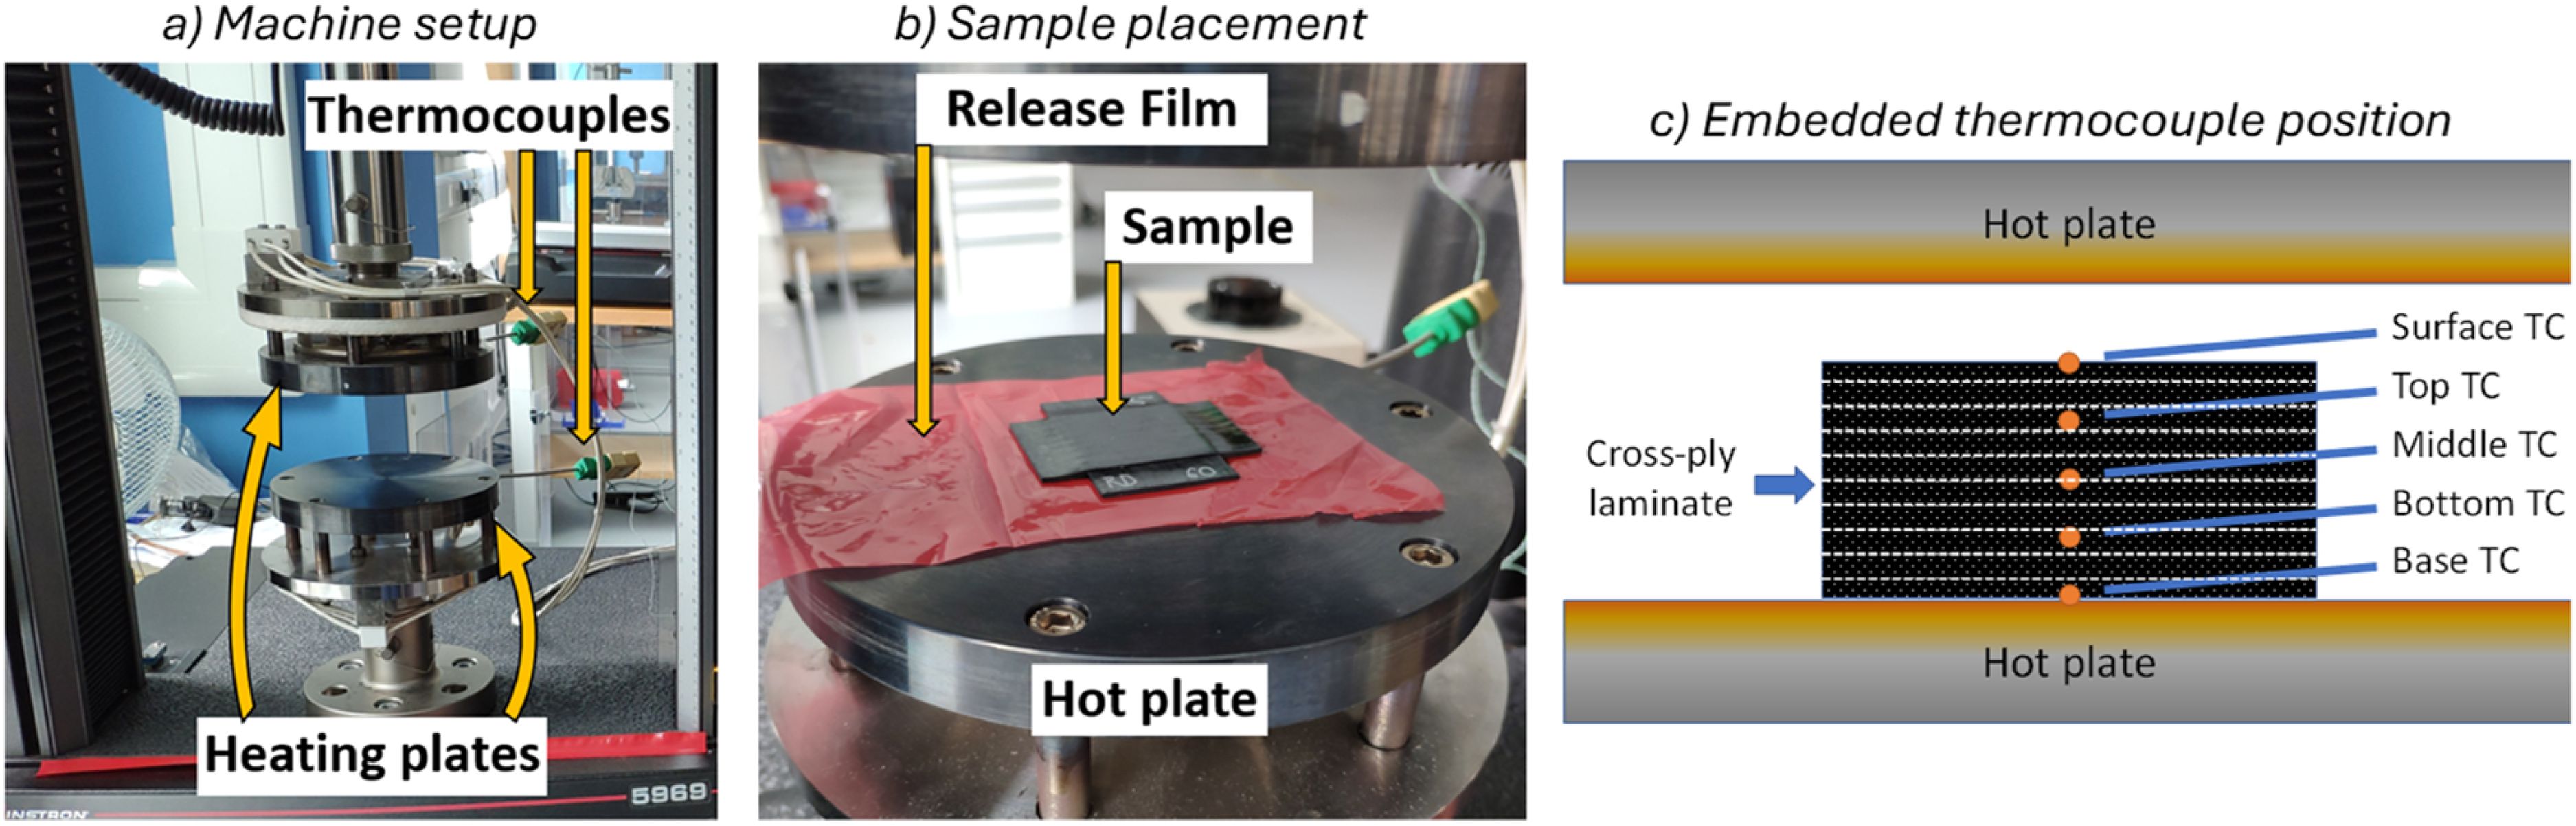
Testing equipment and sample placement.
Methodology
The specimens of this experimental study were prepared via Ply-By-Ply (PBP) compaction, to attempt to replicate an additive manufacturing method.
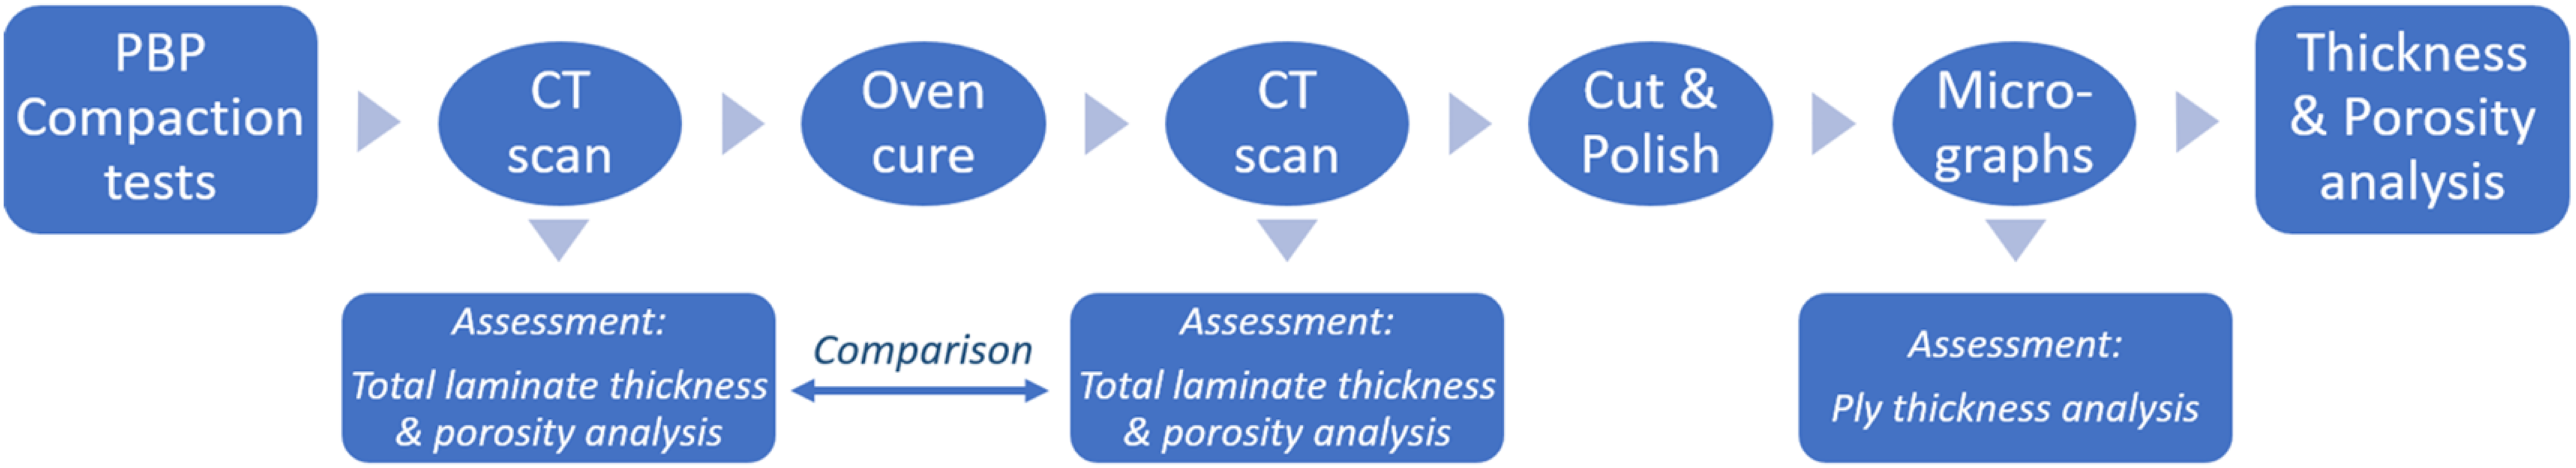
Contrary to normally compacting laminates when all plies are already laid (i.e. in bulk), the adapted PBP compaction process of this paper consisted of compressing each ply for a given time, temperature and load. A new ply was manually added between each heated compaction cycle (representing the primary heating step), to finally create a 10-ply laminate, which was subsequently CT scanned. After the PBP compaction process and CT scan, a secondary heating step (oven cure / post-cure) was applied to each of the test samples (all in one batch), and another CT scan was performed. This was done to compare the material state before and after post-curing.
The workflow of activities (Figure 2) was made to match the following rationale: “If the thickness and voidage levels of the PBP prepared specimens remain similar after the secondary heating step (oven cure), then the adapted compaction process proves to be sufficient to freeze the microstructure. If not, this proves that the microstructure is still evolving during that heating step, as the sample is not fully cured and needs additional processing.”
Workflow of activities.
This workflow allowed to obtain the necessary data about the material behaviour and state:
Performing PBP compaction tests at different temperatures allowed the evaluation of the changes in thickness, relative to the heat input, for each deposited ply. The oven heat treatment step allowed the assessment of a secondary heating step on any changes in the material state (see Figure 3), but also in the dimensions and microstructure. Performing CT scans before and after oven cure, allowed the evaluation of the changes in sample thickness and voidage, both numerically and visually (see Figures 4 and 5). Finally, taking micrographs of the cut samples, allowed the evaluation of the thickness of each ply and to check the effect of the PBP compaction process (see Figures 6 and 7).
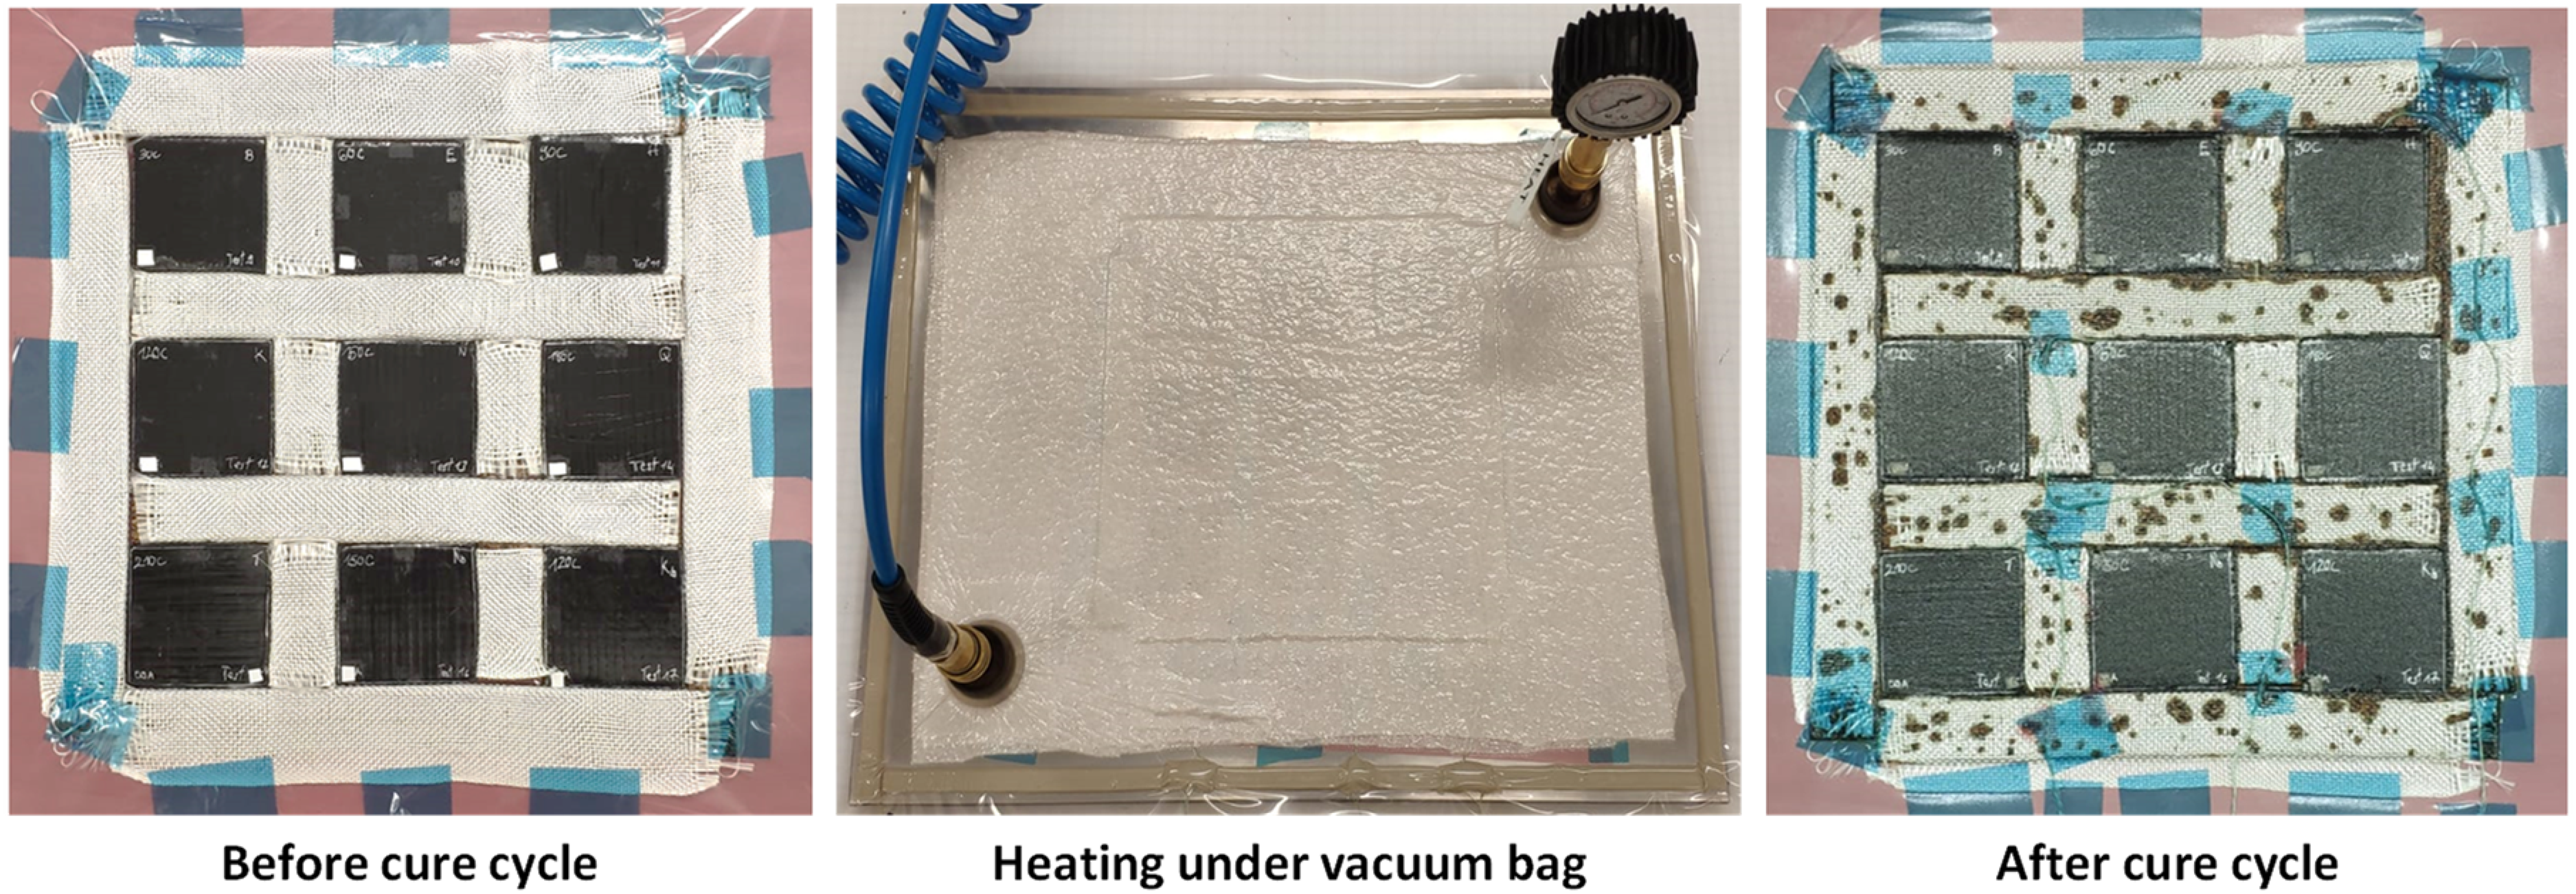
Material state before and after secondary heating step—resin movement, meaning an uncured state before oven heating and high resin outflow, meaning a higher fibre volume fraction.
Thermal history of the 150°C sample, tracked via embedded thermocouples.
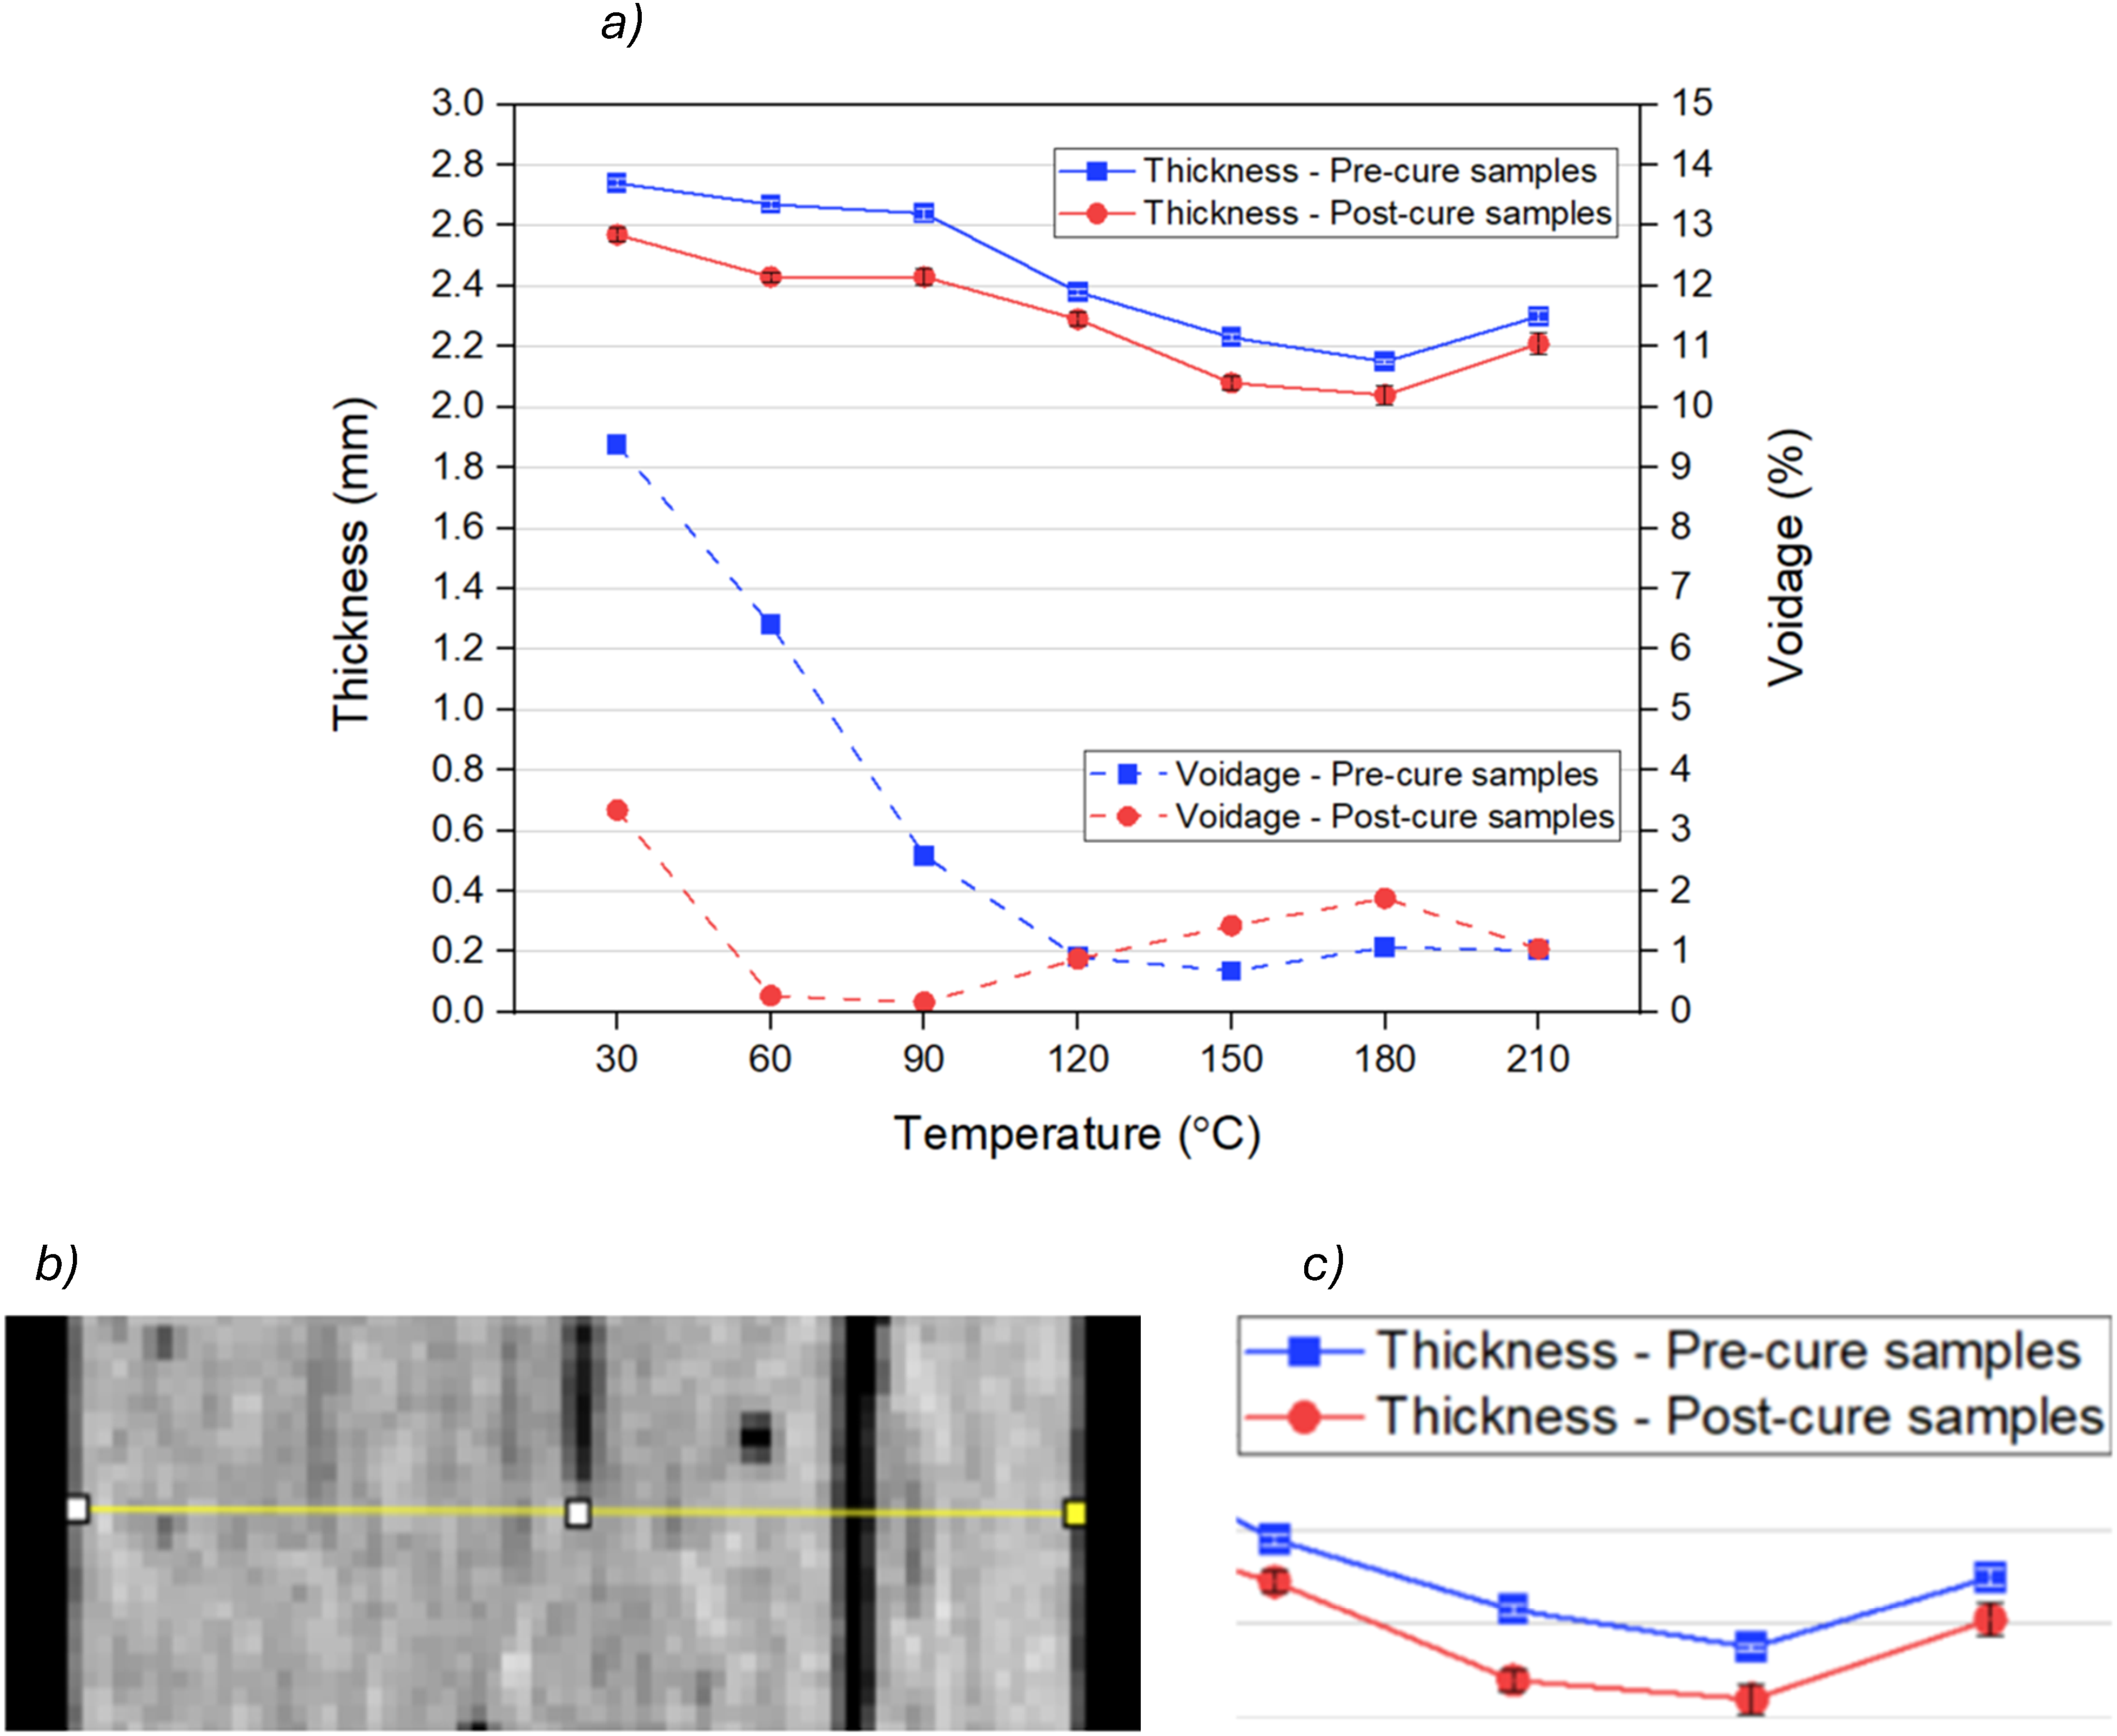
Evolution of thickness and voidage relative to the evolution of temperature. (a) Thickness and voidage evolution graph. (b) Measurement to the pixel on a CT scan slice. (c) Zoom to display the error bars.
CT scans of the seven PBP compacted samples, before and after oven cure.
Micrographs of the 10 plies samples (postcure).
For the compaction tests, the material was cut down into plies (50 × 100 mm strips of prepreg) that were laid in a 0°/90° cross-ply configuration before compaction. Seven samples of 10 plies each were prepared in a single batch of tests, performed consecutively, covering the 30–210°C temperature range, with 30°C increments (30, 60, 90, 120, 150, 180 and 210°C). This range goes below and above the common manufacturing parameters, allowing to gain new insight on both materials and process implications.
It is important to mention here that tests at each condition were not repeated. This is a potential limitation of the study, but it has been decided not to perform a second batch of test as the goal of the study was to determine if the tested material was suitable for a single-step processing method over a very wide temperature range. Multiple repeats would be needed to industrialise this process, but a single one was sufficient to observe the material behaviour and draw the necessary conclusions about the influence of the parameters on the compaction response.
At each considered temperature, each ply was compacted for a duration of 2.5 s at a pressure of 0.1 MPa (= 1 bar). For the 50 × 50 mm2 compaction area of the samples, this pressure corresponds to a load of 250 N and the load rate was then chosen to be 250 N/s, to achieve a 1 s ramp-up to the desired load. Nixon-Pearson et al. 27 report that this level of pressure and pressure rate is within the typical range of processing with AFP (up to 0.2 MPa and to 7 MPa/s respectively).
The 2.5 s load hold duration was selected as it appeared to offer the most reliable control of the test parameter. Shorter compaction times led to machine response issues (overshoots and underload), and longer compaction times led to excessive thickness change.
For the oven cure, the curing conditions were set following the datasheet recommendations: a heating ramp of 2°C/min from room temperature to 110°C for a dwell of 1 h, then to 180°C for a dwell of 2 h, 22 all under vacuum-bag condition.
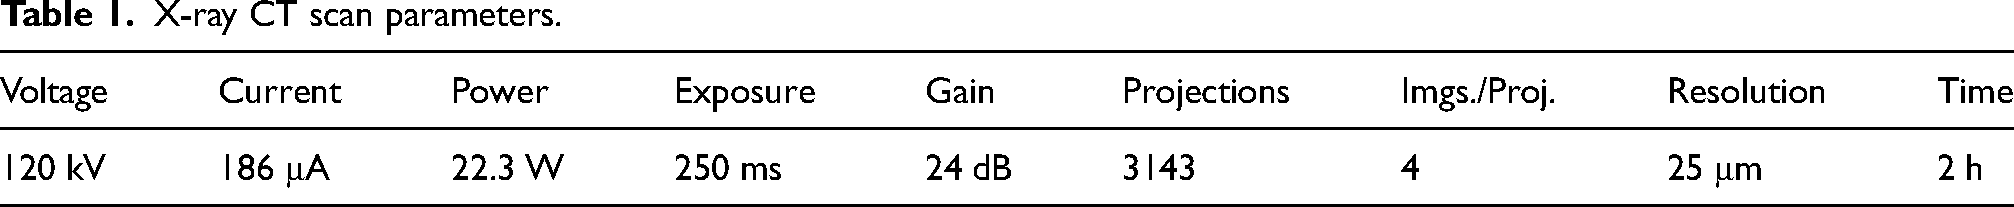
The CT scan parameters are presented in Table 1, and the same settings were used for both scans (before and after cure). The voidage assessment was done using a new approach focusing on void segmentation, which combines the use of ImageJ (FIJI) 28 and Dragonfly. 29 ImageJ was used for the preprocessing of the CT scans, by applying filters and presegmenting with Weka, a machine learning tool that allows to differentiate the material and the voids. Dragonfly was used for the 3D visualisation, the final segmentation and to obtain the final voidage values.
X-ray CT scan parameters.
Results and discussion
General observations
As a reminder, for each considered temperature, each ply was compacted under 1 bar pressure, corresponding to a 250 N load, for a 2.5 s duration. It needs to be stated that this compaction time only covers the time spent at the requested pressure. However, each ply undergoing the PBP compaction test started to receive heat from the moment it was placed on the hot plate (i.e. the first ply) or the composite substrate (i.e. the subsequent nine plies). This limitation of the current setup needs to be addressed in future works, when the focus is shifted to automated deposition testing. However, this method still allows the comparison of the material behaviour, relative to the different parameters it was exposed to. The validity of this comparison is verified by analysing the cure evolution in the next section.
Figure 3 illustrates well the resin flow behaviour before and after oven curing (Step 3 in Figure 2). It can be seen that the cork surrounding the samples (covered with glass fibre cloth to facilitate resin flow and air evacuation) has been impregnated with resin during the step. It is also interesting to notice that the sample displaying the most resin outflow (top right) was the one for which the lowest levels of voidage were recorded (PBP 90°C, after cure). Although the fibre volume fraction had not been calculated, it is thought to have likely increased, due to the reduced matrix volume for the same amount of fibres. A further analysis of the voidage features is conducted in the following sections.
DoC analysis
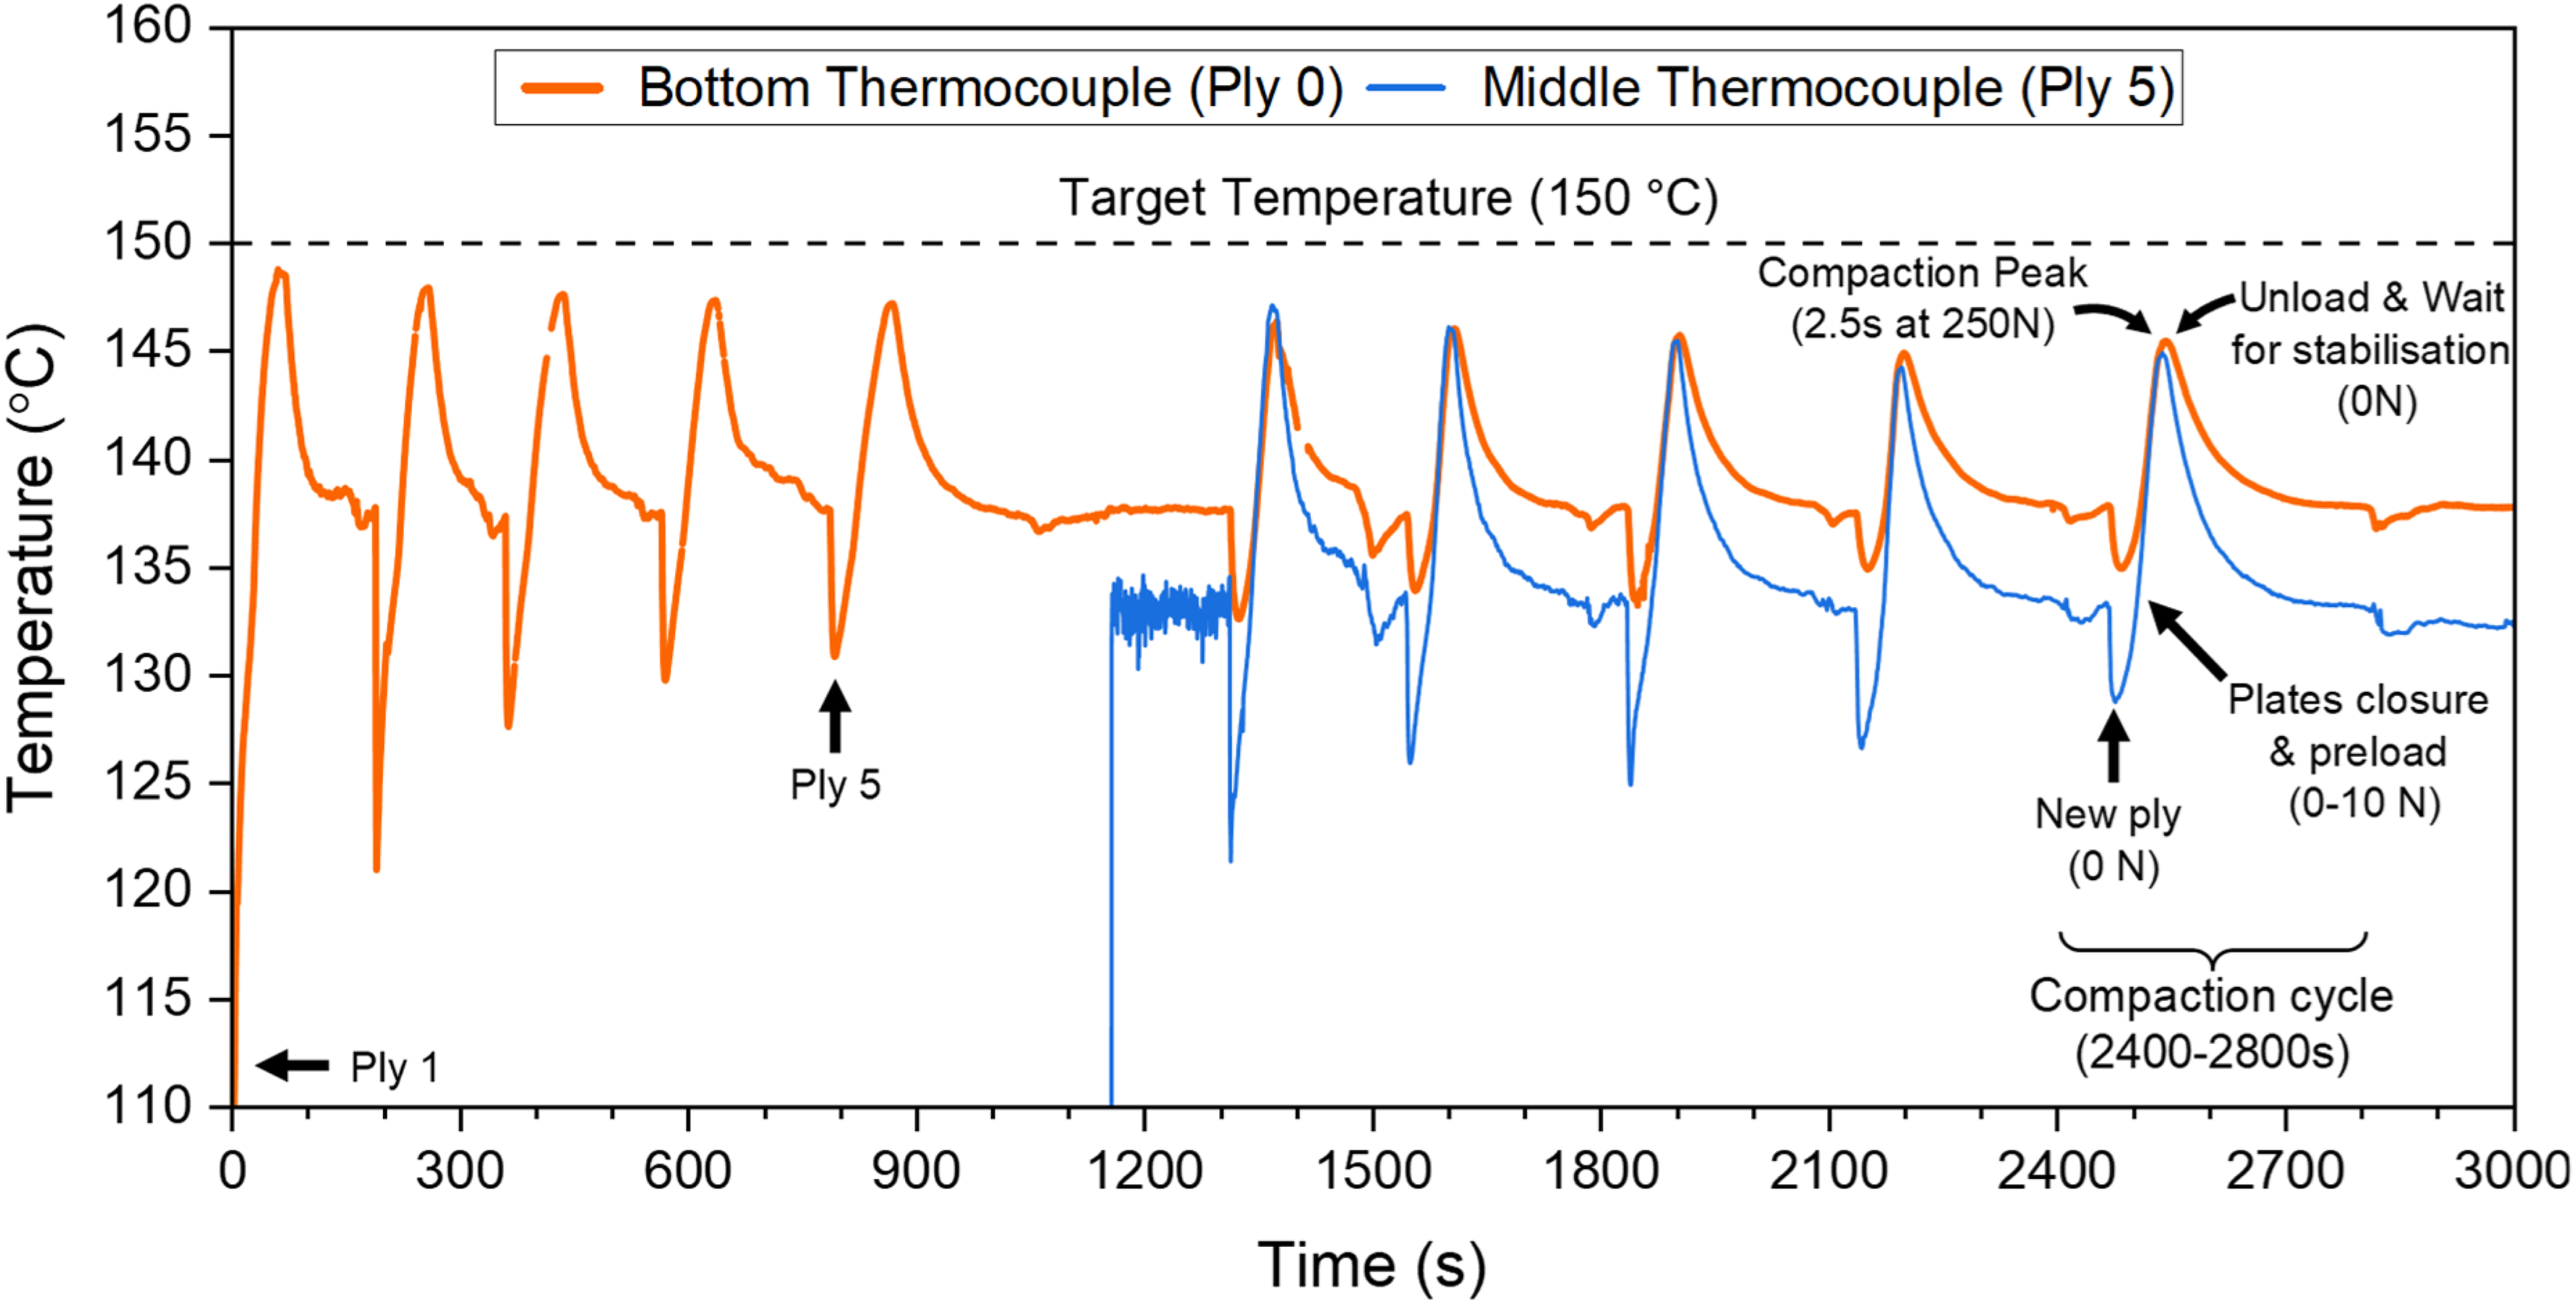
It has been attempted to evaluate the Degree of Cure (DoC) of the laminates after the PBP tests. The cure kinetics of the IM7/M56 system were characterised by Serrano, 30 and the thermal history of the 150°C samples was tracked via embedded thermocouples (Figure 4). In this graph, each temperature peak corresponds to the closure of the plates (compaction), each stabilisation following the peak corresponds to the opening of the plates (relaxation), and each valley corresponds to the application of a new ply, absorbing heat from the stack. It was observed that the target temperature set for the hot plates (150°C) was never reached by the composite stack. This can be attributed to the presence of release film between the composite and the hot plates, on top of the fact that the thermocouples were placed inside the stack being laid up, hence further away from the heat source. It can be observed that the thermal cycles do get longer. It is in part due to the fact that the process was manually operated, but the main reason was the change in cooldown rate after each ply was compacted. Indeed, after each cycle, there was a wait time, to allow the temperature to stabilise before adding the next ply (as can be seen on the cycle of ply 5, which has a longer wait because a thermocouple was being set). It was realised that with the addition of more plies, the wait time was growing longer. This is believed to be simultaneously due to the heat retained by the substrate and to the curing reaction happening.
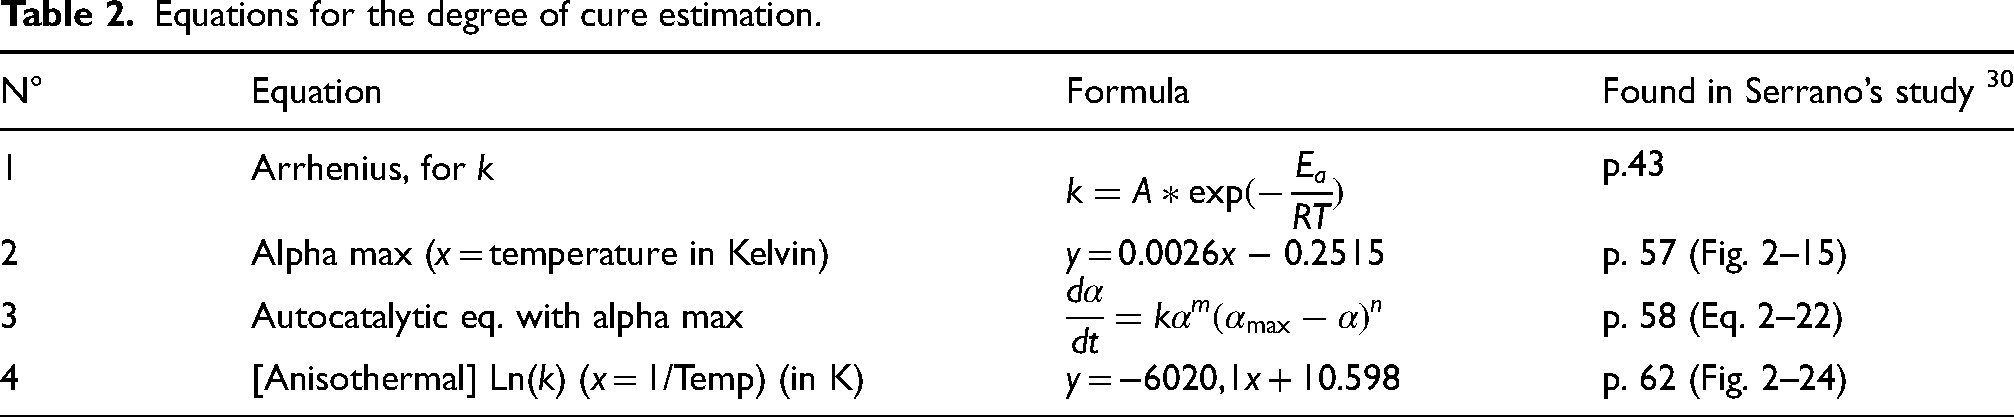
Table 2 provides the equations used for the DoC estimation. Their full description is given in detail in Serrano's study. Equation (1) was necessary to find the cure rate constant k, which was used in Equation (3) that allow to determine the cure rate (dα/dt) in different conditions. Equation (4) allowed to determine the necessary values in anisothermal conditions (such as the heat application in the ply-by-ply process).
Equations for the degree of cure estimation.
Ultimately, by combining the isothermal DSC results from Serrano 30 and thermal history data obtained in this study, it became possible to estimate the evolution of the DoC, for each deposited ply (assuming an isothermal exposure to the averaged temperature, to simplify the calculations), and the results are presented in Table 3.
Degree of cure estimate of each ply after the ply-by-ply compaction test at 150°C.
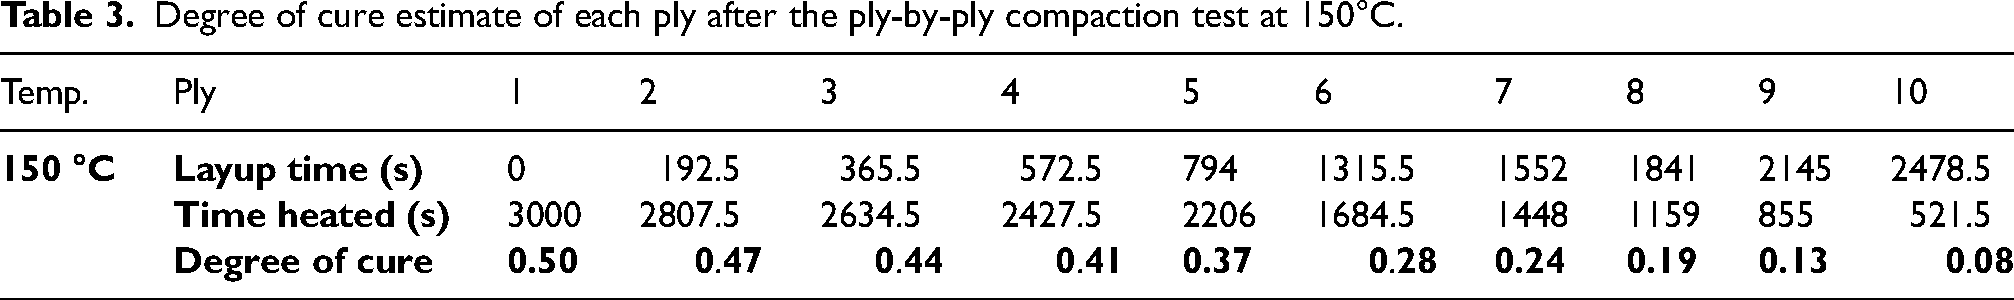
As can be seen, Serrano gives the equation that indicates the maximum DoC reachable, in function of temperature (Equation 2, in Table 3). This allows to estimate that the maximal DoC for processing temperatures of 120°C, 150°C and 210°C would theoretically be 0.77, 0.85 and 1.00, respectively. This confirms the necessity of a secondary heating cycle to reach full cure, for any processing temperature below 210°C, independently of the processing time.
Sample thickness analysis
The thickness of the whole laminate was assessed for each sample. This measurement was carried out both before oven heat treatment (i.e. after the PBP compaction) and after oven heat treatment (i.e. after cure cycle under vacuum bag). The thicknesses were measured via the CT scans, with built-in measurement tools, allowing to easily take precise and repeatable measurements in several locations. The results are presented in Figure 5(a), with the average taken as shown in Figure 5(b), over three spots for the thickness values. The (very small) error bars (Figure 5(c)) show the standard deviation and a higher error is recorded for the post-cure samples because of the irregular surface of the samples (cf. Figure 6). It was observed that up to 90°C, the thickness stays relatively constant. Afterwards and up to 180°C, the samples get noticeably thinner. A slight increase in thickness is also seen at 210°C. This evolution pattern could be due to a drop in resin viscosity at 90°C, allowing a better flow and better through-thickness movement, filling voids and dry areas.
The effects of resin movement on the sample's features can be linked to the squeezing and bleeding phenomena,10,31 experienced by the material during the simultaneous heating and compaction. Those are accentuated by temperature, leading to a more compliant material as the load is applied.
Void analysis
First, the difference needs to be made between delamination voids (large planar voids occurring between the plies) and discrete voids (voids occurring in any location in the material and which may impact the mechanical properties, depending on size and density). 32 In the particular case of this OOA material, dry areas also need to be defined. They are the channels left between the impregnated areas of the OOA prepreg, to subsequently help evacuate the air creating the voids.33,34 Here, the term voidage covers the discrete voids and the dry areas. Figure 5 also presents the observed evolution of the voidage for the 10-ply samples.
Before data treatment, it was expected that this analysis would show that a higher compaction temperature for PBP tests would lead to a reduced voidage. This follows the hypothesis that a higher compaction temperature would lead to better air removal between the plies and permit a better impregnation of the dry areas. However, this phenomenon exists in parallel with the fact that air channels in the prepreg would get filled during the compaction steps as the resin starts flowing towards the centre of the tows. The lack of air evacuation during both the compaction and the oven heating steps is one of the main reasons voids can be found in the final laminates. 35
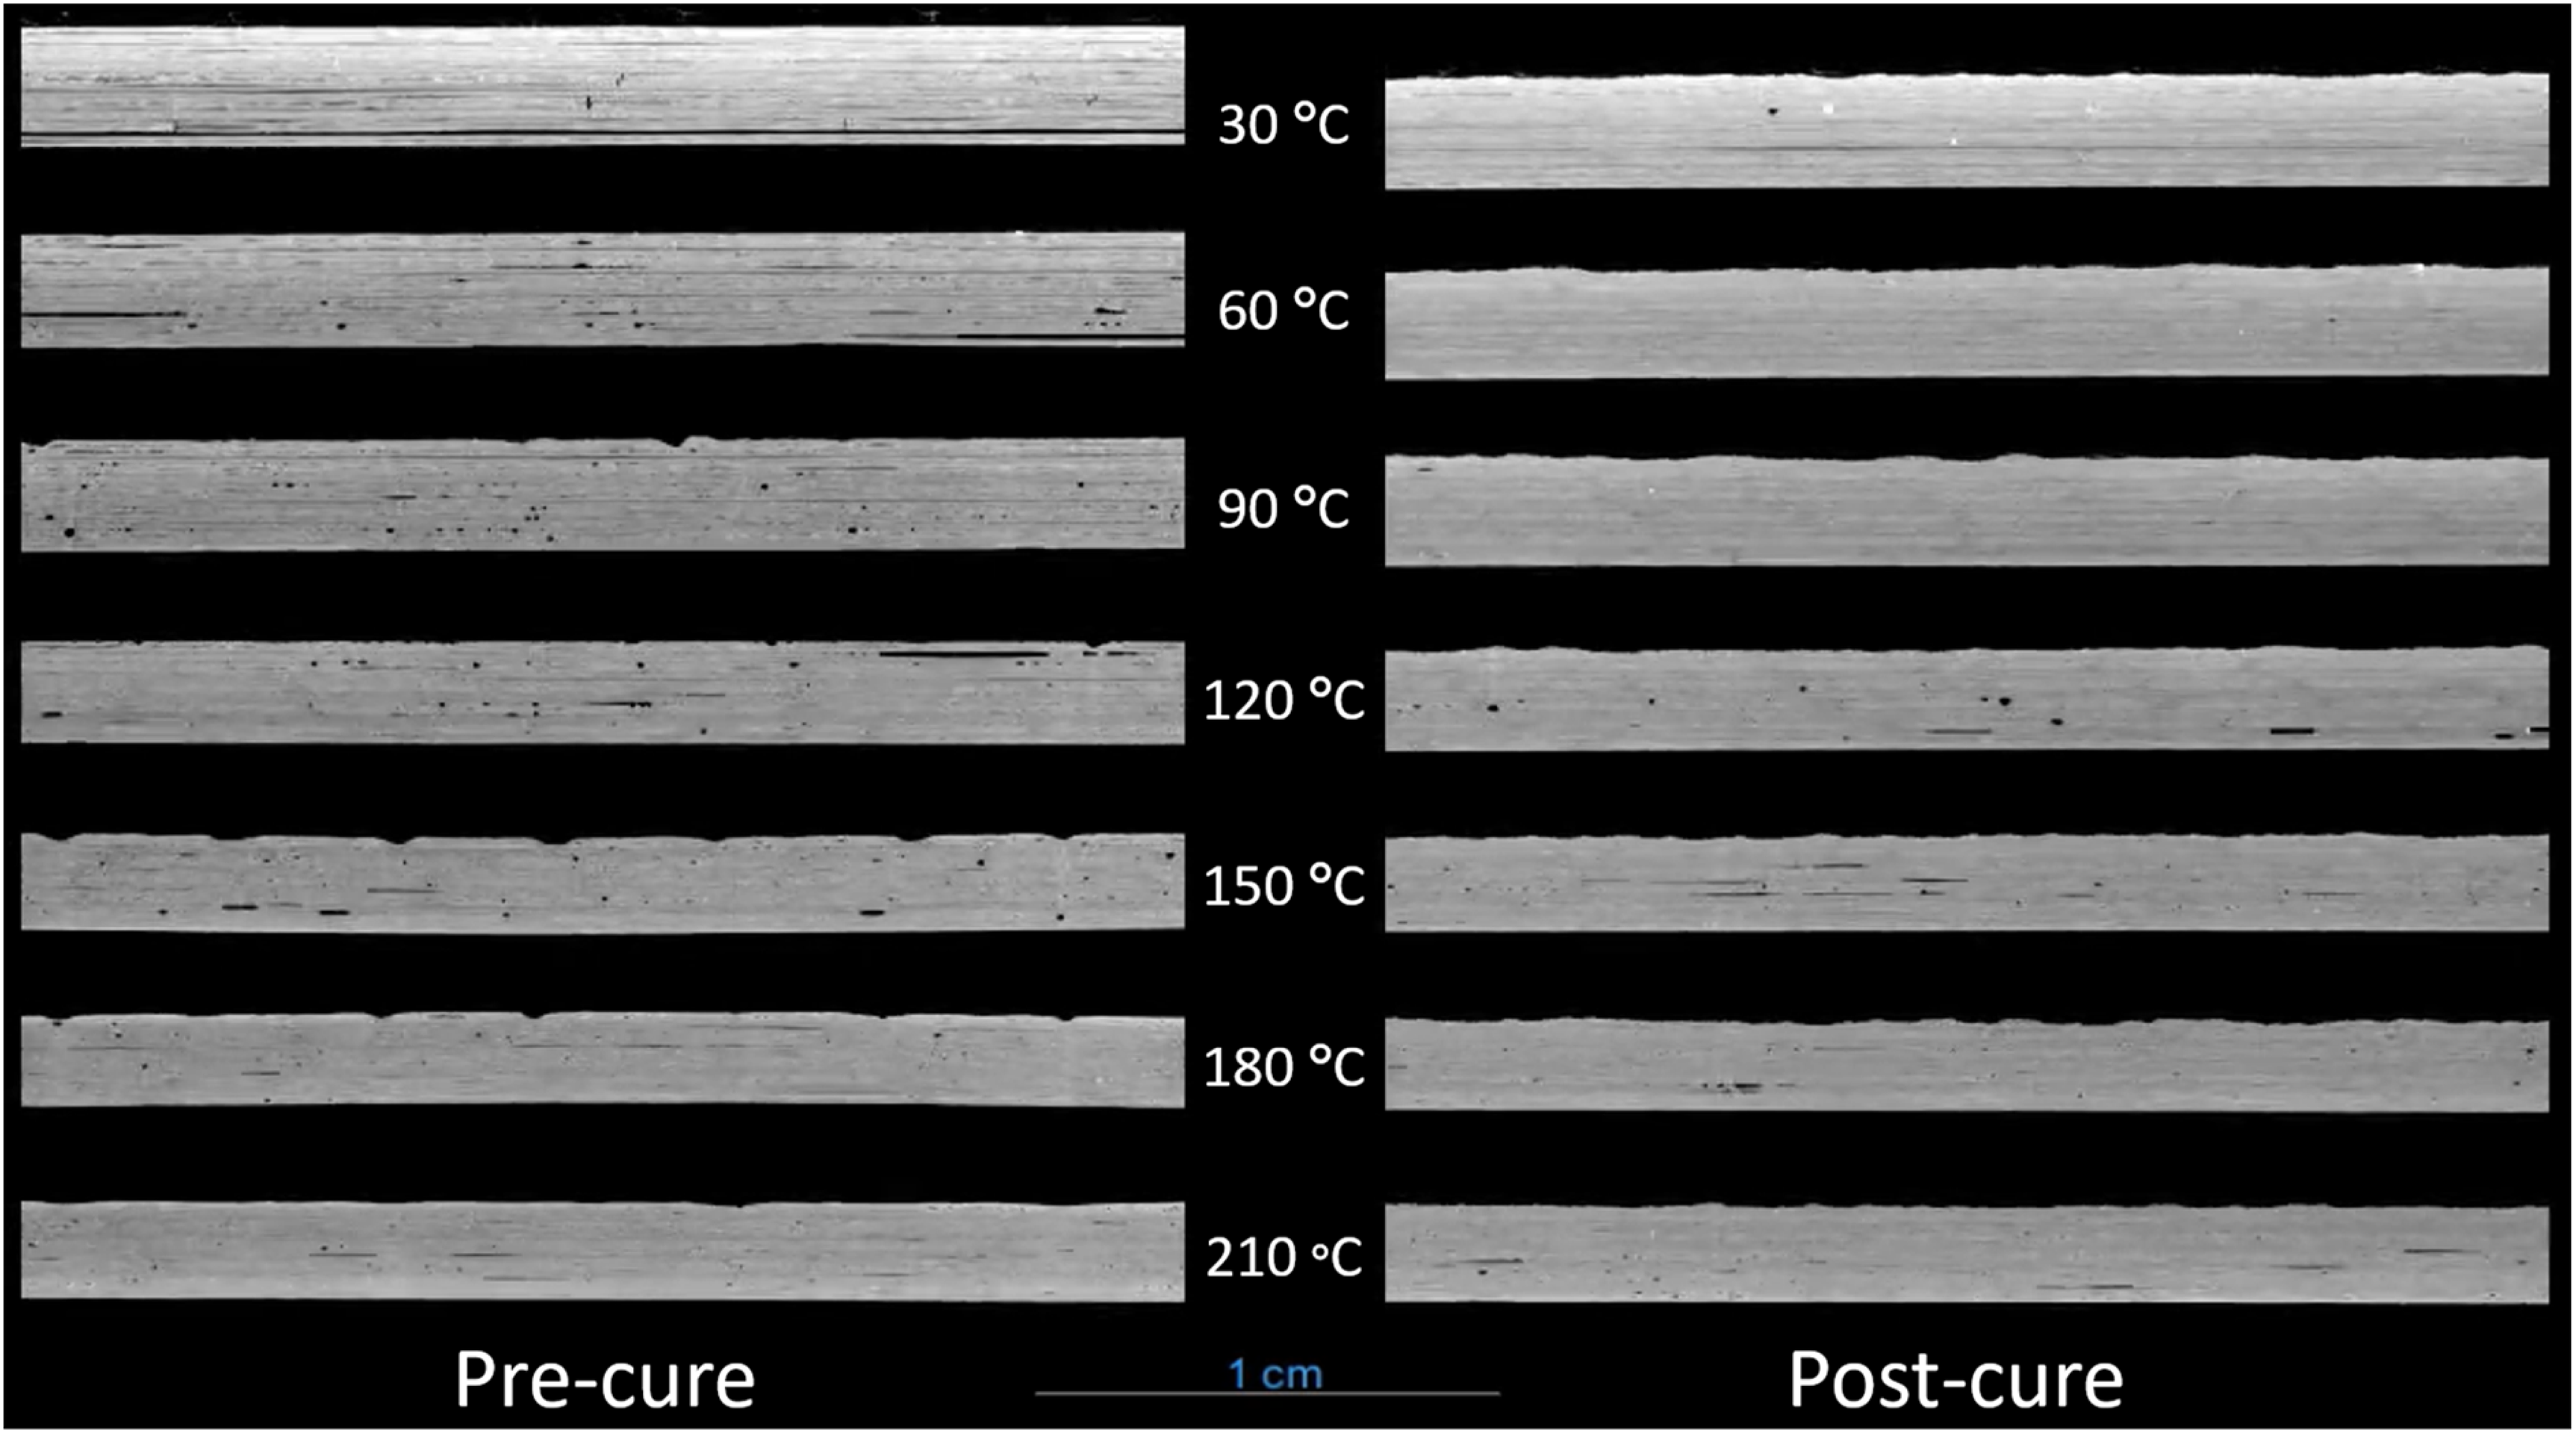
Figure 6 shows the CT scans of the samples, allowing the examination of the voidage evolution. From top to bottom, the samples have been placed in increasing order for temperature, from 30°C to 210°C (30°C increments). On the left side, the samples have only been compacted ply-by-ply. On the right side, they underwent the oven heat treatment, for 2 h at 180°C (with a 1 h dwell at 110°C). When comparing the samples vertically, the effect of the PBP compaction temperature on the thickness and voidage can be seen. Notably, this shows the disappearance of the delaminating voids at 30°C and a decreasing sample height. When comparing the samples horizontally, the effect of the oven heating step on the thickness and voidage can be seen. Notably, this shows the reduction / disappearance of voids in the 30, 60 and 90°C samples.
For the samples compacted at low temperatures (30°C), the voidage level is at its highest, in both the precure and postcure states. Then, at medium temperatures (60–120°C), there is a drop in the voidage level. Finally, at higher temperatures (150–210°C), the voidage appears to stay stable at low levels. A slight increase can be observed in the 120–210°C samples. This alteration may be attributed to the effect of moisture reacting to the heat in the uncured prepreg (as suggested by studies as a dominant source of voids within prepreg36,37). Indeed, when evaporating, moisture creates air bubbles that stay entrapped in the laminate and that contribute to the thickness, explaining the increase seen in voidage contents with the increase in temperature. These observations suggest that the impact of the post-cure step is non-negligible in terms of voidage. This would mean that along with the significant change in thickness observed, the microstructure has not been locked into a stable state and that the one-step PBP process is not suitable for in-situ curing with this material. However, it proves that improvements can be made in preform manufacturing, to better control the thickness and the voidage before the secondary oven curing step. Indeed, in industry, current AFP processes with the considered OOA thermoset prepregs are typically performed at temperatures between 30 and 80°C. This means that the opportunity to increase the processing temperature could be considered for better preform and postcure quality.
It was observed that at high temperatures, the prepreg tows would spread apart as the resin starts flowing and creates surface profile irregularities (i.e. valleys). Nevertheless, less voidage was observed and measured as the test temperature increased, which supports the formulated hypothesis, but tow spreading would need to be considered in a future industrialisation step.
Microstructure analysis
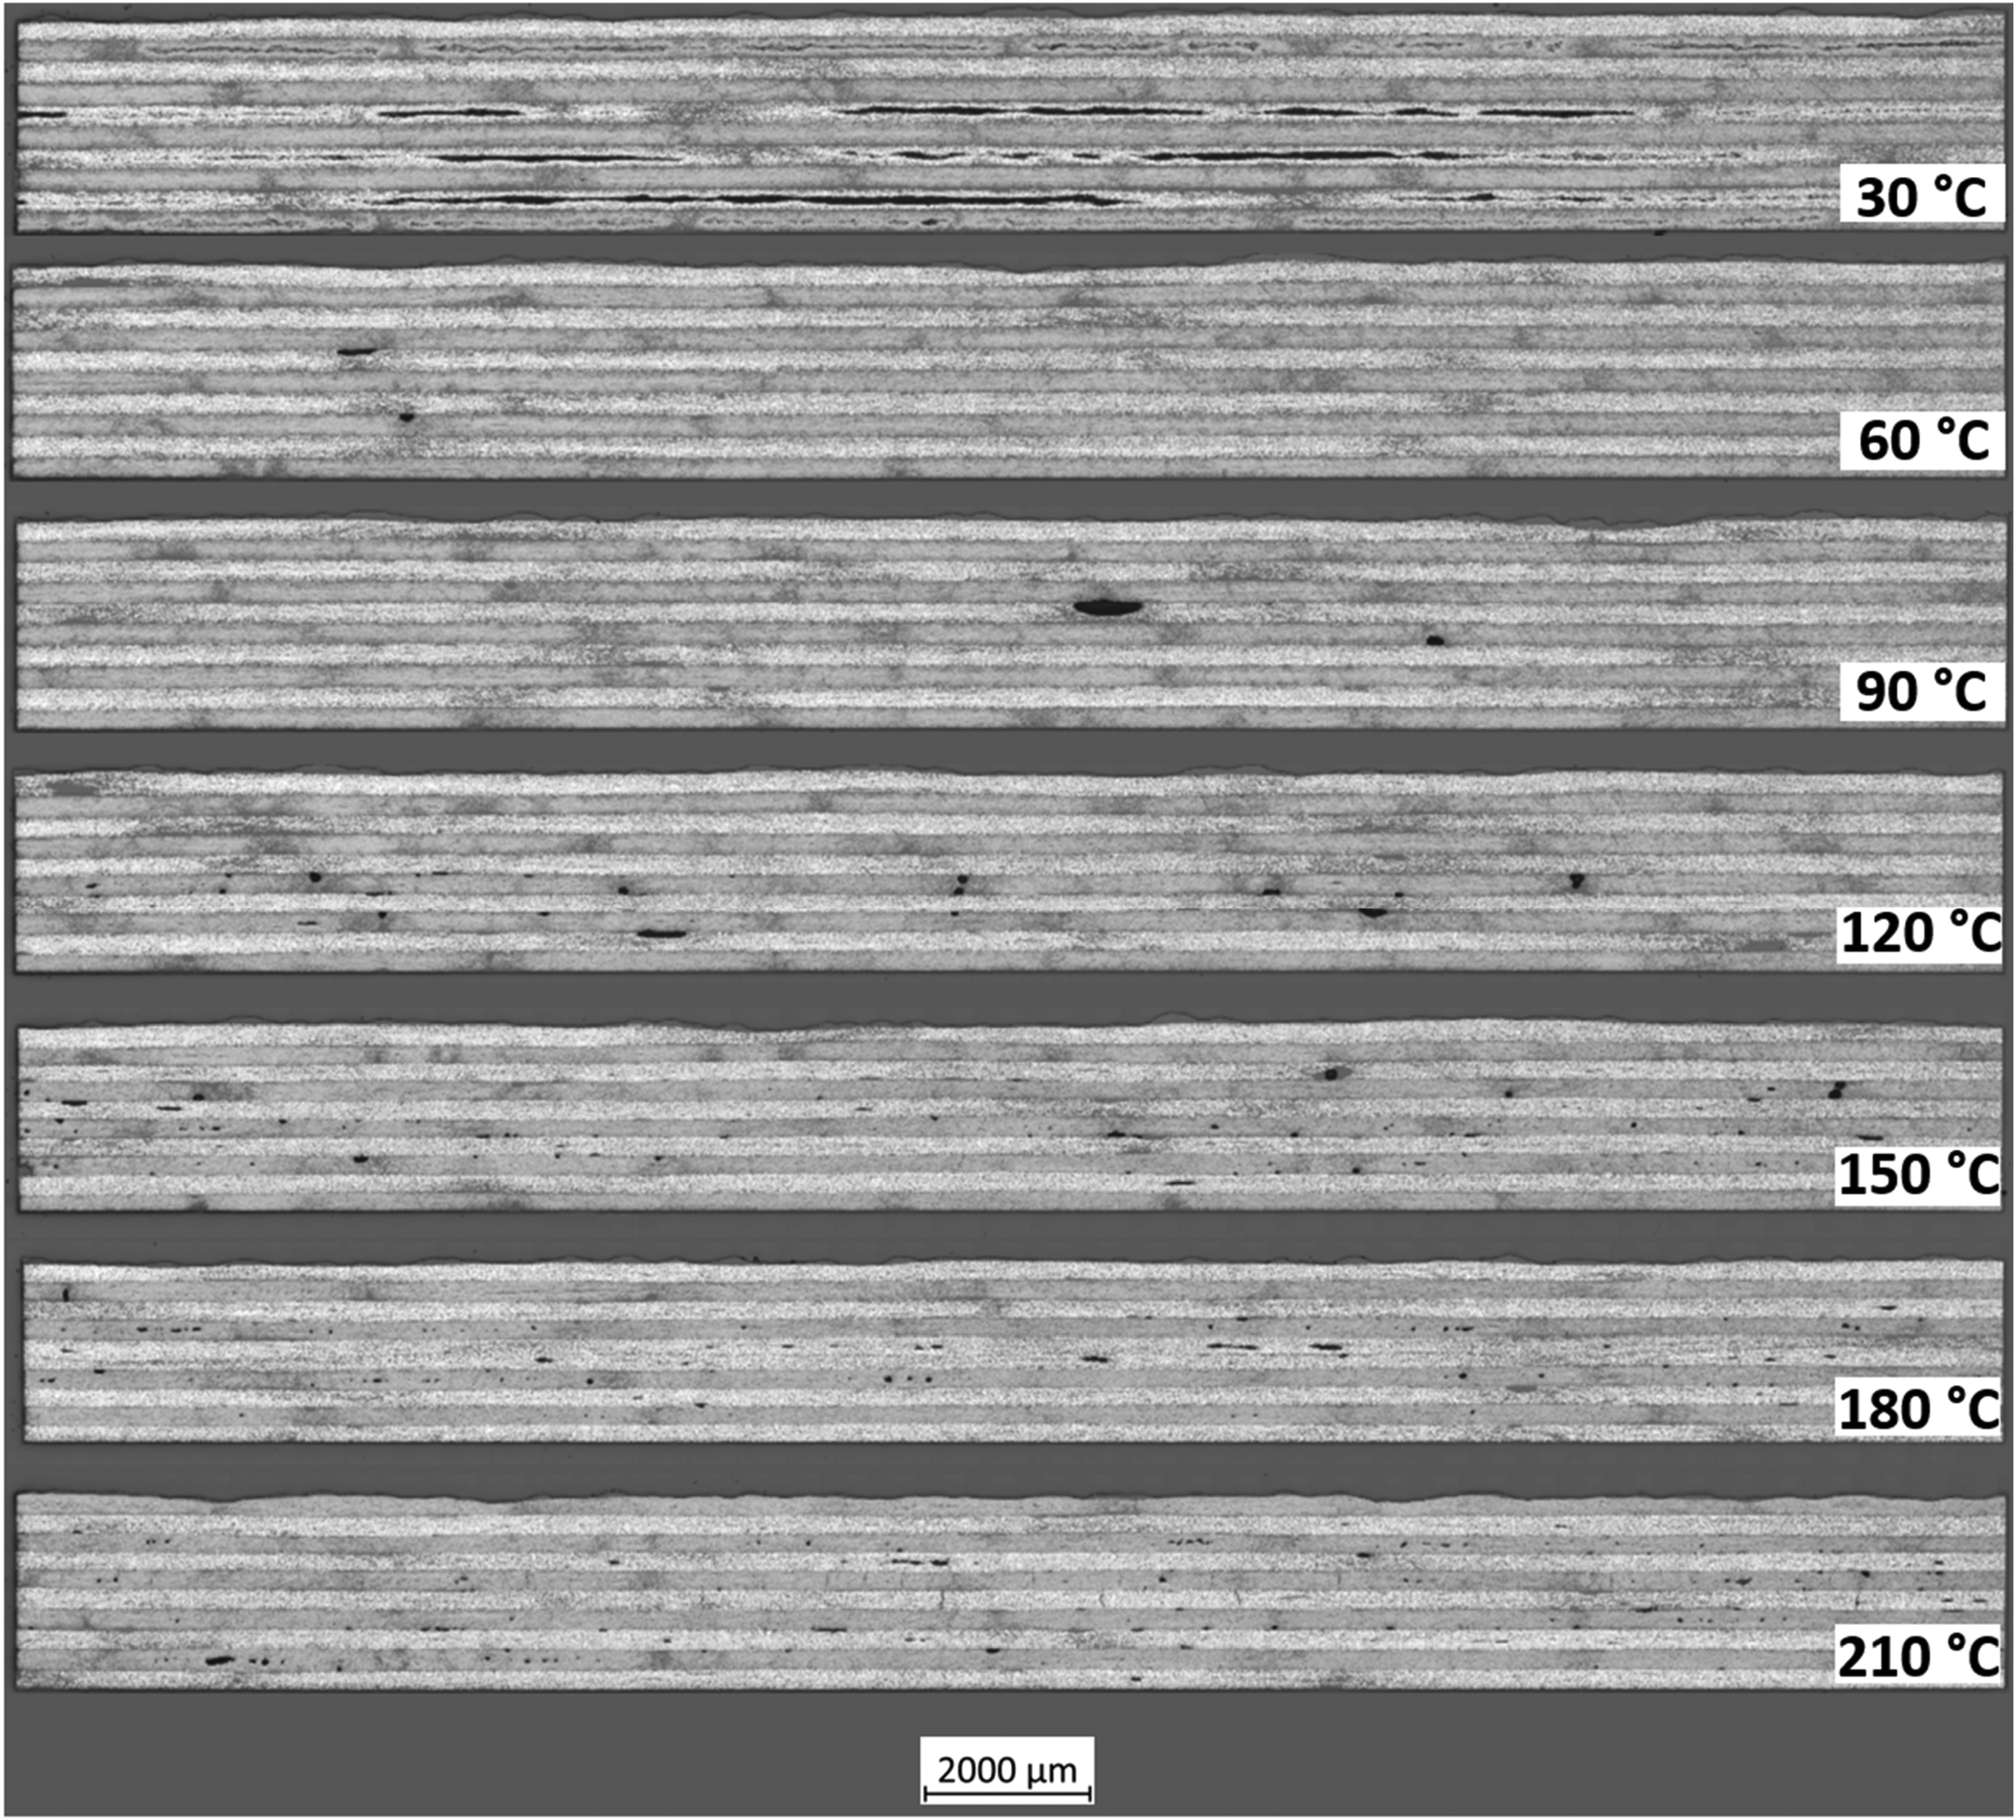
Figure 7 shows the evolution of the microstructure in the middle of the samples. The presented micrographs have been taken from samples after the oven heat treatment step.
The same observations as earlier can be made: increasing the PBP compaction temperature leads to reduced thickness and void levels in the final components. Moreover, this shows the clear effect of the heat input on the size and distribution of the voids. There are fewer, but bigger voids at lower temperatures (notably the dry areas, still unfilled and visible at 30°C). At higher temperatures, the voids are more numerous, but smaller and more evenly dispersed through the sample.
These observations encourage higher temperature deposition to create preforms where the void size would be less harmful to the final composite properties. 13 However, excessively raising the temperature can be detrimental to the laminate's quality. Indeed, vertical microcracks were observed on the 210°C sample, running through the ply thickness, from one interface to another.
As a side note, it can be observed that a stacking error was made in the 180°C sample. The sixth ply was placed in the same orientation as the fifth ply. As a consequence, this error has had effects on the final thickness of the sample. Indeed, this could have led to fibres from both plies nesting into each other, ultimately producing a thinner sample.
It was intended to redo the sample, but it was not possible to reproduce the same testing conditions (material becoming out of date and changes in the equipment setup). Furthermore, such an error was beneficial to check the reliability of the characterisation techniques, as it was possible to link the drop of thickness in that sample to this particularly outstanding defect (as shown in Figure 9 in the next section). This allows to show that tracking thickness is an applicable method for defect detection.
Ply thickness analysis
The micrographs were also used to determine individual ply thicknesses. Figure 8 shows the results of the process, on the 210°C sample, obtained through Matlab (with the ‘Grabit’ function, allowing to put points on an image, and then extract coordinates as a table to make a plot). This process of annotating the interfaces was cumbersome and time-consuming. Automatic ply detection processes 38 would facilitate such analyses and will be encouraged in future works.
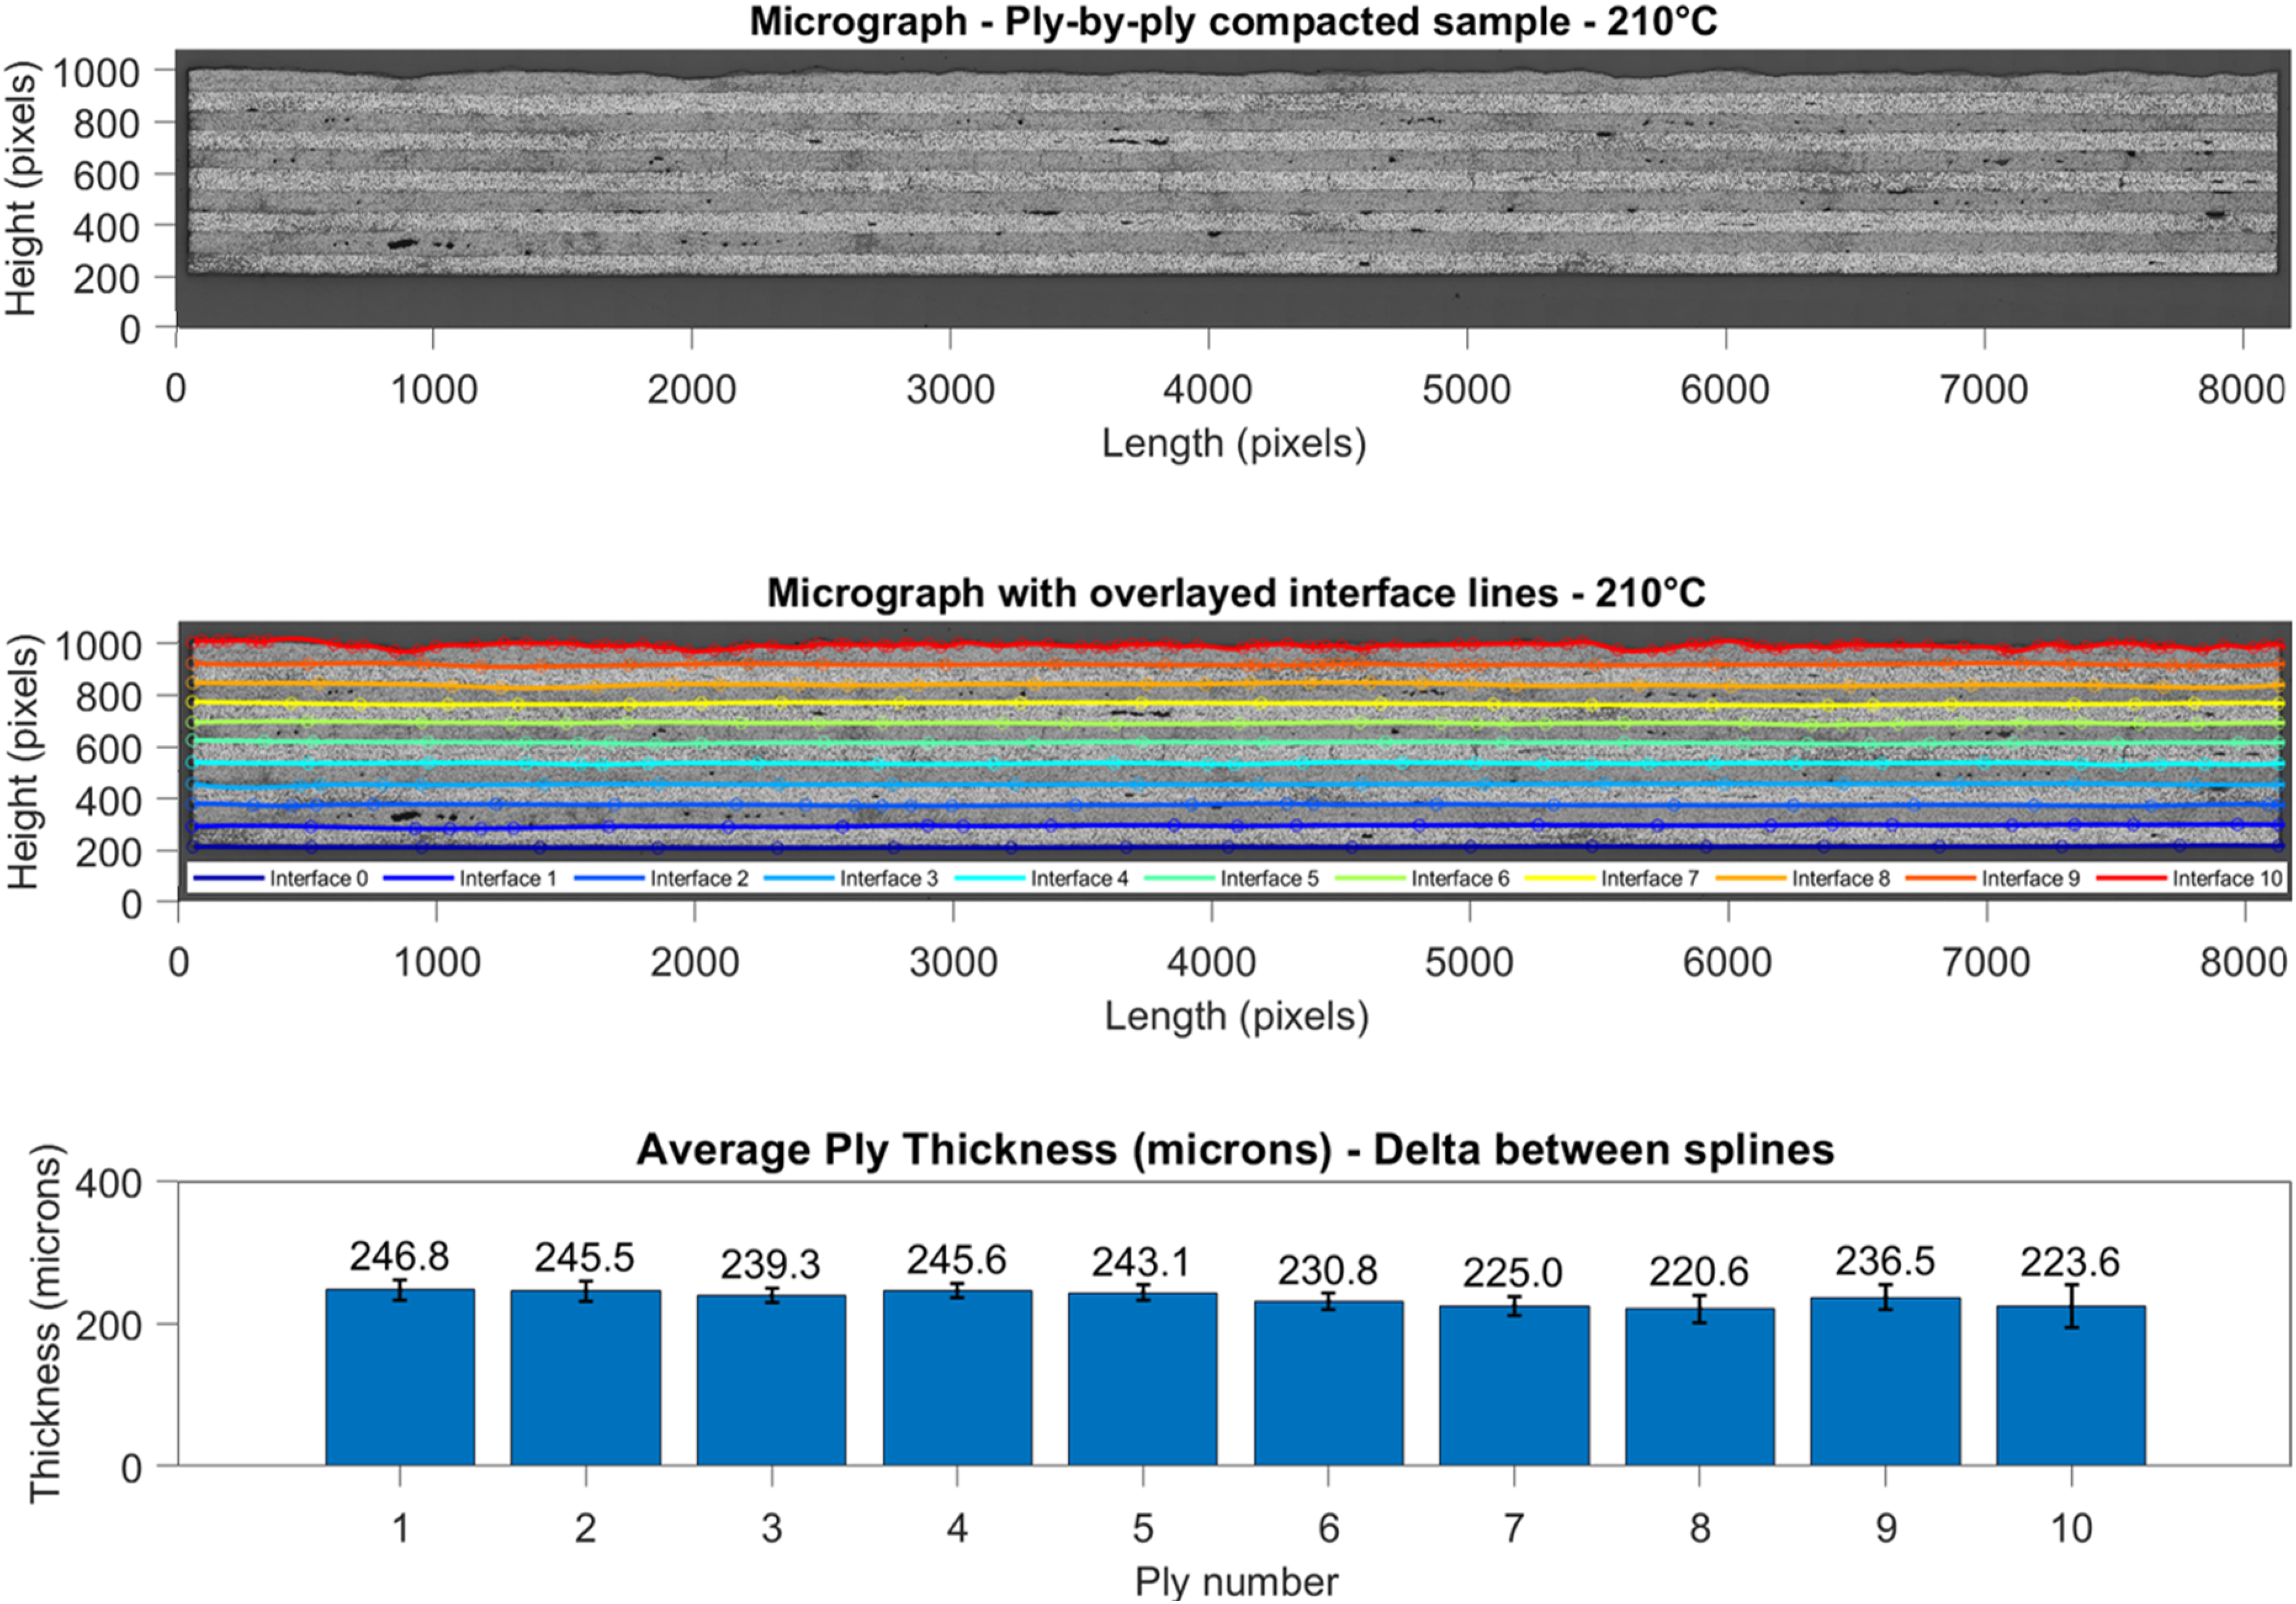
Interface identification process to evaluate average ply thickness (210°C micrograph).
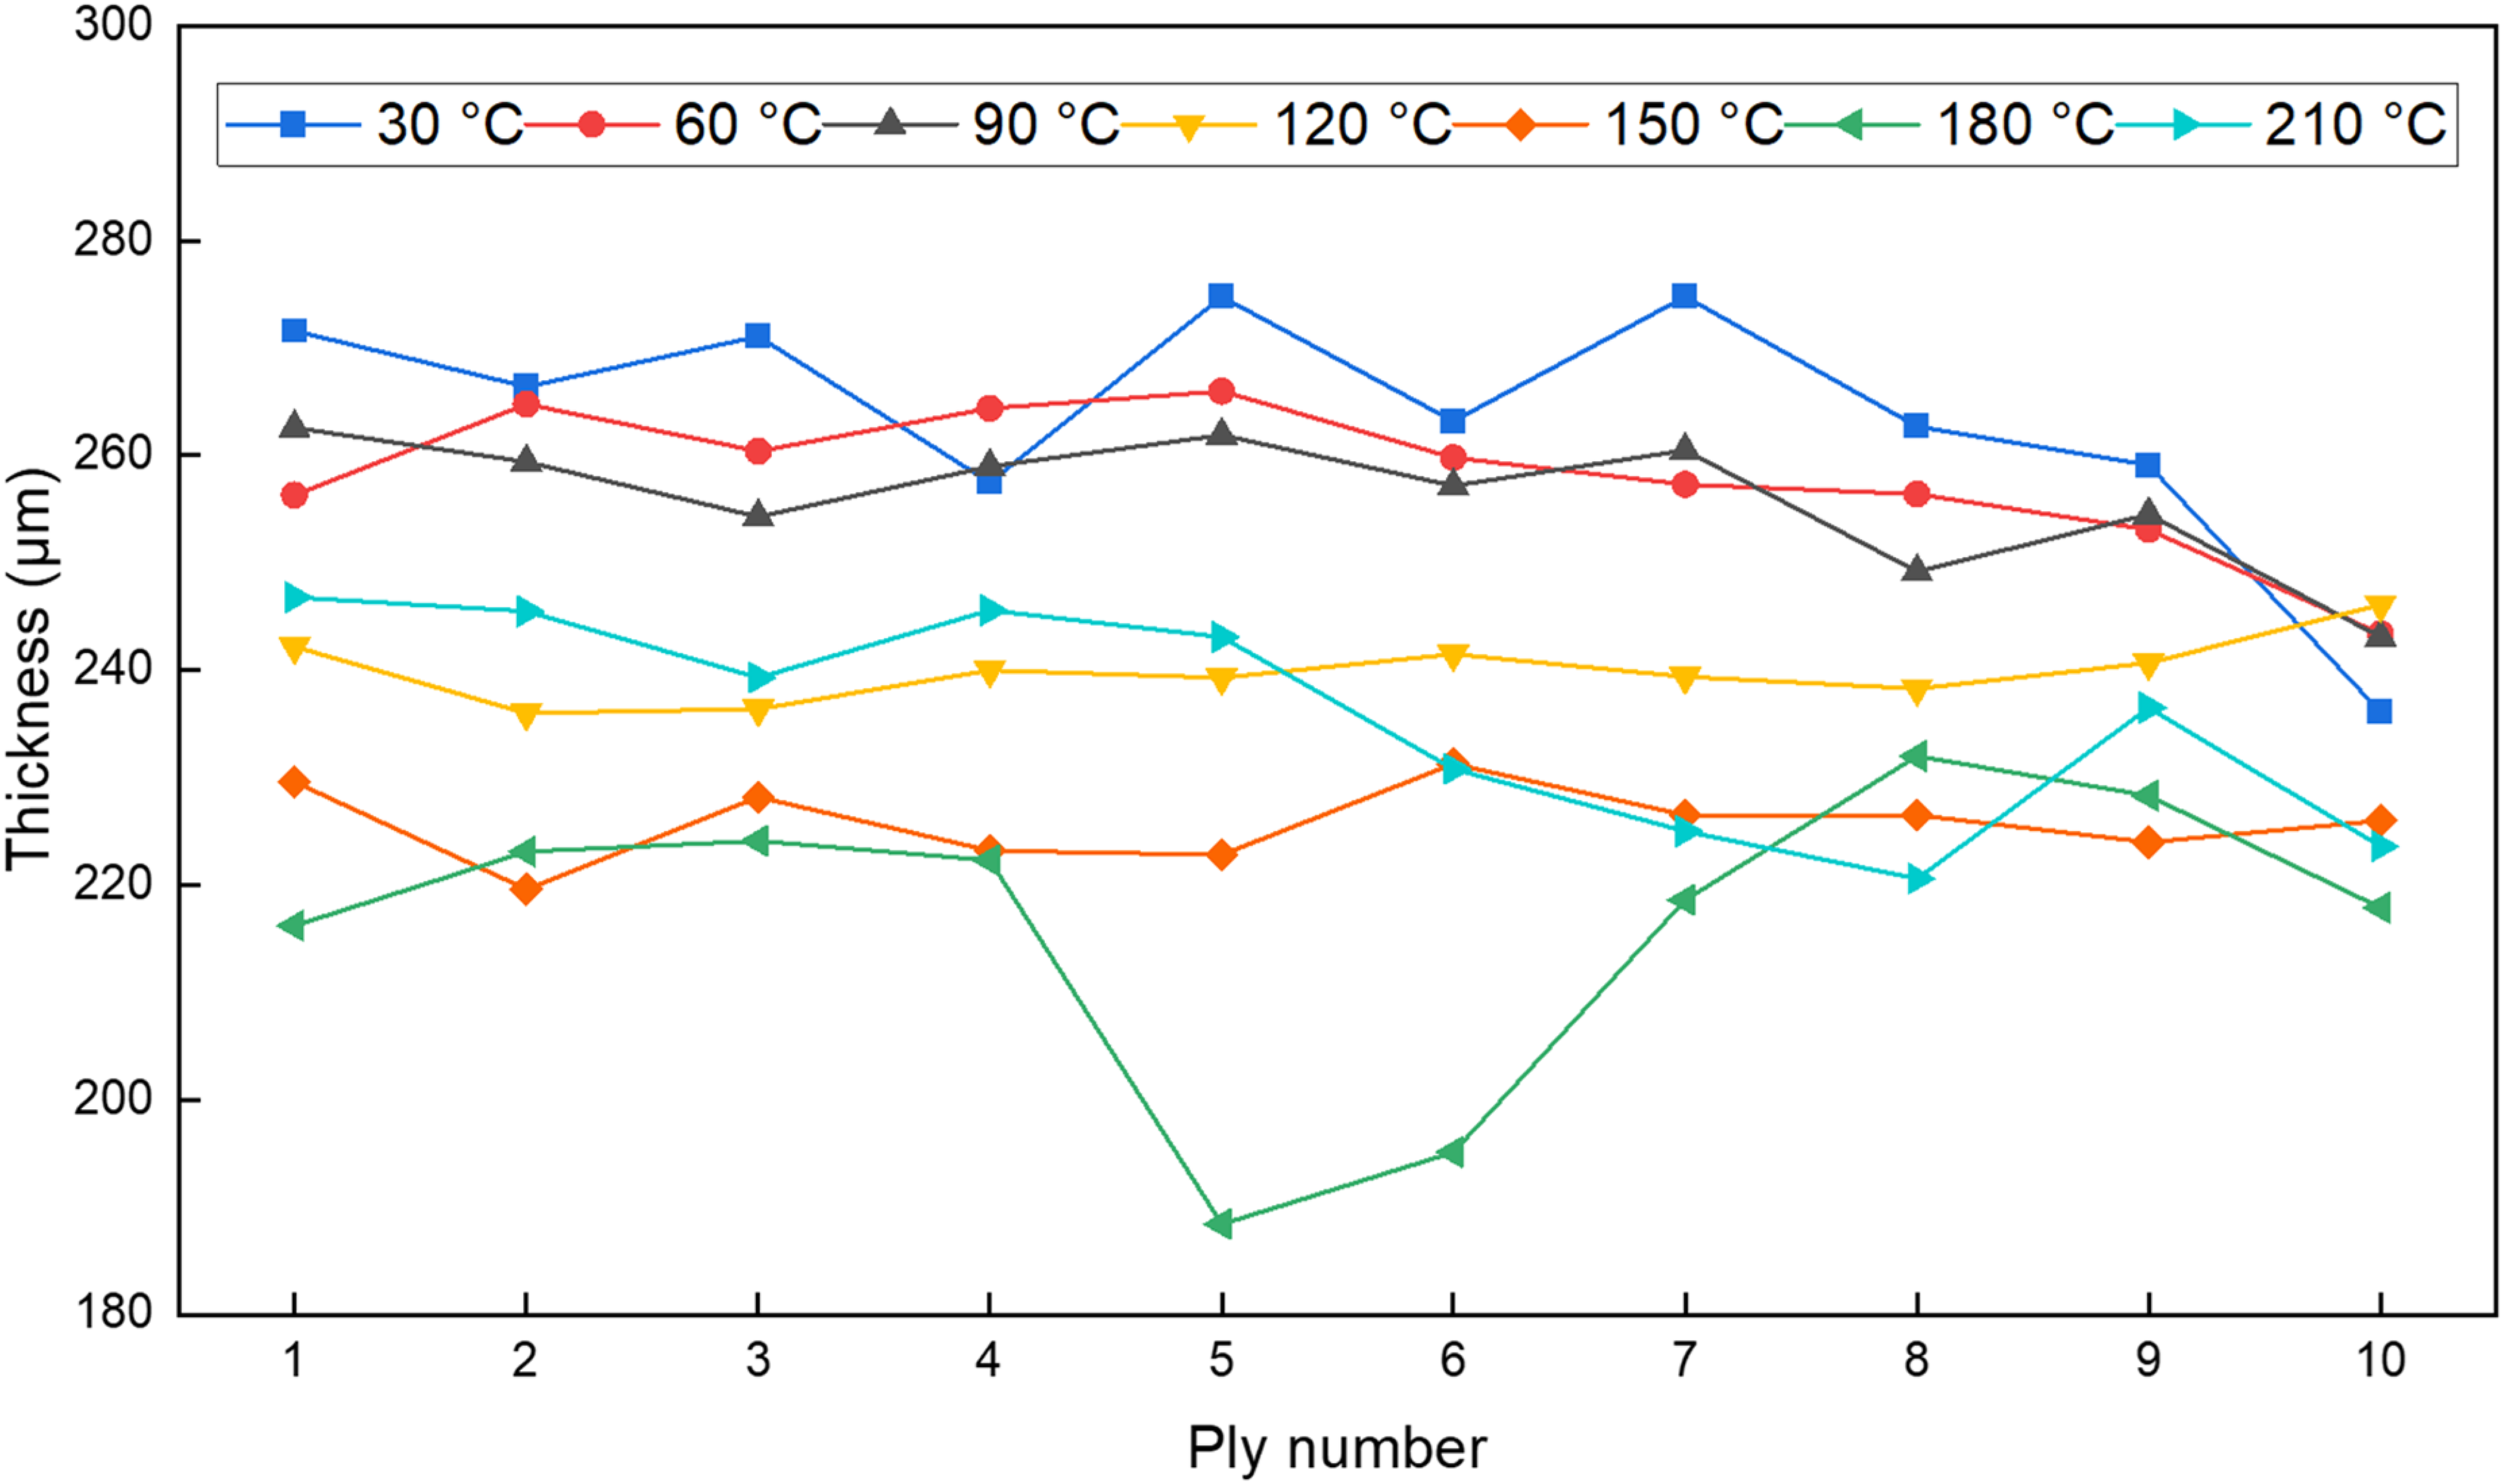
Evolution of ply thickness after post-cure (average measured from micrographs).
The values of the ply thickness indicated in the figure are averages estimated from each point of the interface splines, with standard deviation error bars. It was expected that the first ply would show a different result and be thinner than the rest of the laminate, as it was exposed to an increasing number of compaction cycles whilst not being fully cured. It appears that the ply thicknesses appear to be similar across the sample, for each test temperature. The thickness of the last ply (Ply 10), however, needs to be considered with caution as it was in contact with the bagging consumables during the final oven curing step. The decrease in thickness recorded is due to the fact that resin-rich regions on top of the ply were not considered. This is also the reason for the higher standard deviation error bar seen on this ply, which outlines the highly uneven surface.
When comparing the thicknesses from one test temperature to another (Figure 9), it can be seen that low-temperature PBP compaction tests lead to higher ply thicknesses (average of 264 microns for 30°C) and that higher temperatures generate thinner plies. This trend stays true up to 150°C. After this, the 180°C sample displays the behaviour of an outlier because of the stacking error. The 210°C sample also appears to behave differently and the material reacting too quickly to the heat and pressure (thus leading to the microcracking) is believed to be the cause.
Conclusion
The aim of this study was to answer the following question: “Is it possible to create composite parts in one step, with slow-curing OOA thermoset prepregs that contain air evacuation channels, using an in-situ manufacturing method?” The answer is no.
The results of the investigation suggest that the IM7/M56 would not be suitable for such a dynamic on-line consolidation process, as it did not show enough reactivity through the compaction processes. Indeed, the thicknesses and void levels kept evolving after the secondary heating step (during which the resin was still flowing), leading to believe that the samples were not fully cured. Aerospace sector manufacturers need to accurately control the part thickness through production and not being able to lock in the thickness and the microstructure with the selected parameters meant that this material is not suited for a one-step cure-consolidation approach.
The compaction response of the considered thermosetting OOA prepreg was analysed at ambient and also elevated temperatures, well above those normally used in AFP deposition. Consolidating the prepreg plies at a higher temperature than usual (90–120°C) led to lower thicknesses and reduced voidage levels. The focus on thickness evolution during PBP compaction showed that increasing the processing temperature led to a decrease in both ply thickness and overall sample thickness. A trend could be identified and an average thickness difference of 6.1% was recorded between the pre-oven and post-oven states of the 10-ply samples, showing that the resin could still flow after PBP compaction.
However, while a one-step process with simultaneous deposition consolidation and curing may not be achievable, an improved two-step process may be feasible by using higher deposition temperatures than those being used today. This study shows that on-line consolidation of thermosetting prepregs into a void-free preform during deposition at 90–120°C could enable lower cost OOA curing methods, through Vacuum Bag Only processing in a conventional oven, by reducing thickness and voids to a certain extent.
Such an alternative would allow the creation of components of satisfactory quality while mitigating cost and production rate issues. However, in the pursuit of in-situ manufacturing with thermosetting prepregs, a few options still remain. Future works will then focus on analysing more reactive thermoset prepregs, on dynamic testing setups that are more representative of AFP processing.
Footnotes
Acknowledgements
The authors would like to acknowledge the support of Rolls-Royce plc through the Composites University Technology Centre (UTC) at the University of Bristol and the Engineering and Physical Sciences research Council CoSEM Centre for Doctoral Training (EP/S021728/1), Future Composites Manufacturing Research Hub (EP/P006701/1) and the National Research Facility for Lab X-ray CT (NXCT) at the µ-VIS X-ray Imaging Centre, University of Southampton (EP/T02593X/1). The support received is gratefully acknowledged.
Declaration of conflicting interests
The authors declared no potential conflicts of interest with respect to the research, authorship, and/or publication of this article.
Funding
The authors disclosed receipt of the following financial support for the research, authorship, and/or publication of this article: This work was supported by the Engineering and Physical Sciences Research Council (grant numbers EP/P006701/1, EP/S021728/1, EP/T02593X/1).