
Abstract
Conductive polymer composites (CPCs) are promising alternatives to metal conductive materials due to their light-weight and low-cost. This work investigates the effect of the crystallization behavior of the matrix on the electrical property of CPCs, where semi-crystalline polypropylene (PP) and amorphous styrene-butadiene-styrene tri-block copolymer (SBS) are selected as a matrix, respectively, and conductive carbon black (CB) particles are introduced into matrixes by melting blending. Based on the electrical properties of CPCs with various CB contents and percolation theory, the percolation threshold of 1.8 vol% in PP matrix composites is obtained, much lower than that of SBS matrix composites (5.4 vol%). The analysis with a polarizing microscope and differential scanning calorimeter confirms that such a significant difference in percolation threshold between two composites is due to the crystallization behavior while the crystallization induced segregated structure is proposed. Finally, the rheology behaviors and mechanical properties are characterized for microstructures and applications, respectively.
Keywords
Introduction
With the development of material modification research, many polymer materials possess serval unique properties, so the practical application fields of polymers in industry and life have been further expanded. For example, polymer materials can break through the traditional concept of insulation and explore its application in conductivity, such as wearable electronics, flexible electronics, and antistatic and electromagnetic interference shielding materials,1–7 owing to their low cost, easy operation, and superior thermal properties.8–12 The most frequent method used to fabricate conductive polymer composites (CPCs) is introducing the conductive fillers into various polymeric matrices, whether the matrix and fillers contain a single component or multiple components. And for the CPCs consisting of the insulating matrices and conductive fillers, the electrical conductivity or resistivity versus filler content is generally described by the percolation theory.13,14 Thus, regardless of the composition, structure and phase morphology of matrix material, the critical filler concentration called percolation threshold decreasing the resistivity of polymers by many orders of magnitude is highly concerned, which also characterizes the difficulty of forming a conductive network.13,15 It is always an essential goal to minimize the percolation threshold of CPCs, since the low percolation threshold can lower the cost and avoid that introducing too many fillers to destroy the excellent properties of the matrix.14,16
As reported for CPCs, the high conductivity can be obtained by the optimal option of various resins used as matrix materials, like polypropylene (PP), styrene-butadiene-styrene tri-block copolymer (SBS), polydimethylsiloxane, polyvinyl chloride, polyaniline and high-density polyethylene.3,8,17–20 It also depends on the selection of effective conductive filler, such as carbon black (CB), carbon nanotube, carbon fibers and graphene (GE),19,21–25 and the design of phase structure, e.g., segregated structure, double percolation structure and sandwich structure.17,26,27 The matrix materials as the main component of CPCs play a decisive role in overall properties, and the electrical property primarily depends on the dispersion state of conductive filler, so many research reports about matrix components and the distribution of filler spring up. For the compact distribution of filler which can transfer charges effectively, it is necessary to adjust the matrix components and construct an excellent microstructure. Li et al. 28 showed that SBS/GE composites can achieve an ultralow percolation threshold of 0.12 vol% by constructing a conductive network with three dimensions, while the mechanical properties obtained reinforcement compared to the pure SBS, like the rubber strengthening effect. Thermoplastic elastomer SBS possesses many advantages including stretchability and durability and can achieve the improvements in several properties simultaneously, which is valuable and worthy to study. Also, P. Costa et al. 29 investigated the effect of the butadiene/styrene ratio on the electrical conductivity of SBS/multi-walled carbon nanotube composites and showed the minimal percolation threshold of 5 wt %. There are reports about designing multiphase compositions to realize superior conductivity. Tu et al. 30 illustrated that the processing sequences affected the distribution of filler and caused the difference in electrical and mechanical properties for graphene/polyethylene/PP composites, and showed the lowest percolation threshold of 0.83 vol% when the filler was mainly distributed at the PP phase.
Besides, various effective phase structures are proposed and constructed leading to some unexpectedly superb results occasionally. Gong et al. 31 established a novel structure containing both continuous and segregated phases in PP/polystyrene/CB composites to achieve the percolation threshold of 0.37 vol%. Moreover, Al-Saleh et al.32,33 investigated the effect of the PP/polystyrene ratio and introducing SBS on CB distribution in PP/polystyrene matrix, and found that the CB preferred to locate at the interface between PP and polystyrene which markedly reduced the threshold by about 40% with introducing 5 vol% SBS. And there was an affinity between CB and polybutadiene section in SBS contributing to CB uniform distribution. For the multi-matrix composites with excellent comprehensive performances, it is essential to ensure and reduce the threshold value of each matrix component and the threshold range of composites. Additionally, the microstructure regulation of the matrix is necessary to be investigated which affects the filler location, so the existence of crystallization behavior generating special crystalline structure is also worthy to study. While both polymers with or without crystallization behavior appear in abundant research, there is a pronounced distinction between the two types of polymers when used as the matrix. And the comparative researches which contribute to preparing excellent conductive composites with the matrix containing both two kinds of polymers are relatively rare.
In this work, to highlight the significant distinction in conductivity modification caused by the existence of the crystal structure in the matrix, the one studied polymer is homopolymerized PP with a high degree of crystallinity. In the meantime, typical thermoplastic elastomer SBS is selected as a contrast. The rubber phase comprised of soft polybutadiene chains is continuous and polystyrene chains acting as hard microdomains are dispersed into the rubber phase, so the unordered molecular chains with big side groups result in the absence of crystallization behavior for SBS. Therefore, PP and SBS are used as the matrix materials and CB as conducting filler is introduced into the matrices by mixing blending, to comparatively investigate the influence of crystallization behavior on electrical properties. Based on the percolation theory, the differences in the electrical properties of PP/CB and SBS/CB composites are understood well, where PP/CB composites display superiority in not only the resistivities but also the percolation thresholds. Besides, the existing crystalline behaviors of PP/CB composites are identified and investigated by differential scanning calorimeter results and the more desirable dispersion state of CB compositions in the PP matrix is observed by the optical morphologies. The rheology measurements are used to illustrate the formation state of the intrinsic conductive network and evaluate the processibility of the composites. Additionally, the mechanical properties are measured for assessing the viability in practical applications and reflecting the difference in internal structure. The results illustrate that the crystallization behavior in PP contributes to conductivity modification and the mechanical properties of SBS/CB composites obtain enhancement at the suitable CB content due to the unique interaction between SBS and CB, and both two composites have potential for the applications.
Experimental section
Materials preparation
PP (Category: 040-2, density: 0.9 g/cm3, melt flow rate: 5 g/10 min under 2.16 kg load at 230 °C) was purchased from Jinling Petrochemical Co., Ltd, China. SBS (Category: 4412, density: 0.94 g/cm3, melt flow rate: 0.1 g/10 min under 5 kg load at 200 °C, the compositional mass ratio: S/B = 40/60) was supplied by Baling Petrochemical Co., Ltd, China. CB (Category: AC-80, particle diameter range: 20–50 nm, density: 1.8 g/cm3, dibutyl phthalate absorption value: 380–460 mL/100 g, nitrogen absorption special surface area: 800 m2/g) was obtained from Chezacarb Co., Ltd, Czech. For the processing additives, both the antioxidant (IrganoxB215) and zinc stearate were commercially available, and the former acted as a stabilizer while the latter was used as an external lubricant.
Samples preparation
Depending on matrix materials, all samples were divided into PP/CB and SBS/CB composites. To maintain the desirable stability and lubrication in the processing, the dosages of antioxidant and zinc stearate were determined as 0.5 and 1 wt% for the matrix material, respectively. The CB particles were introduced into the matrices and got the homogenous distribution by melt blending at 180 °C on the two rollers mixer (SK 160B, Shanghai Rubber Machinery Works, Shanghai, China), and thus the sheet molding compounds were obtained. Keeping the total volume of matrix and filler constant, for the PP/CB composites, the CB volume fractions of seven samples prepared were increased from 0 to 6 vol% with 1 vol% variation. For the SBS/CB composites, six samples varying the volume fraction of CB from 0 to 10 vol% with 2 vol% variations were obtained first, and then three samples with the CB percentages of 4.5, 5, and 5.5 vol% were prepared to determine the threshold more accurately. All the specimens were pressed into plates with 2 mm thickness regularly by hot molding on the plate vulcanizing machine (XLB-D 350 × 350 × 2, Shanghai First Rubber Machinery Factory, Shanghai, China) at 180 °C. The samples were named as PP/ x vol% CB and SBS/ x vol% CB, respectively, where the x represented the CB volume fraction for the matrix.
Characterization
Electrical properties
According to the test range of measurement machines and pursuing high accuracy in electrical resistance values (R) of composites, a digital multimeter (VC98A+, Shenzhen Victor Co., Ltd, China) and a high-resistance meter (ZC-36, Shanghai Precision and Scientific Instrument Co., Ltd, China) were used to measure the resistance of the composites with resistance R

Crystallization property
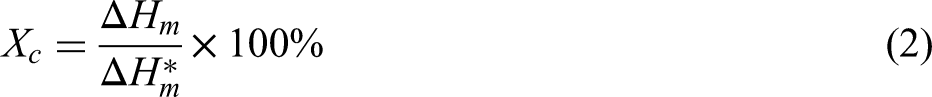
Through a differential scanning calorimeter (DSC, Discovery DSC 25, TA, America) in a dry nitrogen atmosphere, the crystallization and melting behaviors of composites were recorded. Each sample was first heated from room temperature to 200 °C at the heating rate of 40 °C/min and stayed at 200 °C for 1 min to erase the heat history. Then each sample was cooled to 20 °C at the cooling rate of 5 °C/min to obtain the crystallization curve and held for 1 min, then heated again from 20 °C to 200 °C at the heating rate of 10 °C/min to achieve the melting curve. Based on the DSC results, the crystallinities of both composite materials (Xc) and PP component in the composites (
Dispersion analysis of CB in polymeric matrix
For all the composites, the morphologies were observed by the optical microscope (NP-800RF/TRF, Nanjing Jiangnan Optical Co., Ltd, China) in the mode of transmission and the method for evaluating the CB distribution states in the matrixes was referred to ISO 18553:2002. To observe the crystallization structure of PP, polarized light was applied. All the standard samples with a mass of 0.25 ± 0.05 mg and thickness of 20 ± 10 μm were pressed out to the ultra-thin film at 180 °C.
Rheology behaviors
The difference in the intrinsic microstructure of samples was verified by the dynamic plate rheometer (MCR302, Anton Paar, Graz, Austria) in rheological properties. Dynamic frequency sweep was carried out in the angular frequency range of 0.02–100 rad/s under the 1% strain at 180 °C for the whole wafer composites with a diameter of 23 mm and thickness of 2 mm.
Mechanical properties
The tensile properties of the samples were measured by the laboratory universal testing machine (CMT 5254, Shenzhen SANS Testing Machine Co., Ltd, China) with a testing rate of 5 mm/min at room temperature, and all the samples were annealed at 70 °C for 2 h.
Results and discussion
Comparative electrical properties between PP/CB and SBS/CB composites
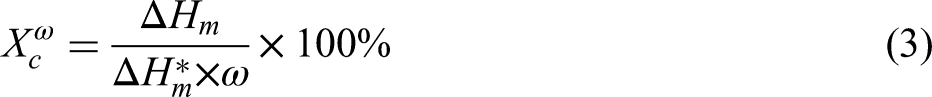
The electrical conductivity of CPCs was gradually optimized due to the increasing content of conducting filler CB, and the variation trend in the conductivity of CPCs could be comprehended by studying the percolation theory. Thus, an understanding of percolation theory and threshold was of great importance, since when the filler fraction reached a critical value called percolation threshold, the CPCs became electrically conductive from the insulating state and its conductivity got improved dramatically. Figure 1 shows the volume resistivities of PP/CB and SBS/CB composites with the CB fraction variation. Generally, depending on the experimental conductive data, the theoretical percolation thresholds of two systems could be calculated by the Equation (4) fitting:
36

The volume resistivities and fitted percolation thresholds of PP/CB and SBS/CB composites
Based on the percolation threshold, the relationship curve between the conductivity of CPCs and filler content could be separated into several parts, which was also reflected in Figure 1 clearly. When the volume fraction of CB is very low, the volume resistivity of CPCs was highly close to that of the pure matrix since CB particles existed as an isolated state in the matrix, like islands. With the increasing filler loading, the agglomeration of CB particles and inter-particle contact initially occurred. Once the volume fraction of CB reached the percolation threshold, the agglomeration and inter-particle contact occurred on lots of particles, prompting adjacent particles to form a percolation network. Clearly, the calculated theoretical percolation threshold of PP/CB composites was 1.8 vol%, much lower than that of SBS/CB composites about 5.4 vol%, which could be identified by the significant plunges occurring at the CB content range of 1–2 vol% and 4.5–6 vol% for PP/CB and SBS/CB composites, respectively. The CPCs accomplished the transition from insulator to conductor because of the presence of internal pathways for transporting electrons. However, the resistivity of the PP/CB composite dropped four orders of magnitude with a CB content of 2 vol% while SBS/CB composite still maintained insulating. And the PP/CB composite got a resistivity of 10 Ω.m with a CB fraction of 4 vol%, which was much lower than 1014 Ω.m for the SBS/CB composite. Thus, the conductive PP/CB composites could be obtained by introducing fewer CB particles to form the conductive network easily, though the volume resistivities of pure PP and SBS were about 1015 Ω.m. And a dramatic decrease in volume resistivity could be observed as CB content exceeded the percolation threshold, due to the gradual enhancement and stabilization of the conductive network structure. When CB content was very high, the volume resistivity of CPCs was no longer reduced significantly because of the saturated state of CB, and the electrical conductivity was the most optimum at this time. It was observed that the resistivity of the PP/CB composite was about 10−1 Ω.m with a CB content of 6 vol%, which was also smaller than the SBS/CB composite by about four orders of magnitude. The above distinctions between the two composites were mainly ascribed to the matrix microstructures. The good symmetry and arrangement neatly of the PP polymer chain resulted in the formation of crystals and influenced the distribution of CB which were reflected in the following DSC results and optical morphologies. For PP/CB composites, CB particles would tend to distribute in the amorphous region because the polymer chains were tightly packed in the crystalline regions, so the conductive network formation required lower CB loading or a more complete conductive network formed at the same content. Differently, SBS with the homogenous composition and structure was responsible for the relatively uniform and loose CB distribution state in the entire polymeric region. Thus, the higher CB loading in SBS was needed to reduce the resistance and distance between inter-particles.
Structural characterizations and mechanistic insights of the electrical property
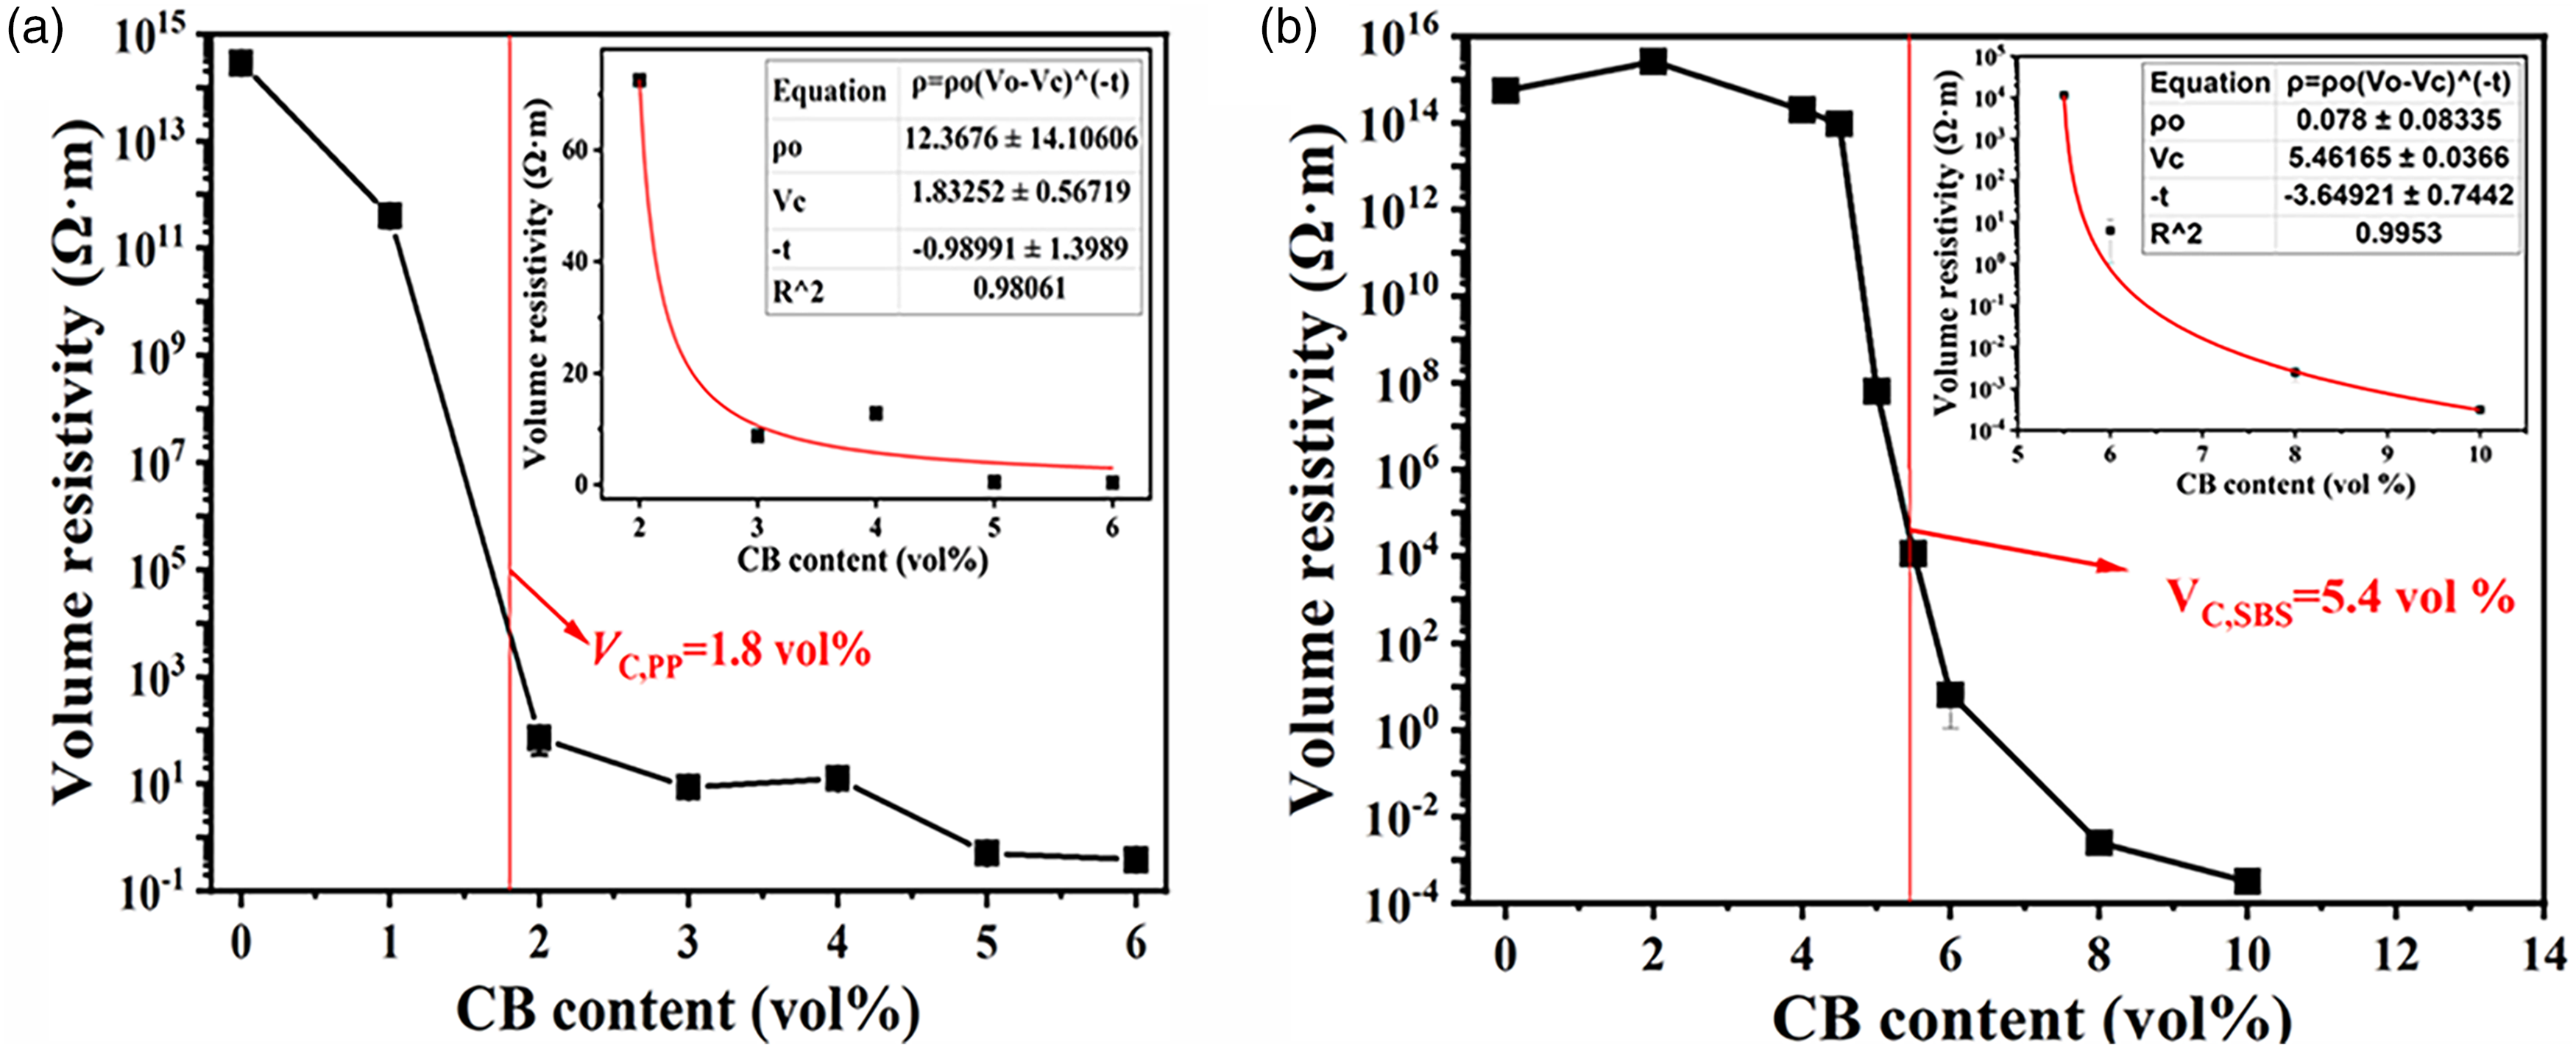
The volume resistivities decreased with increasing filler loading but the difference in descent rates highly depended on the CB dispersion states which were observed by the optical microscope and shown in Figures 2 and 3 for PP/CB and SBS/CB composites, respectively. Without CB blending, the perfect spherocrystals with big sizes of pure PP were observed, while it was transparent in pure SBS due to the isotropic structure. As CB loading increased, both the two composites were covered gradually by the CB particles with high amounts. The distances between CB particles in PP got shortened significantly to form the percolated network as the CB volume fraction reached 2 vol% corresponding to the low threshold of about 1.8 vol%. The conductive network was comprised of numerous closely contacted CB particles and agglomerates, and the big agglomerates were mainly dispersed at the locations among the crystals while many small CB particles and agglomerates were distributed in the crystal region. Meantime, the size of spherocrystal became smaller compared to pure PP which could be attributed to the volume exclusion effect or the influence of CB on the nucleation and crystallization of PP. The above phenomenon also appeared in the PP/CB composites with the higher CB fraction, but the amount of CB particles and agglomerates existing at the crystal regions increased remarkably leading to the complete and stable conductive network and a large decline in resistivity. Differently, even though the number of CB particles and agglomerates was not small in the SBS/CB composites as CB content reached 2 vol%, the contact between them was not obvious or close. Without the existence of crystalline structure in SBS, the CB dispersion still appeared to be natural and random despite the influences of the viscosity of SBS and shear force in the preparation. Thus, only a sufficiently high content of CB ensured the close contact among the CB particles and agglomerates to construct the CB network. The marked reduction of the distance among CB particles and agglomerates appeared in SBS/4 vol% CB and the obvious CB network existed in SBS/6 vol% CB which agreed with the threshold of 5.4 vol%. Therefore, based on the comparisons in CB distribution for the two composites, it was clear that the influence of the appearance of the crystalline structure was high and meaningful.
The optical microscope images of PP/CB composites
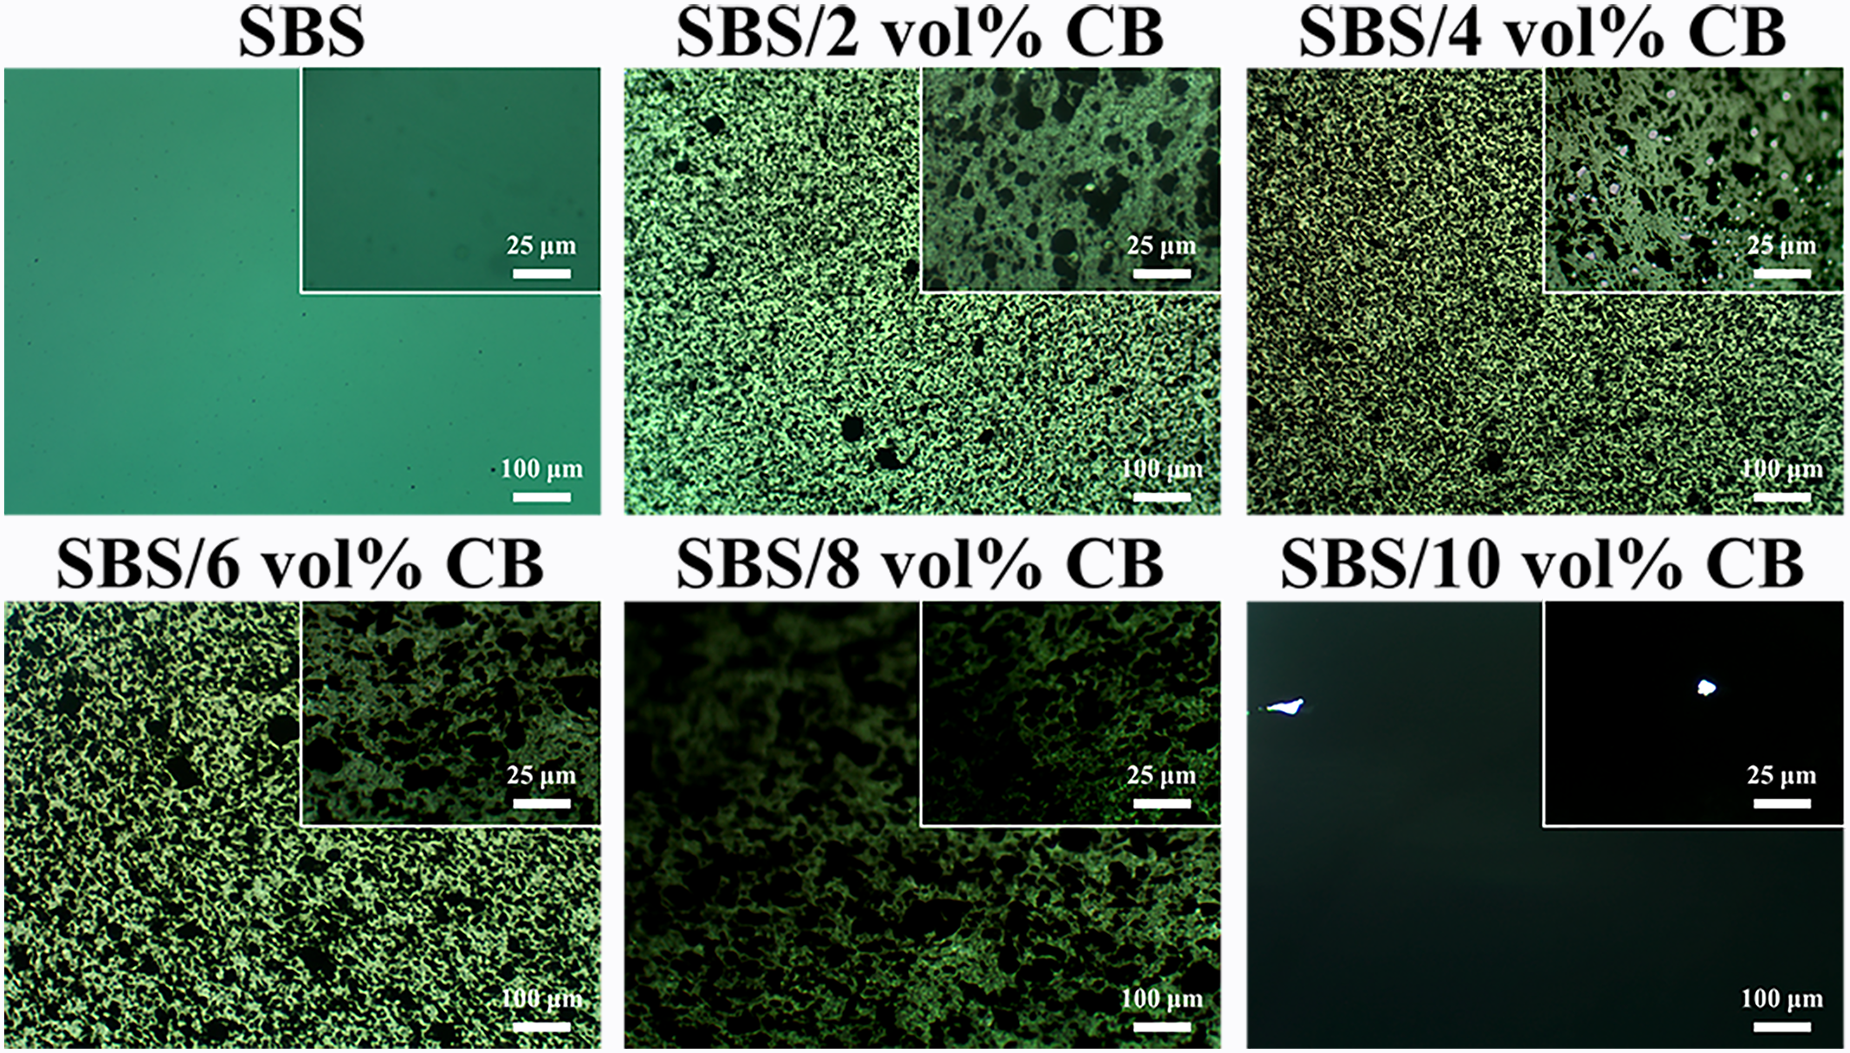
The optical microscope images of SBS/CB composites
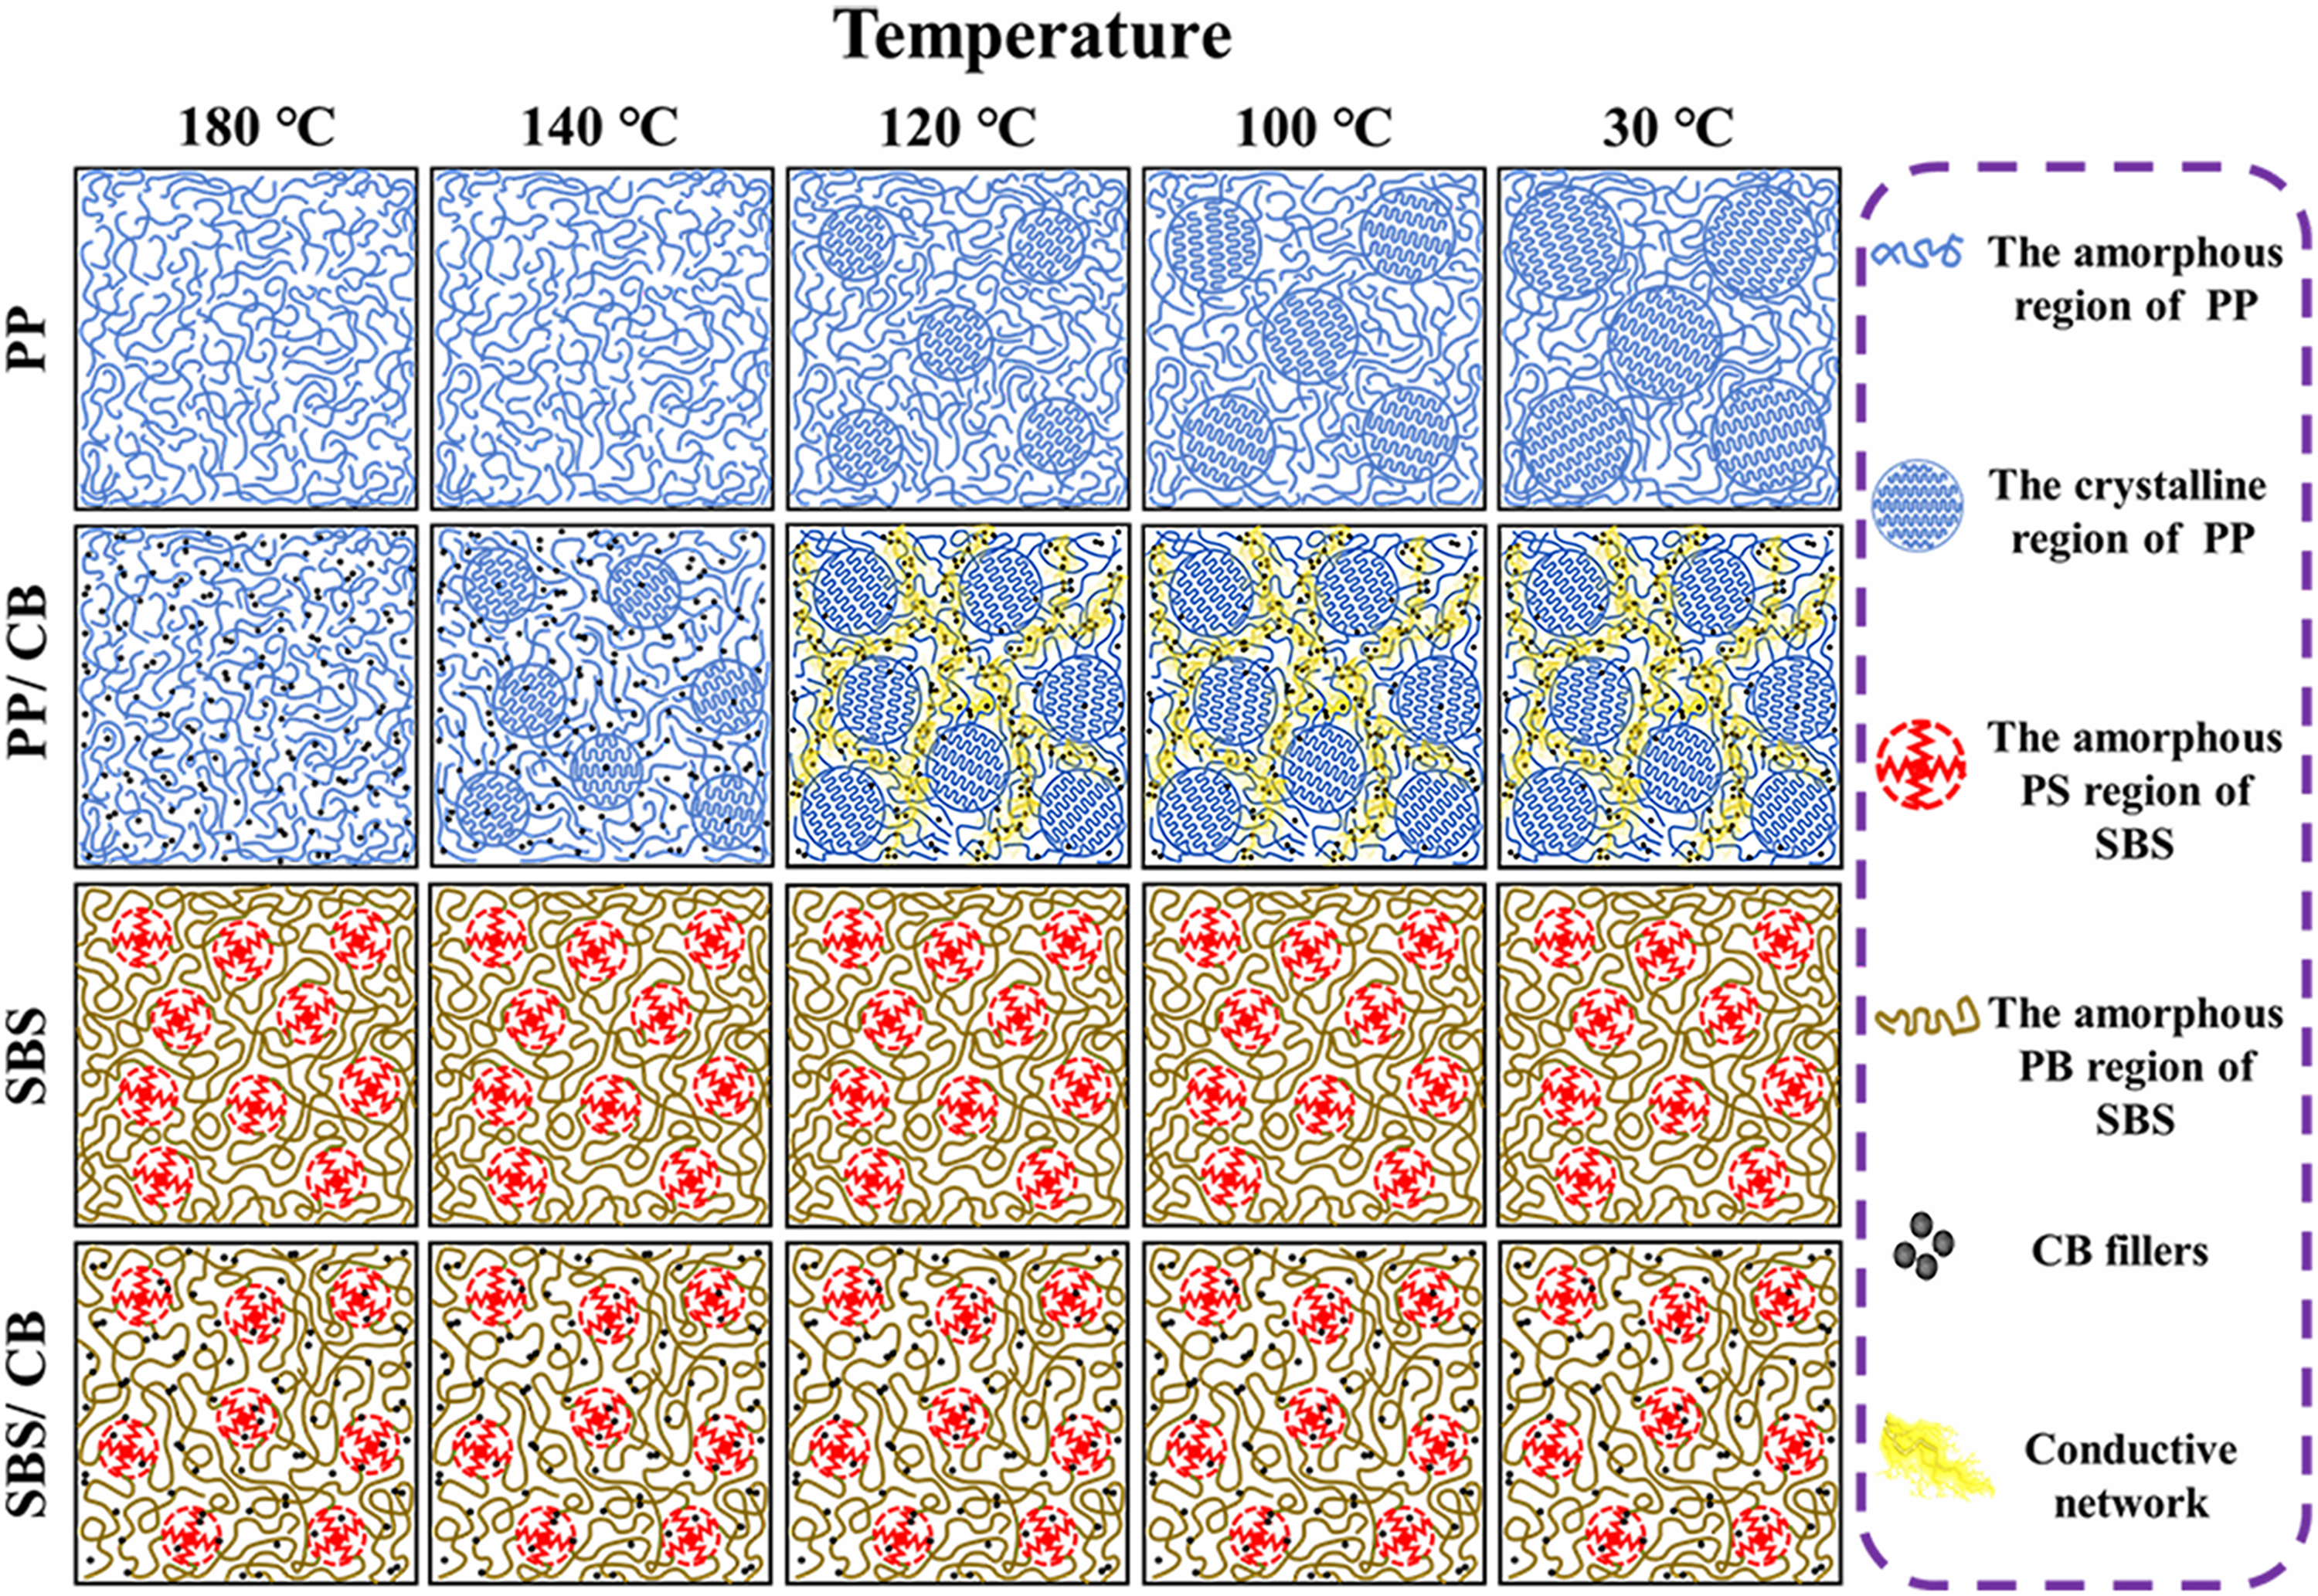
To understand the effect of crystalline structure on CB dispersion and conductive network construction more vividly, the diagrams of PP/CB and SBS/CB composites were shown in Figure 4. The morphologies of the pure matrices and filled composites with two respective percolation thresholds were displayed, where the volume exclusion effect was considered and the sizes of crystals were referred to the optical morphologies and crystallinity in DSC results. 37 Thus, the crystallization behavior was affected by loading CB particles and the sizes of spherulites became smaller compared to pure PP. Moreover, the CB particles and agglomerates were mainly distributed at the amorphous region of the PP matrix, so the CB compositions got tighter contact to form a conductive network at the low CB content of 1.8 vol% and the above phenomenon was more pronounced as the CB fraction reached 5.4 vol%. 38 However, the conductive network formation was not easy for the SBS/CB composites with low CB content since the nonexistent crystalline structure and large dispersion region resulted in the incompact contact among the CB compositions. The formation of percolated network appeared until the CB content increased to 5.4 vol%, and the amount of CB particles could cover most parts of SBS at this content. Therefore, there was an interaction that the crystalline structure of PP greatly improved the efficiency of conductive network construction and the formed CB network affected the nucleation or crystal growth of PP in turn. Based on a portion of the percolated network in PP/CB composites distributed at the sites among the crystals, it seemed like a segregated structure formed by crystallization.
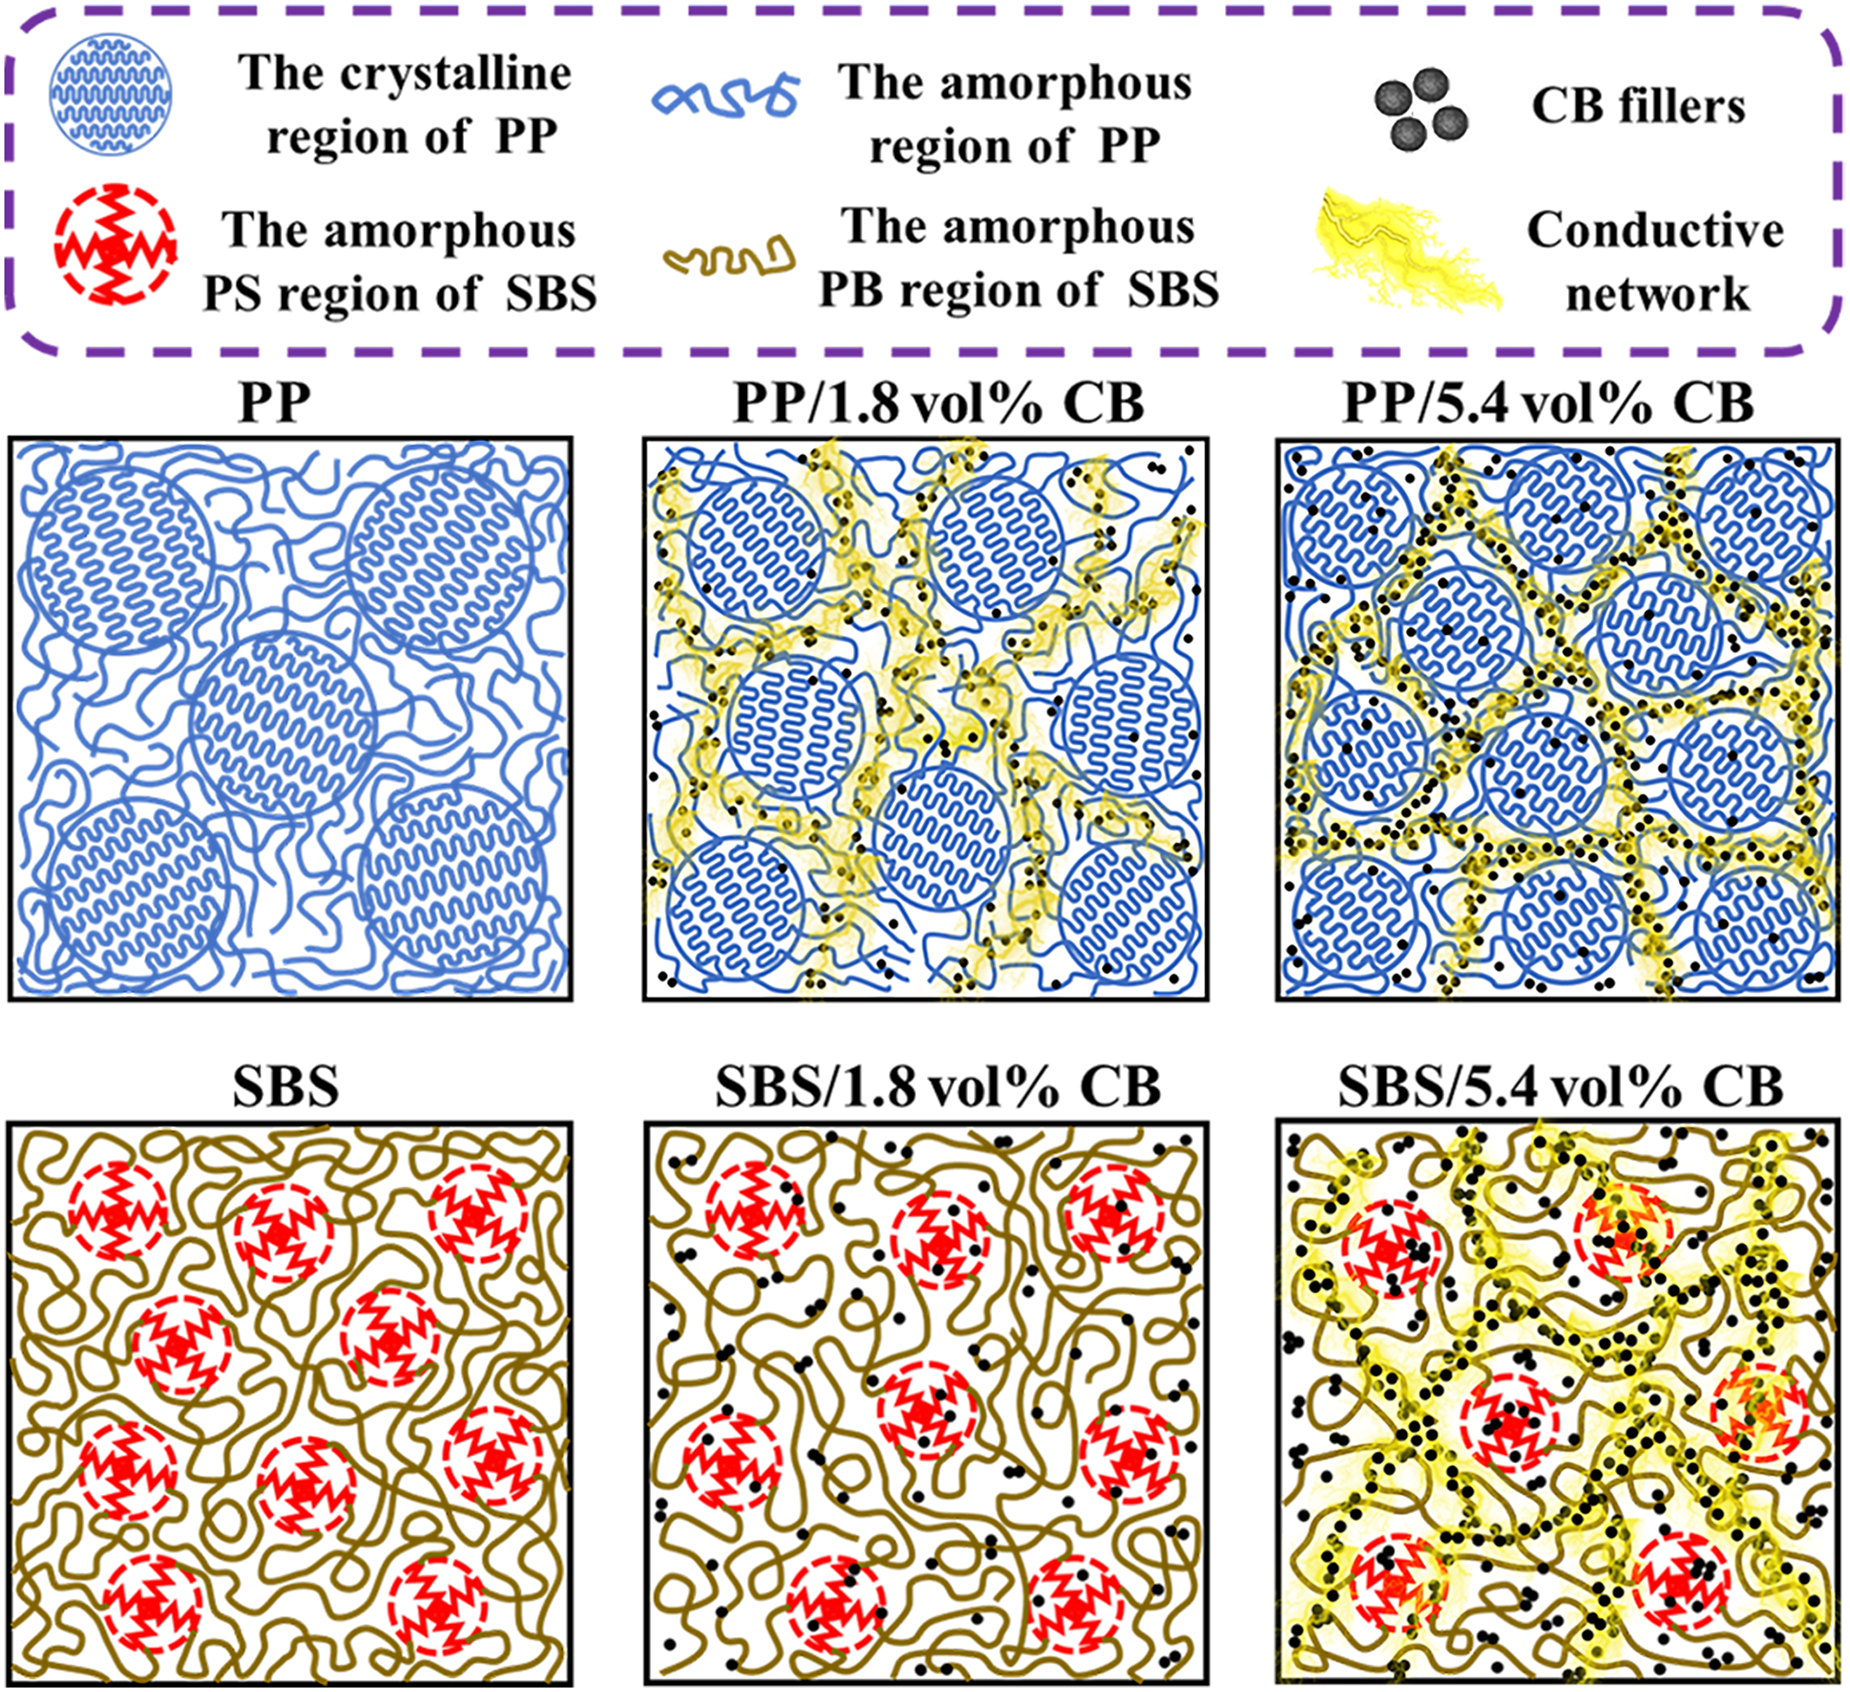
Scheme of the morphologies of both PP/CB and SBS/CB composites containing two pure matrices and four filled composites.
To further investigate the distinction in crystallization behavior between the two composites and the detailed influence of CB on crystallization behaviors, the thermal behaviors were measured, as displayed in Figures 5 and 6. There was one clear negative peak appearing in each curve for PP/CB composites which indicated the formation of crystals with a single crystal phase, whilst the curves of all SBS/CB composites showed the tilted line without any peak suggesting the absence of crystallization behavior. Table 1 lists the main parameters of thermal properties for the PP/CB composites. Compared to pure PP, both the crystallization onset temperatures (
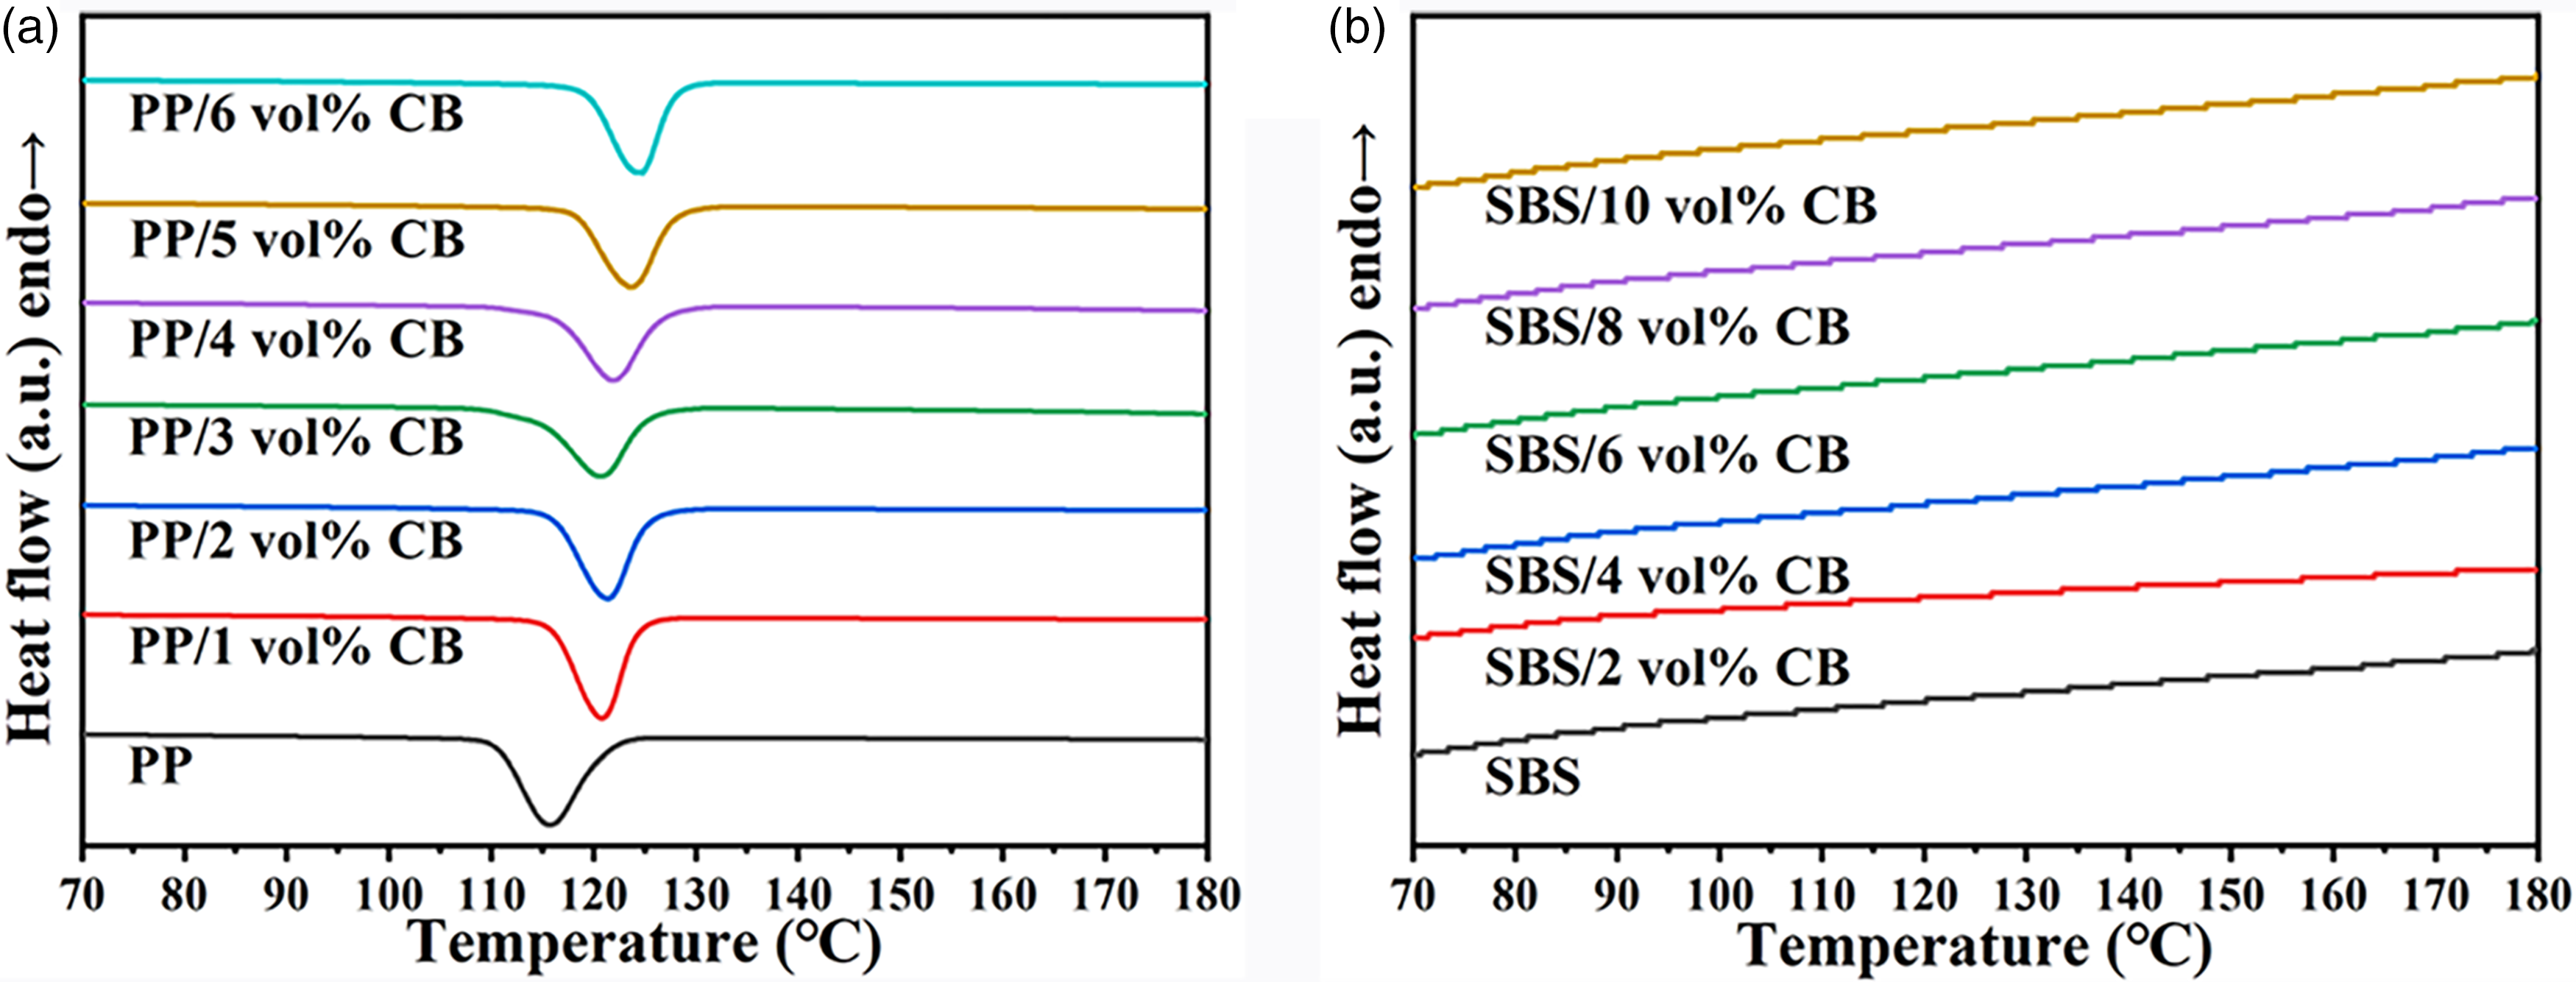
The crystallization behaviors of (a) PP/CB and (b) SBS/CB composites.
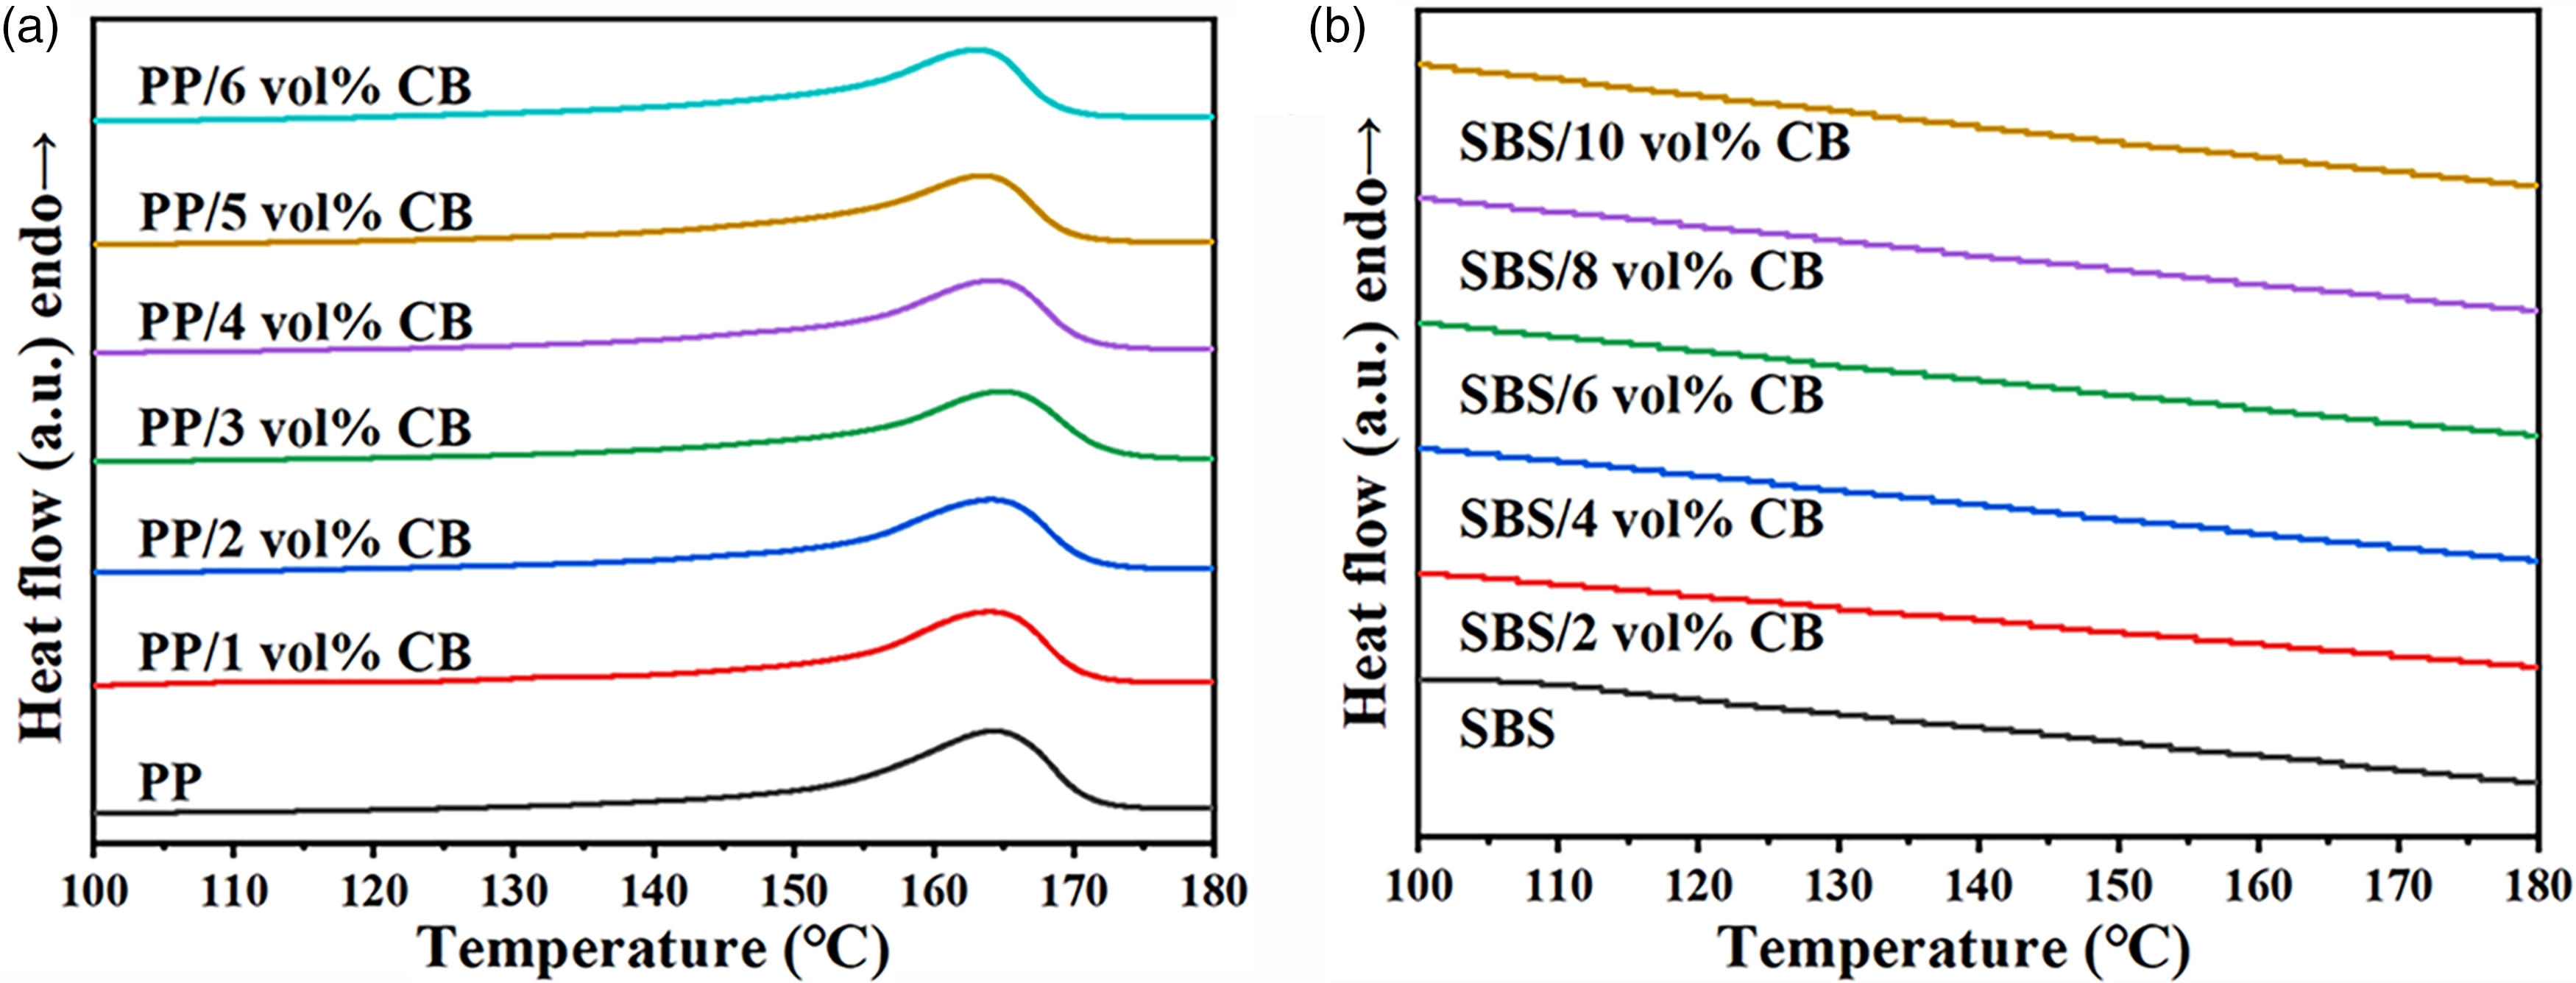
The melting behaviors of (a) PP/CB and (b) SBS/CB composites.
The main parameters of thermal properties for the PP/CB composites
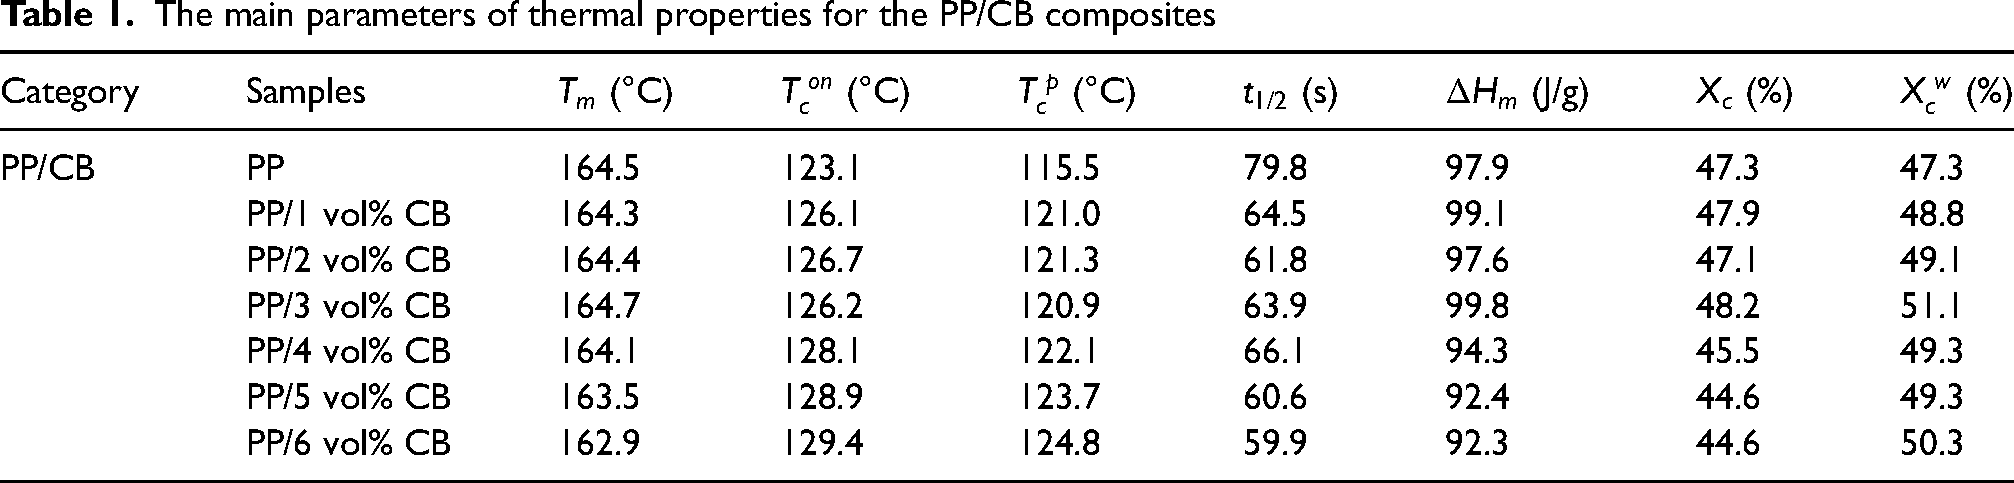
Meanwhile, the half-crystallization time (
To understand the effect of the CB compositions on the crystallization behavior and thermal and electrical properties of the composites clearly, Figure 7 illustrates the morphology variations of four composites including PP, SBS, PP/1.8 vol% CB and SBS/1.8 vol% CB at the temperature range from 30 to 180 °C. All the composites were cooled from the melting state at 180 °C quickly. According to the absence of crystallization behavior of SBS, there was almost no change in the micromorphology of the SBS matrix composites, without any applied external force during the cooling process. For the PP matrix composites, corresponding to higher
Scheme illustration of morphology variations with varying temperature from 180 to 30 °C for the two matrices without loading and with loading of 1.8 vol% CB.
Comparative rheology behaviors between PP/CB and SBS/CB composites
The rheology behavior as one powerful method reflecting the difference in filler network microstructure sensitively contributed to comprehending the relationships between structures and performances of filled composites in the perspective of processing and application.26,30,42,43 Three prominent parameters varied at 180 °C as a function of angular frequency (ω) as shown in Figure 8, where the storage modulus (G′) and loss storage (G″) reflected the energy stored by elastic deformation and the energy lost in the form of heat during materials distortion, respectively, and the complex viscosity (η*) represented the flow resistance measured at the oscillatory state. 43 The effect of the filler network on G′ was most pronounced at low frequencies like forming the plateau. 44 As shown in Figure 8(a) and (c), the G′ of both PP/CB and SBS/CB composites increased constantly with the increasing CB loading, which indicated the gradual construction of the CB network. When the CB volume fraction reached 2 vol%, the PP/CB composites initially displayed a low-frequency plateau which was confirmed by the remarked decrease of slopes of the curve. Nevertheless, the signal plateau was observed in SBS/CB composites as the CB content was as high as 4 vol%.26,30,45,46 In comparison, the higher G′ appeared in SBS/CB composites, which was explained by the larger molecular weight. Specifically, the G′ of PP/2 vol% CB had a significant increment from PP/1 vol% CB at low frequencies which was caused by the formation of the CB network with solid structure, and the same substantial increase of G″ also appeared in Figure 8(b). When the CB fraction reached 4 and 6 vol% in SBS/CB composites, G′ had two large increments in a row, suggesting that the percolated network was under construction at that CB content range which was consistent with the CB dispersion as shown in Figure 3. The same variation also occurred in G″ as shown in Figure 8(d) indicating the restriction effect of CB network on the movements of polymer chains. 46 Thus, the percolation thresholds determined by rheology were following with the electrical conductivity as displayed in Figure 1. Besides, the ratio of G′ and G″ was used to describe the state of composites, and the ratio greater than 1 represents the solid-like behavior like the material with network structure at melting state and the liquid-like system in contrast. 43 G′ is lower than G″ until CB loading reached 2 and 6 vol% for PP/CB and SBS/CB composites, respectively, further verifying the construction of percolated microstructure.43,44,47 Additionally, as CB content increased, the values of G′ and G″ kept bigger tardily, meaning the enhancement of the filler network.
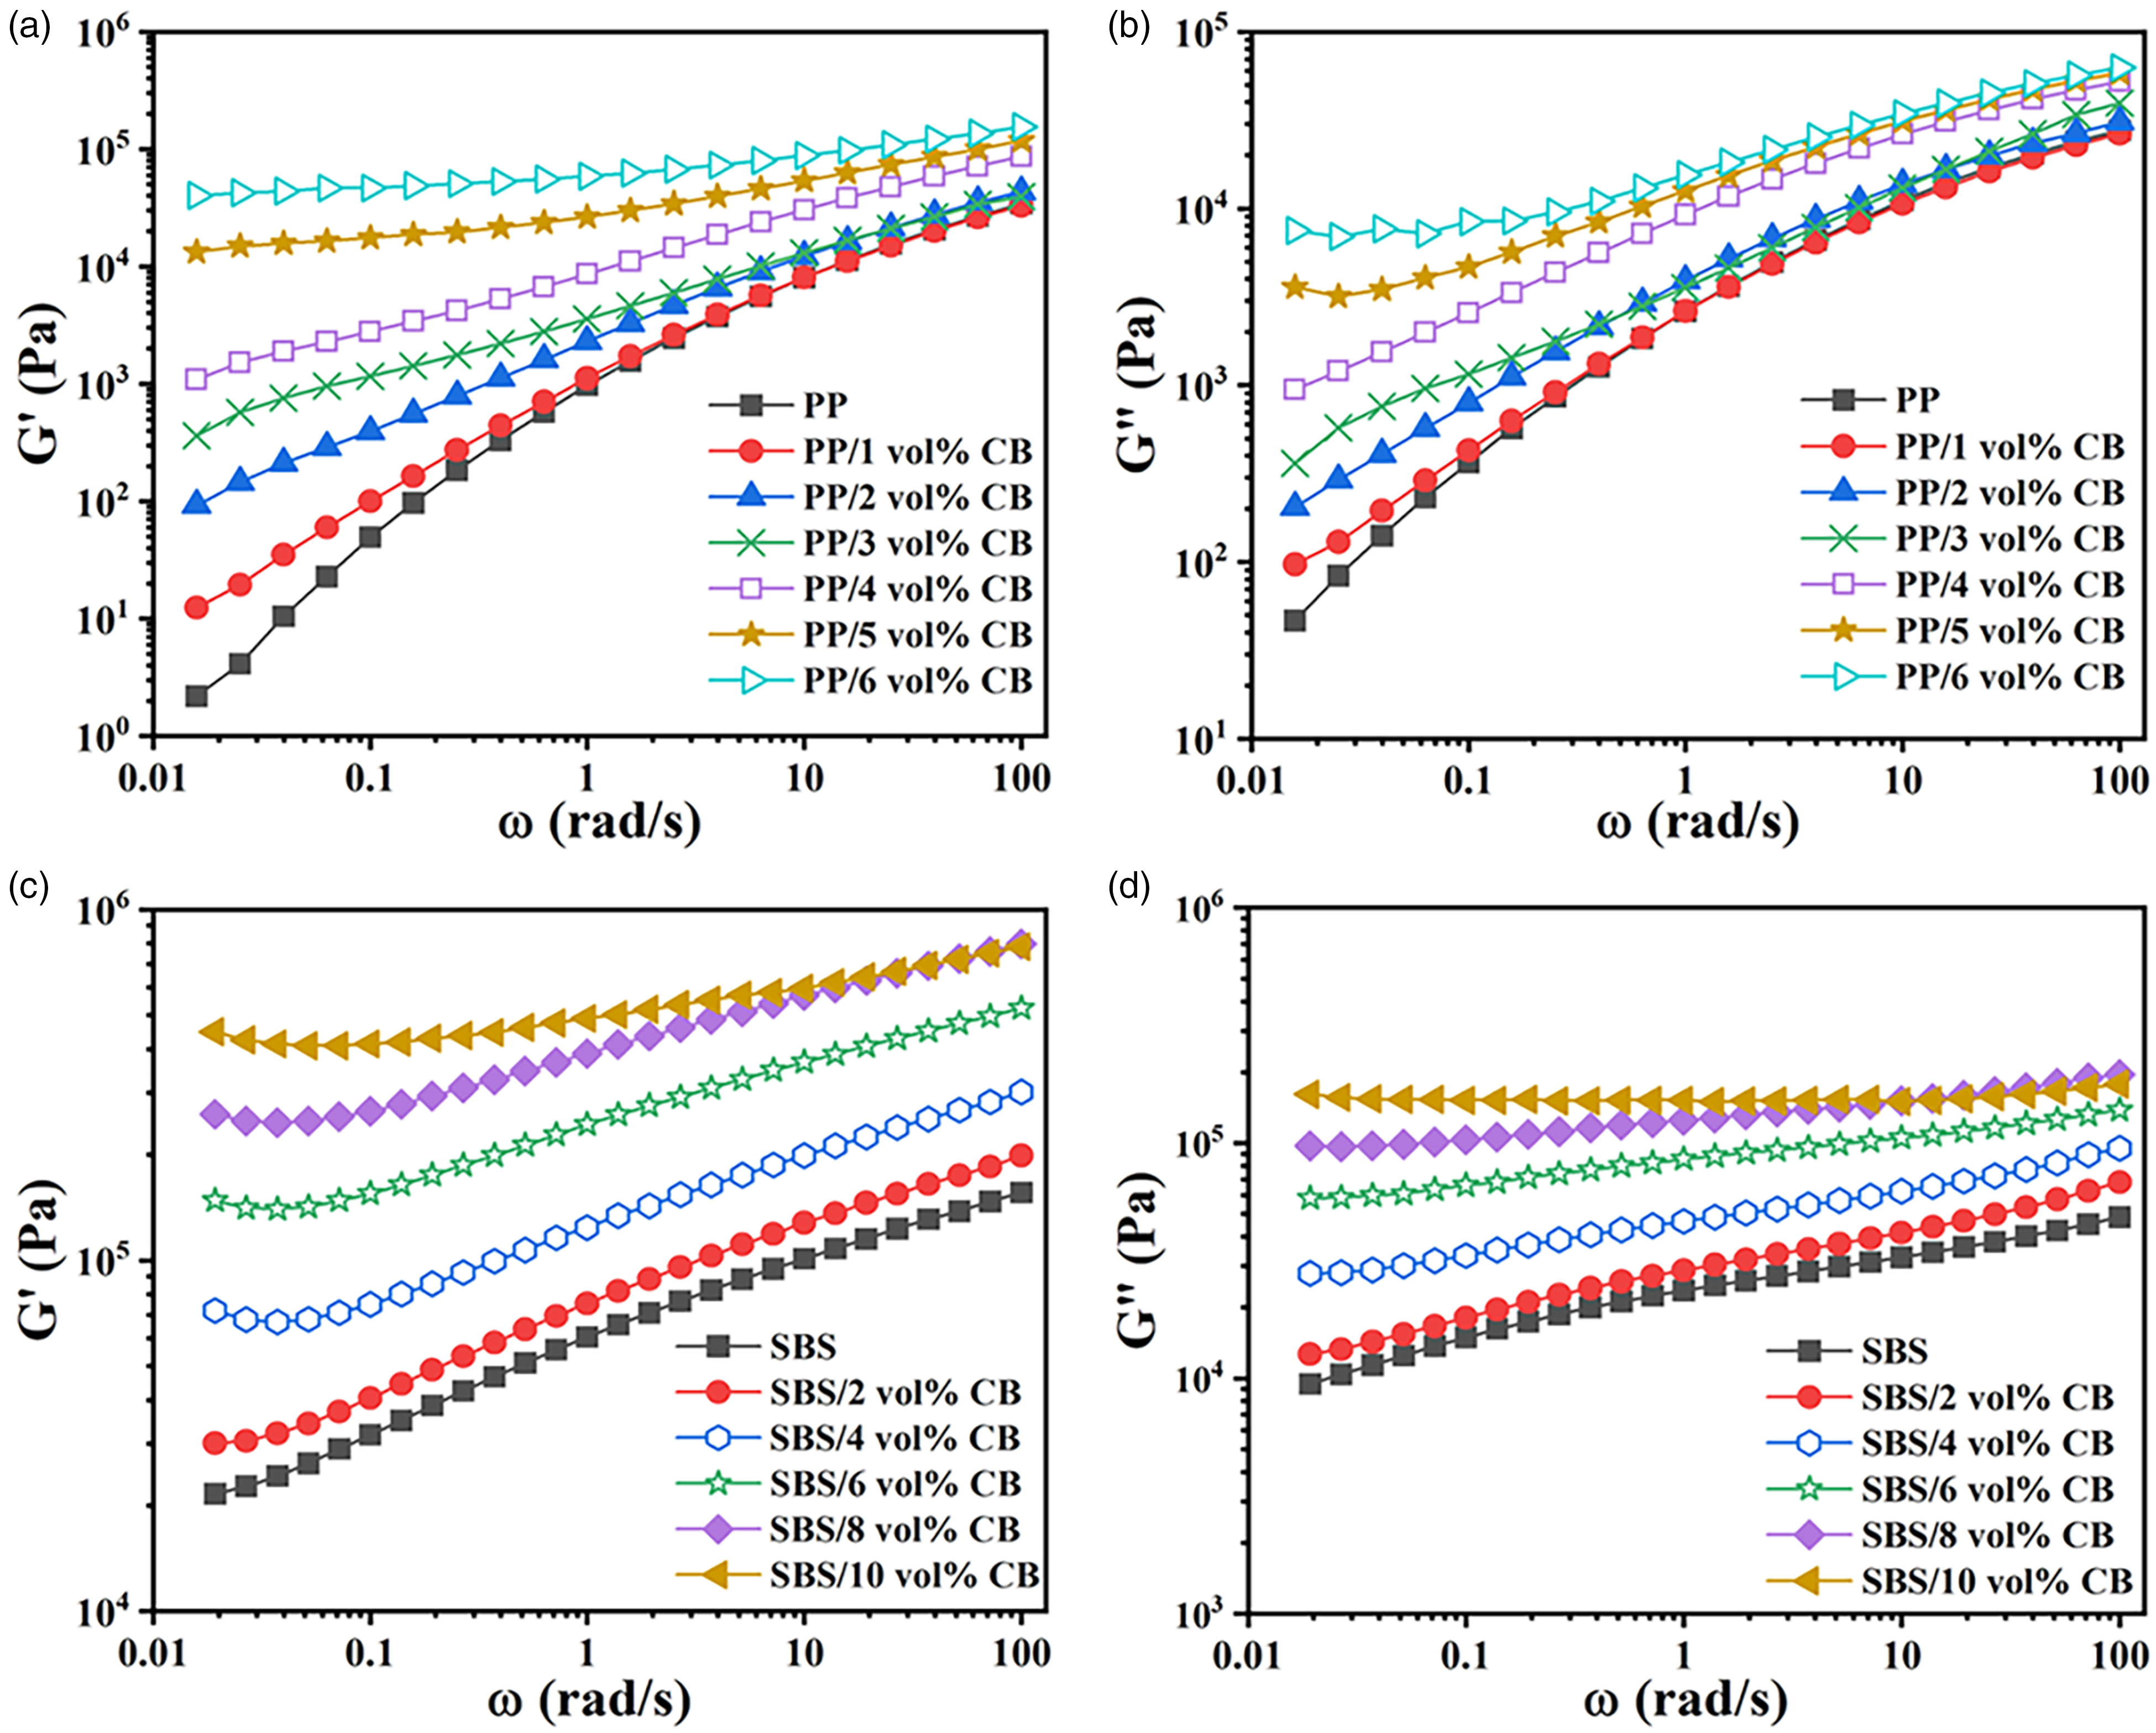
The rheology behaviors: the storage modulus(G′) and the loss modulus (G″) versus angular frequency (ω) for PP/CB and SBS/CB composites, respectively.
Figure 9 illustrates the dependence of η* on CB content and angular frequency for the all composites. The η* of both two composites increased with growing CB loading which was most conspicuous at low-frequency but decreased with increasing frequency. 48 At the melting state, the flow of resins was affected by the filler as inorganic particles with poor liquidity which curbed the mobility of polymer chains, resulting in the increasing η*. The high value of η* generally suggested a high melting strength with unfavorable processability and high energy consumption in processing, so the low value was desirable. The η* of PP/1 vol% CB got small raise and was followed nearly with pure PP matrix. The pronounced increase of η* and the disappearance of the Newtonian plateaus were observed as the CB content reached 2 vol% which were ascribed to the establishment of a percolated network. 48 It was observed that the η* of conductive composite PP/2 vol% CB was not greatly high at low frequencies and decreased dramatically to the low value with the increasing frequency, so the processability was fine. For the SBS/CB composites similarly to the pseudoplastic fluid, the rapid growth of η* at low-frequency appeared at the filler proportion from 4 to 6 vol% which was also attributed to the microstructure formation, like the same analysis in G′ and G″. The η* of all SBS/CB composites were relatively higher due to the long chains and high molecular weight of SBS, and the η* of conductive SBS/CB composites decreased greatly by increasing the shear rate which was corresponded to the improved processability.
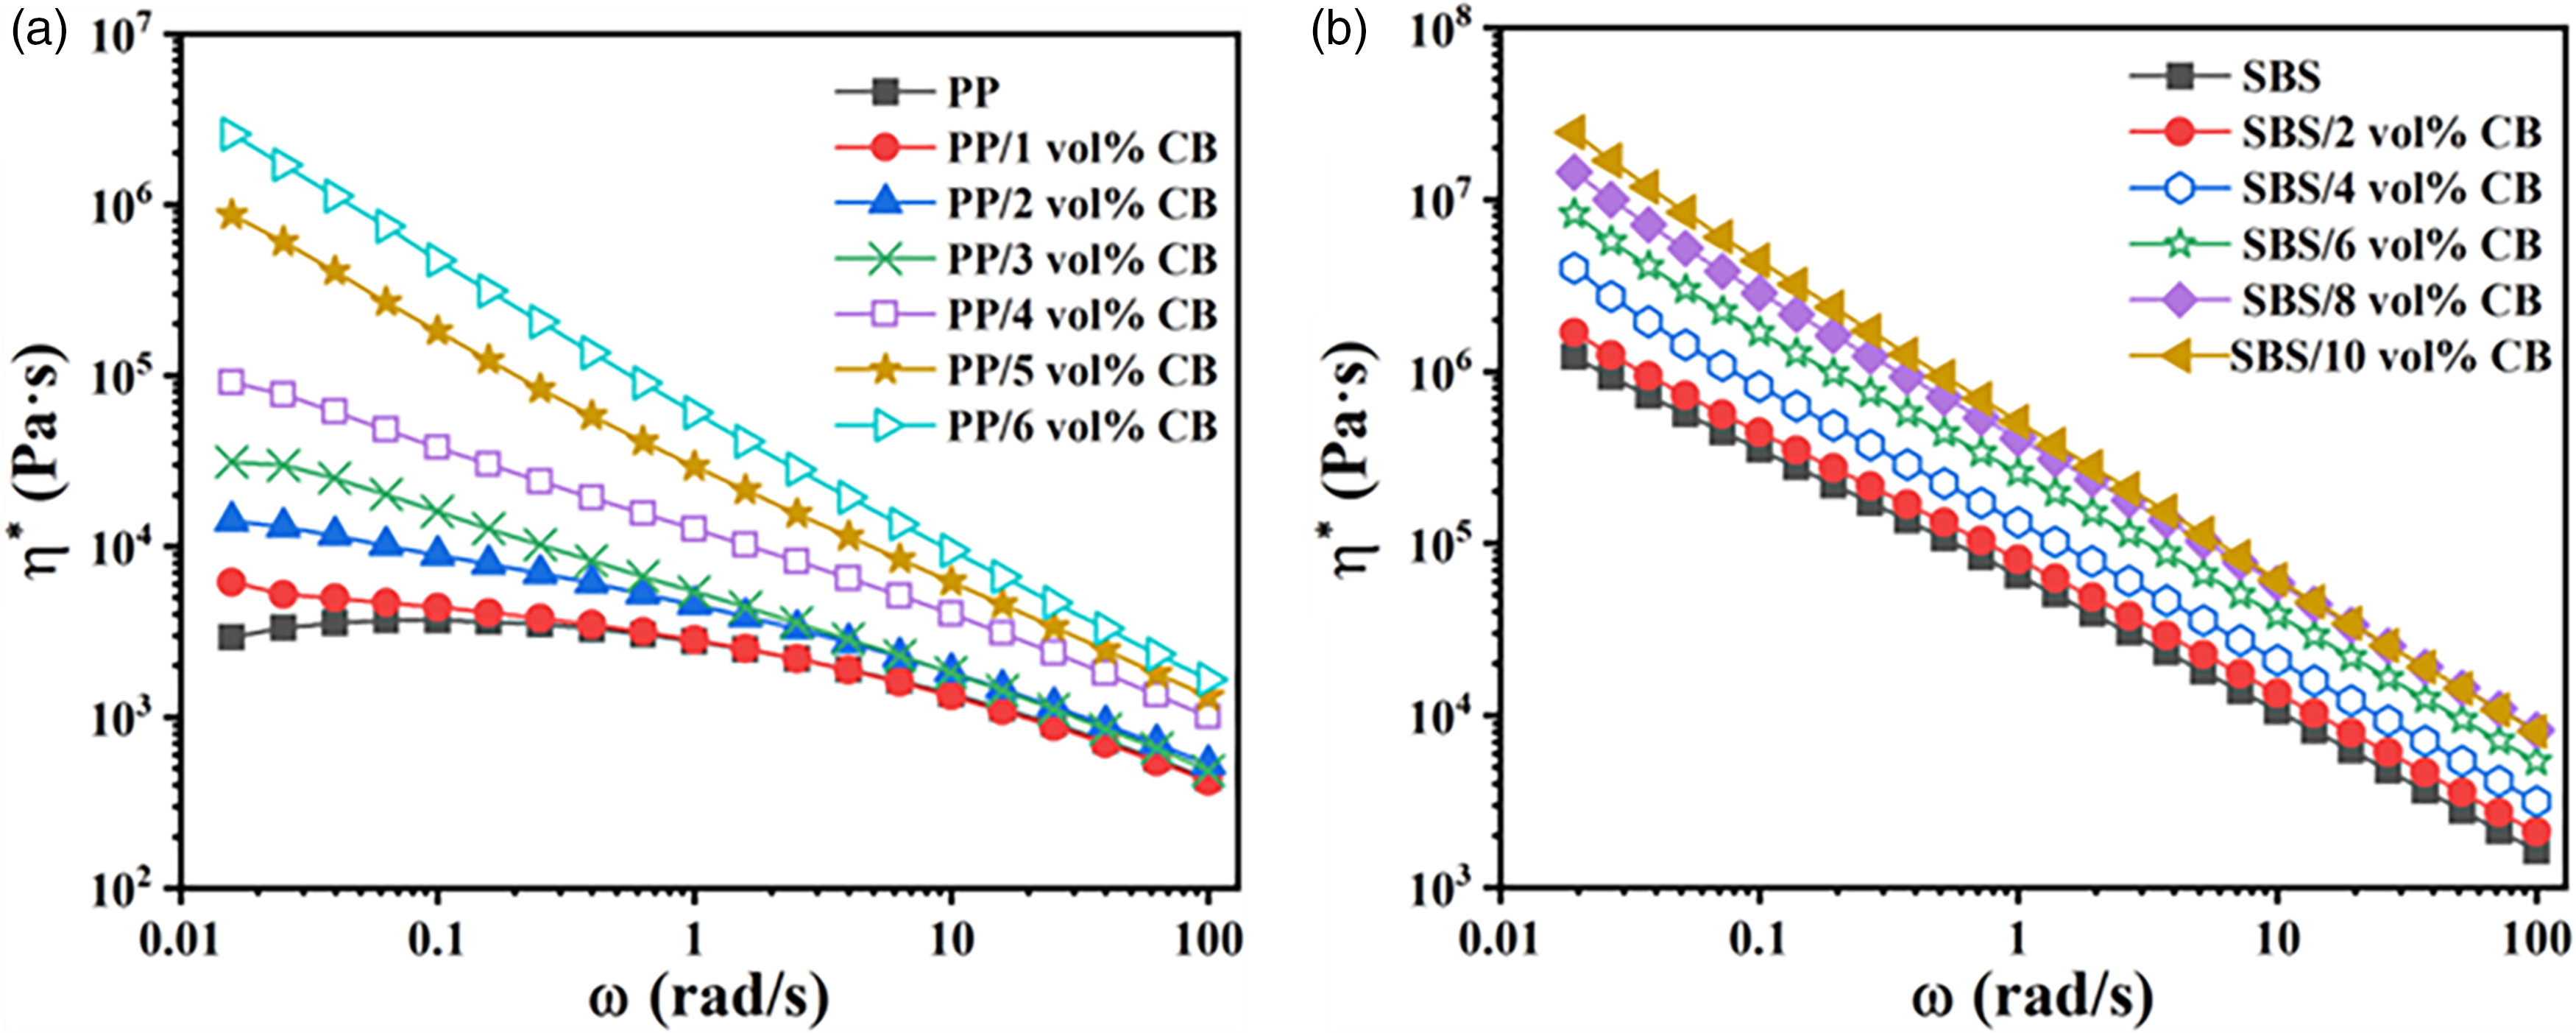
The complex viscosity (η*) versus angular frequency (ω) for (a) PP/CB and (b) SBS/CB composites, respectively.
Comparative mechanical properties between PP/CB and SBS/CB composites
The mechanical properties measured were applied to evaluate the practicality of composites and reflect the difference in filler microstructure, distribution state and special interaction with matrix, and the detailed data were listed in Table 2 for the comparison. The tensile strength of PP/CB composites with a minimum of 31.3 MPa was larger than SBS/CB composites with a maximum of 21.0 MPa, which suggested the high hardness of rigid polyolefin PP corresponding to the certain crystallinity in Table 1. The tensile strengths of PP/CB composites were lower than pure PP because the effectively compact dispersion of CB particles caused the increasing agglomerates and stress concentration regions even at a low CB content. And that the small or incomplete crystals formed with the loading of CB was also a considerable reason, as displayed in Figure 2. However, as the CB percentage increased, the tensile strength of SBS/CB composites increased to the maximum and then gradually decreased, owing to the enhancement effect that CB with a certain content range acted as fortifiers in elastomer materials and the growing stress concentration plots with high CB content similarly. 49 It was confirmed that when the CB content was lower than 6 vol%, the filler was dispersed in the matrix loosely with less aggregation as shown in Figure 3 and the tensile strength of the SBS/CB composite got improved than pure SBS. 47
The mechanical properties of PP/CB and SBS/CB composites.
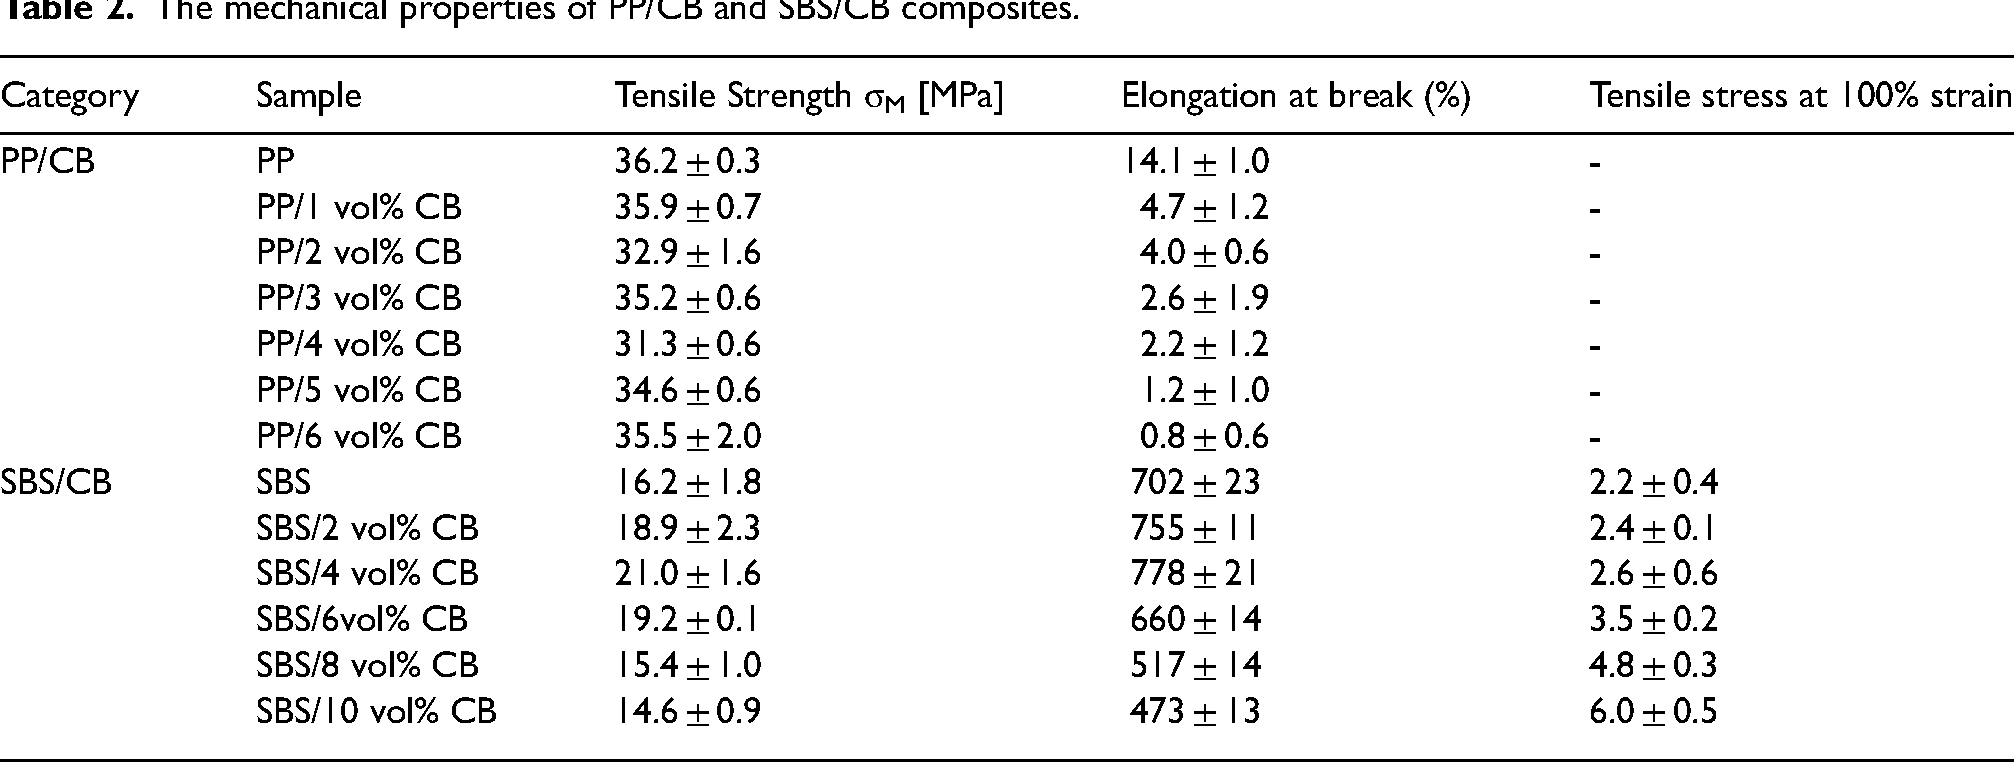
For the elongation of break, the variation tendencies of the two composites were following with the tensile strength. Compared to the PP/CB composites with a maximum of only 14.1%, the values of SBS/CB composites were significantly higher and the minimum of 473% was about 34 times for PP/CB composites. The mechanical properties of composites were mainly controlled by the matrix material and highly affected by the filler content and distribution. Interestingly, the improvements in mechanical properties of SBS/CB composites could be achieved at the percolation threshold. However, after loading the CB with a content of the threshold, the tensile strengths of PP/CB composites displayed relatively stable but the elongation at break highly decreased which was against the stretchability. Moreover, the variation of tensile stress at 100% strain in SBS/CB composites further demonstrated the enhancement effect of CB particles in strength. Therefore, the reinforcements in tensile properties of SBS/CB composites contributed to achieving some wearable and flexible applications, though the absence of crystallization behavior made the higher required filler to achieve conducting. And with the introduction of the low content CB, the stretchability of PP/CB composite was weakened but still able to meet the applications required small deformation, and the percolation threshold could be further decreased by regulating the crystallization behavior.
Conclusions
In this work, the difference in conductivity modification caused by the presence of crystallization behavior in the matrix was investigated. The rigid polymer PP with the strong crystallization ability and the thermoplastic elastomer SBS without crystallization behavior were selected as the studied matrices and the conductive filler CB was introduced into the matrices by melting blending to fabricate PP/CB and SBS/CB composites. Based on the percolation theory, the theoretical percolation threshold of the PP/CB composite was 1.8 vol% which was significantly lower than 5.4 vol% in SBS/CB composite. Thus, the conductivity modification effect of PP was better since loading high-content CB generally weakened some excellent properties of the matrix deeply. With the observation of CB distribution by the optical morphologies, the existence of crystalline structure in the PP/CB composites made the CB particles and agglomerates located at the site among the crystals which contributed to forming the conductive network more efficient than the SBS matrix composites with the same CB content. Thus, the low percolation threshold was achieved by a segregated structure induced by crystallization behavior. According to the DSC results, CB acting as the heterogeneous nucleator facilitated the crystallization behavior but the high-content CB compositions restricted the growth of crystals. The percolation phenomenon at low-frequency occurring in the rheology properties were following with that in electrical performance which confirmed the formation of the percolated network at the threshold content and the complex viscosity illustrated the great processibility for both two composites. Although the tensile performances displayed the enhancement and inverse effects in the SBS/CB and PP/CB composites with desirable electrical properties, respectively, the two composites meet the practical applications required the small-deformation. Therefore, the crystallization behavior of the matrix prompted the efficient formation of a conductive network with a similar segregated structure and there was an interaction relationship between the filler and crystallization behavior, which would guide the construction of controllable and efficient conductive network by adjusting the crystallization behavior of the matrix.
Footnotes
Acknowledgements
This work was supported by the Priority Academic Program Development of Jiangsu Higher Education Institution (PAPD) and the Key R & D Programme (Competitive Projects) Projects of Jiangsu Province (No. BE2020011).
Declaration of conflicting interests
The authors declared no potential conflicts of interest with respect to the research, authorship, and/or publication of this article.
Funding
The authors received no financial support for the research, authorship, and/or publication of this article.