
Abstract
This work presents how the optimization of polymer conductive composites constituting the semi-crystalline polymer matrix (low-density polyethylene (LDPE) and isotactic polypropylene (it-PP)) and carbon black (CB) by melt-mixing process, has an important influence not only in diminishing the resistivity of the composite but also in reducing the critical concentration of CB. The experimental procedure consists of studying the influence of processing parameters such as mixing temperature, time, and speed on the electrical resistivity values. Optimal parameters are considered as those obtained with the lowest standard deviation for electrical resistivity and a reduction in resistivity in comparison with the arbitrary conditions established as preliminary or reference. The control of those parameters allows in attaining an important reduction (7%) in the critical CB concentration at threshold percolation in both the studied composites in comparison with those obtained under unfavorable conditions or even with those obtained under reference conditions.
Keywords
Introduction
The electrical properties of polymer compounds modified with conductive particles have been widely studied for scientific and technological reasons 1 –4 for more than half a century. Many research groups have studied the intrinsic nature and the chemical modification of the conductive particles and the physical characteristics of materials such as shape, 5 size, 6 aggregation, 7 surface area, 8 and so on. Among the most interesting particles are the carbon single-walled 9 and multi-walled nanotubes, 10,11 nanofibers, 12 carbon blacks (CBs), 13 metallic particles, 14 and others. 15
Relevant contributions have been achieved, thanks to the electrical properties studied from the chemical and physical nature of the polymer matrix, 16,17 its dependence on molecular weight, 18 thermal transitions, 19 surface tension, 20 and so on. A central point of study of these materials has been the development of techniques and specialized equipment 21,22 for preparation and processing, allowing for correct conclusions about the electrical behavior of these types of materials. 22
The very well accepted elucidation of the electrical conductivity has been established by the electronic percolation mechanism 23 that actually is considered the best way to explain the electrical behavior of these materials. This statistical point of view establishes that the electrical current is transported via conductive paths that are formed by the electrical interconnection among conductive particles. These interconnected particles render percolation networks that are built in the percolation threshold, when the concentration of conductive particles that are required for building those conductive networks is minimal; it is known as critical concentration. From a practical point of view, it does not predict the percolation threshold for a particular combination of polymer-conductive particle. However, this study is a very useful description because it explains that the electrical conductivity depends on the building of conductive networks, and consequently it intrinsically depends on the distribution of particles in the entire polymer matrix. This gives the possibility of obtaining conclusions related to the particle distribution during the composite preparation and on the possible redistribution due to external factors. 4,22 –24
Because the electrical properties of the polymer compounds depend on the distribution and concentration 1 –24 of the conductive particles, polymer composite have some advantages over other useful materials for electric conduction. In terms of concentration of the conductive particles, polymer composites show electrical resistivity from the insulator to the conductive regimen; this means they show resistivity depending on the composition of the conductive particles, with the benefit of being much lighter than the conventional conductive materials. For a given particle concentration, it is possible to modify the resistivity by modifying the external conditions, inducting a redistribution of the particles. 25 So those materials could be used not only in antistatic shielding 26 and electronic nose applications 27 but in signal autoregulating fields such as thermo regulators, 28 sensors, 29 and artificial muscle. 30 In conclusion, not only the electrical properties, but all their general properties are completely dependent on the particle distribution and in turn on the preparation conditions. The appropriate preparation conditions could be useful for designing fabricate polymer composites with specific properties.
As a result, it is important to understand the effect of the processing parameters on the particle distribution for each polymer–particle pair, 1 –31 allowing us to select the conditions for obtaining compounds with reproducible electrical properties and modeling the final properties of the polymer compound.
The electrical behavior of the polymer compounds with CB in terms of processing conditions has been studied by several research groups focused mainly on the melting mixing process 5,22,31 –36 and in less proportion on the dissolution mixing. 37 –39 However, there is not a unified criterion about the best processing parameters, neither a generalized criterion about the method for preparing the composites. Some authors have demonstrated that the melt mixing dispersion stand out the positive temperature effect in comparison with the solution mixing for CB polymer composites, 40 whereas others 41 have evidenced that processing conditions influence the sensibility detection to organic vapors. The modification effect of the conductivity due to shared forces applied during the mechanical mixing had also been studied. 42 Other studies 31,43 have verified that thermodynamic and dynamic factors, including interfacial energy, viscosity, polymer proportions, rotation speed and mixing time, and the mixing sequence, have an effect on the final properties of polymer composites based on ethylene–vinyl acetate copolymer/low-density polyethylene (EVA/LDPE) and CB. The influence of temperature and extrusion speed on the intensity of the positive temperature coefficient (PTC) were studied in polymer blends of poly(butylene terephthalate) (PBT)/poly(olefin) with CB. 42 These studies demonstrated that an increase in temperature and mixing speed, both render a significant decrease on resistivity. Processing conditions such as time, temperature, speed, and pressure have an influence on the electrical conductivity in polymer compounds of (EVA), ethylene–propylene diene (EPDM) rubber, and its blend 50:50, with carbon fibers and CB. 31 From the studies of PBT and poly(amide12-b-tetramethylene glycol) (PEBAX), 44 it was concluded that the electrical properties could be controlled only by changing the temperature and the extrusion speed, without changing the composition. In another article, 22 many parameters in the preparation of electrical composites based on a modified polyamide and CB by extrusion method were studied in detail. From that study it is understood that there are many parameters that could influence the dispersion of CB particles and the final properties of the composites. The authors concluded that feeding sequence and screw geometry were the most relevant processing variables. The lowest surface resistivities were obtained for a combination of sequential feeding, highly restrictive screw, low-set temperature, and moderate screw speed. Many other reports 5,31,35,36,45,46 demonstrate that specific polymer processing conditions for preparing polymer compounds could be useful for modeling the electrical properties of the composite materials. According to the particular nature of the components and the great possibility of select materials for the polymer composite preparation, it is possible to establish a particular criterion for the processing parameters, depending on the polymer matrix. In this work, processing conditions for polymer compounds of thermoplastic matrix with CB were studied. The proposed optimization criterion, uses the conditions when the preparation of polymer composites results in the lowest standard deviation for electrical resistivity, whereas other authors have considered as the best conditions, those at which the higher conductivity is reached. The first criterion allows to assume that the carbon particles show the same average spatial distribution. This criterion was considered because the lowest resistivity does not always render the best reproducibility in electrical resistivity, which in terms of practical application is very important. The contribution of this work is to establish a criterion in the parameter processing selection in order to observe a good reproducibility, not only in the percolation threshold but in the decreasing of it. Using arbitrary conditions, it could be shown that the percolation threshold tends to increase in both types of polymer composites and it also leads to the worst reproducibility in resistivity. The lack of reproducibility in properties could conduce to erroneous interpretation of results when associating them to the composition instead of the inappropriate distribution of the conductive particles, which in turn depends on the processing parameters.
Experimental
This study consists of evaluating the influence of three main parameters of the thermomechanic mixing process used to prepare the composites: mixing temperature, mixing time, and mixing speed. In order to analyze the isolate effects, we started with initial processing conditions selected from available information. 35,44,47 Then, three experimental levels were considered for each parameter, so that the individual effects could be studied by simple factorial experiments. For each preparation of the composite (LDPE, it-PP with CB), 5 probe samples were processed. The bulk electrical resistivity (ρ) was used to evaluate the influence of the studied parameters; average dispersion between the samples of the same composite composition was the statistical criteria taken into consideration.
Materials and composite preparation
CB Vulcan XC72 from Cabot Co. (MA, EUA) 1.8 g/cm3density; LDPE commercial degree, weight-average molecular weight (Mw) = 2.0 × 10⁵, density of 0.92 g/cm3, and melting point 110–115°C, from Industria Cangrejera de México (Coatzacoalcos, Veracruz); isotactic polypropylene (it-PP) in pellets, Mw = 340,000, density 0.90 g/cm3, and a melting point of 160–165°C from Sigma-Aldrich Co., (USA) were used as received.
Composites (1) LDPE/CB and (2) it-PP/CB were prepared in a thermomechanical laboratorial Banbury-type internal mixer, 50 (Diseño y Maquinados de Toluca, México). It has a 1 Hp motor PN345SP coupled with a gear system. The mixing chamber has a capacity of 10–16 g, this and the two rotor blades are made of stainless steel 304. Each rotor blade is flat and they have the same dimensions but the speed of one of them is one revolution higher than the other. That allows mixing speeds from 30 to 1750 rpm. The chamber temperature is controlled by a PID digital controller Honeywell DC1020 from 25 to 250°C, supplied by Cole Parmer, USA.
The polymer is softened by maintaining the temperature in the mixing chamber and the CB particles are added and mixed until a homogeneous material is obtained. The preparation procedure consists of an initial preheating of the mixing chamber from room temperature (20°C) to processing temperature (Tp ). In the initial stage, the mixing system is initialized at 10 rpm and at 20°C below the polymer fusion temperature in order to stabilize the temperature in the mixing chamber. Then the polymer is added at 100°C for LDPE and at 160°C for it-PP, whereas the palette speed is maintained at 30 rpm. Then CB particles are carefully added in a 2-min lap, so that they do not spring out of the chamber. Once both the components have been introduced into the chamber (it takes around 15 ± 2 min) and the Tp has been reached, the control parameter stage is initiated: processing temperature, processing time, and mixing speed (Tp , tp , and Vm ). The initial processing conditions are shown in Table 1, as a function of the polymer matrix. At the end of the stage, the system is led to cool slowly (2°C/min) and the composite is taken out of the chamber when 70°C is reached. Finally the composite is triturated and stored for further evaluations.
Initial mixing conditions for the processing of each composite type.
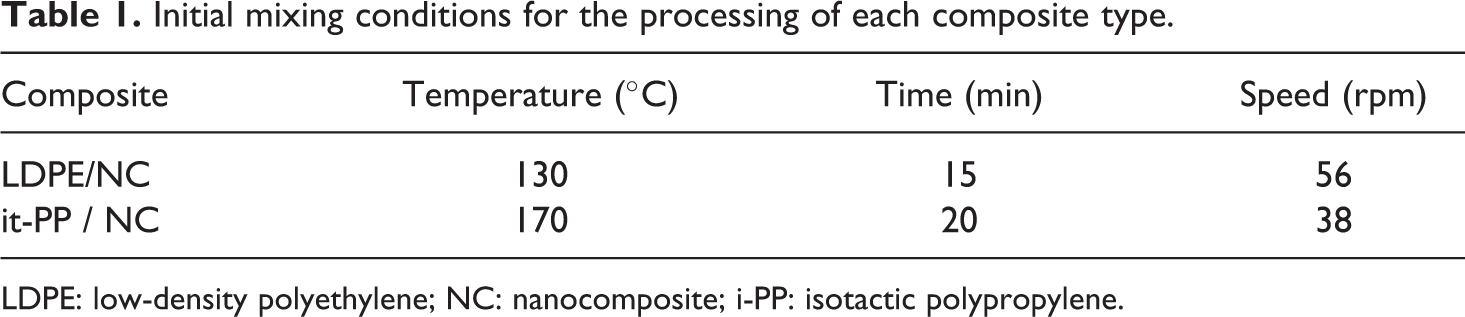
LDPE: low-density polyethylene; NC: nanocomposite; i-PP: isotactic polypropylene.
Sample preparation
In order to evaluate the bulk electrical resistivity (ρ) of the polymer composite, cylinder-shaped samples were processed by compression molding using a 10-ton hydraulic press, where heating is provided by external resistances. The process is carried out according to the conditions shown in Table 2. The molding cooling process is achieved slowly with clean and dry compressed air. The size of the mold used allows the processing of cylindrical-shaped samples of approximately 1 cm2 diameter and 1 cm length. Samples of 1 cm length result in a unitary volume (1 cm3) suitable for further volumetric resistivity estimations. Samples’ diameter and length were measured using a Vernier caliper of 0.02 mm resolution.
Molding parameters of the polymer composites.
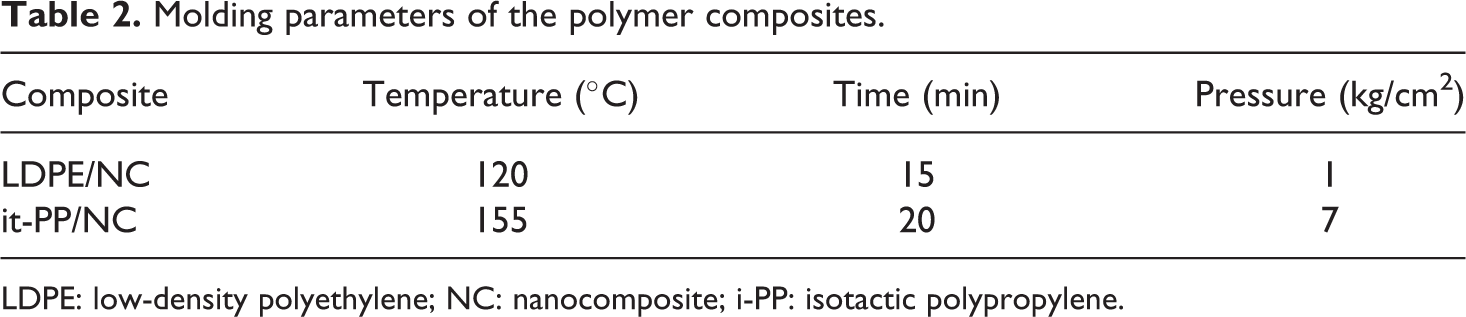
LDPE: low-density polyethylene; NC: nanocomposite; i-PP: isotactic polypropylene.
Electrical measurements
For the electrical resistance measurement, the plane surfaces of the cylinders are polished with silicon dioxide (SiO2) abrasive paper, and they are covered with a thin layer of colloidal silver paste that is left to dry in vacuum for 24 h. The resistance measurement is made by the two-point method using a digital multimeter. In the case of samples whose resistance is higher than 10 MΩ, the measure is carried out with a Keithley electrometer mod. 6517A, supplied by Servicios de Calibración y Metrología, Apodaca Nuevo León, México. The sample resistivity ρ, in Ωcm, is calculated from the Ohm law, equation (1):
where S represents the area of the plane faces in cm2; and L is the length of the sample in cm.
Results and discussion
Optimization of the composites processing
The adjusted parameters during the mixing process for obtaining polymer composites were mixing temperature (Tm ), mixing time (tm ), and mixing speed (Vm ). An experiment for optimizing the process must include the study of the effects by varying the studied parameters. In case of Tm , the polymer must be softened before the mixing could be carried out, it must be near to the fusion temperature. With respect to the tm and Vm , both depend on the type and size of the mixing equipment. The composites that were used as reference were processed under the same conditions reported in some literature for similar compounds. 47 The used composition for this reference composite was 15 wt% CB for LDPE/CB and 9 wt% CB for it-PP/CB composites, the processing conditions are shown in Table 1. The bulk average resistivity was 11 kΩ.cm in case of LDPE/CB and 200 Ω.cm for it-PP/CB.
The optimization experiment for both composites was conducted by studying three levels for each studied parameter; these levels were identified as low, medium, and high. Medium values were selected as initial values (reference preparations). The analysis for LDPE/CB was conducted first by changing the mixing time, tm , that is, 5, 15, and 20 min of the chosen levels (reference mixing time was 15 min) and left the other two parameters (Tp = 130°C and Vp = 56 rpm) constant. The bulk resistivity values of these experiments are shown in Figure 1; the full black circles represent the average value for each sample set of compositions and hollow circles indicate the dispersion values of each individual sample with respect to the mean resistivity value. Table 3 shows that the resistivity values tend to increase as the mixing time increases. Samples with tp = 5 min show the lowest mean resistivity and the shortest variation between samples. This behavior is explained in terms of the shearing forces exerted by mixing the palettes on the composite, they act on CB agglomerates at the interfaces of laminar flow, and break them into primary aggregates; the weak van der Waals force between the agglomerates in CB break them up easily. If the composite remains under stress for a longer time, the CB agglomerates are broken down, increasing the gap between the individual aggregates. 48 The loss of the high CB structure explains the corresponding increase in the composite bulk resistivity due to the interruption in the number of the conductive paths. 12
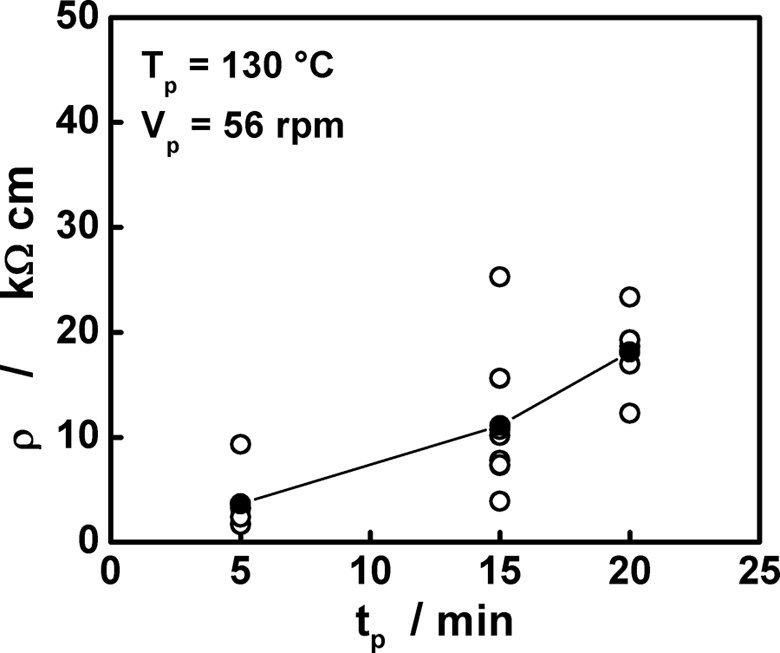
Effect of the mixing time on the bulk resistivity for LDPE + 15 wt% CB composites. LDPE: low-density polyethylene; CB: carbon black; Tp : processing temperature; tp : processing time; Vp : processing speed; ρ: bulk electrical resistivity.
Comparison between the reference (CR ), the optimized (Co ) and the less favorable conditions (CL ) for the LDPE + 15 wt% CB.
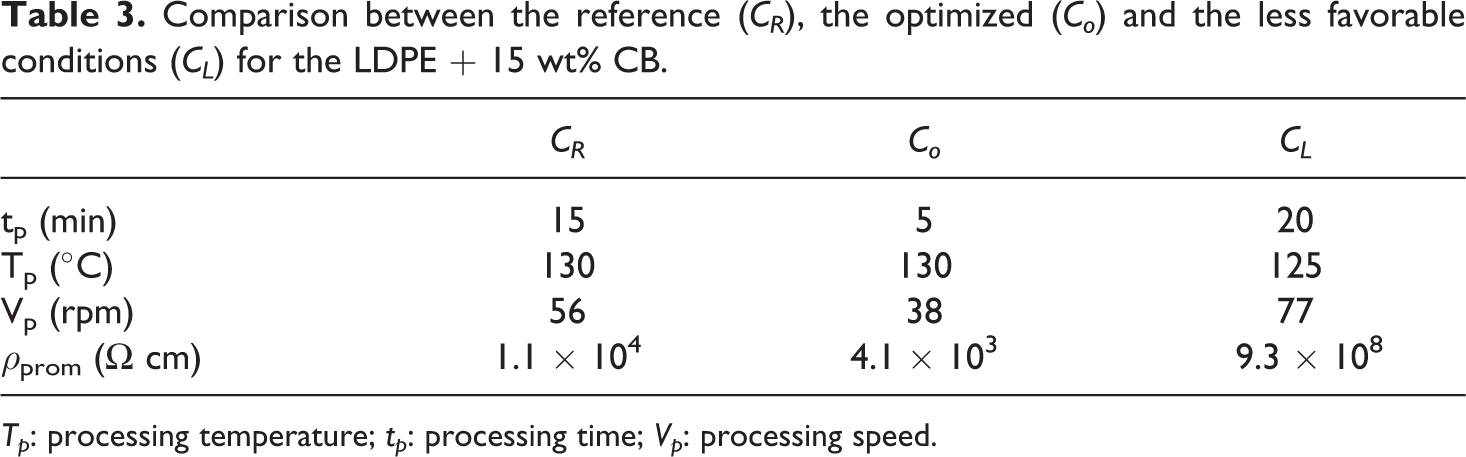
Tp : processing temperature; tp : processing time; Vp : processing speed.
The next step consists of studying the influence of the Tm , which was selected based on the thermal behavior of the polymer matrix: above (140°C) and below (125°C) of the reference temperature (130°C), maintaining the tm and Vm at 5 min and 56 rpm, respectively. The resistivity results for these samples are shown in Figure 2. It can be appreciated that at the lowest Tm (125°C), there is a great variation from the mean in the composite resistivity. In the case of higher temperatures, a significant variation in the individual values could not be observed in the mean value with respect to the individual reference ones. A reduction in the mobility (viscosity) of the polymer matrix as a consequence of increasing the Tm seems to promote a better distribution of the conductive particles in the entire polymer. The last studied parameter was the Vm , for which two levels of variation were tested over and under the reference value (56 rpm): 77 rpm and 38 rpm, with the Tm (130°C) and tm (5 min) maintained as constant, both chosen as the optimal from the two last described experiments because they produced the lowest dispersion and resistivity values. The results are shown in Figure 3. The resistivity behavior of the samples showed that a high Vm produces a wide dispersion of the values around the average, with a tendency of increased resistivity values. On the other hand, little reduction in the mean resistivity of the samples prepared at low Vm was noticed. The mixing machines submit the softened mixture to continuous shear strength because the palettes spin in opposite directions. This stress state affects the structure of the conductive particles in such a way that the high structure of the CB is constantly affected (broken) each time the load is acting on the particles. It could be expected that an increase in the Vm causes a frequent modification (rupture and reordering) of the conductive networks in the composite, which cause the mentioned wide dispersion of resistivity. Considering the described observations, it can be noticed that some values for the studied parameters render better results such as low mean resistivity and low dispersion around the mean. The first value is indicative of a good establishment of the conductive network, whereas the second indicates the reproducibility of the preparation procedure. With those results, a new set of values (named optimal) was chosen in order to get better processed composites. The new optimal conditions included those that allow the lowest mean resistivity and the lowest dispersion or variability between individual ones: tp = 5 min, Tp = 130°C, and Vp = 38 rpm for LDPE.
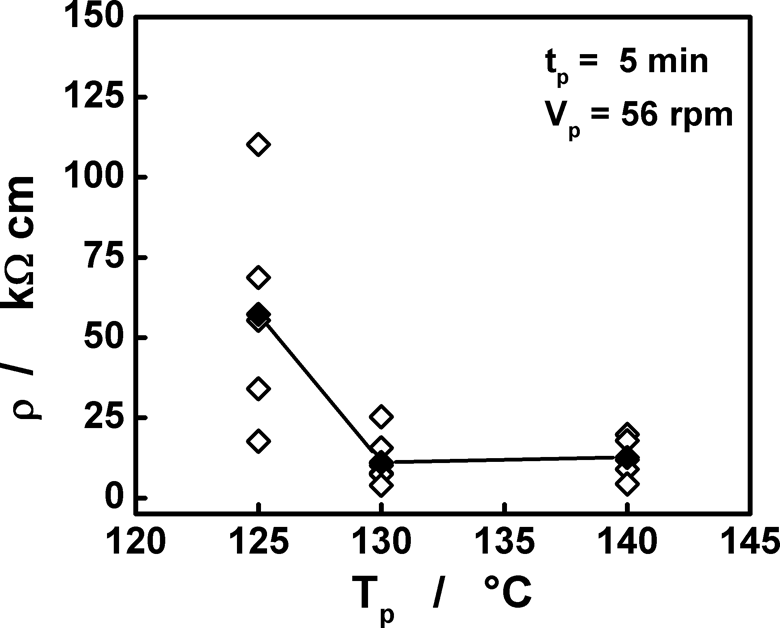
Effect of the mixing temperature on the resistivity for LDPE + 15 wt% CB composites. LDPE: low-density polyethylene; CB: carbon black; Tp : processing temperature; tp : processing time; Vp : processing speed; ρ: bulk electrical resistivity.
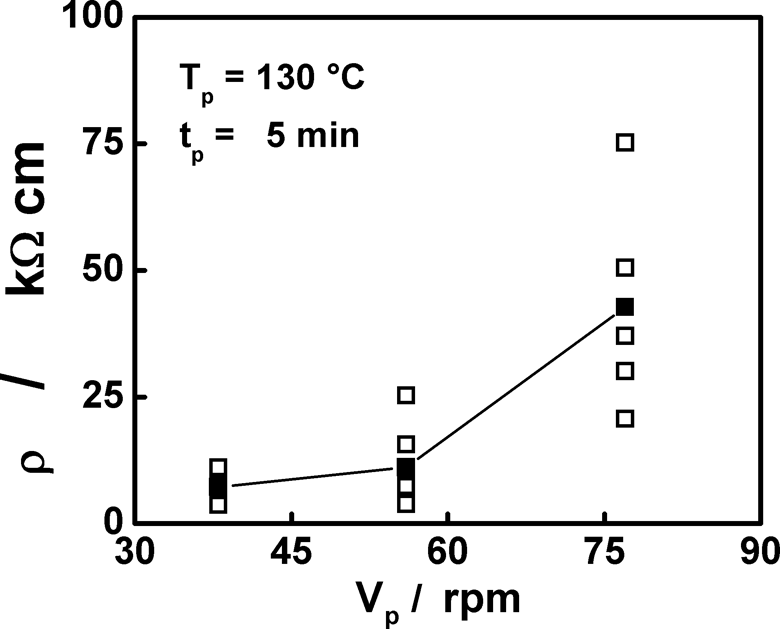
Resistivity variation with the mixing speed for LDPE + 15 wt% CB composites. LDPE: low-density polyethylene; CB: carbon black; Tp : processing temperature; tp : processing time; Vp : processing speed; ρ: bulk electrical resistivity.
The resistivity differences between the composites prepared (Co ) with these optimal parameters and those prepared with reference values (CR ) are shown in Table 3, resistivity is higher for Co samples than that for CR samples. For the purpose of comparing, a composite was processed with the less favorable conditions (CL ) (at which the average resistivity and the dispersion values are the highest), tp = 20 min, Tp = 125°C, and Vp = 77 rpm. It is evident that there is a difference of 5 orders of magnitude in the mean bulk resistivity between the composite obtained under optimal conditions and that processed under less favorable conditions.
On the other hand, a similar optimization procedure was applied for it-PP + CB. For tm , two different mixing times were studied (5 and 10 min), both below the initial conditions (20 min); and it was observed that at longer times, the polymer begins to degrade, the Tm (170°C) and Vm (38 rpm) were kept constant. Results in Figure 4 show that at short times the average resistivity diminishes and the dispersion values do not show a significant difference. With respect to Tm , it was used only at a lower temperature (160°C) compared to the initial one (170°C), keeping the tm and Vm constant at 20 min and 38 rpm, respectively. It can be appreciated in Figure 5 that at a lower temperature than that of the i-PP melting (160°C), the composite shows both a higher resistivity and a major dispersion among the individual values. This could be due to a more irregular distribution of the CB particles into the polymer matrix because of the limited movement of the polymer chains at any temperature below the melting point; however an increase in temperature produces a lower viscosity of the polymer and a better distribution of CB particles. No significant changes in resistivity were detected for the highest temperature (180°C) with respect to the reference but only a faster deterioration (oxidation) of the polymer. Finally two Vm s (56 and 77 rpm) were studied, both of them higher than the initial speed (38 rpm), keeping the tm and Tm at 10 min and 170°C, respectively; the results are shown in Figure 6. While the Vm increases, an increase in resistivity is observed. It was already explained for LDPE composites that as the shear forces submitted by the spinning palettes act for long periods, they produce a major probability that the conductive networks have more interruptions. The middle speed only showed a slight increase in the variability between the samples. With those results, the optimal conditions for the it-PP/NC composite were chosen as To = 170°C, to = 10 min and Vo = 38 rpm. These optimal conditions are different compared to the initial, except for the tm .
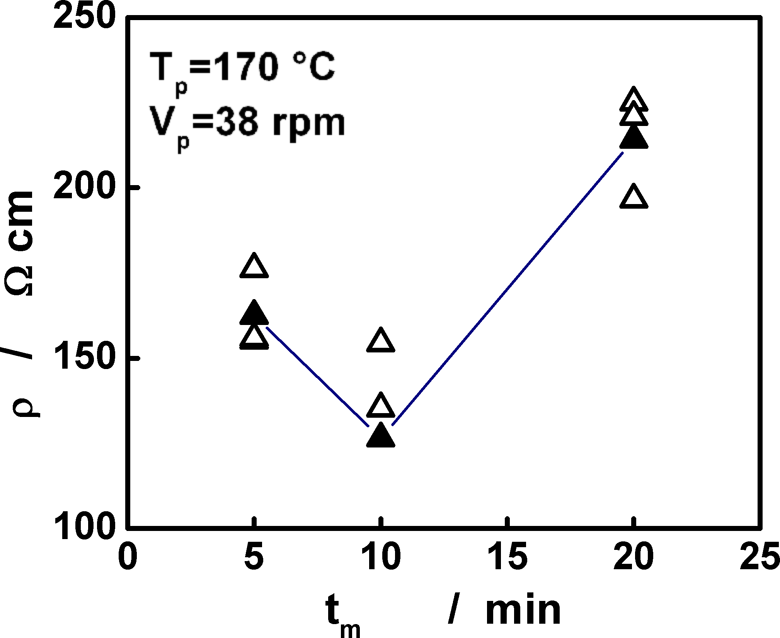
Resistivity as a function of the mixing time for i-PP + 9 wt% CB composites. i-PP: isotactic polypropylene; CB: carbon black; tm : mixing time; ρ: bulk electrical resistivity.
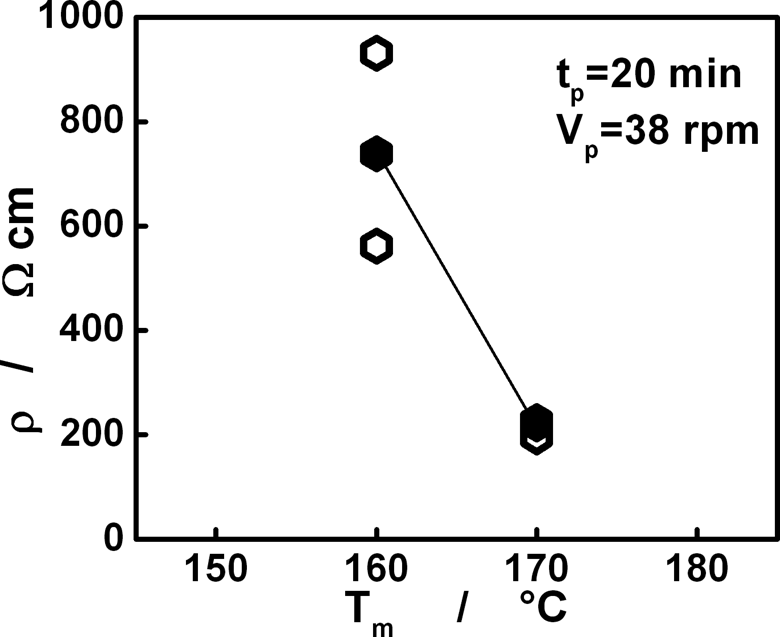
Effect of the mixing temperature on the resistivity for i-PP + 9wt% CB composites. i-PP: isotactic polypropylene; CB: carbon black; Tm : mixing temperature.
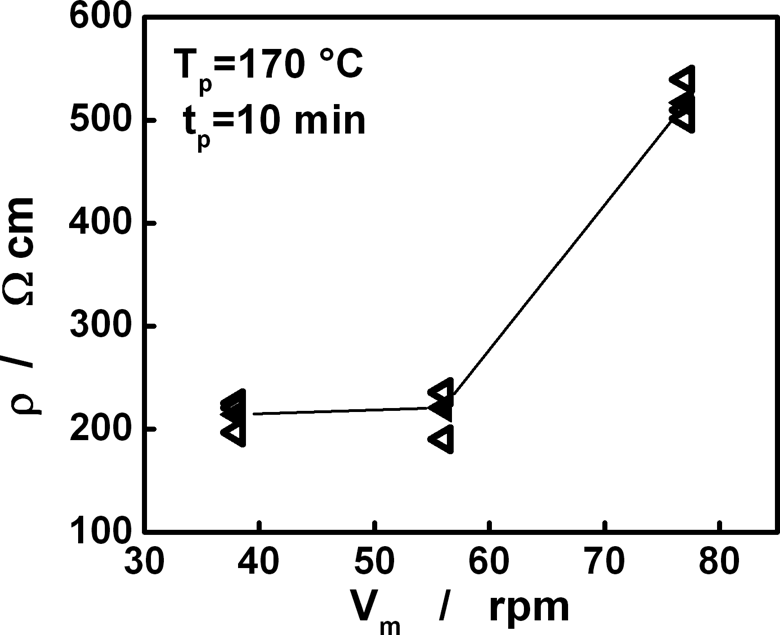
Resistivity as function of the mixing speed for i-PP+9wt%CB composites. i-PP: isotactic polypropylene; CB: carbon black; Vm: mixing speed.
Electrical properties of the optimized composites
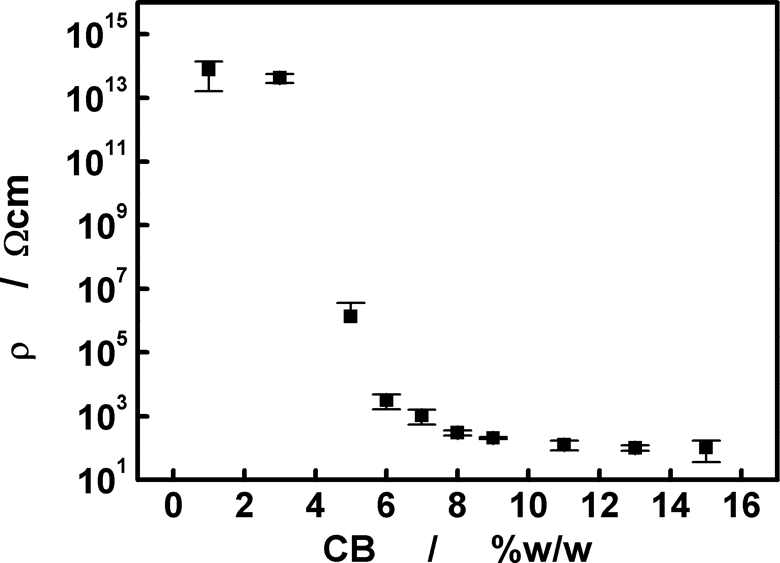
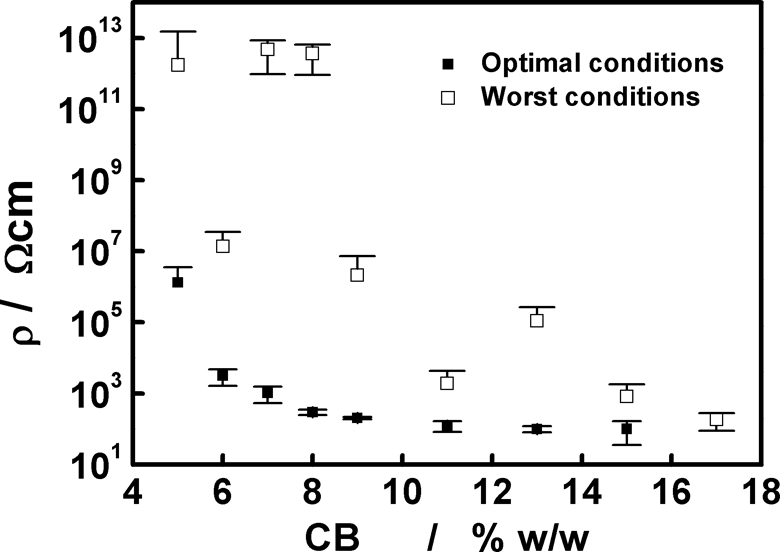
The electrical resistivity results (percolation curve and critical CB concentration) of the LDPE/15 wt% CB for composites obtained under optimized conditions show a more efficient distribution of the CB particles in the entire polymer, building the conductivity network at a lower concentration of CB particles, compared with the composites processed under the unfavorable conditions. The percolation curve characterizes the electrical behavior of a composite; Figure 7 was build using the samples obtained under the optimal parameters. The error bars in this plot represent the standard deviation, and it could be observed that the data variability is higher for CB concentrations at the transition zone than for concentrations at the conductive zone, the critical concentration of CB for LDPE/CB composite was calculated as 13.7 wt% CB. Figure 8 shows the percolation curves for polymer composites prepared under the best and the worst conditions. It can be appreciated two important differences: the composites prepared under worst conditions have a higher standard deviation for resistivity and higher critical concentration (15.5 wt% CB). The numerical analysis was made based on the equation (2).
22
Percolation curve built from LDPE + CB composites obtained under the optimal parameters. LDPE: low-density polyethylene; CB: carbon black. Percolation curves showing the differences in reproducibility and the percolation transition value for LDPE + CB composites obtained under the two conditions: the optimal (black circles) and the worst (hollow circles). LDPE: low-density polyethylene; CB: carbon black.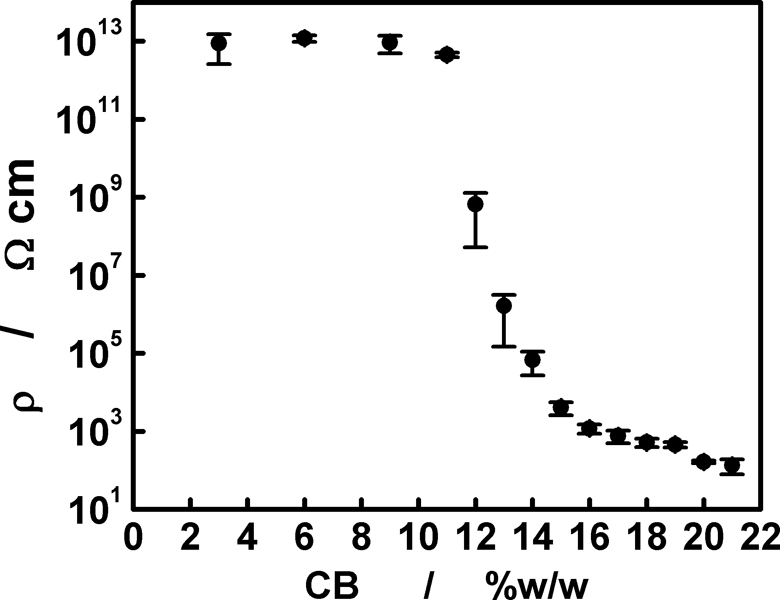
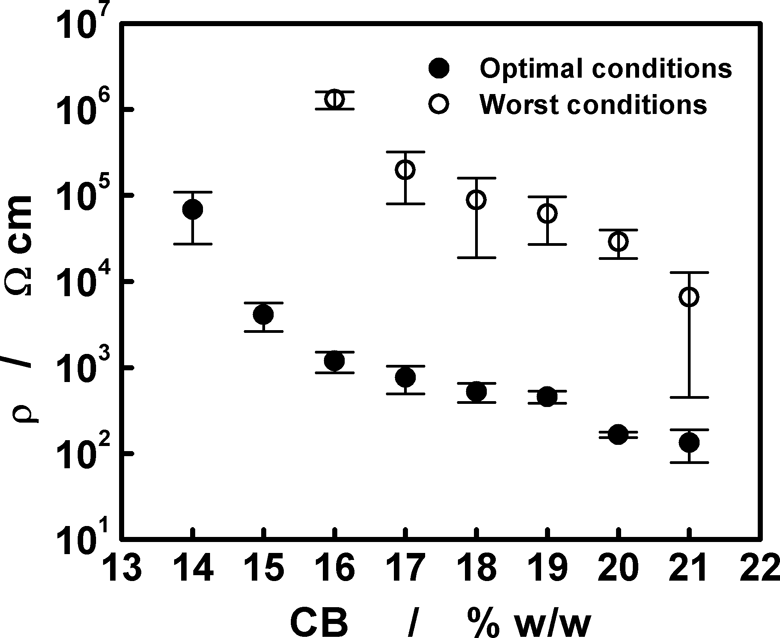

For this calculus, a critical exponent value α of 1.7 was computed. 22,49 The experimental data fit was evaluated comparing the experimental resistivity data for each concentration, with the values predicted by the numerical fit. Figure 8 demonstrates how the processing conditions highly affect the electrical properties of conductive polymer composites, by modifying mainly the percolation concentration, with a 10% decrease in critical concentration at optimized conditions. Furthermore, we can appreciate two important behaviors of those curves: for composites prepared under optimal conditions, the resistivity values are three orders of magnitude lower and the standard deviations are much smaller (± 0.2 vs. ± 0.4%) than those samples processed under unfavorable conditions.
In the case of the it-PP/CB with optimized processing conditions, the percolation curve was made with samples prepared at 1, 3, 5, 7, 9, 11, 13 and 15 wt% CB (Figure 9). A numerical treatment similar to the LDPE/CB was applied in order to find the critical concentration. The experimental data of the conducting zone allowed in the calculation of a critical concentration of 4.97 wt% CB after mathematical adjustment. In order to improve this estimation, some additional concentrations were prepared and evaluated: 5.5, 6, 8, 10, 12, 14, 16 and 17 wt% CB and the fitting curve is illustrated in Figure 10 in conjunction with the curve for the composites prepared under the unfavorable conditions. Again, the same behaviors as LDPE/CB system are presented for bulk resistivity values and for the standard deviation. The percolation threshold for samples prepared under the optimal conditions (4.9% wt% CB) is 13% lower than that for composites prepared under the worst conditions (5.6% wt% CB).
Percolation curve for the i-PP+CB composites obtained under the optimal conditions. LDPE: low-density polyethylene; CB: carbon black.
Percolation curves showing the differences in reproducibility and in the percolation transition value for i-PP + CB composites obtained from the two conditions: the optimal (black circles) and the worst (hollow circles). i-PP: isotactic polypropylene; CB: carbon black.
Conclusions
The effects of the processing parameters should be considered in the preparation of conductive polymer composites when the thermomechanic mixing process is used. For this study, three main parameters were taken into account in the preparation of LDPE/CB and it-PP/CB composites: Tm, tm , and Vm . It was evident that they had an important and direct influence on the final electrical properties of the composites. We analyzed the effect of each parameter once at a time, maintaining the other two as constant. The best ones were chosen from the two results: parameters that allow the lowest resistivity and the minor variation between the individual values for each particular preparation. With samples prepared with the optimized conditions, it was possible to reduce the mean electrical resistivity with respect to the reference preparation conditions in three magnitude orders. With the samples prepared with the optimized conditions, the percolation curves were constructed for both composites; and using a numerical analysis of the experimental data, the critical concentration was calculated as 13.7 wt% CB for LDPE and 4.9 wt% CB for it-PP, both about 13% lower than the critical concentrations of composites prepared with the unfavorable conditions. That evidences improving the processing conditions for composites, and it is possible to prepare a conductive material with a lower concentration of conductive particles and lower variability of the volumetric resistivity values. The decrease in the critical CB concentration is due to the use of a minor quantity of conductive particles, which is beneficial for the processing of the polymer composite and in some potential application as vapor sensing and PTC effect, as examples.
Footnotes
Acknowledgements
We thank Diseño y Maquinados de Toluca for the construction of mini mixing machine.
Funding
This work was supported by