
Abstract
We introduce a new collection of data that consolidates information on European Parliament elections into one comprehensive source. It provides information on formal electoral rules as well as national-level and district-level election results for parties and individual politicians (including full candidate lists). The use of existing and new key variables makes it easy to link the data across the different units of observation (country, party, candidate, member of parliament) and join them with external information. Currently, the data cover four elections (1999–2014). Among other aspects, the collection should facilitate research on the European Parliament's allegedly weak electoral connection. In this article, we outline the main features of the datasets, describe patterns of intra-party competition and preference voting and conduct exploratory analyses of individual-level changes in list positions.
Introduction
The European Parliament (EP) operates in an intricate political setup regarding both its relations with other European Union (EU) institutions and its intra-chamber dynamics. Its members (MEPs) come from up to 28 member states and represent different national parties. At the same time, most national parties are affiliated to European party groups. Moreover, while MEPs deal with European matters, their recruitment occurs in elections that are formally and practically independent national-level contests (De Vreese and van der Brug, 2016; Reif and Schmitt, 1980; Van der Brug et al., 2022).
Empirical research into the behavior of MEPs has expanded considerably in the past decades, matching the empowerment of the legislature (for comprehensive reviews, see Hix and Høyland, 2014; Ripoll Servent, 2018; Yordanova, 2011). Most of these studies assume that the behavior of MEPs lacks an electoral connection in the sense that it is not motivated by re-(s)election concerns and is without electoral consequences. This assumption remains the standard view among EP scholars (Hix and Høyland, 2013; Judge and Earnshaw, 2008). However, systematic empirical studies of such electoral causes and consequences are scarce and somewhat limited in scope. 1
This remains a limitation of the literature on this topic because the large variety of electoral systems used in EP elections (Däubler and Hix, 2018; Farrell and Scully, 2007) may result in considerable heterogeneity in representational behavior (e.g. Bowler and Farrell, 2011; Hix, 2004; Hix and Hagemann, 2009) and electoral accountability (Sorace, 2021; Wilson et al., 2016). For example, several larger member states use subnational districts, which have become more prevalent since 2004 with their introduction in France (Navarro, 2016) and the EU accession of Poland. In addition, the use of preferential voting is now more widespread. No fewer than 10 of the 13 countries that have joined the EU since 2004 use flexible or open rather than closed lists.
An obstacle to empirical research into electoral incentives and effects is the lack of a comprehensive data source. While plenty of excellent data on EP elections exist, there is no consolidated and easy-to-use collection covering electoral rules, national- and district-level results for parties and electoral information for individual candidates and MEPs. What is already available from scattered sources includes classifications of electoral systems (Farrell and Scully, 2007) and party lists (Däubler and Hix, 2018), national-level election results for parties from the ParlGov database (Döring and Manow, 2020), information on MEPs’ formal parliamentary roles (Høyland et al., 2009) and several replication datasets (e.g. Daniel, 2015; Meserve et al., 2015). The various components of the European Election Studies are of limited use in this context.
This article introduces a new ‘one-stop shop’ for such data. 2 The information comes in the form of three datasets: an aggregate dataset with country-level information (e.g. electoral rules) and party-level results (at the national and district levels), a dataset for candidates (including list positions and preference votes where applicable) and a dataset for MEPs (with mandate types, district affiliation and convenient links to the other two datasets). The data collection covers four European elections (1999, 2004, 2009 and 2014).
This new data collection can help address a number of core research themes on the EP. To highlight their potential, in this article we use these data to describe recent EP elections with regard to intra-party competition, the take-up of preference voting and the extent to which MEPs are elected on the basis of personal votes. An exploratory analysis of the link between parliamentary activity (questions, reports and speeches) and list rank change for first-term MEPs reveals a complex pattern.
Electoral incentives, research themes and the added value of a new data collection
This new collection of data will enable researchers to explore several research themes on electoral incentives and the intra-party dimension in the EP. The first of these concerns voters’ choice of candidates in systems that allow for it. How do voters make such choices and on what kind of information do they base their decision (Christensen et al., 2020; Gattermann and De Vreese, 2017, 2022)? Not only is this an interesting question about voting behavior, but it also has implications for MEPs’ electoral incentives. At the same time, survey data rarely provide information on candidate choice, since it is too expensive to collect in this context. Many interesting questions can thus be answered using the candidate-level preference voting results we provide. Our data allow to examine preference vote take-up, candidate performance and the list-level characteristics of preference votes such as their concentration (Dodeigne and Pilet, 2021).
A broad second field comprises the link between electoral incentives and the behavior of politicians. Existing work has, for example, analyzed the impact of electoral systems on candidates’ campaign strategies (Hix and Hagemann, 2009; Lorenzo Rodríguez and Garmendia Madariaga, 2016; Obholzer and Daniel, 2016). For MEPs, the focus has been on representational roles (Brack and Costa, 2019; Farrell and Scully, 2010;), on the type of parliamentary activities they prioritize (Høyland et al., 2019; Sorace, 2018), on parliamentary voting (Däubler and Hix, 2018; Hix, 2004) and on their interactions with interest groups (Ibenskas and Bunea, 2021). 3
A third theme examines the consequences of parliamentary behavior on the electoral performance of parties and candidates. For example, analyzing data from six EP elections, Hobolt and Høyland (2011) show that parties that nominate highly experienced national politicians as leading candidates tend to be rewarded by voters. Their focus on the top candidate from each list reflects the data availability constraints that have characterized extant research at the intersection between the EP legislative and electoral arenas. While there is evidence for MEP productivity-based retrospective voting being a feature of the 2019 EP elections (Sorace, 2021), no study has tested longitudinally whether the vote shares of party lists vary with the different quality of MEP incumbents or whether citizens punish legislators for their voting record on controversial issues. Our datasets offer the possibility to easily match information on MEPs, candidates and election results, thereby providing a starting point for answering such research questions.
The COMEPELDA collection
Starting point, aims and approach
A major obstacle to research on the electoral connection in the context of the EP appears to be the lack of a consolidated and comprehensive source of both electoral data on different levels or actors (i.e. MEPs, parties and candidates) and information on the institutional context of EP elections in the various countries. Data do exist on various aspects of EP elections. Institutions are described, for example, by Däubler and Hix (2018), Farrell and Scully (2007) and Stöver and Wüst (2006). The ParlGov database (Döring and Manow, 2020) provides aggregate election results at the national level, but does not include information on the level of subnational districts. Data on the electoral performance of politicians are often available on the web, but the sources are scattered. Hence, rather than collecting genuinely new data, our main aim was to assemble existing data from different sources and integrate them into a coherent collection.
Guiding our efforts was a focus on electoral data. Rather than taking a more encompassing approach toward electoral incentives (e.g. trying to collect biographical data on individual politicians or including information about what happens inside the EP such as party switching), we concentrated exclusively on the electoral context and a rather narrow set of variables. This helped us both keep the scope manageable and build a data collection characterized by very high coverage and quality as a result of thorough checking. Further, because our collection has a somewhat narrow focus on the electoral arena, it is important that scholars can easily link it to existing data and extend it in the future. Therefore, we tried to set up the data in a way that makes it simple to combine our datasets with others. We will describe this in more detail below.
In line with the idea of keeping the task focused, we also delineated the case coverage early in the project. First, we decided to study EP elections since 1999. We presumed that locating information for contests before that year could be challenging, since online availability is limited. The 2019 election occurred while the project was already ongoing, and we opted to finish the work on the earlier cases rather than take on another task, which can be addressed in future research. Second, motivated by an interest in how previous and upcoming elections affect politics in the EP, we chose to include those parties that: a) win at least one seat in the current election, b) won at least one seat in the previous election or c) present as candidate at least one MEP who served during the outgoing term of the EP. The first of these criteria is simple to implement, the second slightly harder (for instance in case of party renaming) and the third turned out to be occasionally challenging (since some outgoing MEPs may run for parties that garner few votes).
Our data collection starts from three main sources. First, we imported national-level data on votes and seats from the ParlGov database (Döring and Manow, 2020), which also helped delineate the cases to cover following the rules outlined above. 4 Second, we employed the data from Høyland et al. (2009), which allowed us to identify MEPs and the basic information on their parliamentary mandates. Third, large parts of the information on electoral systems was retrieved from Däubler and Hix (2018), who cover the elections between 2004 and 2014. The remaining data, especially party-level results for member states with subnational districts and politician-level information on list positions and preference votes, were harder to assemble. We partly reused the data provided by Däubler and Hix (2018) and Hermansen (2018), but much information had to be collected from online (and occasionally offline) sources. Whenever possible, we relied on information available from the EP itself (e.g. European Parliament, 1999, 2004) or on the official election results provided by election authorities, home affairs ministries and national statistical offices.
Some readers might think that compiling these data requires only a few days of webscraping and some data wrangling. Yet the necessary steps are numerous, and due to various problems, time intensive. To start with, some of the data were difficult to find. For example, more detailed information such as candidate-level results is not always available on English-language websites. The 28 countries use a broad range of languages, some of which are written in non-Latin alphabets (Bulgarian and Greek). A particular challenge in collating the data was correctly matching parties and politicians across data sources given the variations in formatting, naming and spelling due to the inconsistent handling of party alliances, language-specific characters, and additional forenames. Other difficulties arose from various institutional or behavioral idiosyncrasies. For example, candidates running as independents or the fact that Italian candidates may be listed (and are often elected) in more than one district caused additional complexity.
Introducing the three datasets
Our data collection consists of three datasets, which refer to the different entities of interest: member states and parties (aggregate data), candidates and MEPs. Table 1 provides an overview of the content of the three datasets
Structure and content of the datasets.
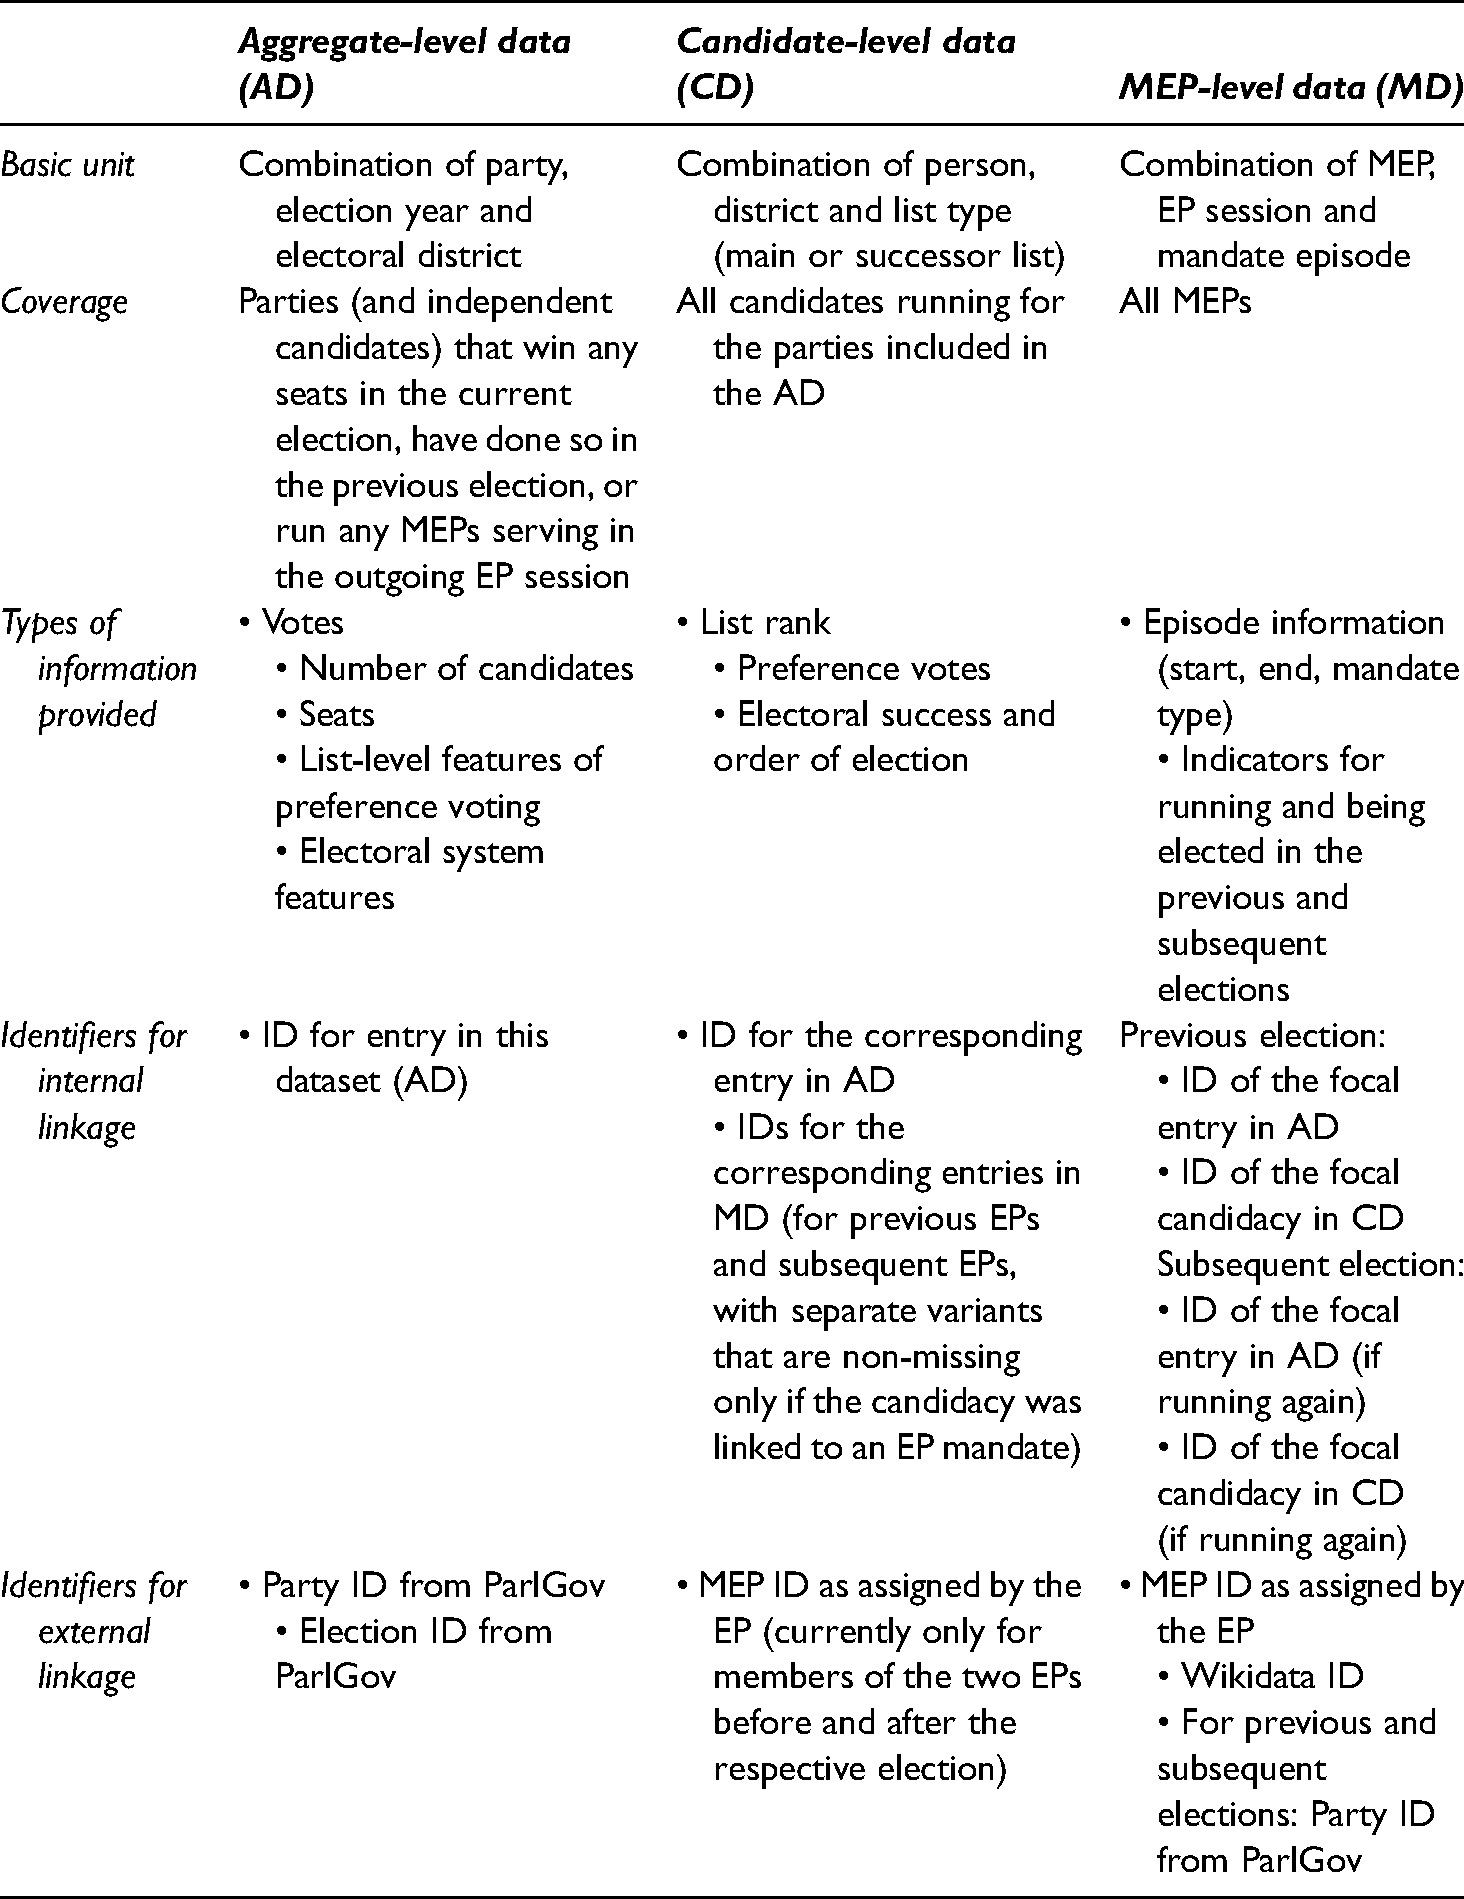
The aggregate-level dataset comprises approximately 1800 observations. The unit of analysis is the party as it contested the election (i.e. including alliances and any team of candidates running under the same label) in an EP election in a district. In other words, the unit of analysis is an electoral party, because all the variables (e.g. votes, seats) are well defined at this level in a given election. Complications arise for ID variables or when comparing units over time, since alliances, which are frequent in certain countries (e.g. Croatia, Portugal and Spain), are often short-lived. Similar problems are caused by party name changes and mergers. In general, we use the same party ID and party name as ParlGov, which need not be the same as the label actually used in the respective election. As explained in the codebook, our data include an indicator variable for party alliances and additional IDs that allow users to look up component parties in ParlGov. In addition, the dataset provides information on party lists that run separately but form apparantements for inter-party seat allocation.
The substantive data encompass information on the number of votes, seats and candidates, complemented by list-level summaries of preference voting. For several variables, we present both country-level and district-level versions. If a country does not use subnational districts, the entries in the latter are identical to those in the former. This dataset also holds information on the electoral systems used in the various countries with regard to both the between-party dimension (e.g. the electoral formula used or whether multi-tier allocation takes place) and the within-party dimension (e.g. ballot structure or whether preference voting is obligatory). The included ParlGov IDs for party, alliance and election can be used for external linkage in combination with the Party Facts database (Döring and Regel, 2019).
The candidate-level dataset provides information on all the candidates running for those parties included in the aggregate-level dataset. The file covers more than 29,000 observations. The main substantive variables are pre-electoral list rank (for systems in which parties make that decision), preference votes (where applicable), indicators for electoral success and order of election. Within the collection, the dataset can easily be linked to the other files using the internal IDs for the corresponding entries in the aggregate-level and MEP-level data (here with different variants referring to the previous and subsequent terms and – in the case of multiple candidacies – indicating whether the candidacy was linked to an actual mandate).
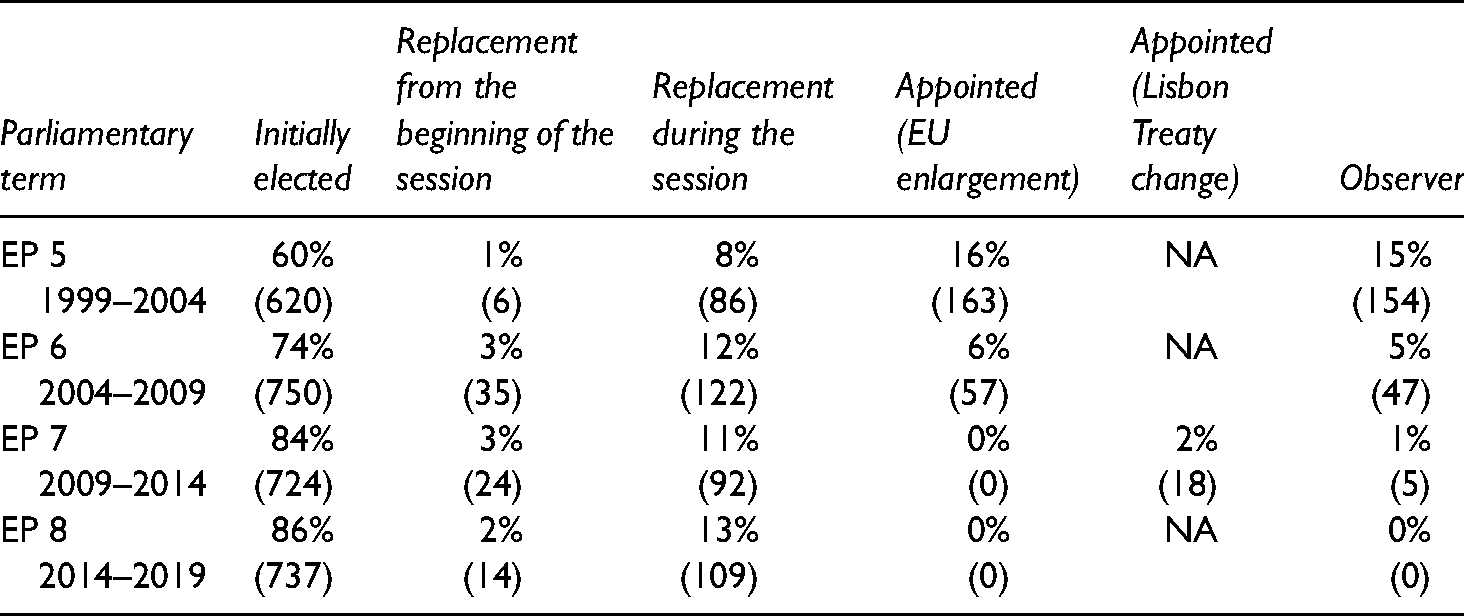
The MEP-level dataset includes more than 3700 observations. The units refer to a specific ‘mandate episode’ of an MEP in an EP session, which is defined by a certain path to becoming an MEP. Table 2 shows the frequency of the mandate types across sessions. Although there is only one episode per MEP and EP in most instances, some politicians may have two or three episodes within a session, especially in the context of EU enlargement. For example, some Bulgarian and Romanian legislators had up to three statuses in EP 6: as observers until January 1 2007, then as appointed MEPs until elections were organized in each country and, finally, as elected MEPs afterward.
Mandate types of episodes (row %, absolute number in parentheses).
The MEP-level dataset holds basic episode information (start, end and episode type) and indicators for whether the MEP was a candidate and was elected in the previous and subsequent elections. 5 It also provides information on the electoral party (ParlGov Party ID) and district with which the MEP was affiliated in the previous and subsequent elections (where applicable). For MEPs with several candidacies in the same election, these variables refer to the ‘focal’ candidacy. For the previous election, it refers to the district the MEP eventually represented and the list type – main or successor list – on which the mandate was based. 6 For the subsequent election, it refers to the district represented in the outgoing EP and the main list. Adding further information from the other datasets of the collection is easy using the simple numeric ID variables included. To facilitate joining information from external sources, The data also come with the MEP's Wikidata ID to enable scholars to join additional information from Wikidata, the database hosted by the Wikimedia Foundation. This could be done by using the R package WikidataR (Keyes et al., 2021). It is also possible to link to the Comparative Legislator Database (Göbel and Munzert, 2021), which at the time of writing covers 10 national-level parliaments (but not the EP).
Illustration of data features and example analyses
We first discuss the electoral systems used in the 2014 EP election as visualized in Figure 1. The classification follows that of Däubler and Hix (2018). In our data, we distinguish 29 units for this purpose, the 28 member states and Northern Ireland (which has a different electoral system and party system than Great Britain). In line with the EU Treaty, elections need to be conducted using some form of proportional representation system (subsuming STV, which is used in Ireland, Northern Ireland and Malta). Of the list-based systems, seven employed closed lists (intra-party seat allocation based on the pre-electoral list rank), ten had open lists (intra-party seat allocation based on preference votes exclusively), and nine flexible ones (candidates can ‘jump the queue’ given by the pre-electoral ranking if they win a certain number of personal votes). In eight of the 29 cases, a candidate vote is obligatory. Some form of subnational district is found in six countries (France, Germany, Great Britain, Ireland, Italy and Poland).
Intra-party competition
Intra-party competition at the ballot, induced by the existence of preferential voting, generates the strongest electoral incentive for personal vote seeking, because candidates need to distinguish themselves from co-partisans that benefit equally from the same party reputation (André et al., 2014; Carey and Shugart, 1995; Hix and Hagemann, 2009). The standard approach to testing the argument follows the ‘conditional effect of district magnitude’ hypothesis introduced by Carey and Shugart (1995). Intra-party competition is assumed to increase with district magnitude (M) in systems allowing for a candidate vote, whereas under closed lists personal vote-seeking incentives should decrease in larger districts, since candidates become more anonymous.
Using M as an indicator of intra-party competition suffers from a number of problems. First, the measure also taps into other concepts, especially the size of the district electorate. The various mechanisms linked to the correlates of M prove hard to disentangle (André and Depauw, 2014). Second, as proposed by Crisp et al. (2007), there is no guarantee that M captures co-partisan crowdedness. In the original contribution, Carey and Shugart (1995: 431) discuss that the ratio calculated as the number of a party's candidates over M is actually the ‘key determinant’ of the need for intra-party distinction; nevertheless, they settle on M as the ‘fixed and identifiable’ part, arguing that the number of a party's candidates ‘tends to rise with M’. Crisp et al. (2007) take up the ratio idea again and make the valid point that the notion of crowdedness would require an appropriate denominator equaling the expected number of seats a party is going to win.
In our data, there is a high correlation between M and the number of candidates parties run (Pearson's r = 0.80, Spearman's rank correlation ρ = 0.81). Figure 2 plots the ratio of party candidates and party seats against M (the axes use a log10 scale). The value of this ratio may be the best prediction of intra-party competition that MEPs have, at least at the beginning of the term (their party's electoral prospects may change over time, of course). As can be seen, the relationship between the two variables is rather complex. While the smoothing line points to a linear relation in the middle range of M (approximately between 4 and 15), the overall relationship between M and intra-party crowdedness has a sigmoid shape (Spearman's rank correlation ρ = 0.34). Researchers must thus be careful when using M as a measure of intra-party competition in EP elections (and beyond). Indeed, the ratio of candidates and seats might not be the ideal solution; one problem of this approach is that typically few candidates are serious contenders, so the indicator tends to overestimate intra-party competition, and possibly not equally in all instances (André et al., 2014: 236).
There is another thorny issue with M in the context of EP elections. Three of the member states with subnational districts (Germany, Italy and Poland) operate a two-tier seat allocation system under which seats are first assigned between parties at the national level and then within parties to the districts. The German case (whose observations are excluded from Figure 2) is even trickier, since typically only the Christian Democrats run 16 state-level lists (CSU in Bavaria, CDU in the other states; lists are connected for inter-party allocation), whereas the other parties employ one national list Hence, in Italy, Poland and Germany, how to code M remains debatable. Overall, there is scope for new theoretical and empirical suggestions about measuring intra-party competition (for a discussion of vote dispersion measures see Dodeigne and Pilet, 2021), some of which can easily be implemented with our data collection.
Preference voting
As pointed out above, candidate voting by citizens is of interest both in itself and in terms of its consequences for MEPs’ incentive structures. A first question relates to the extent to which voters use the preference vote option if they can choose between casting a party vote or supporting a candidate. Figure 3 displays the share of party voters casting preferences at the party level in those member states in which preference voting is optional and that grant citizens one candidate vote. 7 Each circle represents the value of a national party in an EP election; the mean across the parties in each election is shown as a solid larger point. Member states are arranged in descending order by the mean across all party-level data points. Within each country, the most recent election is shown at the top and the earliest EP election at the bottom.
This figure shows that the uptake of the candidate vote option varies substantially across countries. Broadly speaking, in some countries, around three out of four voters regularly choose a candidate (Slovenia, Denmark, Slovakia and Croatia). In Bulgaria and Austria, on the contrary, typically only one out of four voters does so. This may be because these two countries had flexible lists with hard-to-reach thresholds before 2014 (Däubler and Hix, 2018). Both citizens and candidates may care less about personal votes if these are unlikely to change the list order. In Bulgaria, we find the expected increase in take-up following the reduction of the preference vote threshold for candidates. Sweden occupies a central position in the graph. Interestingly, the Scandinavian country also features the clearest differences over time. Perhaps surprisingly, the take-up of the candidate vote has decreased considerably over time in Sweden. Overall, the graph illustrates that a larger part of the variation is found across countries rather than between parties or over time.
Another question is whether preference votes ‘make a difference’. While providing a detailed answer to this question is beyond the scope of this paper, we show some results based on a simple intuitive approach. For countries that use lists pre-ranked by parties and allow for preference voting, we can identify MEPs who were elected based on the actual rules in place, but who would not have been so under closed lists. In other words, given the total number of seats won in the given EP election, the selectors would have preferred other candidates to take them. Figure 4 illustrates how often that happens, distinguishing for each country-election the share of MEP candidates who owe their election to their personal vote (in color) and those who would also have been elected under a closed list rule (in light gray). It could be argued that party selectors at the time of nominations cannot clearly predict the number of seats the party will win. Using a stricter definition, we therefore further distinguish candidates (with darker colors) whose list position was at least three ranks lower than the number of seats won (e.g. list position five or lower if the party won two seats). 8 Member states are sorted according to the share of candidates elected out of order (pooled across elections) and within country by election year (most recent at the top). The circles indicate the average size of the national delegation.
Candidates can become MEPs even if they were ranked at a list place insufficient for election according to the selectorate's ranking. This phenomenon is most frequent in Italy. In the four elections covered, the relative frequency of Italian MEPs ‘jumping the queue’ was 40–47% of initially elected candidates. Austria and Bulgaria are again at the bottom end of the graph; this is not surprising since it is hard to reach the preference vote threshold in flexible list systems if few voters are inclined to use the candidate vote option, as discussed above. In most countries, out-of-order election occurs regularly, although infrequently. However, caution is warranted when interpreting the number of such candidates. Low figures may not imply that parties always ‘get their way’; often selectors’ and voters’ preferences may simply be aligned, or parties even anticipate who will be the most popular candidates in the electorate. Again, these patterns point to interesting research possibilities from the perspectives of both voting and parliamentary behavior.
Parliamentary activity and re-selection
From a principal–agent perspective (Hix, 2004; Hug, 2016; Klüver and Spoon, 2015; Mühlböck, 2012), the national party selectorate is one of the key principals of MEPs, since it decides on renomination and therefore crucially affects re-election prospects. If an electoral connection is at work, the basic expectation would be that party selectors reward those MEPs who work hard and sanction those who do not. Previous empirical evidence for such a relationship is mixed, though. 9
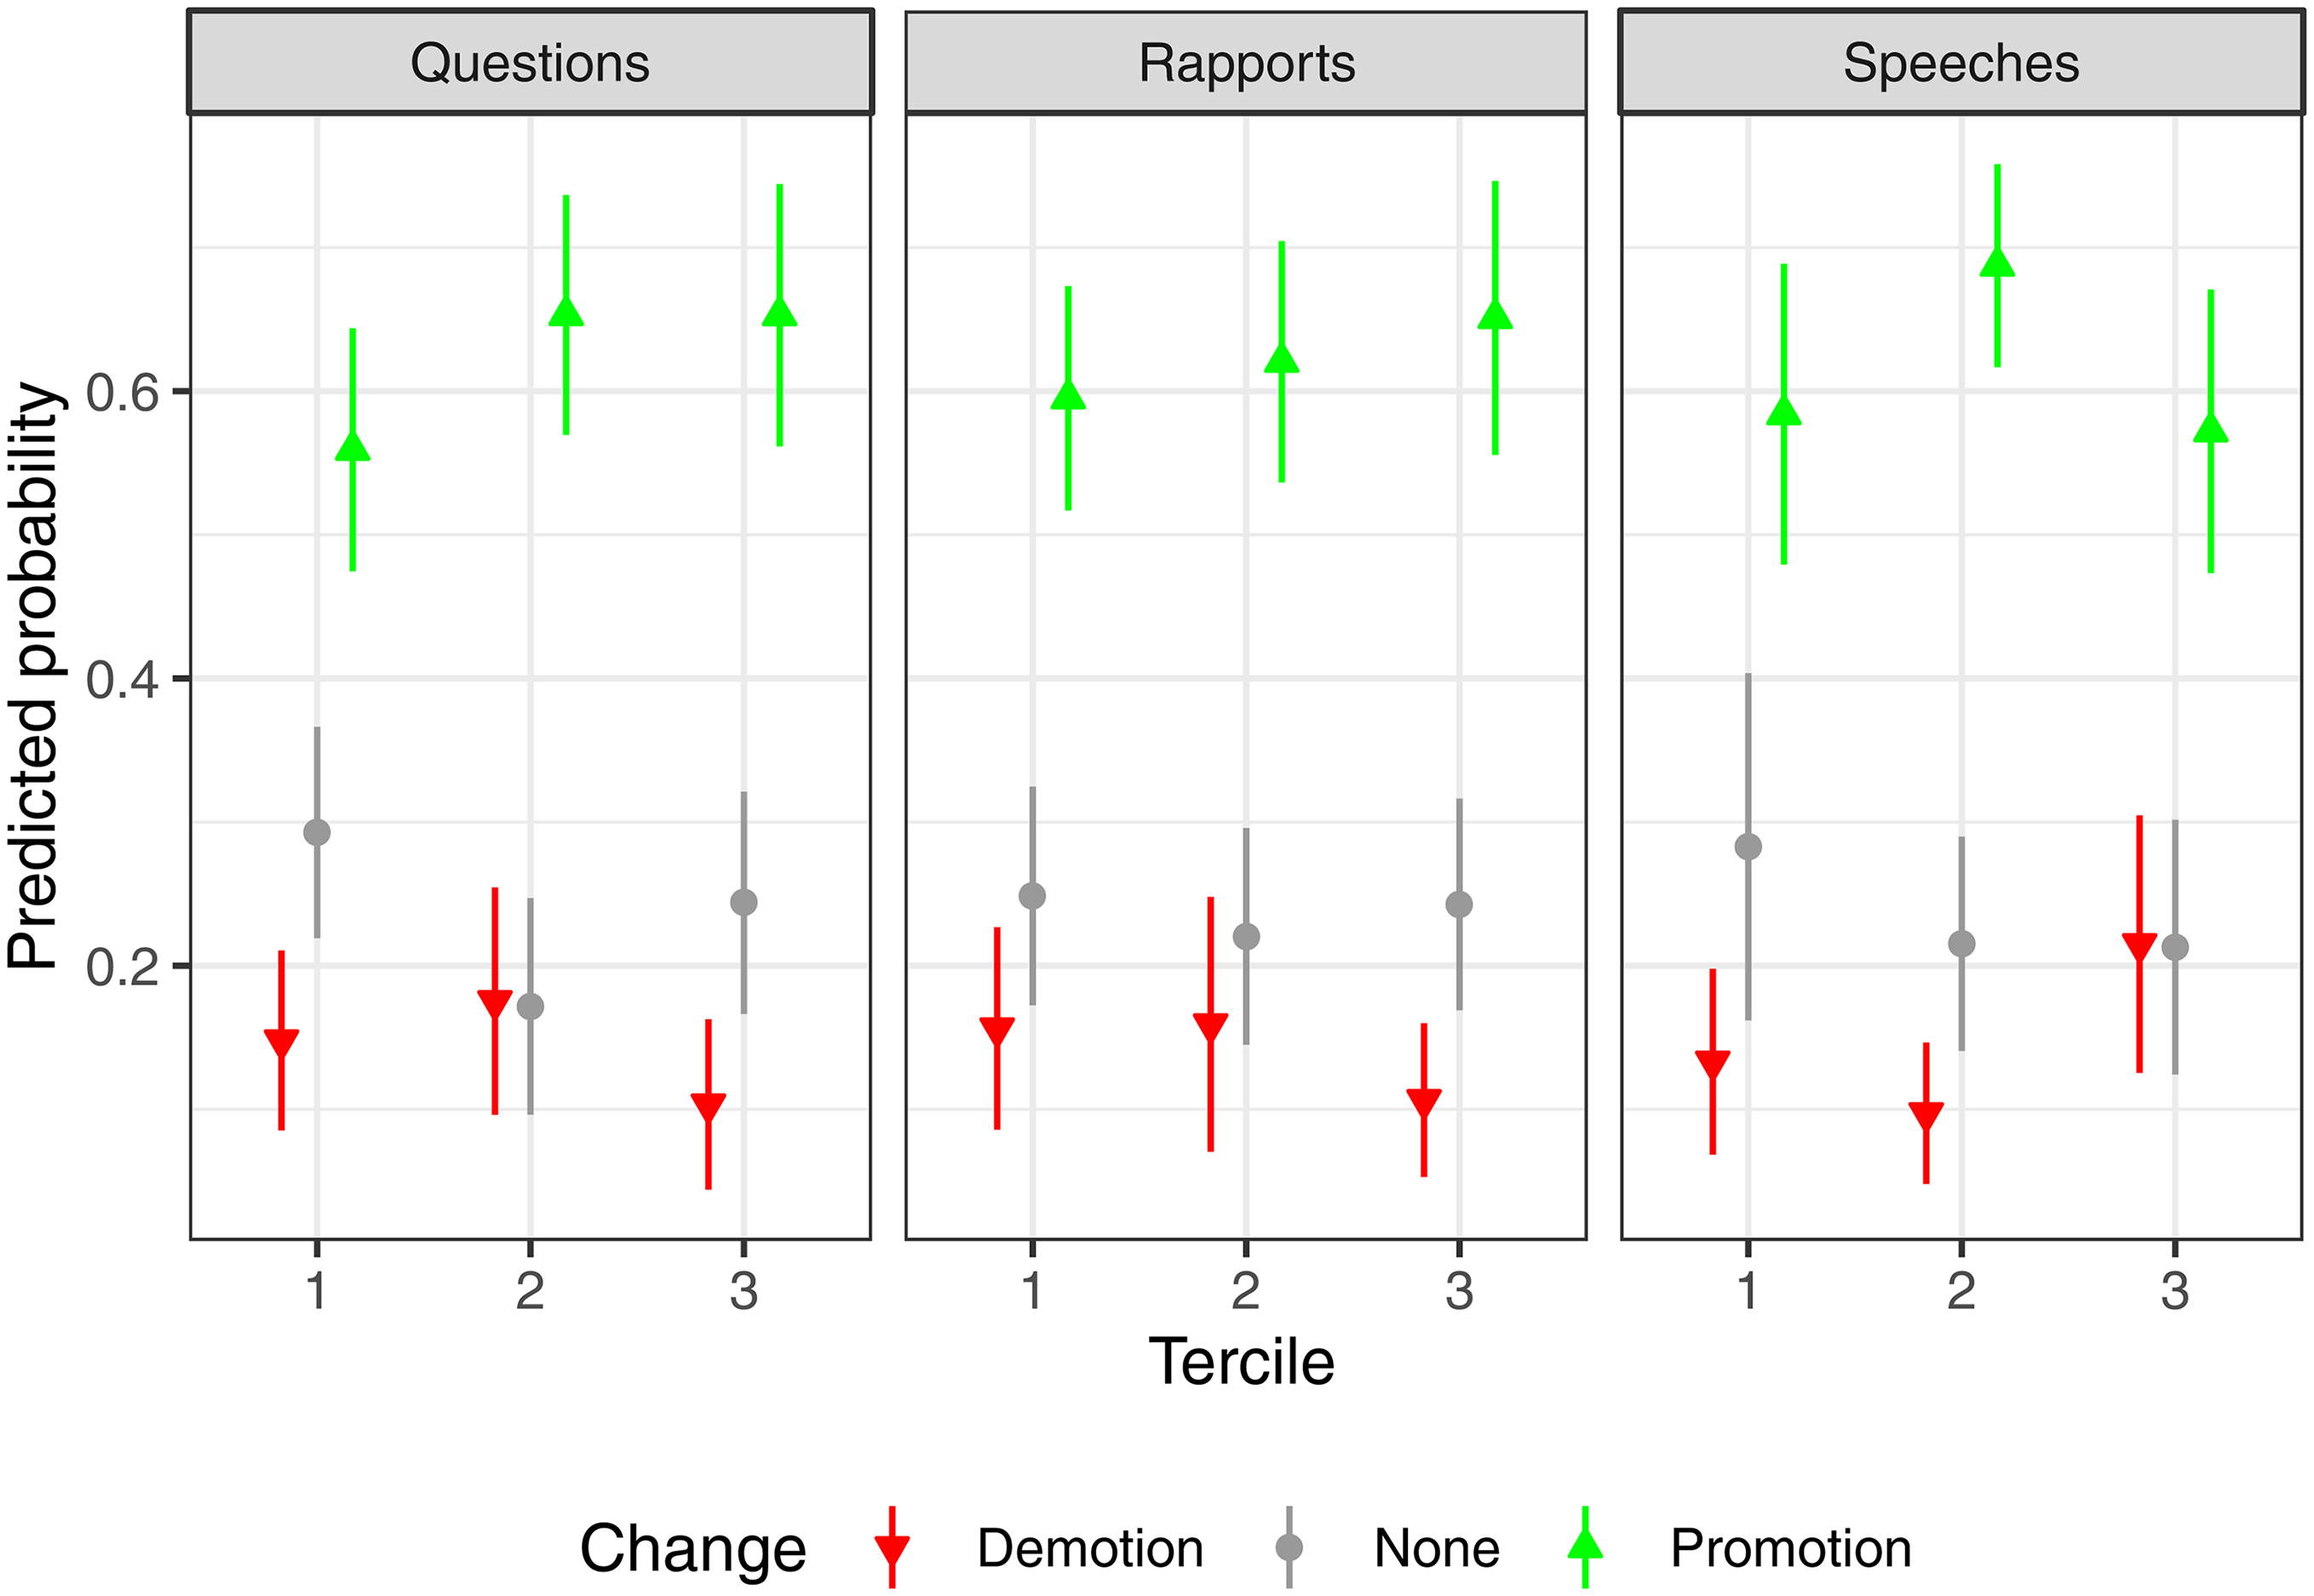
COMEPELDA allows us to examine this relationship from a variety of perspectives. As an example, we present the results from a simple model analyzing the change in list position for outgoing MEPs (who were running and renominated). The analysis focuses on first-time MEPs, since their initial list position cannot have been affected by prior EP work in a narrow sense. Hence, selectors may update their assessment of these politicians based on their performance during their first term in the EP. As dependent variables, we consider a binary indicator for demotion (lower list place than the previous one) and, for MEPs who did not start off from the first list place already, a ternary indicator for demotion, no change or promotion. To improve comparability, the analyzed set of MEPs is restricted to those who rerun for the same party (i.e. those whose party ID remains constant) in the same district and whose party did not change between running on its own and as part of an alliance over time. To avoid further assumptions about functional form, MEPs are grouped based on the terciles of the distributions of the number of reports, questions and speeches. 10 As control variables, we include age, sex, the co-partisan crowdedness measure discussed above (in logged form) and indicators for EP leadership position and replacement MEP status. To capture the variation in starting points and marginality, we consider the ex-ante list rank and ex-ante rank of election, each with indicators for being first and with a relative measure dividing the rank by the total number of candidates and seats (André et al., 2015).
Table 3 summarizes the results that, as in previous work, are somewhat mixed. In Model 1, for the binary demotion variable, five of the six activity-related coefficients have the expected negative sign, suggesting that MEPs are less likely to be demoted if their activity does not fall in the bottom third, but none of these coefficients is statistically significant. Surprisingly, MEPs who give many speeches face a higher risk of being demoted (p < 0.05). For the analysis of the trichotomous measure (demotion, no change and promotion), Figure 5 displays the predicted probabilities based on Model 2. We can see that MEPs asking at least an intermediate number of questions are more likely to be promoted. The differences for reports are fairly muted, while non-linear patterns are clearly visible for speeches. MEPs who speak moderately often are most likely to be promoted. Again, those speaking most frequently are most likely to receive a worse list position. It is an interesting question whether this is an endogeneity problem in the sense that we do not adequately capture the renomination-related incentives behind the need to speak or if these MEPs often say things disliked by their national selectorate.
Regression analyses of the change in list rank.
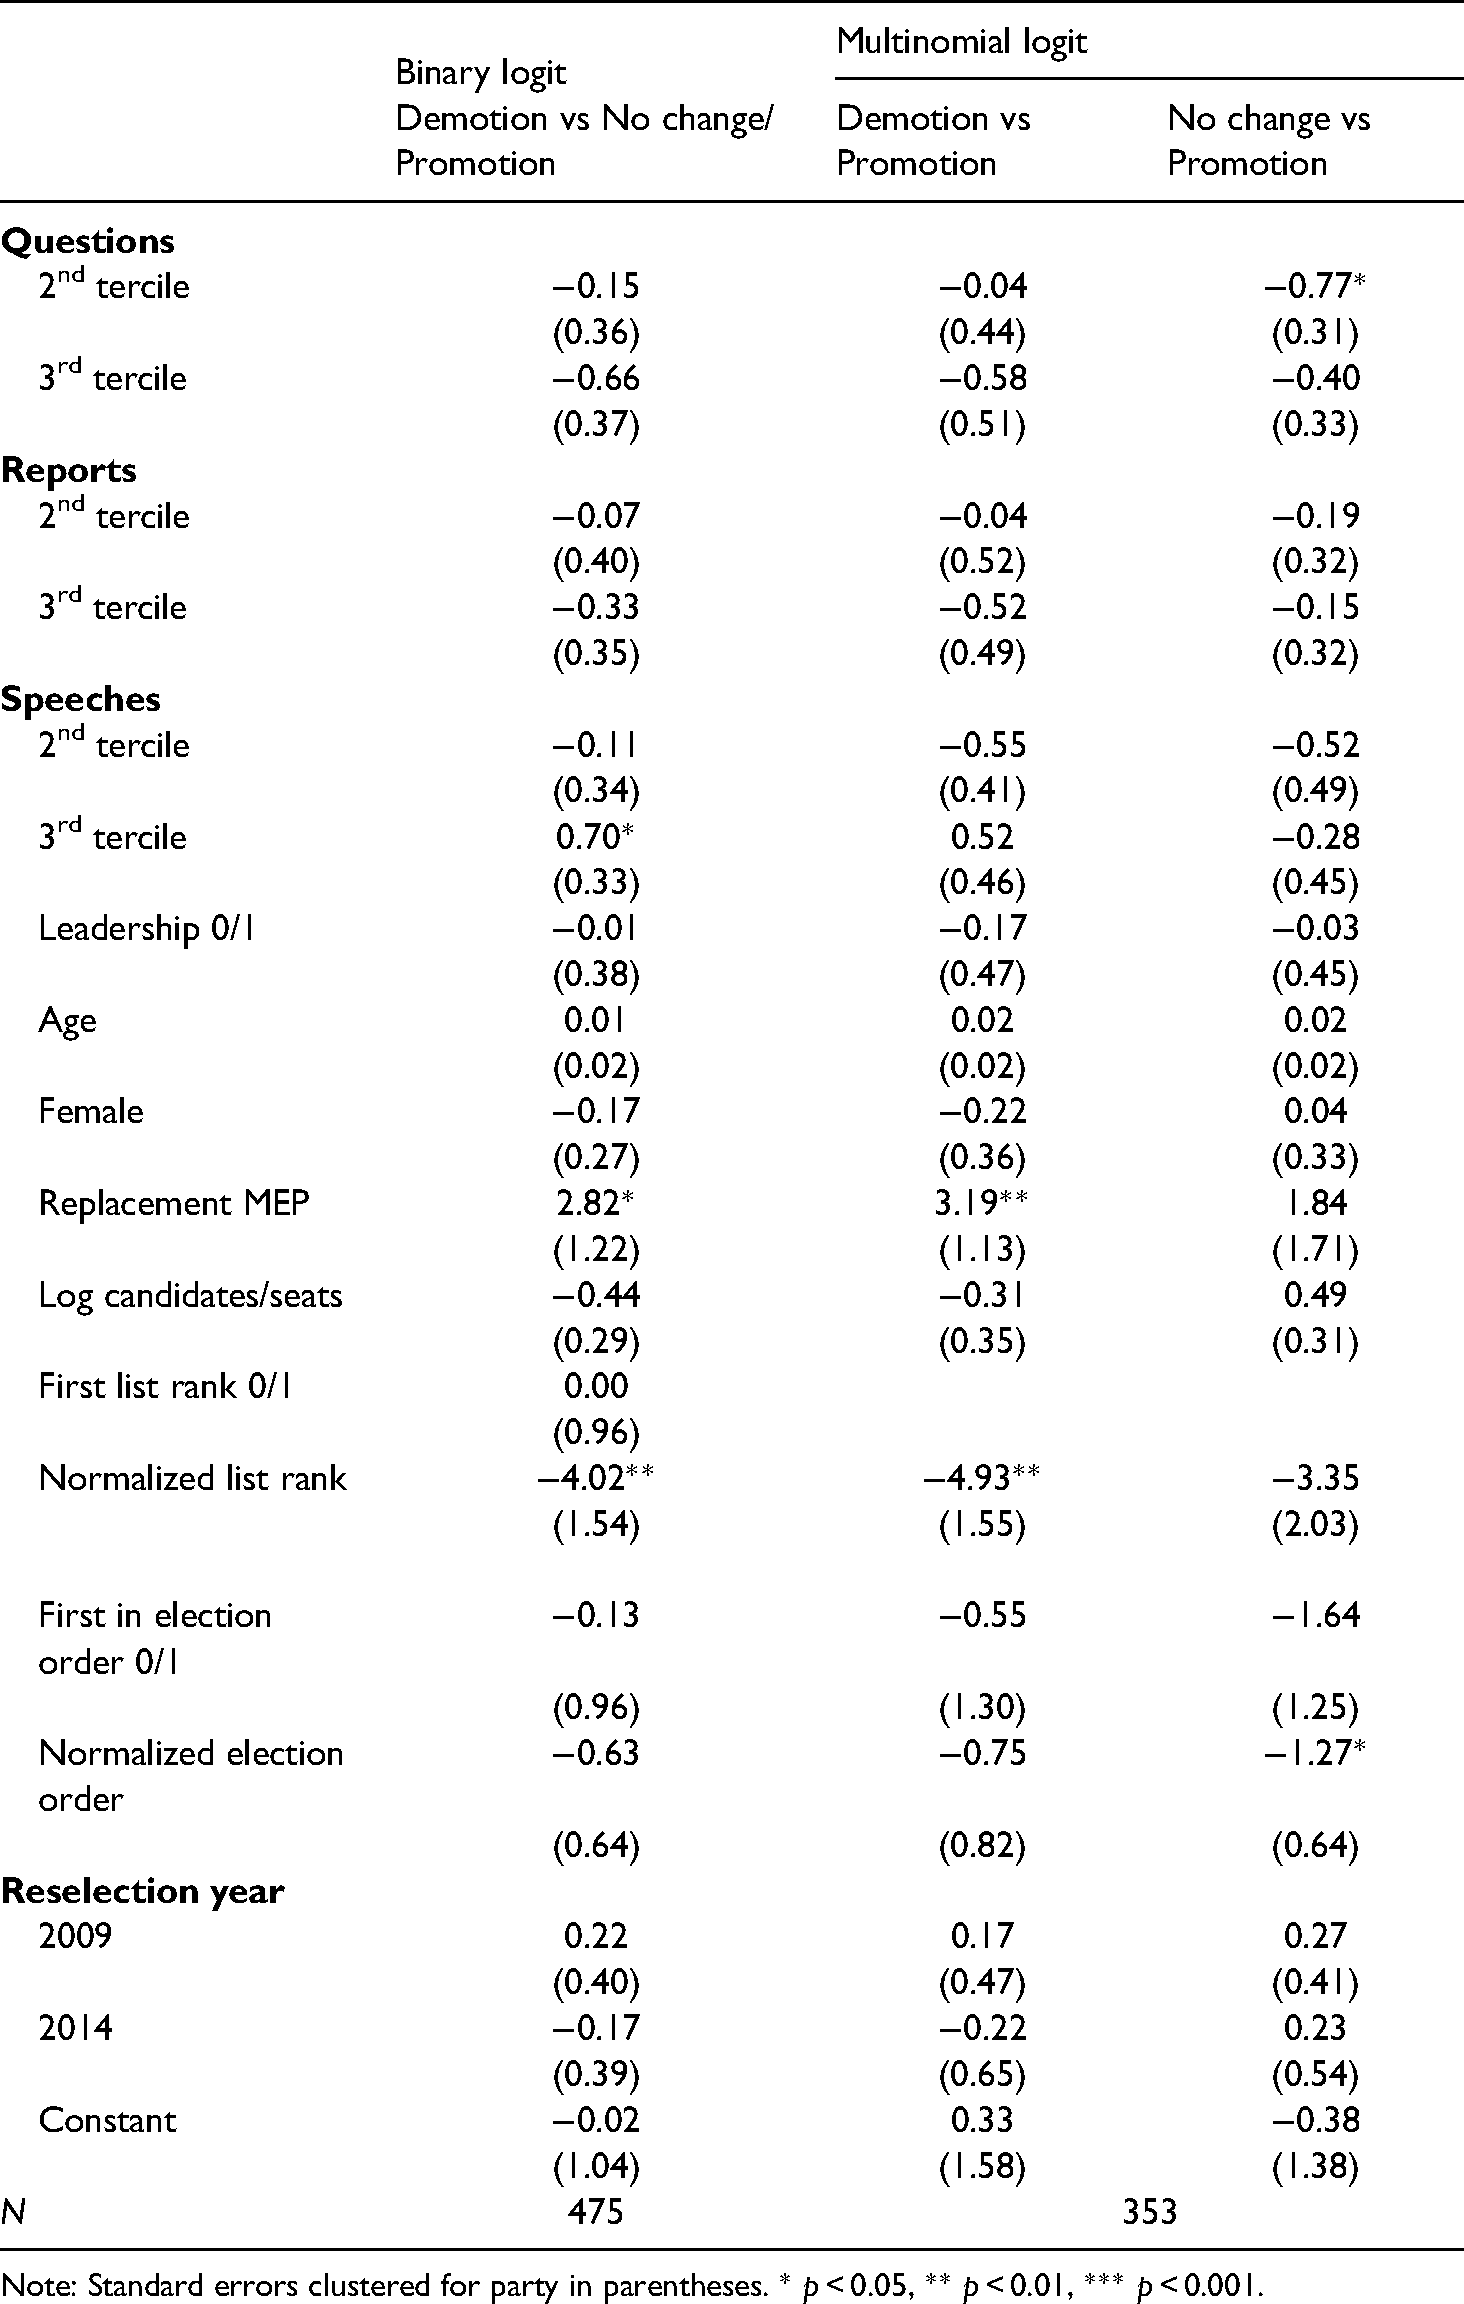
Note: Standard errors clustered for party in parentheses. * p < 0.05, ** p < 0.01, *** p < 0.001.
This analysis is merely exploratory, and further research should examine more thoroughly, both in theoretical and in empirical terms, how accountability patterns vary with such factors as ballot structure, citizens’ preference-voting behavior, and party type. Our data either provide the relevant measures to do so or make it easy to add such information from other sources.
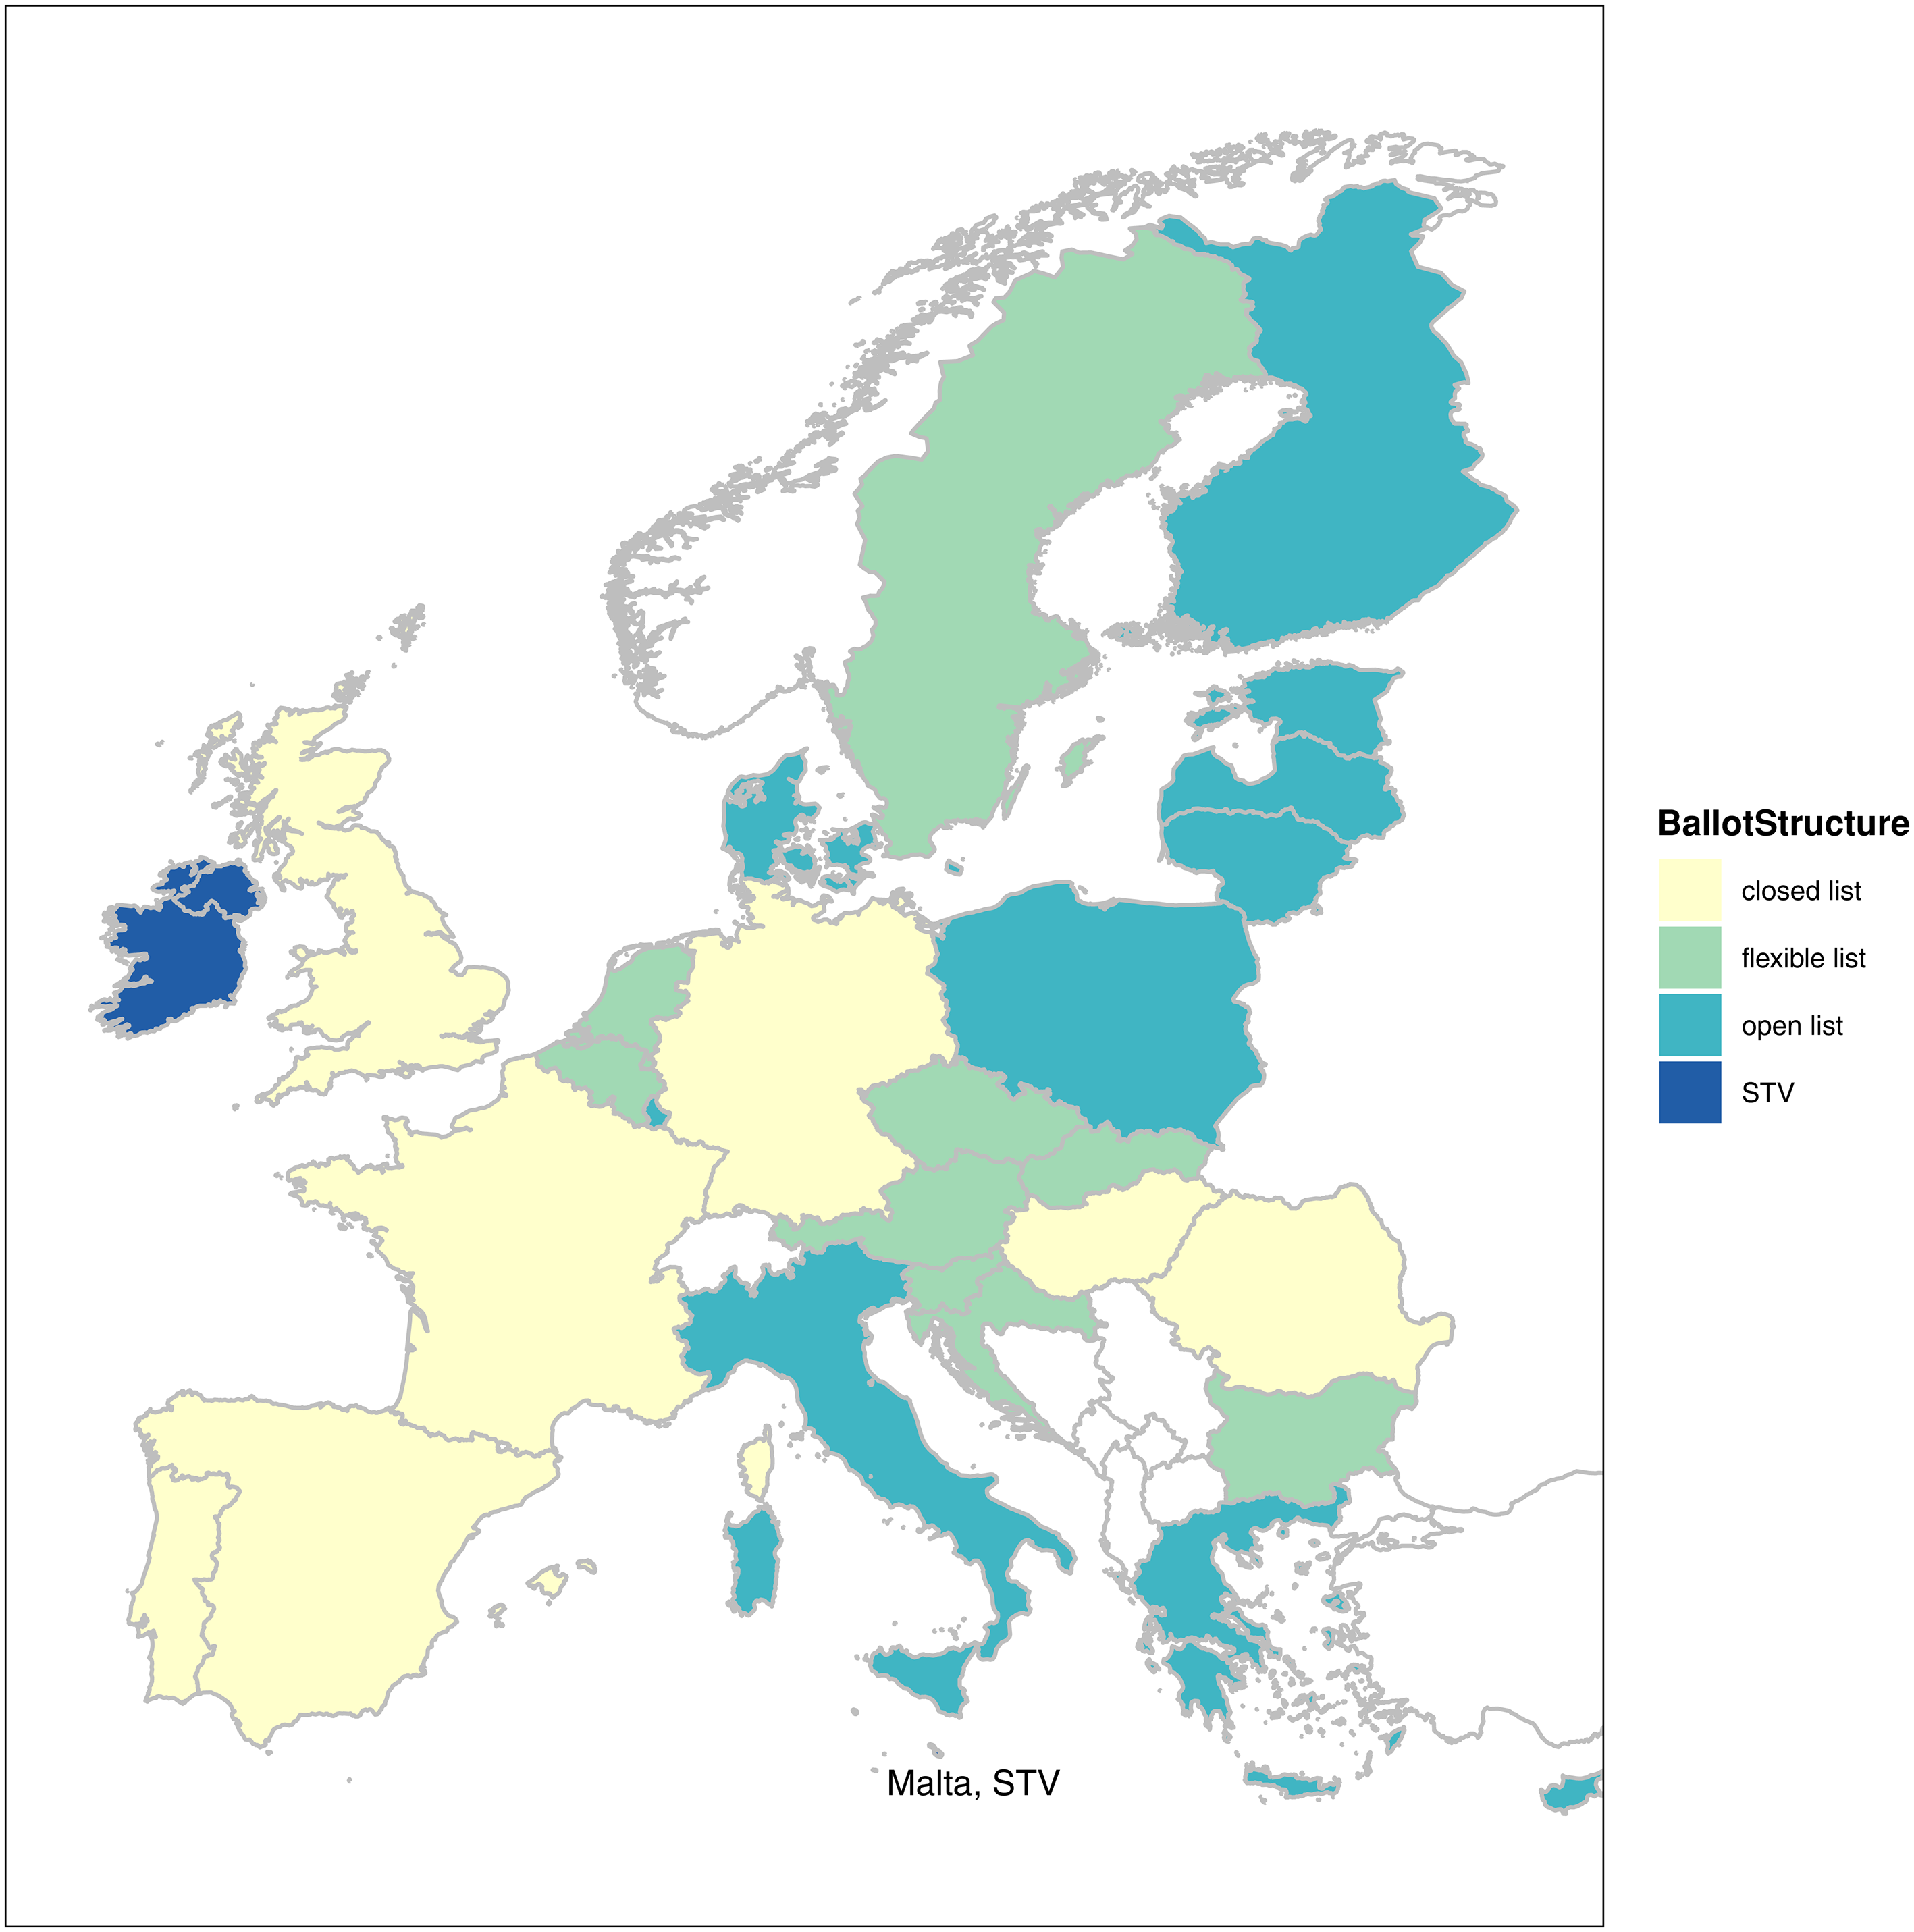
Ballot structure in EP elections, 2014.

The non-linear relationship between district magnitude and intra-party competition.
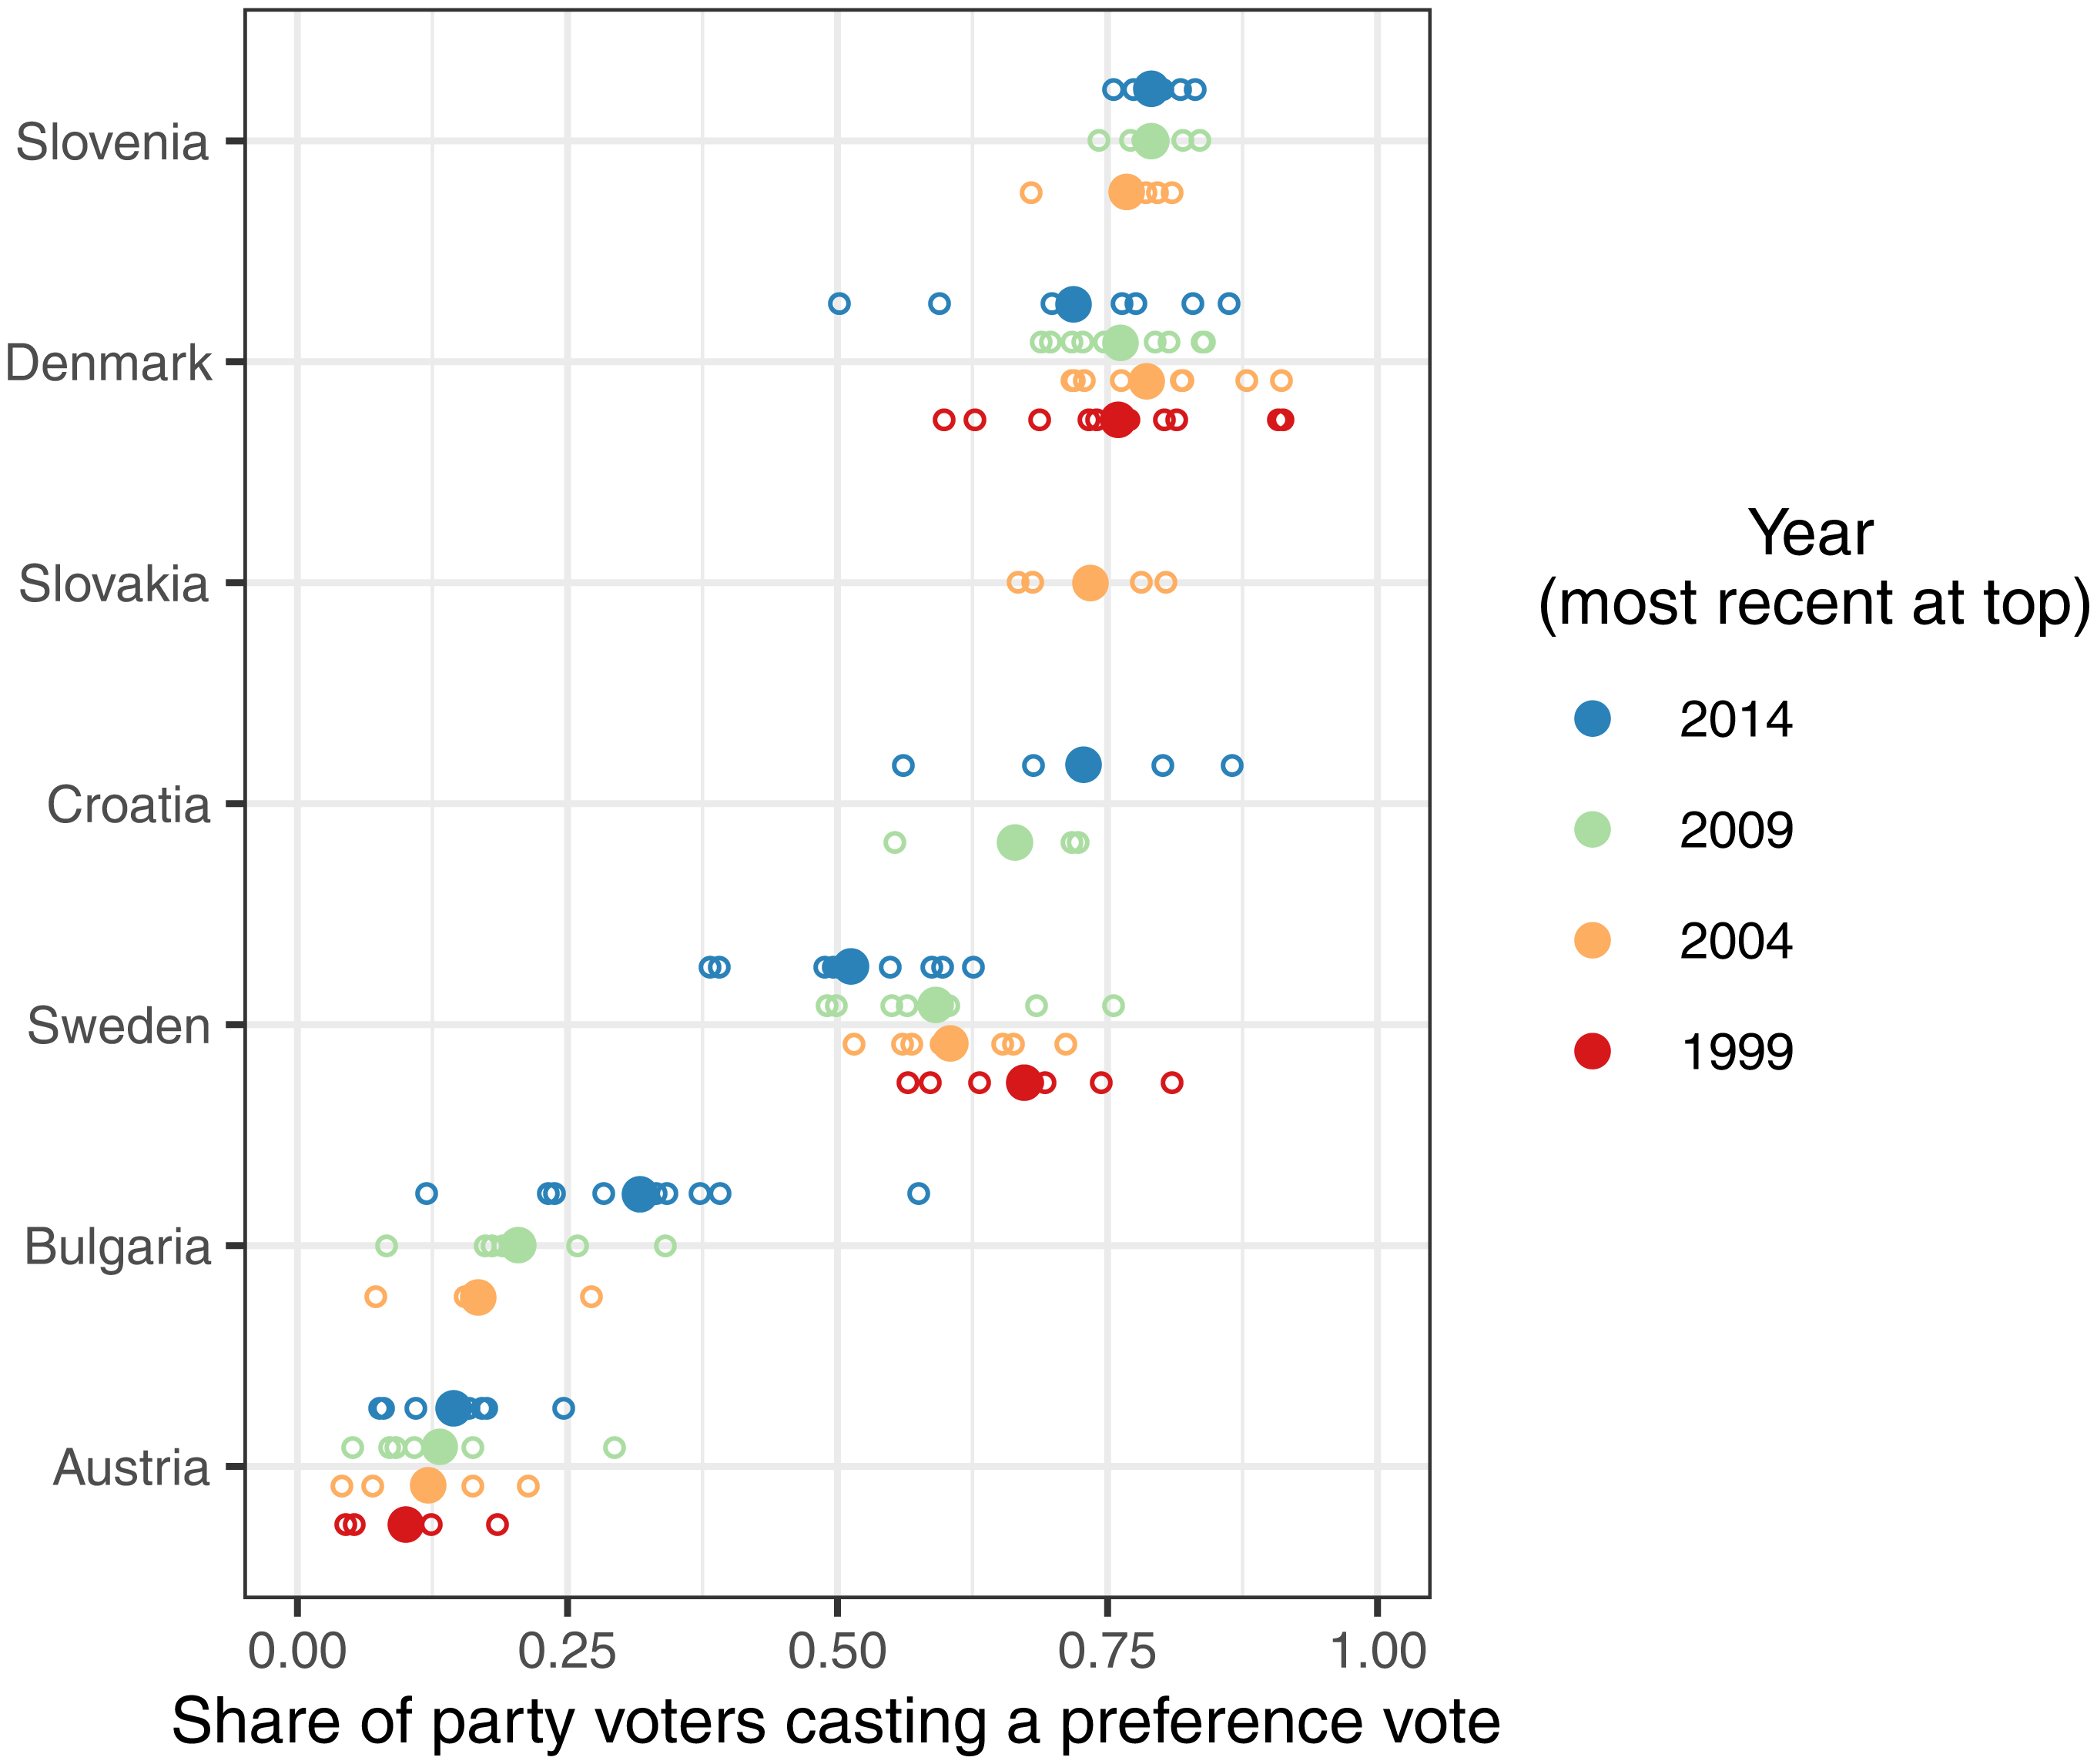
Preference vote use across countries, across parties and over time.
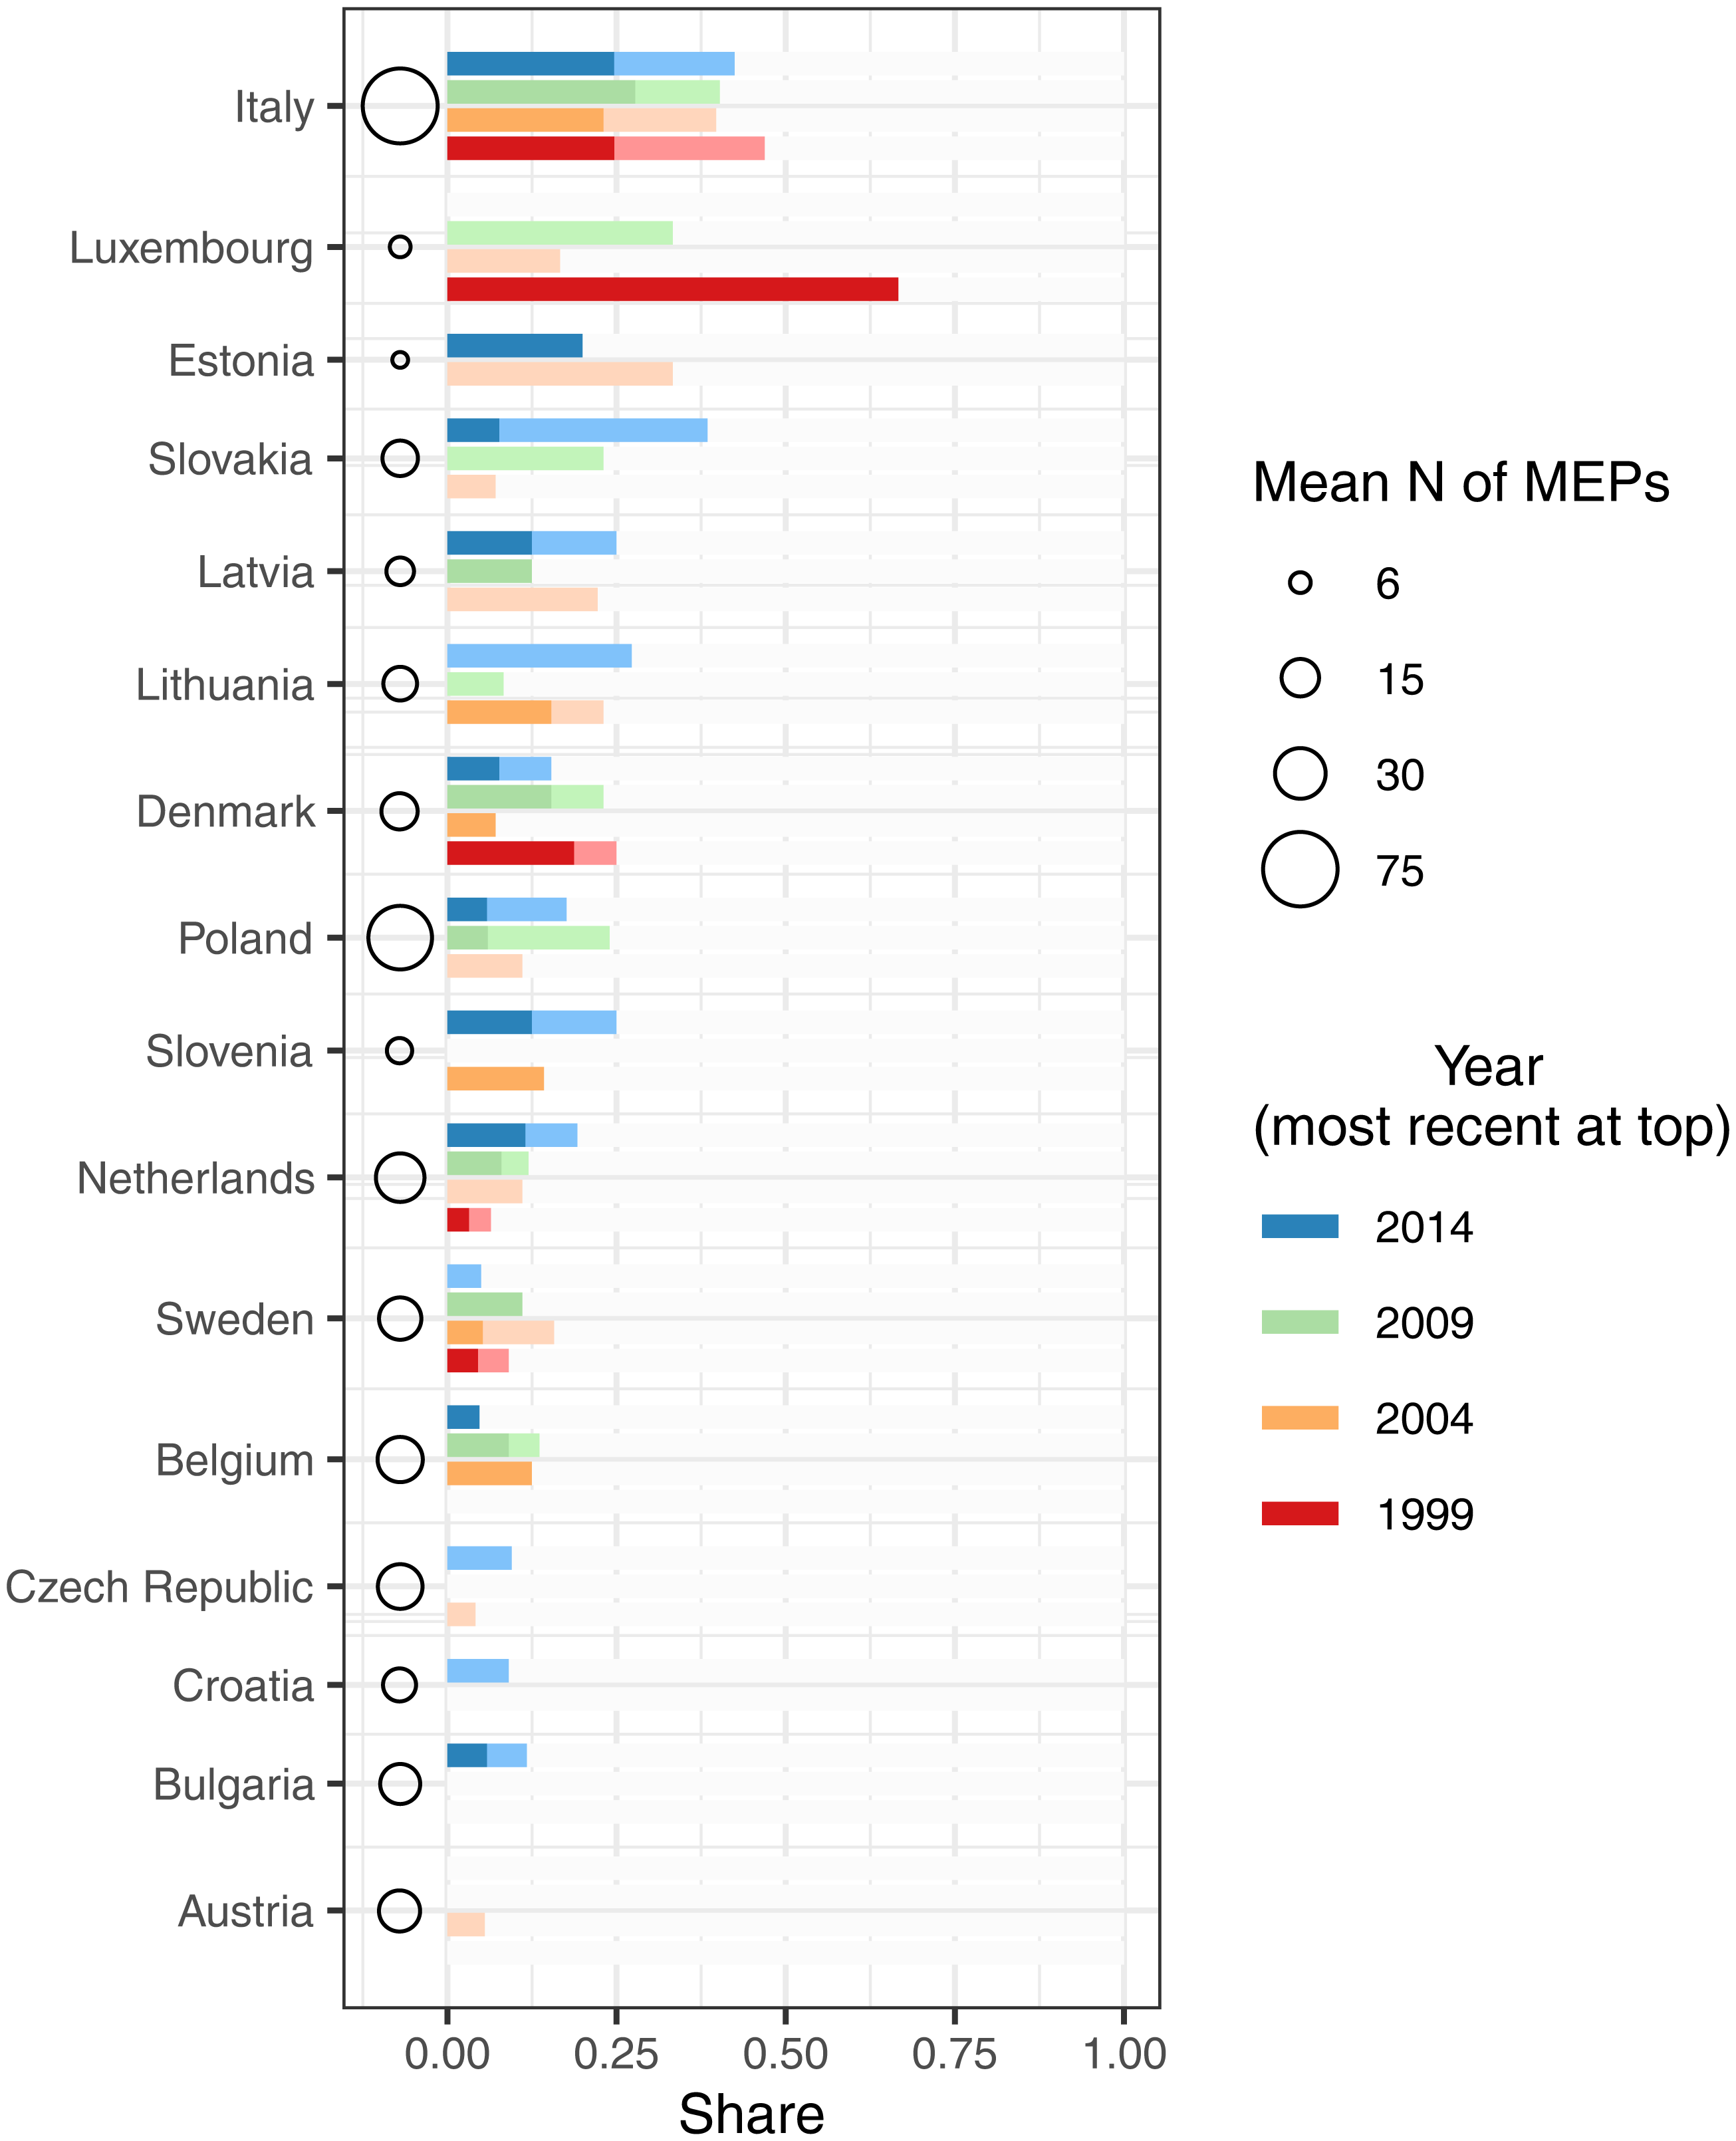
MEPs owing their election to preference votes.
Mean predicted probability for types of list rank changes.
Conclusion
The growing salience of the EP in EU decision-making and in the domestic politics of its member states are paralleled by an expanding scholarship focusing on its position and role compared with other EU institutions as well as on its members’ behavior and relationships with their parties and voters. A wide range of this literature implicitly or explicitly adheres to assumptions and hypotheses related to the electoral environment in which MEPs and national delegations operate, which could not be tested previously due to the absence of data.
The purpose of this paper is to introduce a new comprehensive data collection on EP elections. This collection complements existing datasets and provides information useful for a broad range of subfields, encompassing voting behavior, political representation, and legislative politics. As an in-built feature, the datasets can easily be linked both within the collection and to external sources, and they are amenable to future extensions. We are planning to add information from the 2019 election once we receive feedback from end users on the 1999–2014 data.
We also sketch a research agenda on how electoral incentives shape behavior in the EP and its corollary scenario: voters rewarding legislative efforts. The data should enable researchers to examine the supply side of European elections from a longitudinal perspective. This would help re-evaluate the often-mentioned claim of a missing electoral connection. We hope that this data collection will facilitate a large number of comparative analyses and raise the understanding of the functioning of the EP and EU politics more generally.
Supplemental Material
sj-zip-1-eup-10.1177_14651165211053439 - Supplemental material for Introducing COMEPELDA: Comprehensive European Parliament electoral data covering rules, parties and candidates
Supplemental material, sj-zip-1-eup-10.1177_14651165211053439 for Introducing COMEPELDA: Comprehensive European Parliament electoral data covering rules, parties and candidates by Thomas Däubler, Mihail Chiru and Silje SL Hermansen in European Union Politics
Footnotes
Acknowledgements
The data collection endeavor described in this paper would not have been possible without the diligent research assistance by Ertan Bat. We are grateful to him. We also would like to thank all the people who helped with country-specific questions and other queries. These include Patrick Dumont, Kostas Gemenis, George Hajipavli, Bjørn Høyland, Raimondas Ibenskas, Tom Louwerse, Julien Navarro and Tevfik Murat Yildirim. We apologize to anybody we have forgotten to mention.
Author contributions
The order of the authors reflects the contributions made to the project.
Declaration of conflicting interests
The author(s) declared no potential conflicts of interest with respect to the research, authorship, and/or publication of this article.
Funding
Mihail Chiru's work was supported by a grant of the Romanian Ministry of Education and Research, CNCS - UEFISCDI, project number PN-III-P4-ID-PCE-2021-233, within PNCDI III.
Supplemental material
Supplemental material for this article is available online.
Notes
References
Supplementary Material
Please find the following supplemental material available below.
For Open Access articles published under a Creative Commons License, all supplemental material carries the same license as the article it is associated with.
For non-Open Access articles published, all supplemental material carries a non-exclusive license, and permission requests for re-use of supplemental material or any part of supplemental material shall be sent directly to the copyright owner as specified in the copyright notice associated with the article.