
Abstract
Which member states could leave the European Union in the years ahead? To answer this question, I develop the ‘EU Exit Index’ measuring the exit propensities of all European Union member states. The index highlights that the United Kingdom was an outlier and uniquely positioned to leave the European Union. While all other states are far behind the United Kingdom, the index still reveals substantial variation among them. Moreover, the index allows monitoring the development of exit propensities over time. It shows that the European Union is in better shape today than before the Brexit referendum and that, currently, no further exits are on the horizon. Still, this could change in the future and the EU Exit Index provides systematic and reproducible measurements to track this development.
Introduction
The United Kingdom’s (UK) decision to leave the European Union (EU) ushers in a new era of European integration. So far, integration was largely perceived as a one-way street, with the EU continuously growing from initially six to 28 member states. It seemed only a matter of time before the whole European map would be printed in reflex blue, notwithstanding a few holdouts such as Switzerland or Norway. This belief has been shattered on 23 June 2016, when the UK became the first country voting to leave the EU in a referendum, which is what it formally did on 31 January 2020. While Brexit will have profound and long-lasting consequences, the most immediate impact is that it proves that it is possible to leave the EU. Many countries have since been connected to future exits but, to date, there is little systematic research on how close other countries are to such exit scenarios.
This article speaks to an emerging literature on the causes and consequences of Brexit. Explaining the Brexit decision has attracted considerable attention (e.g. Goodwin and Milazzo, 2017; Hobolt, 2016; see also Huysmans, 2019) and much of it will be used in this article to develop a general argument about how democratic nation-states leave the EU by extrapolating from the British case. Increasingly, however, the consequences of Brexit move to the fore. Huhe et al. (2020) ask how Brexit affects decision-making in the Council of the EU, while Hix (2018) predicts the UK’s relationship with the EU in the long term (see also Schimmelfennig, 2018). Still, the most pressing question posed by Brexit is whether any other countries could follow suit. In an article appearing shortly after the referendum, Hobolt (2016: 1271) asked: ‘Is Britain an outlier?’ Limiting herself to Germany, France, Denmark, Sweden, and Finland, she considered it likely given the need for coalition governments and greater levels of public support for EU membership. ‘Yet’, she concludes, ‘that is not to say that the Brexit vote represents a uniquely British phenomenon’ (Hobolt, 2016: 1271), leaving the door open for the possibility of future exits.
The question of whether, and if yes which, member states could leave the EU has been present in the literature for some time. Pierson (1996: 146) wrote about the ‘growing implausibility’ of a member state leaving the EU, describing national exits as ‘virtually unthinkable’. Still, already neo-functionalists acknowledged that integration may also ‘spill-back’ and noted that states could leave the EU (Hodson and Puetter, 2018: 466). More recent contributions can be structured along three dimensions. Some stress the social dimension, where leaving the EU becomes more likely when citizens hold exclusive national identities or negative attitudes towards the EU (Carl et al., 2019; Glencross, 2019) or prefer their domestic political system over that of the EU (De Vries, 2018). Others emphasize the expected economic impact, which is taxing for Eurozone economies (Vollaard, 2014: 1154) or those deeply integrated into the single market (Hix, 2018: 19; König and Ohr, 2013). Finally, yet others point to the political dimension, such as when countries are frequently outvoted in EU decision-making (Kelemen, 2007: 62–63) or have strong Eurosceptic parties (Heppell et al., 2017; Tournier-Sol, 2015).
In this article, I bring this literature together and rely on the methodology of composite indices to systematically measure the exit propensity of every member state across these three dimensions. Composite indices have become widely popular in a variety of scientific disciplines by providing an accepted method to reduce complex systems into a single measure and revealing relative positions, mostly of countries (Greco et al., 2019: 62). The ‘EU Exit Index’ shows that the UK was indeed an outlier and uniquely positioned to leave the EU. Still, there is substantial variation across the remaining 27 member states. Austria or Sweden are much more likely to leave the EU than Luxembourg or Lithuania. The fact that this outcome will be uncontroversial to most pundits of European politics provides some confidence in the ‘face validity’ of the index since it ‘quantifies existing qualitative beliefs about the ranking of cases’ (Brown, 2010: 144; see also Haftel and Thompson, 2006: 264). The EU Exit Index also allows monitoring exit propensities over time. Overall, the findings suggest that the UK will likely remain the only country leaving the EU, at least in the foreseeable future.
Why leave?
In this section, I distinguish three fundamental dimensions to explain a member state’s decision to leave the EU: social, economic, and political. These three dimensions broadly correspond to three relatively homogenous blocks in the literature: research on public opinion, international political economy, and comparative politics. Each of these dimensions can also be roughly connected to one actor group: citizens, businesses, and politicians. For each dimension, I formulate hypotheses providing the foundation for the EU Exit Index.
The social dimension
The first dimension includes how citizens influence a state’s decision to leave the EU. The most direct mechanism linking citizens to this question is through a popular referendum. However, it is also conceivable that leaving the EU would be propelled by a single-issue general election or even mass protests. The period from Rome to Maastricht has been marked by a permissive consensus among citizens, with only limited popular attention devoted to European integration. This changed in the 1990s and turned into a constraining dissensus (Hooghe and Marks, 2009). Still, EU integration continues to deepen, also due to functional pressures during the sovereign debt crisis (Jones et al., 2016; Niemann and Ioannou, 2015: 200–205). This incongruity, in turn, fuels increased politicization (Cramme and Hobolt, 2015; Risse, 2015). While some see this as a step towards a fully-fledged European polity (e.g. Follesdal and Hix, 2006: 557; Habermas, 2012: 51–52), others warn about its irreversibility and that it benefits the populist right (e.g. De Wilde and Zürn, 2012; Kriesi et al., 2006: 929). Either way, citizens will have to play a greater role in accounts of European (dis)integration going forward.
More specifically, public opinion research deals with the characteristics that define who supports and who opposes European integration. It broadly distinguishes ‘utilitarian’, ‘identity’, and ‘cue-taking’ approaches (Hobolt and De Vries, 2016: 420–423). Utilitarian support is based on a positive cost-benefit analysis. Identity support describes citizens’ emotional attachment to Europe. Finally, cue-taking contends that European decisions are so complex that citizens rely on proxies such as politicians for forming their integration preferences (Anderson, 1998: 590–591). Since parties are part of the political dimension below, I exclude this perspective here.
While events such as the sovereign debt crisis may strengthen utilitarian considerations (Hobolt and Wratil, 2015), identity is at best partly offset (Kuhn and Stoeckel, 2014). Analysing the Brexit vote, Hobolt (2016: 1268) similarly finds identity as a substantial predictor for leave votes (see also Carl et al., 2019). As both factors exert a distinctive influence on citizens’ support for integration, I include both. H1: The higher the share of citizens perceiving the EU as providing net benefits and the higher the share of citizens feeling European, the lower a member state’s exit propensity. H2: The higher the share of citizens viewing freedom of movement negatively, the higher a member state’s exit propensity. H3: The higher the share of citizens expressing greater trust in their national political system than the political system of the EU, the higher a member state’s exit propensity.
The economic dimension
In the economic dimension, I theorize that economic adjustment costs flowing from abandoning the Eurozone act as a deterrent to leaving the EU. Europe’s common currency has become a controversial achievement of European integration, particularly in the aftermath of the financial crisis. The Euro may thus reinforce disintegrative tendencies in the social dimension. Moreover, EU member states differ in terms of their capabilities to leave the Eurozone and have varying outlooks on its short-term effects. Countries whose national currency would likely appreciate against the Euro stand to lose less than those facing depreciation. In the latter case, businesses and citizens have incentives to shift assets to Eurozone economies, triggering a full-blown bank run (Eichengreen, 2010: 21–27). However, also countries whose currencies stand to appreciate face the prospect of severe adjustment costs. For example, a new currency needs to be printed and exchanged, contracts redenominated, and price tags adapted. This leaves a profound impact on countries abandoning the Euro. H4: Member states that have adopted the Euro have a lower exit propensity. H5: The more a member state trades with other EU member states, the lower its exit propensity. H6: The worse a member state is doing economically, such as indicated by a lower credit rating, the lower its exit propensity. H7: The more a state derives budgetary benefits from EU membership, the lower its exit propensity.
The political dimension
Leaving the EU clearly also has a political dimension. The British referendum result had to be implemented by political institutions. Initially, Prime Minister Theresa May was eager to start the process with minimal interference from other domestic actors as she sought to sidestep the British parliament under the royal prerogative. This was successfully challenged in the courts by a private litigant. Nevertheless, the House of Commons eventually overwhelmingly supported triggering Art. 50. While a majority in the House of Lords seemed opposed to Brexit, it did not have the necessary powers to block it. Similarly, the devolved legislatures in Scotland or Northern Ireland could not have aborted the process. The configuration of a country’s polity thus bears on political outcomes. Specifically, veto players determine a political system’s capacity to change the status quo (Mansfield et al., 2008; Tsebelis, 2002), in this case EU membership. H8: The more veto players a member state has, the lower its exit propensity. H9: The more Eurosceptic MPs a member state has, the higher its exit propensity. H10: The more a country is side-lined during EU decision-making, the greater its exit propensity.
Data and method
In this section, I will discuss this article’s data sources and methodological questions connected to the construction of composite indices. 1
Indicators
For the social dimension, I take seven questions from the Eurobarometer (EB) survey. First, the question on whether a member state would face a better future outside the EU. Second, whether respondents are pessimistic about the future of the EU. Even if not allowing me to distinguish between utilitarian and ideational support, both items should capture well citizens’ desire to leave the EU. Third, I include whether citizens see themselves as ‘only national’ to measure the share of exclusive nationalists. I include, fourth and fifth, the questions on whether respondents ‘feel’ being EU citizens and whether the EU conjures up a negative ‘image’ for them. Sixth, whether immigration from other member states evokes a negative feeling is included. This question is even better suited than a direct question on freedom of movement since it breaks down a fairly abstract principle to a concrete outcome. Finally, to include De Vries’s benchmarking idea the difference in trust between the European and national parliament is included. I take the average of the two standard EBs in each calendar year to annualize the data. 2
The economic dimension consists of five indicators. First, a dichotomous variable on Eurozone membership. Second, intra-EU trade of goods and services relative to a country’s gross domestic product (GDP) as reported by Eurostat. To gauge the impact of Brexit, trade figures are calculated without the UK from 2017 onwards. Trade in services data for 2019 are not yet available and have been fitted using Holt’s method. Third, I take the sovereign credit ratings of all three major CRAs and transform them into a numeric 18-point scale, where countries with the highest ratings receive a score of 1 (see the Online appendix for additional information). Sovereign credit ratings are a comprehensive measure of economic robustness and the ability of member states to adjust to leaving the EU. Fourth, leaving the regulatory framework of the single market entails regulatory uncertainty, which can negatively impact foreign investment (Daude and Stein, 2007: 337). Since foreign investors could be partly replaced by domestic investors, I take the net international investment position from Eurostat. As a broad measure of a country’s foreign investment position (assets minus liabilities) vis-à-vis the rest of the world, it gages a state’s vulnerability towards changes in foreign investment. Fifth, I use the operating budgetary balance as a share of GDP to determine the budgetary status of each member state.
The political dimension contains four indicators. To measure veto players, I rely on the Political Constraint Index (Henisz, 2002), which includes information on the number of independent branches of government having veto power over legislative decisions, preference alignment across them, and the fractionalization of parliaments. Since, in the current release, data are available only until 2016, I manually added values up to 2019. Second, to measure the share of Eurosceptic MPs, I use the Chapel Hill Expert Survey (Bakker et al., 2015) and election results from the Parliaments and Governments database (Döring and Manow, 2018), to which I manually added recent elections. 3 To measure sovereignty concerns due to states being side-lined during decision-making, I – third – follow the pertinent literature (e.g. Bailer et al., 2015) and include how often a country voted against or abstained in all final legislative votes in the Council. Fourth and finally, since the EP is today mostly a co-equal branch of government, I include the share of Members of the European Parliament (MEPs) per country outvoted in final legislative votes. 4
Normalization
Since the indicators have different measurement units and numerical properties (for descriptive statistics see the Online appendix), they need to be normalized before aggregation to minimize the risk of inadvertently introducing weights into the index. For the normalization, I follow Dreher (2006: 1093) and rely on min-max standardization, which is one of the ‘most frequently used normalisation methods’ (OECD, 2008: 117). 5 Where higher values translate into a higher exit propensity, the formula is: (xq,c – min(xq))/range(xq), where xq,c is the raw value for indicator xq of country c. Where higher values indicate lower exit propensities, the formula becomes: (max(xq) – xq,c)/range(xq). To facilitate interpretation, normalized indicators are multiplied by 100. After this transformation, values closer to 100 consistently indicate higher exit propensities. Panel normalization is applied and minima and maxima of indicators are determined across the whole time period under investigation (before and after Brexit). This increases the comparability across time and makes the index more robust to outliers. The downside is that in future updates of the EU Exit Index values may change if new minima or maxima are established (Gygli et al., 2019: 558).
Weighting
Simply aggregating normalized indicators through a non-weighted arithmetic average invites a problem of ‘double counting’ (Greco et al., 2019: 65). This refers to the inadvertent introduction of weights by including colinear indicators in the index without correcting for their overlapping information through methods such as principal component or factor analysis. The evidence concerning the factorability of the dataset used here is good. The standardized Cronbach’s alpha is 0.72, which suggests that the indicators reliably measure the same underlying construct (OECD, 2008: 72). 6 Similarly, Kaiser-Meyer-Olkin’s (KMO) measure of sampling adequacy is 0.69 and thus well above the 0.6 threshold set by the OECD (2008: 67). Finally, Barlett’s test of sphericity (χ2 = 1732, p-value < 0.001) underlines that the correlation matrix is significantly different from an identity matrix.
To select the number of dimensions in the data, I choose principal components (a) with eigenvalues greater than one; (b) that individually explain at least 10% of the total variance; and that (c) cumulatively explain at least 60% (OECD, 2008: 89). This suggests the extraction of three components that together account for over 60% of the total variance (see the Online appendix). Following König and Ohr (2013: 1081), the retained components are rotated using the oblique promax method with Kaiser normalization to account for the interdependencies among indicators. Weights are obtained by squaring and normalizing the rotated factor loading of each indicator, weighted by the share of variance explained by each component.
Table 1 shows that the first component mainly aligns with social indicators measuring citizens’ attitudes towards European integration plus the EP, which as the EU’s only directly elected institution follows a similar dynamic. The second component explains the majority of indicators in the economic dimension and trust in national political institutions, which maps best onto this dimension as it tends to be highest in old member states that do better economically. Finally, component three explains a relative majority of all indicators in the political dimension. After accounting for collinearity in the data and statistically determining optimal weights, the social dimension contributes exactly half to the overall EU Exit Index, the economic dimension just under one third, and the political dimension about one sixth.
Rotated factor loadings and computed weights.
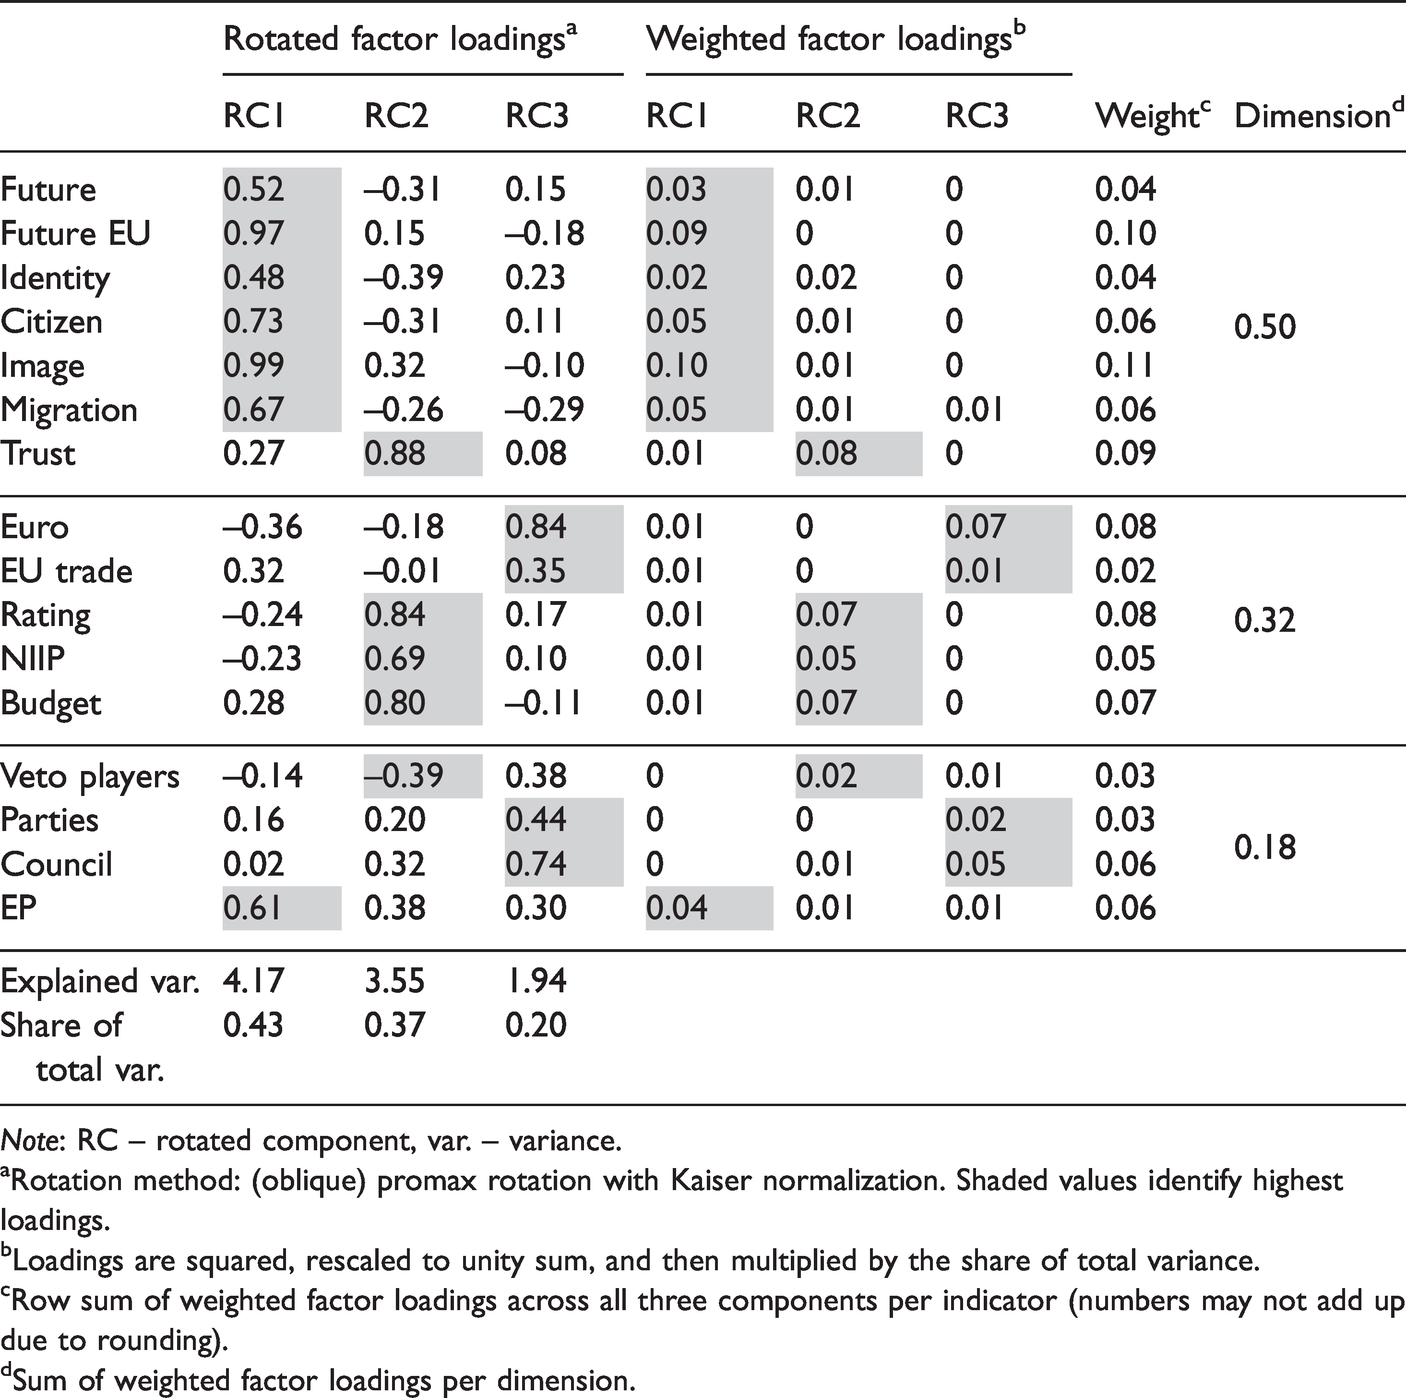
Note: RC – rotated component, var. – variance.
aRotation method: (oblique) promax rotation with Kaiser normalization. Shaded values identify highest loadings.
bLoadings are squared, rescaled to unity sum, and then multiplied by the share of total variance.
cRow sum of weighted factor loadings across all three components per indicator (numbers may not add up due to rounding).
dSum of weighted factor loadings per dimension.
Results
Table 2 contains the results of the EU Exit Index. The left half of the table shows the values for 2015 as the year directly preceding the Brexit referendum in June 2016. The right half includes maximum values achieved by each country at any point between 2014 and 2019. As becomes evident, the UK is indeed an outlier. It ranks first overall and is in the top three across all three dimensions. It is worth noting, however, that the UK is not ranked first in the social dimension. A unidimensional perspective of this dimension would thus invite a puzzle why it was the UK leaving the EU and not Cyprus or Greece. Moreover, the UK’s lead is substantial. The 14-point spread between itself and the second-ranked country – Austria – is more than one standard deviation (10.18). No other two countries ranked next to each other are even remotely this far spread apart. When comparing maximum values (in the right half of the table), the UK is even further ahead and leads Austria by more than 17 points.
Results of the EU Exit Index for 2015 and maximum values across all six years.
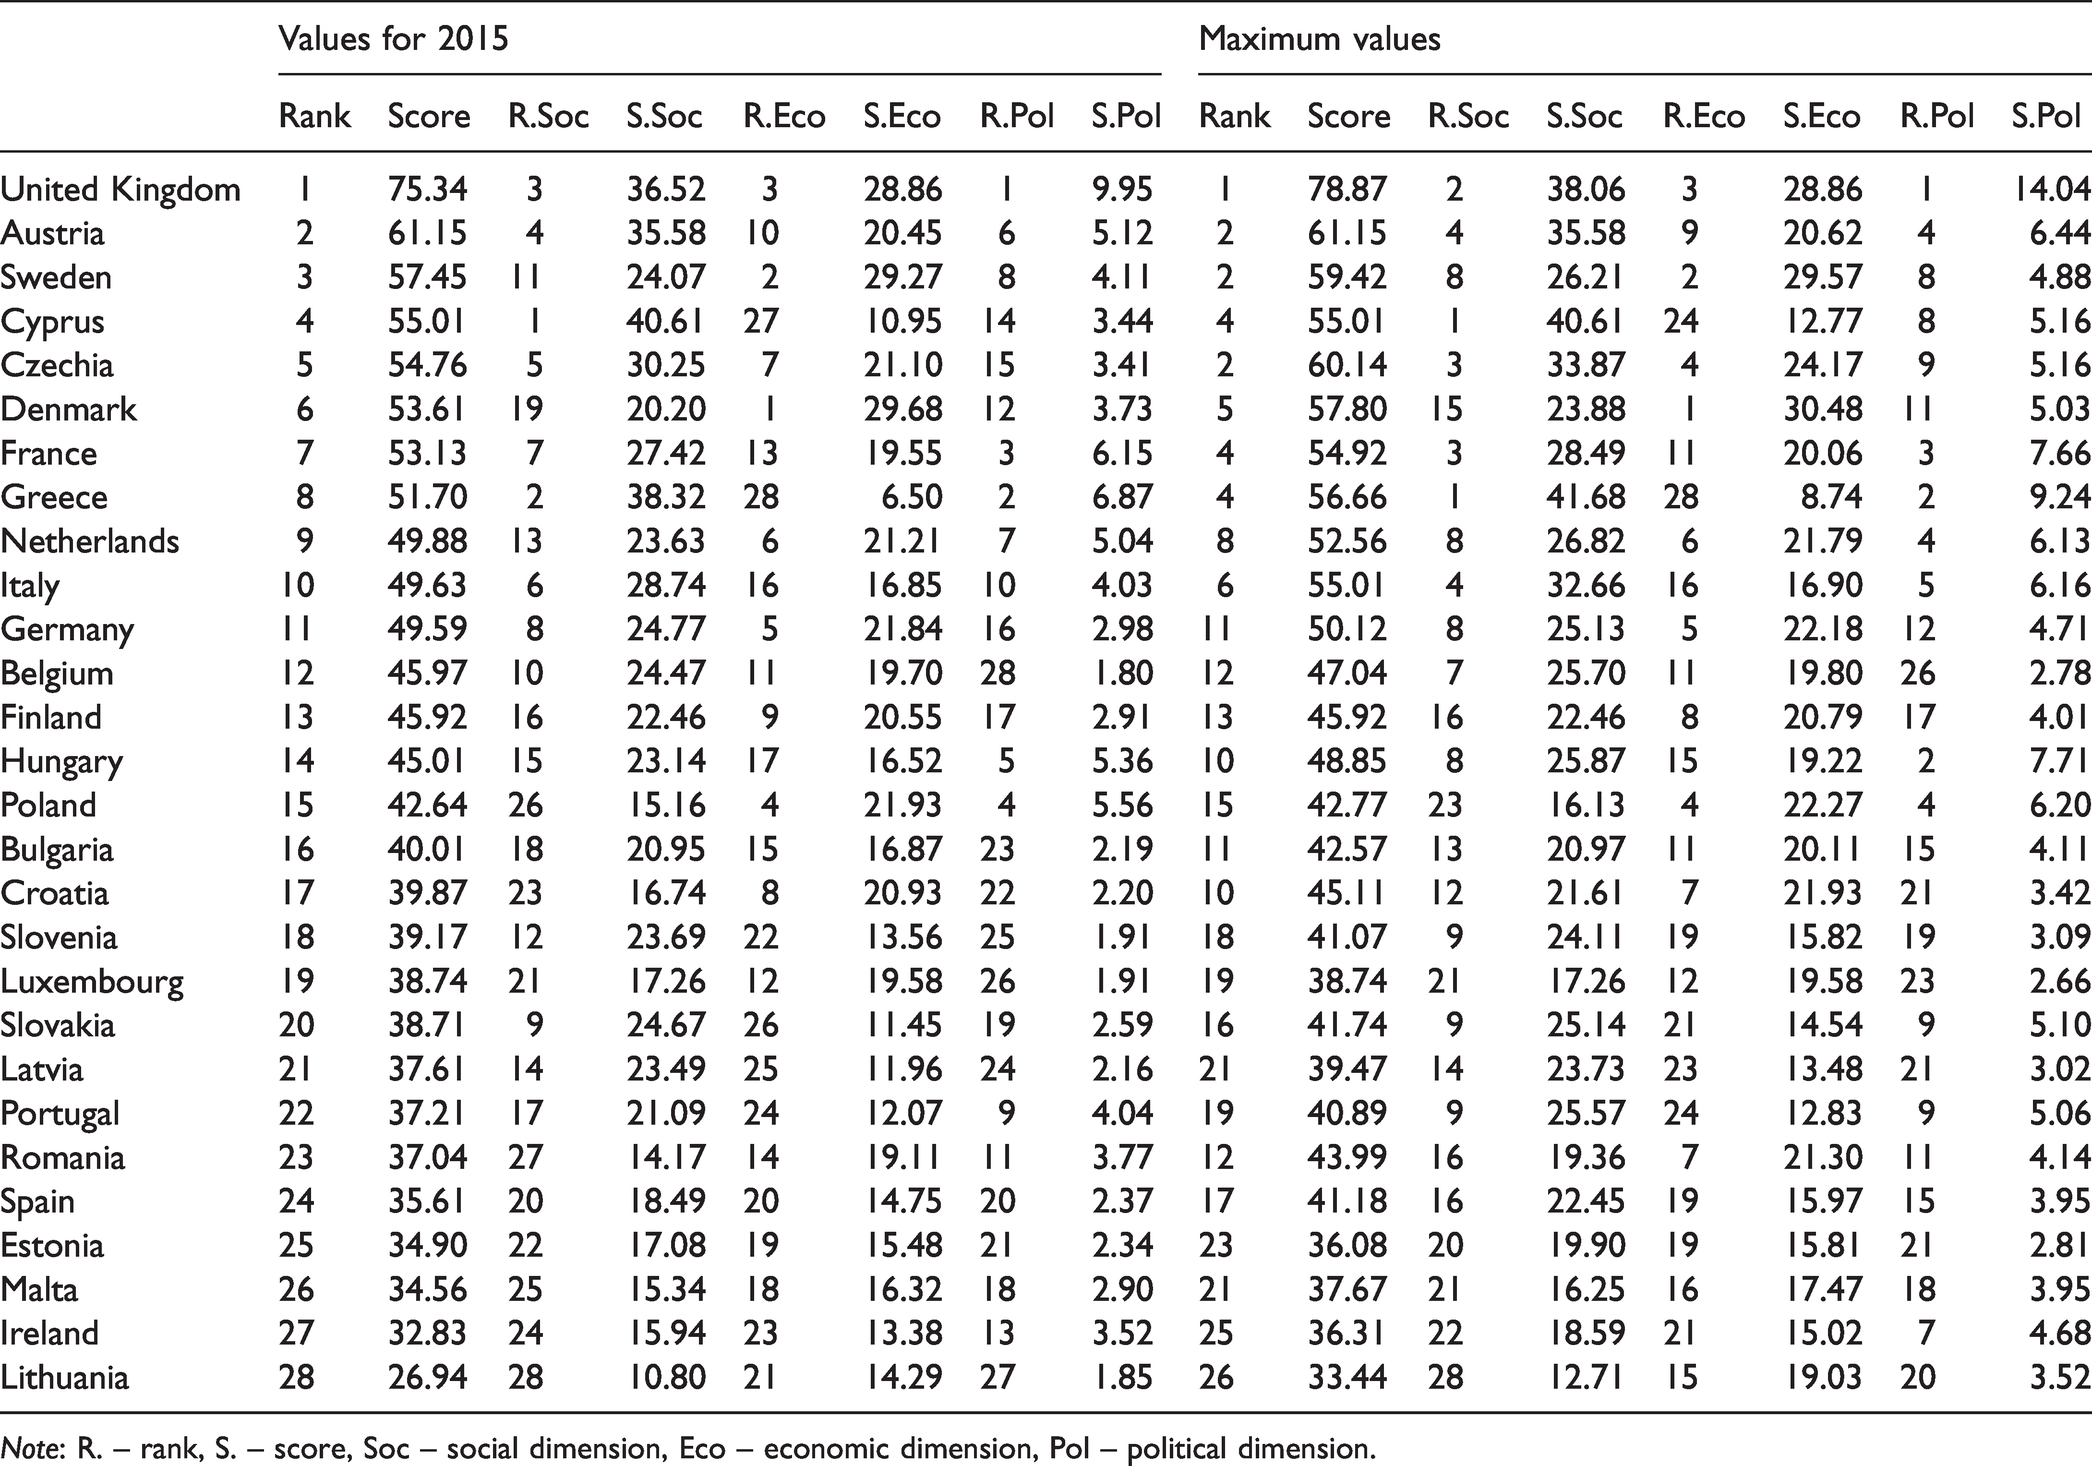
Note: R. – rank, S. – score, Soc – social dimension, Eco – economic dimension, Pol – political dimension.
While no other state is at a comparable risk of leaving the EU as the UK, the index does pick up substantial variation among the remaining member states. Again, focusing on maximum values in the discussion of the results, only three countries came close to or exceeded 60 points: Austria, Czechia, and Sweden. If a country other than the UK were to leave the EU, it would likely be one out of these three. A bit behind, at around 55 index points, cluster five countries: Denmark, Greece, Cyprus, France, and Italy. Except for Czechia and Cyprus, these countries have also been identified as potential exit candidates in previous scholarly contributions on the topic. 7 However, the EU Exit Index also suggests that all of these states are fairly firmly rooted in the EU relative to the UK, which left the EU by the slightest of margins. Moreover, Finland, Hungary, and the Netherlands, which have been mentioned as exit candidates, do not emerge as top candidates here. Germany, which has received attention following the Alternative für Deutschland’s decision to include the spectre of ‘Dexit’ in its European election manifesto, is also far from this scenario.
One of the primary benefits of the EU Exit Index over existing approaches is that it can capture developments over time. One might even argue that the index has been ‘calibrated’ with Brexit and that it takes somewhere between 61 (the highest score recorded by Austria, which has not left the EU) and 75 points (the score of the UK in 2015) for future exits to become conceivable. As can be seen in Figure 1, there is no indication of any other countries leaving the EU at this point in time. In fact, 23 of the 28 member states have seen their scores decrease between 2014 and 2019. This trend is most pronounced for Cyprus, which fell from a peak of 55 index points in 2015 to a low of 35 points in 2019. Portugal and Spain have also seen double-digit declines. On the other end, Romania and Poland saw their scores increase the most. Still, this increase amounts to only around 2 points and puts them at around 40 index points overall, which means that they are far from plausible exit scenarios. Similarly, Poland and Hungary, which repeatedly sparred with the EU over rule of law violations and democratic backsliding, are far from turning their backs on Brussels. Put differently, the EU Exit Index reveals that – currently – there are no signs pointing in the direction of future exits.
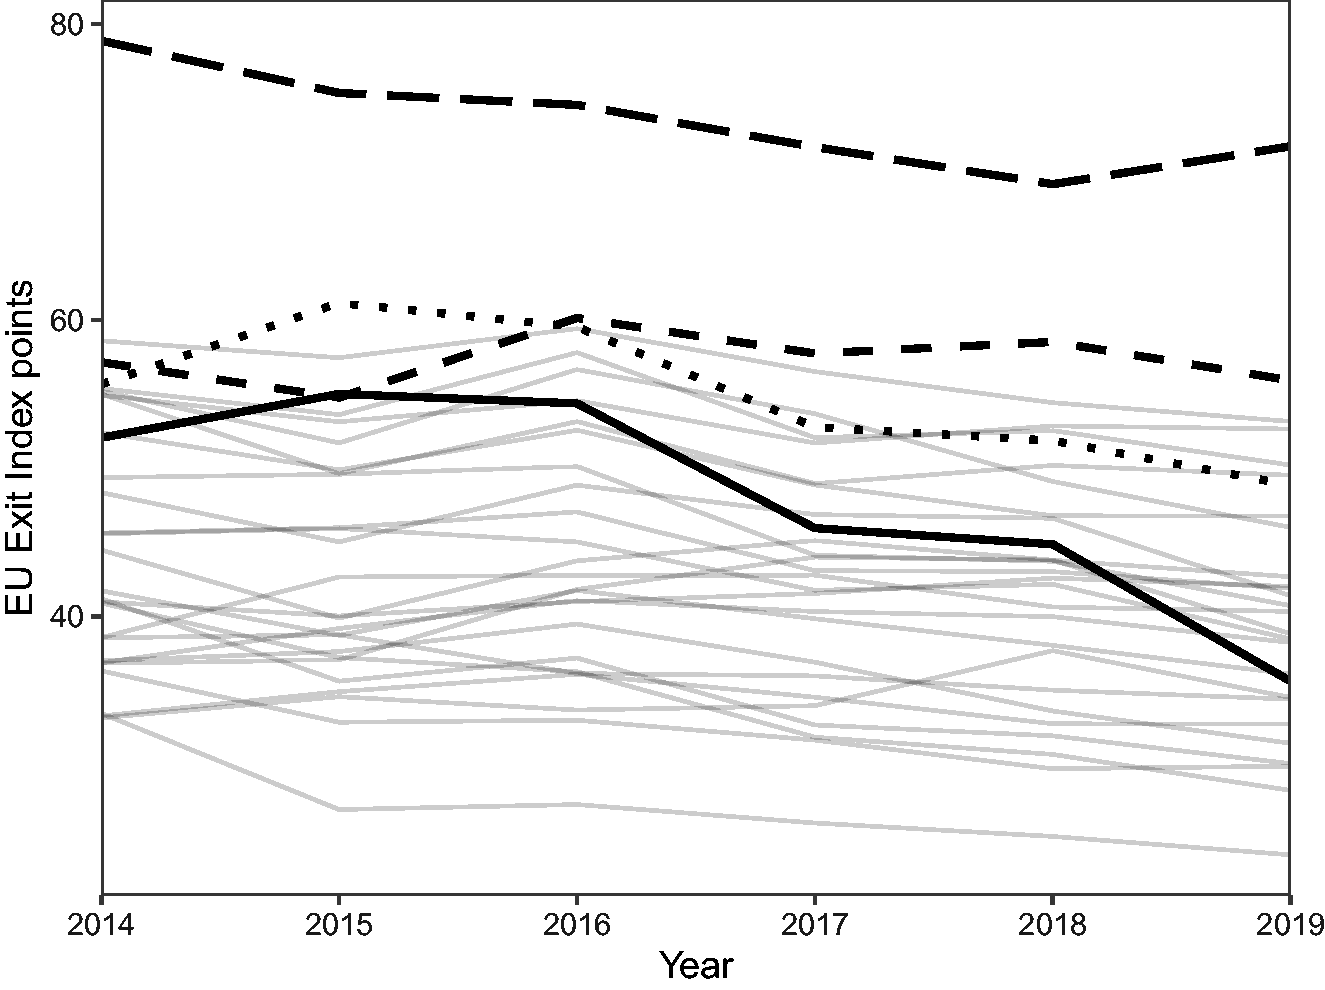
Development of the EU Exit Index over time.
Another crucial question that can be tackled with the help of the EU Exit Index concerns the effects of actual exits. Do the declining values over time go back to a ‘rallying-around-the-EU-flag effect’ after the referendum shock or the difficulties the UK experienced in the process of exiting the EU? 8 Overall, short-term variations in the EU Exit Index are most likely in the social dimension. The political dimension can also change substantially following national elections with radically different outcomes from the previous one. The economic dimension is relatively stable and will usually change only over longer periods. Both the rallying and difficulties effects should primarily manifest themselves in the social dimension. But whereas the rallying effect should be sudden and potentially short-lived, the difficulties effect should increase over time as the British struggle over leaving the EU played out in front of the eyes of Europe. The EU Exit Index indeed suggests that this second effect is stronger. In 2017, the average reduction of exit propensities in the social dimension was only 2 index points. In 2018, this grew to around 4 and in 2019 to 6 index points. While public opinion on the EU is of course not only driven by Brexit, these results indicate that its effect will only be felt over time – and could reverse itself and spark further exits if Brexit, eventually, would come to be perceived as a British success story.
Robustness tests
To establish the degree of robustness of the EU Exit Index to alternative model specifications, several robustness checks were performed (for details see the Online appendix). 9 The first test seeks to gauge the index’s sensitivity to individual indicators. The UK always remains in first place irrespective of which indicator is removed and generally keeps a two-digit lead over the second-ranked country. The only exception concerns an EU Exit Index without an indicator for Eurozone economies, in which case the UK only has a nine-point lead over Austria. As for other countries, those ranking highly are mostly stable and only switching places among themselves. More substantial changes are mostly confined to countries in the middle of the table. Since the primary purpose of the EU Exit Index is the identification of countries at risk of leaving the EU (and thus ranking highly), these fluctuations are of limited relevance.
As a second test, I have computed the weights for the EU Exit Index following the approach outlined in Nicoletti et al. (2000), which is among the most popular in the literature on composite indices. Here, retained components are rotated using the orthogonal varimax method with Kaiser normalization. Final weights are obtained by squaring and normalizing (only) the highest rotated factor loading of each indicator and weighing it by the share of variance explained. Here, the UK is still leading the table by a wide margin. Similarly, Austria, Sweden, and Czechia are still exceeding 60 index points, but this group is joined by Denmark, which has a higher risk under this specification.
Third, I have computed the EU Exit Index as a simple non-weighted arithmetic average of all indicators where each dimension contributes one third towards the final index. In addition, I check for the sensitivity of this unweighted index to individual indicators. The UK again consistently comes out on top. Austria, Sweden, and Denmark are again relatively close to the UK. In this specification, however, France and Italy move up while Czechia falls off. Fourth, to check the robustness of the results not only with regard to weighting but also normalization procedures, I standardize indicators by subtracting the mean and dividing them by their standard deviation (z-score). The UK still ranks first and is ahead of Austria by more than one standard deviation. Here, however, Cyprus and Greece are closer to exits than Czechia or Sweden.
Fifth, I computed the EU Exit Index with an additional indicator for the electoral system, where countries with majoritarian systems have higher exit propensities. This leads to the UK becoming even more of an outlier and France moving into second position, slightly ahead of Austria. Finally, I included an indicator with the number of referendums held on a national level between 2010 and 2020. The more common referendums are, the higher exit propensities. Also here the UK tops the index followed by Austria, Czechia, and Sweden. In sum, the robustness tests cement the UK’s position at the top of the EU Exit Index, underlining its outlier status among member states. The countries behind the UK stay relatively constant, though their exact ranking differs slightly depending on the model specification.
Conclusion
Will the UK remain an outlier or will Brexit set a trend and be followed by more member states leaving the EU? Answers to this question in the literature so far have often been unidimensional and yielded ambiguous results. In this article, I have developed the EU Exit Index measuring the exit propensities of member states in a systematic fashion by drawing on the methodology of composite indices. The index reveals that the UK was uniquely positioned to leave the EU. While further exits are unlikely in the foreseeable future since most countries’ exit propensities have decreased since the Brexit referendum, it cannot be ruled out that other countries could go down this path, particularly if the UK establishes an attractive new alternative to membership. Whereas Brexit could be brushed off with the UK’s unique history with continental Europe, any other countries leaving the EU would deal a severe blow to its self-understanding as the guarantor of unity across the European continent. Still, the EU’s collapse through successive exits is unlikely. Most states seem all but guaranteed to see their national interests better served by keeping the Union.
The EU Exit Index can be useful in several respects. For scientific inquiry, the index – and its individual components – provide an interesting new data source capturing important properties of EU member states. The index could, for example, help explain compliance levels with EU laws across different member states, which can be shaped by Euroscepticism (Finke, 2020). More broadly, scholars using panel data analysis may find it desirable to control for the social, economic, or political dimension of Euroscepticism in their models. Scholars of EU politics and decision-making could find the index helpful to explain outcomes. As the UK has shown, states can attempt to use high exit propensities strategically to extract concessions from other member states. While in the past this was often perceived as an idle threat, this effect will likely grow stronger as member states have no interest in any further states leaving the EU. This could mean that states with greater exit propensities will find their preferences accommodated more in future decisions.
Economists may find use in the EU Exit Index to assess the risk of other member states leaving the EU. After Brexit, investors will need to include this uncertainty when making long-term investment decisions. How to account for this contingency has a substantial impact on a diverse set of asset classes. Therefore, including a state’s risk of leaving the EU could make an important contribution to a wide array of economic modelling efforts. Finally, the index should be welcomed by the general public. In the wake of the Brexit referendum, there was widespread concern among EU citizens about whether their own member state could be heading in the same direction. During the Covid-19 pandemic, the question of national exits has become less salient since this hardly provides an environment conducive to major political changes such as leaving the EU. But, in the longer term, the negative economic and social fallout of the pandemic could further increase contestation over European integration. Periodic updates of the EU Exit Index can help to monitor the situation and inform public and scholarly discourse on one of the most important issues facing the EU in the years ahead.
Supplemental Material
sj-pdf-1-eup-10.1177_14651165211000138 - Supplemental material for Introducing the EU exit index measuring each member state’s propensity to leave the European Union
Supplemental material, sj-pdf-1-eup-10.1177_14651165211000138 for Introducing the EU exit index measuring each member state’s propensity to leave the European Union by Markus Gastinger in European Union Politics
Supplemental Material
sj-zip-2-eup-10.1177_14651165211000138 - Supplemental material for Introducing the EU exit index measuring each member state’s propensity to leave the European Union
Supplemental material, sj-zip-2-eup-10.1177_14651165211000138 for Introducing the EU exit index measuring each member state’s propensity to leave the European Union by Markus Gastinger in European Union Politics
Footnotes
Acknowledgements
For valuable comments on earlier drafts of this article, I am very grateful to three anonymous referees, Andreas Dür, Rachel Epstein, Jessica Fortin-Rittberger, Brigid Laffan, Craig Parsons, Dominik Schraff, Alasdair Young, and the participants of panel 11L at the EUSA Biennial Conference in Miami (4–6 May 2017). All remaining errors and inconsistencies are my own.
Funding
The author(s) disclosed receipt of the following financial support for the research, authorship, and/or publication of this article: This project has received funding from the European Union’s Horizon 2020 research and innovation programme under the Marie Skłodowska-Curie grant agreement No. 840135.
Supplemental material
Supplemental material for this article is available online.
Notes
References
Supplementary Material
Please find the following supplemental material available below.
For Open Access articles published under a Creative Commons License, all supplemental material carries the same license as the article it is associated with.
For non-Open Access articles published, all supplemental material carries a non-exclusive license, and permission requests for re-use of supplemental material or any part of supplemental material shall be sent directly to the copyright owner as specified in the copyright notice associated with the article.