
Abstract
This study investigates dynamics of negative campaigning by Norwegian political parties on Facebook, Instagram and Twitter from 2013 to 2024. Analysing 89,791 posts from nine major parties, it uses a novel content analysis approach combining Large Language Models (LLMs) and human annotation to categorize posts as negative, positive or neutral. The findings show an overall rise in negative campaigning across platforms, with significant changes following leadership shifts in the right-wing populist Progress Party (PP). The study examines engagement levels, measured by likes, for different content types. Initially, negative content attracted more engagement on Facebook. This trend, however, decreased over time, while Instagram saw increased engagement with negative content during later years. Twitter users appeared to have rather consistently favoured negative content, reflecting its reputation for incivility. The article enhances understanding of political communication strategies in a high-choice media environment, emphasizing the need to tailor campaign strategies to platform-specific user dynamics.
Keywords
Introduction
Political communication systems continue to face crucial changes (Van Aelst et al., 2017) – changes that involve the coming, transformation, and the going of the ‘technologies that undergird the process’ (Blumler, 2015: 426, see also Daniel and Obholzer, 2025). For instance, Twitter has largely gone from being seen as an important tool for politicians (e.g. Enli and Skogerbø, 2013), to one tool among many. Indeed, the introduction of social media like Facebook and Instagram has led to a comparative dearth of Twitter use at the hands of political actors (Larsson, 2024). Beyond ‘dead or dying platforms’ (Matassi and Boczkowski, 2023: 106), those services that succeed in maintaining longevity are nevertheless likely to change with regard to their functionalities (e.g. Helmond et al., 2019) as well as in relation to the potential voters that make up the audiences and users of each respective platform (e.g. Bruns and Moon, 2018).
As a result of such overtime transformations, political actors – such as parties – are likely to change their campaigning prioritizations. Recent efforts have pointed to an upsurge in seemingly related concepts, often referred to as negative campaigning (e.g. Bene et al., 2022; Klinger et al., 2022), populist campaigning styles (Magin et al., 2024) or indeed ‘dark politics’ (Nai and Maier, 2024). With the above in mind, the study presented here provides longitudinal and cross-platform insights into the use of negative campaigning at the hands of the major Norwegian political parties on Facebook, Instagram and Twitter between the years 2013 and 2024. Separating negative from instances of positive and neutral campaigning, the study employs novel approaches to analyse a total of 89,791 posts, combining automated analysis by means of Large Language Models (LLMs) with manual annotation. Detailing both the types of campaigning efforts provided by political actors across platforms and time as well as the engagement – defined here as likes – that these different varieties of content reached, our efforts thus take both the ‘supply and demand’ (e.g. Daniel and Obholzer, 2025) of political communication into account. Indeed, the precise meaning of each like rests with the reacting user (Ozanne et al., 2017), making it impossible to know at scale whether the like was provided in support of or against the content engaged with. Regardless, interacting with posts in this way suggests popularity in relation to the algorithms guiding visibility on platforms (e.g. Bene, 2021). With this in mind, the study presented here makes a series of contributions. Our longitudinal design allows us to move past the ‘strong present-day bias’ of social media research identified by Matassi and Boczkowski (2023: 109). Relatedly, our design allows us to investigate the claim made by Klinger et al. (2022) that ‘[t]he development of negative campaigning over time remains poorly understood, as does the question of whether the approach yields benefit for parties and candidates’ (Klinger et al., 2022: 5). One such benefit that is particularly important in the context of online campaigning is the amplification (Zhang et al., 2017) of party posts based on user engagement by means of the degree to which posts were interacted with. As the processes studied here contribute to make the content interacted with visible beyond initial audiences (e.g. Eberl et al., 2020), understanding social media engagement becomes a critical issue for online campaign professionals. Thus, the work presented here will shed light on the question of whether ‘going negative’ (Baldwin-Philippi, 2018: 14) can be considered a suitable strategy for political actors to gain audience engagement across social media.
Negative and positive campaigning
While negativity has been part of the rhetorical arsenals of political actors since Ancient Roman times (Klinger et al., 2022), current developments related to ‘affective publics’ (Papacharissi, 2015) and the apparent increasing role that emotions play in public life (Wahl-Jorgensen, 2019) have rendered emotional framings of political issues key elements for communicators. Research has found that emotional appeals in social media posts are likely to yield engagement – which in turn is likely to result in wider spreading of the content (e.g. Jost, 2022). Online engagement appears to especially tangible in relation to negative content (Bene et al., 2022; Eberl et al., 2020) – tendencies that we might expect will exert influence on the prioritizations of political actors.
Negative campaigning, then, typically involves political actors critiquing their opponent’s values, character, suggestions for policy and so on, instead of focusing on their own ideas and suggestions (Mattes and Redlawsk, 2014; Nai and Maier, 2024). While politics in our case country of Norway has typically been seen as consensus-oriented (Strömbäck and Aalberg, 2008), recent work has suggested an increase of affective polarization – resulting in part from negative campaigning efforts (Martin and Nai, 2024). Indeed, the suggestion by Klinger et al. (2022) that ‘[a]dversarial messages can be aggressive to varying degrees’ (Klinger et al., 2022: 5) remind us that negative campaigning can take on different forms based on, for instance, degrees of affective polarization. Relatedly, Nai and Maier (2024) suggest that ‘political attacks come in many shades’ (p. 54). While often pointed to as harmful to democracy (Ansolabehere and Iyengar, 1995), negative emotions such as anger have also been shown as leading to increased attention to politics (Neuman et al., 2018). The results, then, must be seen as somewhat mixed when it comes to the ways in which negative campaigning appears to influence voter behaviour.
Negative campaigning can also be juxtaposed with positive campaigning efforts. Positive campaigning can be understood as characterized by political actors mainly focusing on the promotion and positive presentation of their own achievements, policies and ideas (e.g. Bernhardt and Ghosh, 2020; Reiter and Matthes, 2021). While it appears that ‘negative campaigning in general has a remarkable mobilizing potential’ (Bene et al., 2022: 10), most previous insights into negative campaigning have chiefly been based on Facebook (Eberl et al., 2020; Reuning et al., 2022), which further merits the platform comparative perspective featured here.
Comparing across platforms and time
Authors have suggested that populists have been especially successful on social media (e.g. Jacobs et al., 2020). In the Norwegian context, the Progress Party (NO: Fremskrittspartiet, EN: Progress Party, PP henceforth) has been described as a right-wing populist party (e.g. Magin et al., 2024), and has enjoyed success on primarily Facebook (e.g. Larsson, 2014; Kalsnes, 2016b). While our current efforts deal with political parties, party leaders can nevertheless be important in a party-centred democracy such as the Norwegian one (Karlsen and Enjolras, 2016). The period studied here saw two leaders for PP–Siv Jensen (who led PP from 2006 to 2021) and current leader Sylvi Listhaug (party leader since 2021). While Jensen and Listhaug both have been described as adopters of negative styles, Listhaug has been pointed to as particularly controversial (Flaarønning et al., 2018). While Listhaug has hosted her own Facebook Page where her viewpoints could be aired (Vikås and Røed, 2017), we are interested here in the supposed influence of the party leader on party policy and campaigning style. Relatedly, as PP left the conservative-led government in 2020 and failed to reach government positions during the 2021 national election, the party took on an oppositional role – a role that has been coupled with increased use of negative campaigning (Hartman and Törnberg, 2025). With these tendencies in mind, we expect to see changes in PP campaigning style after the year of 2021:
H1a: For Facebook, the PP will increase neg content on after 2021.
H1b: For Instagram, the PP will increase neg content on Instagram after 2021.
Relatedly, a series of research efforts have pointed to a general turn towards negative campaigning. For instance, Reuning et al. (2022) remind us that ‘anger is a potent force in both politics [. . .] and social media engagement’ (p. 5). Indeed, in their comparison of party communication during the 2014 and 2019 European Parliamentary elections, Klinger et al (2022) presented a quantitative content analysis of 14,293 political party posts and found overtime increases of negative campaigning efforts. While Hartman and Törnberg (2025) did not look at longitudinal change in their study of negative campaigning analysing a sample of 18 million tweets posted by parliamentarians in 19 European countries, their results suggest a clear presence of negative campaigning across a series of contexts. In southern Europe, Machado and Fenoll (2025) found that ‘negative campaigning has increased in Portugal over the last decade’ (p. 1). Based on these findings, we expect Norwegian parties to behave similarly:
H2a: Negative content will show ascending tendencies over time across all platforms.
H2b: Positive content will show descending tendencies over time across all platforms.
Next, with regard to what is referred to here as the demand of political communication across platforms, previous works suggest cross-platform differences. For Facebook, we have already mentioned the success of PP on this particular platform. Having devoted time and energy to build a following on Facebook (Kalsnes, 2016a), a series of empirical efforts have suggested that PP (Larsson, 2020; Kalsnes and Larsson, 2021) and indeed right-wing populists in other contexts (Davidson and Enos, 2024; Fine et al., 2024) typically enjoy higher levels of engagement when they adopt negative campaigning approaches on Facebook. Our third hypothesis reads:
H3: For Facebook, the PP will receive more likes for posts characterized by negative campaigning than for other types of campaigning.
While recent insights have suggested the use of negative campaigning also by parties other than PP (Magin et al., 2024), previous research regarding the types of content provided by non-populist parties that has reached high levels of online engagement suggest that negativity has been less of a driving force in this regard (Larsson, 2020). Given these mixed results, we formulate the following research question:
RQ1: For Facebook, what characterizes the distributions of likes per year for positive, negative and neutral posts provided by parties other than the PP over time?
Often pointed to as part of a ‘visual turn’ (Farkas et al., 2022: 2) in political communication, studies have found tendencies of personalization in the content provided by political actors to Instagram (Larsson, 2019). Indeed, Pineda et al. (2022) suggested that with some variation, content reaching high levels of engagement on the platform is characterized by ‘familiar or personal attributes’ (p. 5). As other scholars have suggested that Instagram is mainly used for entertainment purposes (Pelletier et al., 2020) and that it is geared towards engaging ‘the users’ ‘hearts’’ (Grusell and Nord, 2020: 6), we expect negative content to be less engaged with.
H4: For Instagram, negative content will not dominate liking activity.
If Instagram is seen as a friendlier platform, the reverse appears to be true for Twitter. For instance, in a study on the use of Twitter during the annual Swedish Almedalen democracy festival, Gustafsson and Larsson (2025) found something akin to hashtag hijacking (Burgess and Bruns, 2012) of these events by right-wing extremist actors. Beyond studies based on ‘hatetags’ (Orgeret et al., 2025), previous work has suggested increased harshness and incivility as typical of Twitter. Oz et al. (2018) studied responses to the online communication efforts by the White House and found that posts responding to tweets ‘were significantly more uncivil and impolite’ (Oz et al., 2018: 3400) than responses to Facebook posts. Southern and Harmer (2019) studied tweets sent in response to members of the UK parliament and found widespread use of incivility in messages sent to those in power. As negative content appears to be tangible on Twitter, we suspect that the engagement patterns emanating from the platform will be similarly geared towards negative content. As will be shown later, while PP effectively left Twitter in 2018, other parties continued to host accounts on the platform – accounts that have been more or less active in recent years (Larsson, 2024). With the above in mind, our fifth and final hypothesis is formulated accordingly:
H5: For parties other than the PP, negative campaigning on Twitter will be more liked as time goes by.
Methods
Data collection
The Norwegian political system features two ‘big tent’ parties – the Social Democratic Arbeiderpartiet (Labour Party; LP) and the Conservative Høyre (Conservatives; C). Beyond these dominating political powers, and of particular interest for the paper at hand, right-wing populism has made its mark also in Norway. Founded in 1973, the previously mentioned Fremskrittspartiet (PP) has in recent years become a party to be reckoned with. Entering the Norwegian parliament in the same year that the party was founded, PP remained in opposition until the 2013 election, the results of which led to a liberal-right-wing coalition government which would remain in power until the 2021 elections. With coalitions and other types of cooperations between parties being an essential part of political systems like the Norwegian one, research would suggest that parties and other political actors would abstain from focusing on negative campaigning. Indeed, too much negativity might stand in the way of successful coalition formation during post-election negotiations (e.g. Walter and Nai, 2015). Perhaps influenced by tendencies of increasing negative tones in international politics as discussed above (Rooduijn, 2019), such risks have not stood in the way of Norwegian parties adopting negative and similar campaigning techniques (e.g. Magin et al., 2024). This appears to be especially true for the aforementioned PP (e.g. Schwartz et al., 2022).
Against this backdrop, Table 1 provides an initial overview of how many posts were collected from what parties, on what platform and between which specific dates.
Parties included in the study. Presented in order of vote % in 2021 election.
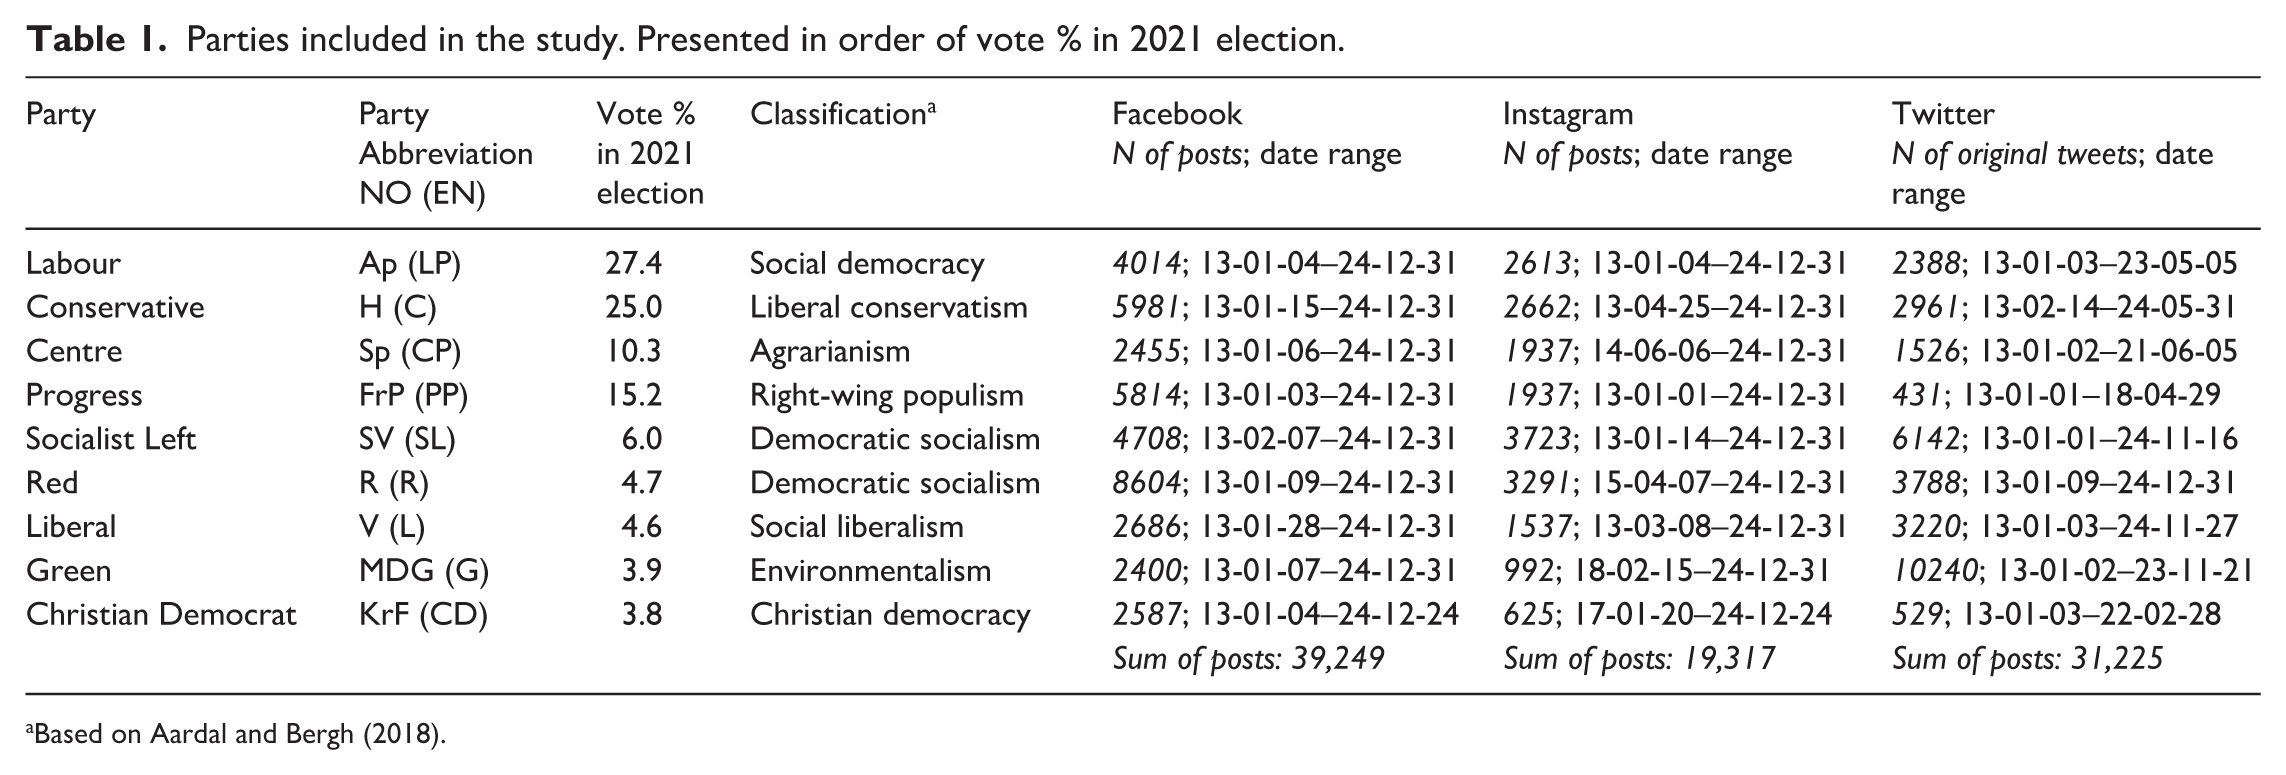
Based on Aardal and Bergh (2018).
For Facebook and Instagram, data were collected by means of the Meta Content Library (MCL), a data archiving tool offered by Meta. MCL allows for the archiving of structured data files featuring variables such as the text content of posts as well as variables showing the volume of engagement – such as likes – that each post had received at the time that the data was downloaded. For Facebook, a total of 39,249 posts were downloaded, while 19,317 posts were collected from Instagram.
For Twitter, recent changes in data access made it necessary to utilize different services for data collection. First, we used the now-defunct Twitter Academic API to archive all tweets from up until the closing of the API in early 2023. A custom-built scraper provided by apify.com was used to gather tweets from the remaining 2023–2024 period. Combining these two Twitter data sets, we first filtered the data to only include original tweets as penned by the specified accounts. Second, we checked the combined Twitter data set for duplicates. In sum, this resulted in a data set of 31,225 tweets.
Looking close at Table 1, the three right-most columns indicate gaps in the collected data. For Instagram, we see that a series of parties – CP, R, G, CD – were comparably late adopters. For Twitter, we see a reverse tendency. While all parties were active from the start of the studied period, the majority appear to drop off at earlier (such as PP and CP) or relatively later (such as C and SL) points in time. As such, while many of these accounts are still available to peruse on the platform currently known as X, they have not been updated for some time.
With Table 1 provided an initial overview of the N of posts collected, Figure 1 provides over-time insights into platform use – regardless of what types of content was provided in the posts.
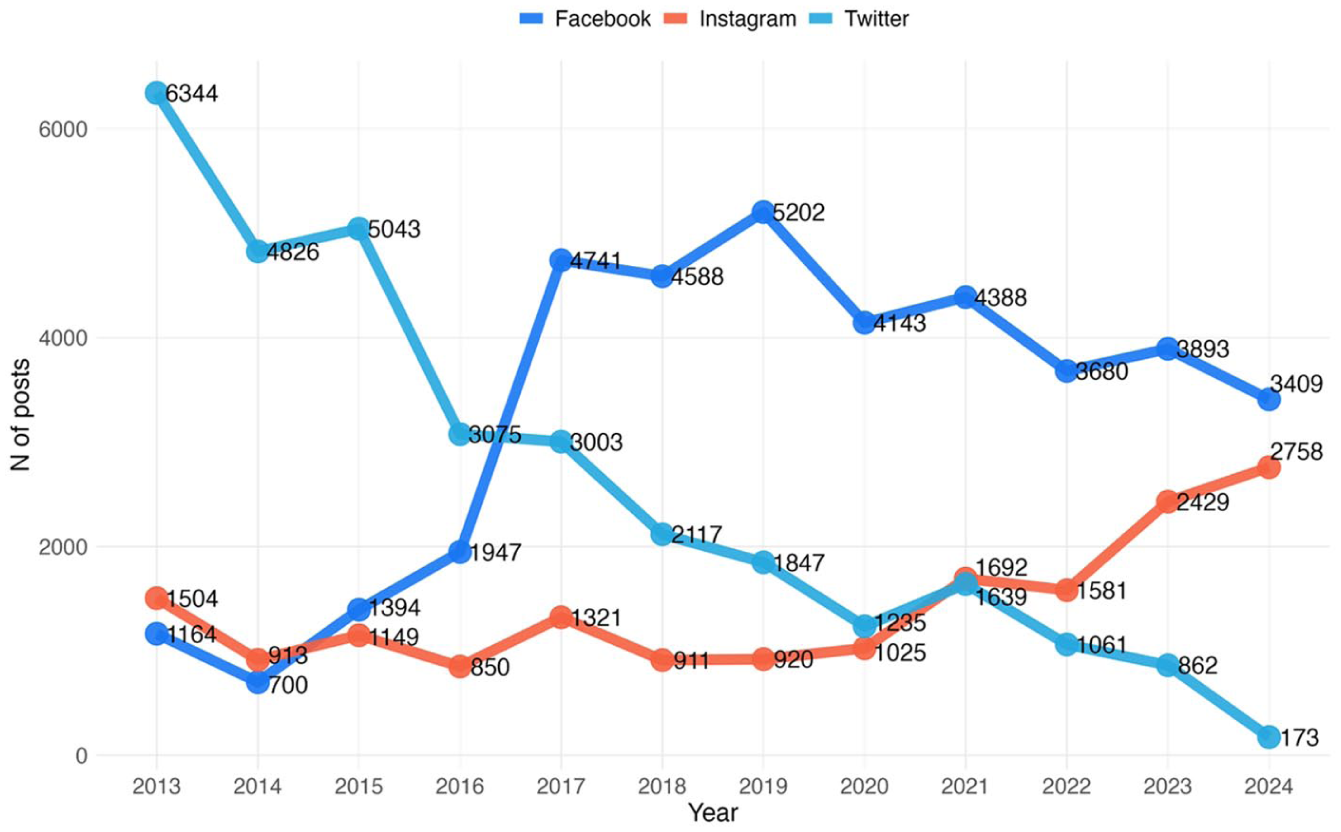
Number of posts throughout the studied time period.
Starting with Twitter, the light blue line shown in Figure 1 indicates a clear decline of use. If Twitter has largely been seen as an elite medium (Magin et al., 2024), the dark blue line representing the volume of Facebook activity undertaken by the studied parties would seem to strengthen its position as ‘more of a mass medium’ (Jacobs et al., 2020: 616). As can be seen Figure 1, the platform rises to its dominant position during the 2017 parliamentary election. Following the 2021 national elections, we see not only what could perhaps be described as the final sprint of Twitter use – but also the start of a slow decline for Facebook coupled with an increase of party Instagram use. In sum, the lines shown in Figure 1 give testament to the claim made by Enli (2017) that ‘social media election campaigns are constantly developing’ (p. 59) and indeed that as a result of such developments ‘even Twitter [. . .] may come and go’ (Bekafigo and McBride, 2013: 638).
Data analysis
Classification of social media posts into characterized mainly by positive, negative or neutral campaigning content was performed in three steps. First, posts were categorized by means of automated content analysis with the assistance of an LLM. Recent ventures into automated text annotation using LLMs have suggested that such models perform on par with or even outperform crowd-workers or trained annotators (e.g. Gilardi et al., 2023; Weber and Reichardt, 2023). This seems to be the case especially for comparably shorter texts – such as social media posts (Heseltine and Clemm von Hohenberg, 2024). Relatedly, scholars have pointed to the suitability of LLM-based approaches for determining the sentiments of texts (Gilardi et al., 2023; Weber and Reichardt, 2023) – arguably a task quite similar to the one handled here.
Following Törnberg’s (2024b) suggestion, we utilized OpenAI’s GPT-4 model (version gpt-4-0314). Based on previous work, we use what is commonly known as zero-shot annotation (as suggested by Heseltine and Clemm von Hohenberg, 2024; Törnberg, 2024a; Weber and Reichardt, 2023) and provided the LLM with ‘carefully formulated natural language instructions’ or prompts (Törnberg, 2024b: 2) – much like instructions would be provided to human annotators. With suggestions for ‘prompting strategies’ (Weber and Reichardt, 2023: 3) in mind, the LLM was instructed accordingly (translated from the original Norwegian to English): Please classify the following social media posts provided by Norwegian political parties as mainly characterized by negative, positive or neutral campaigning. Negative campaigning is understood as critique towards political opponents or others regarding their values, character, record, program, ideas and suggestions for policy. Positive campaigning features promotion of their own policies, achievements, and visions for the future rather than attacking or critiquing their opponents. Neutral campaigning is defined as information on campaign activities without taking a positive or negative stance.
Second, intracoder reliability was tested by having the same LLM recode a randomly selected sample of 50% of the original 89,791 posts (N = 44 896). Using Krippendorf’s α, reliability was measured at .86. Given that this coefficient can be seen as comparable with the one reported for the same test performed where the LLM had been asked to make ‘an educated guess’ (Törnberg, 2024b: 6) about party allegiances based on a data set of tweets sent by politicians, intracoder reliability was considered satisfactory.
Third, for intercoder reliability, inspiration was drawn from the ‘hybrid coding approach’ suggested by Heseltine and Clemm von Hohenberg (2024). First, the author coded a random 5% sample of the original 89,791 posts (N = 4490), following the same prompt as shown previously. Again employing Krippendorf’s α, intercoder reliability was gauged at .77. Second, another human coder was tasked in the same way as described and coded a random sample of 500 posts. Krippendorf’s α for this second round of intercoder reliability assessment reached .78. While these measurements did not reach the same level as was found for the intracoder reliability, this latter result nevertheless goes beyond the often discussed threshold of .7 (Lombard et al., 2002).
For measuring engagement, we use the like feedback option that had been present on the studied platforms for the entirety of our studied period. Following Heft et al. (2023), we consider likes to have ‘functional equivalence’ across all three platforms. Given the non-parametric nature of like counts, we opt for suitable statistical tests to determine mean differences (Kruskal–Wallis and Dunn’s tests).
Results
Figure 2 presents a faceted line graph allowing for insights into the year-by-year distributions (percentages shown) of the three different types of campaigning studied here.
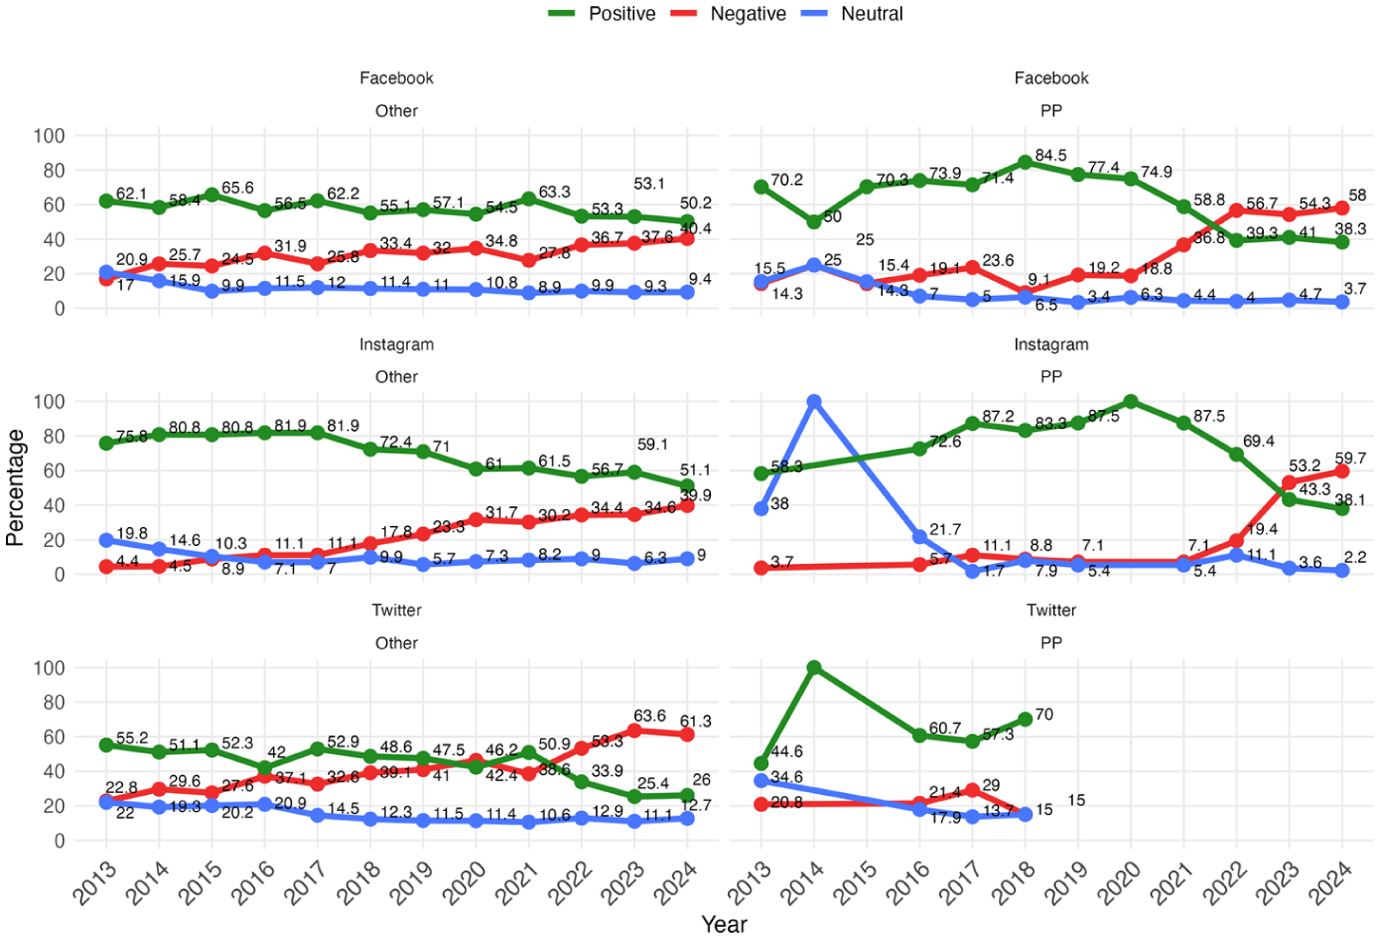
Distribution of posts characterized by negative, neutral and positive campaigning across platforms and parties (PP and other parties).
Our first hypotheses suggested a shift towards negative campaigning for PP on Facebook (H1a) and Instagram (H1b) following the introduction of Listhaug as party leader during the 2021 election year. For Facebook (please refer to the upper right-hand section of Figure 2), the lines indicate a clear shift following 2021. From 2022 and onwards, posts characterized by negative campaigning appear to be prioritized by PP, supporting H1a. For Instagram, we can discern a similar tendency. Here, the apparent shift towards negativity takes place 1 year later than on Facebook, leaving the final 2 years in our study characterized by mainly negative posts. Nevertheless, these results speak in favour of H1b. Thus, towards the end of our studied years, PP prioritizations change first on Facebook and 1 year later on Instagram.
Our next two hypotheses suggested that across all three platforms and for all actors other than PP, negative content would become more common over time (H2a) and that conversely, positive content would become less common over time (H2b). While Facebook (upper left-hand section of Figure 2) and Instagram (middle left-hand section) show similar tendencies in this regard, we can note at least one difference of interest between the two platforms. Specifically, the green line for Instagram appears to have a slightly clearer descent than the corresponding line shown for Facebook. This indicates a somewhat more tangible change towards negativity on Instagram. Notwithstanding these differences, the specified line trajectories lend support to H2a and H2b. For Twitter, this support is strengthened as the final 3 years of our study show a clear dominance of negative content. While previous years do indeed suggest mixed tendencies, the trends uncovered for these final years strengthen the support for H2a and H2b.
For our demand side analyses, we present three figures (Figures 3–5). Each of these deals with one platform, starting with Facebook. Each figure presents two panes – the right one visualizing the liking activity undertaken in relation to posts provided by PP, and the left one detailing these activities as undertaken in relation to other parties. The lines in each of these panes denote the mean amount of likes per year, while the jittered points visible in relation to these lines represent the underlying data points – one point represents one post made to each specific platform.
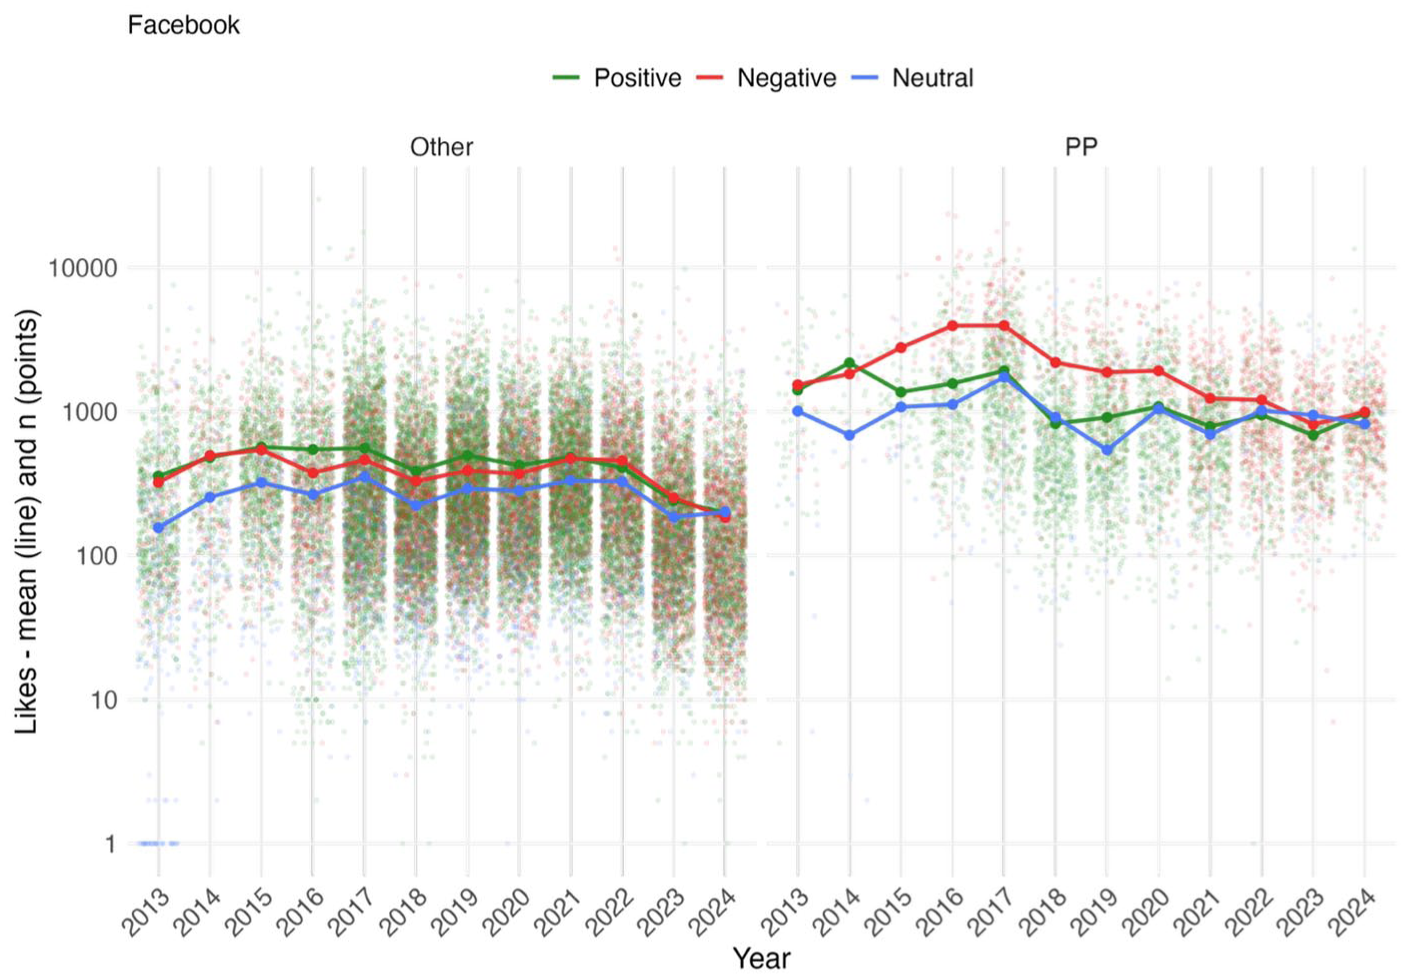
Means of Facebook Likes per party group, year and type of campaigning.
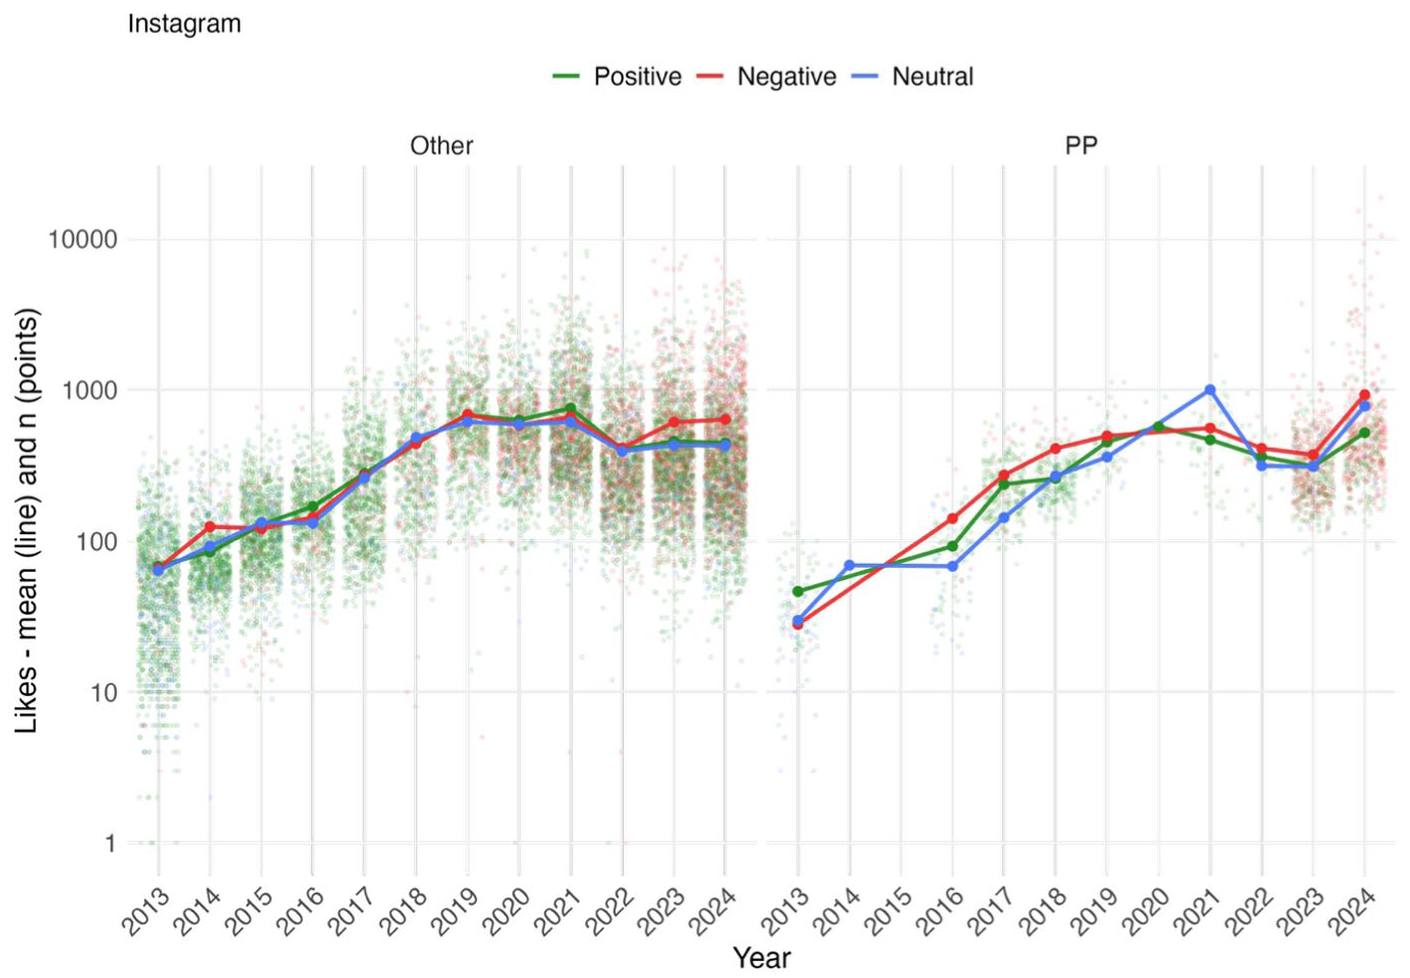
Means of Instagram Likes per party group, year and type of campaigning.
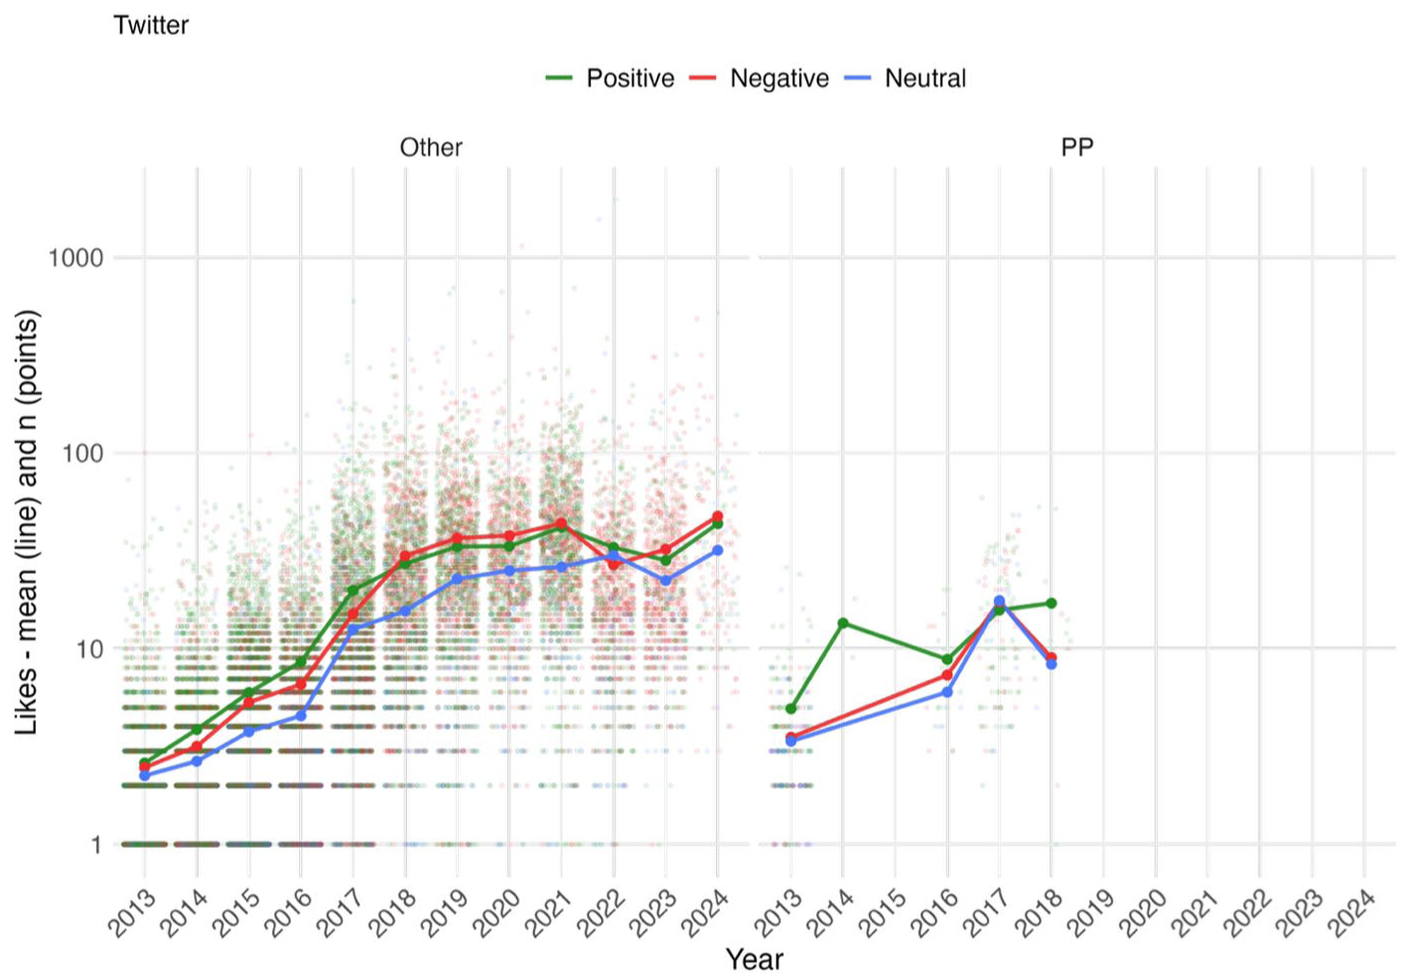
Means of Twitter Likes per party group, year and type of campaigning.
Our third hypothesis suggested that ‘For Facebook, the Progress Party will receive more likes for posts characterized by negative campaigning than for other types of campaigning’. Focusing on the right-hand pane of Figure 3, the red line representing the means of likes for Facebook posts featuring negative themes provided by PP has a prominent position for most years. A series of Kruskal–Wallis tests were performed – one for each year – comparing the mean differences between posts classified as characterized by negative, neutral or positive campaigning content. Mirroring the relative vertical proximity of the lines visible in the left-hand pane of Figure 3, these tests emerged as non-significant for 2013, 2023 and 2024 (p > .05 for all these years). Furthermore, post hoc analysis using Dunn’s test suggested that, much like one would assume from inspecting Figure 3, posts classified as featuring negative campaigning content received significantly more likes from 2015 and until 2022 (p < .01 for all years save for 2022, where p < .05). While no differences between the different campaigning types studied here for the three last years, the remaining 9 years did, however, emerge as featuring such differences. Thus, our third hypothesis is supported.
Focusing now on the left-hand pane of Figure 3, RQ1 asked: ‘For Facebook, what characterizes the distributions of likes per year for positive, negative and neutral posts provided by parties other than PP over time?’ The positioning of the green line, detailing positive campaigning efforts, suggests different trajectories when compared to PP. Performing a series of Kruskal–Wallis tests, significant mean differences were found for each year (p < .01) except for the last year in our study (p > .05). Post hoc analysis by means of Dunn’s test showed that while no significant difference could be discerned between the negative and positive varieties of campaigning for 2013 through 2015 (p > .05), differences between those two varieties and the neutral category were indeed significant for the same 3-year period (p < .01). From 2016 and until 2020, positive campaigning efforts were rewarded with significantly more likes (p < .01 for all yearly comparisons). However, from 2021, the tendencies shift to become more similar to those uncovered at the very beginning of the time period. Specifically, for 2021 through 2023, no significant differences between the means reported for positive and negative campaigning are reported (p > .05 for all yearly comparisons), while significant differences can be found when comparing these two to the neutral variety of campaigning (p < .01 across all yearly comparisons). As indicated by the overlapping lines in the right-hand pane of Figure 3, the final year under scrutiny – 2024 – sees no significant between the three studied varieties (p > .05 across all comparisons).
In sum, then, while PP followers appear to have engaged more with negative campaigning content, the picture is at least somewhat different for the other parties studied here. For these parties, positive content appears to have yielded more likes – at least historically.
Next, Figure 4 details the activity undertaken on Instagram.
For Instagram, our fourth hypothesis suggested that ‘negative content will not dominate liking activity’. Starting with the means of likes provided in relation to posts from PP (as seen in the right-hand pane), Kruskal–Wallis testing suggested non-significant mean differences for 2013–2015, 2020 and finally 2022–2024 (p > .05 for all comparisons). By contrast, significant mean differences were found for all other years, indicating a dominance of negative content in 2016 and 2018 (p < .01 for all comparisons during these years). For 2017, 2019 and 2021, while no significant difference could be discerned between the means of likes for negative and positive campaigning (p > .05 for all comparisons), the means reported for these two varieties were nevertheless significantly different from those reported in relation to neutral content. Providing further contrast to the results presented earlier in relation to Facebook, this suggests that the election year of 2021 saw neutral posts receiving more likes than the negative or positive varieties. In sum for PP on Instagram, then, while 2 years – 2016 and 2018 – see negative content receive higher means of likes, the remainder of our studied years suggest differing patterns airing support for our fourth hypothesis.
For parties other than PP, the lines shown in the right-hand panel emerge as clustered quite close, suggesting limited differences between the means of likes. Utilizing a series of Kruskal–Wallis tests, significant mean differences were nevertheless found for 2014 (p < .01), 2016 (p < .05) as well as for the final 2 years – 2023 and 2024 (p < .01 for both years). The remainder of these tests emerged as non-significant (p > 05 for all those years), reflecting the proximity of lines. Post hoc testing using Dunn’s test was performed in relation to those years where differences had been uncovered – 2014, 2016, 2023 and 2024. The year 2014 saw negative content dominate (p < .01 for all comparisons). This tendency is reversed in 2016, where no significant mean difference was reported between neutral and negative type content (p > .05 across all comparisons), but where positive campaigning content reported higher means (p < .05 across all comparisons). For the final two studied years, we again see negative content receiving more likes than posts classified as featuring positive or neutral content (p < .01 for all comparisons during both years).
Thus, while 3 years showed tendencies of negative content receiving more likes, the remaining 9 years either showed no significant differences between the studied types of content or suggested that more likes were on average awarded to posts featuring positive content. Taken together with the results reported in relation to PP as discussed above, the findings discussed here lend support for our fourth hypothesis.
Finally, for Twitter, Figure 5 details the means of likes per year much like has been done for Facebook and Instagram above.
Much as for Figure 2, the left-hand pane of Figure 5 allows us to clearly see the break in Twitter activity as undertaken by PP. Indeed, while the former Twitter, now X account still exists at the time of this writing, the latest post from the account at the time of this writing had been provided on 29 April 2018.
Given the deluge of PP activity on the platform at hand, our interests for liking patterns in relation to posts featuring positive, neutral and negative campaigning were focused on their competitors. Taking the aforementioned trends towards negativity into account, our fifth hypothesis suggested that ‘For parties other than the Progress Party, negative campaigning on Twitter will be more liked as time goes by’. The lines shown in the left-hand pane of Figure 5 suggest some tendencies in this regard. Again utilizing Kruskal–Wallis testing for all years, 2013 and 2022 saw no significant differences between the means of likes found for the different types of campaigning. Moving on, yearly Kruskal–Wallis testing for 2014 through 2017 all emerged as significant (p < .01 for all years), with subsequent post hoc testing employing Dunn’s tests indicating significant differences between all reported means for these years (p < .01 for all comparisons). Inspecting the left-hand pane of Figure 5 for the following 4-year period of 2018–2021, a change in the positions of the lines is evident. No significant difference could be discerned from 2018 through 2021 between the means reported for posts classified as positive and negative (p > .05 for all such comparisons across all mentioned years). Conversely, and perhaps somewhat expected given the positioning of the blue line during these years, the means for negative and positive campaigning posts alike emerged as significantly higher than the means reported for posts classified as characterized by neutral content (p < .05 for all such comparisons across all mentioned years). With the comparisons for 2022 already discussed above, the tests performed for the final 2 years in our study show tendencies similar to those reported for the 2018 through 2021 period. Specifically, while no significant differences were found between the means reported for negative and positive campaigning posts (p > .05 for all such comparisons for 2023–2024), the differences between these two means and the mean for posts characterized by neutral content emerged as statistically significant (p < .05 for all such comparisons for 2023–2024).
With the first 4 years studied saw positive posts gain higher amounts of likes on average, and with negative posts being indistinguishable from positive posts with regard to liking patterns for 6 out of 12 studied years, we do not find support for our fifth hypothesis. Negative campaigning posts did not yield higher amounts of audience engagement – a finding that would appear to go against the general image of the platform under scrutiny as discussed above.
Discussion
With regard to the prevalence of negative campaigning, the results shown in Figure 2 suggest that the right-wing populist PP did indeed embrace negativity over other emotions following the aforementioned leader shift during the 2021 election year. As two tendencies are likely to have been at play here – PP shifting from governing to opposition party, Listhaug supposedly taking a more aggressive stance to communication strategy – it is difficult to pinpoint the degrees to which leadership or party status change yielded influence over the communication provided on the Meta-owned platforms. The suggestion is made for researchers to assess these matters in other countries and contexts – to what extent do changes in party leadership result in changes in party communication prioritizations? Relatedly, the finding that both Facebook and Instagram are owned by Meta could play a part in how mainstream parties appear to be slowly gearing their communication towards more negative stances. While we are not implying direct efforts on behalf of platform operators to influence the posting strategies of political parties, previous research has nevertheless uncovered how technology actors shape political communication efforts (e.g. Roemmele and Gibson, 2020) in more indirect, perhaps even clandestine ways – a claim that fits well with the whistleblower reports that have suggested the incentivization of negative content by the platforms themselves (e.g. Zubrow, 2021). Moreover, the similarly gradually descending green and ascending red lines for parties other than PP shown in Figure 2 seem to suggest a slow creep towards negativity dominating these platforms. While we cannot speak in detail about the mechanisms behind such developments, the findings presented here speak to overall developments towards polarization in politics, as visible through lenses of ‘affective publics’ (Papacharissi, 2015) and indeed in the ‘tenor of our shared conversations’ in public life (Wahl-Jorgensen, 2019: 2).
As expected, this creep towards negativity appears as even more stated on Twitter. As the corresponding red and green lines in Figure 2 intermingle to higher extents for parties other than PP than they did for the platforms dealt with above, our results fall in line with previous scholarship that has pointed to Twitter as particularly characterized by negativity. While PP and indeed their leaders stopped using Twitter in 2018, another individual appears to have made his mark on this latter platform. In 2022 – the same year that Elon Musk finalized his Twitter takeover – we see a clear division between negative and positive content – a division that seems to grow clearer for the remaining studied years. Indeed, researchers (e.g. Karpf, 2024) and pundits (e.g. Colomé, 2025) have pointed to increased negativity after the Musk takeover – presumably because of changes to the algorithm guiding content visibility. Again, while we cannot claim a direct relationship between platform ownership and their algorithmic prioritizations on the one hand and the social media activities of Norwegian parties on the other, the patterns uncovered here nevertheless appear to fall in line with tendencies uncovered elsewhere. The results presented in this regard are likely derived not only from changes to the technical architecture of the platform – it does not seem unlikely that the flight of more mainstream or even progressive political voices from X to other platforms have further influenced the various algorithms that guide visibility on this and other platforms. Assessing these trends in other countries might help shed further light on the influence of powerful individuals and entities on platform tendencies towards negativity.
With regard to the demand perspective of communication, Figures 3 and 4 provided insights into the degree to which negative, positive or neutral content was engaged with through the years. While PP received more likes for negative content on the Meta platforms at the start of the studied time period, this tendency waned over time. For other parties, traces of a reverse tendency could be discerned. For Facebook, the initial dominance of positive content in this regard ended up in a mixed situation towards the end of our studied time period. For Instagram, a clearer dominance of negative campaigning receiving more likes can be seen during the last two studied years. Thus, not only have we seen a shift in relation to the types of contents supplied by the parties studied here – we can also discern changes in what types of content becomes ‘likable’ for their audiences. The juxtaposition of these results creates a series of contrasts – consider, for instance, that while PP increased their share of negativity on Facebook during the latter years in our study, audience demand for such content appears to have dropped given the non-significant mean differences disclosed earlier. While Twitter shows tendencies similar to Facebook, Instagram emerges as the odd one out, as negative campaigning efforts received more engagement than the other types of content studied here. Looking beyond the study at hand, perhaps this latter result suggests the beginning of the end of Instagram as a ‘friendly platform’ – as discussed earlier. Differences and contrasts like those reported here can hopefully be of interest not only to communication researchers, but also to relevant practitioners involved in crafting and evaluating communication campaigns.
While the study at hand has provided useful insights into the longitudinal use and popularity of negative campaigning across three social media platforms, it has limitations that need to be addressed. First, we have already mentioned the seemingly never-ending introductions of new social media services. TikTok is one example, Bluesky another. Whether or not these or other novel platforms will succeed in upholding longevity in ways similar to those studied here, the inclusion of comparably novel platforms is important in order for comparative political communication scholars to be able to shed further light on developments such as those studied here. At the same time, while new platforms emerge, older platforms develop and change in ways of relevance for the work presented in the paper at hand. Facebook, for instance, introduced their Reactions engagement variety in 2016. Given the cross-platform comparisons presented here, detailing Reactions was not deemed a suitable approach. However, the changing nature of Facebook Reactions in relation to emotional campaigning varieties could be an interesting opportunity for future research.
Second, while Norway is a party-centred democracy, individual politicians such as party leaders play an increasingly important role in online campaigning efforts such as those studied here. Indeed, the apparent effects of leadership change in the PP as detailed above serves as an example of the influence yielded by individual politicians. With this in mind, future studies might find it useful to assess the supply and demand of negative and positive campaigning efforts also for party leaders.
Third, while the three-way classification of campaigning across time and platforms utilized here has provided useful insights into how campaigning develops, it does not allow for more detailed insights into aspects of political communication such as different rhetorical forms. Related to this is the issue of the many different ways that negativity and indeed positivity can be expressed in political contexts. The longitudinal, multi-platform design featured here made such more sophisticated approaches impossible. Hopefully, the design and results presented in the paper at hand will be useful for anyone wishing to take on such more specified endeavours.
Footnotes
Funding
The author received no financial support for the research, authorship and/or publication of this article.
Author biography
![]() .
.