
Abstract
We combine AI-based visual content analysis data with large-scale topic modeling to examine the proportion of coverage and the visual construction of the wars in Ukraine and Gaza in Facebook posts published by 51 top European media organizations between 25 February and 2 April 2024 (N > 90,000 posts). This period coincides with the 2-year anniversary of the Russian invasion and overlaps with the sixth month of the war in Gaza. The analysis finds an imbalance in the volume of coverage allocated to the two wars, as well as war-specific visual framing devices, but also similarities in their portrayals. Ultimately, in both cases, the visualization of war creates a distance between the viewers and those affected on the ground.
The sprawling impact of the war in Ukraine following the Russian invasion on 24 February 2022, and of the war in Gaza following the Hamas terrorist attacks on 7 October 2023, can hardly be overstated. Tens of thousands of lives have been lost, millions have lost their homes, and billions of euros have been fueled into humanitarian and military efforts. Beyond the direct costs, recurring street protests about the conditions in Gaza have exposed the dwindling public confidence in political elites’ commitment to the same humanitarian goals in both conflicts.
Most European citizens have experienced these conflicts remotely, with war news regularly vying for their screen attention. Increasingly, media reaches people online: in 2024, about 75% of the European public consumed news online, 44% on social media only (Newman et al., 2024). Given the media’s unique role in bringing the battlefield developments to the attention of the European public, and its role in framing public understanding of foreign conflicts (Jungblut, 2022), we leverage the current AI capabilities for large-scale visual analysis (Dumitrescu et al., 2025) to examine the share of and visual construction of the news about the Ukraine and Gaza wars on the Facebook feeds of the top news sources in the 24 European countries in spring 2024. In the crowded social media space, the 2024 Reuters Institute Digital News Report ranked Facebook as the number one social media news channel in 19 of these countries, with an average 33% of the public using it for news (Newman et al., 2024). Our database encompasses all Facebook posts available for scraping containing both visuals and text, published by 51 news media between February 25 and April 2, 2024 (N = 94,184 posts).
While the two conflicts have different political and historical roots, as well as radically different triggers, a comparative analysis of their coverage in the mainstream European media is important for several reasons. First, they share key similarities. Both war theaters are culturally and geographically close to Europe, and, as such, they pose an unprecedented challenge in recent history to European values and security. Moreover, during our period of focus, both claimed thousands of lives, despite no groundbreaking frontline developments. 1 Furthermore, as noted by others, they both involve a confrontation between a large military power (Russia and Israel) and “a neighboring nation (Ukraine and Palestine) with whom it has historically unequal relations” (Oleart and Roch, 2025: 1689). At the same time, evidence from public discourse analysis suggests that EU leaders took different approaches to each conflict. While the top EU leaders, Ursula von der Leyen and Josep Borrell, consistently treated Ukraine as part of the European family, “the relationship between ‘Europe’ and Palestine [was] portrayed as that of ‘others’” (Oleart and Roch, 2025: 1702). In sum, a comparative analysis of their concurrent media coverage can yield new insights not just into how mainstream media across the European continent juggles the demands of reporting concurrent significant foreign developments, but also into the differences and overlaps in the mediated image the public gets exposed to.
Empirically, we examine the Ukraine and Gaza war coverage as part of the overall political coverage on Facebook by the selected media in each country and compare it with the share of and visualization of non-war political news. Then, in line with previous research (e.g. Fengler et al., 2020), we consider whether geographic closeness to the war theater or domestic importance influence countries’ media war-specific coverage volume. We also consider if, given EU top elites’ documented conflict-specific framing, as well as the constant reports of victims on both fronts, the comparative coverage volume differs by country media system, as classified by Humprecht et al. (2022). This classification combines considerations about journalists’ commitment to reporting excellence, with the perceived importance of political bias in a system, along with support for a strong public service and widespread access to the media. Given the European public’s shared interest in learning about the realities of these wars, we build on this classification to examine whether the cross-war coverage differs in countries where support for journalistic excellence and public service is higher. Finally, we examine how the two wars are portrayed on Facebook. Here, in line with previous research on war coverage (e.g. Schwalbe, 2013), we first consider the visual importance given to actors—politicians and non-politicians. Moreover, as the denotative aspects of the portrayals (shot distance and group shots) affect viewers’ perceptions of those depicted (Azevedo et al., 2021; Kogut and Ritov, 2005; Kress and Van Leeuwen, 2020; Rodriguez and Dimitrova, 2011), we consider the extent to which non-politician actors are portrayed with close-up shots and through crowd shots. Last, but not least, we investigate the association of each war with technical shots (Fahmy, 2010) such as those showing destroyed buildings and the military. Overall, we find both differences and similarities in the coverage. While the war in Ukraine is more prominently covered, and different visuals are associated with each war (notably, visuals of politicians with the portrayal of Ukraine, and visuals of crowds with the portrayal of Gaza), ultimately, the framing devices utilized are consistent in their lack of personalization of those affected, thereby cementing the distance between viewers and the ground realities of the war.
We proceed with the theoretical background leading to our analysis, followed by the data and the results. We conclude with a discussion of our findings and the limitations of the study.
Theoretical background
Why media coverage of foreign conflicts matters
The volume of coverage
When it comes to the coverage of wars and foreign conflicts, the mainstream media are uniquely positioned to influence “the perceived relevance of a conflict, the predominant interpretation of conflict events, the public’s attribution of conflict roles (e.g. victim, perpetrator or hero) and the public support for conflict interventions” (Jungblut, 2022: 126), due to the mediated nature of international events. While existing levels of public concern moderate the media’s influence (Geiß, 2022), the amount of issue coverage in the media can nonetheless play a role in increasing or maintaining that concern.
The visual framing of the coverage
In addition to the volume of coverage, the framing of war stories, particularly through the focus on specific actors, can affect the public’s perceptions about who and what is more important and who is to blame (see review by Jungblut, 2022). While both the text and the visual components of framing contribute to this effect, “many studies conclude that the visual frame sets the direction and interpretive horizon in which the accompanying linguistic information is evaluated” (Geise and Xu, 2024: 16). Visuals’ “iconicity, their indexicality, and especially their syntactic implicitness” (Messaris and Abraham, 2001: 220, cited by Fahmy (2010)) have been shown to pack considerable politically relevant information, which in turn affect how people interpret the topic and actor depicted (e.g. see overview in Dumitrescu (2016)).
Human-interest stories can ease compassion with those affected (e.g. Boukes, 2022), and previous research has distinguished the human-interest visual frames focused on those affected by the war, from frames that focus on the technical aspects of the operations (Fahmy, 2010). Moreover, who is portrayed—elite political actors, or civilians/non-governmental actors—also reflects the importance of voices in the conflict. In a mixed, qualitative-quantitative analysis of the framing of the Iraq war in 2003–2004 in the mainstream American press, Schwalbe (2013) finds that the presence of politicians was the second most utilized framing device, accounting for about 30% of the frames. Similarly, visuals of political elites were identified as an integral part of the political narrative of the Russian invasion of Crimea in 2014 (Ojala et al., 2017) as they appeared in about 45% of the images analyzed by the researchers from across several mainstream European media sources. At the same time, other research found that the focus on politicians or civilians might depend on the conflict party: Dobernig and Lobinger (2010) found that in the coverage of the 2009 Gaza crisis in mainstream European media, the Palestinian side was overwhelmingly represented through images of civilians, while the other parties were more likely to be represented through politicians.
In addition to who is pictured, other denotative and stylistic-semiotic levels of visual framing (Rodriguez and Dimitrova, 2011) contribute to the understanding of the news coverage. In the grammar of visual design (Kress and Van Leeuwen, 2020), the shot distance influences the audience’s connection with those depicted. Closer shots make image subjects seem closer to the viewer, while wider shots help cement the distance between the audience and the ground reality the image reflects. Moreover, recent experimental research suggests that group portrayals of refugees are perceived as a “less humane way of visualizing them” (Azevedo et al., 2021: 13), which is in line with the “identified victim effect” (Kogut and Ritov, 2005). These results suggest that in the coverage of wars, the emotional distance the audience feels with respect to crowds and wide shots should increase compared to more close-up, individualized portrayals.
Cross-national coverage of the Ukrainian and Middle East conflicts in the European media: existing evidence
Several studies have examined the European media coverage of the long-running Russian-Ukrainian conflict, with different methods and research foci. Looking at the amount of reporting, a study of the coverage of the 2014 war in 13 European countries by Fengler et al. (2020) found three different levels of media attention: high (e.g. Poland and Germany), limited (Czechia, the United Kingdom, the Netherlands, Portugal, Latvia, and Switzerland) and marginal (Albania, Romania and Serbia). The authors theorized that such differential attention could be partially traced to the diplomatic involvement of the Polish and German governments in bringing about a resolution (Fengler et al., 2020, pp. 407–408). Studies about the framing of the 2014 conflict point to a largely shared European perspective. For example, Ojala and Pantti (2017) examined the use of frames capturing “national politics,” “international politics” and “violence and war” in four main newspapers from the United Kingdom, Germany, Finland, and Sweden, finding that “despite their differences, the papers’ dominant framing patterns largely aligned them with the ‘Western’ position in the conflict while alienating Russia” (Ojala and Pantti, 2017: 51). Ojala et al.’s (2017) study of the portrayals of actors throughout the conflict corroborated this shared European position.
Peer-reviewed research on the coverage of the Israeli–Palestinian conflict over the past decades in the European media is significantly scarcer. A rare study by Baden and Tenenboim-Weinblatt (2018) includes coverage of the conflict from January 2006 to June 2015 in six newspapers in France, Germany, and the United Kingdom, but this is combined with other sources into a larger category of “foreign news” outlets. The results point to the conflict being closely monitored, with rich coverage also in between active phases (pp. 28–30), but the data does not allow for a comparative intra-European analysis of the amount of coverage. In a different study of these same European media outlets, the authors conduct a quantitative analysis of the conflict’s framing for the same period, and find mostly uniformity, but also some differences between the French newspapers compared to their UK and German counterparts (Baden and Tenenboim-Weinblatt, 2017). Still looking at framing, Segev and Miesch (2011) followed a different research focus (i.e. the sentiment associated with Israel), as they examined the coverage of the conflict in the first 6 months of 2010 in France, Germany, the United Kingdom, Italy, and Switzerland. Their results point to higher levels of negativity in the United Kingdom and Italy compared to the other three countries.
Current research on the European media coverage of the most recent, ongoing wars tends to focus on a limited number of media outlets and countries, and therefore does not yet allow for a more rounded, continent-wide perspective to emerge. 2 However, an indication of the public framing of the current conflicts in Europe is provided by recent analysis of the speeches of EU Commission President Ursula von der Leyen and Vice President Josep Borrell (Oleart and Roch, 2025). The study found that whereas in the case of Ukraine, the underlining theme for both officials was one of support for the suffering of the Ukrainian people along with a call for unity in fighting against the Russian aggression, in the case of Gaza, the message about the human suffering was more muted. In this case, the focus on combatting terrorism overshadowed the humanitarian support, although the authors also report differences between the two leaders, with Borrell more critical of the Israeli actions in Gaza.
Taking stock of the current knowledge about the coverage of both conflicts, significant gaps remain, due to the limited national coverage of the existing data and the different methods applied to the study of each conflict. Moreover, the analysis of the EU leaders’ speeches corroborates the unity message with respect to Ukraine found also in previous studies of European media and shows less unity in the treatment of Gaza. It thus becomes empirically important to examine to what extent such cross-conflict patterns are mirrored in the media coverage and visual framing across the continent, as well as how countries may differ in these respects.
What drives between-country differences in coverage?
One potential driver of differential conflict media salience is its relevance for domestic politics, as suggested by Fengler et al. (2020). Jungblut (2022) also points to previous studies supporting the role played by geographic proximity and aid in influencing media war coverage salience (pp. 129–130). 3 Thus, one would expect the volume of media coverage in the East of Europe, especially among the neighbors of Ukraine and Russia, to be higher for the war in Ukraine, compared to the other countries (H1a); the volume of Ukraine coverage to be higher than the volume of the Gaza coverage across Europe (H1b); and the comparative importance given to the two conflicts in the media to be more skewed toward Ukraine among its immediate neighbors (H1c). We call this the “Proximity/Domestic Relevance and Coverage Volume” Hypothesis (H1).
Given that both conflicts have European-wide ramifications, that they both involve significant human right abuses, and given the imbalance in elite framing, the country-specific media environments might also influence what kind of coverage the public gets. In their analysis of 29 European countries, Humprecht et al. (2022) find that countries map into three media systems models: Democratic Corporatist, Hybrid, and Polarized Pluralist. The Democratic Corporatist model is characterized by high levels of excellence when it comes to journalistic reporting norms, state support for public media, and media reach, but also low political parallelism, and countries that fit it best are Austria, Denmark, Germany, Finland, the Netherlands, Norway, Sweden, and Switzerland. The Hybrid model is characterized by medium levels on all dimensions is represented by Belgium, Czechia, France, Ireland, Italy, Portugal, and the United Kingdom. Finally, the Polarized-Pluralist model exhibits high levels of political parallelism and low levels on all the other dimensions. Countries mapping into this model are Bulgaria, Croatia, Greece, Hungary, Poland, Romania, and Spain. In light of the similar evolution of the conflicts throughout the period examined (i.e. high numbers of victims, no major breakthroughs), one might expect the two war theaters to benefit from similar coverage priority levels in countries where journalists have a stronger commitment to excellence in news reporting and public service, and political parallelism is low; thus, in countries fitting the “Democratic Corporatist” model, compared to other media system groups.
Summing up, previous war coverage research (conducted primarily in Western countries) suggests media uniformity for the framing of Ukraine, and more country-specific patterns for the Gaza coverage; while cross-European media systems research provides a basis to investigate whether the bias in the cross-war coverage volume is lower in countries with stronger journalist commitment for reporting excellence and public service. We build on these research strands to formulate the following additional Research Questions:
Methods
Data collection and processing
Retrieval procedure
Our investigation began by identifying the Facebook pages of the top two online news sources in each of the 24 European countries included in the Reuters Institute 2023 Digital News Report (Newman et al., 2023), for a total of 51 outlets (see Supplemental Appendix Table A1). 4 We then used the Apify Facebook Scraper to collect all the Facebook posts from these outlets between 25 February 2024 and 2 April 2024 (for a total of 113,241 posts). The collection occurred every 2–4 days, with 1-day overlaps between collection sessions, to avoid data loss. The Apify Facebook Scraper provided the text in the body of the post, a link to the image, and other meta data. The image associated with each post was downloaded with Octoparse. We subsequently removed duplicates based on Facebook post ID and posts for which the image could not be downloaded, resulting in 96,702 cases.
Additional text collection and text processing
As the Apify Facebook Scraper only provided the text present in the body, we retrieved any additional text present on the images associated with the posts using AMMICO, an open-source software designed to extract textual information from visual outputs (Dumitrescu et al., 2025). All the non-English text was subsequently translated to English with Google Translate, 5 and only posts that had at least 10 non-space characters were retained (N = 95,088 posts). We next cleaned the text using the quanteda R package, by removing the punctuation, weblinks, and stop words. The final step in the data preparation was to remove the posts with no tokens, leaving us with a final database of N = 94,184 cases. Figure 1 gives an overview of our geographical coverage, together with the country-specific number of cases.
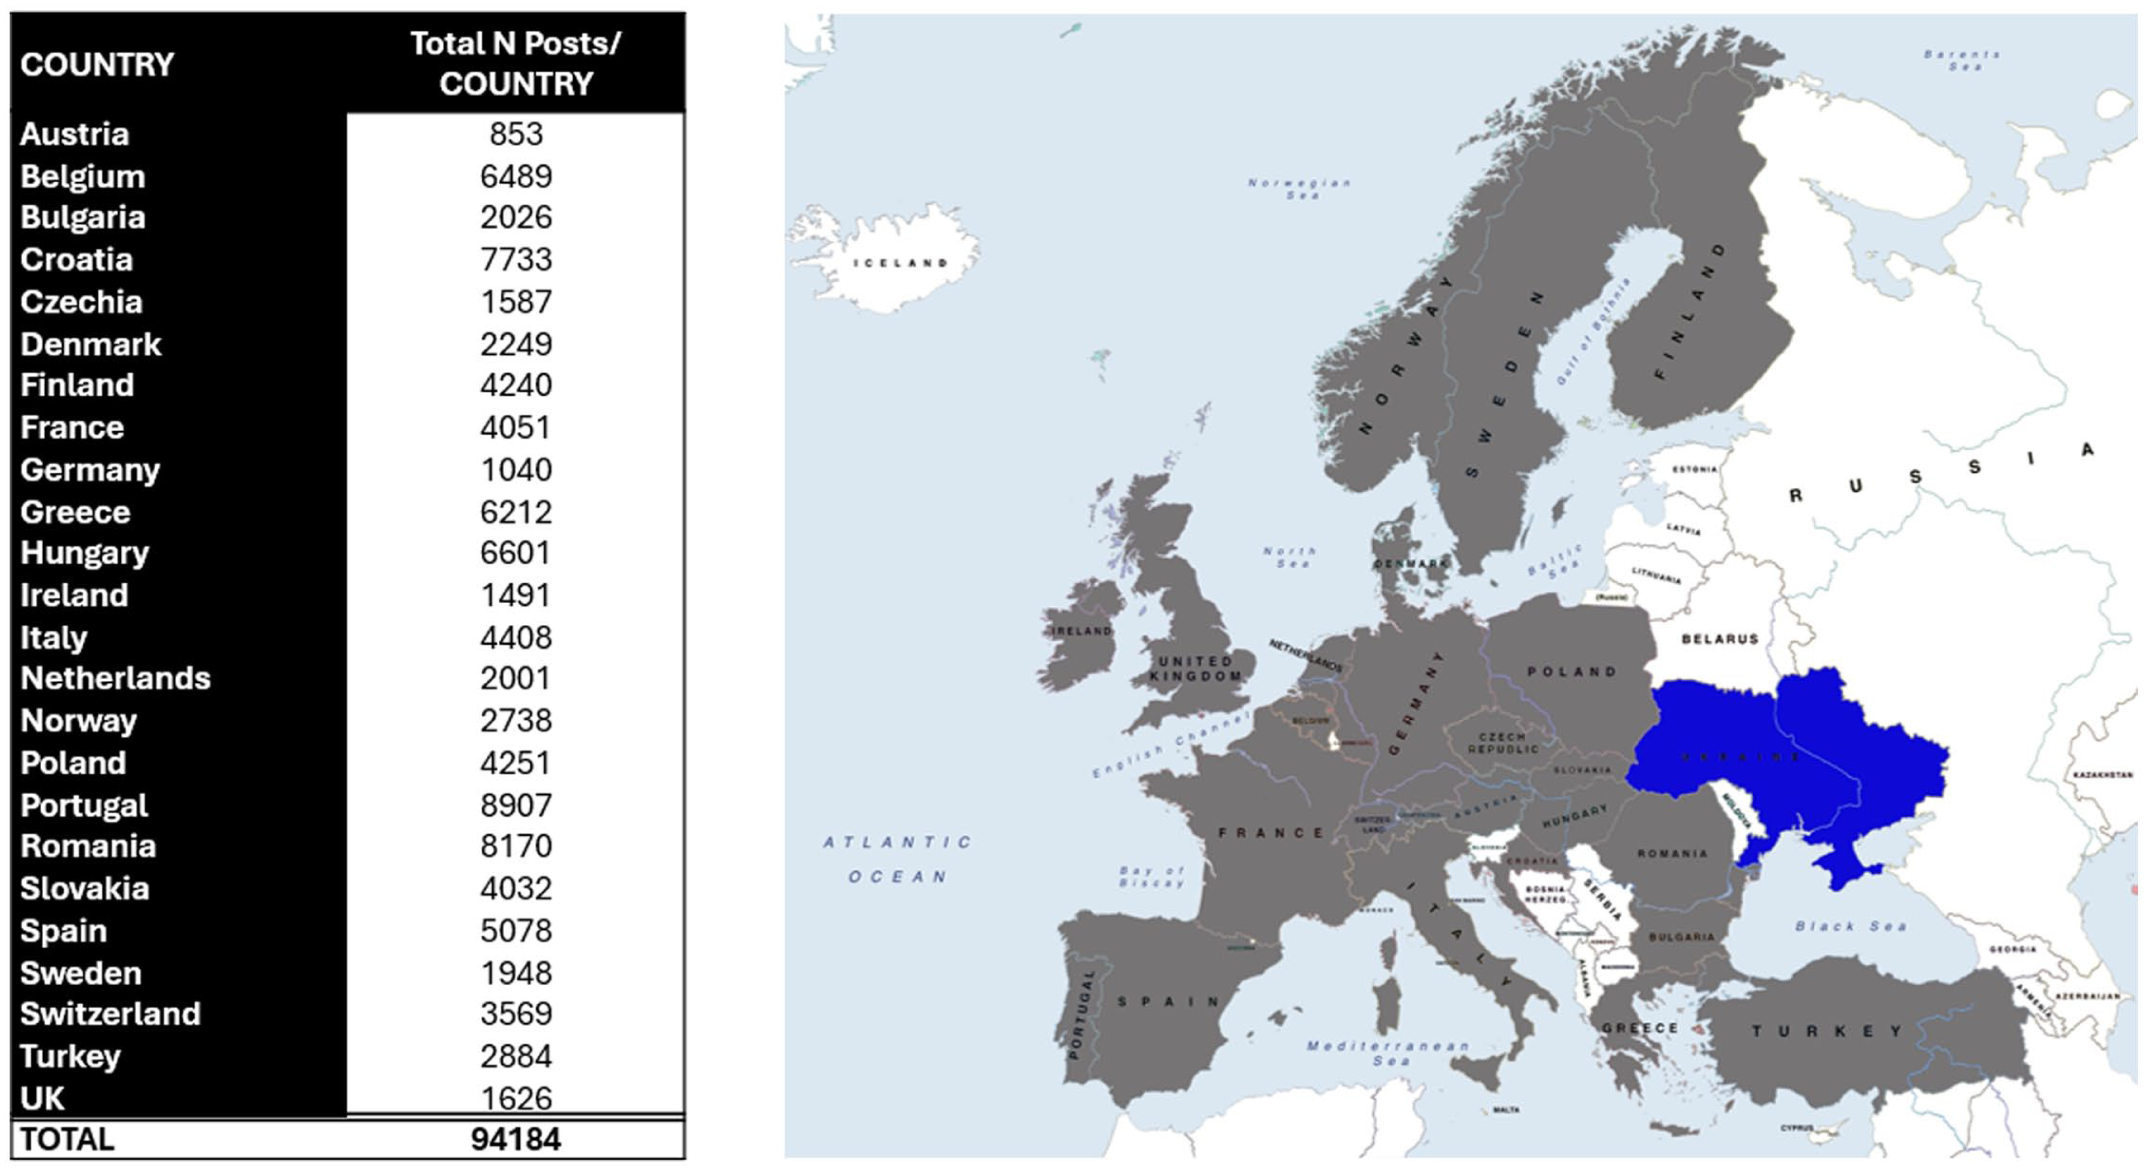
Visualization of the geographic coverage and distribution of posts by country.
Variables: war coverage share and visual framing
After translation of the entire corpus of texts to English, 200 texts were randomly selected for two coders to extract topic keywords. The two sets of keywords were subsequently combined and mapped into an initial set of commonly agreed topics, covering the wars in Ukraine and Gaza (hereafter referred to as “Ukraine/Russia” and “Gaza/Israel” topics, to reflect all belligerent parties), politics (e.g. political actors and institutions, EU politics, US politics, elections, and general political process—formal and informal, such as debates), sports, crime-related topics (violent or not), environment (i.e. nature, natural places), migration, economy (e.g. tax returns), entertainment (e.g. Oscars), weather, food, health, personal stories and deaths (e.g. obituaries). Based on this initial evaluation, we estimated the topics in the entire data using a Keyword-Assisted (keyATM) topic model (Eshima et al., 2024). The KeyATM model provides a semi-supervised Bayesian approach “that combines a small amount of information with a large amount of unlabeled data” (Eshima et al., 2024: 731), thereby utilizing pre-existing researcher knowledge, while taking full advantage of the benefits of a Bayesian framework. The model approach is discussed at length in Supplemental Appendix A2, Section A2.1. To improve model performance and parsimony, we only specified a limited number of keywords, collapsed some political topics and dropped other non-political ones (e.g. nature, food). Across multiple model iterations, the model that performed best had 12 set topics and 3 free ones. 6 Table 1 displays the set keywords and the top 10 words for each topic.
Topic modeling results with the KeyATM package.
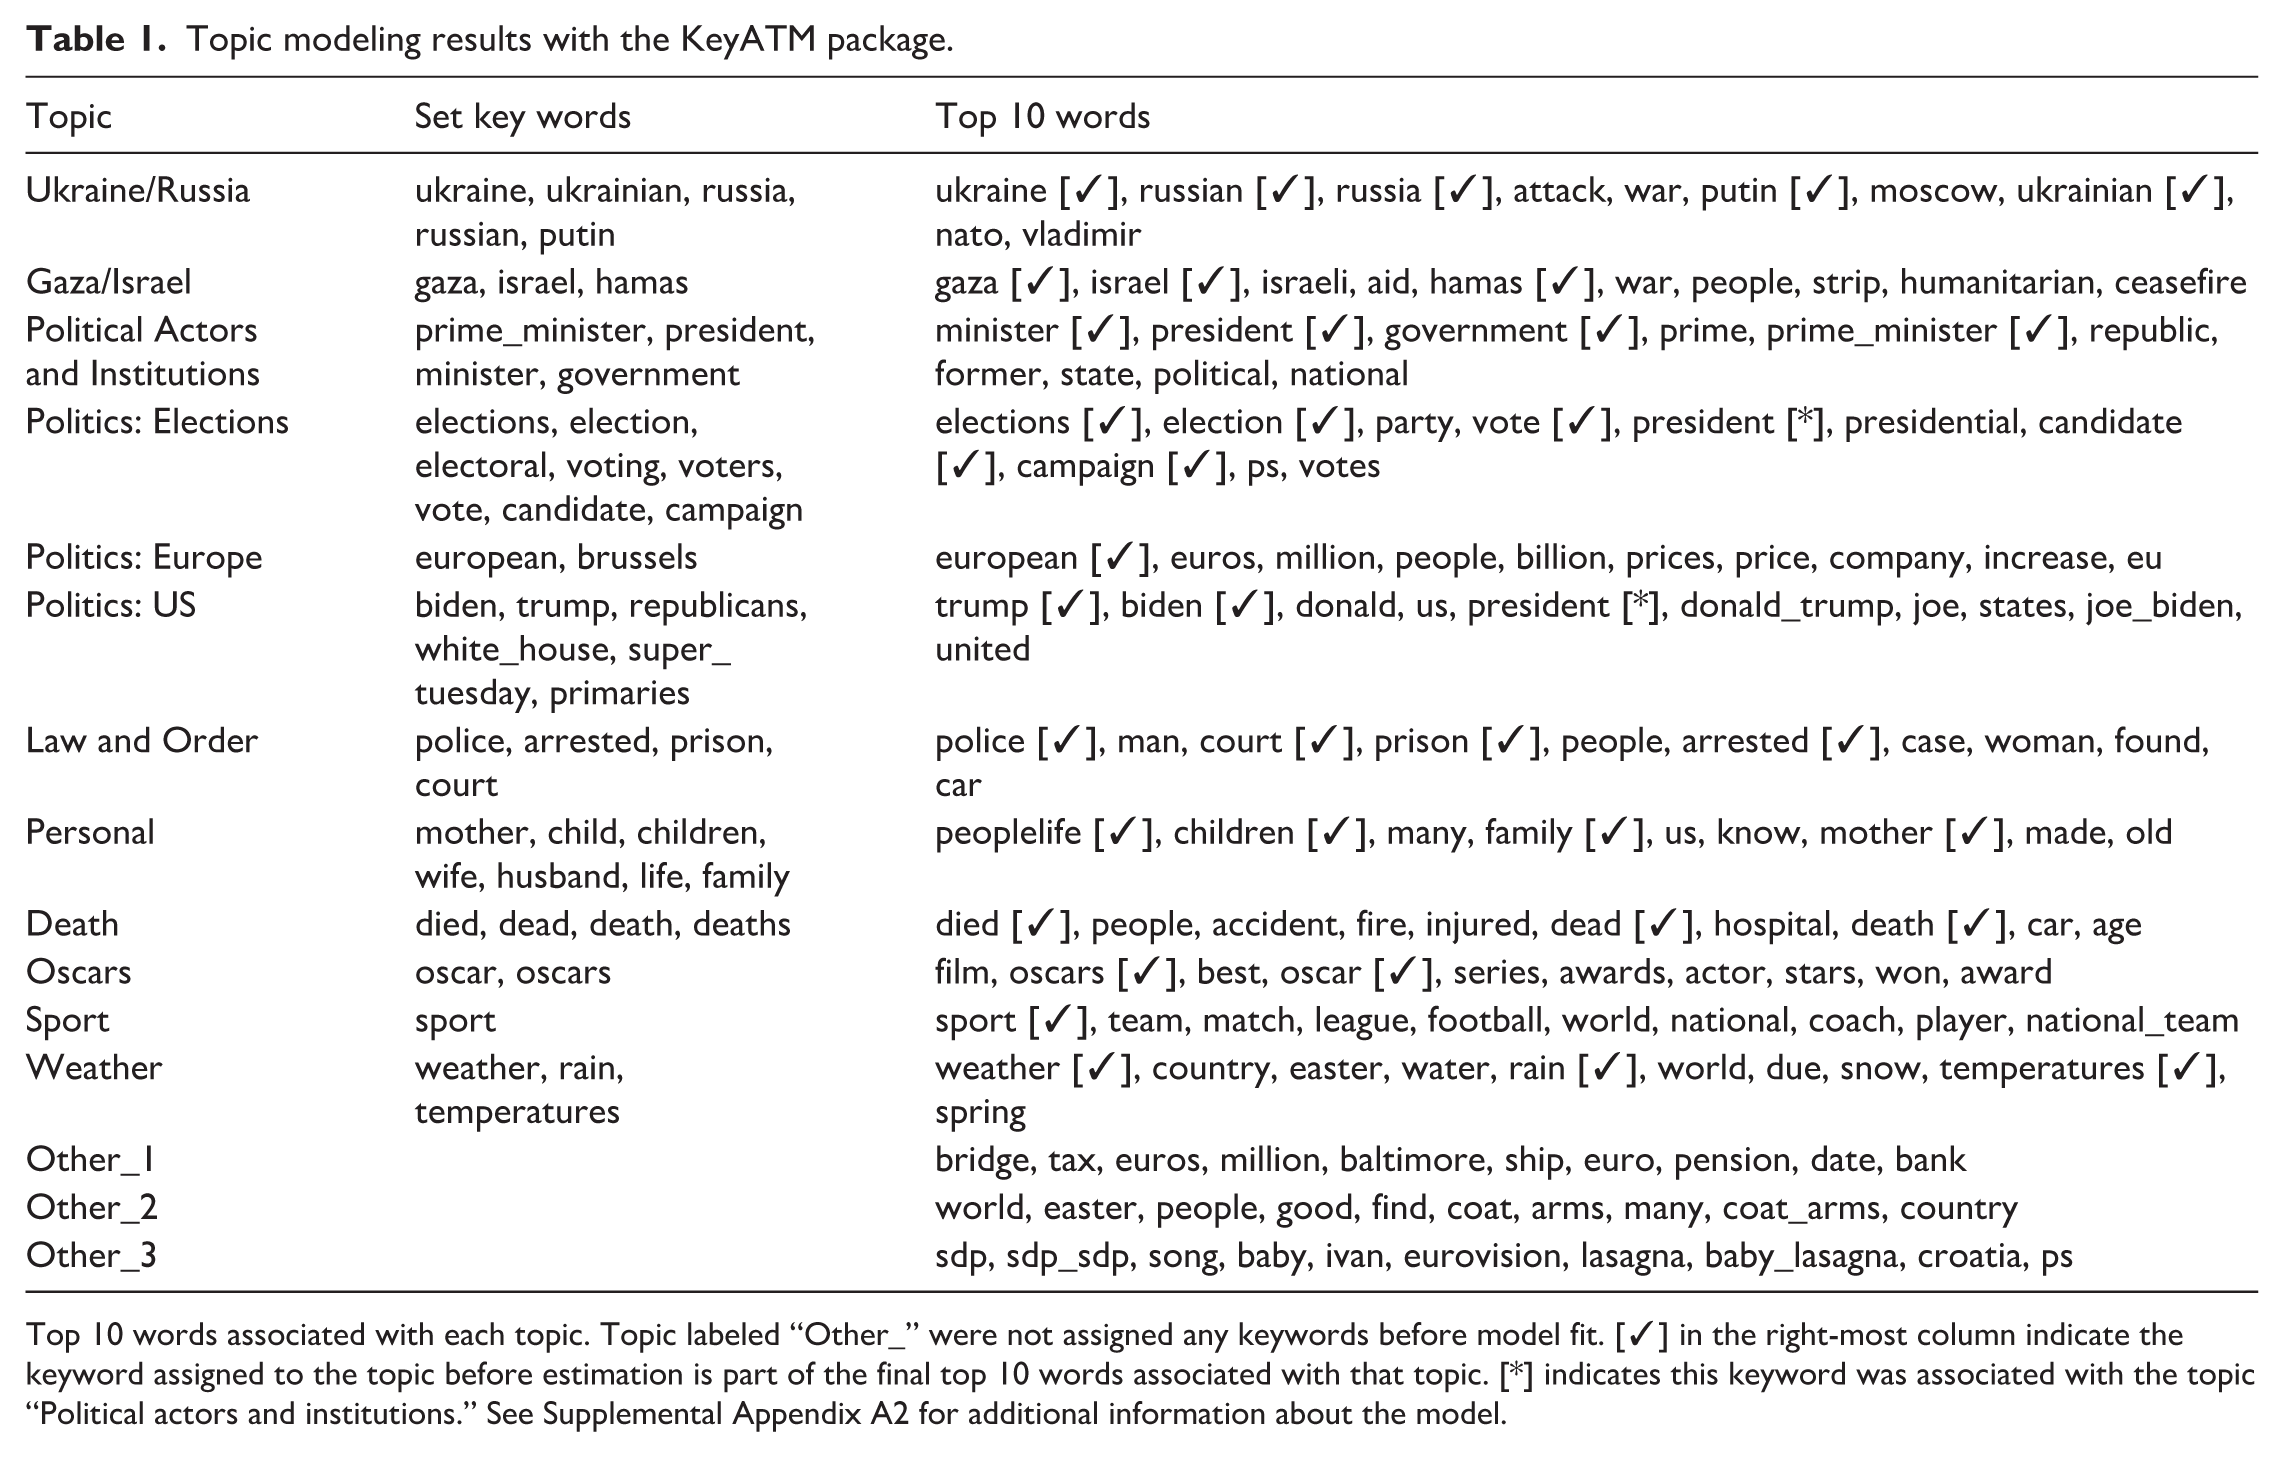
Top 10 words associated with each topic. Topic labeled “Other_” were not assigned any keywords before model fit. [✓] in the right-most column indicate the keyword assigned to the topic before estimation is part of the final top 10 words associated with that topic. [*] indicates this keyword was associated with the topic “Political actors and institutions.” See Supplemental Appendix A2 for additional information about the model.
Coverage volume operationalization
A key quantity of interest is the “topic-document” distribution (i.e. “the proportions of topics for each document, reflecting the main themes” in each text, Eshima et al., 2024: 734). We operationalize the volume of war coverage through the estimated proportions of the “Ukraine/Russia,” and “Gaza/Israel,” topics. To better gauge their importance among all political coverage, we collapse all politically themed topic proportions (the two wars, actors and institutions, elections, EU and US politics) into a “Total Political Coverage,” variable. Moreover, to compare war reporting to other political coverage, we also create a “Non-War Political Coverage,” variable, reflecting the combined political topics proportions without the two war topics. In Supplemental Appendix A2, we provide comprehensive evidence validating the content of “Ukraine/Russia,” “Gaza/Israel,” and “Non-War Political Coverage” using an alternative machine-based classification and human evaluation.
Visual content extraction and validation
We used ammico AMMICO’s Summary Detector to extract visual data. The tool relies on computer vision models using the language-vision LAVIS library (Li et al., 2023), and specifically BLIP models pretrained on the Visual-Questions-and-Answers library (VQAv2), containing 204,721 COCO images, 1,105,904 questions, and 11,059,040 ground truth answers (https://visualqa.org/). Using natural language questions, we extracted information about several objects in the post images. These are presented in Table 2, together with the corresponding F1-scores, taking as benchmark the human evaluation of the same objects. Additional metrics are presented in Supplemental Appendix Table A3.
AMMICO questions, human coder validation, and visual variables coding.
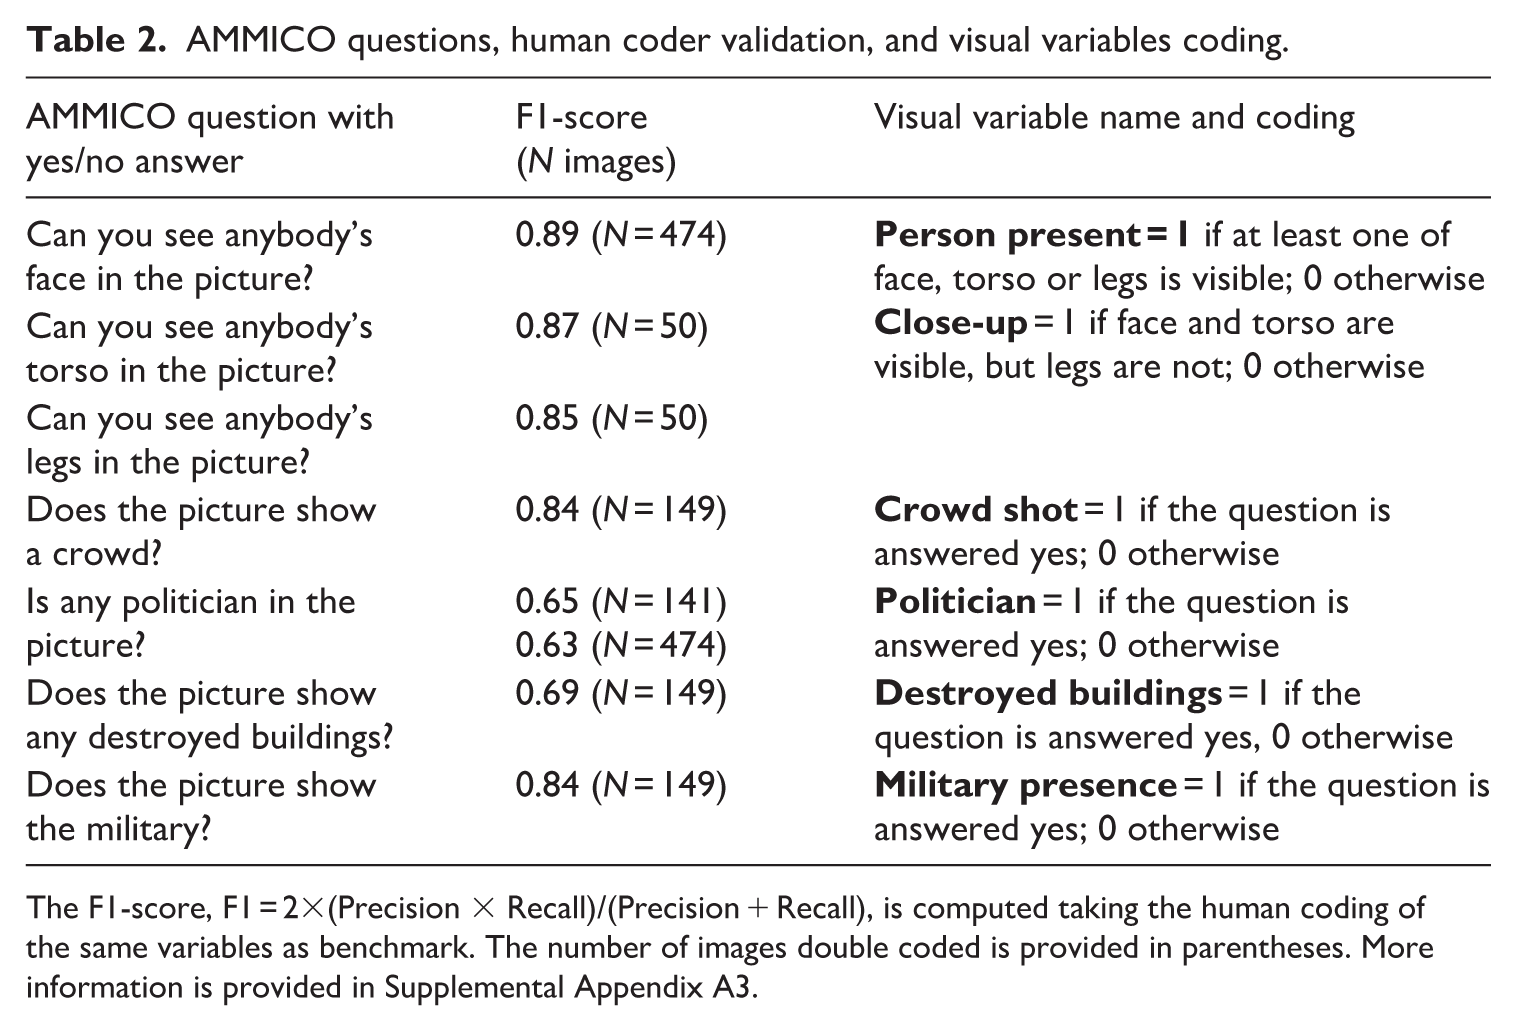
The F1-score, F1 = 2×(Precision × Recall)/(Precision + Recall), is computed taking the human coding of the same variables as benchmark. The number of images double coded is provided in parentheses. More information is provided in Supplemental Appendix A3.
Visual framing variables
The visual detection allows us to identify images containing human participants (through the variable Person Present, full sample M = 0.73, SD = 0.44, N = 94,184); as well as whether they depict a Politician (full sample M = 0.28, SD = 0.48, N = 94,184), a Crowd (M = 0.15, SD = 0.36, N = 94,184), and whether the individuals are shown through Close-up Shots (i.e. by showing their face and torso, but not their legs, M = 0.28, SD = 0.45, N = 94,184). To better understand how actors are depicted in relation to the two wars, we analyze images containing at least one person (N = 69,458). In this sample, we first examine the association of wars and politicians (M = 0.36, SD = 0.48, N = 69,458). Then, among the sample containing human portrayals, but no politicians, we examine the association between Close-up Shot (M = 0.28, SD = 0.45, N = 44,284) and Crowd Shot (M = 0.40, SD = 0.40, N = 44,284) with wars.
We operationalize the more technical shots (Fahmy, 2010) through images of Destroyed buildings (M = 0.04, SD = 0.21, N = 94,184) and Military Presence (M = 0.05, SD = 0.22, N = 94,184).
Results
The comparative war coverage volume (H1, RQ2)
We begin by examining the proportion taken by the two wars in each country from the Total Political Coverage, displayed in Figure 2, both as individual means (Model 1) and as the ratio of the Ukraine/Russia to the Gaza/Israel topic proportions (Model 2). Additional topic proportions are presented in Supplemental Appendix A4. In both models, the countries are listed based on their media systems classification by Humprecht et al. (2022).
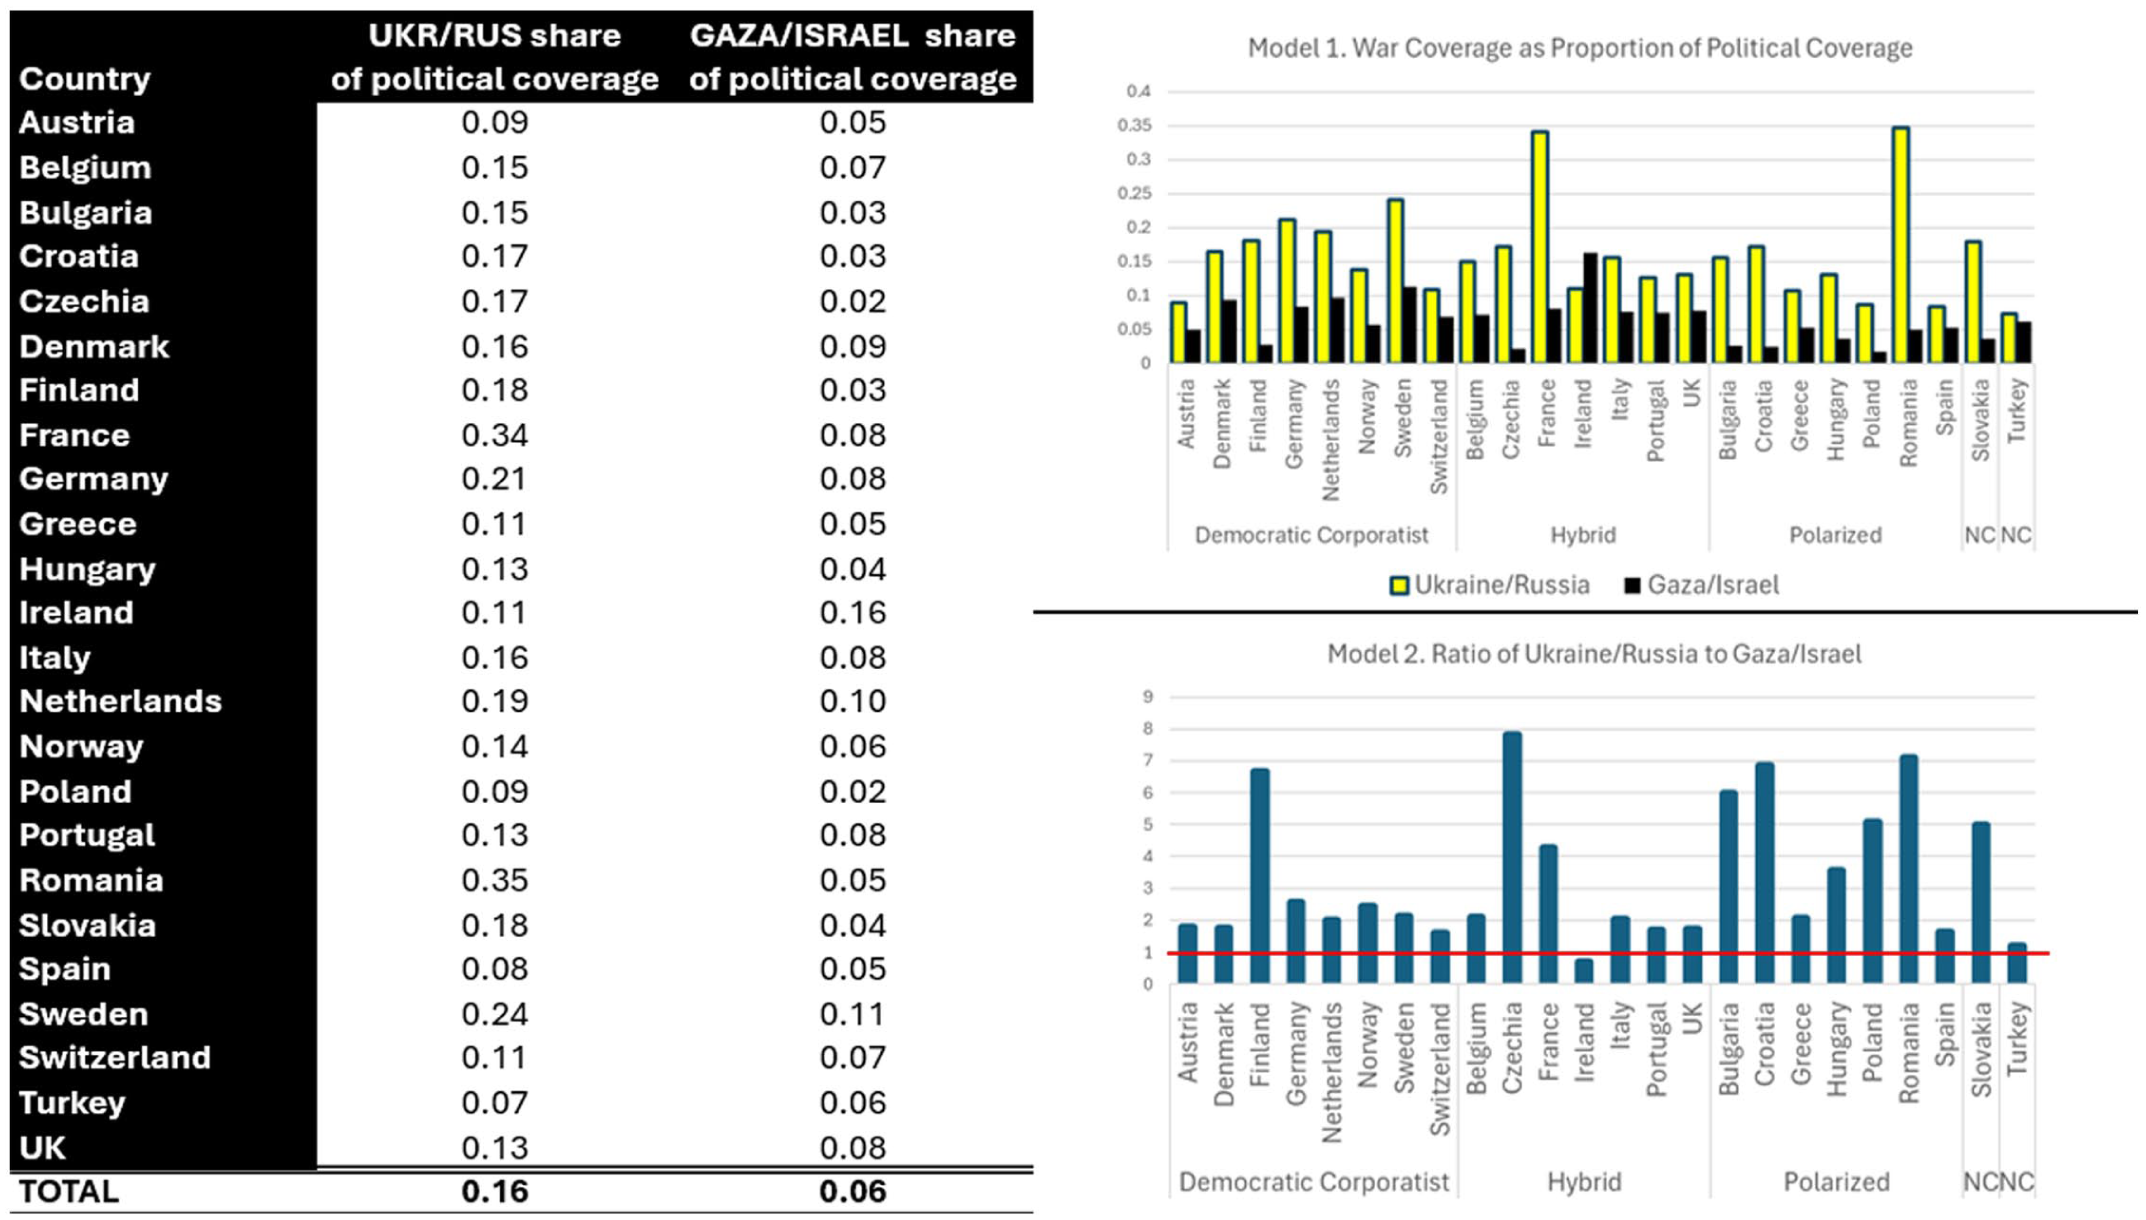
War coverage as a proportion of the total political coverage.
Overall, war coverage takes up an average of 22% of the Total Political Coverage in the period of focus, suggesting that despite the wars producing victims every day, their media reporting on Facebook was limited. As Models 1 and 2 in the figure indicate, however, there is variation both among countries and between the two wars. Looking first at the percentage of coverage of Ukraine, we find limited support for H1a, as a country’s neighbor status does not necessarily equate higher interest: Ukraine occupies between a third and a fifth of the political coverage in Romania, France, Sweden and Germany, while in Poland, this is only 9%; Slovakia and Czechia have similar levels to Denmark and the Netherlands. At the same time, with one exception (Ireland), countries consistently give more coverage to the geographically proximate, domestically more salient war in Ukraine than in Gaza (which, overall, ranges between 2% and 16%), thereby supporting H1b. Model 2, which looks at the country-level ratio of Ukraine to Gaza coverage provides evidence supporting both H1b and H1c: In line with H1b, most countries cover the two wars with a ratio of approximately 2:1. However, for countries close to the Ukrainian war theater—Romania, Poland, Czechia, Slovakia, Bulgaria, Croatia, Hungary, and Finland—this ratio increases to at least 5:1. Finally, when it comes to media systems (RQ2), non-frontline countries belonging to the Democratic Corporatist group (e.g. Denmark, the Netherlands, Sweden) do not exhibit a different pattern of cross-conflict attention compared to those in other media systems groups; their ratios are similar to countries such as Spain and Greece in the Polarized camp.
In short, while war coverage is generally limited on the media Facebook walls, the coverage volume exhibits both a general bias favoring the coverage of Ukraine and one that is accentuated by proximity to the war zone.
The comparative visual framing of war (RQ1)
We turn next to how wars are portrayed, in comparison with non-war political coverage and each other, both within and across countries.
Analysis strategy
To evaluate these differences, we run five logistic regression models in each country, with the visual depiction as the dependent variable, and the text topics as independent variables. Based on these models, we estimate predicted probabilities of each visual element being associated with stories containing either 90% non-war political coverage, or 90% “Ukraine/Russia” coverage or 90% “Gaza/Israel” coverage, and test for the significance of the difference between these predictions to evaluate both how the wars are visually portrayed with respect to non-war coverage, and how the two wars are represented with respect to each other. To examine how human actors are being portrayed, we first examine the likelihood of them being politicians, conditional on the image depicting at least one person. Then, for non-politician actors, we examine the extent to which they are being shown in close-ups and in crowds. The remaining two variables (visuals of destroyed buildings and military presence) are evaluated across the full sample to test the association of war stories with technical frames.
These predicted probabilities are graphed in Figures 3–7. 7 To maintain consistency with Figure 2, we keep the same country order. Moreover, we use the same color code in all Figures to indicate significant differences at the p = .05 level (two-tailed): red if a visual depiction is more likely to be associated with war coverage (than with non-war coverage) and blue if it is less likely to be so. In maps reporting cross-European between-wars comparisons, we color countries in red if the likelihood of a visual element is significantly higher for Ukraine/Russia and blue when it is significantly lower (thus, higher for Gaza/Israel). We use gray for all non-significant differences, as well as for predicted probabilities for non-war coverage, which we display as a reference point.
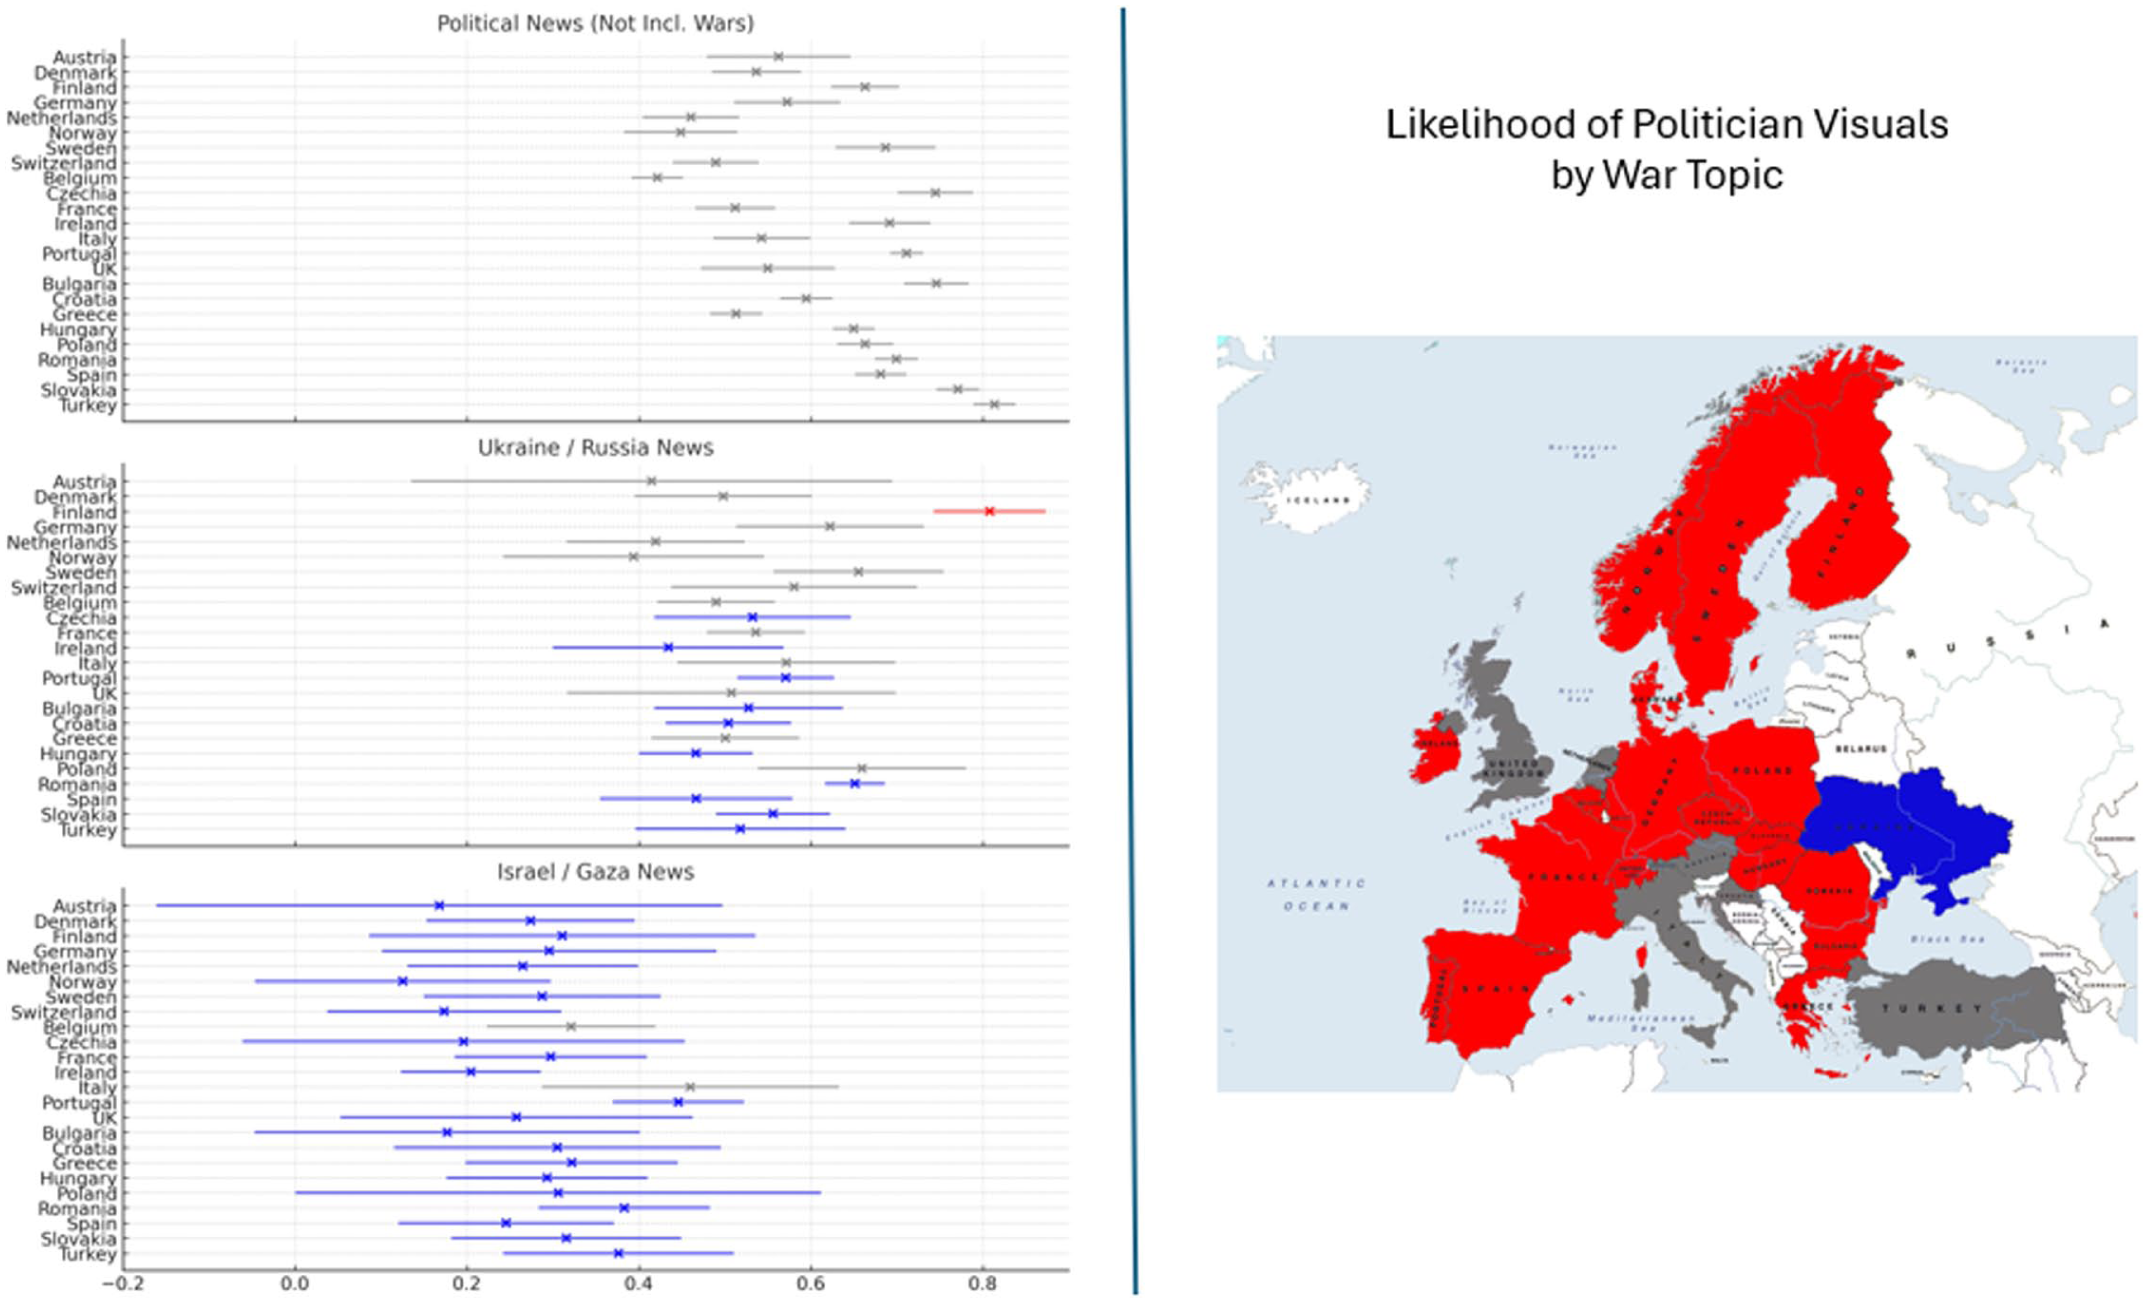
Predicted probabilities of politician visuals by war topic, compared to non-war political news (left), and between wars (right).
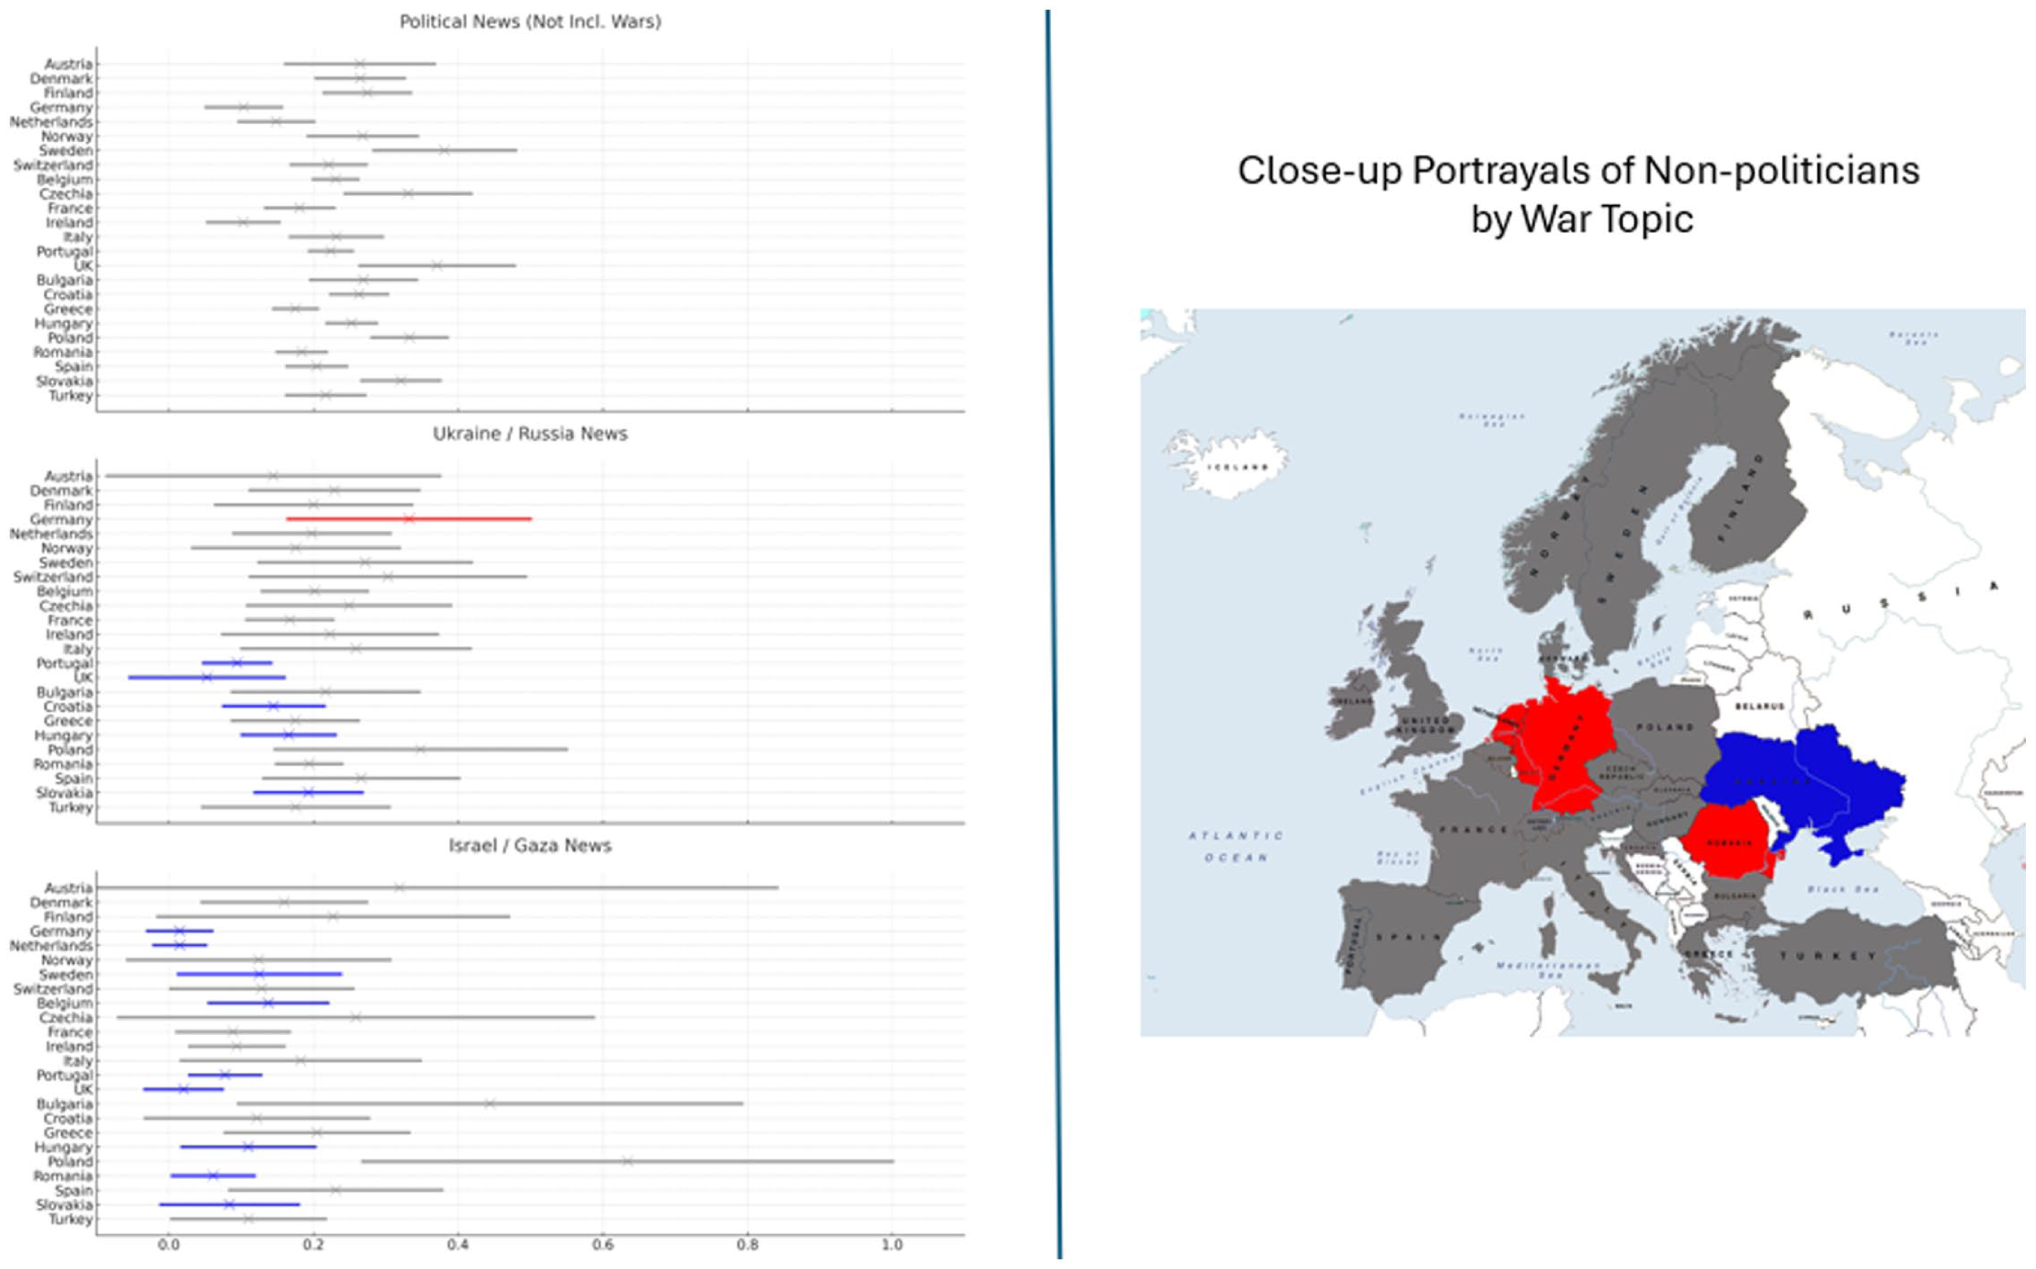
Predicted probabilities of close-up portrayals of non-politicians by war topic, compared to non-war political news (left), and between wars (right).
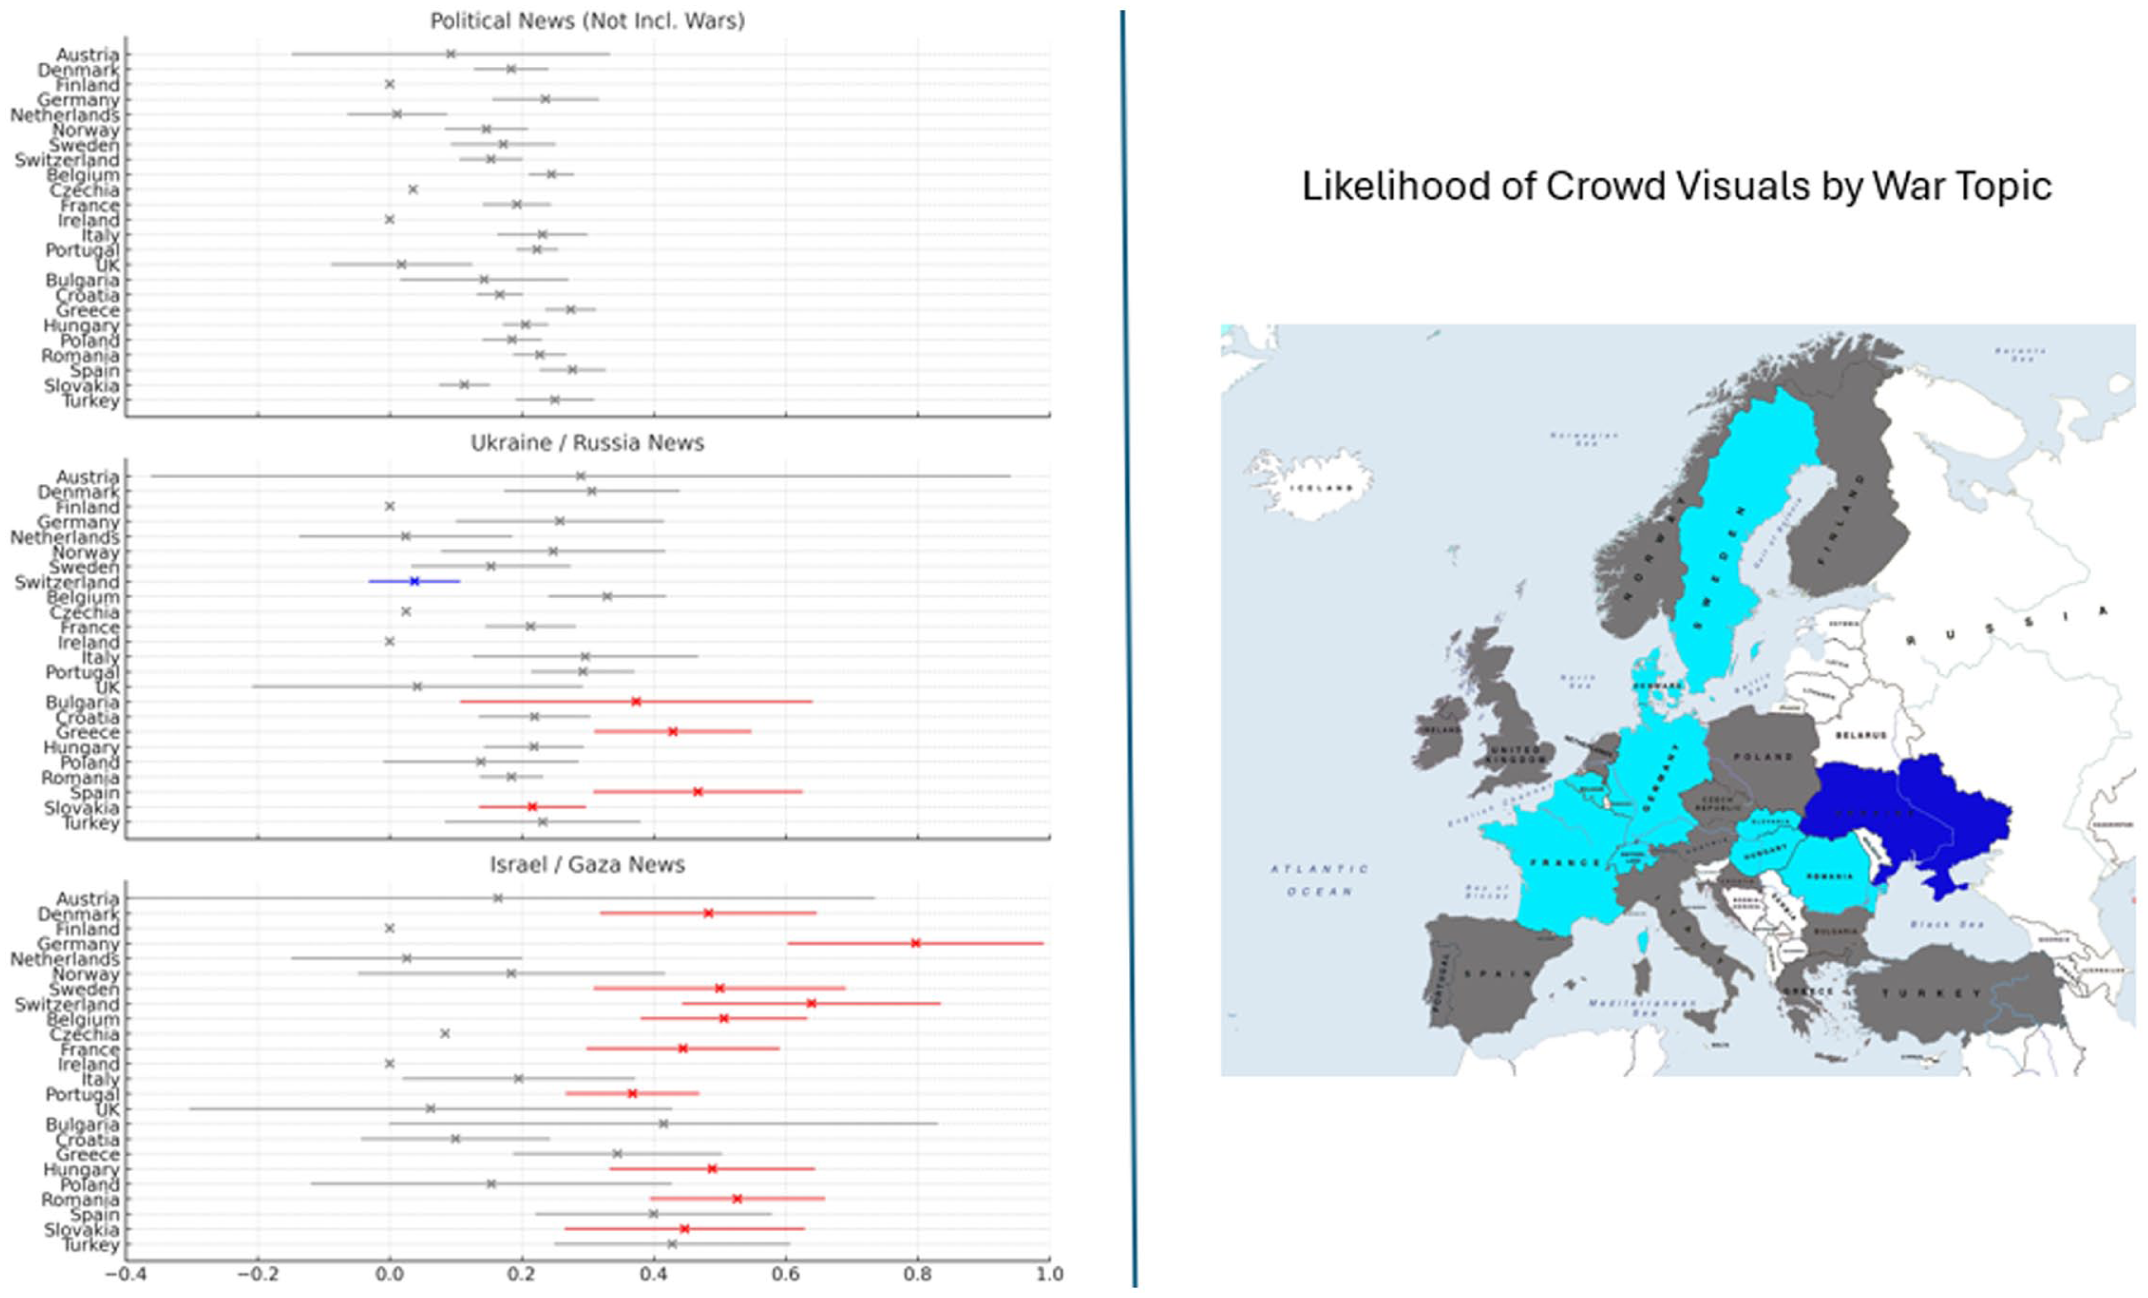
Predicted probabilities of crowd visuals by war topic, compared to non-war political news (left), and between wars (right).
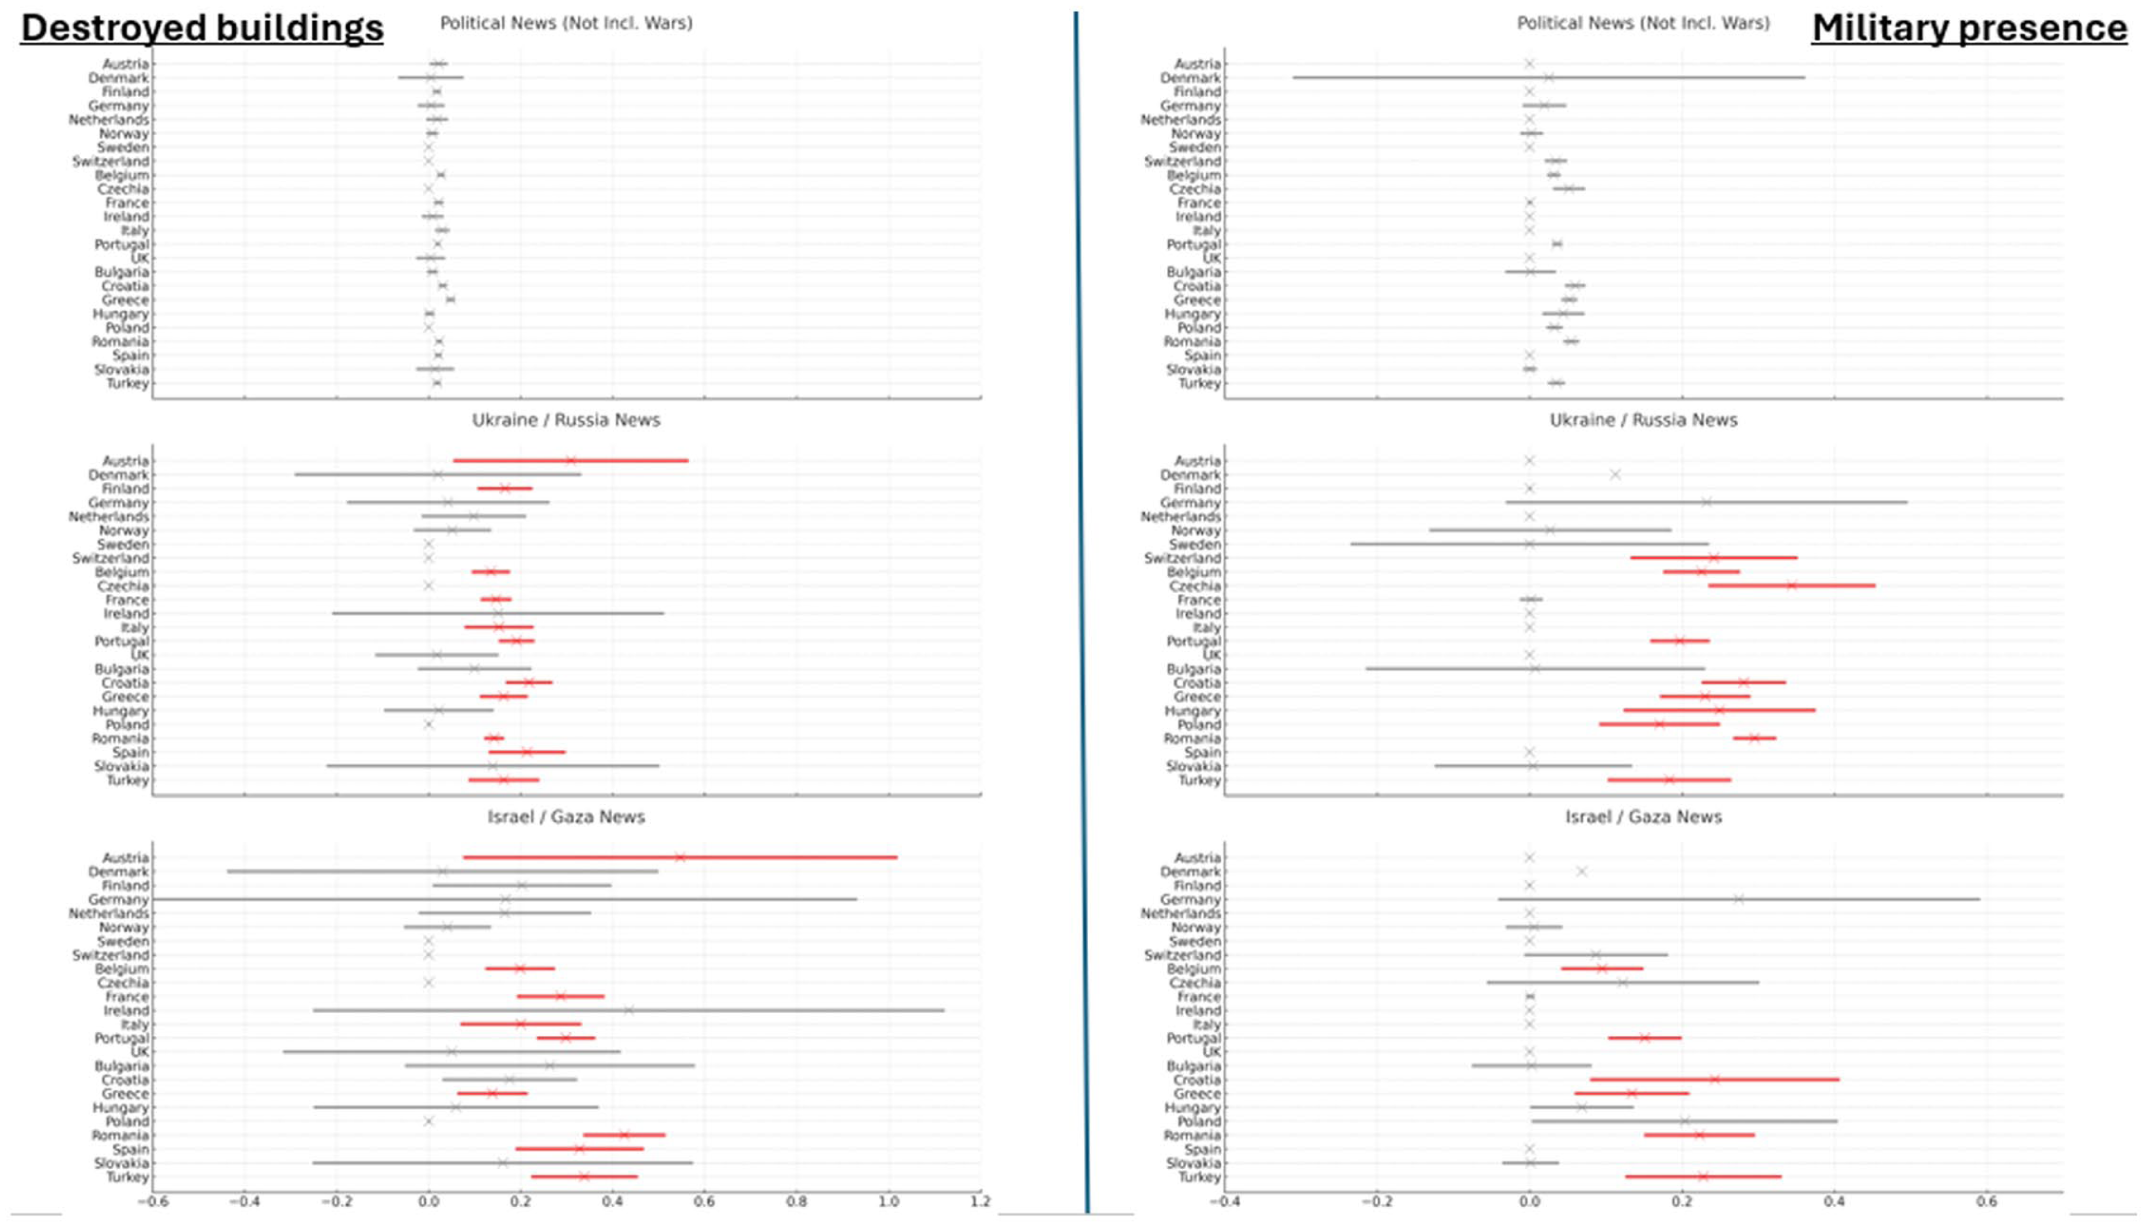
Predicted probabilities of destroyed buildings (left) and military presence (right) by war topic, compared to non-war political news.
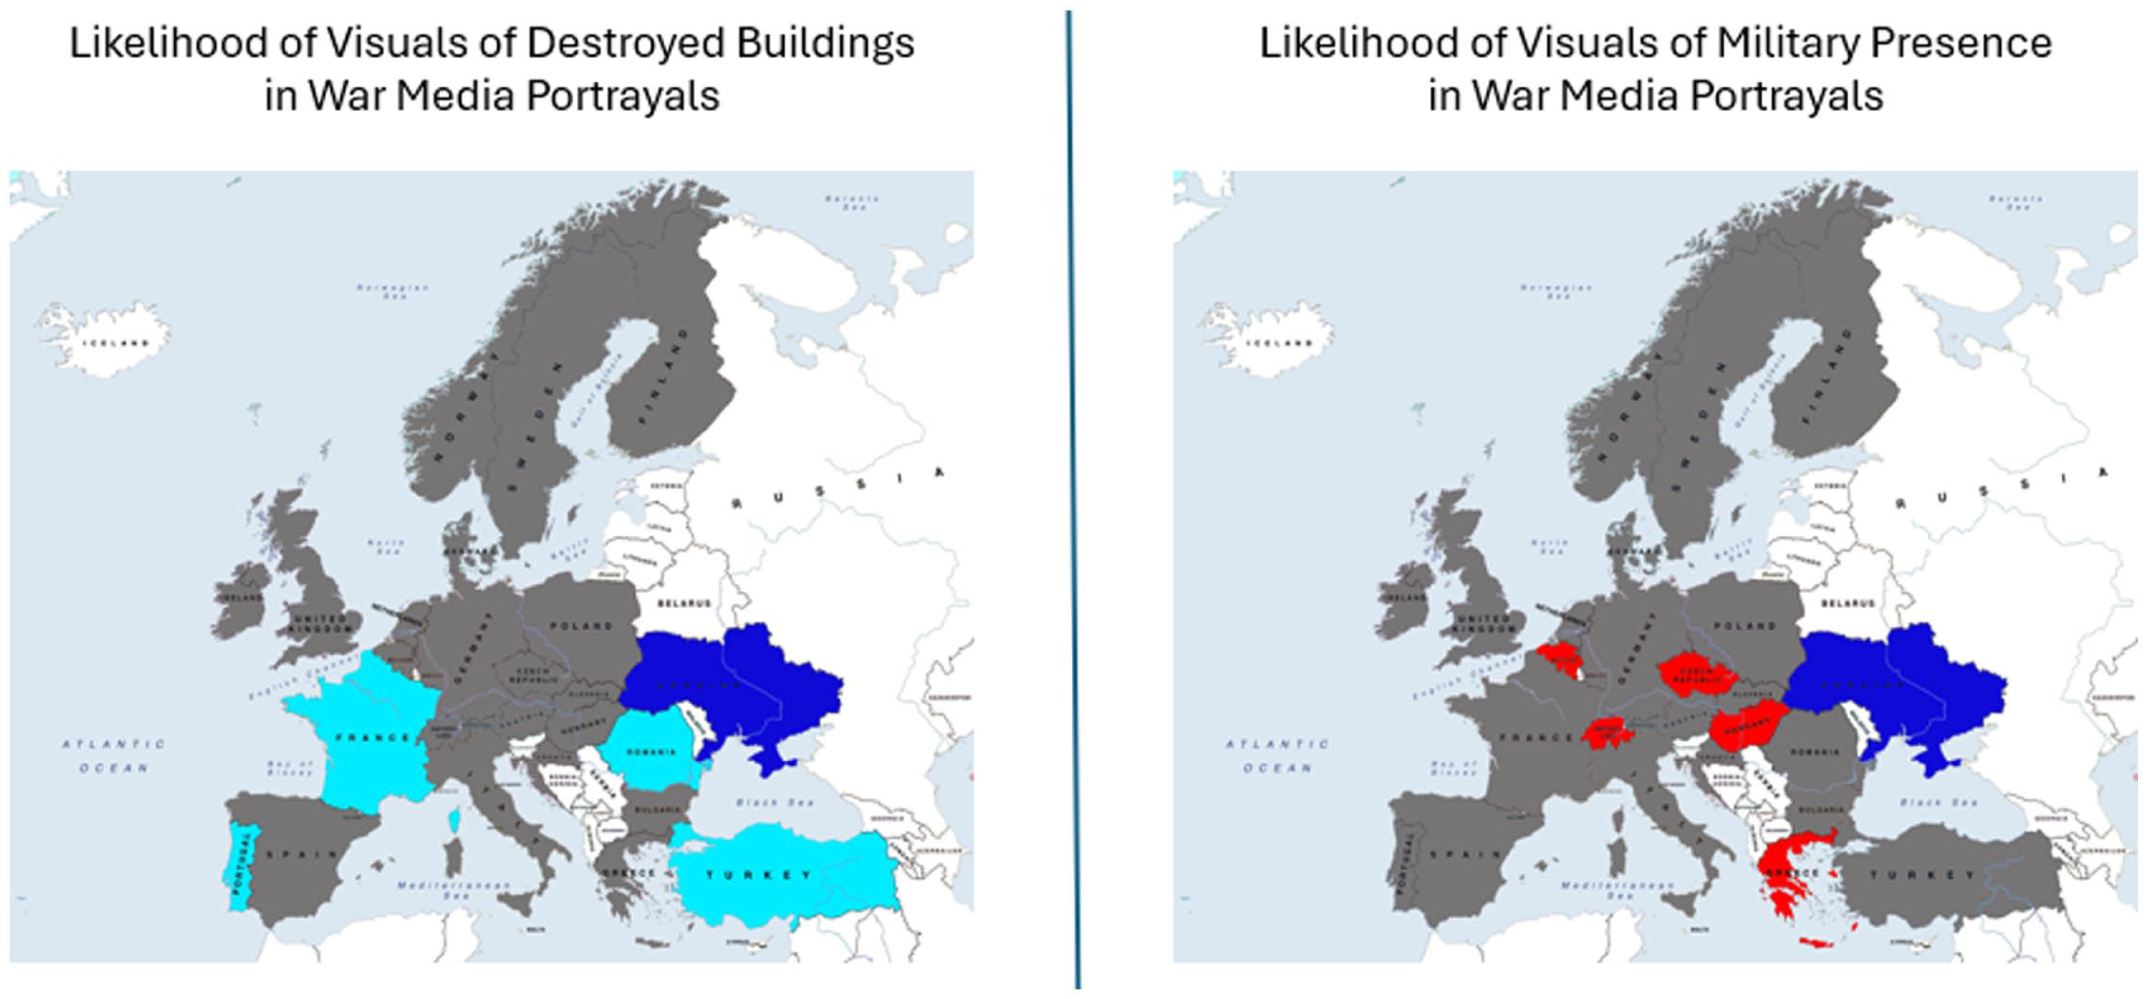
Cross-war differences in predicted probabilities of destroyed buildings (left) and military presence (right) by war topic.
The three panels on the left side of Figure 3 depict the estimated likelihood of politicians featuring in visuals associated with the three topics. As we can see, in most countries politicians are more likely than non-politician actors to appear in non-war political coverage, and this statement holds true for Ukraine/Russia news too, although the likelihood decreases significantly in 10 countries. In one country, Finland, politicians are featured in Ukraine/Russia news even more than they are in non-war stories, while for 13 countries, there is no difference. For the Gaza/Israel topic, the decrease in the association of news with politicians is significantly more widespread—in 22 of the 24 examined; and most of these probabilities drop below 0.5. Moreover, most confidence intervals for the predictions overlap between countries—with few differences emerging either as a function of proximity/domestic relevance or media systems. Thus, uniformity among countries appears to be the rule, with Finland being the exception. The map on the right of Figure 3 gives an overview of the countries where politicians play a significantly different role in the visualization of the two wars. We see that across Europe (except for Austria, Croatia, Italy, the Netherlands, Turkey, and the United Kingdom) the war in Ukraine is significantly more likely to be associated with politicians than the war in Gaza, or put differently, non-politician actors are more present in Gaza/Israel news than in Ukraine/Russia stories.
Figures 4 and 5 further explore how non-politician actors are portrayed with respect to the three types of news. Figure 4 displays the likelihood of these actors being portrayed using close-up shots, while Figure 5 examines the probability of them being associated with crowds. Along with predicted probabilities, we also map the countries with significantly different portrayals when directly comparing the two wars. As Figure 4 shows, non-politician actors are generally less likely to be depicted using close-up shots, no matter the topic, and the likelihood of them being depicted in this manner is similar across Europe, although for war it significantly decreases in several countries. The number of countries with such a marking decrease are fewer for Ukraine (five) compared to Gaza (nine). Overall, however, as the map to the right of Figure 6 shows, only in Germany, the Netherlands, and Romania are Ukrainian non-political actors more likely to be depicted through close-up shots than similar actors in Gaza.
Figure 5 shows that crowd visuals are rare for non-war political topics, and to a similar extent also in the coverage of the war in Ukraine. Only in three countries we observe a marking increase for the war in Ukraine compared with non-war stories, and in Switzerland, there is a small but significant decrease in the association of this visual with the topic of Ukraine/Russia. The coverage of Gaza, on the other hand, looks different: crowd shots are significantly more used in association with the Gaza/Israel topic than with non-war stories in 10 of the 24 countries. Moreover, the war in Gaza is more likely than the war in Ukraine to be pictured through crowds in nine countries: Belgium, Denmark, France, Germany, Hungary, Romania, Slovakia, Sweden, and Switzerland.
Figures 6 and 7 show the incidence of “technical” shots—images of destroyed buildings and the military. Overall, these visuals are rare in the sample during the period. Figure 6 shows the different predicted probabilities by country and topic, while Figure 7 indicates which countries provide a significantly different visualization of the two conflicts for each indicator.
As Figure 6 illustrates, compared to non-war political coverage, most countries do not display differences in the association between these different indicators and war stories; however, across Europe, the incidence of these images increases in more countries for Ukraine than for Gaza. Thus, we observe that, compared to non-war stories, images of destroyed buildings are more frequently associated with the Ukraine war in eleven countries, and images of the military are more frequent in ten. Looking at the Gaza coverage, compared to non-war news, such images are more frequently featured only in nine and six countries (for destroyed buildings and the military presence, respectively). When it comes to the cross-war comparison, depicted in Figure 7, these differences reach significance only in a few countries: Belgium, Czechia, Hungary, Greece, and Switzerland for military portrayals (more for Ukraine); and France, Portugal, Romania, and Turkey for destruction visuals (less for Ukraine).
Discussion and study limitations
Against the backdrop of markedly different elite attitudes with respect to Ukraine and Gaza (Oleart and Roch, 2025), our analysis of the coverage volume and war visual framing in the Facebook posts of 51 media sources in 24 European countries yields nuanced insights into the mediated image of these ongoing salient wars on the media Facebook walls.
First, we find support for H1b and H1c—the coverage salience is higher for the war in Ukraine than for Gaza, and this is especially so for countries close to the frontline. Second, in response to our RQ1 (a), compared to non-war news, both conflicts are less portrayed through politicians, but this visual approach is particularly marked in Gaza. Moreover, when it comes to non-politician actors, for both wars, individual close-up portrayals are rare; however, there is, in addition, a strong association of the war in Gaza with crowds. Finally, when it comes to technical shots, we find that in a strong minority of countries, both wars are more likely to be associated with images of destroyed buildings and the military than non-war news. With respect to RQ1 (b), we find two patterns: comparatively speaking, Ukraine is more likely in most countries to be portrayed through politician visuals than Gaza, and Gaza is more likely in a strong plurality of countries to be portrayed though crowds. At the same time, except for these two patterns, the media portrayals are often similar both between the wars and compared to regular political news.
In view of the existing body of knowledge about war media coverage, several contributions should be noted. For one, technical shots—destruction and the military—are relatively rare in this period, suggesting that the visual focus lies elsewhere. This is different from the results reported in Fahmy (2010), where technical frames dominate. However, beyond the different media sources we analyze with respect to this previous study, another factor at play might be timing. Unlike in previous research, by the time of this investigation, both wars had been going on for either 2 years (Ukraine) or 6 months (Gaza). Thus, these results open the possibility that the use of such technical frames might decrease with the duration of the conflict, or at least, in the absence of any major battleground breakthrough.
Second, the bias in the comparative media war salience in favor of Ukraine, and especially among its neighbors is consistent with previous research that found proximity and domestic salience increase media war coverage (e.g. Fengler et al., 2020; Jungblut, 2022). In this study, we also considered countries’ media environment and commitment for journalistic high-quality reporting as another dimension influencing the coverage balance (RQ2) but found no evidence of such pattern. In practice, this means that media across Europe are reflecting the same difference in attention as expressed by elites, making it more difficult for the public to consider the realities of these wars on equal footing. Among the factors influencing these choices, one may be the scarcity of verifiable news from Gaza; but this pattern may also be driven by elites themselves, which the media must cover. This opens, therefore, future areas of analysis related to how journalists decide to prioritize war topics that pose similar humanitarian concerns, when elites approach these topics differently.
Third, while the two wars are comparatively portrayed through different visual frames (politicians for Ukraine and crowds for Gaza), these framing approaches share an important similarity: in both cases, they keep the non-politician human actors at a distance from the European viewer. As noted already, non-politicians are rarely portrayed through close-up shots, no matter the topic, therefore, in line with previous visual research (e.g. Kress, Van, and Leeuwen, 2020), cementing the gap between them and those scrolling through their Facebook feed away from the battleground. In Gaza, non-politician portrayals, while more frequent than in Ukraine, are often visualized through crowds. Given previous research on crowd portrayals and identified victims (Azevedo et al., 2021; Kogut and Ritov, 2005), such visuals are expected to limit the personal connection viewers can feel to those affected. In short, while using different visual devices, wars are portrayed the same way when it comes to those suffering on the ground: it obscures their personal identity.
Our analysis has limitations. First, Facebook, despite its importance as a news platform, is only one of the social media channels media organizations use; moreover, even if social media is on the rise as source of information, other platforms (e.g. websites, apps, print, and television) remain highly important. Second, reliance on AI risks oversimplifying complex imagery, with significant ethical implications. While AI is getting increasingly better at detecting key objects, errors remain, and visual meaning-making goes beyond simple presence. Thus, the interpretation of images that contain politicians, close-ups, crowds, destroyed buildings, or military presence as illustrating deeper frames may be overly simplistic. Future research should explore other platforms and integrate qualitative audience reception studies to enrich findings and deepen interpretations. Finally, much of the variation may be due to either country-specific variables or to the sources media organizations use. Future studies should explore editorial choices more, using qualitative approaches for a more in-depth understanding of these choices.
These limitations, notwithstanding, the study showcases the contribution that large-scale, AI-informed comparative content analyses can bring to our understanding of media coverage of war, while opening new avenues of exploration.
Supplemental Material
sj-docx-1-nms-10.1177_14614448251413689 – Supplemental material for How does war look like on the European mainstream media Facebook? A large-N comparison of the media Facebook posts covering Ukraine and Gaza in 24 European countries in spring 2024
Supplemental material, sj-docx-1-nms-10.1177_14614448251413689 for How does war look like on the European mainstream media Facebook? A large-N comparison of the media Facebook posts covering Ukraine and Gaza in 24 European countries in spring 2024 by Delia Dumitrescu in New Media & Society
Footnotes
Author’s note
The author would like to thank the four anonymous reviewers for their constructive comments as well as participants at the 10th annual conference of the International Journal of Press/Politics in October 2024 for their very useful feedback on an earlier version of this project. She is also very grateful to the team at the Scientific Software Center at Heidelberg University responsible for the development of AMMICO (AI-based Media and Misinformation Content Analysis Tool), especially to Inga S. Ulusoy, who led the software development, as well as to Petr Andriushchenko and Dmitrii Kapitan for their key contributions to the tool.
Funding
The authors disclosed receipt of the following financial support for the research, authorship, and/or publication of this article: The author acknowledges support by the state of Baden-Württemberg through bwHPC and the German Research Foundation (DFG) through grant INST 35/1597-1 FUGG, as well as access to the data storage service SDS@hd supported by the Ministry of Science, Research and the Arts Baden-Württemberg (MWK) and the German Research Foundation (DFG) through grant INST 35/1503-1 FUGG, and support by the state of Baden-Württemberg through bwVisu. The author also gratefully acknowledges the support of the Scientific Software Center at Heidelberg University, through the “open call project” initiative in 2022 and 2025, which made possible the development of AMMICO, the open-source content analysis tool used in this research project.
Supplemental material
Supplemental material for this article is available online.