
Abstract
Do people process information differently on mobile phones compared to computers? We investigate this question by conducting two online field experiments. We randomly assigned participants to use their mobile phones or personal computers (PCs) to process different kinds of information. Study 1 (N = 116) discovered that participants using mobile phones process emails more efficiently (i.e., spend less time) than those using PCs. Study 2 (N = 241) extended this to online deceptive content and found that individuals using mobile phones, especially habitual users, are more efficient, but engage in less information processing, are less attentive and less vigilant about misinformation, compared to those using PCs. However, the latter are more likely to succumb to phishing emails by clicking on malicious links. We discuss theoretical implications for information processing across media devices and practical implications for combating misinformation and cybersecurity attacks.
Keywords
Mobile phones have enabled new ways for users to access all types of information, from communication and entertainment to work-related content. Data show that mobile phones have surpassed desktops/laptops in web traffic (Oberlo, 2022). Many key differences exist between mobile phones and personal computers (PCs), such as screen size, typing mode, portability, and context of use. The question is: Do these differences have psychological consequences? In particular, do they alter the nature of information processing? Given the ubiquity of mobile phone use, what with the constant updates and infinite scrolling, a case could be made for information being processed less effortfully in this medium.
Anecdotal and empirical evidence is quite mixed. On the one hand, it is not uncommon for people to skim content on their phones, thus failing to notice details of the information when it is viewed on a mobile phone (e.g. forgetting to hit Reply All when answering emails). On the other hand, we also observe people being very absorbed in their mobile phones to the point of ignoring all distractions in their surroundings. Literature on this possibility is also equivocal (e.g., Dunaway et al., 2018; Kim and Sundar, 2014; Oulasvirta et al., 2005).
To resolve this issue, we conducted two online between-subjects field experiments and compared information processing across mobile phones and PCs. In Study 1, we randomly assigned participants to view emails from credible sources, spam emails, and tricky pictures using either their mobile phones or PCs. We recorded users’ attention, time spent processing the information, recognition memory, and recall memory. Based on results from Study 1, we designed Study 2 by focusing on online deception contexts (i.e., phishing emails and misinformation). In addition to users’ self-reported information processing, we also measured their actual clicking behaviors. The findings of these two studies contribute to our understanding of how device type affects users’ information processing and susceptibility to online deception.
Literature review
Mobile phone versus PCs: a comparison
Mobile phones and PCs differ from each other in screen size and the way in which they afford user control. In general, PCs are larger than mobile phones. According to Kim and Sundar (2014), larger screens (compared to smaller screens) can enhance perceived affective quality by triggering the “bigger is better” heuristic. In other words, content becomes more visually appealing on larger screens. At the same time, increased screen size also enhances perceived control of the device, thus facilitating better information processing. As Molyneux (2018) noted, larger screen is positively related to ease of reading, clarity, and organization of information.
Due to larger screen sizes, the operation of PCs is often accompanied by mouse clicking and keyboard typing. By contrast, the smaller screen of mobile phones lends itself to touch control, which makes mobile phones a “personal technology” that has “intimate emotional experiences known only to the users” (Vincent, 2013: 60). Researchers have found that the bodily proximity with one’s mobile devices has affected the content people post online. For example, Naaman et al. (2010) found that 41% of the mobile tweets were messages related to one’s emotional or physical status updates. Similarly, Murthy et al. (2015) pointed out that mobile tweets had more egocentric representation of self, as it contains more use of “I,” “me,” and “myself” compared to web-based tweets.
As a device that is tethered to users physically and emotionally (Campbell et al., 2020), the mobile phone is situated in everyday life contexts (Grüter et al., 2014) and is often used during idle times, such as waiting in line or taking public transport. Therefore, mobile phone users may be less attentive compared to PC users. Oulasvirta et al. (2005) pointed out that mobile users can only keep their attention focused on mobile devices for 4–8 seconds. In addition, mobile phones could be used concurrently with other activities, which increases the level of environmental distraction, constantly shifting users’ attention between the phone and other background activities (Park et al., 2019).
Aside from the environment, distraction may also come from the phone itself. Ward et al. (2017) found that even the presence of a mobile phone reduces people’s cognitive resources. Furthermore, the availability of multiple apps and the disruptive feature of notifications create unplanned and extended use of mobile phones. Using actual mobile use data, Oulasvirta et al. (2012) found that once users open one app, they are likely to use the others, thus extending their overall time spent on mobile phones. However, such distraction may be less likely to happen on PCs because the larger real estate of the screen makes the notifications less distracting and the access to multiple apps less salient.
Yet another factor could be the nature of the apps that users typically engage with when using different devices. Large-scale surveys have shown that personal computers are generally favored by users for carrying out more significant, complex, and longer tasks related to work and productivity. In contrast, mobile phones are typically favored for smaller, spur-of-the-moment activities, such as browsing and communicating on social media apps (e.g. Broadband Research, 2023).
In sum, a variety of factors, ranging from the physical form factor of the devices to the culture surrounding the contexts and contents pertaining to their usage, seem to contribute to differences in the manner in which individuals process information from mobile phones versus PCs.
Mobile phone versus PC in information processing
As individuals increasingly use mobile phones to receive and send information, it is important to examine whether and how the use of mobile phone shapes the way individuals process information, which is critical for ensuring correct inferences and related judgments (Eagly and Chaiken, 1993). According to dual process models in social cognition, individuals usually process information through two qualitatively different routes that differ in the depth of processing. One classic dual process model is the Heuristic-Systematic Model (HSM; Chaiken, 1980), which proposes that individuals can process information in a systematic and/or heuristic manner. In the systematic mode, individuals exert extensive cognitive effort to scrutinize the given information. In the heuristic mode, they process information superficially and make judgments based on simple decision rules, called heuristics, by considering factors that may not be central to the given information. HSM also argues that humans tend to primarily employ heuristic processing in order to minimize cognitive effort when processing information (Todorov et al., 2002). In a similar vein, the Elaboration Likelihood Model (ELM) posits that individuals process messages (usually persuasive messages) through two different routes: the central route (wherein individuals carefully evaluate the content or argument of the message) and the peripheral route (wherein individuals rely on superficial cues rather than message arguments to make decisions and judgments; Petty and Cacioppo, 1986).
As discussed previously, mobile phones and PCs differ from each other on several dimensions that can play a role in information processing. While HSM, ELM and other dual process models focus on source and message attributes that can trigger heuristic versus systematic processing, the Modality-Agency-Interactivity-Navigability (MAIN) model (Sundar, 2008) posits that digital media affordances, such as modality, can trigger different mental shortcuts that may bias the nature of information processing. 1 For instance, Kim and Sundar (2016) discovered that accessing information on large (vs small) screens made users more likely to be “transported” into the mediated world and apply the “being there” heuristic when processing information on the screen. Likewise, there are several other mental shortcuts that may be triggered by affordances of contemporary media.
Considering that mobile phones usually have smaller screens compared to PCs, it is likely that users might spend more effort in more systematic processing on mobile phones than PCs. In addition, mobile phone users are known to be cognitively absorbed when texting (Hou et al., 2018). An eye-tracking study also shows that when processing online shopping information, consumers’ visual attention (operationalized as total fixation duration) was much longer when using mobile devices than desktops (Hwang and Lee, 2022). Based on this rationale, mobile phones may lead to a “spotlight” effect, such that their small screens attract users’ attention and engage users in more systematic processing of the presented information. Furthermore, other studies have suggested the possibility that larger screen devices can promote more heuristic information processing. For instance, a controlled lab experiment conducted by Kim and Sundar (2016) revealed that displaying the same advertisement on a larger screen smartphone resulted in more heuristic information processing compared to a smaller screen smartphone. Similarly, Alasmari (2020) found that larger screen size devices (specifically, 9.7-inch tablets) induce higher cognitive overload compared to smaller screen size devices (such as 4-inch smartphones), thereby hindering students’ comprehension and retention of class materials. These studies indicate that mobile phones, which typically have smaller screens than personal computers, could, in fact, lead to more systematic and effortful information processing among individuals.
However, this runs counter to conventional wisdom because mindful processing is seldom associated with mobile phone use. Quite the opposite, there is great concern over the negative effects of mobile phone use on users’ cognitive functioning (Wilmer et al., 2017) and how users tend to use mobile phones in an absent-minded manner (Marty-Dugas et al., 2018). In fact, researchers have found that even the mere presence of mobile phones impairs users’ performance on cognitive tasks, especially for those who fear they might miss out on important information (Niu et al., 2022). Empirical evidence also suggests that news readers spend less time and fixate less when reading news on mobile phones than laptop computers, indicating shallower attention (Dunaway et al., 2018). In a similar vein, on mobile phones (vs desktop computers), users visually attend to social media posts to a lesser extent (Keib et al., 2021) and show lower cognitive engagement to video news stories by demonstrating lower heart rate variability and weaker connection between content and skin conductance levels (Dunaway and Soroka, 2021). This is potentially attributed to the fact that people tend to use their mobile phones in very brief sessions and with frequent disruptions (Molyneux, 2018) compared with desktop computers, thus limiting the depth of information processing on mobile devices.
Given all these conflicting theories and results, the answer to the question of whether users are more likely to process information heuristically or systematically on mobile phones (vs PCs) can go in either direction. It is also worth noting that the indicators of information processing can vary greatly across studies. Most of the above-mentioned studies on device differences adopted measures such as self-reported attention or psychophysiological measures to evaluate attention. Yet, there is a lack of understanding of whether the information is processed in a heuristic or systematic manner (Chaiken, 1980). Other studies suggest that thoughts related to the presented information (Chaiken, 1980), levels of self-reported elaboration (Eveland, 2002), extent of information retrieval from memory (Xu and Sundar, 2016), and quality of performance on cognitively challenging tasks such as detecting deception (Masip et al., 2009) are all indicators of heuristic or systematic processing (higher levels on these indicators imply systematic information processing, while lower levels indicate more heuristic information processing). All these measurement differences may further complicate the direction of prediction. Therefore, we propose a research question rather than a directional hypothesis:
RQ1. Are there differences between mobile phones and PCs in the extent to which they are associated with systematic and heuristic information processing?
Study 1
Method
We conducted an online between-subjects experiment to test the proposed research question.
Participants
We recruited our participants from Cloud Research, which consists of high-quality microworkers from Amazon Mechanical Turk who have passed stringent quality screening (Litman et al., 2017). 2 Cloud research also provides us a more diverse sample, which can help us assess the prevalence of the phenomenon under study (i.e. shallower processing on mobile phones) in the general population. An a priori power analysis indicated that for an alpha of .05, assuming a medium effect size (f = 0.25), two conditions and three control variables (Faul et al., 2007), we needed 128 participants in order to achieve sufficient power (0.8). Overall, 131 participants participated in the study, but only 116 completed the entire survey, using either their mobile phones (N = 64) or PCs (laptops or desktops; N = 52), which resulted in a sample size that is slightly smaller than desired. The average age was 38.11 (SD = 12.67), with 50.0% female (N = 58) and 50.0% male (N = 58). Majority are Caucasian (N = 87, 75.0%), followed by African American (N = 12, 10.3%) and Asian (N = 9, 7.8%). They are also relatively highly educated, with 81.0% (N = 94) having earned a bachelor’s degree.
Procedure
We randomly assigned participants to use either their mobile phones or PCs to answer the survey. To ensure that they used the designated device to take the survey, we (1) provided clear instructions in several places; and (2) used Qualtrics’ metadata information to filter out participants who did not follow this instruction. Specifically, Qualtrics can unobtrusively detect the device the participants are using when answering the questionnaire (Qualtrics support, 2023). We added a filter question so that once the system detected that the participants were not using the correct device to participate in the study, they would be automatically filtered out of the study before they answered the first question.
Upon entering the main survey, participants were asked to fill out a pre-stimuli questionnaire measuring the control variables about their need for cognition and frequency of using mobile phones. They were then presented the following three types of messages—normal emails, spam emails, and tricky pictures. Finally, we asked about their demographic information, the readability of the information as the third control variable, and the dependent variables.
Stimuli
First, we presented participants two emails, one regarding a COVID-19 webinar and the other about a live concert, in either the mobile (Figure A1 in Appendix A 3 ) or PC email format (Figure A2 in Appendix A) depending on the device to which they were assigned. We created these emails based on real webinar emails sent out from trustworthy academic and non-governmental organization (NGO) institutions. The emails included information pertaining to the sender (e.g. who the sender is, how the sender requires the receiver to reply to the emails), and the details of the event (either concert or webinar), including platform, speaker, time, location, topic, and themes. We chose these two topics to build our stimuli, as they are highly relevant, and very common topics at the time of our data collection.
Next, participants saw five tricky pictures in random order (Figure A3a to A3e in Appendix A) to test if they would fall for perceptual illusions. These pictures were obtained from online open sources that prey on human’s stereotypical thinking pattern (e.g. copper knife, yet copper is the description of the knife’s color not the material; the darker the area, the lesser the number of individuals per km).
Finally, they saw two spam emails, one about Amazon account security (see Figure A4 in Appendix A), and the other about tax refund (see Figure A5 in Appendix A), which were all adopted from real spam email examples provided by Norton (https://us.norton.com/blog/online-scams/phishing-email-examples). We chose these two topics with Internal Revenue Service (IRS) and Amazon as authority figures so that they would be applicable for all participants in our study, who were US citizens working as Amazon Mechanical Turkers.
Measurement
All self-reported items were measured on a 7-point Likert-type scale.
Control variables
Need for cognition is a psychological trait that predicts one’s predisposition for engaging in effortful thinking (Cacioppo and Petty, 1982) and is hence controlled in our analysis. We used the 18-item short Need for Cognition scale (Cacioppo et al., 1984). Sample items include “I would prefer complex to simple problems” and “Thinking is not my idea of fun (R)” (M = 4.52, SD = 1.15, α = .93).
Perceived readability of the information was also controlled to make sure that differences in information processing across the two devices is not due to readability. Three items (1 = very low, 7 = very high) were adopted from Al Ghamdi et al. (2015) including “Ease of reading characters,” “Ease of understanding the contents,” and “Clarity of organization of information.” No significant differences in perceived readability were found between the two conditions, t(112) = –.31, p = .75 (M = 5.12, SD = 1.45, α = .90).
Frequency of using mobile phones was also controlled, and was measured through one item (1 = never, 7 = all the time; M = 4.82, SD = 1.03). We also controlled for participants’ frequency of using mobile phones to read and answer emails (M = 4.44, SD = 1.69)/PCs (M = 4.59, SD = 1.95) in analyses with dependent variables related to normal and spam emails.
Dependent variables
Heuristic information processing, unlike systematic information processing, is less effortful, less analytical, and more superficial (Chaiken et al., 1989). Measuring heuristic and systematic information processing has always been a challenge, well recognized by researchers (Bellur and Sundar, 2014; Schemer et al., 2008). The most commonly used method to measure the amount of systematic (vs heuristic) information processing was originally proposed by Chaiken and Maheswaran (1994), which is to measure the number of message relevant thoughts listed after one is exposed to the message, manifest as recall memory. In addition to recall memory, scholars have used recognition memory to measure the amount of cognitive resources users spend when processing information (Andsager and White, 2009). Later, Chaiken and Ledgerwood (2012) proposed an additional dimension that should be taken into account when measuring cognitive load, which is the attention that users allocated to process the information. Similarly, Schemer et al. (2008) operationalized the amount of cognitive resources in terms of the time spent by participants reading the information. Xu and Sundar (2016) combined all these dimensions and operationalized heuristic versus systematic information processing in terms of (1) time spent processing the information, (2) attention, (3) recognition memory, and (4) recall memory. Since self-reported measures can be subjective, some researchers have argued that we can measure more distal outcome variables of heuristic information processing to better assess the depth at which individuals processed the information, including individuals’ attitude toward the messages (especially when the message has a persuasive intention; Darley and Smith, 1995), credibility assessment of unfounded arguments (Pennycook et al., 2015), and whether they are able to detect deception (Ali and Zain-ul-abdin, 2021).
In general, we followed Xu and Sundar’s (2016) method for gauging systematic versus heuristic processing by comparing the time spent processing the information, attention, recall memory, and recognition memory. In addition, we measured users’ susceptibility to deceptive content (i.e., tricky pictures and spam emails).
For legitimate emails, we measured the following variables: (1) time spent viewing the emails recorded by Qualtrics (webinar email: M =53.97 s, SD = 43.75; concert email: M = 54.85, SD = 44.82); (2) self-reported attention measured by adopting the three-item scale from Chaffee and Schleuder (1986; 1 = little, 7 = a lot). Items include “how much attention did you pay to the information in the email?” “how much did you focus on the information in the email?” and “how much did you concentrate on the information in the email?” (webinar email: M = 5.43, SD = 1.40, α = .96; concert email: M = 5.52, SD = 1.54, α = .96); (3) recall memory was measured by an open-ended question right after they read the email, which asked them to list out as many thoughts as possible. Following Shen and Dillard (2007), two coders coded each thought in terms of whether the thought was relevant to the emails (Percent agreement: 82.9%; Krippendorff’s alpha = .81). 4 We then calculated the number of relevant thoughts (webinar email: M = 4.82, SD = 2.68; concert email: M = 5.18, SD = 2.89), which is different from the number of words entered by participants. In addition to the thoughts, we recorded the total number of words entered by each participant in the open-ended questions, using Excel. 5 (4) Recognition memory: we administered seven multiple choice and three fill-in-the-blank questions for each email regarding details contained in the email, such as the sender, the requested reply method, and the time and location of the event. The total number of correct answers were aggregated to represent their recognition memory of the email (webinar email: M = 4.38, SD = 2.17; concert email: M = 5.15, SD = 2.43).
For tricky pictures, we measured (1) time participants spent viewing the pictures, objectively recorded by Qualtrics (M = 44.77, SD = 31.68) and (2) susceptibility to tricky pictures, operationalized as the number of questions they answered correctly out of the five questions based on them (M = 1.50, SD = 1.15). The possible range of this variable is 0 to 5.
For spam emails, we measured (1) timeparticipants spent processing the spam emails recorded by Qualtrics (Amazon spam email: M = 25.94 s, SD = 23.45; IRS spam email: M = 21.50 s, SD = 17.78); (2) suspicion toward the spam emails was measured using two metrics. The first one was the self-reported action tendency, Amazon email: “click into the link and provide your updated personal information” (1 = completely disregard it; 7 = will definitely help; M = 2.39, SD = 1.97); IRS spam email “How likely are you to take action to claim your refund” (1 = completely disregard it, 7 = will definitely claim; M = 4.66, SD = 2.38). The second metric was one open-ended question following the action tendency question which asked “Why” participants chose to take actions (or not). Two coders then coded the open-ended question in terms of whether the participant mentioned their suspicion about the email or not (percentage agreement: 99.1%; Krippendorff’s alpha = .98). (3) recognition memory of the (a) email address and (b) how many links were embedded in the emails, was measured through multiple-choice questions.
Data analysis
Effects of device type on recognition memory, recall memory (including word count), and susceptibility to tricky pictures were analyzed using negative binomial regression as they were count data and were unlikely to follow normal distribution. Effects of device on suspicion toward the spam emails, recognition memory of links in spam email, and recognition memory of the spam email address were analyzed using logistic regression models as they are dichotomous data. Effects of device on all the other variables were analyzed using MANCOVA or ANCOVA. All the analyses were conducted using SPSS (Hinton et al., 2004).
Results
Processing of legitimate emails
Results from the MANCOVA revealed that in general, there was no significant effect of device on the continuous variables, F (4, 107) = 1.09, p = .37, Wilks’ Λ = .96, partial η2 = .04. Specifically, we found no significant difference between participants using PCs and mobile phones in terms of the time they spent on the two legitimate emails, time on webinar email: F (1, 112) = 1.69, p = .20, R2 = .02; time on concert email: F (1, 112) = .40, p = .53, R2 = .00. There were also no significant differences in their self-reported attention to webinar email, F (1, 112) = 1.14, p = .29, R2 = .01, and concert email, F (1, 112) = 2.44, p = .12, R2 = .02.
Negative binomial regressions revealed no significant differences between participants using PCs and mobile phones for recall memory of either webinar email, B = .03, SE = .22, Wald c2 = .01, p = .91, Exp (B) = 1.03, 95% CI OR = [.68, 1.56], or concert email, B = .02, SE = .21, Wald c2 = .01, p = .92, Exp (B) = 1.02, 95% CI OR = [.68, 1.54]. Nor for recognition memory of either webinar email, B = –.11, SE = .21, Wald c2 = .27, p = .61, Exp (B) = .90, 95% CI OR = [.59, 1.36], or concert email, B = –.09, SE = .21, Wald c2 = .15, p = .70, Exp (B) = .92, 95% CI OR = [.61, 1.39]. We only observed that participants typed significantly fewer number of words when using mobile phones than those using PCs for both webinar email, B = –.35, SE = .20, Wald c2 = 3.10, p = .08, Exp (B) = .71, 95% CI OR = [.48, 1.04], and concert email, B = –.47, SE = .20, Wald c2 = 5.66, p = .02, Exp (B) = .63, 95% CI OR = [.43, .92] (see Table 1 for a summary of descriptive statistics of users’ responses for the two emails).
Descriptive statistics of information processing of webinar and concert emails in Study 1.
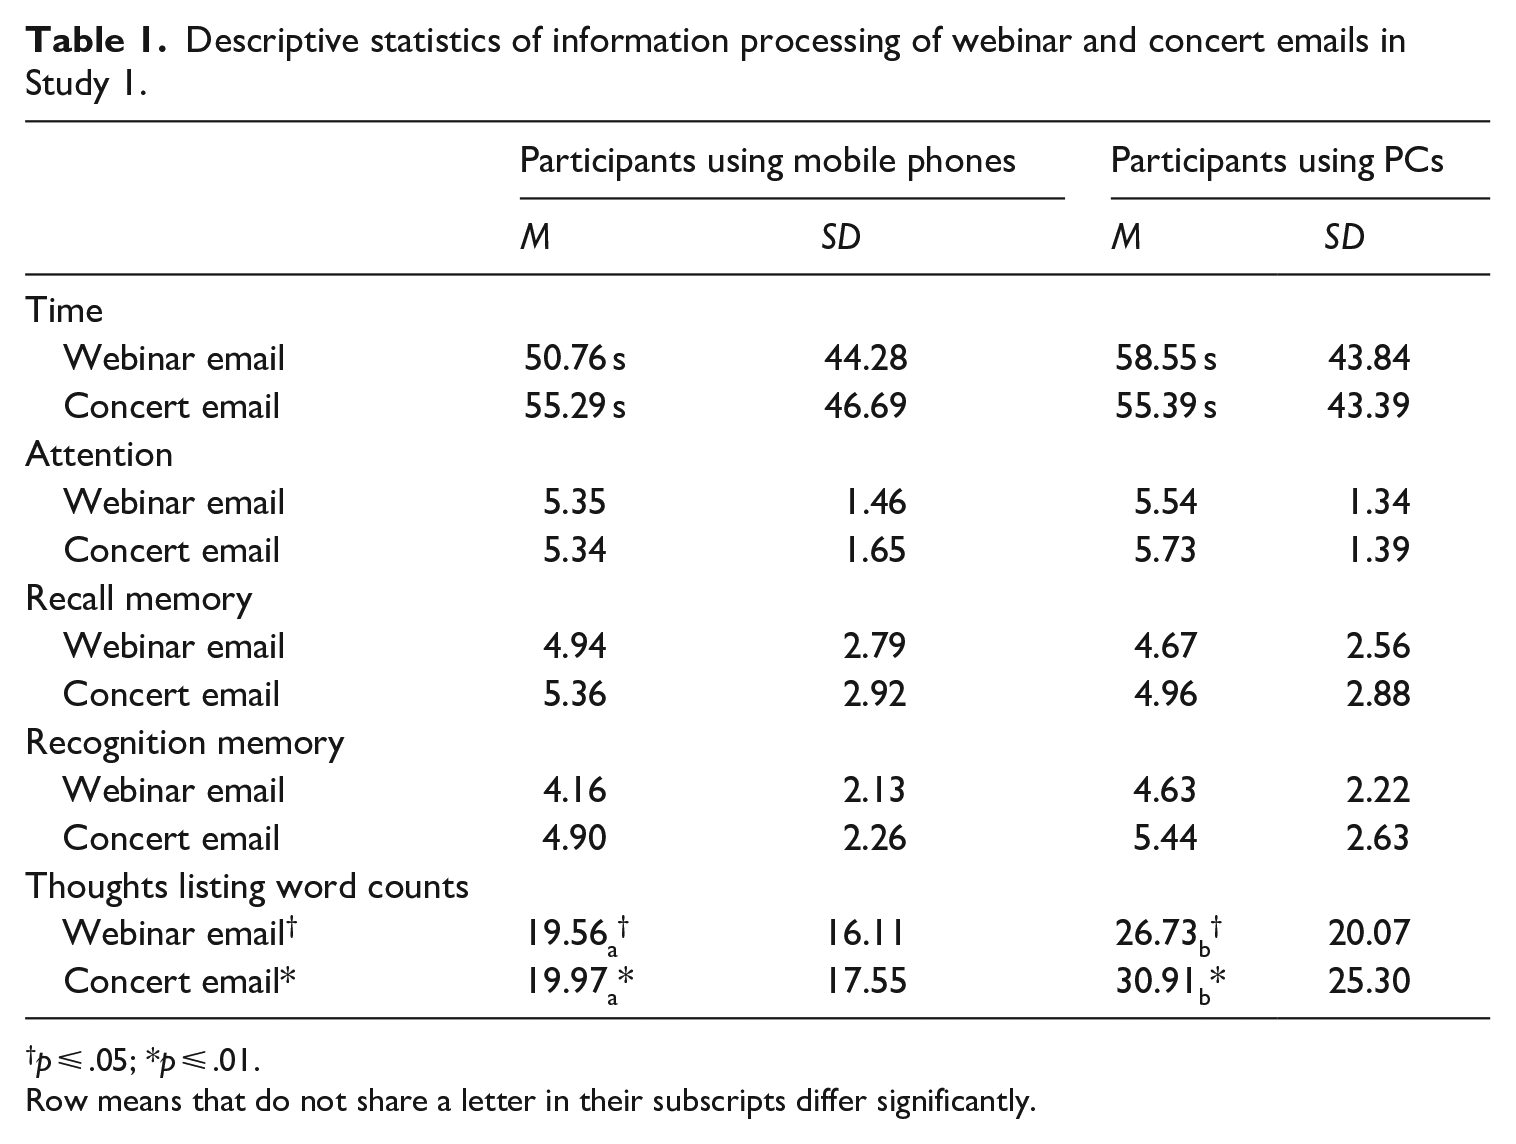
p ⩽ .05; *p ⩽ .01.
Row means that do not share a letter in their subscripts differ significantly.
Processing of tricky pictures
Results from the ANCOVA revealed that participants spent significantly more time processing the tricky pictures when using PCs (M = 52.57 s, SD = 32.92) compared to mobile phones (M = 38.20 s, SD = 29.56), F (1, 112) = 6.70, p = .01, R2 = .06. However, there was no significant difference between PC (M = 1.56, SD = 1.19) and mobile (M = 1.46, SD = 1.13) users in terms of their susceptibility to tricky pictures (Table 2).
Descriptive statistics of information processing of the fake news blurbs in Study 2.
p ⩽ .05; *p ⩽ .05; **p ⩽ .01; ***p ⩽ .001.
Processing of spam emails
Results from the MANCOVA revealed that in general, there was no significant effect of device on the continuous variables, F (3, 107) = 1.62, p = .19, Wilks’ Λ = .96, partial η2 = .04. However, univariate analysis revealed that participants using PCs spent significantly more time processing the spam emails (M = 54.51 s, SD = 37.84) than those using mobile phones (M = 41.33 s, SD = 31.62), F (1, 112) = 5.37, p = .02, R2 = .04.
Yet, we did not observe any significant difference between them in their expression of suspicion about the two spam emails (Amazon spam email: Mobile vs Laptop (B = .32, SE = .52, Wald c2 = .38, p = .54, OR = 1.38, 95% CI OR = [.50, 3.81]); IRS spam email: Mobile versus Laptop (B = .16, SE = .40, Wald c2 = .16, p = .69, OR = 1.18, 95% CI OR = [.53, 2.59]), their recognition memory of the email address (Amazon spam email: Mobile vs Laptop (B = –.45, SE = 1.58, Wald c2 = 1.13, p = .29, OR = .64, 95% CI OR: [.28, 1.47]); IRS spam email: Mobile versus Laptop (B = .37, SE = .48, Wald c2 = .62, p = .43, OR = 1.45, 95% CI OR = [.57, 3.68]), or their action tendency (Amazon spam email: F (1, 112) = .002, p = .96; IRS refund email: F (1, 112) = .17, p = .69. But, we found that participants using PCs (75%, N = 39) were more likely to correctly identify how many links were embedded in the Amazon spam email than those using mobile phones (46.0%, N = 29), B = –1.23, SE = .43, Wald c2 = 8.37, p < .01, OR = .29, 95% CI OR = [.13, .67].
Discussion and implications
Generally, we found that participants using PCs do not perform any better on questions asking them to recall specific details than those using mobile phones, suggesting no significant differences in information processing. If anything, we found participants using mobile phones input fewer words and spent significantly shorter time processing both textual and visual information than those using PCs. Given that there is no significant difference between the two conditions on heuristic and systematic information processing, this finding suggests that users on their mobile phones are processing the information in a more time-efficient manner (Heemstra, 1986).
A possible explanation is that tasks that require information processing (e.g., emails, online searches, shopping) are increasingly being performed using mobile devices instead of PCs. Therefore, users may have adopted the skill to process information quickly and pertinently on their mobile devices despite the smaller screen: this would mean that heavy users of mobile phones would be more efficient than light users, that is, how frequently people use their mobile (vs PC) devices and how familiar they are with their devices, or users’ habitual usage, can be a relevant individual difference. A follow-up study is necessary to compare whether users with different levels of habitual usage of mobile phone show different patterns of information processing across devices.
A few design limitations of Study 1 are also worth noting. First, we did not measure or control for the effects of environmental distraction. It is possible that participants in both conditions processed information more effortfully in our experiment compared to a naturalistic setting where users’ attention is diverted when using mobile phones. In addition, we mainly used thought-listing and memory questions to gauge participants’ information processing, which might be less objective than behavioral measures. Finally, the statistical power of Study 1 is lower than ideal, thus limiting our confidence in declaring null effects based on the non-significant findings. Therefore, more participants are needed for a definitive confirmation of the absence of differences between mobile and PC users.
We also found that, compared to credible information (i.e., legitimate emails), participants using PCs and mobile phones might differ when processing information that contains deceptive content (i.e., spam emails and tricky pictures). Specifically, we observed differences in time spent processing the information, and participants using PCs are more likely to notice the links embedded in spam emails. This result suggests that we are more likely to observe differences in systematic and heuristic information processing when the content involves deception. It also aligns with previous research that generally applies the concept of systematic versus heuristic information processing in the context of content credibility evaluation (Masip et al., 2009). The concept of heuristics and information processing has been commonly employed in previous theoretical frameworks such as the HSM (Chaiken, 1980) and the Elaboration Likelihood Model (ELM; Petty and Cacioppo, 1986) to investigate how users assess the credibility of online information. In addition, studying when users tend to process deceptive information heuristically rather than systematically is of practical significance, as shallow information processing can result in more detrimental behavioral consequences in these situations. Therefore, based on the results from Study 1 as well as past literature in the context of heuristic and information processing, we examined how individuals process deceptive information across devices in Study 2.
We decided to use phishing emails and news that contains misinformation as our stimuli, and measured participants’ actual behaviors (e.g., actions of clicking on the phishing emails’ links or sharing misinformation to their social networks) to investigate the consequences of potential shallow processing. We chose clicking behavior because click-rate is one of the major measures of susceptibility to phishing attacks (Williams et al., 2018). We chose these two contexts for Study 2 since prior researchers have often utilized these dual processing models (i.e. heuristic processing vs systematic processing) to explore instances where users fall for phishing attempts (e.g. Vishwanath et al., 2011) or misinformation (Hwang and Jeong, 2023). Several studies consistently indicate that heuristic information processing explains why users become susceptible to deceptive information (Hwang and Jeong, 2023; Vishwanath et al., 2011; Workman, 2007). In addition, among various forms of deceptive information, phishing emails, and online misinformation are particularly important contexts that demand research attention and user training (e.g. Atske, 2022; Carroll et al., 2022; Chiluwa and Samoilenko, 2019; Lee, 2018). By conducting a follow-up study, using more diverse contexts, we expect to provide a more comprehensive comparison of users’ information processing between mobile phones and PCs.
Study 2
Compared to PCs, the prevalence and increasing usage of mobile phones in our daily lives can foster habitual mobile uses. According to Verplanken and Orbell (2003), habits involve automaticity, frequency, and identity. Mobile phone users tend to be high on all three dimensions. They can be easily and automatically triggered by the mere presence of the device without awareness (Ward et al., 2017). They tend to check phones quite frequently, with the majority checking their phones every 5–15 minutes (Banerjee and Gupta, 2018). Indeed, mobile phones are treated as an extension of oneself, due to its highly portable nature and its role as a constant companion (Ross and Bayer, 2021). There is also a positive association between habit strength and the associated behaviors. For instance, when individuals use Facebook more frequently, they are more likely to develop a strong habitual use of Facebook (Vishwanath, 2015). Habitual use may also lead to an overuse of mobile phones (van Deursen et al., 2015).
This habitual use of media can affect how people process information. Because of the existing mental links between certain situations and behavioral responses, individuals do not have to elaborate much before taking actions. Instead, their habitual behaviors are automatically manifested with less control or consciousness (Naab and Schnauber, 2016), and can serve a functional purpose in obtaining certain goals or end states (Verplanken and Wood, 2006). For instance, when feeling bored, habitual mobile users may take out their phones to check updates, without even thinking about what they can do to pass time. Hence, habits can help reduce cognitive effort in information processing.
But, on the flip side, habits can lead to biases and mistakes in judgment as they are less likely to be associated with systematic processing of information. According to cultivation research, heavy users of a specific medium are more likely to process the information delivered by that medium heuristically compared to light users, due to their familiarity with the embedded constructs (Shrum, 2017). This is also consistent with HSM, which posits that systematic information processing typically necessitates higher motivation from individuals to engage in more effortful processing (Chaiken and Maheswaran, 1994). For habitual users, the automaticity of habitual enactment enables them to apply their ingrained social scripts automatically without requiring the motivation for extensive information processing (Vishwanath et al., 2018). Although prior research did not directly examine the effects of habitual usage of specific technology devices, earlier studies have demonstrated how ritualistic media usage behaviors can affect users’ information processing such as a specific application on mobile phones or PCs. For instance, as shown in previous research, the stronger the habitual Facebook use, the more likely a user falls victim to social media attacks (Vishwanath, 2015). Similarly, individuals with habitual email habits (e.g., checking emails without thinking) are shown to be less suspicious of phishing emails (Vishwanath et al., 2018). However, due to the survey nature of these studies, we are not sure if the observed difference is truly due to users’ habitual usage of a specific device, or due to the fact that users process different content or have different motives when using different devices. Therefore, it is important for us to adopt an experimental approach in order to rule out content effects by ensuring that the content is constant across devices. Specifically, in addition to our original research question, we propose that when users develop strong habitual use of mobile phones, they are more likely to employ heuristic, rather than systematic, processing of information presented on their mobile phones:
H1. Habitual use of mobile phones will moderate the relationship between device (mobile phones vs PCs) and information processing (heuristic vs systematic), such that users with higher habitual mobile phone use will be more likely to show heuristic processing of information presented on mobile phones than PCs.
Method
We conducted an online between-subjects experiment similar to Study 1, with device (mobile phones vs PCs) as our primary independent variable.
Participants
For Study 2, we recruited participants from a US university (N = 260 were recruited and N = 241 finished the study). We decided to use college students as our study sample in Study 2 primarily because we wanted to increase the completion rate. Out of 241 participants, 134 were assigned to use their mobile phones to take the survey and 107 were assigned to use their PCs. The average age was 20.22 (SD = 1.22), with 43.6% female (N = 105), 56.0% male (N = 135), and 0.4% other (N = 1). Majority were Caucasian (N = 184, 76.3%), followed by Asians (N = 33, 13.7%) and African Americans (N = 10, 4.1%). A power analysis was conducted using an alpha of 0.05, a power of 0.8, and a medium-effect size (f = 0.25; Faul et al., 2007). For a study design with two conditions, the desired sample size is 128, which is smaller than our sample of 241, indicating sufficient statistical power for our analysis.
Procedure
Similar to Study 1, we randomly assigned participants to use either their mobile phones or PCs to answer the survey, following the same procedures. However, we made the survey shorter than Study 1. Participants were randomly presented with only one of six misinformation blurbs and one of four phishing emails. They were asked to imagine that they received the email/encountered the news, and to read it as they would normally read email messages/news. For phishing emails, we used the embedded codes in Qualtrics to unobtrusively track if participants clicked the malicious links or not. If they clicked the link, they were simply directed to the post questionnaire. No actual malicious websites were shown to the participants. Those who did not click on the malicious links were directed to the same post questionnaire after they finished reading the email.
Stimuli
We chose six fake news blurbs from a fact-checking site (Snopes.com) for stimulus sampling. Among them, four were political misinformation and two were non-political misinformation (Figure B1a to B1f in Appendix B 6 ). The news blurbs contained the source, the title, and a short abstract of the news. Similarly, the four phishing emails were included in this study for the purpose of stimulus sampling. All emails were selected from a large pool of existing phishing emails (Lin et al., 2019). We chose emails that use authority as the primary cue in order to maximize the possibility of observing an effect, considering that Lin et al. (2019) found users to be significantly more susceptible to phishing emails using authority than other weapons of influence. We modified some parts of each email to fit the university context (Figure B2a to B2d Appendix B) and embedded codes in the links, so that we could track if participants clicked the malicious links or not.
Measurement
All self-reported items were measured on a 7-point Likert-type scale.
Control variables
In addition to the control variables in Study 1, namely the need for cognition (M = 4.49, SD = .74, α = .84), readability (M = 5.48, SD = 1.16, α = .89), for which we found no difference across the two conditions, t(239) = .68, p = .50) we also controlled for frequency of reading emails from PCs (M = 5.02, SD = 1.63) and frequency of reading emails from mobile phones (M = 4.27, SD = 1.69; for phishing emails-related behaviors and perception). Frequency of using mobile phones (M = 3.14, SD = 1.57) and PCs to read news (M = 2.89, SD = 1.81) was controlled when analyzing users’ perceptions about fake news blurbs (1 = never, 7 = all the time).
Dispositional trust was also controlled since past studies have revealed that it could affect how users process information with malicious intent (Hong et al., 2013). It was measured with three items adopted from Wright and Marett (2010) such as “I usually trust people until they give me a reason not to trust them” and “I generally give people the benefit of the doubt when I first meet them” to control for their pre-existing tendency of trusting others (M = 5.09, SD = 1.13, α = .71).
Preference for multitasking was also controlled due to the nature of the experiment (which happened outside of a lab) and that some participants might be multitasking when processing the information. And past research has revealed that multitaskers are more likely to make errors in cognitive tasks (Srivastava, 2013). It was measured by 14 items adopted from David et al. (2015), such as “I try to multitask whenever possible” and “I lose track of time when multitasking” (M = 4.06, SD = 1.06, α = .89).
Distraction of the current environment was also controlled due to the nature of our experiment. Specifically, we aimed to control for the potential effects of environmental distraction on their information processing. It was measured via five items (Lee and Brand, 2010) such as “The place I am now provides an undisturbed environment so that I can concentrate on the survey” and “The place I am now is quiet” (M = 2.60, SD = 1.21, α = .83). We found no significant difference between the two conditions on this variable, t (239) = –.80, p = .43.
Moderators
Mobile phone habitual usage was measured by two items adapted from LaRose et al. (2003), namely “Using mobile phones is a habit I have gotten into” and “Using mobile phones is part of my usual routine” (M = 6.03, SD = 1.05, Spearman-Brown Coefficient 7 = .83).
Dependent variables
Fake news blurbs
Time spent on the fake news blurb (recorded by Qualtrics; M = 12.69, SD = 10.42), Attention (self-report; M = 3.85, SD = 1.46, α = .93), and Recall memory (thought listing, count data) were measured similarly as in Study 1. In addition to identifying relevant thoughts (M = 3.86, SD = 2.88) and irrelevant thoughts (M = 1.85, SD = 2.32), the two coders coded all relevant thoughts for source-related thoughts (M = .32, SD = .72) or message-related thoughts (M = 3.54, SD = 2.74; percent agreement: 95.4%; Krippendorff’s alpha = .88). We improved our coding process primarily because literature suggests that systematic information processing is associated more with argument-related thoughts, while heuristic information processing is associated with cues-related thoughts (e.g. source cues; Chaiken, 1980).
Systematic information processing was also measured using a scale from Kahlor et al. (2003). Participants were asked to rate five items such as “I thought about what actions I myself might take based on what I read” and “I thought about how what I had read related to other things I know” (M = 5.08, SD = 1.74, α = .80). 8
Perceived credibility was measured with the three-item scale from Appelman and Sundar (2016). Participants were asked to rate the degree to which they think the news was “accurate,” “authentic,” and “believable” (M = 3.35, SD = 1.39, α = .87).
Susceptibility to fake news was gauged through coding their thoughts. If the participants indicated their doubts about the news’ legitimacy, the coder would code it as 1 (feeling suspicious), otherwise 0 (no suspicion; dichotomous). Two coders coded this variable (percent agreement: 94.4%; Krippendorff’s alpha = .89).
Phishing emails
Time spent on processing the phishing email was unobtrusively recorded by Qualtrics (M = 7.92, SD = 9.08).
Actual action was measured in terms of whether the participants clicked on the malicious links or not which was recorded unobtrusively by us (0 =did not click on the link, 1 = click on the link; dichotomous).
Action tendency was measured with one item “How likely are you to take action as advocated in the email?” on a 7-point scale (1 = completely disregard it, 7 = will definitely do; M = 4.75, SD = 2.16).
Suspicion toward the phishing email was gauged through an open-ended question asking why they chose to take (or not take) the action. Two coders then determined whether the participants felt any suspicion about the phishing email or not 9 (dichotomous).
Data analysis plan
Similar to Study 1, to answer RQ1, we ran different models based on the level of measurement of the dependent variables (i.e., logistic regression for dichotomous data, negative binomial regression for count data, and MANCOVA for continuous data). To test H1, we used Model 3 of Process Macro in SPSS (for dichotomous variables and continuous variables), while the negative binominal regression was used for count data (i.e., recall memory and thought-listing word count; Hayes, 2017).
Results
Fake news perception (RQ1)
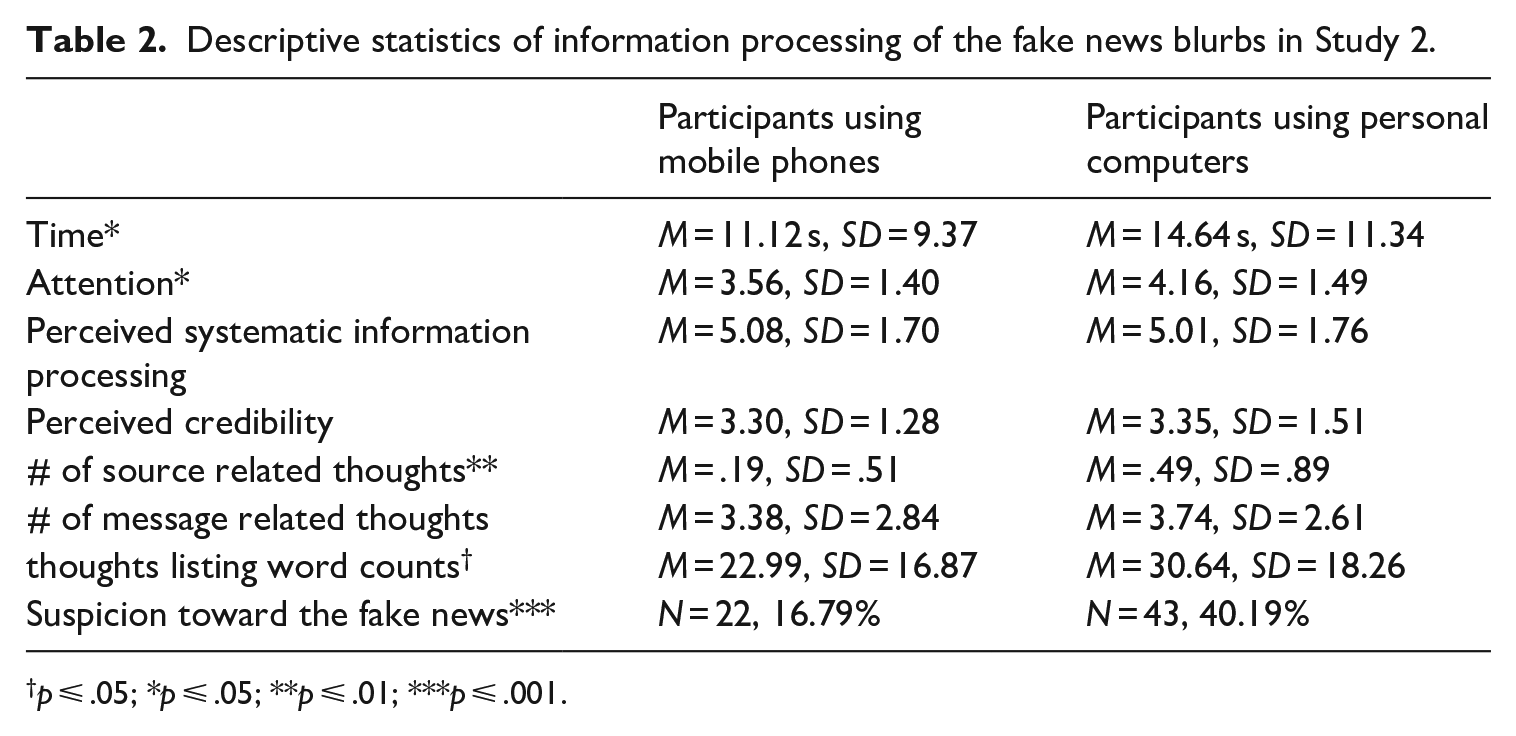
Results from the MANCOVA revealed that in general, there were significant effects of the device on the continuous variables, F (4, 228) = 3.35, p = .01, Wilks’ Λ = .94, partial η2 = .06. Specifically, we found that participants assigned to use mobile phones tended to spend less time processing the news compared to those using PCs, F(1, 226) = 4.28, p = .04, R2 = .02. Participants using mobile phones also reported less attention to the news compared to those using PCs, F(1, 226) = 5.89, p = .02, R2 = .03. There were no significant differences in perceived systematic information processing, F(1, 226) = 1.26, p = .26, R2 = .00, or perceived credibility of the news, F(1, 226) = .50, p = .48, R2 = .00.
In terms of thought listing, similar to Study 1, the negative binomial regression model revealed that participants assigned to use mobile phones entered fewer words compared to those using PCs, B = .26, SE = .69, Wald c2 = 3.53, p = .06, Exp (B) = 1.29, 95% CI OR = [.99, 1.69]. We also found that although there was no significant difference between the two groups in terms of the number of message-relevant thoughts (B = .12, SE = .15, Wald c2 = .55, p = .46, Exp (B) = 1.12, 95% CI OR = [.83, 1.52]) participants using PCs were more likely to list source-relevant thoughts (B = .90, SE = .30, Wald c2 = 9.09, p < .01, Exp (B) = 2.45, 95% CI OR = [1.37, 4.39], see Table 2 for a summary of descriptive statistics).
The coding of these thoughts further revealed that participants assigned to use PCs were more likely to indicate their suspicion toward the fake news (N = 43, 40.19%) compared to those using mobile phones (N = 22, 16.79%), B = 1.26, SE = .34, Wald c2 = 13.58, p < .001, OR = 3.52, 95% CI OR = [1.80, 6.89].
Phishing emails (RQ1)
Results from the MANCOVA revealed that in general, there were significant effects of the device on the continuous variables, F (3, 229) = 3.99, p < .01, Wilks’ Λ = .95, partial η2 = .05. We found that, similar to Study 1, participants assigned to use mobile phones spent significantly less time processing the phishing email, compared to participants using PCs, F(1, 228) = 10.76, p < .01, R2 = .05. However, there was no difference across the two groups in terms of self-reported attention, F(1, 228) = .02, p = .89, R2 = .00, action tendency, F(1, 228) = .59, p = .44, R2 = .00, or their expression of suspicion toward the phishing emails in the open-ended question, B = .03, SE = .31, Wald c2 = .01, p = .93, OR = 1.03, 95% CI OR = [.56, 1.89].
Interestingly, we found that, compared to participants using mobile phones, those who were assigned to use PCs were more likely to click on the malicious links (B = 1.20, SE = .30, Wald c2 = 16.28, p < .001, OR = 3.32, 95% CI OR = [1.85, 5.94], see Table 3 for a summary of statistics).
Descriptive statistics of information processing of the fake news blurbs in Study 2.

p ⩽ .01; ***p ⩽ .001.
The moderating effects of mobile phone habitual usage (H1)
To test H1, we treated habitual usage of mobile phone as the moderator. We found that for phishing email processing, there was a significant interaction effect between device type and habitual mobile usage on participants’ expression of suspicion toward the phishing email, B = –.72, SE = .33, Wald c2 = 4.68, p = .03, OR = .49, 95% CI OR = [.25, .93] (see Figure 1). In general, highly habitual users were less likely to be suspicious about the phishing emails, but this tendency was amplified when they were using mobile phones to process those emails. The moderating effects of habitual usage on the other dependent variables were not significant (see Supplementary Material I 10 ). Overall, our data partially support H1.
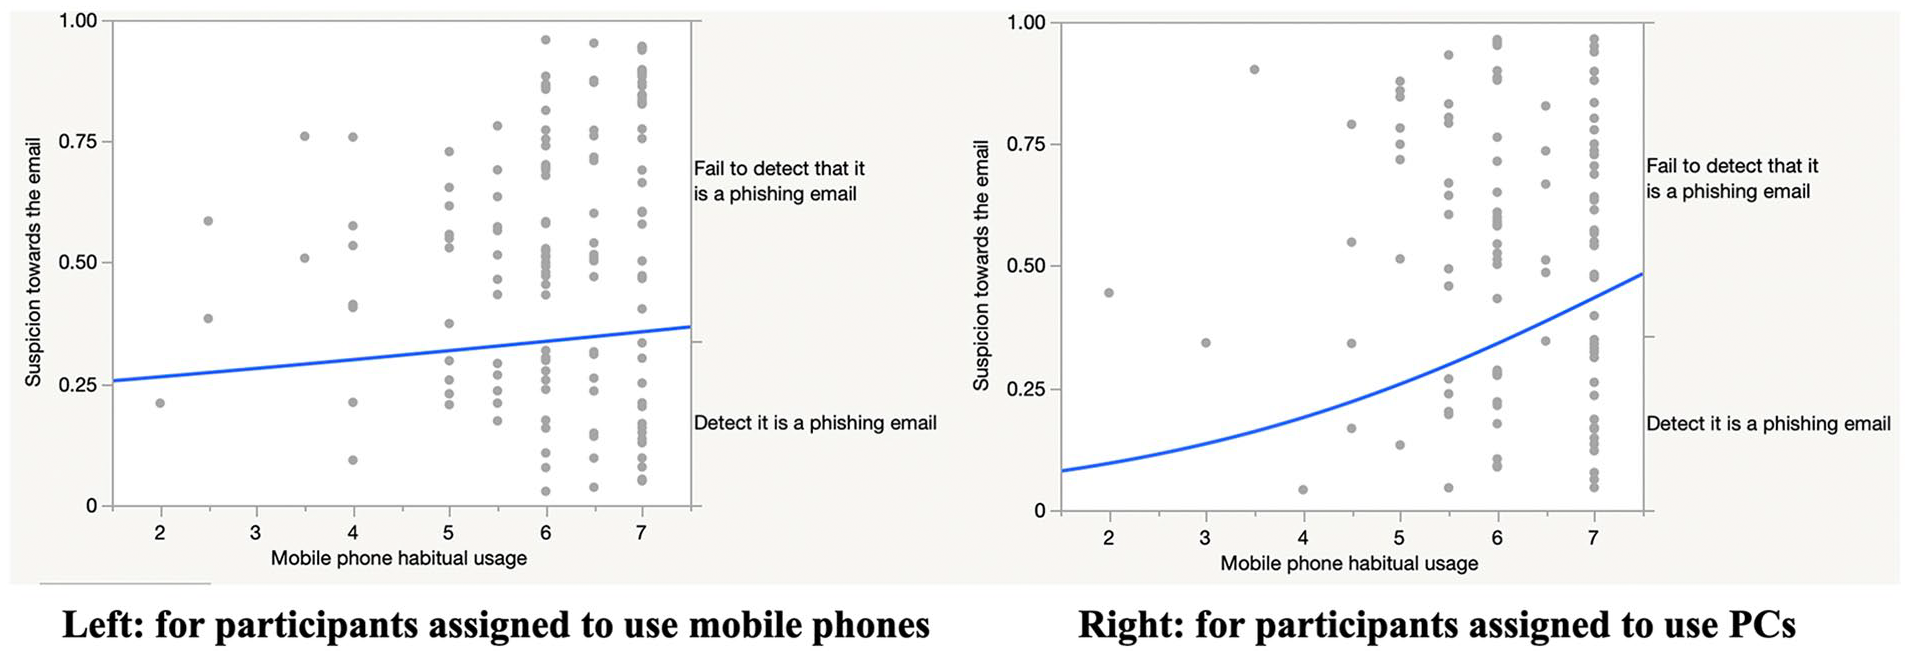
Interaction effect between device type and mobile phone habitual usage on participants’ expression of suspicion toward the phishing email.
Discussion
Our study offers several theoretical implications. We found similar results across both studies, in that users spend less time processing information when using their mobile phones compared to PCs, which is consistent with previous literature (Al Ghamdi et al., 2015). While Study 1 suggested that there was no difference in the quality of information processing between the two devices, Study 2 revealed that mobile phone users’ shorter processing time is accompanied by lower attention to news, specifically misinformation. This echoes Dunaway et al. (2018) and Dunaway and Soroka (2021) that mobile phone users not only spend less time processing online news, but also are less attentive compared to PC users. Mobile phone users’ lower attention to the news could be attributed to the news characteristics. Compared to emails, news blurbs are relatively short in length, and past studies have revealed that fake news articles, in particular, tend to be simpler and shorter (Horne and Adali, 2017), thus requiring less cognition and information processing. The characteristic of news blurbs partly explains the attention disparity between participants using mobile phones and PCs to process the news. The reason behind this disparity might be because reading news is more commonly performed on mobile phones. Therefore, users might be less attentive to the news when reading it on their mobile phones than on PCs, as the cost of effortfully processing news on mobile phones could be higher, involving such actions as scrolling or navigating across tabs in search of information (Dunaway et al., 2018). Reading emails, however, has traditionally been performed on computers. Although there is an increasing trend of performing email-related tasks on mobile devices (Gajić, 2019), the purpose of reading emails is often specific to personal or professional correspondence, which typically necessitates a higher level of attention. In addition, emails are significantly longer compared to news blurbs (which only contain the news title as the textual information). This characteristic holds true for our stimuli as well (see Appendix B 6 ). Previous research has consistently shown that shorter textual information typically demands a shorter attention span from users (Gordon et al., 2023; Leahy and Sweller, 2016). This is corroborated by our data which showed that the mean score of attention is relatively lower when users process fake news blurbs compared to when they process emails. Considering these factors together, therefore, emails are more likely to be processed with greater attention overall, regardless of the device.
Study 2 also showed that users were less suspicious about fake news on their mobile phones. Yet, they were less likely than PC users to list source-related thoughts regarding fake news (an indicator of heuristic processing). At first glance, these results might seem contradictory, suggesting that participants using PCs are more likely to employ heuristic information processing, yet are better at detecting deceptive intention of fake news. However, users using PCs also listed a similar number of message-related thoughts compared to those using mobile phones. This implies that users on PCs do not employ less systematic information processing than those using mobile phones to process information. These results suggest that PC users are probably engaging in both heuristic and systematic information processing. According to HSM (Chaiken, 1980), individuals can process information in systematic and heuristic manner simultaneously, resulting in an additive effect on their subsequent evaluation of the information if the two modes do not generate highly contradicting information (i.e., the additivity principle). This combination may help users to detect the deceptive intention of fake news more easily when using PCs. Therefore, users’ susceptibility to fake news when using mobile phones might be due to their relative lack of depth in information processing, and not because of greater reliance on specific heuristics. In fact, studies have shown that absence of thorough information processing is one of the key contributors to fake news susceptibility (Pennycook and Rand, 2019). Our study suggests that such lack of attention to accuracy might be more prevalent among mobile news readers.
As for phishing emails, we found that users assigned to use mobile phones were less likely to click on the malicious links, whereas those assigned to use PCs might be more likely to notice the links in the spam emails (Study 1) and act on them (Study 2). This result is rather surprising given that click-rate is one of the major measures of susceptibility to phishing attacks (Williams et al., 2018). However, it should be noted that we did not find any differences between users assigned to use PCs or mobile phones in their expression of suspicion about the phishing emails. What we observe from this study can be explained by the difference in input modalities across the two devices as illustrated in the MAIN model (Sundar, 2008). As the operation of PCs is often accompanied by mouse clicking and keyboard typing, and it is easier to navigate to different Web tabs on PCs compared to mobile phones, users might be more likely to click on the links when seeing them on PCs. Another plausible reason is that users on PCs may feel safer to click the malicious link as most PCs are equipped with antivirus software.
We also found moderation effects of mobile phone habitual usage, such that habitual mobile users are less suspicious about the phishing emails on their mobile phones compared to their PCs. Studies have shown that habitual use of media platforms (e.g. Facebook, email) is associated with a higher likelihood of being preyed upon by attackers on that platform (Vishwanath, 2015; Vishwanath et al., 2018). Our study contributes to the literature by revealing the effects of habitual device usage (i.e. mobile phones) could also affect how users process information across contexts.
Overall, the present research integrates theories in social cognition and communication technologies by providing empirical evidence on how digital devices with different affordances influence information processing. Specifically, our study emphasizes the importance of going beyond traditional source and message factors and considering digital media as a potentially new factor when studying social cognition. Our experiments also provide insights for practitioners in the misinformation mitigation and cybersecurity domains. First of all, we found that when users process fake news, they are less suspicious about it when using mobile phones. This result stresses the importance of designing literacy related messages or nudges that help users become more vigilant when using mobiles phones to read news. Existing interventions usually focus on helping users to identify the features embedded in the news to detect misinformation (Meta, 2020). However, our results suggest that the device used for reading the news could also make a difference. Therefore, it is important to first inform users or raise their awareness of how they are more likely to fall for misinformation on mobile devices. Our study also found that users’ higher susceptibility to misinformation when reading it on their mobile phones might be due to their lack of processing, not simply more heuristic information processing. According to HSM, heuristic cues can sometimes aid systematic information processing when the judgmental implications are consistent with each other (i.e., the additivity hypothesis; Chen and Chaiken, 1999). Therefore, we could design just-in-time alerts or nudges on the mobile interface that highlight helpful heuristic cues (such as the source of the fake news) to better enable users to detect misinformation.
Our data suggest that PC users are more likely to click on malicious links in phishing emails. This finding has critical practical implications for cybersecurity researchers, underscoring the need for creative strategies to prevent users from clicking on such links. Designers should embed more salient warnings on PC interfaces to communicate the risks of phishing attempts. Our study also found that habitual mobile users are less suspicious about the phishing emails when they are using mobile phones. This result implies the importance of personalized design to combat cybersecurity attacks online, particularly for habitual mobile phone users, to prevent them from succumbing to phishing emails when receiving them on their mobile devices.
Limitations and directions for future research
From a methodological perspective, we would like to acknowledge the natural tension between internal validity and external validity that arise when conducting experiments about mobile communication. Mobile phones have become so ubiquitous that studying phenomena associated with the usage of mobile phones is difficult in artificial settings (e.g. lab settings). As Nardi and O’Day (2000) note, it is important to study the information ecology surrounding technologies in order to fully understand how and why users interact with those technologies. Therefore, our choice of field experiments was made in the interest of ecological validity, even though it comes with heightened risks of incidental confounds (e.g., distraction of the environment, which we statistically controlled in Study 2). However, the study settings are not fully natural. Therefore, we would like to call for more unobtrusive methods of collecting mobile phone users’ behavioral data in future studies. For instance, a group of researchers recently proposed a novel approach to unobtrusively capture users’ daily mobile phone activities by taking screenshots of users’ phones every 5 seconds, called screenomes (Reeves et al., 2020). With advances in computational communication research, future research can study individuals’ mobile phone usage in a more ecologically valid manner.
Another limitation of our study is that both Studies 1 and 2 are field experiments, and we did not control for the device model that participants used. Nor did we account for reasons behind attrition—participants who dropped out of our study may have some unique characteristics (e.g., deciding to adhere to their current device might indicate high reliance on that specific device) that should be accounted for in future studies. Furthermore, in contrast to Study 1, which involved a more diverse sample, the participants in Study 2 were primarily college students who might be even more inclined to rely on mobile phones for various tasks. Nevertheless, the findings from both Studies 1 and 2 were generally aligned, particularly in the context of processing deceptive content. Future studies could replicate findings in Study 2 with a more diverse sample. Finally, for fake news processing, we did not implement the actions associated with our behavioral measures. Future studies could adopt actual behavioral measures of fake news sharing, commenting, liking, and reading by designing a mock-up website to collect users’ responses.
Conclusion
Converging data from both studies suggest that users are more expedient in processing online information on mobiles phones than PCs, in part because they are less attentive and engage in less information processing compared to those using PCs to process the information. While this is efficient for most categories of information, it can be problematic when it comes to detecting online deception. And the more habituated a person is to using mobile phones, the less vigilant they are to phishing emails on mobile phones. This insight can be helpful for promoting media literacy as well as for designing affordances and alerts on mobile devices that can nudge users toward systematic processing and thereby help combat online deception and misinformation.
Footnotes
Funding
The author(s) received no financial support for the research, authorship, and/or publication of this article.