
Abstract
This study investigated the impact of cyberbullying victimization at work on well-being and strain in the workplace. This is the first study to use a longitudinal approach to research cyberbullying at work. A nationally representative sample of Finnish workers (n = 768) took part in a five-wave survey study. Both within-person and between-person effects were analyzed using hybrid regression models showing that experiencing cyberbullying at work leads to psychological distress, technostress, work exhaustion, and decreased work engagement. The effects of remote work and social media use were also explored. These results confirm that cyberbullying at work can have damaging consequences for victims and, consequently, for whole organizations. Thus, it constitutes a significant problem that employers must confront.
Keywords
Introduction
Information and communication technologies (ICTs) continuously reshape the way work is done by impacting, among other aspects, organizations’ internal communication (Leonardi et al., 2013; Treem and Leonardi, 2013; Tsai and Men, 2017) and how businesses interact with their clients and various audiences (Hofmann et al., 2013; Kligler-Vilenchik and Tenenboim, 2020; McGregor, 2018; Nah and Saxton, 2013; Tsimonis and Dimitriadis, 2014). This accelerated during the coronavirus disease (COVID-19) crisis, which was characterized by the rise of remote work and the shift of a great deal of professional life to online spaces (Eurofound, 2020; Oksanen et al., 2021). The use of ICTs for work purposes creates many new possibilities, but it also introduces novel challenges (Leonardi et al., 2013; Molyneux et al., 2019; Ollier-Malaterre et al., 2013; Pasquini and Eaton, 2021). One of the most significant risks is the emergence of cyberbullying at work (i.e. workplace cyberbullying). Although this phenomenon is traditionally associated with and studied among children and adolescents (Chen et al., 2017; Zych et al., 2015), a growing body of research has proven that bullying and cyberbullying continue into adulthood and working life (Farley et al., 2021).
Cyberbullying at work is conceptually similar to face-to-face bullying and is defined by the repetitiveness or persistency of the negative behaviors and the power imbalance between the perpetrator and the victim (Farley et al., 2021; Watts et al., 2017). However, specific features of modern technology give new meaning to those terms (Farley et al., 2021; Vranjes et al., 2017). For instance, because messages stay online for a long time and may be viewed by many people, even a single act can lead to a long-lasting situation (e.g. widespread, continued ridicule, and humiliation) or repeated negative emotions for the victim (Dooley et al., 2009). The possible anonymity and invasiveness of the act, which can be committed and seen anywhere, create more diverse possibilities for perceived power imbalances (D’Cruz and Noronha, 2013; Farley et al., 2021; Forssell, 2016) and lead to increased fear (Ford, 2013). Therefore, cyberbullying might have more negative consequences for victims than traditional bullying does (Coyne et al., 2017; D’Cruz and Noronha, 2013; D’Souza et al., 2018; Ford, 2013; Watts et al., 2017). Due to the increasingly important role of the Internet in working life, cyberbullying at work could become increasingly prevalent (D’Cruz and Noronha, 2013). However, few studies have assessed the prevalence of this phenomenon, with victimization estimates varying from 0.7% to 33.8% of respondents (Farley et al., 2021; Oksanen et al., 2020).
The current study is the first to use longitudinal design to investigate cyberbullying at work and its consequences for the victim. We examined the effects of cyberbullying victimization at work on employee’s well-being and strain. We based our study on the workplace stress framework and dysempowerment theory. Our analysis included a nationally representative sample of Finnish workers who participated in the five-wave survey study collected between Spring 2019 and Spring 2021 in 6-month intervals.
Traditional workplace stress framework and dysempowerment theory
We based our study on the traditional workplace stress framework (Pratt and Barling, 1988) and dysempowerment theory (Kane and Montgomery, 1998). The traditional workplace stress framework revolves around three concepts related to three stages of the stressful situation (Pratt and Barling, 1988). First, the stressor is the objective event or aspect of the environment. Second, stress is the way the individual evaluates the stressor subjectively. Finally, strain is the psychological and physical outcome of stress.
Barling (1996) utilized the traditional workplace stress framework for understanding workplace violence and proposed classifying its consequences as direct and indirect. The direct consequences of workplace violence include primarily negative mood and cognitive distractions, whereas the indirect consequences stretch across many domains, impacting the individual’s well-being and mental strain in many aspects, including various psychological (e.g. depression) and psychosomatic problems (e.g. sleeping difficulties). Barling (1996) also predicted that individuals’ functioning in the organization will be impacted in many ways. For instance, experiencing workplace violence can lead to emotional exhaustion at work and a decrease in affective commitment to the workplace. The extent of the experienced outcomes also depends on various moderating factors. This model has been utilized in previous studies on workplace violence (LeBlanc and Kelloway, 2002; Schat and Kelloway, 2003), bullying (Wu et al., 2015), and cyberharassment (Ford, 2013). Furthermore, research on the consequences of cyberbullying at work aligns with this model, as victims experience almost all of the consequences mentioned above (Baruch, 2005; D’Cruz and Noronha, 2013; Farley et al., 2015; Ford, 2013; Hong et al., 2014; Kopecký and Szotkowski, 2017).
According to dysempowerment theory, dysempowerment is the process of assessing a work event as violating one’s dignity and experiencing subjective stress (Kane and Montgomery, 1998). This leads first to an affective response—for example, experiencing fear, anger, or depression—which, in turn, negatively impacts the individual’s well-being and work-related attitudes. Dysempowerment theory predicts that experiencing multiple such events will have a stronger dysempowerment effect than single instances. The same is true for affronts perceived as more severe. Various individual characteristics also influence this relationship. Dysempowerment can cause various negative effects on attitudes and behaviors, impairing individuals’ functioning in the organization in many ways, including hindering their emotional engagement in their work, organizational commitment, motivation, cooperation, innovation efforts, and trust in their employer and colleagues (Kane and Montgomery, 1998). Dysempowerment theory has been previously used in cyberbullying at work studies as it aligns with the repetitive and persistent nature of cyberbullying that violates individuals’ dignity and causes affective responses that influence one’s well-being and work-related behavior, in turn leading to negative individual and organizational consequences (Coyne et al., 2017; Farley et al., 2015).
Consequences of cyberbullying at work
The traditional workplace stress framework (Barling, 1996; Pratt and Barling, 1988) and dysempowerment theory (Kane and Montgomery, 1998) both predict that experiencing workplace violence will lead to symptoms of psychological distress. Distress refers to the negative dimension of stress, and psychological distress is defined as a multifaceted mental health phenomenon that manifests itself through decreased mental well-being with nonspecific symptoms (e.g. depression and anxiety; Drapeau et al., 2012). However, psychological distress can also include somatic symptoms (e.g. headache and insomnia) and other behavioral and functional problems (Drapeau et al., 2012). The results of previous research connect experiences of workplace cyberbullying and cyberharassment with many such problems, including mental strain and a variety of negative emotions (Coyne et al., 2017; D’Cruz and Noronha, 2013; Farley et al., 2015; Kopecký and Szotkowski, 2017; Oksanen et al., 2020; Snyman and Loh, 2015); physiological symptoms, including pain, sleep troubles, and problems with concentration (D’Cruz and Noronha, 2013; Kopecký and Szotkowski, 2017); social problems such as increased irritability and more frequent conflicts (Kopecký and Szotkowski, 2017); and mental problems such as anxiety (Baruch, 2005; D’Cruz and Noronha, 2013; Ford, 2013), depression (Ford, 2013; Hong et al., 2014), lowered self-confidence (Hong et al., 2014), and lowered optimism levels (Snyman and Loh, 2015).
Experiencing cyberbullying at work also impacts individuals’ functioning at the organization (e.g. Baruch, 2005; Coyne et al., 2017; Farley et al., 2015; Snyman and Loh, 2015). One important outcome of cyberbullying is work exhaustion. As a consequence of work-related stress, work exhaustion represents the decreased well-being factor of the three dimensions of burnout, whereas cynicism and reduced professional efficacy are more accurately defined as negative work-related attitudes (Maslach et al., 2001). Work exhaustion refers to the basic individual stress dimension of burnout (i.e. depletion of individuals’ mental resources that are exceeded by high job demands that induce work exhaustion; Taris et al., 2005). Previous research has suggested that cyberbullying can lead to work exhaustion (Oksanen et al., 2020). This aligns with the traditional workplace stress framework, which predicts emotional exhaustion at the organization to be a result of experienced workplace violence (Barling, 1996), and with the dysempowerment theory, which stresses the negative impact of violence on well-being and organizational functioning (Kane and Montgomery, 1998). Work exhaustion has been previously connected with the higher intention to leave the job (Moore, 2000) as well as with both mental and physical health problems (Toppinen-Tammer et al., 2009).
Previous research has suggested that experiencing cyberbullying leads also to lowered work engagement (Anwar et al., 2022; Muhonen et al., 2017). Work engagement is defined as a long-term positive state of work-related well-being characterized by feeling motivated, energetic, and dedicated to one’s work (Schaufeli et al., 2002). It is a crucial concept in dealing with working life challenges, as it has been found to have various positive consequences, including improving work performance (Hakanen and Koivumäki, 2014; Hakanen et al., 2008) and preventing burnout (Schaufeli et al., 2008, 2009). Therefore, the threat that cyberbullying poses to work engagement can have serious and far-reaching consequences.
Cyberbullying victimization is also associated with stress experienced due to the use of technology, namely, technostress (Oksanen et al., 2020). Technostress refers to the difficulties to manage the demands of the technology usage and is triggered by techno-stressors, which can potentially lead to strain (Ayyagari et al., 2011; Tarafdar et al., 2019). Techno-stressors include techno-invasion (i.e. the invasive effect of being constantly connected and reachable), techno-overload (i.e. having to work faster and longer because of technology), techno-complexity (i.e. feeling inadequate due to one’s skills in using technology), techno-insecurity (i.e. fearing for one’s job as a result of increasing automation or not having sufficient technological skills), and techno-uncertainty (i.e. the unsettling effect of constant technological advances causing the need for constant education; (Fischer and Riedl, 2017; Ragu-Nathan et al., 2008; Tarafdar et al., 2019). From the point of view of the present study, invasion and overload are the most relevant techno-stressors as they emphasize how technology burdens individuals while the other techno-stressors focus more on people’s perceived competence with technology. Overall, technostress can lead to many negative outcomes, including decreased job performance and job satisfaction, as well as increased burnout symptoms (Ayyagari et al., 2011; Brooks and Califf, 2017; Ragu-Nathan et al., 2008; Tarafdar et al., 2007).
Social media use and well-being at work
The effects of social media use at work on employees’ well-being depend on the frequency and purpose of the use (Cao and Yu, 2019; Oksa et al., 2021). Moderate work-related Internet use has various positive outcomes, including increased work engagement (Hakanen et al., 2011; Oksa et al., 2020, 2021; van Zoonen and Banghart, 2018). However, heavy social media use has been connected to higher technostress and work exhaustion (Oksanen et al., 2021). This result aligns with research on compulsive Internet use. It is defined as uncontrollable and continuous Internet use, characterized by preoccupation with the activity despite its negative consequences and experiencing negative psychological withdrawal reactions (Caplan, 2010; van den Eijnden et al., 2008). Compulsive Internet use has been found to decrease happiness and increase stress, anxiety, loneliness, and depression among adults (Muusses et al., 2014); it is also connected to developing a maladaptive relationship with one’s work (Quinones et al., 2016).
Furthermore, working life has been recently influenced by the COVID-19 crisis, which led to an increase in remote work (Eurofound, 2020; Oksanen et al., 2021), which can pose certain threats to well-being. Past research shows that remote work and associated professional social media use are risk factors for cyberbullying at work (Oksanen et al., 2020), psychological distress (Oksa et al., 2021), and technostress (Brooks and Califf, 2017; Oksa et al., 2021; Panisoara et al., 2020).
The impact of social media use on an individual might also be altered by the specific networks in which they are involved online. Identity bubbles are an important type of such networks characterized by strong social identification, homophily, and information bias, as their members interact with likeminded others and rely strongly on information obtained from them (Kaakinen et al., 2020; Keipi et al., 2017). Involvement in social media identity bubbles can have positive effects, as it helps satisfy the need for social belonging. For instance, it has been found to predict lower perceived loneliness and psychological distress among the working population during the COVID-19 crisis (Latikka et al., 2022). However, it may also lead to far-reaching, negative consequences for both individual and societies, as such prolonged isolation from differing opinions can ultimately lead to conflicts (Abisheva et al., 2016; Kaakinen et al., 2020). Involvement in social media bubbles has also been linked to more severe psychological consequences of experienced cyberbullying at work (Oksanen et al., 2020).
Finally, along with the factors mentioned above, personality traits can influence an individual’s well-being at work. The Big Five model is a widely used personality taxonomy (Digman, 1990; John et al., 2008) that has been applied to related studies in the past. Personality traits influence the health outcomes of stress (Bolger and Zuckerman, 1995) as well as occupational health and well-being (Code and Langan Fox, 2001; Grant and Langan-Fox, 2006). For instance, high neuroticism levels are associated with higher technostress and work exhaustion (Armon et al., 2012; Srivastava et al., 2015). Demographic factors can further influence these relationships. For example, women tend to experience more technostress (La Torre et al., 2020; Oksa et al., 2021)
This study
In this study, we aimed to investigate the effects of cyberbullying at work on employees’ well-being and mental strain using a longitudinal design that includes within- and between-person comparisons. Based on the traditional workplace stress framework (Pratt and Barling, 1988) and dysempowerment theory (Kane and Montgomery, 1998), as well as on previous research in the field (Coyne et al., 2017; Farley et al., 2015; Oksanen et al., 2020; Snyman and Loh, 2015), we identified psychological distress, work exhaustion, technostress, and work engagement as relevant indicators of employees’ well-being and strain that may be affected by experienced workplace cyberbullying. Therefore, we expected the following:
H1. Over time, an increase in cyberbullying victimization at work is associated with increased psychological distress.
H2. Over time, an increase in cyberbullying victimization at work is associated with increased work exhaustion.
H3. Over time, an increase in cyberbullying victimization at work is associated with increased technostress.
H4. Over time, an increase in cyberbullying victimization at work is associated with decreased work engagement.
We also explored the effects of remote work, compulsive social media use, involvement in social media identity bubbles, and personality traits.
Method
Participants
Participants in this study took part in the longitudinal survey collected to represent Finland’s working population. Surveys were collected every 6 months starting from mid-March 2019 (Time Point 1 [T1]; N = 1817). The response rate for the first survey was 28.3%, and an analysis of sample characteristics found no major bias in comparison to official statistics of Finland considering gender, age, and education level (Oksa et al., 2020; Oksanen et al., 2021). The participants were recontacted for follow-up surveys in autumn 2019 (T2; n = 1318), spring 2020 (T3; n = 1081), autumn 2020 (T4; n = 1152), and spring 2021 (T5; n = 1018). T3 was sent only to those who had responded to T2, but in T4 and T5, all of the original respondents were invited in order to keep the number of participants in the study as large as possible. In total, 840 respondents, or 46.23% of the original survey respondents, participated in all five surveys.
All participants had employment at T1, but some retired during the data collection. The final sample for this article includes those participants (n = 768) who held some form of employment at T5. Participants were 56.31% male and aged 18–64 at T1 (M = 43.49, standard deviation [SD] = 10.74). Among the participants, 25% held a master’s degree or higher from a university, and 21.09% occupied managerial positions. Participants were from all major occupational fields and covered all areas of mainland Finland.
The study protocol underwent a review by the Academic Ethics Committee of the Tampere region, which stated that the study does not pose ethical problems (decision number 83/2018). All participants agreed to participate in the online surveys voluntarily, and they were informed of the study’s purpose. Norstat carried out the data collection, and the data included only respondents who completed the entire survey. We conducted separate data-integrity checks for each time point to ensure participant effort. Data quality checks consisted of cross-checking various items, patterned responses checks, and nonsensical responses checks (Curran, 2016). We also checked open-ended comments to detect possible biased motives in responding. We did not find any major issues with the respondents taking part in the longitudinal survey.
Measures
Our study has four main outcome variables (i.e. psychological distress, work exhaustion, technostress, and work engagement), with cyberbullying victimization at work serving as the main predictor. Controls include a number of factors related to social media use, work characteristics, personality, and sociodemographic background.
Psychological distress
We used the 12-item General Health Questionnaire to measure psychological distress at each time point (Goldberg et al., 1997), which is a well-established measure utilized to examine mental well-being in various contexts (Gnambs and Staufenbiel, 2018). The items included, for example, “Have you recently been feeling unhappy and depressed?” “Have you recently felt constantly under strain?” and “Have you recently lost much sleep over worry?” Likert-type scoring (0–1–2–3) was applied (Banks et al., 1980), leading to a scale from 0 to 36, with higher values indicating higher psychological distress. The internal consistency of the scale was excellent at all time points (T1: ω = .92, T2: ω = .91, T3: ω = .90, T4: ω = .91, T5: ω = .92; see Table 1 for details).
Descriptive statistics of the main study variables.
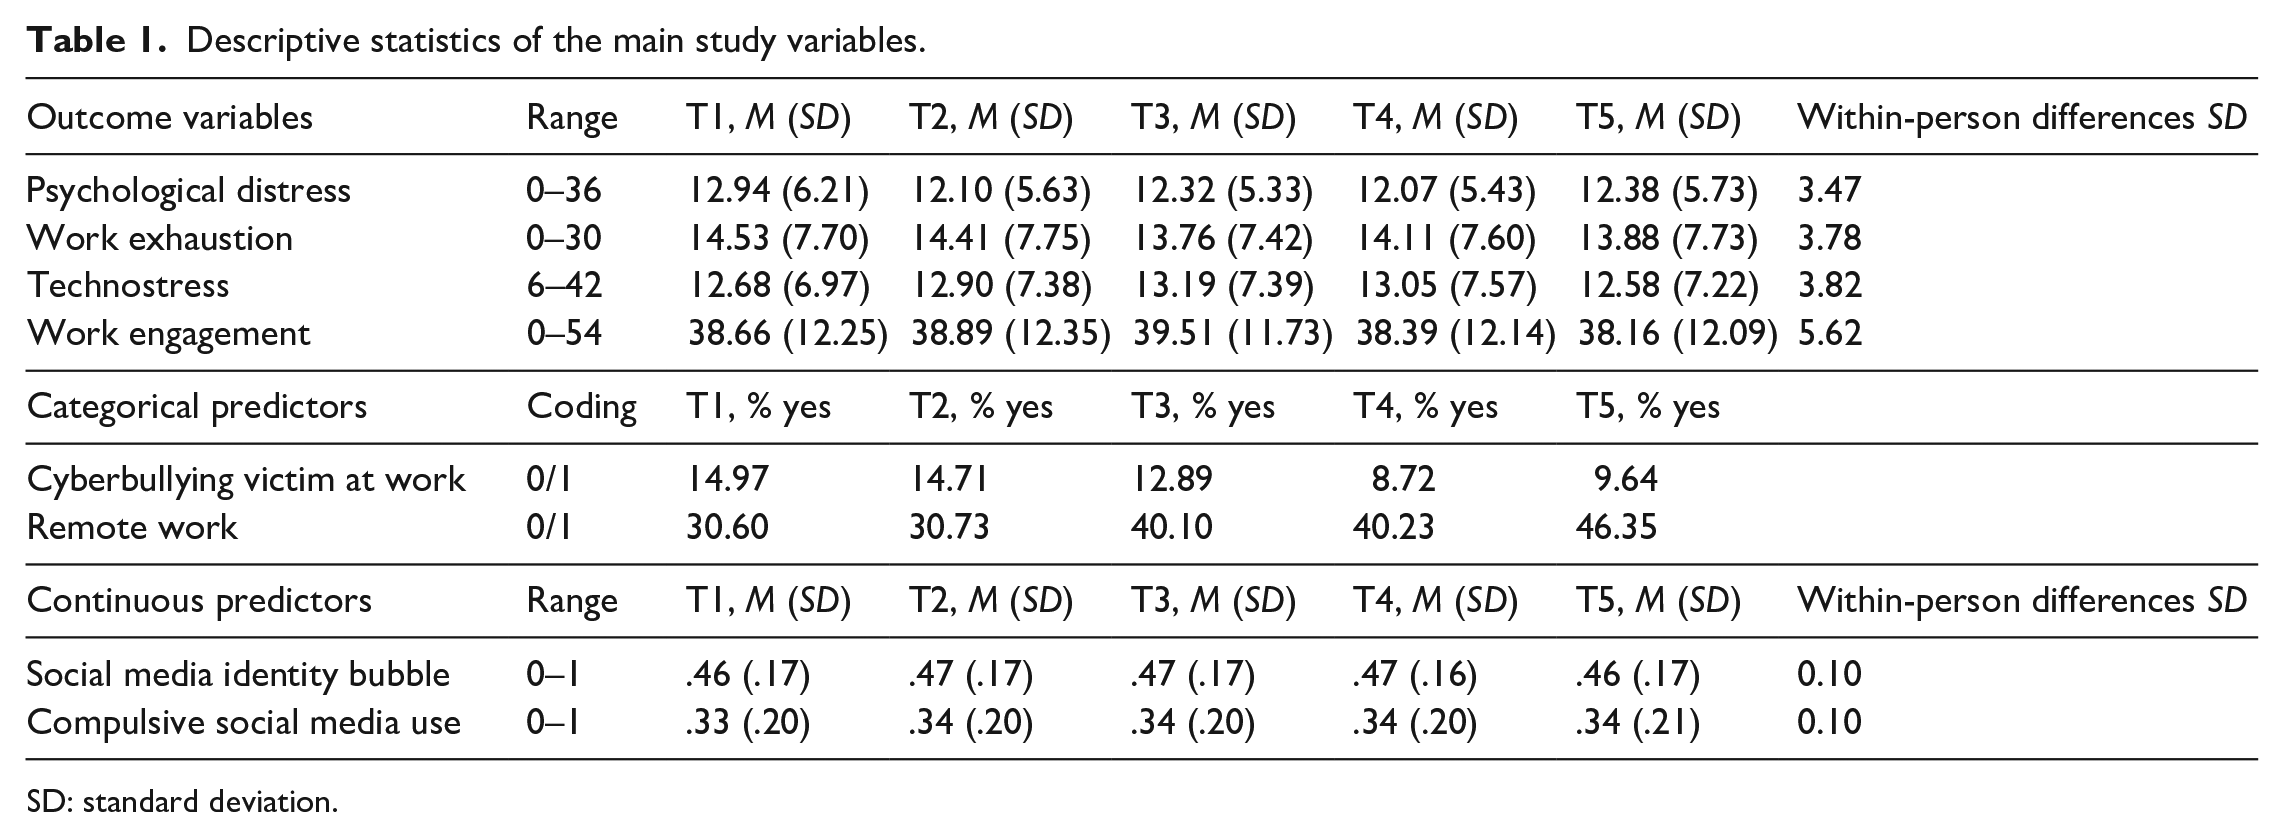
SD: standard deviation.
Work exhaustion
We utilized the 5-item exhaustion subscale of the well-established Maslach Burnout Indicator to measure work exhaustion at each time point (Maslach et al., 2018). The items included, for example, “I feel emotionally drained from my work.” By summing the five items with answer options ranging from 0 (never) to 6 (daily), we created a scale with a range of 0–30. The internal consistency of the scale was excellent at all time points (T1: ω = .93, T2: ω = .93, T3: ω = .92, T4: ω = .93, T5: ω = .93).
Technostress
We adapted six items from the techno-overload and techno-invasion subscales of Ragu-Nathan et al.’s (2008) technostress scale to measure the burdening and intrusive nature of technostress caused by social media at each time point. The items included the following: “I am forced to do more work than I can handle due to social media”; “I am forced to work with tight time schedules due to social media”; “I am forced to change my habits to adapt to new social media services”; “I have to be always available due to social media”; “I feel my personal life is being invaded by social media”; and “I have to sacrifice my time to keep current on new social media services.” The answer options ranged from 1 (disagree completely) to 7 (agree completely), so the final scale had a range of 6–42. The internal consistency of the scale was excellent at all time points (T1: ω = .89, T2: ω = .90, T3: ω = .91, T4: ω = .92, T5: ω = .91).
Work engagement
Work engagement was measured at each time point utilizing the widely used 9-item version (UWES-9; Seppälä et al., 2009) of the Utrecht Work Engagement Scale (UWES; Schaufeli et al., 2006). The items included, for example, “I am enthusiastic about my job.” Of the nine items with answer options ranging from 0 (never) to 6 (daily), we created a composite variable with a range of 0–54 for the analysis. The internal consistency of the scale was excellent in all time points (T1: ω = .96, T2: ω = .96, T3: ω = .96, T4: ω = .96, T5: ω = .96).
Cyberbullying victimization at work
We measured cyberbullying victimization at work using a 10-item scale adapted from the Cyberbullying Behavior Questionnaire (Forssell, 2016; Oksanen et al., 2020). Items related to insulting, harassing, and threatening behaviors experienced by participants at their work, such as “Necessary information has been withheld, making your work more difficult (e.g. being excluded from email lists),” “False statements about you have been spread on the Internet,” and “Aggressively worded messages (e.g. capital letters, bold style, or multiple exclamation marks) have been sent to you via email, text messages, or the like.” We created a dummy variable from the options and analyzed those who had been victims of cyberbullying at least monthly. The internal consistency of the scale was excellent at all time points (T1: ω = .94, T2: ω = .95, T3: ω = .93, T4: ω = .93, T5: ω = .95).
Social media identity bubble
Involvement in social media identity bubbles was measured using the 6-item Identity Bubble Reinforcement Scale (Kaakinen et al., 2020). Involvement in identity bubbles is linked to strong social identification, homophily, and reliance on information from others in the group. The scale included statements such as “In social media, I belong to a community or communities that I’m proud of”; “In social media, I prefer interacting with people who share similar interests with me”; and “In social media, I trust the information that is shared with me,” with response options ranging from 1 (does not describe me at all) to 7 (describes me completely). The original scale had a range of 6–42, but the scale was normalized to have a range of 0–1 for this study. The internal consistency of the scale was good at all time points (T1: ω = .84, T2: ω = .82, T3: ω = .83, T4: ω = .83, T5: ω = .85).
Compulsive social media use
We measured compulsive social media use using a 3-item short Compulsive Internet Use Scale (Meerkerk et al., 2009) adapted to describe social media use, as this is the main focus in our work. The scale included the statements “I find it difficult to stop using social media when I am using it”; “I think about social media, even when I am not on social media”; and “I think I should use social media less often,” with response options ranging from 1 (disagree completely) to 7 (agree completely). The original scale had a range of 3–21, but the scale was normalized to have a range of 0–1. The scale’s internal consistency was good at all time points (T1: ω = .86, T2: ω = .86, T3: ω = .87, T4: ω = .86, T5: ω = .88).
Remote work
We measured remote work with a question that asked whether respondents worked remotely at least some days each month. Those who indicated that they worked remotely at least sometimes were considered remote workers.
Control variables
Control variables included the respondent’s gender, age, education level (master’s degree or higher), and managerial position. We also measured personality using the 15-item Big Five Inventory (Hahn et al., 2012). For all five traits, all items had responses ranging from 1 (does not describe me at all) to 7 (describes me completely). The scales for all traits ranged from 3 to 21, and they were normalized to range from 0 to 1 for the models: openness (M = 0.70; SD = 0.16), conscientiousness (M = 0.75; SD = 0.14), extroversion (M = 0.64; SD = 0.21), agreeableness (M = 0.69; SD = 0.14), and neuroticism (M = 0.56; SD = 0.17). The internal consistency of the traits varied from acceptable (openness: ω = .70, conscientiousness ω = .70, agreeableness: ω = .60, neuroticism: ω = .71) to good (extroversion: ω = .88). We also used information about occupational area. The question was based on responses from the participants on the field that was closest to their work or study from the list of International Standard Industrial Classification of All Economic Activities (Official Statistics of Finland, 2008; United Nations, 2008). We did not find any major differences between the main fields, and we did not include occupational area in the main statistical models.
Statistical techniques
We conducted statistical analyses with Stata 16.1. The descriptive results include descriptive figures of the study’s main variables, including means and standard deviations reported in Table 1 and Pearson correlation coefficients and p values reported in Appendix 1. We also provided standard deviation figures for whole-panel data for within-person variables, as well as information about general changes in our main variables on interest. These results are based on multilevel fixed-effects regression models. We also employed multilevel random-effects logistic regression models to investigate whether there were any differences in the likelihood of being a victim of cyberbullying based on different sociodemographic factors and occupational fields. We only report these additional analyses in the main text.
The main analyses concentrated on the longitudinal effects of cyberbullying at work on well-being and strain—namely, psychological distress, work exhaustion, technostress, and work engagement—using linear multilevel hybrid models. Hybrid models allow for the estimation of the within-person effect of time-variant variables while considering between-person effects. Hybrid models are considered to solve common issues related to the standard random- and fixed-effects approaches, and they combine strengths of both (Schunck, 2013; Schunck and Perales, 2017). We used the hybrid command to run the analysis (Schunck and Perales, 2017).
The hybrid modeling strategy allowed us to investigate both the long-term influence of cyberbullying on the victims and the differences between cyberbullying victims and unaffected employees. Within our model, all main time-variant variables had within- and between-person effects. The models also included a number of control variables. Our main interest was in the within- and between-person effects of cyberbullying victimization at work on the dependent variables. All models include 768 participants and up to 3840 observations per model.
Results
Our descriptive results showed some changes in prevalence of victimization to cyberbullying at work over time. Before the COVID-19 crisis at T1 and T2, approximately 15% of respondents reported being victims of cyberbullying at work, but the prevalence decreased to 12% at T3 and less than 10% at T4 and T5. Analysis based on fixed-effects logistic regression showed that this decrease is statistically significant in T4 and T5 (both p < .001) compared to previous time points. At the same time, remote work increased due to the COVID-19 crisis, but well-being and strain among workers remained relatively stable. There was a statistically significant decrease in psychological distress. Decrease occurred already at T2 (p < .001), and there were no statistically significant changes after that according to fixed-effects linear regression models. Work exhaustion was lower during the COVID-19 crisis in T3–T5 in comparison to T1 (T3: p < .001, T4: p = .034, T5: p = .001).
Main analyses based on hybrid models showed robust findings on the detrimental effects of cyberbullying at work (see Table 2). We found the within-person effects of cyberbullying victimization at work on higher psychological distress (B = 1.34, p < .001), work exhaustion (B = 0.84, p = .032), technostress (B = 1.01, p = .002), and lower work engagement (B = −2.93, p < .001). The effect of cyberbullying victimization on work exhaustion was smaller than for other strain variables, but it was also statistically significant. Thus, a change in cyberbullying victimization at work status from nonvictim to victim, or, in other words, becoming a cyberbullying victim, resulted in increased strain over the follow-up period in multiple measurements, as compared to strain levels from before the victimization.
Hybrid multilevel models explaining well-being.
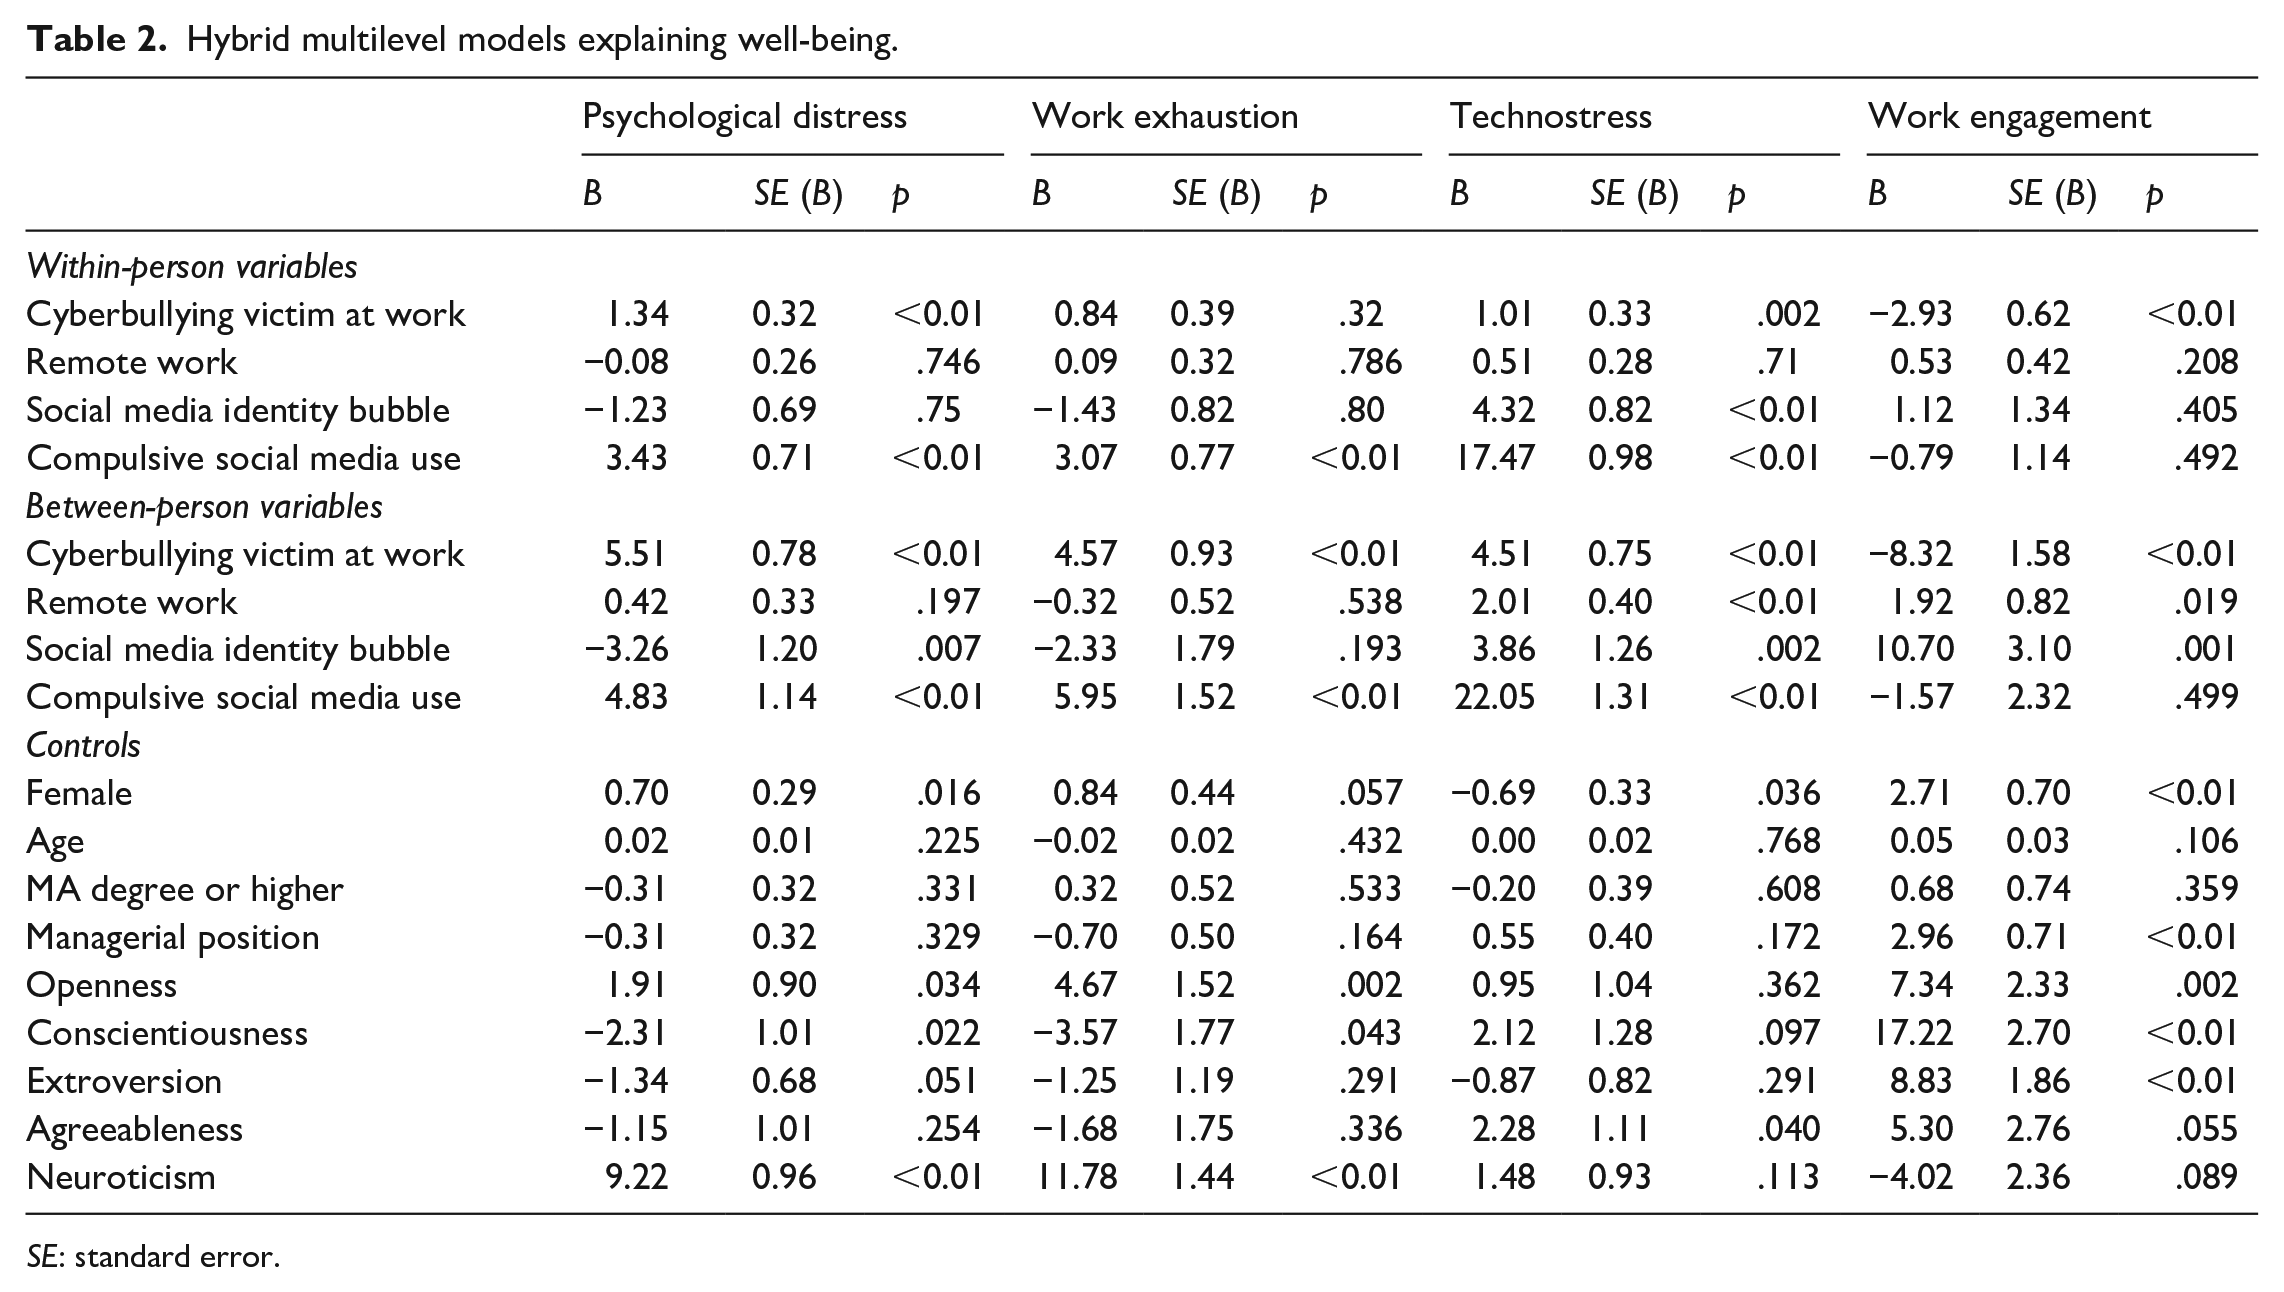
SE: standard error.
We also found between-person effects showing overall differences between nonvictims and victims of cyberbullying. Compared to unaffected employees—in other words, those who were not victims—victims of cyberbullying at work were more psychologically distressed (B = 5.51, p < .001), were more exhausted at work (B = 4.57, p < .001), were more technostressed (B = 4.51, p < .001), and had lower work engagement (B = −8.32, p < .001). These effects of cyberbullying on its victims, as compared to nonvictims, could be considered strong.
Out of all the covariates, more intensive involvement in social media identity bubbles had a within-person effect on increased technostress (B = 4.32, p < .001), and higher compulsive social media use had a within-person effect on increased psychological distress (B = 3.43, p < .001), work exhaustion (B = 3.07; p < .001), and technostress (B = 17.47, p < .001). Thus, over time, the increase in involvement in social media identity bubbles and in compulsive social media use led to an increase in some strain indicators. There were also some significant between-person effects, as remote workers reported higher technostress (B = 2.01, p < .001) and work engagement (B = 1.92, p = .019) compared to nonremote workers. Participants with stronger involvement in social media identity bubbles reported lower psychological distress (B = −3.26, p = .007) and higher technostress (B = 3.86, p = .002) and work engagement (B = 10.70, p = .001). Participants who received higher compulsive social media use scores received higher psychological distress (B = 4.83, p < .001), work exhaustion (B = 5.95, p < .001), and technostress scores (B = 22.05, p < .001).
Out of the control variables, women reported higher psychological distress (B = 0.70, p = .16), lower technostress (B = −0.69, p = .036), and higher work engagement (B = 2.71, p < .001). Those in managerial positions reported higher work engagement (B = 2.96, p < .001). Openness was associated with higher psychological distress (B = 1.91, p = .034), higher work exhaustion (B = 4.67, p = .002), and higher work engagement (B = 7.34, p = .002). Conscientiousness was associated with lower psychological distress (B = −2.31, p = .022) and lower work exhaustion (B = −3.57, p = .043) and work engagement (B = 17.22, p < .001). Extroversion was associated with higher work engagement (B = 8.83, p < .001), and agreeableness was associated with higher technostress (B = 2.28, p = .040). Neuroticism was associated with higher psychological distress (B = 9.22, p < .001) and work exhaustion (B = 11.78, p < .001).
As an additional analysis, we checked with multilevel random-effects logistic regression models whether there were any differences in background variables for being a victim of cyberbullying at work. There were no statistically significant differences in gender and education. We also found no statistically significant differences between occupational fields on the prevalence of cyberbullying victimization at work. Younger age was associated with a higher likelihood of becoming a victim. In comparison with 45-year-olds and older, younger participants had a higher risk of being victims of cyberbullying at work than older participants (B = 0.72, OR = 2.06, p < .001). Also, those who were in a managerial position in T1 reported being victims of cyberbullying at work significantly more often than others (B = 1.08, OR = 1.38, p < .001).
Discussion
In this study, we investigated the longitudinal effects of cyberbullying at work on well-being and strain using a theoretical framework combining the traditional workplace stress framework (Pratt and Barling, 1988) and dysempowerment theory (Kane and Montgomery, 1998). Our findings showed robust evidence that cyberbullying victimization at work has negative consequences for workers over time. Within-person increases of cyberbullying at work were associated with higher psychological distress, higher work exhaustion, higher technostress, and lower work engagement. Between-person effects allowed us to compare the victims and nonvictims, showing that victims reported more psychological distress, work exhaustion, technostress, and lower work engagement. These results are compatible with theoretical assumptions drawn from both the traditional workplace stress framework (Pratt & Barling, 1988) and dysempowerment theory (Kane and Montgomery, 1998).
Our results, which consider the detrimental effects of compulsive social media use, align with previous studies (Muusses et al., 2014; Quinones et al., 2016) on compulsive Internet use in general. Both within- and between-person comparisons confirmed its negative impact on distress, technostress, and work exhaustion levels, thus providing fresh longitudinal evidence to the field. Hence, spreading awareness and knowledge on how to recognize and combat compulsive Internet and social media use is essential. Moreover, results on involvement in social media identity bubbles showed that within- and between-person effects were associated with increased technostress. This is an important result, especially as previous research has identified involvement in social media identity bubbles to be a risk factor for serious psychological consequences of cyberbullying at work (Oksanen et al., 2020). Therefore, even though participants involved in identity bubbles reported lower psychological distress and higher work engagement than others, social media identity bubbles should still be treated as potentially harmful to the individual.
Our results on the impact of remote work on well-being highlight both the opportunities and challenges associated with working away from the office. Remote workers reported higher levels of work engagement, which can be explained by the freedom and flexibility associated with this type of work, as shown in previous studies (Hakanen et al., 2011). However, as expected and based on past research (Oksa et al., 2021; Panisoara et al., 2020), remote workers also reported higher levels of technostress. We did not find any other significant effects of remote work in this study.
Furthermore, well-being and strain were influenced by personality, gender, and one’s position in the organization. Managers seemed better off with higher work engagement, which can be explained by factors such as their higher work autonomy. Extroversion, openness, and conscientiousness were also positively associated with higher work engagement. Open and neurotic people were more likely and conscientious people were less likely to be strained by work or in general, whereas agreeable people were more likely stressed due to techno-stressors. These results provide a glimpse into the complex connections between personality factors and well-being. Because individual differences, such as personality traits and gender, can affect individuals’ functioning in the organization, it is important that interventions aimed at tackling workplace well-being and strain problems contain a certain level of flexibility, providing space for the realization of employees’ varying needs. This is especially important because various work-related inequalities may be reinforced in the COVID-19 crisis environment. For instance, it seems that the crisis caused more problems in working life for women than for men (Lyttelton et al., 2020; Milliken et al., 2020). Our results indicate that women had higher work engagement and lower technostress but higher psychological distress than men.
The results of this study highlight the negative effects that cyberbullying has on employees and, consequently, on organizations. As our findings highlight, cyberbullying can have a severe impact on employees’ mental health. It can erode trust, cohesion, and collaboration of the work community and, as a result, have financial implications for the organizations if employees are, for example, dissatisfied, absent, performing poorer, or about to resign (Baruch, 2005; Coyne et al., 2017; Kowalski et al., 2018). Previous studies have suggested that characteristics of a work environment may impact the chance that cyberbullying will occur. For instance, cyberbullying at work has been associated positively with other stressors in the work environment—for example, organizational change or team conflict (Vranjes et al., 2017)—and negatively with perceived organizational support and perceived effectiveness of a workplace’s anti-bullying strategy (Gardner et al., 2016). Moreover, low support from supervisors is a risk factor for cyberbullying victimization at work (Oksanen et al., 2020). Therefore, organizations could mitigate the risk of cyberbullying by mindfully navigating these challenges. Training programs focused on detecting and dealing with stress (Snyman and Loh, 2015) and emotion regulation (Vranjes et al., 2017) can also decrease cyberbullying and aid workers in coping with it when it happens.
The study also provides a significant theoretical contribution, thus demonstrating the usefulness of traditional workplace stress framework (Pratt & Barling, 1988) and dysempowerment theory (Kane and Montgomery, 1998) in understanding the consequences of experiencing workplace cyberbullying. Although both theories were previously used in research focusing on cyberbullying and related factors (Coyne et al., 2017; Farley et al., 2015; Ford, 2013), such studies are still scarce and sometimes provide only partial support for the theories (Coyne et al., 2017; Farley et al., 2015). Acquiring more evidence on the matter is crucial, as cyberbullying constitutes an increasingly important research topic. This study successfully combined the traditional workplace stress framework and dysempowerment theory, providing a comprehensive theoretical approach that can be utilized in future research.
One positive aspect of our results was that cyberbullying at work decreased during the COVID-19 era from spring 2020 to spring 2021, compared to before the COVID-19 outbreak. There are multiple reasons for this, but increased remote work is one potential cause. Within our study, workers reported less work exhaustion during the COVID-19 era—a finding that was also reported in previous research from spring 2020 (Oksanen et al., 2021). Thus, it is possible that, during the COVID-19 crisis, remote work, the lack of commute, and more distant work relationships led to lower tensions at work, which in turn had some positive effects for employees, at least in Finland. Another reason for the decline of cyberbullying might be the growing public discussion around the dangers of cyberbullying and cyberharassment. However, these reasons are beyond the scope of our study. The positive findings of this study are very important, as the mental health of European employees has declined during the COVID-19 pandemic (Eurofound, 2021). Nevertheless, cyberbullying at work remains a significant problem, and it is crucial to find ways to prevent it.
Strengths and weaknesses
A significant strength of the study is its longitudinal design, which included five time points stretched across a period of more than 2 years. This design allowed us to capture the changes and outcomes of experienced cyberbullying at work, as well as the COVID-19 crisis. Our conclusions are further strengthened by the use of hybrid regression modeling, as we obtained similar results from two complementary perspectives: within- and between-person comparisons. However, because our sample included only Finnish workers, any generalizations of the results beyond the Finnish environment should be approached with caution. Longitudinal studies, including participants from a wider variety of cultural spheres, are needed to further advance our understanding of the consequences of cyberbullying at work.
Conclusion
Although cyberbullying at work has recently gained attention, this was the first study to use a longitudinal design to investigate the impact of cyberbullying at work on well-being and strain. We demonstrated the various negative outcomes that victims face: increased psychological distress, technostress, work exhaustion, and decreased work engagement. These consequences are detrimental not only to individuals but to organizations as a whole. Moreover, the results we obtained show how well-being and strain are influenced by remote work, involvement in social media identity bubbles, and compulsive social media use. Mindfully navigating the challenges that come with the use of ICTs is an important task for organizations. In particular, preventing cyberbullying is a crucial goal, which, if not addressed properly, can constitute a difficult, organization-wide problem.
Footnotes
Appendix 1
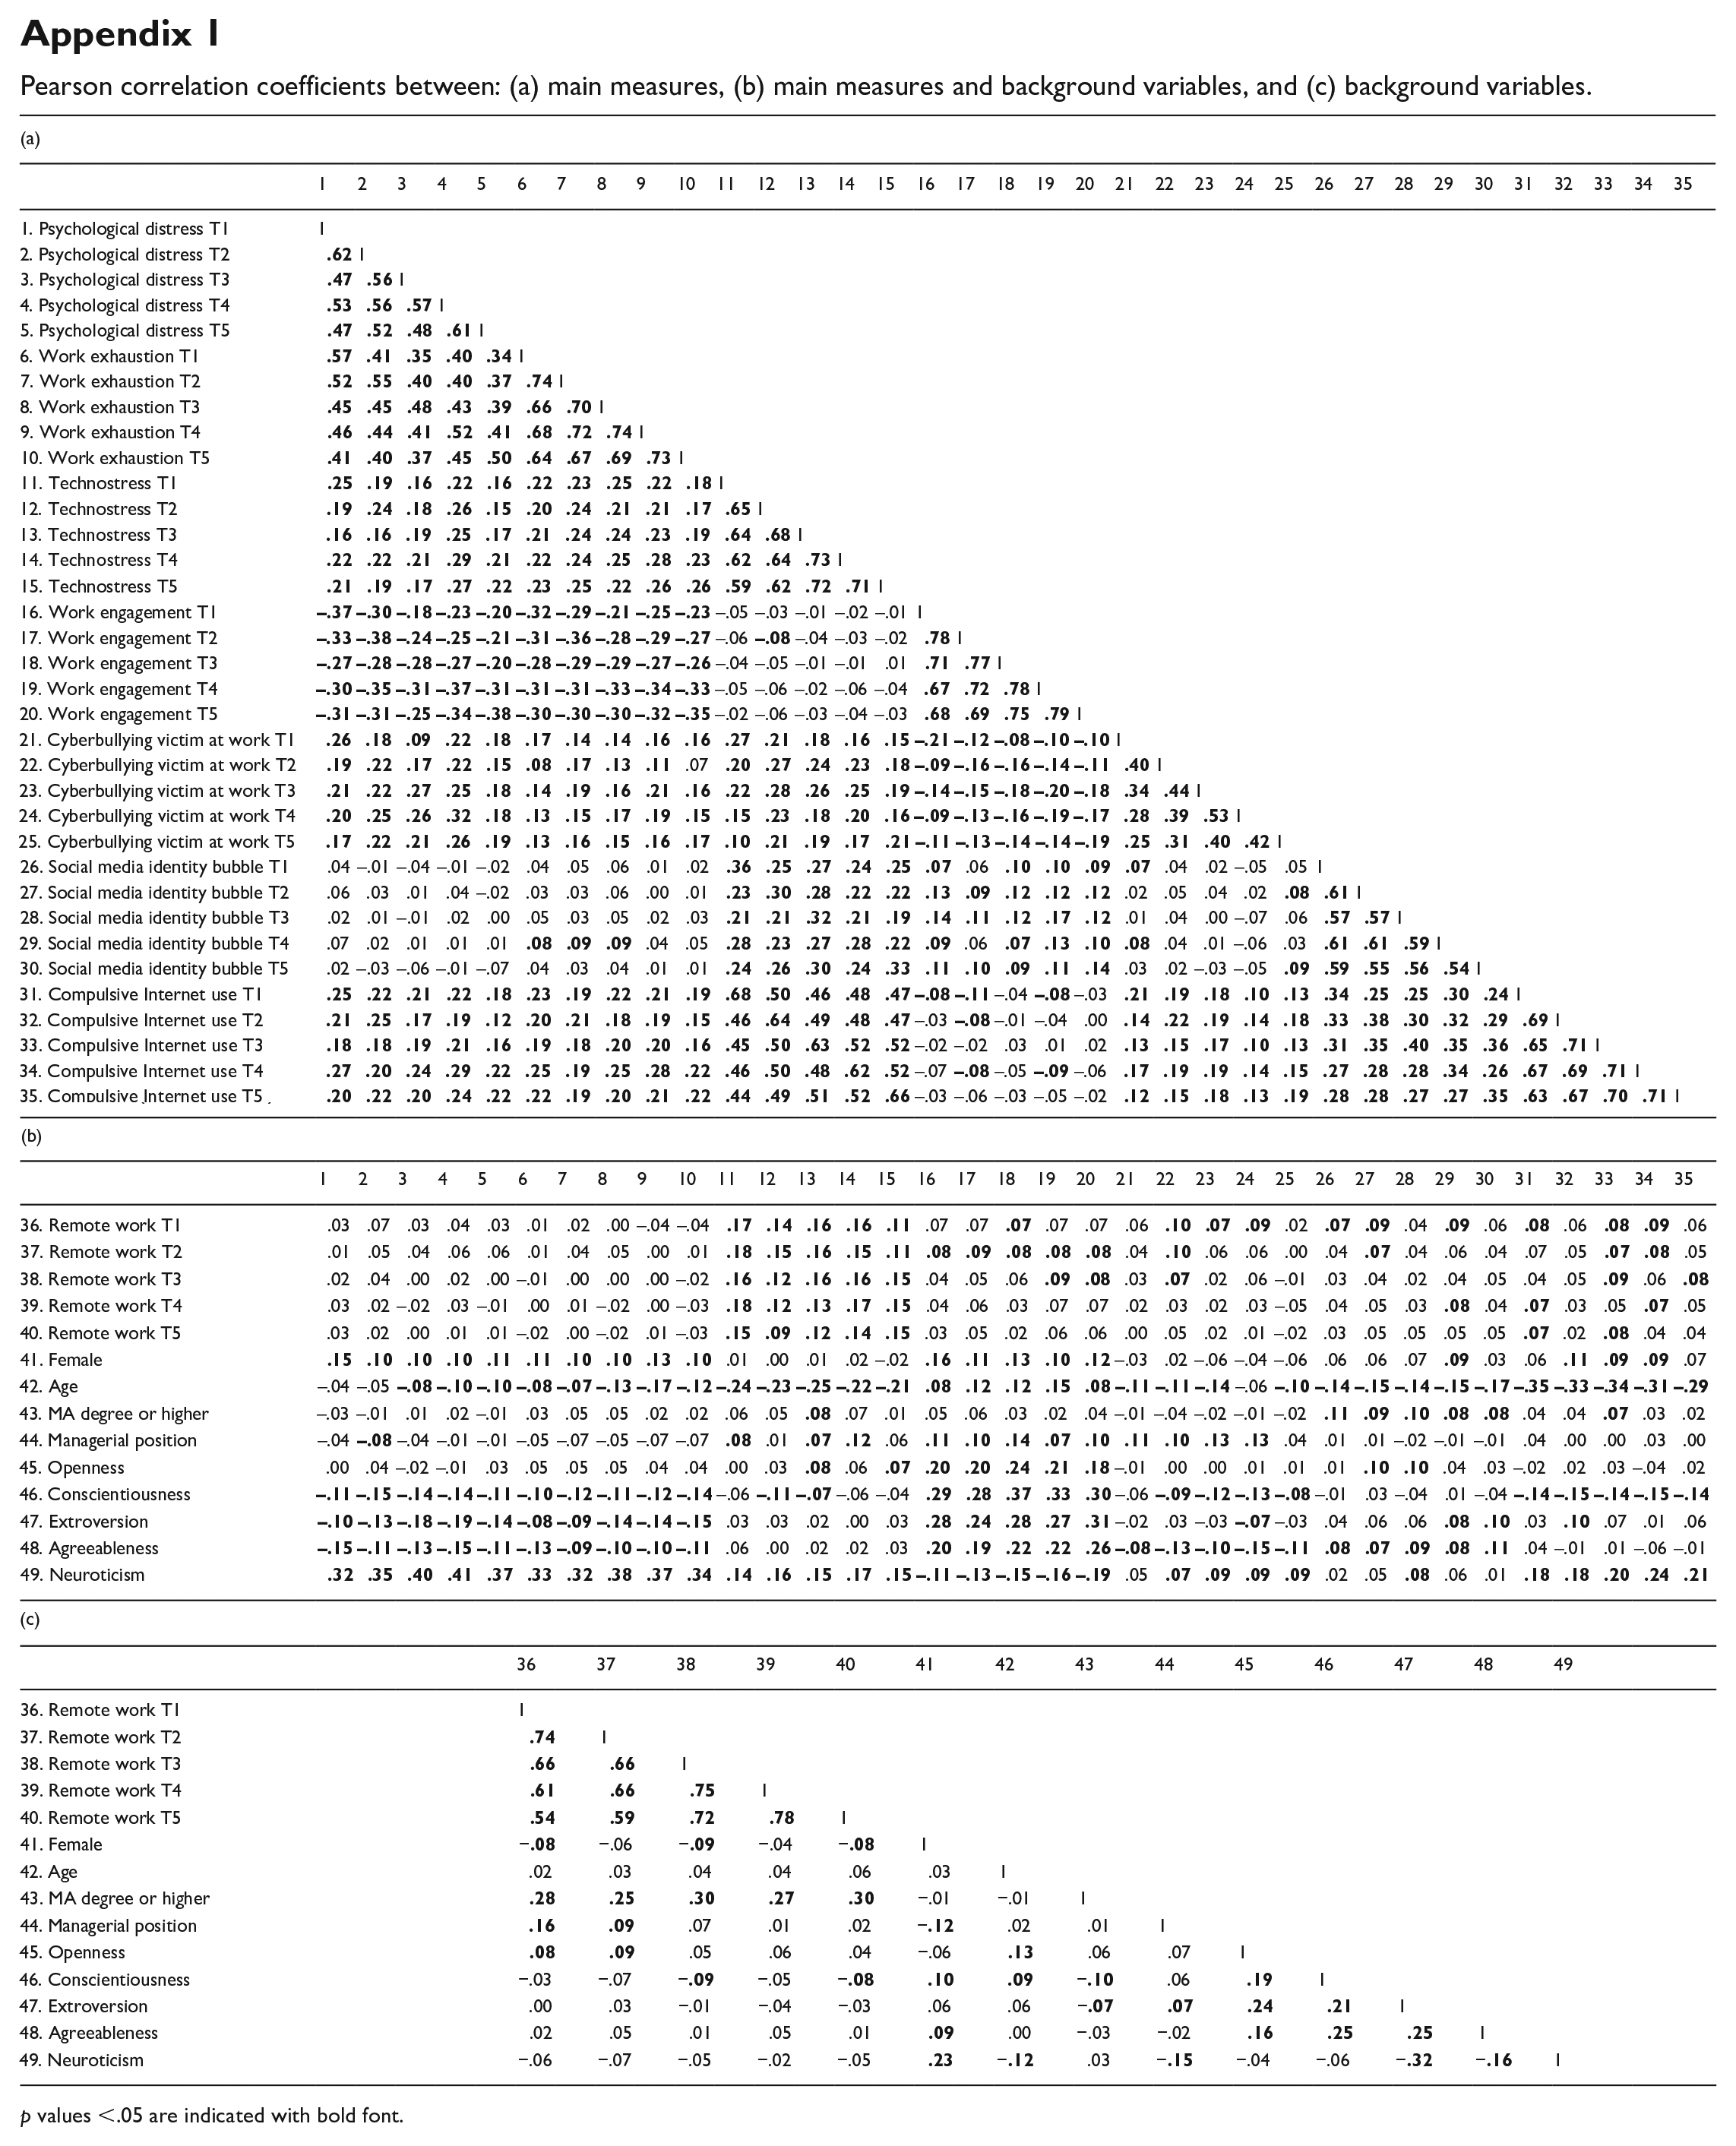
Pearson correlation coefficients between: (a) main measures, (b) main measures and background variables, and (c) background variables.
| (a) | |||||||||||||||||||||||||||||||||||
|---|---|---|---|---|---|---|---|---|---|---|---|---|---|---|---|---|---|---|---|---|---|---|---|---|---|---|---|---|---|---|---|---|---|---|---|
| 1 | 2 | 3 | 4 | 5 | 6 | 7 | 8 | 9 | 10 | 11 | 12 | 13 | 14 | 15 | 16 | 17 | 18 | 19 | 20 | 21 | 22 | 23 | 24 | 25 | 26 | 27 | 28 | 29 | 30 | 31 | 32 | 33 | 34 | 35 | |
| 1. Psychological distress T1 | 1 | ||||||||||||||||||||||||||||||||||
| 2. Psychological distress T2 |
|
1 | |||||||||||||||||||||||||||||||||
| 3. Psychological distress T3 |
|
|
1 | ||||||||||||||||||||||||||||||||
| 4. Psychological distress T4 |
|
|
|
1 | |||||||||||||||||||||||||||||||
| 5. Psychological distress T5 |
|
|
|
|
1 | ||||||||||||||||||||||||||||||
| 6. Work exhaustion T1 |
|
|
|
|
|
1 | |||||||||||||||||||||||||||||
| 7. Work exhaustion T2 |
|
|
|
|
|
|
1 | ||||||||||||||||||||||||||||
| 8. Work exhaustion T3 |
|
|
|
|
|
|
|
1 | |||||||||||||||||||||||||||
| 9. Work exhaustion T4 |
|
|
|
|
|
|
|
|
1 | ||||||||||||||||||||||||||
| 10. Work exhaustion T5 |
|
|
|
|
|
|
|
|
|
1 | |||||||||||||||||||||||||
| 11. Technostress T1 |
|
|
|
|
|
|
|
|
|
|
1 | ||||||||||||||||||||||||
| 12. Technostress T2 |
|
|
|
|
|
|
|
|
|
|
|
1 | |||||||||||||||||||||||
| 13. Technostress T3 |
|
|
|
|
|
|
|
|
|
|
|
|
1 | ||||||||||||||||||||||
| 14. Technostress T4 |
|
|
|
|
|
|
|
|
|
|
|
|
|
1 | |||||||||||||||||||||
| 15. Technostress T5 |
|
|
|
|
|
|
|
|
|
|
|
|
|
|
1 | ||||||||||||||||||||
| 16. Work engagement T1 |
|
|
|
|
|
|
|
|
|
|
–.05 | –.03 | –.01 | –.02 | –.01 | 1 | |||||||||||||||||||
| 17. Work engagement T2 |
|
|
|
|
|
|
|
|
|
|
–.06 |
|
–.04 | –.03 | –.02 |
|
1 | ||||||||||||||||||
| 18. Work engagement T3 |
|
|
|
|
|
|
|
|
|
|
–.04 | –.05 | –.01 | –.01 | .01 |
|
|
1 | |||||||||||||||||
| 19. Work engagement T4 |
|
|
|
|
|
|
|
|
|
|
–.05 | –.06 | –.02 | –.06 | –.04 |
|
|
|
1 | ||||||||||||||||
| 20. Work engagement T5 |
|
|
|
|
|
|
|
|
|
|
–.02 | –.06 | –.03 | –.04 | –.03 |
|
|
|
|
1 | |||||||||||||||
| 21. Cyberbullying victim at work T1 |
|
|
|
|
|
|
|
|
|
|
|
|
|
|
|
|
|
|
|
|
1 | ||||||||||||||
| 22. Cyberbullying victim at work T2 |
|
|
|
|
|
|
|
|
|
.07 |
|
|
|
|
|
|
|
|
|
|
|
1 | |||||||||||||
| 23. Cyberbullying victim at work T3 |
|
|
|
|
|
|
|
|
|
|
|
|
|
|
|
|
|
|
|
|
|
|
1 | ||||||||||||
| 24. Cyberbullying victim at work T4 |
|
|
|
|
|
|
|
|
|
|
|
|
|
|
|
|
|
|
|
|
|
|
|
1 | |||||||||||
| 25. Cyberbullying victim at work T5 |
|
|
|
|
|
|
|
|
|
|
|
|
|
|
|
|
|
|
|
|
|
|
|
|
1 | ||||||||||
| 26. Social media identity bubble T1 | .04 | –.01 | –.04 | –.01 | –.02 | .04 | .05 | .06 | .01 | .02 |
|
|
|
|
|
|
.06 |
|
|
|
|
.04 | .02 | –.05 | .05 | 1 | |||||||||
| 27. Social media identity bubble T2 | .06 | .03 | .01 | .04 | –.02 | .03 | .03 | .06 | .00 | .01 |
|
|
|
|
|
|
|
|
|
|
.02 | .05 | .04 | .02 |
|
|
1 | ||||||||
| 28. Social media identity bubble T3 | .02 | .01 | –.01 | .02 | .00 | .05 | .03 | .05 | .02 | .03 |
|
|
|
|
|
|
|
|
|
|
.01 | .04 | .00 | –.07 | .06 |
|
|
1 | |||||||
| 29. Social media identity bubble T4 | .07 | .02 | .01 | .01 | .01 |
|
|
|
.04 | .05 |
|
|
|
|
|
|
.06 |
|
|
|
|
.04 | .01 | –.06 | .03 |
|
|
|
1 | ||||||
| 30. Social media identity bubble T5 | .02 | –.03 | –.06 | –.01 | –.07 | .04 | .03 | .04 | .01 | .01 |
|
|
|
|
|
|
|
|
|
|
.03 | .02 | –.03 | –.05 |
|
|
|
|
|
1 | |||||
| 31. Compulsive Internet use T1 |
|
|
|
|
|
|
|
|
|
|
|
|
|
|
|
|
|
–.04 |
|
–.03 |
|
|
|
|
|
|
|
|
|
|
1 | ||||
| 32. Compulsive Internet use T2 |
|
|
|
|
|
|
|
|
|
|
|
|
|
|
|
–.03 |
|
–.01 | –.04 | .00 |
|
|
|
|
|
|
|
|
|
|
|
1 | |||
| 33. Compulsive Internet use T3 |
|
|
|
|
|
|
|
|
|
|
|
|
|
|
|
–.02 | –.02 | .03 | .01 | .02 |
|
|
|
|
|
|
|
|
|
|
|
|
1 | ||
| 34. Compulsive Internet use T4 |
|
|
|
|
|
|
|
|
|
|
|
|
|
|
|
–.07 |
|
–.05 |
|
–.06 |
|
|
|
|
|
|
|
|
|
|
|
|
|
1 | |
| 35. Compulsive Internet use T5 |
|
|
|
|
|
|
|
|
|
|
|
|
|
|
|
–.03 | –.06 | –.03 | –.05 | –.02 |
|
|
|
|
|
|
|
|
|
|
|
|
|
|
1 |
| (b) | |||||||||||||||||||||||||||||||||||
| 1 | 2 | 3 | 4 | 5 | 6 | 7 | 8 | 9 | 10 | 11 | 12 | 13 | 14 | 15 | 16 | 17 | 18 | 19 | 20 | 21 | 22 | 23 | 24 | 25 | 26 | 27 | 28 | 29 | 30 | 31 | 32 | 33 | 34 | 35 | |
| 36. Remote work T1 | .03 | .07 | .03 | .04 | .03 | .01 | .02 | .00 | –.04 | –.04 |
|
|
|
|
|
.07 | .07 |
|
.07 | .07 | .06 |
|
|
|
.02 |
|
|
.04 |
|
.06 |
|
.06 |
|
|
.06 |
| 37. Remote work T2 | .01 | .05 | .04 | .06 | .06 | .01 | .04 | .05 | .00 | .01 |
|
|
|
|
|
|
|
|
|
|
.04 |
|
.06 | .06 | .00 | .04 |
|
.04 | .06 | .04 | .07 | .05 |
|
|
.05 |
| 38. Remote work T3 | .02 | .04 | .00 | .02 | .00 | –.01 | .00 | .00 | .00 | –.02 |
|
|
|
|
|
.04 | .05 | .06 |
|
|
.03 |
|
.02 | .06 | –.01 | .03 | .04 | .02 | .04 | .05 | .04 | .05 |
|
.06 |
|
| 39. Remote work T4 | .03 | .02 | –.02 | .03 | –.01 | .00 | .01 | –.02 | .00 | –.03 |
|
|
|
|
|
.04 | .06 | .03 | .07 | .07 | .02 | .03 | .02 | .03 | –.05 | .04 | .05 | .03 |
|
.04 |
|
.03 | .05 |
|
.05 |
| 40. Remote work T5 | .03 | .02 | .00 | .01 | .01 | –.02 | .00 | –.02 | .01 | –.03 |
|
|
|
|
|
.03 | .05 | .02 | .06 | .06 | .00 | .05 | .02 | .01 | –.02 | .03 | .05 | .05 | .05 | .05 |
|
.02 |
|
.04 | .04 |
| 41. Female |
|
|
|
|
|
|
|
|
|
|
.01 | .00 | .01 | .02 | –.02 |
|
|
|
|
|
–.03 | .02 | –.06 | –.04 | –.06 | .06 | .06 | .07 |
|
.03 | .06 |
|
|
|
.07 |
| 42. Age | –.04 | –.05 |
|
|
|
|
|
|
|
|
|
|
|
|
|
|
|
|
|
|
|
|
|
–.06 |
|
|
|
|
|
|
|
|
|
|
|
| 43. MA degree or higher | –.03 | –.01 | .01 | .02 | –.01 | .03 | .05 | .05 | .02 | .02 | .06 | .05 |
|
.07 | .01 | .05 | .06 | .03 | .02 | .04 | –.01 | –.04 | –.02 | –.01 | –.02 |
|
|
|
|
|
.04 | .04 |
|
.03 | .02 |
| 44. Managerial position | –.04 |
|
–.04 | –.01 | –.01 | –.05 | –.07 | –.05 | –.07 | –.07 |
|
.01 |
|
|
.06 |
|
|
|
|
|
|
|
|
|
.04 | .01 | .01 | –.02 | –.01 | –.01 | .04 | .00 | .00 | .03 | .00 |
| 45. Openness | .00 | .04 | –.02 | –.01 | .03 | .05 | .05 | .05 | .04 | .04 | .00 | .03 |
|
.06 |
|
|
|
|
|
|
–.01 | .00 | .00 | .01 | .01 | .01 |
|
|
.04 | .03 | –.02 | .02 | .03 | –.04 | .02 |
| 46. Conscientiousness |
|
|
|
|
|
|
|
|
|
|
–.06 |
|
|
–.06 | –.04 |
|
|
|
|
|
–.06 |
|
|
|
|
–.01 | .03 | –.04 | .01 | –.04 |
|
|
|
|
|
| 47. Extroversion |
|
|
|
|
|
|
|
|
|
|
.03 | .03 | .02 | .00 | .03 |
|
|
|
|
|
–.02 | .03 | –.03 |
|
–.03 | .04 | .06 | .06 |
|
|
.03 |
|
.07 | .01 | .06 |
| 48. Agreeableness |
|
|
|
|
|
|
|
|
|
|
.06 | .00 | .02 | .02 | .03 |
|
|
|
|
|
|
|
|
|
|
|
|
|
|
|
.04 | –.01 | .01 | –.06 | –.01 |
| 49. Neuroticism |
|
|
|
|
|
|
|
|
|
|
|
|
|
|
|
|
|
|
|
|
.05 |
|
|
|
|
.02 | .05 |
|
.06 | .01 |
|
|
|
|
|
| (c) | |||||||||||||||||||||||||||||||||||
| 36 | 37 | 38 | 39 | 40 | 41 | 42 | 43 | 44 | 45 | 46 | 47 | 48 | 49 | ||||||||||||||||||||||
| 36. Remote work T1 | 1 | ||||||||||||||||||||||||||||||||||
| 37. Remote work T2 |
|
1 | |||||||||||||||||||||||||||||||||
| 38. Remote work T3 |
|
|
1 | ||||||||||||||||||||||||||||||||
| 39. Remote work T4 |
|
|
|
1 | |||||||||||||||||||||||||||||||
| 40. Remote work T5 |
|
|
|
|
1 | ||||||||||||||||||||||||||||||
| 41. Female | − |
−.06 | − |
−.04 | − |
1 | |||||||||||||||||||||||||||||
| 42. Age | .02 | .03 | .04 | .04 | .06 | .03 | 1 | ||||||||||||||||||||||||||||
| 43. MA degree or higher |
|
|
|
|
|
−.01 | −.01 | 1 | |||||||||||||||||||||||||||
| 44. Managerial position |
|
|
.07 | .01 | .02 | − |
.02 | .01 | 1 | ||||||||||||||||||||||||||
| 45. Openness |
|
|
.05 | .06 | .04 | −.06 |
|
.06 | .07 | 1 | |||||||||||||||||||||||||
| 46. Conscientiousness | −.03 | −.07 | − |
−.05 | − |
|
|
− |
.06 |
|
1 | ||||||||||||||||||||||||
| 47. Extroversion | .00 | .03 | −.01 | −.04 | −.03 | .06 | .06 | − |
|
|
|
1 | |||||||||||||||||||||||
| 48. Agreeableness | .02 | .05 | .01 | .05 | .01 |
|
.00 | −.03 | −.02 |
|
|
|
1 | ||||||||||||||||||||||
| 49. Neuroticism | −.06 | −.07 | −.05 | −.02 | −.05 |
|
− |
.03 | − |
−.04 | −.06 | − |
− |
1 | |||||||||||||||||||||
p values <.05 are indicated with bold font.
Declaration of conflicting interests
The author(s) declared no potential conflicts of interest with respect to the research, authorship, and/or publication of this article.
Funding
The author(s) disclosed receipt of the following financial support for the research, authorship, and/or publication of this article: Funding was provided by The Finnish Work Environment Fund (Professional Social Media Use and Work Engagement Among Young Adults Project, project number 118055 PI: Atte Oksanen). Data collection was also partly funded by the Faculty of Social Sciences of Tampere University, Finland. Reetta Oksa is funded by the Finnish Cultural Foundation.