
Abstract
For a long time, a common opinion among policy-makers was that the digital divide problem would be solved when a country’s Internet connection rate reaches saturation. However, scholars of the second-level digital divide have concluded that the divides in Internet skills and type of use continue to expand even after physical access is universal. This study—based on an online survey among a representative sample of the Dutch population—indicates that the first-level digital divide remains a problem in one of the richest and most technologically advanced countries in the world. By extending basic physical access combined with material access, the study finds that a diversity in access to devices and peripherals, device-related opportunities, and the ongoing expenses required to maintain the hardware, software, and subscriptions affect existing inequalities related to Internet skills, uses, and outcomes.
Keywords
Introduction
As of 2018, the diffusion of the Internet has reached as high as 95% in several countries (worldbank.org). In countries with such high connection rates, the Internet has become a basic utility for social inclusion. Arguments regarding the Internet and its effects on social inclusion are reflected in the “digital divide” discourse, with the premise being that Internet access provides benefits and that not having access to the Internet has negative consequences. With Internet connection rates reaching high levels, a great deal of attention in digital divide research has moved away from indicators related to having an Internet connection (referred to as the first-level digital divide) to indicators of the second-level digital divide (Hargittai, 2002), namely, Internet skills and usage. More recently, attention on the outcomes of Internet use or tangible benefits has increased, referred to as the third-level digital divide (Van Deursen and Helsper, 2015; Wei et al., 2011).
Because of the shift from the first-level digital divide in countries where fixed and mobile broadband are nearly ubiquitous, there is the potential that new technology characteristics are being ignored (Sylvester et al., 2017). The first-level digital divide still requires attention because, besides having or not having an Internet connection, differences in material access must be considered (Gonzales, 2016; Van Dijk, 2005). Material access includes the means required to maintain the use of the Internet over time, such as computer devices (e.g. desktops, tablets, Smart TVs), software (subscriptions), and peripheral equipment (e.g. printers, additional hard drives). New material divides appear as a result of rapidly changing technology, the large variety of devices available to the general public, and the reality that not all of the materials provide the same online opportunities.
The current contribution empirically investigates various factors related to material access in a large-scale representative sample of the Dutch population. First, we consider the devices used to access the Internet and the ownership of peripherals that make the use of the Internet more convenient, such as additional screens and docking stations. To obtain a general idea of who is using the various devices and peripherals, we link these to important personal and positional categories and resources.
Second, we focus on specific aspects of material access, namely, device opportunity, device and peripheral diversity, and maintenance expenses. Device opportunity relates to the replacement of devices. For example, we consider those who only use smartphones or tablets. Diversity relates to the total number of devices and total number of peripherals used. Maintenance expenses are important to sustain the level of subscriptions and devices (Gonzales et al., 2016). Accordingly, we examine whether these three aspects differ among various segments of the populations.
Finally, we focus on the role of the three material access aspects in relation to the second- and third-level digital divides. We are interested in whether they relate to Internet skills, to the things people do online, and to the outcomes they achieve from Internet use.
The following research questions are addressed:
What factors explain the differences in the specific devices and peripherals used?
What factors explain device opportunity, device diversity, and maintenance expense?
To what extent do device opportunity, device diversity, and maintenance expense affect the diversity of Internet use and its outcomes?
Background
Material access in resources and appropriation theory
Resources and appropriation theory (Van Dijk, 2005) argues that categorical inequalities in society produce an unequal distribution of resources and that an unequal distribution of resources causes unequal access to the Internet. Access to the Internet is defined as a process of appropriation that starts with general attitudes toward the Internet and advances to having physical and material access. The process of appropriation is influenced by the social and technological context of Internet use. The social context consists of personal and positional inequalities among users. Personal categorical inequalities such as age and gender are frequently observed in digital divide research. This is also true for the positional categorical inequalities such as job position, level of educational attainment, and household size. Personal and positional inequalities, according to the theory, produce different resources. For example, resources that are frequently considered in digital divide research, albeit under other labels such as economic, social, and cultural capital, include possession, income, and access to a social network (for a review of inequalities between persons, positions, and resources, see Scheerder et al., 2017). According to the theory, the differences in Internet access that resources produce, reinforce inequalities of participation in society and this effect therefore reflects on greater inequalities between persons, positions, and resources.
At the core of the resources and appropriation theory are the types of access to digital technology. Accordingly, material access is part of the second phase, which extends the basic physical access to computers and the Internet. It is this phase that is the focus of the current study, and thus, it will be further elaborated upon, and the resources and personal and positional categories will be linked to this phase. In the final section, the material access phases are linked to the subsequent phases of Internet skills and Internet use and to the tangible benefits that are derived from this enhanced access, such as the improvement of one’s position in society.
Material access
To study the material access divide in the Netherlands, we must first understand who is using some specific materials. For example, the typical devices used for accessing the Internet and going online are desktop and laptop computers, tablets, and smartphones. Other devices that are increasingly used to access the Internet are game consoles and Smart TVs. Furthermore, there is a large variety of peripheral equipment available, among which the most common are printers, scanners, additional screens and hard drives, and docking stations. Each of these additions support the user by offering a more gratifying online experience.
Three aspects are important when focusing on material access inequalities, namely, (1) differences in device opportunities, or the use replacement of a device by other devices with different technical capacities; (2) differences in the diversity of devices and peripherals; and (3) differences in the maintenance costs of devices and peripherals. All three aspects are dependent on technical characteristics. The most studied differences in technical capacities are the use of desktops and laptop computers versus smartphones and tablets. Although the latter have advantages such as their mobility, convenience, price, more continuous Internet use (Mossberger et al., 2012), and increasingly provide additional possibilities besides location services, game playing, and video streaming, they are not a substitute for desktop or laptop computers. They offer lower memory, storage capacity, and speed; less advanced applications (Akiyoshi and Ono, 2008; Mossberger et al., 2012); and limited content availability (Napoli and Obar, 2014). Smartphones and tablets also offer less control over Internet use as specific platforms embedded in closed systems are used in which manufacturers have high levels of control (Napoli and Obar, 2014). They also provide less support as the platforms are often less compatible with protocols and standards (Murphy et al., 2016). Their smaller screen sizes, greater scrolling requirements, and reduced functionality when typing result in an increased cognitive burden (Bao et al., 2011; Murphy et al., 2016; Napoli and Obar, 2014). These differences impact behavioral patterns and tendencies, and a broad array of Internet outcomes (Napoli and Obar, 2014). Overall, Internet access on smartphones and tablets contributes to diminished levels of user engagement, content creation, and information seeking (Napoli and Obar, 2014). Desktop and laptop computers allow users to participate in a greater breadth of activities (Davison and Cotton, 2003; Mossberger et al., 2012; Zickuhr and Smith, 2012). Smartphones and tablets are used relatively often for leisure purposes (gaming and social networking) and personal safety, and desktop and laptop computers are more task- or work-based (Murphy et al., 2016; Pearce and Rice, 2013; Zillien and Hargittai, 2009). Information seeking, for example, is more superficial when using a smartphone or tablet, whereas searches on a desktop are much more immersive (Humphreys et al., 2013; Isomursu et al., 2007).
Following the above reasoning, when considering differences in device opportunity, some combinations of devices are less likely to be beneficial than others in providing a wider variety of Internet uses and outcomes. Using only desktop or laptop computers results in relatively few opportunities for continuous communication, entertainment, and location-based activities, while smartphone and tablet users will only miss out on more immersive Internet work in a relative sense, even as mobile devices further increase in functionality. However, a common trend among younger generations and minority groups is the replacement of desktops and laptops with tablets and smartphones. In terms of digital inequality, these replacements may have fewer potential uses (Napoli and Obar, 2017), while the combination of desktops or laptops with smartphones or tablets offers a broad range of opportunities. For this reason, those who only use smartphones or tablets are referred to as a “mobile underclass” (Napoli and Obar, 2014).
The technical characteristics are also important when considering differences in device and peripheral diversity. The use of more devices offers opportunities for a better and more diverse Internet experience (Donner et al., 2011). The same is true with respect to peripheral equipment in that the use of a greater variety of peripherals will lead to a more satisfying Internet experience. Being able to print materials found online at home, scan files to be uploaded, use an additional screen for multitasking and have access to an additional hard drive for storing downloaded or created multimedia all provide specific advantages.
The final aspect to consider is the maintenance expenses of devices and peripherals (Gonzales, 2016; Gonzales et al., 2016; Graham and Thrift, 2007). Devices can become unstable, breakdown, or require software updates. Accordingly, the actual purchase price of a device is only a small part of the total cost of ownership, as one must consider the additional expenses associated with the hardware such as devices and peripherals, repair costs, and software licensing costs. Even though the vast majority of people in western countries are now able to access the Internet, these numbers do not accurately reflect the ability to reliably maintain that access (Gonzales, 2016).
Resources as a cause for differences in material access
For material access, economic resources are likely to play an important role, specifically, the income required to acquire and sustain Internet use. We expect that people with high incomes own a multitude of (the best) devices and peripherals. They own more desktop and laptop computers, as well as more game consoles compared to those with lower incomes (e.g. Jansen, 2010). People with low incomes are more likely to own secondhand devices and to experience malfunctioning hardware and software. Although most of the lower economic groups now use Internet technology, access is unstable and characterized by frequent periods of disconnection (Gonzales, 2016). Similar situations may occur in relation to Internet subscriptions, which are likely to be better and more expensive among those with higher incomes. Those with lower income are more likely to only have Internet access on their smartphone, whereas those with higher incomes have Internet access on smartphones and other devices such as laptops and desktops (Tsetsi and Rains, 2017). We hypothesize the following:
H1a. Income contributes positively to device opportunity, device diversity, peripheral diversity, and device maintenance.
In addition to income, we expect social resources to play a role in material access. Social support is a general indication of social capital—the accumulated sum of mutual acquaintances—that due to its durability, is a structural resource embodied by one’s social network (Bourdieu and Wacquant, 1992). When devices or peripherals are purchased, social resources enable the receipt of support and maintenance in the event of a malfunction. People with access to other Internet users in their own household are also in a better position to share devices, peripherals, and subscriptions. In this respect, a lack of social support can have a negative impact on the adoption and purchase of devices and peripherals. Hence, the availability of support (quantity) and the level of satisfaction with the support received (quality) are dependent on the available resources (Helsper and Van Deursen, 2017). We hypothesize the following:
H1b. Support quantity contributes positively to device opportunity, device diversity, peripheral diversity, and device maintenance.
H1c. Support quality contributes positively to device opportunity, device diversity, peripheral diversity, and device maintenance.
Personal and positional inequalities as causes for differences in material access
Digital divide research suggests that the most-observed personal categories affecting Internet access are gender, age, and ethnicity (Scheerder et al., 2017). In the developed world, the use of the Internet by both men and women continually increases as they are faced with the same digital technology at work, at school, and at home (Van Dijk, 2005). Nonetheless, gender remains a significant factor impacting Internet use over time in countries with high Internet penetration (Helsper and Reisdorf, 2017). Gender-based stereotypes suggest that women are less technologically competent (Dholakia and Chiang, 2003). Furthermore, while it has been argued that women are at a natural disadvantage because they purportedly lack technological skills and are more technophobic, there is also the argument that the technology itself does not meet women’s needs (Hilbert, 2011). Research demonstrates that while both males and females access the Internet and mobile devices, substantive differences exist in the particular devices they use (Odaci and Kalkan, 2010). We hypothesize the following:
H2a. Men are more likely than women to have more access to device opportunities, device diversity, peripheral diversity, and device maintenance.
With respect to age, young people have more and earlier access to all types of devices that are used to connect to the Internet. For example, mobile communication is now a condition in the everyday lives of young people (Ling, 2012), and as a result, they such as new inventions and innovations and are far more likely to experiment with new devices and peripherals. Accordingly, seniors remain the section of the population that is the least likely to have access to the Internet, despite the benefits that such access affords them (Baker, 2013). Think of transcending social and spatial barriers, maintaining and enhancing social networks, and providing a greater sense of connection to the world (Winstead et al., 2013). Unfortunately, a lack of interest, high costs, ergonomic impediments, complexity (Carpenter and Buday, 2007), knowledge (Gitlow, 2014), and anxiety about new technologies and low technology self-efficacy (Lam and Lee, 2006; Vroman et al., 2015) are all important barriers that interfere with the willingness of seniors to adopt new technology. We hypothesize the following:
H2b. Age contributes negatively to device opportunity, device diversity, peripheral diversity, and device maintenance.
In countries populated by minorities born in other countries (parents or children), there are often significant gaps in Internet access between the majority population and these minority groups. Related research on ethnicity, though not equivalent to immigration status, suggests that they are very active mobile device users, in contrast with the relatively low levels of desktop and laptop ownership among minority groups (Cotton, Anderson and Tufekci, 2009; Watkins, 2009).
H2c. Majorities are more likely than minorities to have access to device opportunity, device diversity, peripheral diversity, and device maintenance.
Factors driving the distribution of resources and Internet access are positional categories, the first of which fall under work and education. Physical access hinges on several resources that include education and employment (Gonzales, 2016). Those who are more highly educated and who are employed are more digitally engaged, and benefit more from technology in their everyday lives (Clayton and Macdonald, 2013). We hypothesize the following:
H2d. Those who are employed are more likely to have access to device opportunity, device diversity, peripheral diversity, and device maintenance expenses than those who are not employed.
H2e. Educational level of attainment contributes positively to device opportunity, device diversity, peripheral diversity, and device maintenance.
Lower levels of social isolation (e.g. not living alone or being in a relationship) improve one’s chances of engaging with the Internet (e.g. Van Deursen and Helsper, 2015). Marital status and household composition are often considered in digital divide research. We expect that the presence of children affects material access, as they often have their own devices for tasks such as school work. We hypothesize the following:
H2f. Married people or households with two or more adults are more likely than those who are single, divorced, widowed, or living alone to have access to device opportunity, device diversity, peripheral diversity, and device maintenance.
H2g. Having children in the household contributes positively to device opportunity, device diversity, peripheral diversity, and device maintenance.
Internet attitudes as a cause for inequalities in material access
The core of resource and appropriation theory describes the process of Internet appropriation in which having material access is a second phase. The first phase is having motivational access. Van Dijk’s (2005) notion of motivational access is primarily shaped by attitudes toward technology, which are crucial to using it (Venkatesh et al., 2003). Negative attitudes such as computer anxiety, decrease the likelihood that an individual will access the Internet (Dutton and Reisdorf, 2019; Reisdorf and Groselj, 2017; Van Dijk, 2005). Internet anxiety is characterized by avoidance, by the expression of negative comments about the Internet and its effects on society, and by attempts to minimize the time spent using the Internet (Durndell and Haag, 2002; Rockwell and Singleton, 2002). Thus, we hypothesize the following:
H3. Internet attitude is positively correlated with device opportunity, device diversity, peripheral diversity, and device maintenance.
Material access as a cause for differences in skills, uses, and outcomes
The final objective is to test the role of the three aspects of material access in the total process of appropriating digital technology. Prior research revealed that the quality of computer equipment, the age of the computer used, and Internet pricing affect the quality of Internet use at home (Zillien and Hargittai, 2009). Technology appropriation is a process with four successive phases or access types. After adopting a favorable attitude toward the Internet and acquiring physical and material access, one must possess Internet skills (Van Dijk, 2005). Internet skills are known to vary considerable among segments of the population (e.g. Hargittai et al., 2018; Van Deursen and Van Dijk, 2011). In addition to Internet skills, Internet usage is part of the second-level digital divide and can be defined in terms of frequency and the type of activities performed, both of which have their own grounds of determination (e.g. Blank and Groselj, 2014; Van Deursen and Van Dijk, 2014). The process of Internet access eventually affects the outcomes of Internet use (Helsper, 2012; Van Dijk, 2005). We add three types of material access to the discussed resources and positional and personal determinants to predict the subsequent phases of Internet access—skills, uses, and outcomes. The goal is to establish the independent effect of material access aspects on the second- and third-level digital divide. We hypothesize the following:
H4. (a) Device opportunity, (b) device diversity, (c) peripheral diversity, and (d) device maintenance contribute positively to Internet skills, Internet use diversity, Internet use frequency, and Internet outcomes.
Method
Sample
The present study uses an online survey and draws on a sample collected in the Netherlands. To obtain a representative sample of the Dutch population, we used Panelclix, a professional organization for market research to provide a panel of approximately 110,000 people. Members of the panel receive a small incentive for every survey they complete. In the Netherlands, 98% of the population uses the Internet; therefore, the user population is very representative of the general population in terms of its sociodemographic makeup. The panel includes novice and advanced Internet users. In total, we aimed to obtain a dataset with approximately 1600 respondents over the age of 18. Eventually, this resulted in the collection of 1698 responses over a 2-week period in February 2018. During the data collection period, amendments to the sampling frame were made to ensure the representativity of the Dutch population. Accordingly, the analyses revealed that the gender, age, and formal education of our respondents largely matched official census data. As a result, only a small post hoc correction was needed. The sample had the following composition: gender: 49.1% female; age: M = 49.7, SD = 18.1; education: low (e.g. primary school) 32%, middle (e.g. high school) 39%, high (e.g. college and university) 29%; occupation: employed 53%, unemployed 4%, disabled 7%, retired 23%, housewife/husband 6%, student 6%; ethnicity: born in the Netherlands 95%, born outside the Netherlands 5%.
The online survey used software that checked for missing responses and then prompted users to respond. The survey was pilot tested with 10 Internet users over two rounds. Amendments were made based on the feedback provided. No major comments were provided in the second round. The average time required to complete the survey was 20 minutes.
Measures
To answer the first research question, the first set of dependent variables are the specific devices and peripherals used. We included desktop, laptop, tablet, smartphone, Smart TV, and game console. All are coded as dichotomous variables, indicating “no use” or “use.” The same is done for the peripheral equipment used. We considered printer, scanner, additional screen, additional hard drive, and docking station.
To study device opportunity, we considered two conditions that both provide a limited set of opportunities. The first condition consists of only using a desktop and/or laptop (13%), and the second condition of only using a tablet and/or smartphone (6%).
To account for the diversity of devices and peripherals, we considered the total number of devices used to connect to the Internet (M = 2.94, SD = 1.35) and the total number of peripherals used (M = 1.96, SD = 1.01).
The final dependent variable considered maintenance expenses and was measured by the annual amount spent in euros on hardware and software (categorized as < 50, 51 to 100, 101 to 150, 151 to 200, and >200).
Material resources were incorporated as income and were measured by using the total family income over the last 12 months, assessed on an 8-point scale. Based on the census data, three categories were created—low, middle, and high income.
Social resources were represented by support quantity and was measured by asking respondents how many people in the home use the Internet (M = 2.31, SD = 1.16). The home or household is the most proximate context for support. Other contexts include work, social networks, neighbors, and so on. The survey offered no data regarding these contexts. Support quality was measured by asking the respondent to think about the last time they asked for help when using the Internet, followed by the question “How much confidence do you have that you can now solve the same problem yourself?” A 5-point scale was used that ranged from “no confidence at all” to “high confidence” (M = 2.31, SD = 1.16).
The first personal indicator considered was age. This was computed by subtracting the reported year of birth from the survey year. Age was subsequently divided into four categories 18–35, 36–50, 51–65, > 65). Gender was included as a dichotomous variable (M/F), as was majority (born in the Netherlands) or minority (born outside the Netherlands) status.
Several positional categories were considered. First, employment statuses were coded as dummy variables, specifically, employed, retired, disabled, househusbands/wives, unemployed, and students. Education was collected by degree as 1 of 10 categories and followed the Dutch educational system classification. These data were subsequently divided into groups of low, middle, and high educational level.
Internet attitude was measured by four items adapted from the digital motivation scale of Helsper, Smirnova and Robinson (2017). All items are balanced for the direction of response (5-point scale, M = 3.88, SD = 0.76). A sample statement included the following: ‘Technologies such as the Internet and mobile phones make life easier’.
Internet skills were measured using the Internet Skills Scale (Van Deursen et al., 2016). This 20-item instrument covers operational, information navigation, social, and creative components and is used in this study as a single skill set. All items were scored on a 5-point scale that ranged from “Not at all true of me” to “Very true of me” and exhibited high internal consistency (α = .89; M = 3.66; SD = 0.73). Examples of items are “I know how to open downloaded files,” ‘I find it hard to decide what the best keywords are to use for online searches’, and ‘I know which information I should and shouldn’t share online’.
Internet use diversity was adapted from Van Deursen et al. (2017), and covers a range of 36 different uses including economic (savings, earnings, employment, finances, and degrees), cultural (identity and belonging), social (political and civic participation, and bridging and bonding ties), and personal (health, leisure, and self-actualization) domains. Respondents were asked to indicate how often they conducted each specific activity. A “No use” answer was coded as a 0, and all other frequencies as 1. A composite measure of Internet use diversity was created by summing the items (M = 18.82; SD = 5.94).
Internet use frequency was measured by asking respondents how often they use the Internet, using a 5-point scale ranging from “less than monthly” to “multiple times a day” (M = 2.31, SD = 1.16).
Internet outcomes was adapted from Van Deursen et al. (2017) and covers a range of 26 different outcomes related to the same domains as considered for Internet usage. Respondents were asked, for each outcome, to what extent they agreed that they had achieved or received that outcome (5-point scale). Agreeing and fully agreeing were coded as 1, and all other options as 0. A composite measure was created by summing the items (M = 5.91; SD = 4.42). Examples of items are “I save money by buying products online’, ‘I have a better relationship with my friends and family because I use the Internet’, and “Online entertainment made me feel happier.”
Analysis
Regarding the first research question, we used logistic regression analyses to identify the significant predictors of the separate devices and peripherals considered. For the second research question, we used linear regression analysis to analyze the contributors to device diversity, peripheral diversity, and device maintenance expenses. Logistic regression was used to analyze the contributors to the two conditions of device opportunity. In all analyses, we added the independent personal and positional variables, the resources, and Internet attitude. For the final research question, we conducted linear regression analyses where device opportunity, device diversity, and peripheral diversity were added to the list as independent variables. Dependent variables included Internet skills, Internet use, and Internet outcomes.
Results
Differences in devices and peripherals used
Among the Dutch population, the following devices are used to go online: desktop (50%), laptop (70%), tablet (53%), smartphone (76%), Smart TV (26%), and game console (12%). Table 1 indicates that those between 18 and 36 years are less likely to use desktops compared to the older age groups and are also less likely to use tablets compared to those between 36 and 65 years old. Furthermore, those between 18 and 36 years are more likely to use smartphones, Smart TVs, and game consoles. In addition, Table 1 reveals that men are more likely to use desktop computers, Smart TVs and game consoles to go online, while women are more inclined to use tablets. Majorities are more likely to use tablets and smartphones than minorities.
Logistic regression analysis to predict the use of devices (odds ratios).
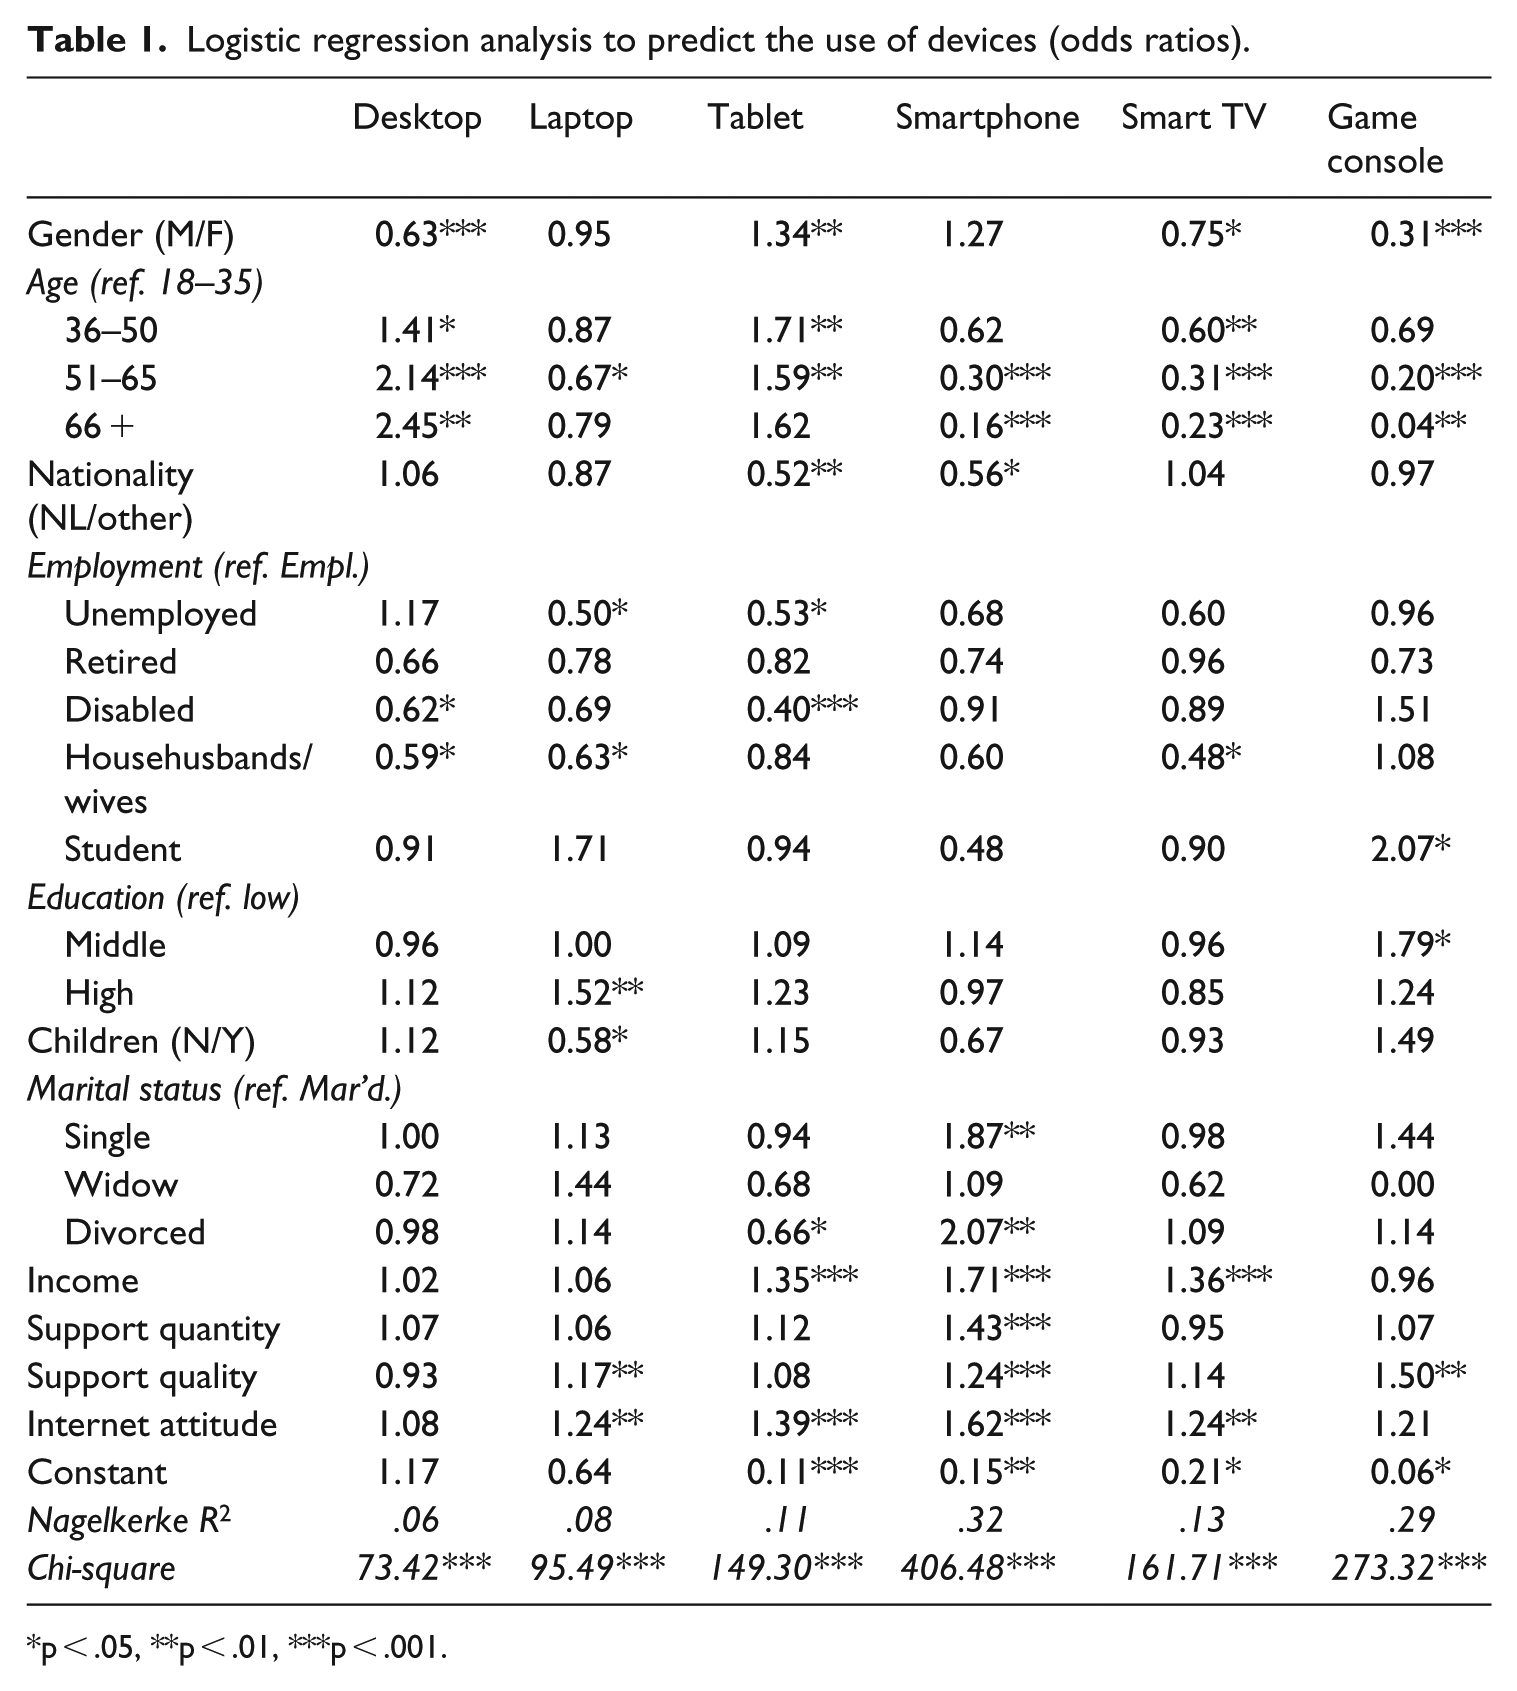
p < .05, **p < .01, ***p < .001.
Table 1 indicates that compared to those who are employed, those who are unemployed are less likely to use laptops and tablets; those who are disabled are less likely to use a desktop or tablet computer, and househusbands/wives are less likely to use desktops, laptops, and Smart TVs. Students are more likely to use game consoles. The level of educational attainment affects the use of laptops, which is higher for highly educated individuals than it is for those with lower levels of education, whereas the use of game consoles to access the Internet is more common among those who are somewhat (mid-level) educated compared to those who have a low level of education. Those with children in the household are less likely to use a laptop than those without children, and widowers and divorced people are more likely to use a smartphone than those who are married. The latter are less likely to use a tablet.
Income positively affects the use of tablets, smartphones, and Smart TVs. Support quantity positively contributes to the use of smartphones, and support quality is positively related to the use of laptops, smartphones, and game consoles. Finally, Internet attitude positively affects the use of laptops, tablets, smartphones, and Smart TVs for online access.
The following peripherals are used: printer (89%), scanner (50%), additional screen (10%), hard drive (37%), and docking station (6%). Table 2 indicates that personal inequalities emerge for gender, age, and majority status. Men are more likely to use additional screens. Compared to those aged 16–35, older age groups are more likely to use printers and scanners. Those aged over 65 are less likely to use additional screens, and those aged over 50 are less likely to use additional hard drives. Minorities are less likely to use additional screens and hard drives.
Logistic regression analysis to predict the use of peripherals (odds ratios).
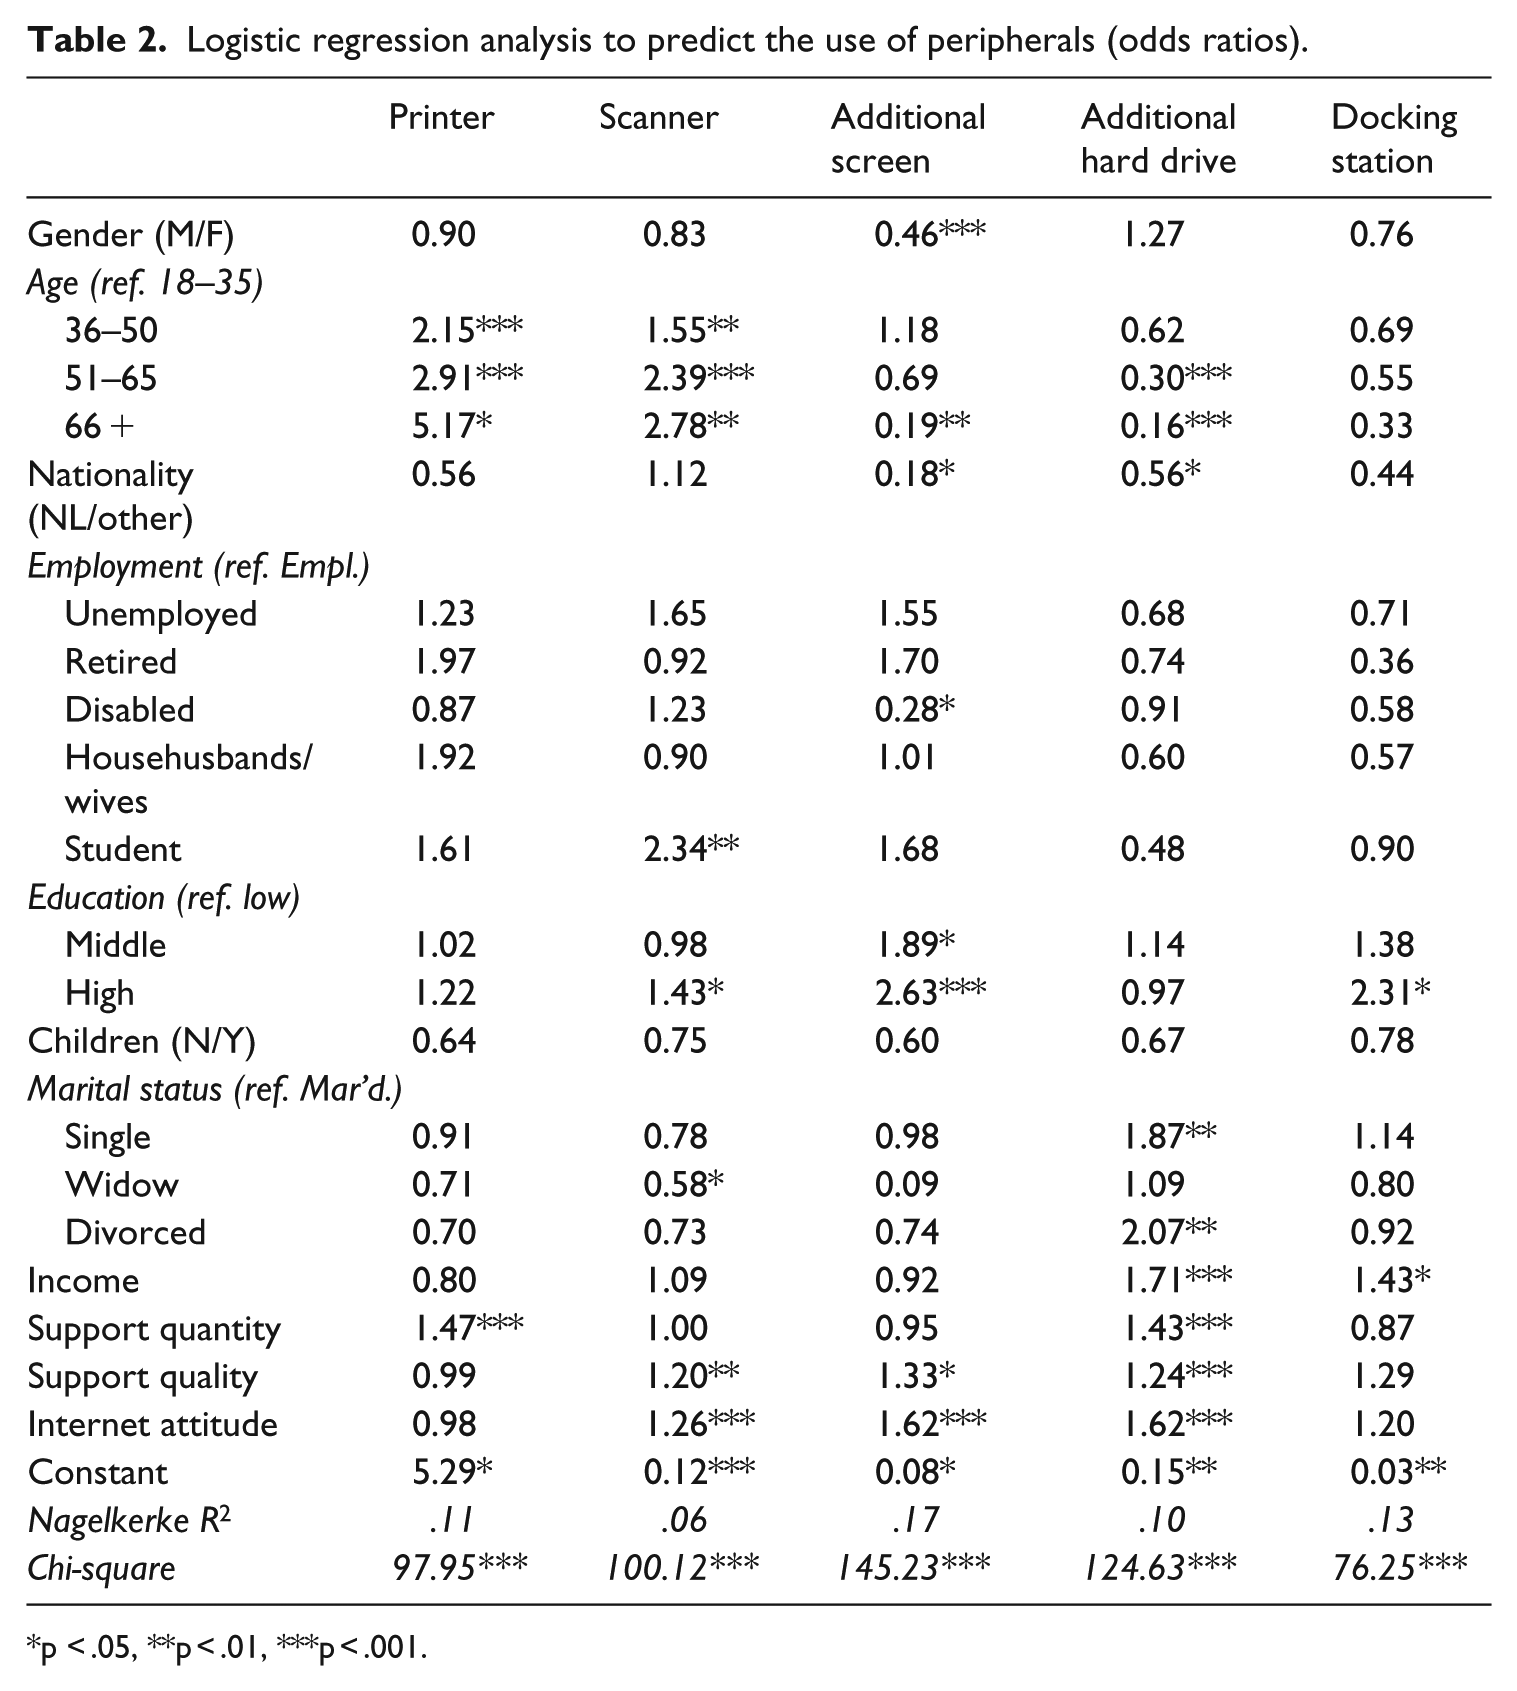
p < .05, **p < .01, ***p < .001.
Compared to those who are employed, those who report a disability are less likely to use additional screens, and students are more likely to use scanners. Those with higher levels of education are more likely to use scanners, additional screens, or docking stations compared to those who have lower educational qualifications, while those who are somewhat well-educated are more inclined to use additional screens.
Finally, income positively contributes to the use of additional hard drives and docking stations, while support quantity affects the use of printers and additional hard drives. Support quality positively impacts the use of scanners, additional screens, and additional hard drives. Similarly, Internet attitude positively affects the use of scanners, additional screens, and additional hard drives.
Device opportunity
With respect to device opportunity, on one hand, we considered people who only use desktop and/or laptop computers, and on the other hand, people who only use a tablet and/or smartphone. Both situations result in a limited variety of uses, and thus provide fewer opportunities compared to situations in which desktop and/or laptop computers are combined with smartphones and/or tablets. Table 3 reveals that people aged over 50 are more likely to only use desktop and/or laptop computers, while the youngest age group is more likely to only use a smartphone and/or tablet. People in the Dutch majority, lower income, less access to support, and higher levels of Internet attitude groups are less likely to only use desktop and/or laptops. Internet attitude also contributes negatively to only using smartphone and/or tablets. Finally, compared to employed people, those who report a disability are more likely to suffer from lower device opportunity.
Logistic regression analysis to predict device opportunity (odds ratios).
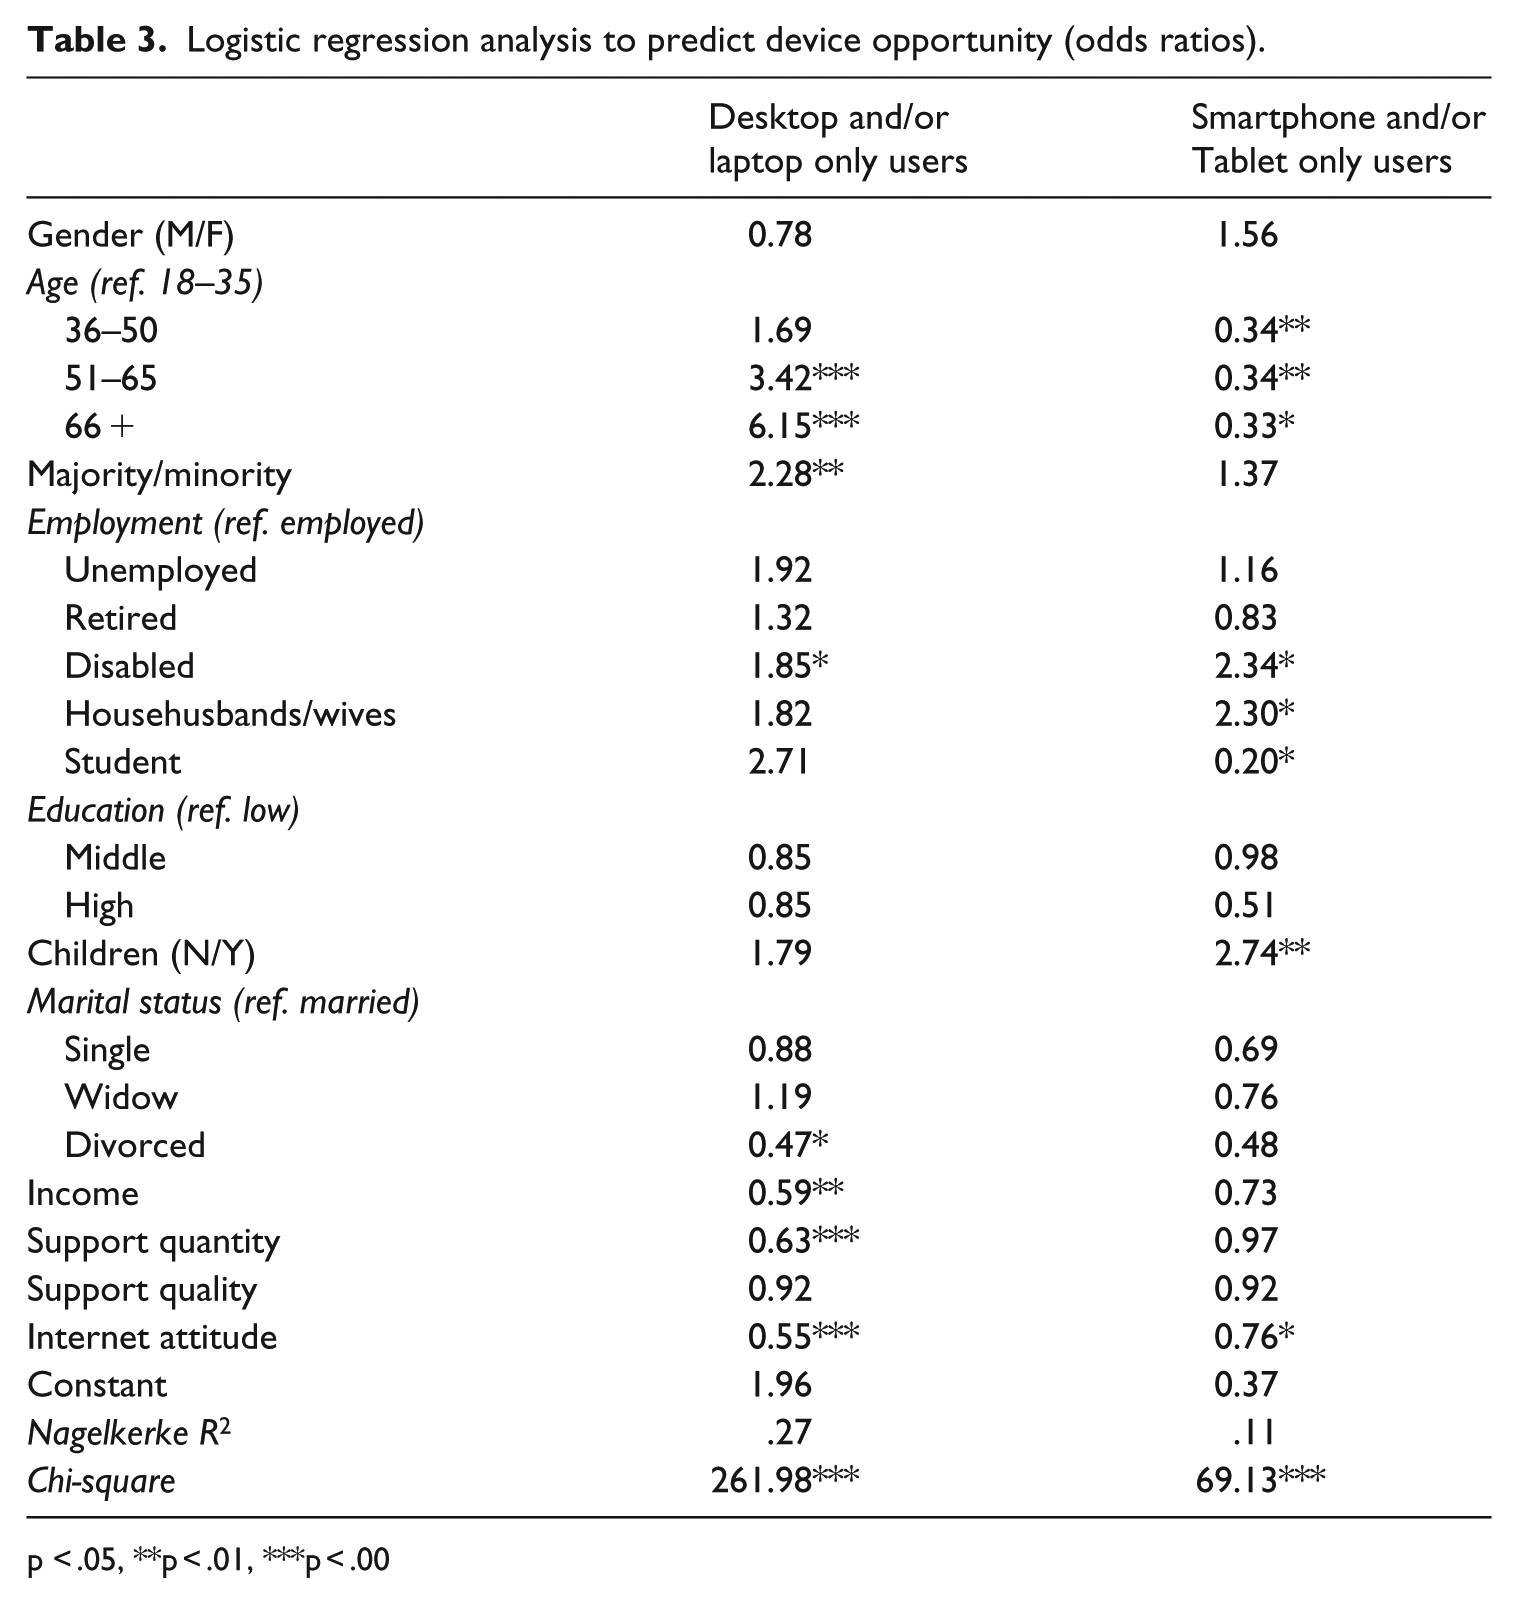
p < .05, **p < .01, ***p < .00
Device and peripheral diversity
With respect to the diversity of devices used to access the Internet, users on average connect to the Internet with 2.94 devices (SD = 1.35), and they use 1.93 peripherals (SD = 0.98). Columns two and three in Table 4 indicate the predictors of device and peripheral diversity. Whereas both device diversity and peripheral diversity are higher among men, age is a negative contributor in device diversity but a positive factor in peripherals diversity. Furthermore, both device and peripheral diversity are greater among citizens of the Dutch majority. Compared to the employed, househusbands/wives use fewer devices to connect to the Internet, and students use more peripherals. Those with higher levels of education have higher device and peripheral diversity than those with low levels of education, and married people exhibit greater peripheral diversity than do widowers and people with no children in the household. Finally, income, support quality, support quantity, and Internet attitude contribute positively to both device and peripheral diversity.
Linear regression analysis to predict the diversity of devices and peripherals used, and maintenance (annual expenses for hardware and software) (β).
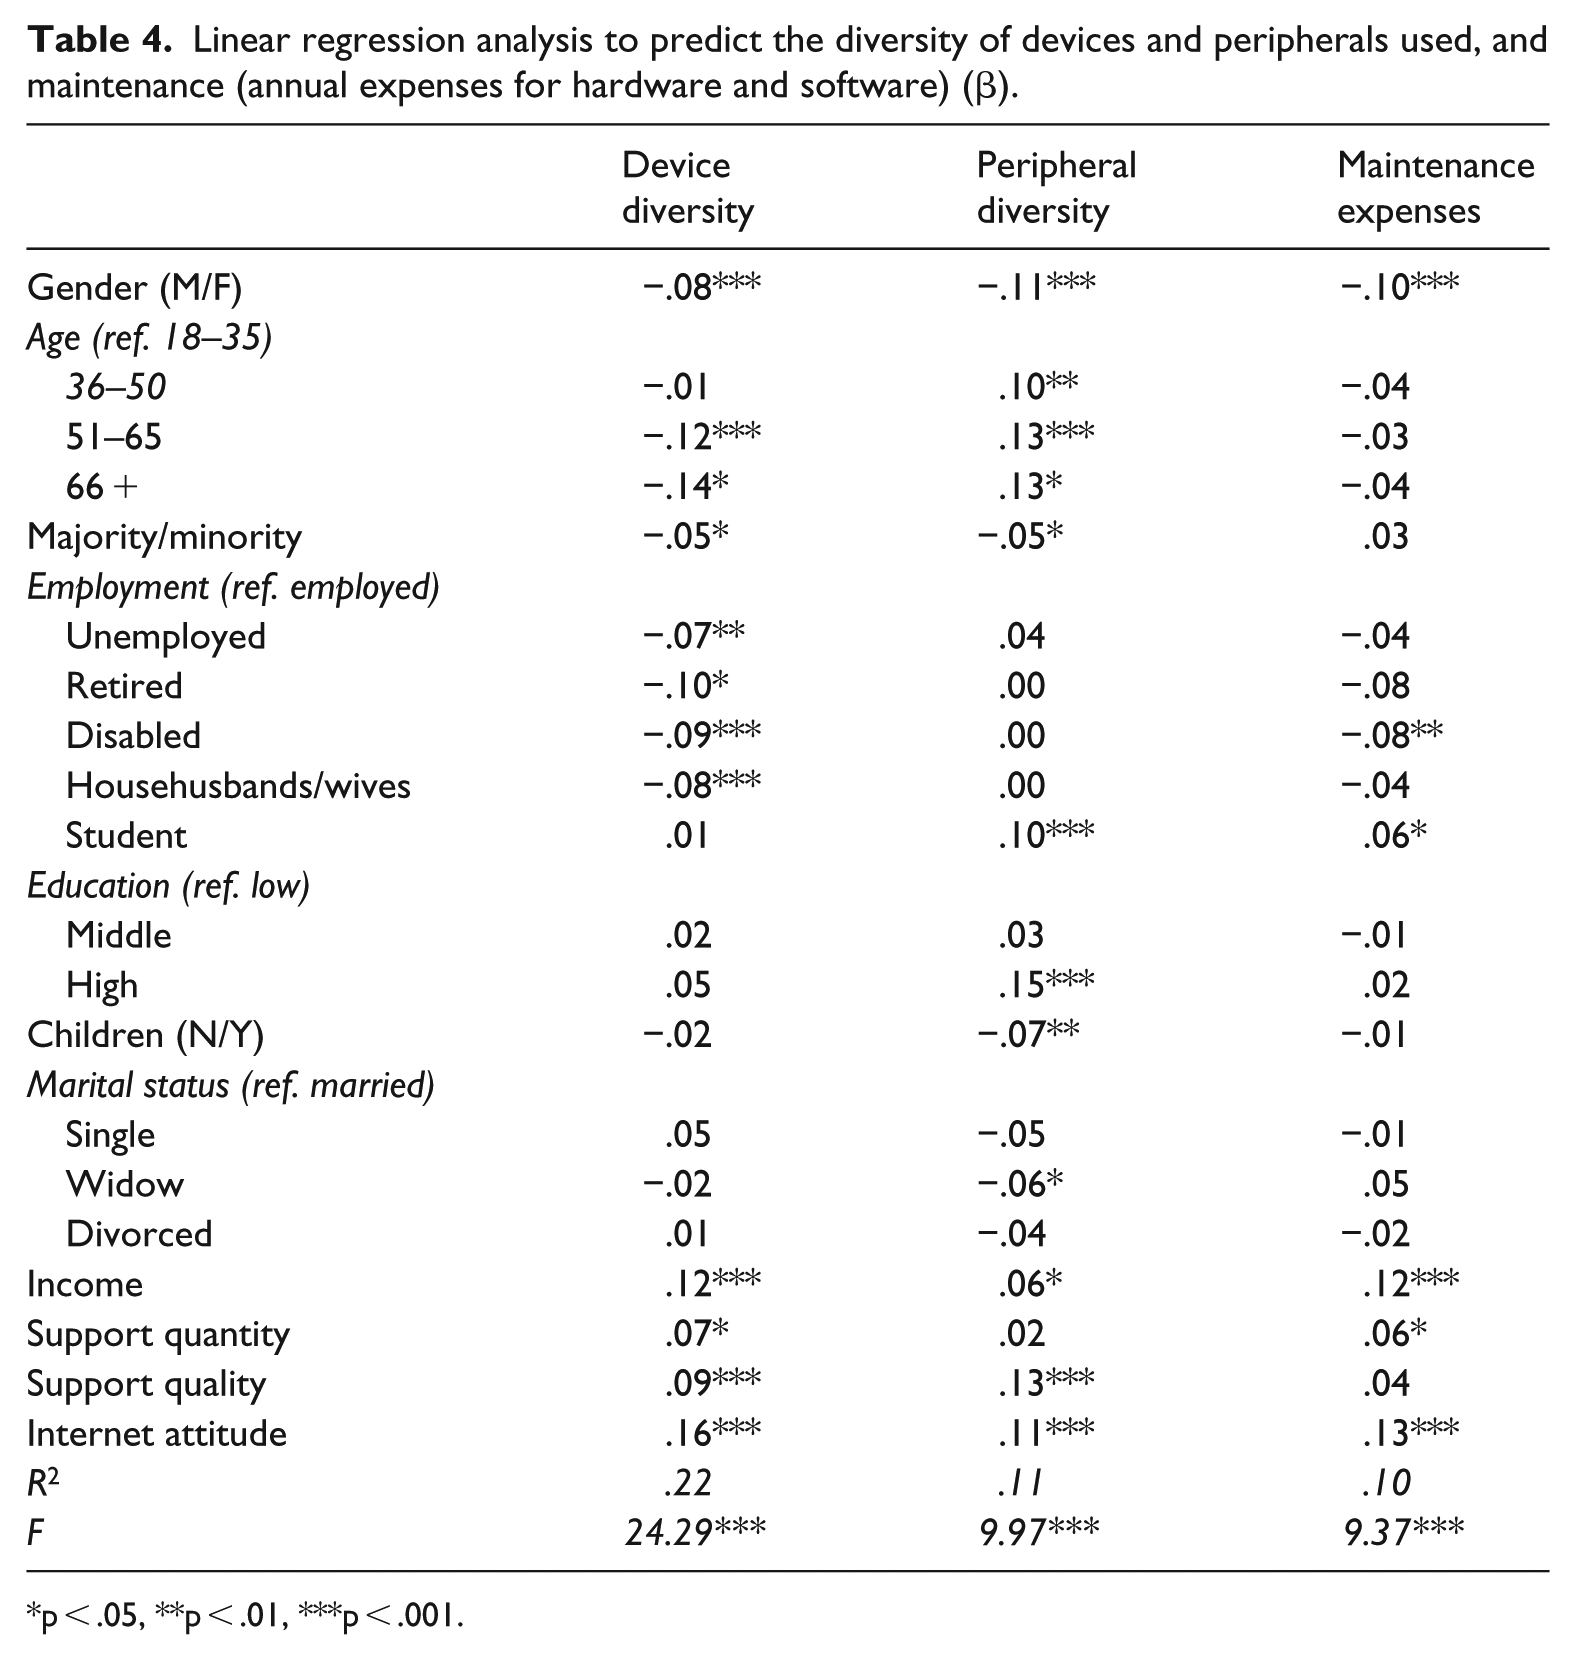
p < .05, **p < .01, ***p < .001.
Expenses for maintenance
The last column in Table 4 shows the contributors to annual maintenance expenses. For example, the table indicates that men have higher maintenance expenses than women (which might relate to the fact they are more likely to own desktops, game consoles, and Smart TVs) and that employed people have more maintenance expenses than do unemployed and disabled individuals. Similarly, widowers have higher expenses than married individuals and those in relationships. Finally, income, support quantity and quality, and Internet attitude have positive effects on annual maintenance expenses.
Overview of the hypotheses test results (Table 5)
Overview of hypotheses H1 to H3.
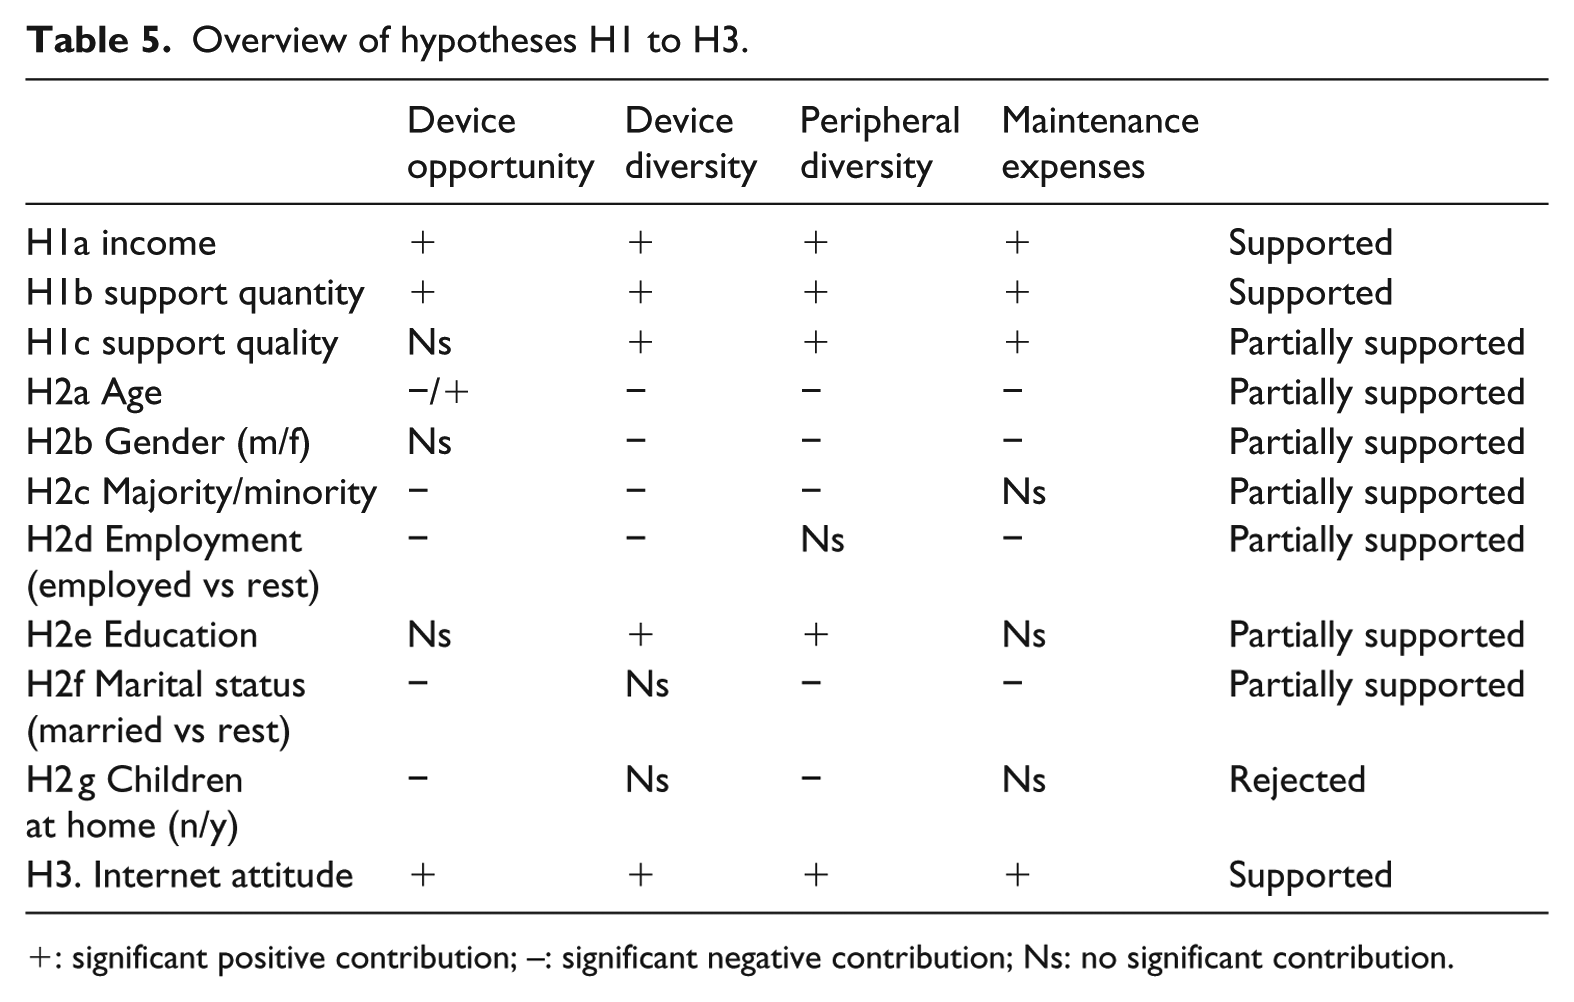
significant positive contribution; −: significant negative contribution; Ns: no significant contribution.
Effect of material access on skills, usage, and outcome diversity
Table 6 indicates that for Internet skills, in addition to the significant contributions of age, employment, education, support quantity, support quality, and Internet attitude, there are also contributions from device opportunity (smartphone/laptop only), peripheral diversity, and maintenance expenses. The next step is Internet usage, which entails both diversity and frequency of use. With respect to diversity, besides the added Internet skills, it has also been determined that device, device opportunity (smartphone/laptop only), device diversity, and maintenance expenses contribute as expected. Furthermore, device opportunity (smartphone/laptop only) and maintenance expenses are positively related to use frequency. While Internet skills and Internet use diversity are important contributors to gaining Internet outcomes, device diversity was found to make a positive, independent contribution.
Linear regression analysis to predict internet skills, use diversity, use frequency, and outcomes (β).
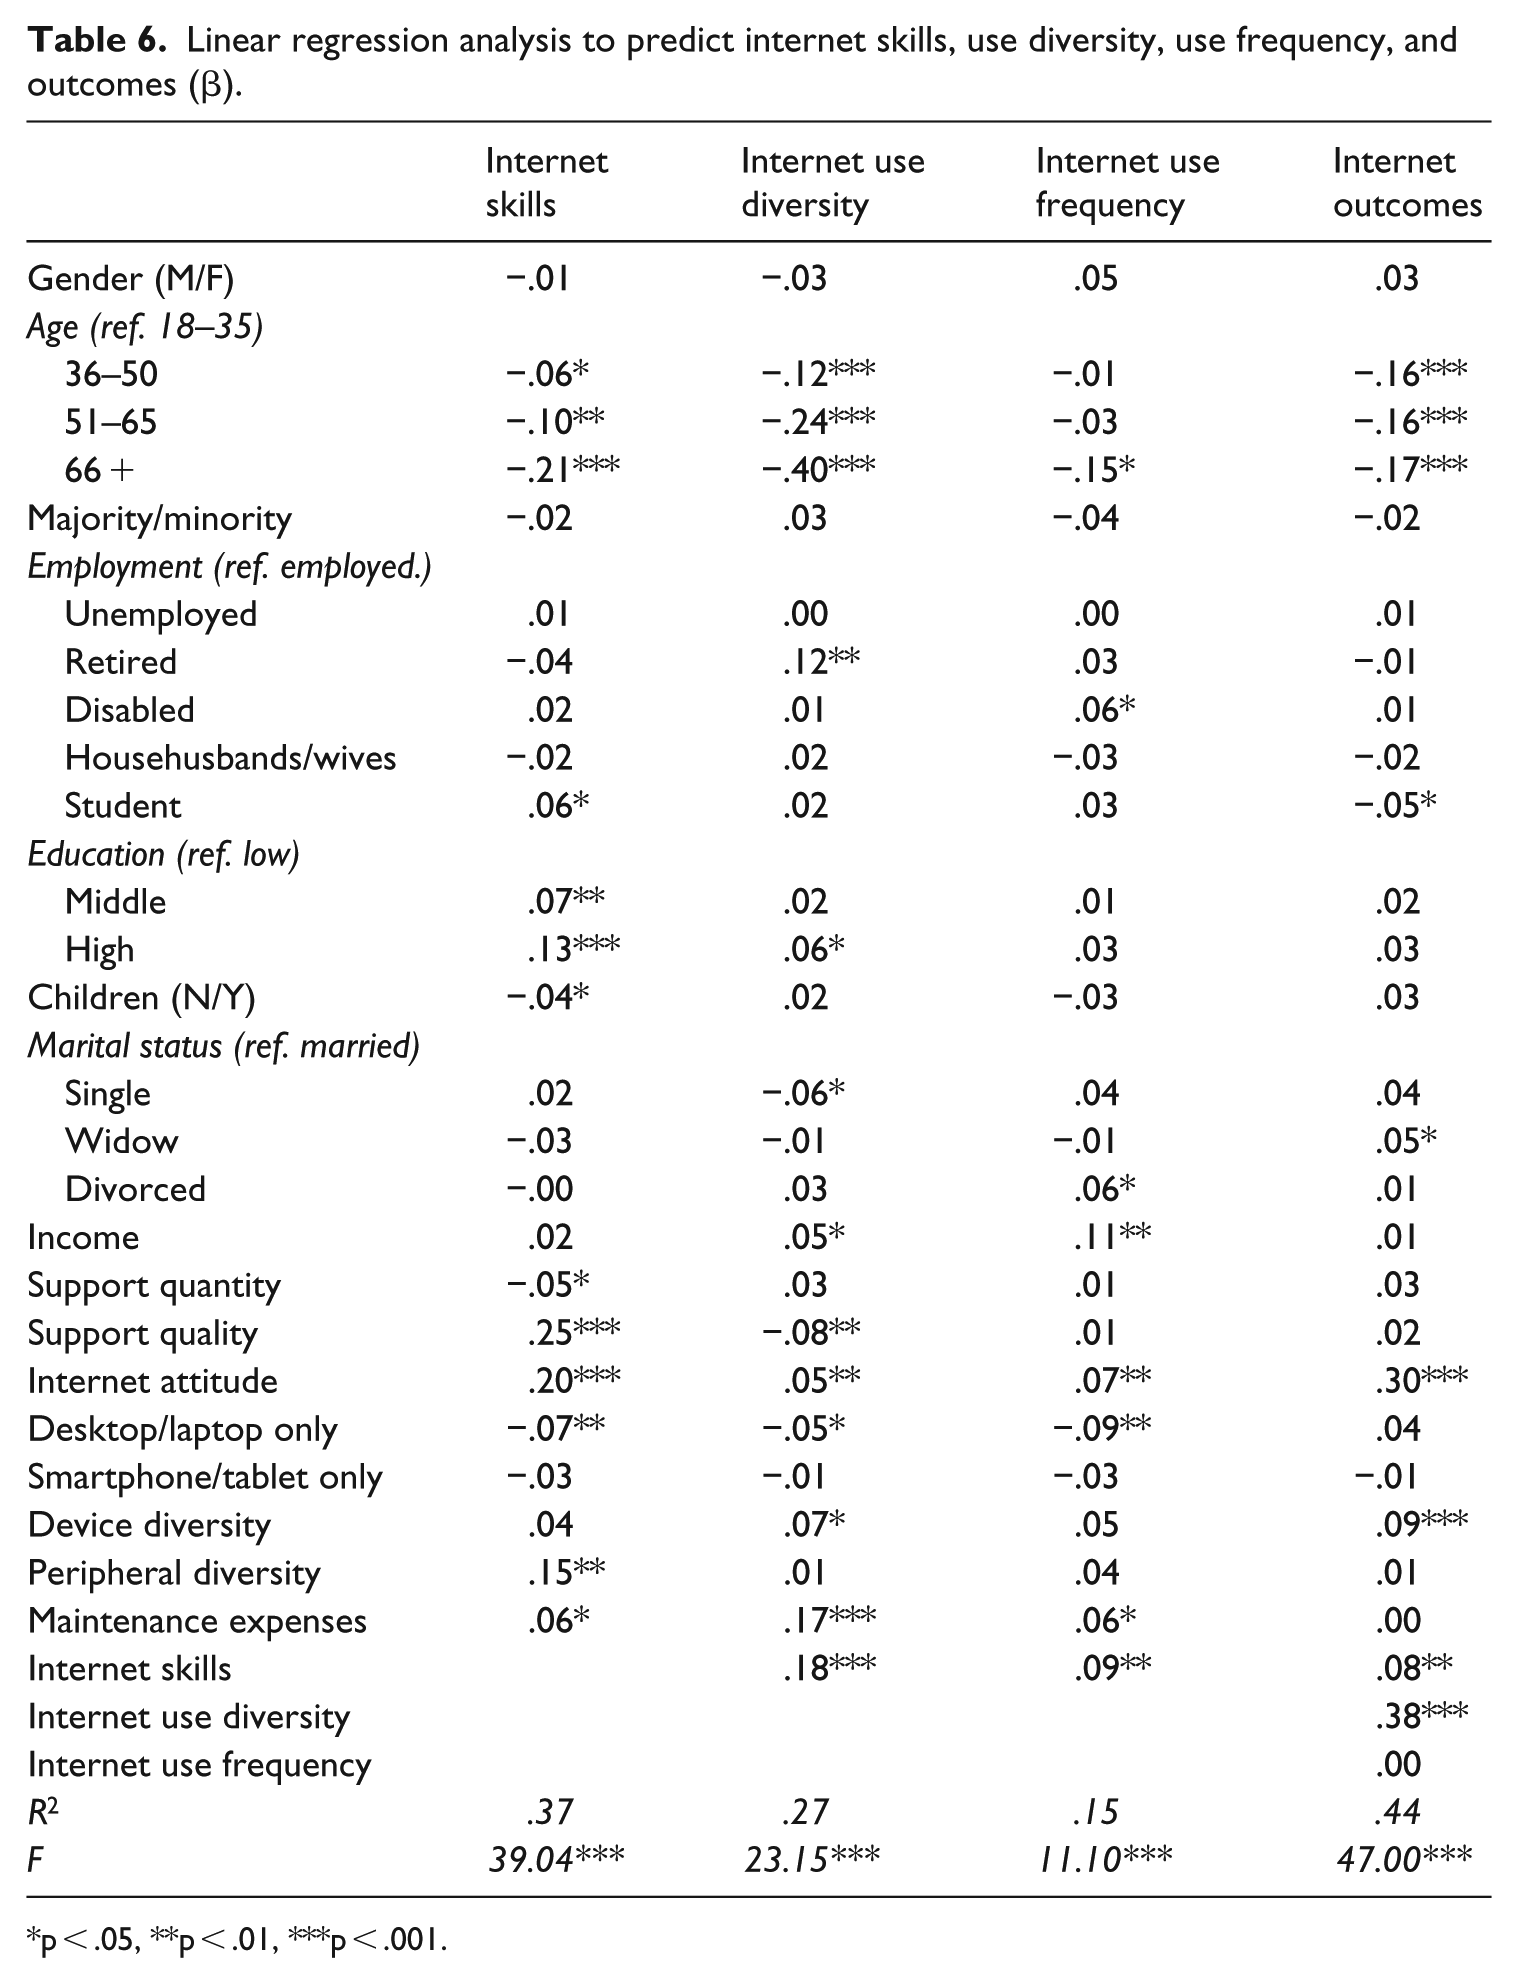
p < .05, **p < .01, ***p < .001.
Table 7 provides an overview of the hypotheses test results.
Overview of hypotheses H4a to H4d.
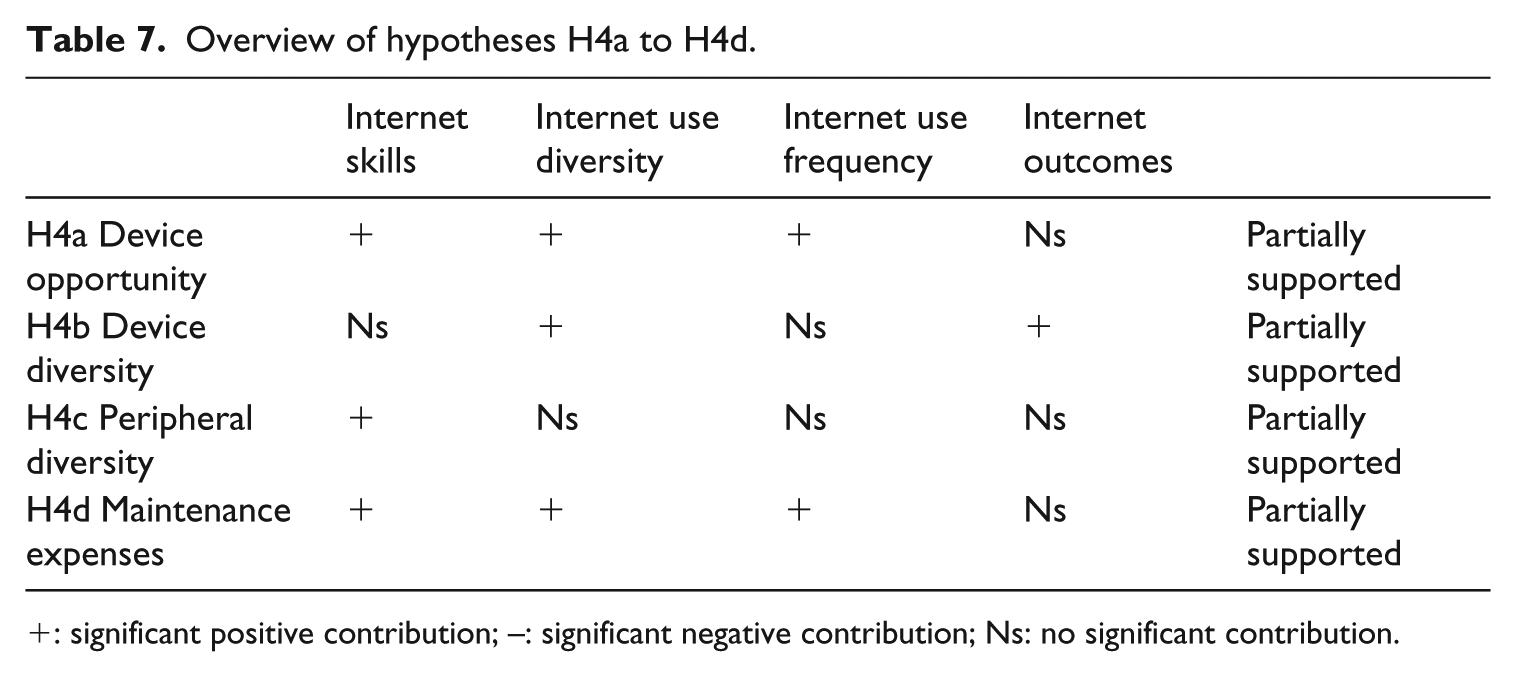
significant positive contribution; −: significant negative contribution; Ns: no significant contribution.
Discussion
Main findings
A common opinion among policy-makers is that the digital divide problem is solved when a country’s Internet connection rate reaches saturation. However, scholars of the second-level digital divide have concluded that the divides in Internet skills and type of use continue to expand even after physical access is universal. Furthermore, several studies have highlighted the continued importance of attitude and material dimensions (e.g. Gonzales, 2016; Hargittai and Kim, 2010; Napoli and Obar, 2014; Reisdorf and Groselj, 2017). This study confirms the importance of both dimensions in the Netherlands, a rich and technologically advanced country where 98% of the population now has home Internet access. More specifically, in the current study, material access was conceptualized as device opportunity, device and peripheral diversity, and maintenance expenses, which are all important dimensions that differ among segments of the population.
In light of the first two research questions, age, gender, majority status, employment, education level, and household composition, as well as material resources (income), social resources (quantity and quality of support), and Internet attitudes are all related to unequal ownership of devices and peripherals. Furthermore, there are systematic differences in the material access dimensions, as these are strongly associated with Internet attitude, income, support quantity, and support quality. Furthermore, males, majorities, and the employed, well-educated, and married people benefit most in terms of material access. In most cases, this is also true for younger people. However, we also found that younger people are more likely to only use a tablet or smartphone (while the overall percentage is low), confirming the existence of an age-related “mobile underclass” (Napoli and Obar, 2014) in the Netherlands. While mobile devices rapidly increase in functionality, they should not be considered equal to desktop and laptop computers. Both offer their own specific advantages, suggesting that using only mobile or nonmobile devices limits the potential range of Internet activities and outcomes. Overall, the findings suggest that common digital divide indicators appear in our conceptualization of material access, suggesting that attention to the first-level digital divide remains important.
This becomes even more apparent in light of the third research question, which was posed to better understand what these differences in material access imply for Internet skills, use, and outcomes. The findings show that device opportunity is related to Internet skills and Internet-use frequency and diversity. Using a higher diversity of devices is related to a higher diversity of Internet use and more Internet outcomes. Furthermore, having more maintenance expenses contributes to Internet skills, and Internet-use frequency and diversity. Thus, the first-level divides accounted for in the current study contribute to second- and third-level divides. By extending basic physical access combined with material access, the study finds that the opportunities these devices offer, diversity in the access to devices and peripherals, and ongoing expenses required to maintain the hardware, software, and subscriptions all relate to inequalities in Internet skills, uses, and outcomes.
Noteworthy is the role of Internet attitude, which is not only important for all material access variables but also for Internet skills and uses. This confirms that Internet attitudes are stronger than many socioeconomic variables and that they are very important at the beginning of the process of Internet appropriation (Van Dijk, 2005). Internet attitude should also be considered as part of the first-level digital divide—the psychological part. Apparently, attitudes toward the Internet are still as important as they were two decades ago (see also Helsper and Reisdorf, 2017; Reisdorf and Groselj, 2017).
This study confirms that the digital divide is a reality that is here to stay, not only in terms of attitude, skills, type of use, and Internet outcomes but also in terms of material access. Accordingly, this also applies to rich and connected countries in the world. Policy-makers who aim to reduce the digital divide must not neglect or forget about the first level.
Limitations and future research
We provided a large-scale, empirical investigation of material access inequalities in the Netherlands. Although the considered aspects provide a comprehensive view of material access, we did not account for the quality of the devices under investigation. For example, processor speeds differ between laptops. Future studies may account for more technical details regarding the devices under investigation, as it is likely that differences between tablet use, for example, are greater among population categories when the technical capacities of tablets are considered. Furthermore, given the rapid changes in smartphone capabilities, it is important to revisit questions of the digital divide with respect to mobile technology (Hargittai and Kim, 2010). In this case, differences in device opportunity might decrease between devices. However, it could also mean that inequality in the technical potential of devices is growing.
In this study, we have revealed that inequalities in material access are present in the Netherlands. Structural differences appear when particular segments of the population systematically and over longer periods of time take advantage of better devices and peripherals, while others use devices that enable fewer opportunities. Future research should determine whether there is growth or reduction in the multiple material access gaps identified in this article, from a longitudinal perspective.
Footnotes
Funding
The author(s) received no financial support for the research, authorship, and/or publication of this article.