
Abstract
The wind turbine gearbox is a critical transmission component in wind power generation systems, with its operational condition directly affecting the safety, reliability, and stability of the entire system. Given that wind turbine gearboxes operate continuously under complex conditions, including variable rotational speeds, high-speed operations, and coupled alternating loads, the risk of failure significantly increases. Therefore, developing efficient and accurate condition monitoring (CM) technologies is essential to ensure safe wind turbine operation and power generation stability. Order analysis (OA), a widely-used technique in rotating machinery fault diagnosis, plays a pivotal role in fault feature extraction under these complex conditions, thanks to its capability to mitigate speed fluctuation interference. However, traditional OA methods face challenges, such as order confusion during unsteady processes like sudden speed changes and start-stop operations, primarily due to inadequate anti-interference performance. Additionally, target order signals are often overwhelmed by background noise, leading to distorted fault feature extraction that fails to meet practical engineering standards. To address these issues, this paper proposes a combined OA method based on Normalized Least Mean Square (NLMS) filtering and Synchroextracting Transform (SET). First, NLMS filtering is applied to reduce noise in the vibration signals, effectively suppressing interference. Then, SET is used on the filtered signals to generate high-resolution time-frequency (TF) distributions. Finally, accurate separation and extraction of order components is achieved through a multi-ridge detection algorithm. This combined NLMS-SET approach satisfies the dual requirements of noise suppression and time-frequency feature preservation: the NLMS filter adapts to eliminate random noise and background interference, avoiding the attenuation of useful order components seen with traditional filters, while the SET algorithm generates high-aggregation time-frequency distributions without cross-term interference. To validate the effectiveness of the proposed method, comparative analyses are conducted using simulated signals, semi-physical simulation signals, and experimental signals. Results show that the method exhibits excellent performance in order feature extraction under strong noise and unsteady working conditions. Based on this, a LABVIEW-based OA system is developed to automate order feature extraction and visual display, providing reliable technical support for CM and fault diagnosis of wind turbine gearboxes.
Keywords
Highlights
1. A hybrid order extraction algorithm integrating NLMS adaptive filtering and SET time-frequency analysis is proposed, achieving dynamic noise reduction while preserving weak fault order components. 2. The critical issues of energy diffusion in non-stationary signals and order aliasing under strong noise and sudden speed fluctuations are addressed through the construction of adaptive orthogonal spectral bases and an “extraction-energy clearing” strategy. 3. A LabVIEW-based OA system is developed for automatic feature extraction and visual display, overcoming the low efficiency of traditional manual analysis in rotating machinery CM. 4. The algorithm’s effectiveness and robustness are validated through multi-scenario tests, including simulated, semi-experimental, and real measured signals, spanning ideal and engineering-relevant complex operating conditions. 5. A reliable technical solution for CM of key wind turbine transmission components (gearboxes, main bearings) is provided, expanding the technical system for rotating machinery fault diagnosis under complex conditions.
1. Introduction
The rapid integration of smart factories and complex industrial information systems highlights the growing importance of digital monitoring and intelligent management in modern manufacturing.1,2 In the context of the transition toward an electricity-carbon-green market, the reliable operation of renewable energy equipment has become crucial for balancing energy supply stability and environmental benefits.3–5 In wind power generation, the gearbox is a critical drivetrain component, and its effective health monitoring has become a key part of industrial AI applications for design, management, and optimization. Wind turbine systems operate under harsh conditions,6,7 including high wind loads, severe rotational speed fluctuations, and extreme temperature variations. These conditions not only accelerate wear and fatigue damage to key wind turbine components but also significantly increase the risk of equipment failure. As the core power transmission component, the gearbox has a relatively high failure rate, posing substantial challenges for fault diagnosis. 8 Conventional fault diagnosis methods primarily rely on steady-state signal analysis. 9 However, these methods cannot adapt to the significant speed fluctuations occurring during wind turbine operation. This incompatibility leads to reduced diagnostic accuracy and higher misclassification rates.
Existing fault diagnosis methods mainly rely on steady-state signal analysis, which has significant limitations in practical wind turbine applications. OA technology, as an effective method for non-stationary signal analysis, provides a promising solution for CM and fault diagnosis of wind turbines. 10 By transforming non-stationary time-domain signals into stationary order-domain signals, OA can effectively eliminate the influence of rotational speed fluctuations on signal analysis and accurately extract fault characteristic information. However, existing OA methods still have certain limitations. For example, the order-frequency Holo-Hilbert spectral analysis (OFHHSA) method proposed in Ref. 11, although effective for demodulating fault information from time-varying vibration signals, still inherits defects from the underlying decomposition method, heavily depends on rotational speed signals, and has a complex physical interpretation. Similarly, the TF compression transform method in Ref. 12, which uses short-time Fourier transform (STFT) to compute the TF representation of signals, is highly sensitive to parameter settings and thus limited in its application. The time-varying filtering (TVF) method in Ref. 13, which implements local filtering, still makes significant simplifying assumptions. The General Chirplet Transform (GCBT) method in Ref. 14, although designed for non-stationary signals with multiple non-proportional fundamental frequencies, suffers from high computational complexity and strong dependency on assumptions.
Despite breakthroughs in existing non-stationary signal analysis methods, they still face significant challenges in the application to wind turbines, especially in complex working conditions and under strong noise interference. To address these issues, this paper proposes a combined order extraction algorithm based on NLMS filtering and SET TF analysis. The innovation of this method lies in the following: first, the NLMS filtering algorithm is used for signal preprocessing, effectively suppressing random noise while retaining useful fault feature signals, laying a high-quality data foundation for subsequent OA. Second, SET TF analysis is introduced to characterize the filtered signals with high resolution. SET reconstructs the traditional wavelet transform TF coefficients by “squeezing” them along the frequency axis, effectively solving the problems of poor time-frequency concentration and energy diffusion in non-stationary signals. Combined with the multi-ridge detection algorithm, this method can accurately locate the dynamic trajectories of each order component. Finally, the precise separation and reconstruction of target order signals are achieved. Compared to traditional methods, the proposed method provides more stable and accurate fault diagnosis results under strong noise and unsteady operating conditions.
2. Contributions
The advantages of this paper are mainly reflected in three aspects:
First, a combined order extraction algorithm based on NLMS filtering and SET TF analysis is proposed. From a theoretical perspective, NLMS filtering achieves a precise balance between dynamic noise reduction and fault feature preservation by virtue of its adaptive iterative update mechanism. Specifically, its normalized step-size adjustment capability enables real-time adaptation to the amplitude fluctuations of vibration signals, which not only efficiently mitigates random background noise and transient interference but also minimizes the excessive attenuation of weak fault order components—a common limitation of traditional fixed-coefficient filtering—thereby providing a high signal-to-noise ratio (SNR) and pure signal input for subsequent TF analysis. Building on this foundation, SET TF analysis fundamentally addresses the energy diffusion issue of non-stationary signals through the construction of adaptive orthogonal spectral element basis functions. Furthermore, integrating the iterative multi-ridge algorithm with an “extraction-energy clearing” strategy, leveraging the high-SNR and high-aggregation TF framework established by NLMS-SET preprocessing, effectively overcomes the order aliasing bottleneck under strong noise and sudden speed fluctuation conditions. This integrated approach theoretically ensures the accuracy and stability of fault feature extraction while significantly enhancing the algorithm’s adaptability to complex and harsh operating environments.
Second, an OA system is developed based on LABVIEW, enabling automatic extraction, and visual display of order features. It overcomes the limitation of low efficiency in traditional manual analysis, provides a technical tool with usability for CM of key wind turbine components.
Third, comparative verification is conducted based on simulated signals, semi-experimental signals, and measured experimental signals, covering scenarios from ideal environments to complex conditions close to engineering practice. This fully proves the effectiveness and robustness of the proposed algorithm under different noise intensities and different steady/unsteady conditions, providing comprehensive and reliable experimental support for the engineering application and promotion of the algorithm.
This combined algorithm can be directly applied to the CM of key transmission components such as wind turbine gearboxes and main bearings. It not only provides reliable and real-time technical support for equipment CM but also further improves the technical system of wind power equipment fault diagnosis. Moreover, it offers a new technical approach for the CM of rotating machinery under complex operating conditions.15,16
3. Principle
3.1. Vibration signal adaptive filtering based on NLMS
The core idea of the NLMS algorithm is to normalize the energy of the input signal and optimize the step size parameter,
17
thereby improving the algorithm’s convergence speed and stability under different input conditions. Assuming the input signal of the adaptive filter is

After introducing the normalization factor, the update equation is given by formula (2).

3.2. IRF estimation based on SET combination with ridge detection method
The SET is a TF redistribution method that can significantly improve the concentration of TF representation. By redistributing the TF representation of the STFT, SET retains only the STFT coefficients most relevant to the time-varying characteristics of the signal and removes the most ambiguous TF energy, thereby greatly enhancing the energy concentration of the new TF representation. In other words, SET discards some STFT coefficients to obtain a TF representation with high energy concentration. Therefore, we first introduce the STFT, whose definition is as shown in formula (3).


By applying the unit impulse function, only the time-frequency coefficients along the ridge
The SET can concentrate signal energy at the IF, significantly improving the energy concentration of TF representation. This feature not only facilitates more accurate extraction of order components but also maintains high TF resolution in noisy environments, effectively suppressing noise interference. In this paper, SET is applied to vibration signals to achieve their TF analysis. 18
Ridge detection technology can accurately estimate a series of order components based on TF signals, and scholars have conducted extensive research on ridge detection methods based on TF distributions. Reference 19 proposes detecting the IF of signals by searching for the maximum value in the TF representation. Although this method is easy to implement, it is highly susceptible to noise or interference from other components, making it difficult to apply in practical engineering scenarios. This paper adopts the ridge extraction method proposed in Ref. 20–22, which can estimate the IF information of the order component with the highest energy in vibration signals. The core logic is as follows: after extracting one ridge, the energy near the ridge is set to zero, and then the next ridge is extracted. The specific steps of the algorithm are as follows. 1. Initial localization of the maximum energy position. Based on the TF distribution 2. Initialization of time boundaries. Based on the sampling frequency fs, the initial left and right time boundaries are defined as: : 3. IF Calculation. The IF at the left time point 4. Iterative update of time boundaries. Update the left and right time boundaries to expand the trajectory tracking range, with the update formulas given by: 5. Multi-ridge extraction. After extracting a smooth IF ridge IF(t), suppress the energy within the bandwidth BW of this ridge, update the energy matrix, and repeat Steps 1-4 to extract subsequent ridges. The specific operations are as shown in Figure 1. Multi-ridge detection algorithm and error analysis flowchart.

num_ridge denotes the number of ridges to be extracted. As indicated by the above analysis, this method features an easy implementation, requiring only the input of the TF representation of the vibration signal, bandwidth BW, and the number of ridges to complete order detection. Therefore, this paper adopts a combined workflow of “NLMS filtering-SET TF transformation-Multi-ridge detection”: first, the vibration signal is preprocessed by NLMS filtering; then, the high-resolution TF representation is obtained via SET; finally, the target order components are accurately extracted by integrating the multi-ridge detection algorithm.
3.3. The proposed method
Finally, the flowchart of the proposed method is presented in Figure 2. A flowchart for order components extraction for wind turbine gearbox fault detection based on SET Joint NLMS.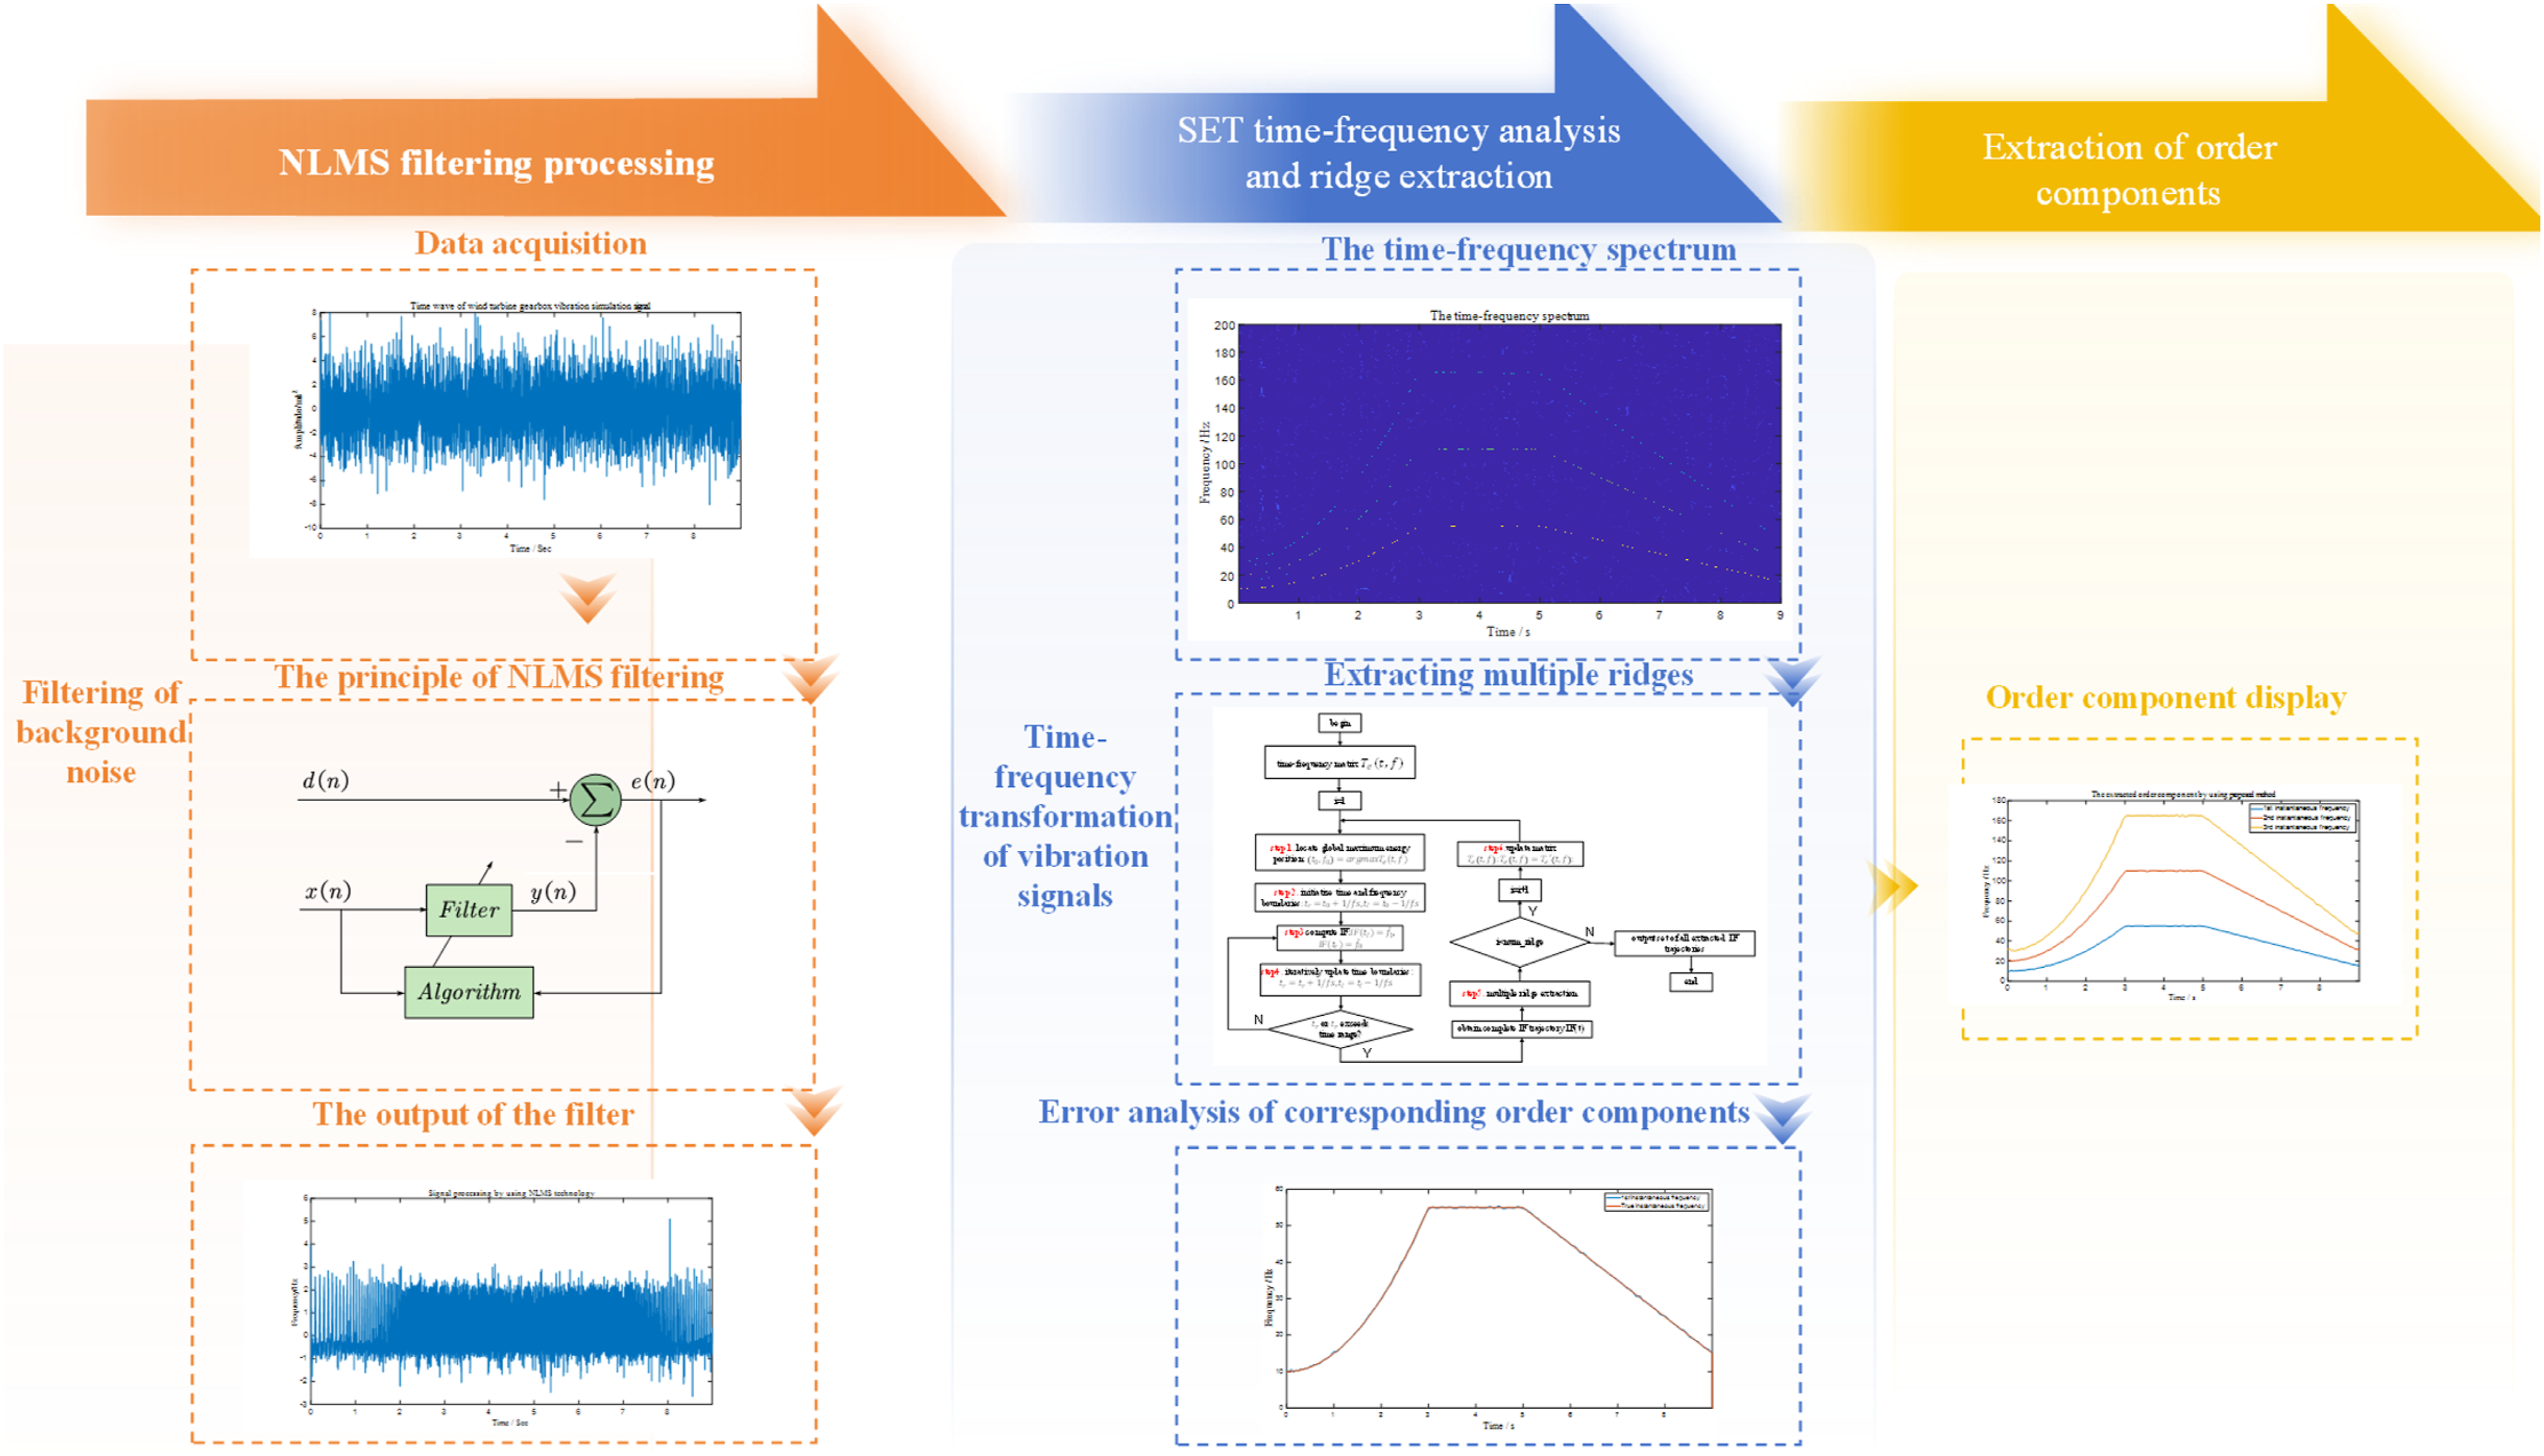
It is noteworthy that the extraction accuracy of order components is related to the parameter values of the proposed method. In the adaptive filtering process, regularization parameter
In the SET processing, the length of the window function plays a key role. A shorter window function can improve time resolution and accurately capture the instantaneous changes of the signal, but it will reduce frequency resolution, leading to blurred frequency information. On the contrary, a longer window function will improve frequency resolution and clearly separate frequency components, but it will reduce time resolution, making it difficult to capture instantaneous changes. To balance time resolution and frequency resolution, this study sets the length of the window function according to the proportion of the signal length, with a default value of 1/8 of the signal length. This setting enables us to obtain refined frequency information while maintaining sensitivity to instantaneous changes under the condition of varying rotational speed. In the ridge search, it is necessary to select the number of ridges, with a default value of 3. When the input is 1, only the instantaneous rotational frequency (IRF) of the wind turbine is extracted, and the research on order components cannot be carried out; however, when the input value is too large, most of the subsequently extracted ridges are invalid. Affecting the analysis effect.
It is worth noting that the accuracy of order component extraction is related to the parameter values of the proposed method. In the adaptive filtering process, the regularization parameter σ, filter order M, and convergence criterion play important roles in the estimation results. For the regularization parameter
In the SET process, the length of the window function plays a key role. A shorter window function improves time resolution and accurately captures instantaneous changes in the signal, but it reduces frequency resolution, leading to blurred frequency information. In contrast, a longer window function enhances frequency resolution, clearly separating frequency components, but it lowers time resolution, making it more difficult to capture instantaneous changes. To balance time resolution and frequency resolution, this study sets the window function length to 1/8 of the signal length, based on the proportion of the signal length. This setting allows us to obtain refined frequency information while maintaining sensitivity to instantaneous changes, adapting to varying rotational speeds.
In ridge search, the number of ridges must be selected, with a default value of 3. When the input is 1, only the instantaneous rotational frequency (IRF) of the wind turbine is extracted, and order component analysis cannot be conducted. However, when the input value is too large, most of the subsequently extracted ridges become invalid, affecting the analysis results.
4. Experimental verification
4.1 Simulation signal analysis
To verify the applicability of the proposed method for extracting the order components of the wind turbine gearbox main shaft under variable speed conditions, and considering that the main shaft generally involves three operating conditions (nonlinear variable speed, constant speed, and linear variable speed),23,24 a simulated signal
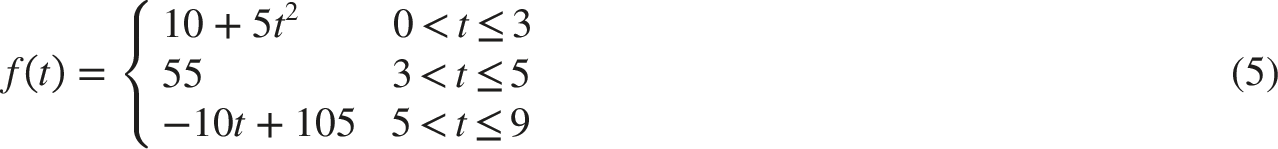
The sampling frequency is 600Hz, and the simulation time is 9s. Meanwhile, taking the IRF

To more accurately reflect the actual operating conditions of the wind turbine gearbox, white noise is also added as a background interference term

Figure 3(a) shows the time wave of The time-domain graph and instantaneous rotating frequency corresponding to signal 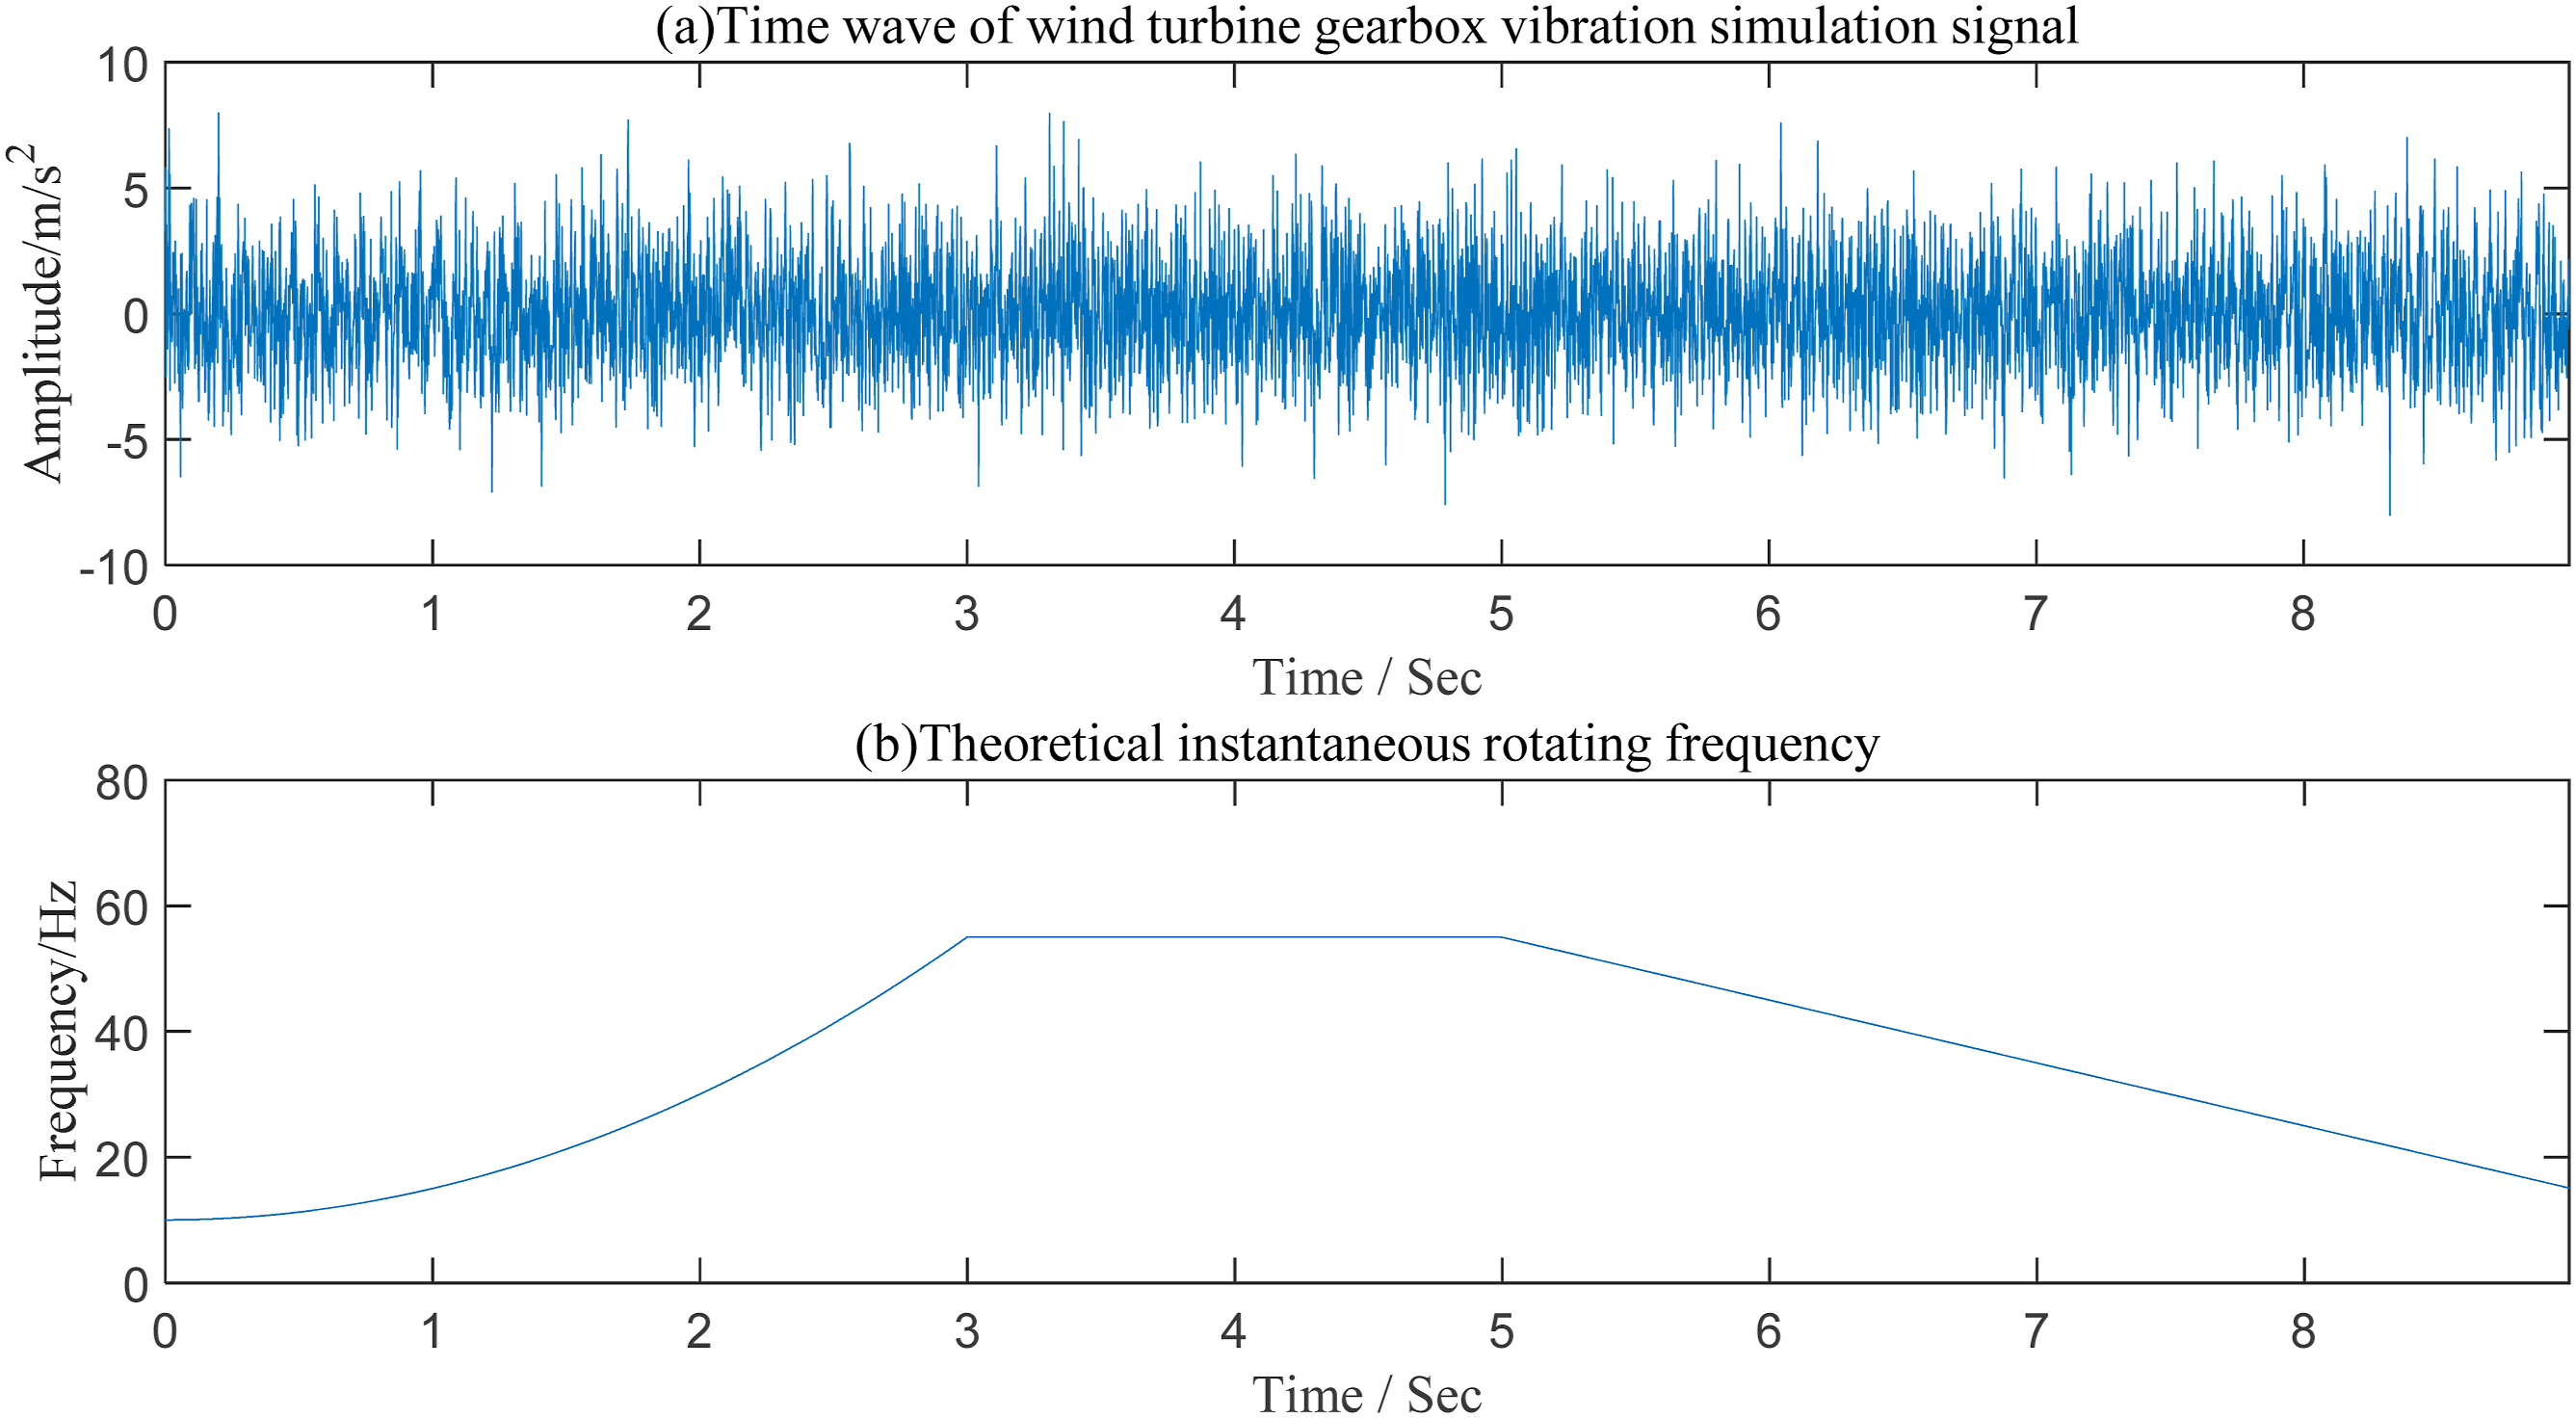
In the first stage, the adaptive filtering is applied to process the signal Signal processing by using NLMS techology.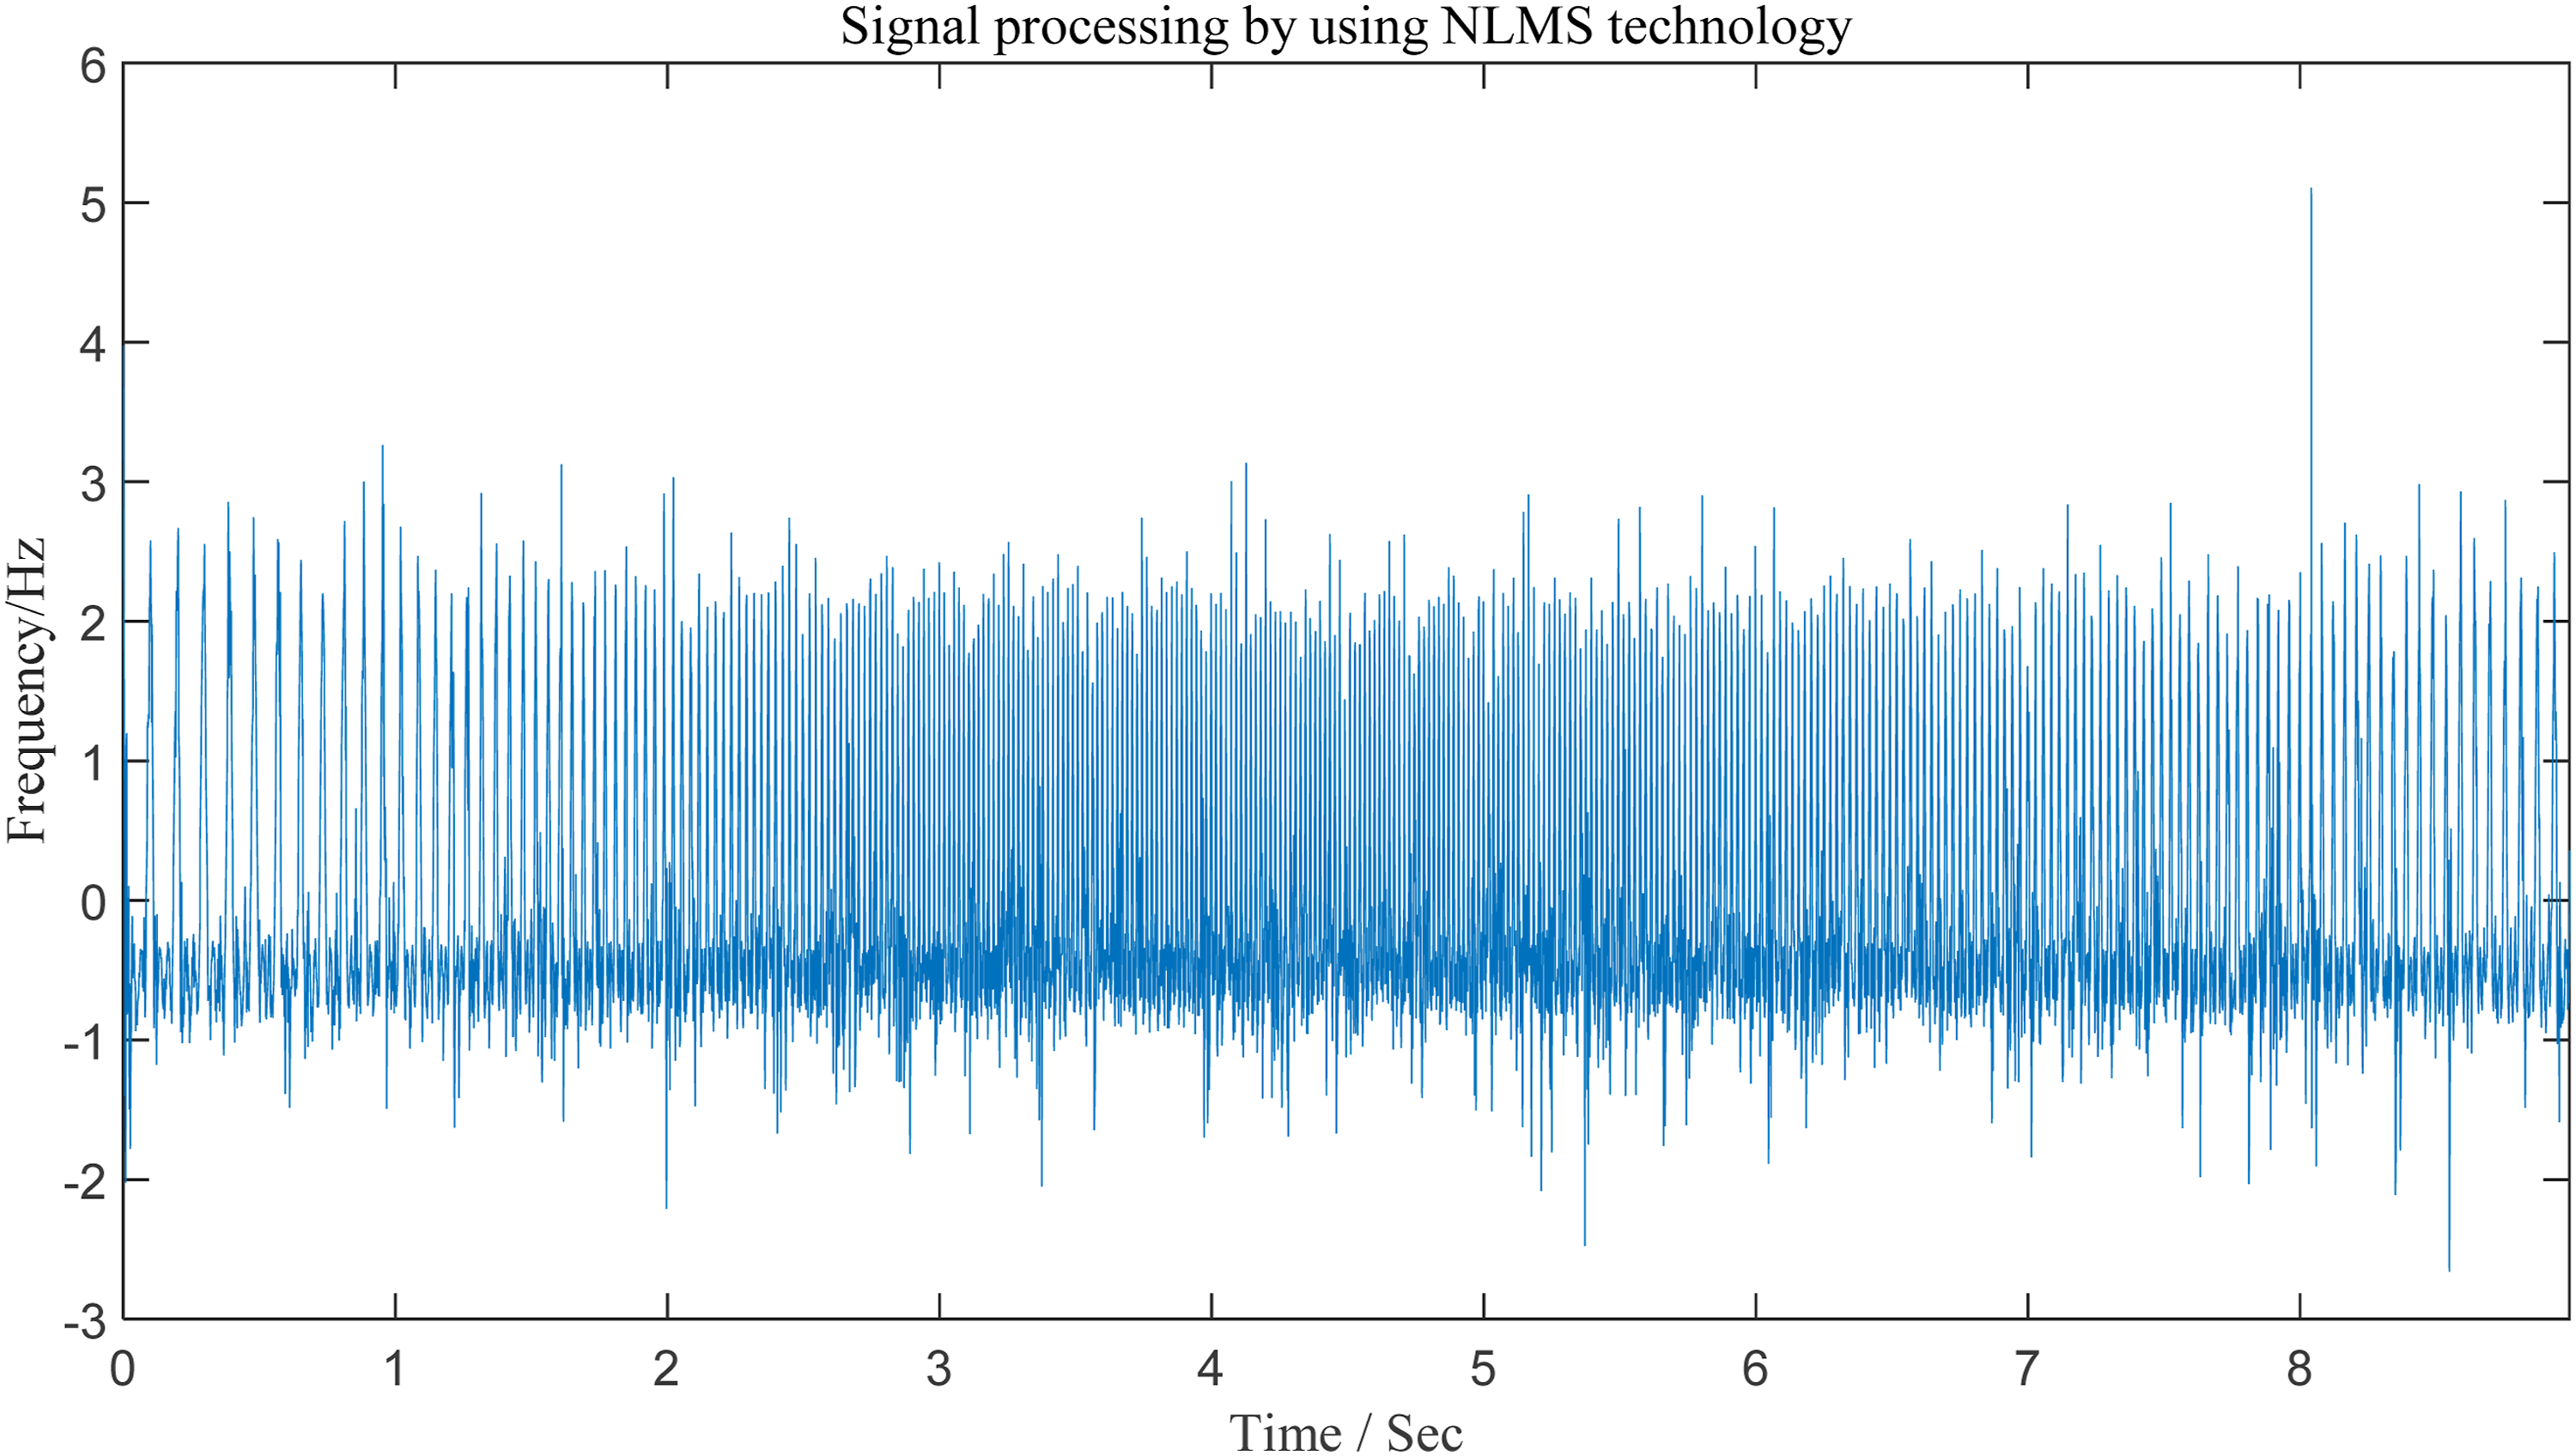
As shown in Figure 4, the waveform of the original simulated signal x(t) is disordered with scattered energy; after processing by the NLMS algorithm, the waveform of the output signal The result of reconstruction signal 
To quantitatively verify the above conclusions, three error metrics Mean Absolute Error (MAE),
25
Mean Absolute Percentage Error (MAPE)
26
and correlation coefficient(R)
27
are adopted in this paper to comprehensively evaluate the accuracy and reliability of the order component extraction results. Their calculation formulas are given by Equation (8), Equation (9), and Equation (10) respectively.


The accuracy of order components extraction is quantitatively analyzed using three evaluation metrics, namely MAE, MAPE and R. Meanwhile, to verify the effectiveness of the algorithm proposed in this paper for wind turbine gearbox signal analysis, its performance in extracting order components is compared horizontally with that of the (Adaptive Chirp Mode Decomposition) ACMD method. Since the Ref. 28 has experimentally compared the order component extraction performance of ACMD, (Empirical Mode Decomposition)EMD, and (Variational Mode Decomposition)VMD, and clearly confirmed that ACMD achieves the optimal effect, this paper does not repeatedly compare EMD and VMD.
Evaluation indicator result corresponding to different signals.
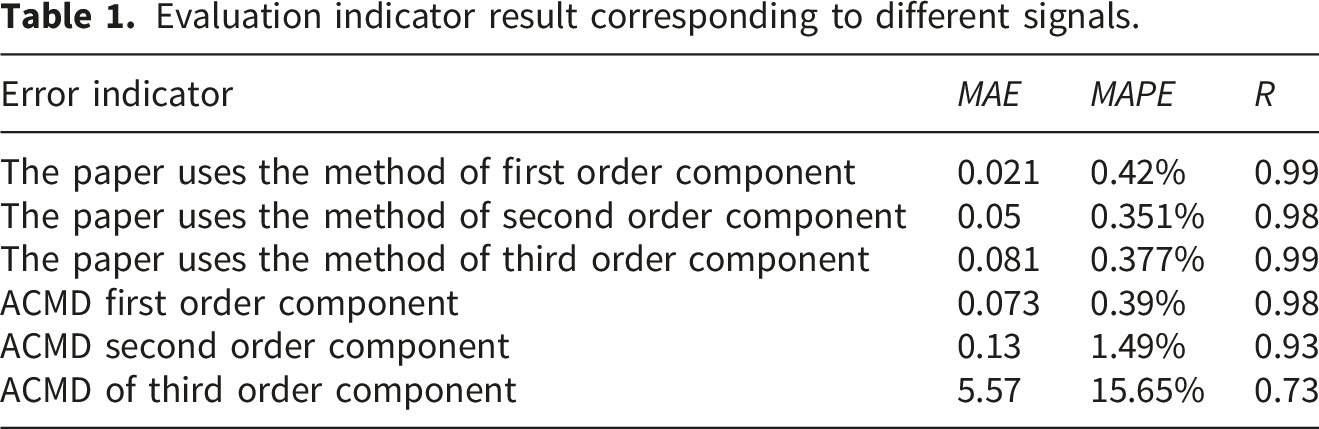
This Table 1 shows the results of error evaluation indicators for different order components, including three metrics: MAE (0.021 for the first-order component, 0.05 for the second-order, and 0.081 for the third-order), MAPE (0.42% for the first-order, 0.351% for the second-order, and 0.377% for the third-order), and R (0.99 for the first-order, 0.98 for the second-order, and 0.99 for the third-order). These indicators measure the accuracy of signal analysis for each order component; the small error values and high correlation coefficients indicate that the analysis results are highly reliable. Looking at the error analysis results of the order components extracted by ACMD: although its first-order component extraction accuracy is relatively high-with a corresponding MAE of 0.073, MAPE of 0.39%, and R of 0.98-the extraction accuracy of its higher-order components is significantly lower than that of the algorithm proposed in this paper.
To verify the superiority of the proposed algorithm in this paper, the original signal The compared TF spectrum corresponding to original signal 
Evaluation indicator result corresponding to different signals.
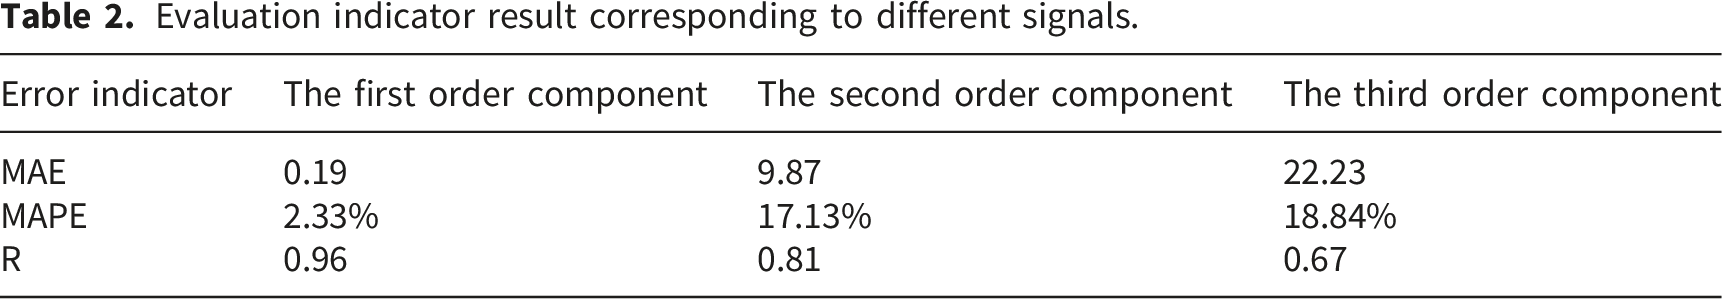
Table 2 presents the error evaluation indicator results for different order components, covering three metrics: MAE (0.19 for the first-order component, 9.87 for the second-order, and 22.23 for the third-order), MAPE (2.33% for the first-order, 17.13% for the second-order, and 18.84% for the third-order), and correlation coefficient R (0.96 for the first-order, 0.81 for the second-order, and 0.67 for the third-order). These metrics quantify the extraction accuracy of each order component under variable-speed conditions. The second-order component exhibits the highest MAPE (17.13%) and a slightly lower R value compared to the first-order component, while the third-order component shows the largest MAE (22.23) and the lowest correlation coefficient (R=0.67). This indicates that the extraction accuracy of high-order components (especially the third-order) is relatively weaker than that of the fundamental frequency component, which is mainly attributed to the energy attenuation and noise interference of high-order harmonics in non-stationary vibration signals.
The fundamental frequency component extracted by the ridge detection is taken as the IRF of the wind turbine, and the angle-equivalent resampling (also known as order tracking resampling) technique is adopted to convert the non-stationary time-domain signal into a stationary angle-domain signal.29,30 In this process, the angular increment of the rotating component is used as the sampling interval instead of a fixed time interval, which effectively eliminates the spectral smearing problem caused by rotational speed fluctuations in traditional time-domain sampling. The resampled angle-domain signal exhibits periodicity corresponding to the rotation period, and fault-related features are stabilized at fixed order positions. Ensuring the consistency and accuracy of fault feature extraction under operating conditions such as linear variable speed, constant speed, and nonlinear variable speed is a key prerequisite for reliable fault diagnosis of rotating machinery under complex operating conditions. Therefore, this paper further studies the order power spectrum of vibration signals. The order power spectrum of the simulated signal is shown in Figure 7. The order power spectrum of the simulated signal.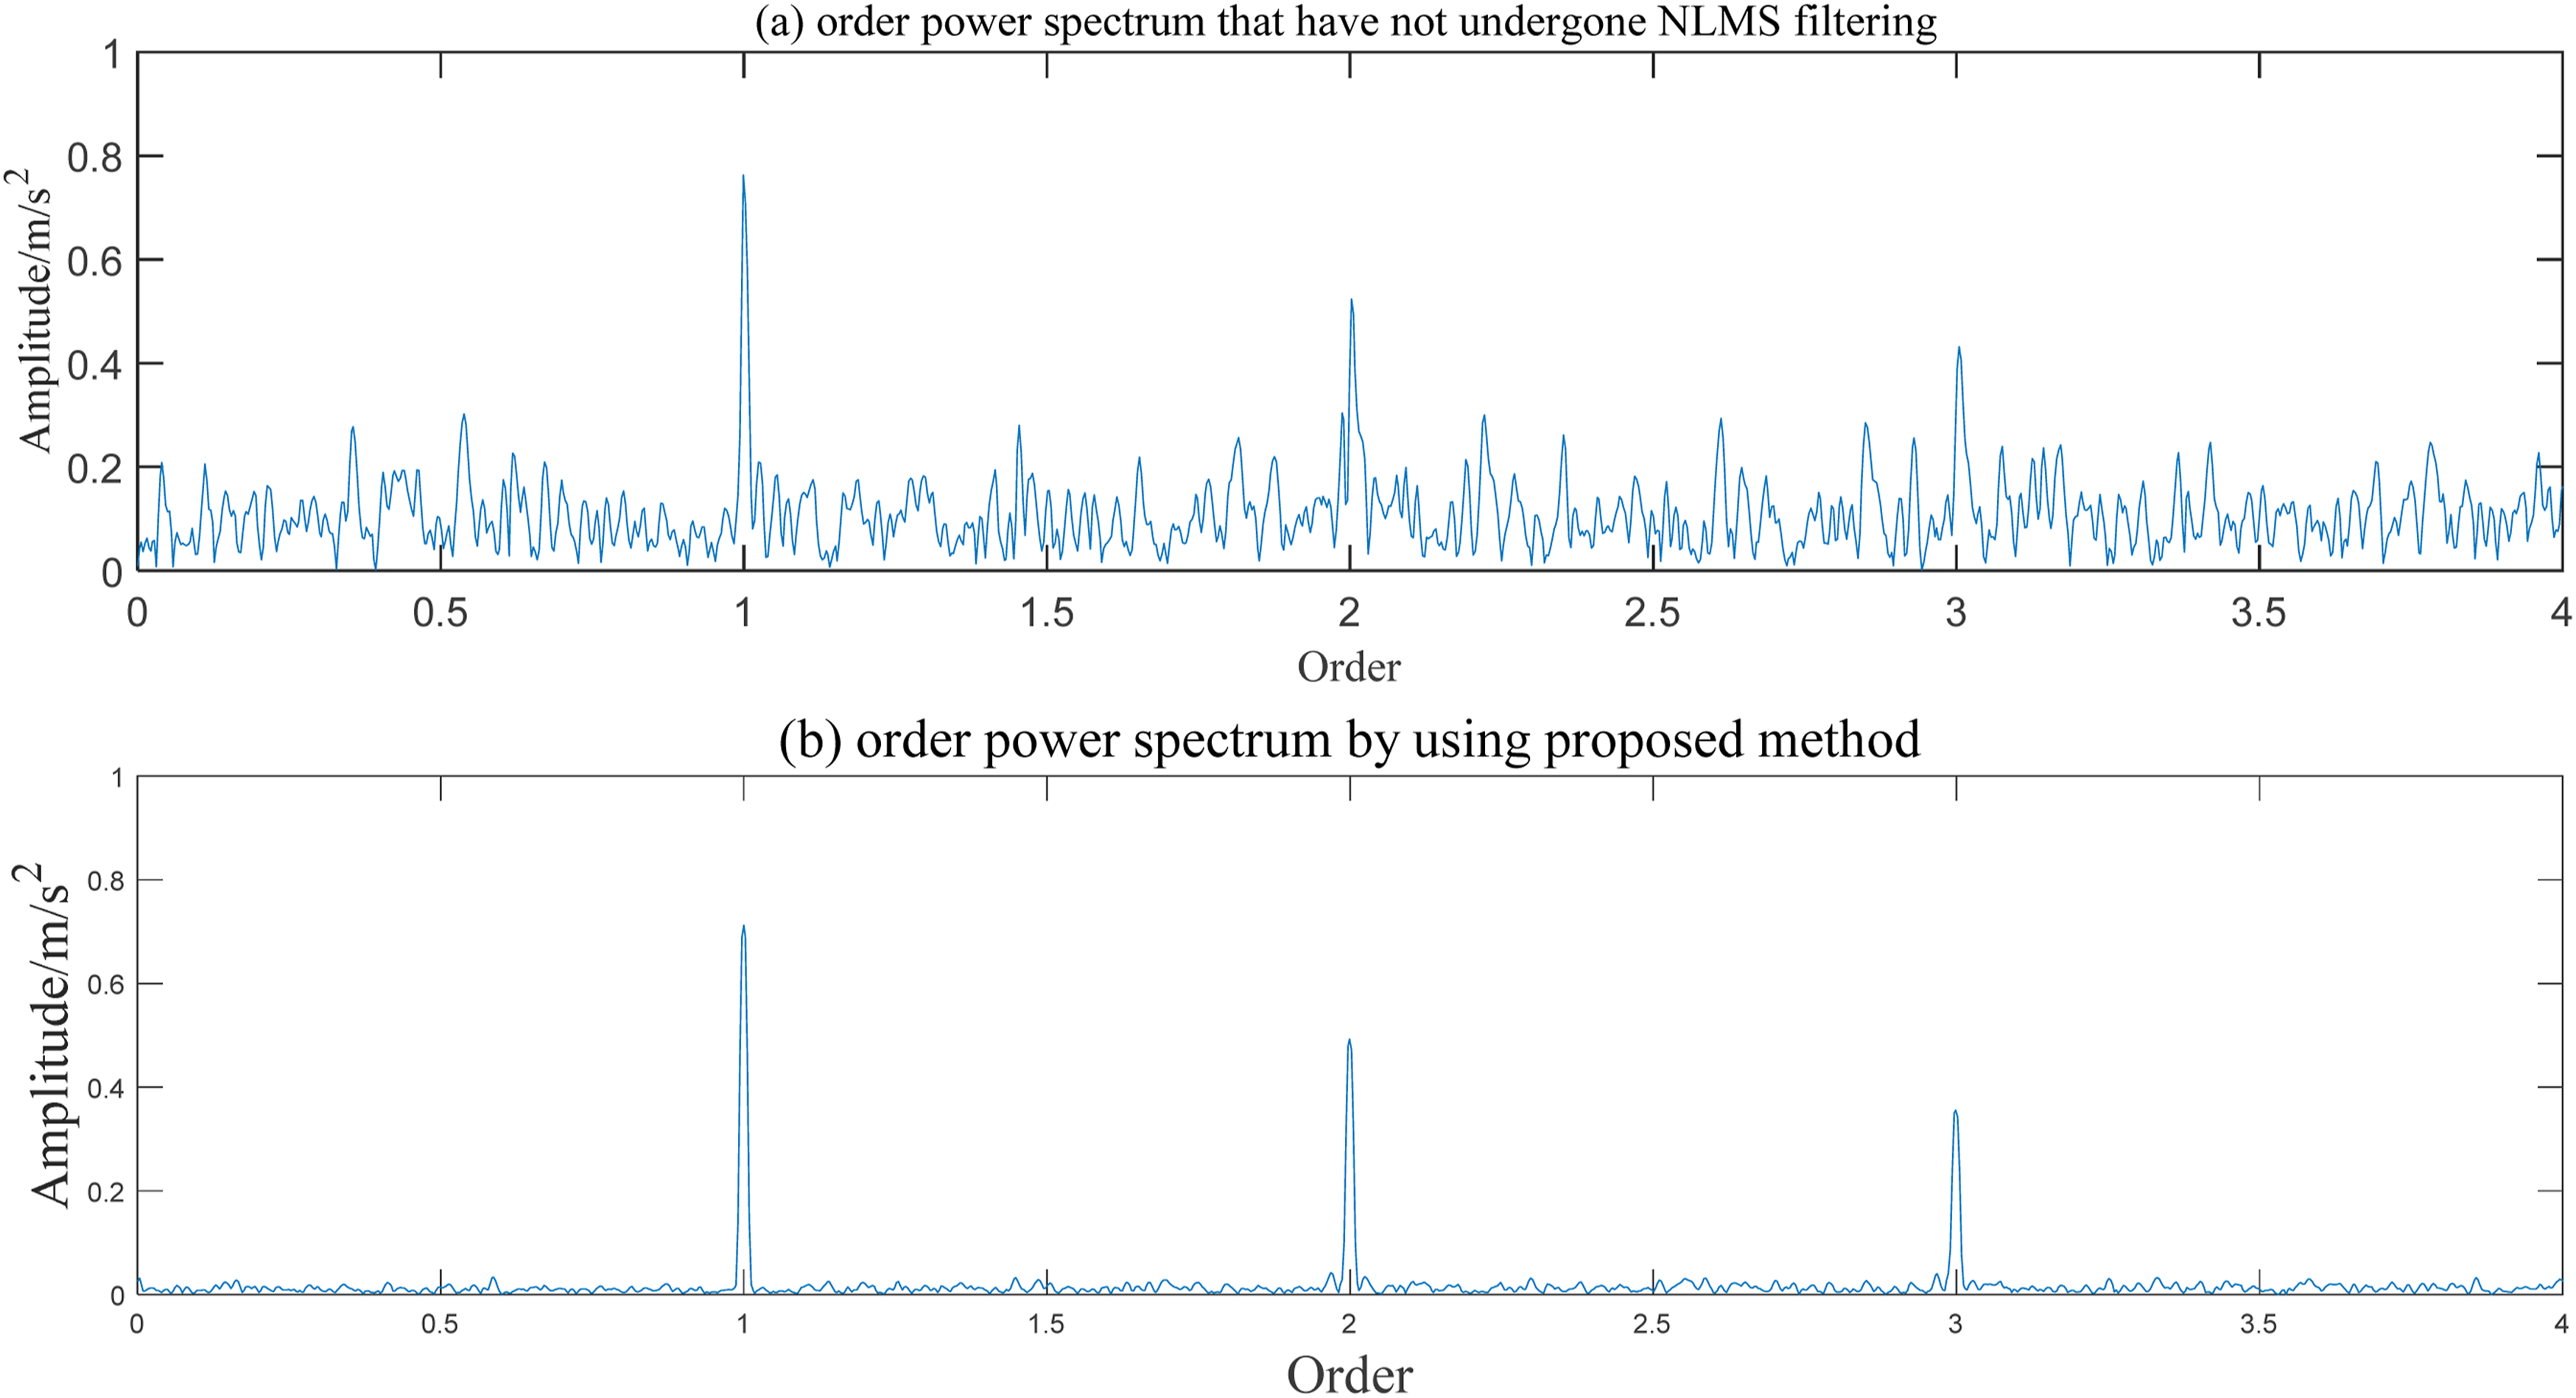
In Figure 7, (a) presents the order power spectrum obtained by directly performing SET and multi-ridge extraction on the simulated signal
4.2. Semi-physical simulation
To further verify the effectiveness of the proposed method, a dynamic signal processing device is designed in this paper to generate frequency-swept signals based on the variable-speed operating conditions of wind turbines. Specifically, the device consists of a DG1032 signal generator, an NI PXI signal processing platform, and a display, as shown in Figure 8. Semi-physical platform and validation signal 
To fit the multi-component characteristics of the fault vibration signal of the gearbox main shaft under variable-speed conditions, a linear frequency-swept component 
The proposed method is applied to process the verification signal X, yielding its TF representation results and extracting the order components. The relevant results are shown in Figure 9. TF representation and instantaneous rotating frequency corresponding to validation signal 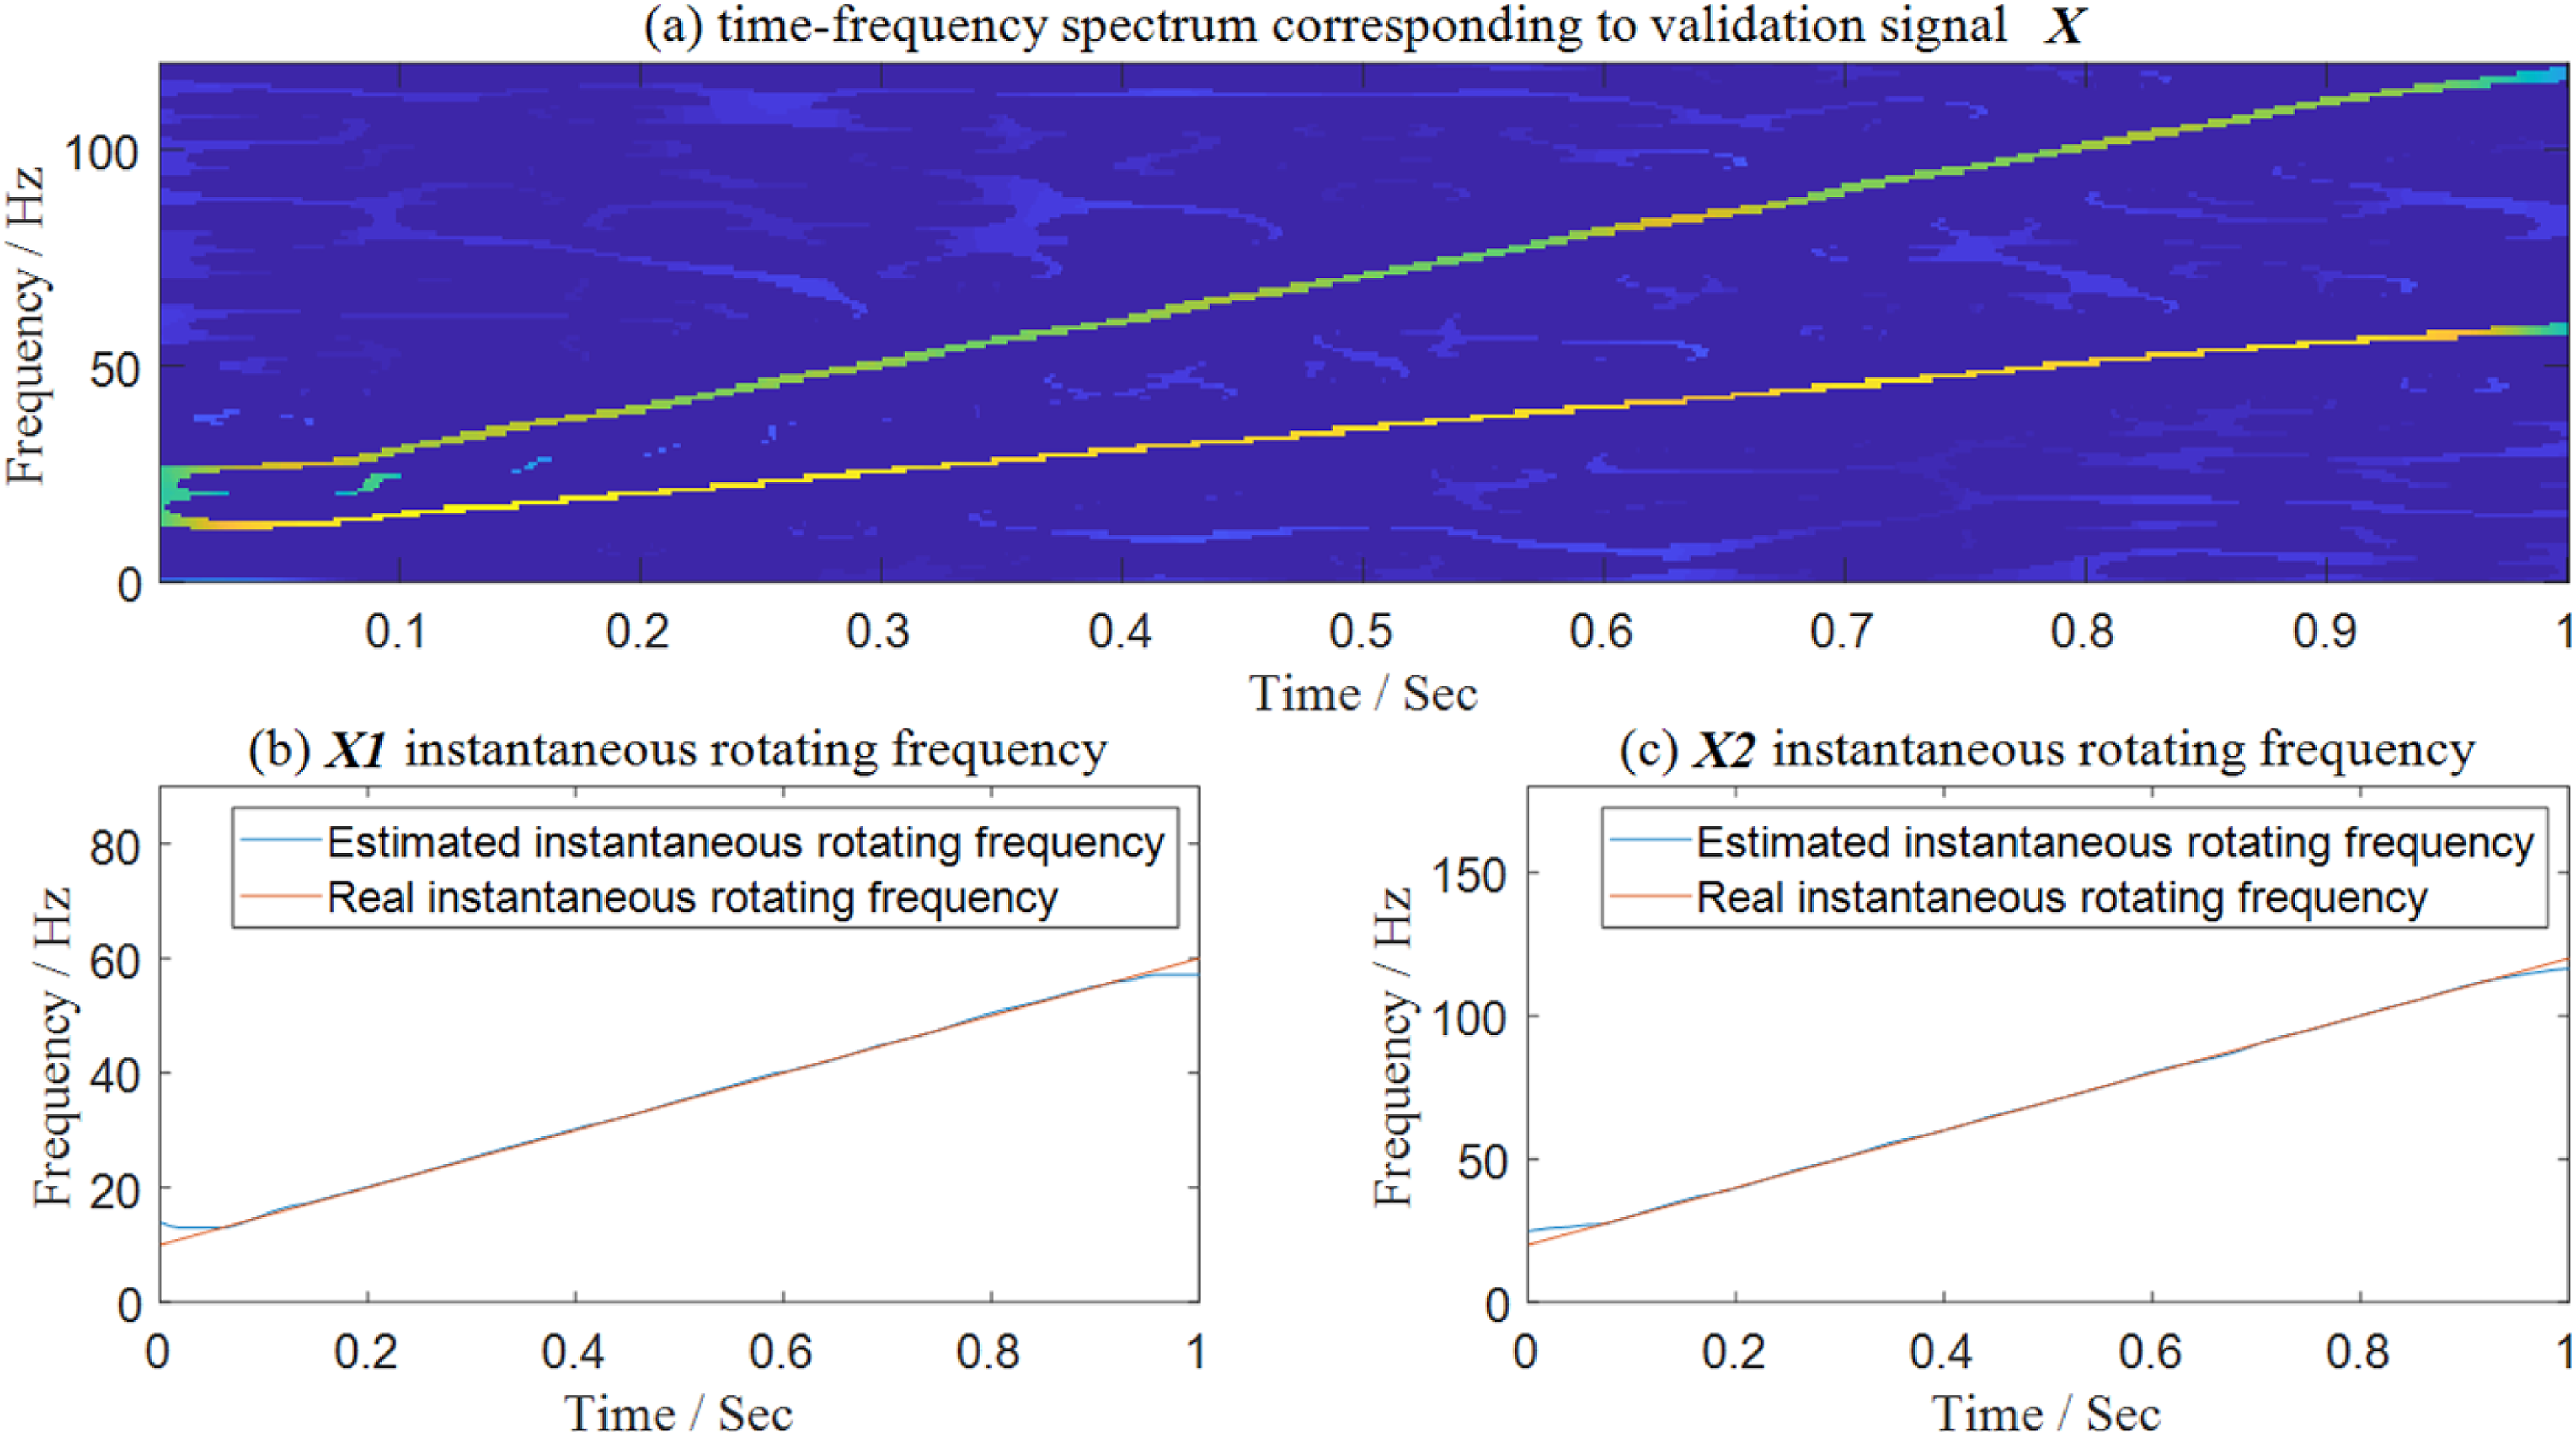
Evaluation indicator result corresponding to different signals.
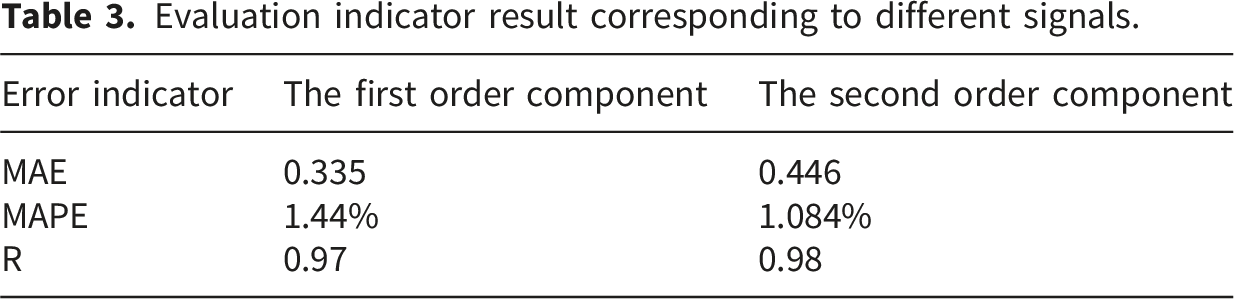
Table 3 shows the results of error evaluation indicators for different order components, including three metrics: MAE (0.335 for the first-order component, 0.446 for the second-order), MAPE (1.44% for the first-order, 1.084% for the second-order), and R (0.97 for the first-order, 0.98 for the second-order). These indicators measure the accuracy of signal analysis for each order component; it can be seen that both the first-order and second-order components have relatively small error values, and their correlation coefficients are close to 1, which indicates that the analysis results of the order components in this scenario are highly reliable.
The order power spectrum of X is illustrated in Figure 10. Order power spectrum of the Semi-physical simulation signal.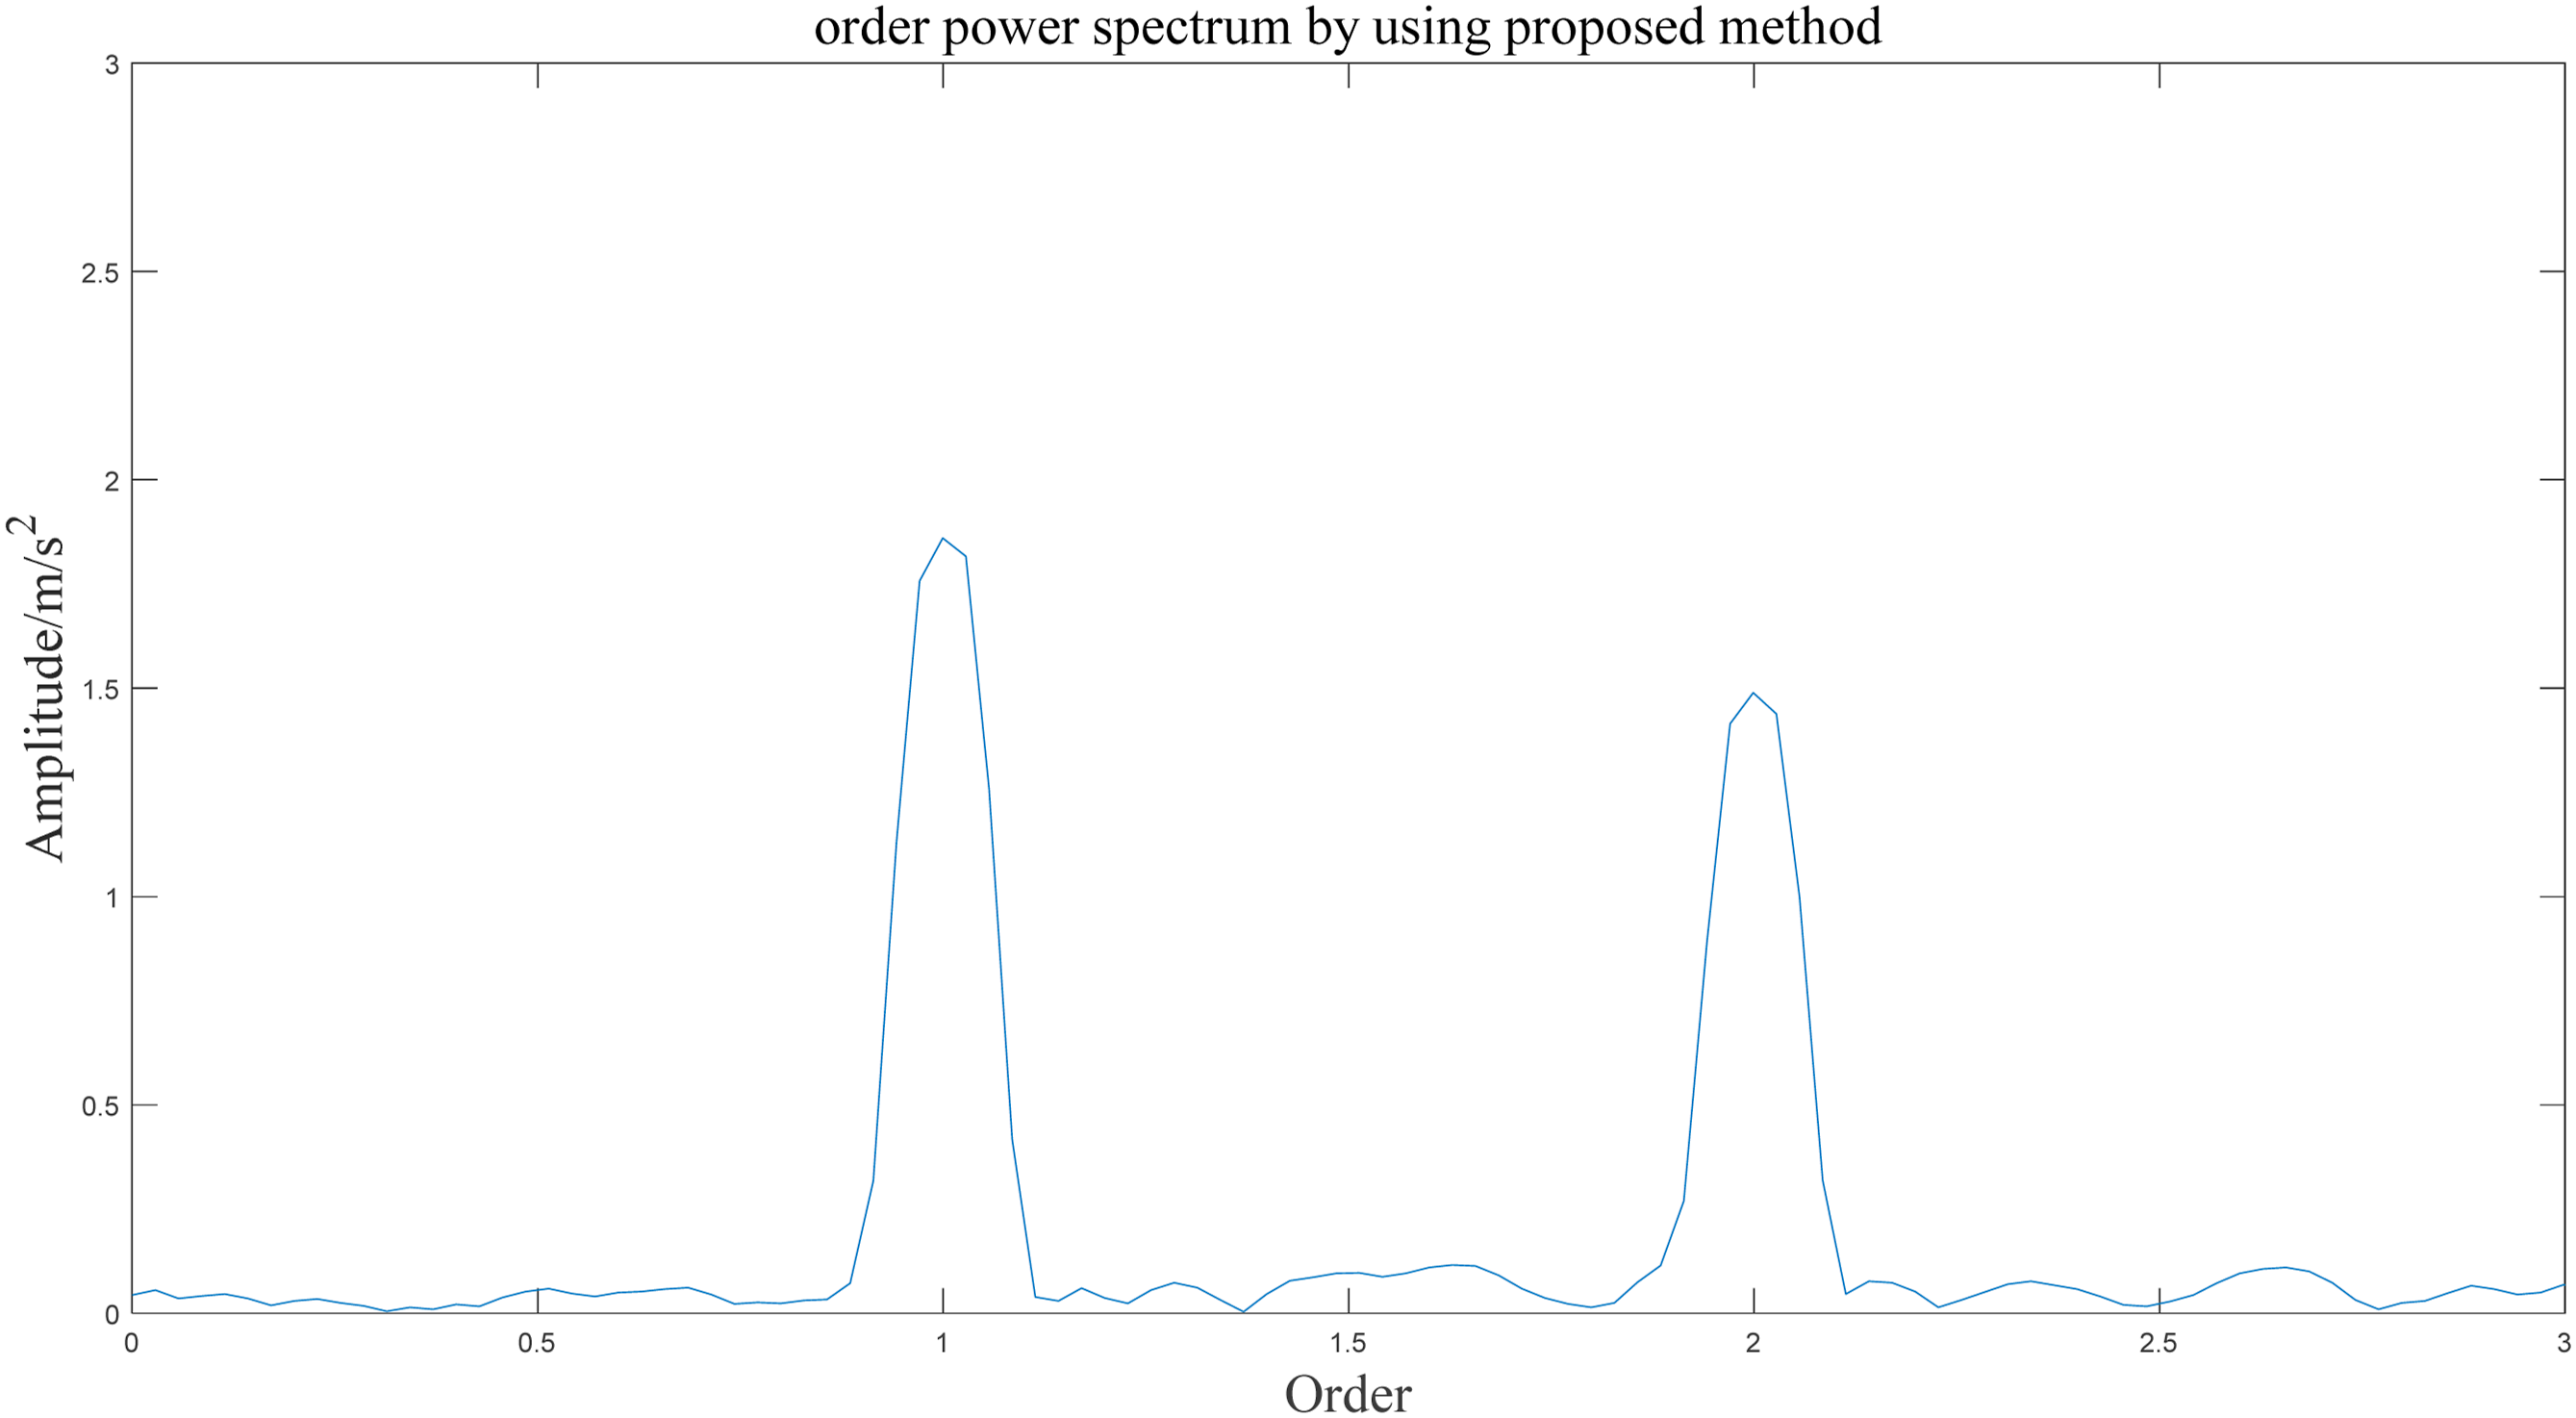
For the semi-physical simulation experimental signal X, distinct peaks corresponding to the fundamental frequency and 2nd harmonic are present in its order power spectrum, with noise interference effectively filtered out.
4.3. Rolling bearing varying speed fault validation
Finally, to verify the practical application effect of the proposed method in order components extraction, a fault vibration signal E(t) under variable-speed conditions is generated using a rolling bearing fault test rig in this paper. The experimental platform primarily consists of a driving motor, a rotor assembly, and a loading unit. Piezoelectric accelerometers are employed to measure the vibration responses of the motor bearing, with signal acquisition performed using the CoCo80 data acquisition system. The bearing utilized in the test is an NSK 6203 model, with the faulty bearing positioned at the motor’s drive end. The accelerometer is mounted on a magnetic base and positioned directly above the end cover of the motor drive end, as shown in Figure 11. The sampling frequency of the test is 25.6 kHz.31–33 Experimental verification platform.
In Figure 11: 1 represents the motor; 2 represents the acceleration sensor; 3 represents the dynamic signal analyzer; 4 represents the rotor; 5 represents the load.
Since the length of the rolling bearing test signal E(t) includes 768,000 sampling points, the data volume is extremely large. Direct analysis will lead to low efficiency and insufficient memory. Therefore, this paper first performs downsampling on the signal, with the down sampling factor set to 50. The sampling frequency after processing is 512 Hz, and the relevant results are shown in Figure 12. The time-domain waveform of experimental signal.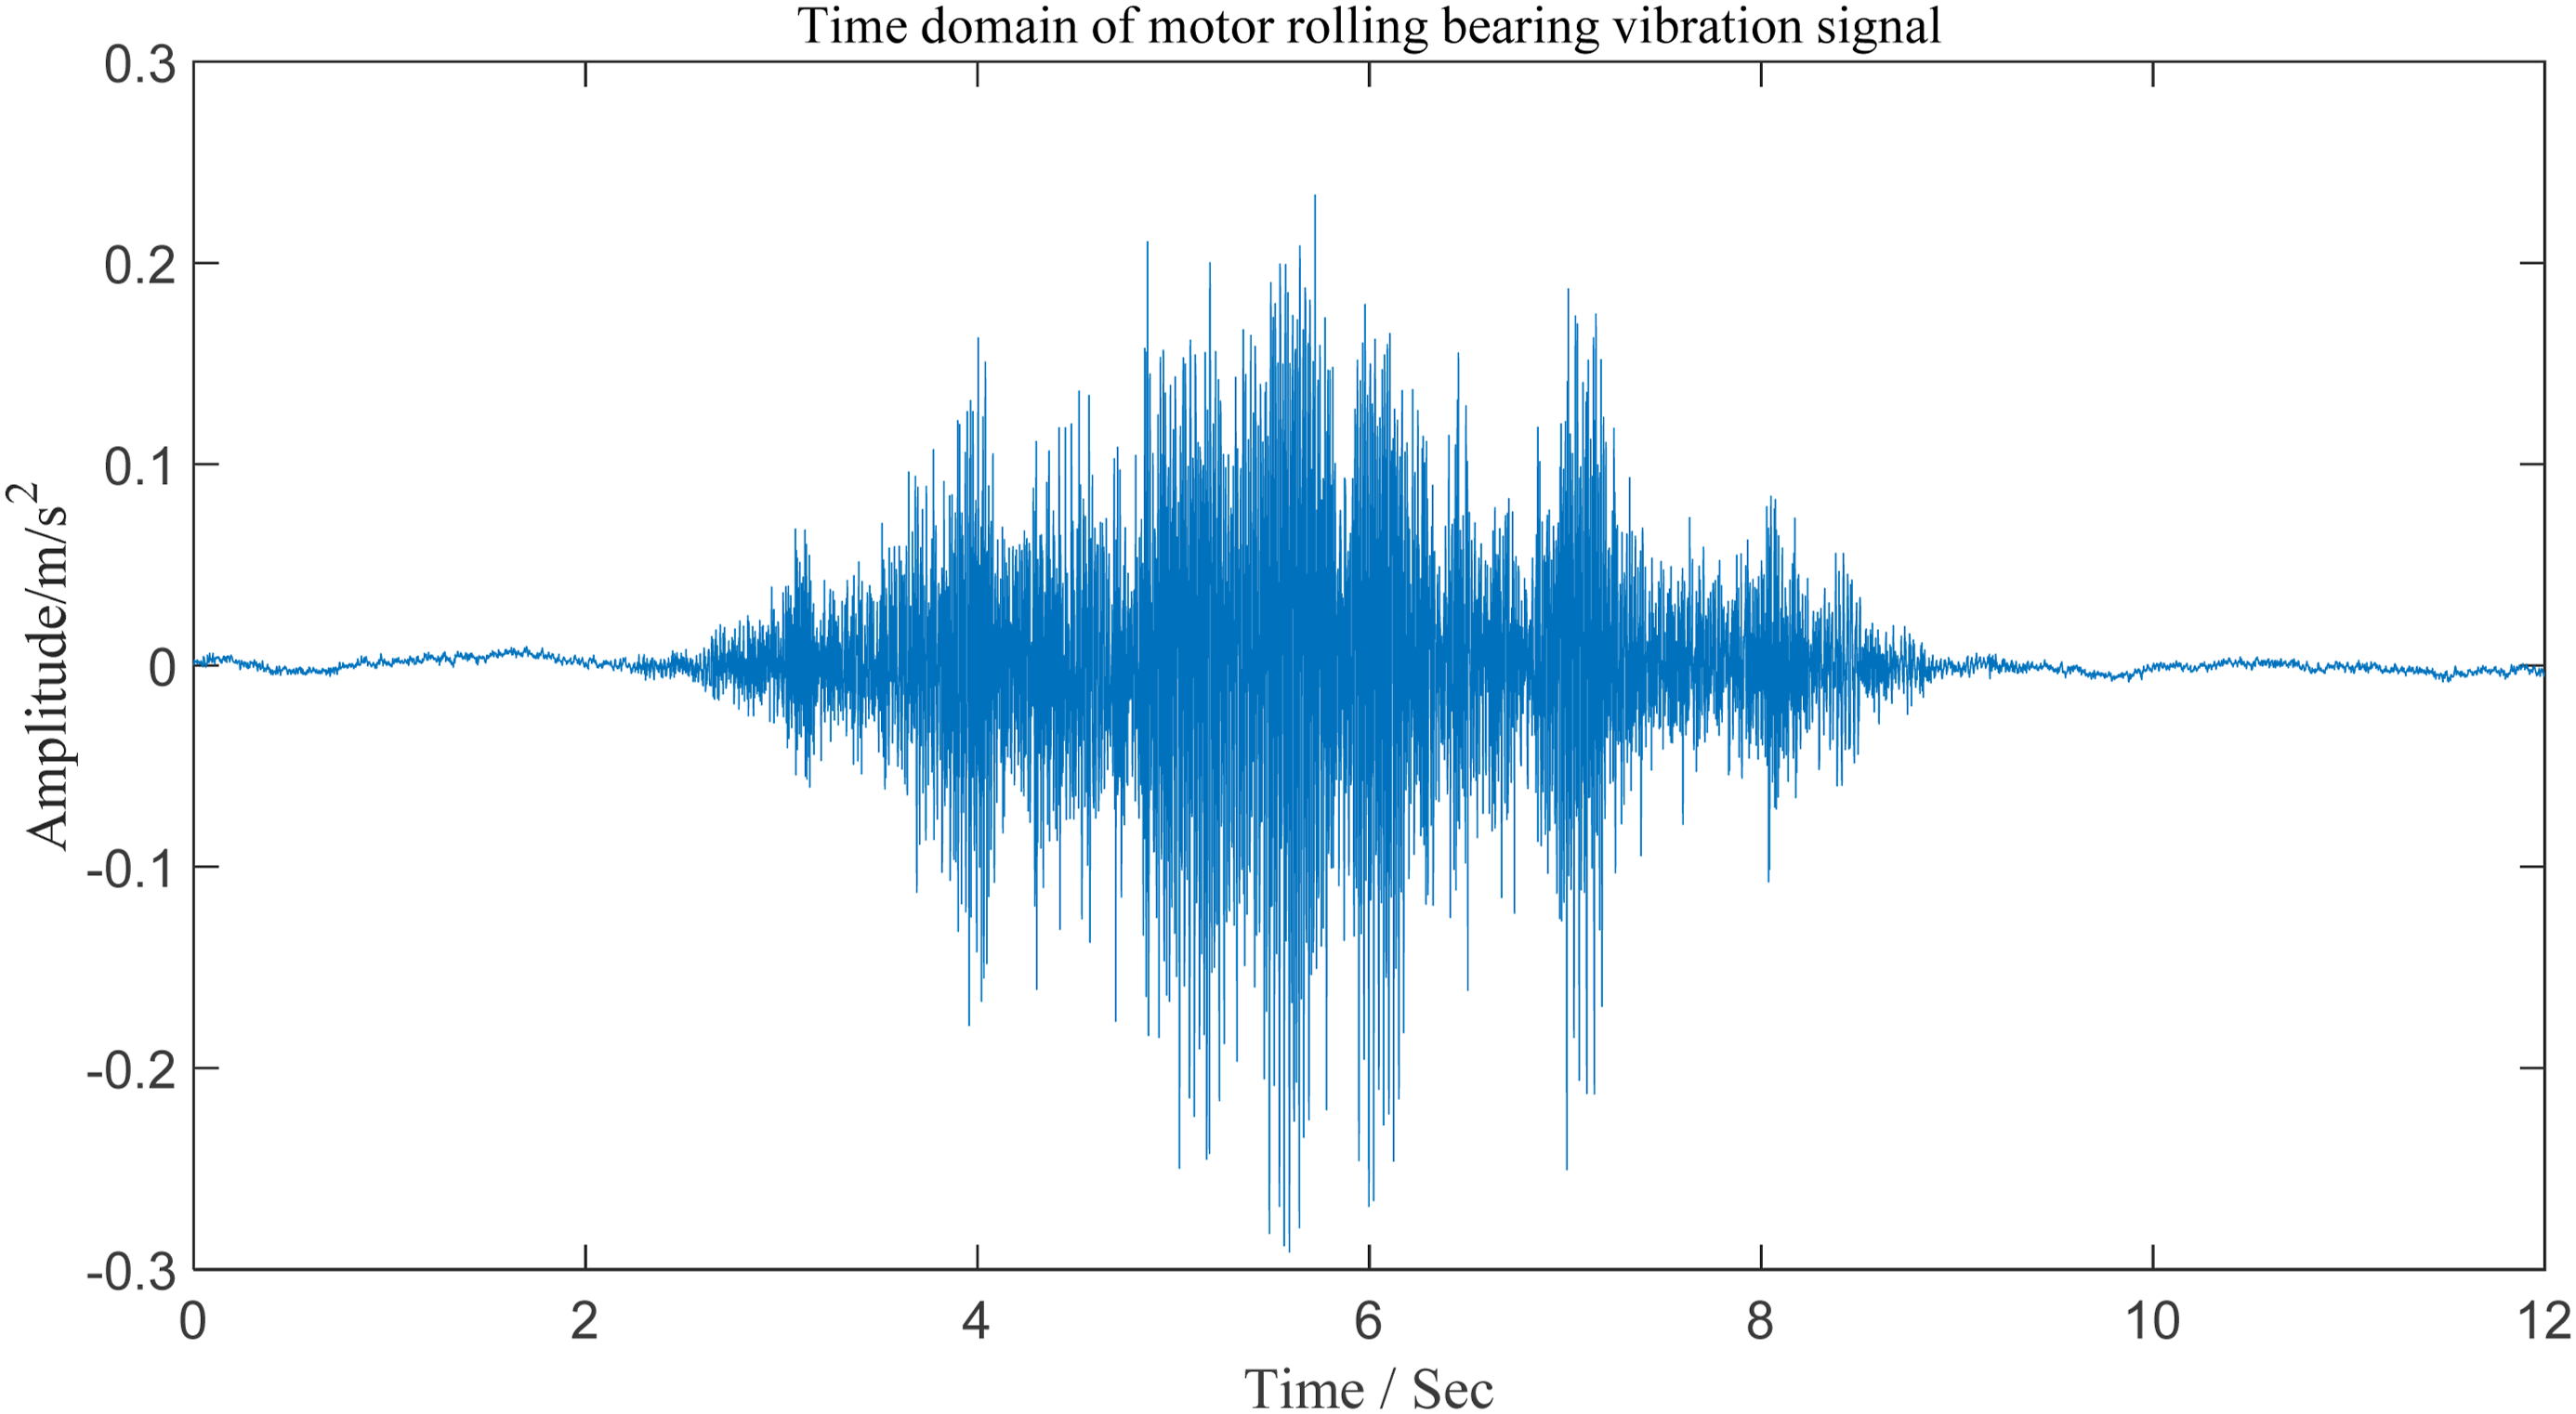
The experimental signal Et is processed using the proposed algorithm in this paper, as illustrated in Figure 13. Specifically, (a) represents the TF spectrum obtained after the combined processing of NLMS filtering and SET; (b) denotes the comparison diagram of IRF; (c) presents the extraction diagram of order components. The TF spectrum and instantaneous rotating frequency estimation corresponding to experimental signal 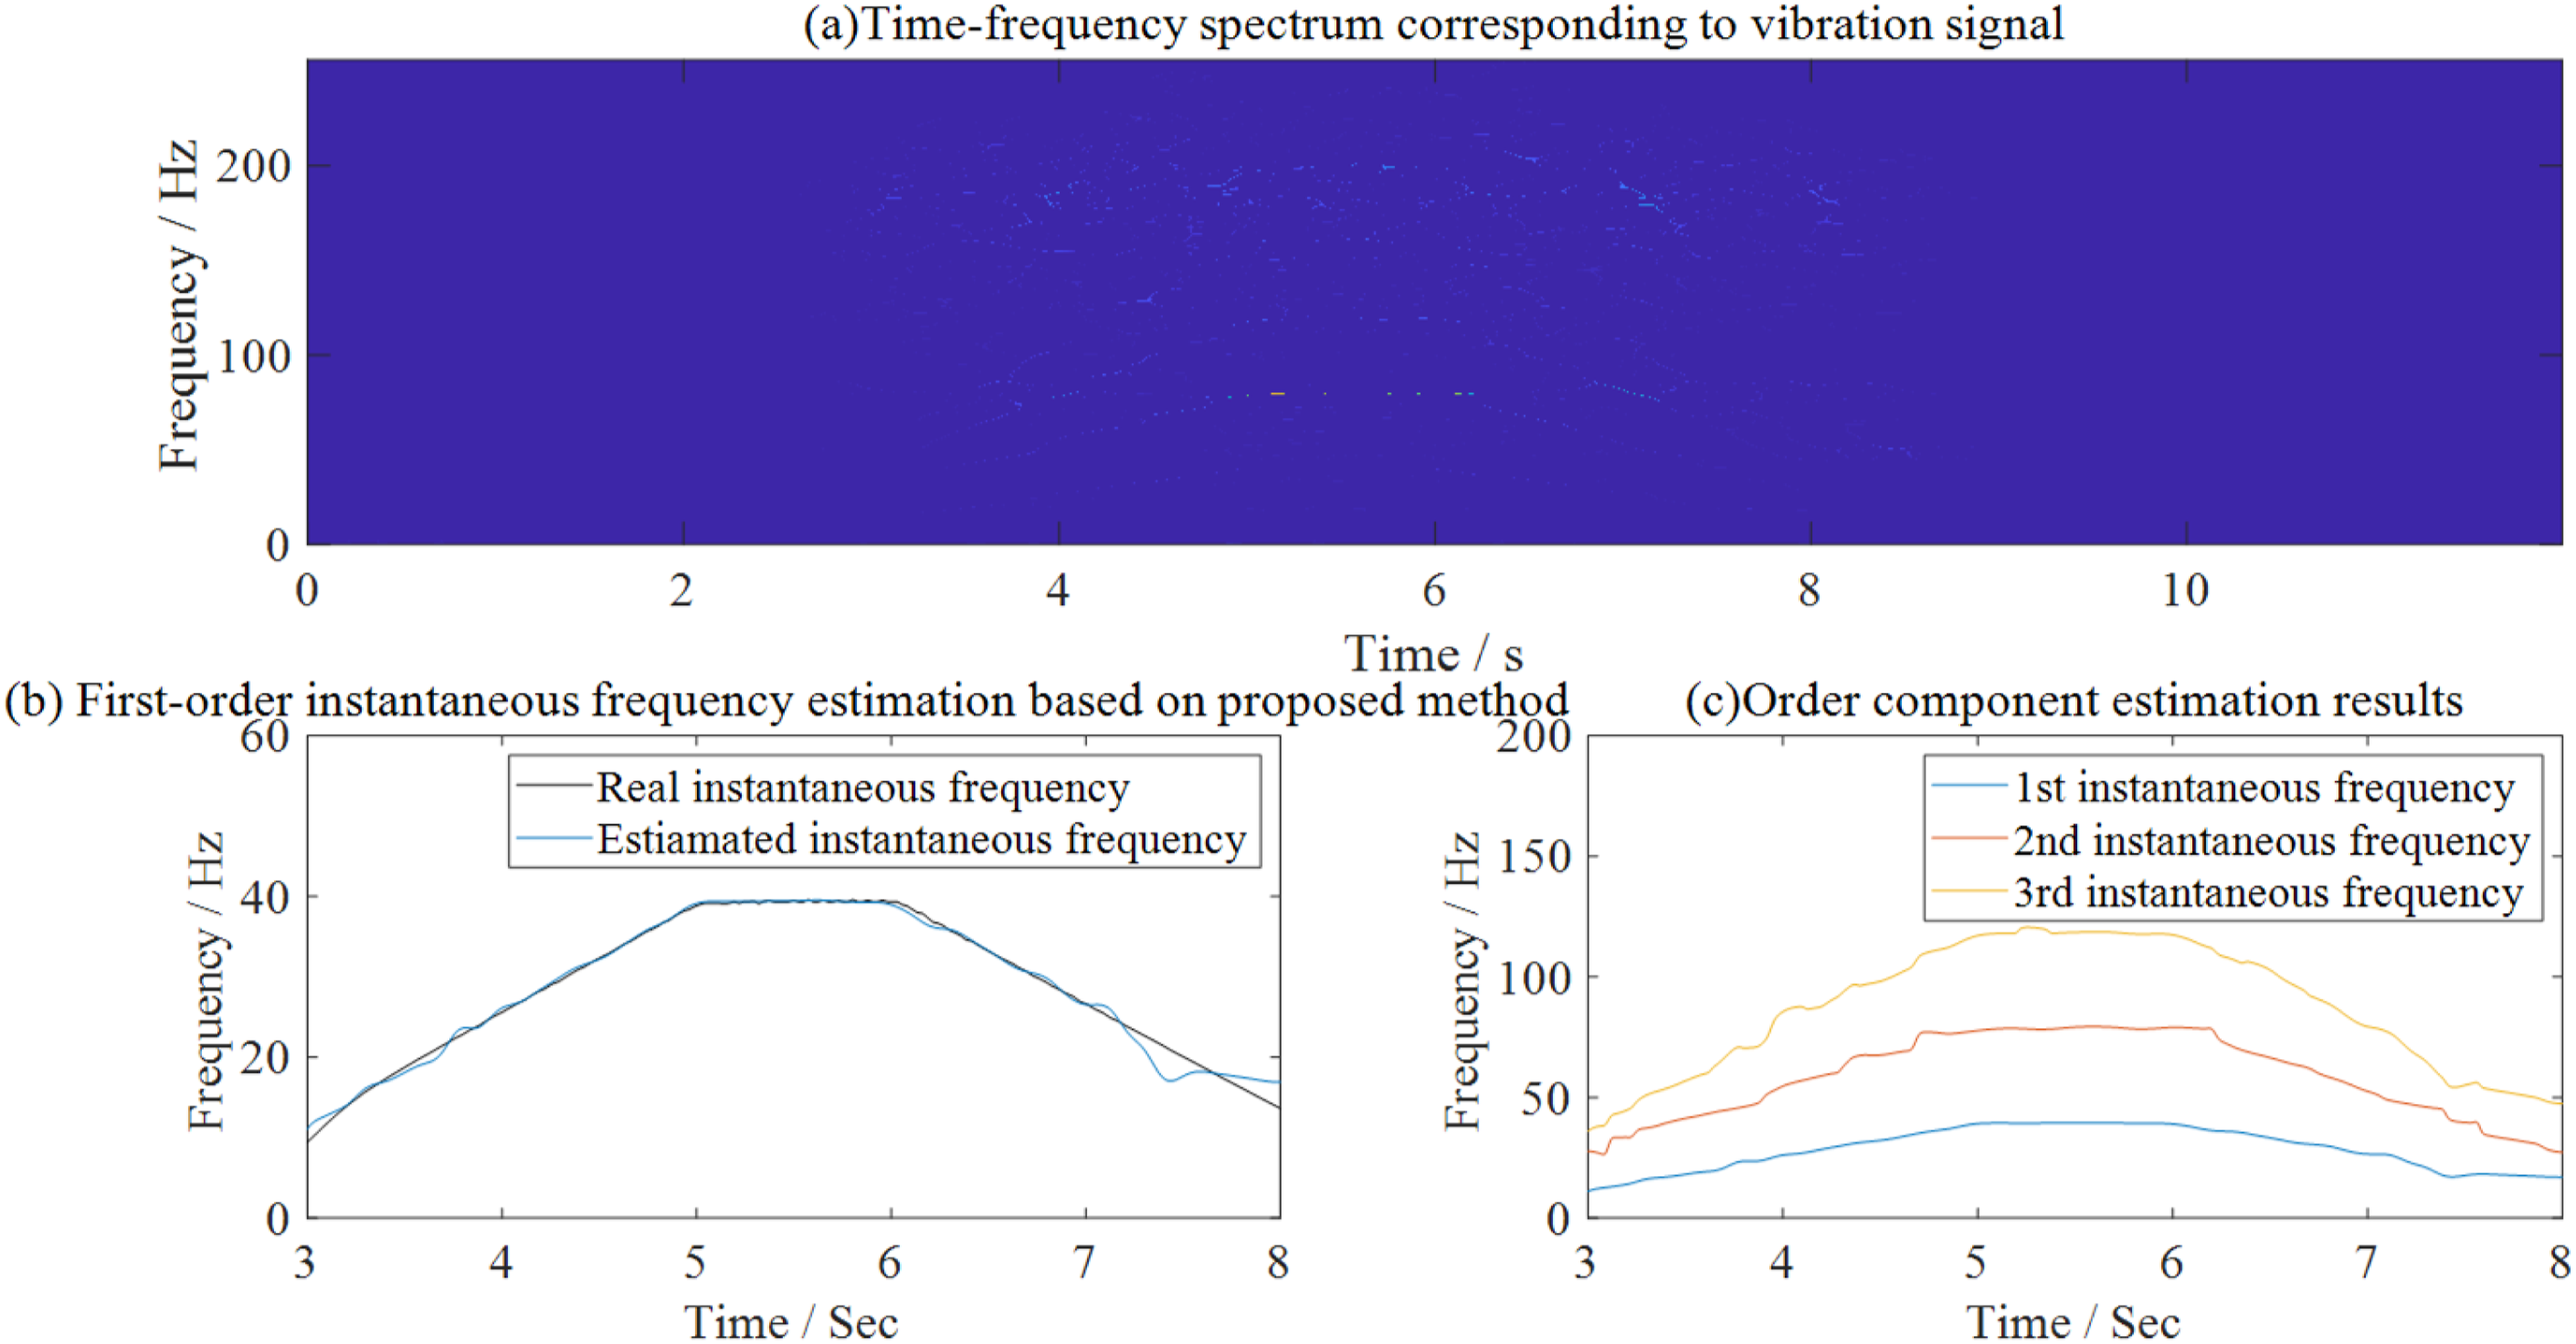
Evaluation indicator result corresponding to different signals.
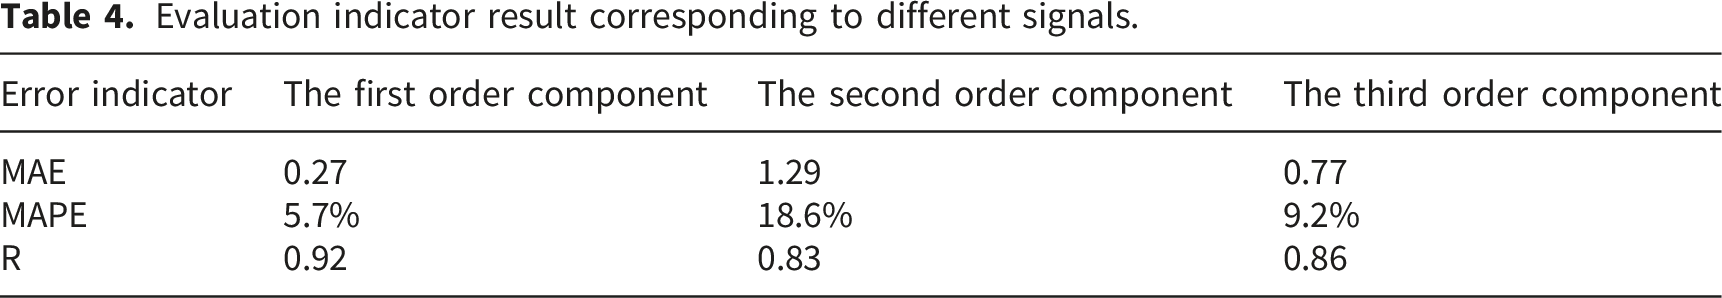
Table 4 presents the error evaluation indicator results of different order components, including three metrics: MAE (0.27 for the first-order component, 1.29 for the second-order, 0.77 for the third-order), MAPE (5.7% for the first-order component, 18.6% for the second-order, 9.2% for the third-order), and R (0.92 for the first-order component, 0.83 for the second-order, 0.86 for the third-order). These indicators reflect the signal analysis accuracy of each order component: the second-order component has the highest MAE and MAPE, and the lowest R; the first-order component has relatively smaller errors and better correlation. Overall, the extraction accuracy of the second-order component is weaker than that of the first and third-order components, but the R values of all components are above 0.8, indicating that the analysis results still have certain reliability.
5. TF performance comparison
As mentioned earlier, TF analysis is the core foundation of the proposed method. This paper adopts the SET to characterize the TF distribution of signals, which can accurately depict the time-varying frequency characteristics of multi-component signals. Due to the multi-stage planetary transmission structure of wind turbine gearboxes, the corresponding fault vibration signals exhibit the feature of strong background noise, thus requiring the adopted TF analysis method to have excellent energy concentration.
To verify the TF resolution performance of SET in the proposed method under different SNR conditions, this paper compares it with the Multi-Synchronous Squeezing Transform (MSST), Smoothed Pseudo-Wigner-Ville Distribution (SPWVD), and Nolinear STFT,28,34,35 respectively. In addition, the Rényi entropy 
To evaluate the robustness of the proposed method, the simulated signal TF performance comparison under different SNR values.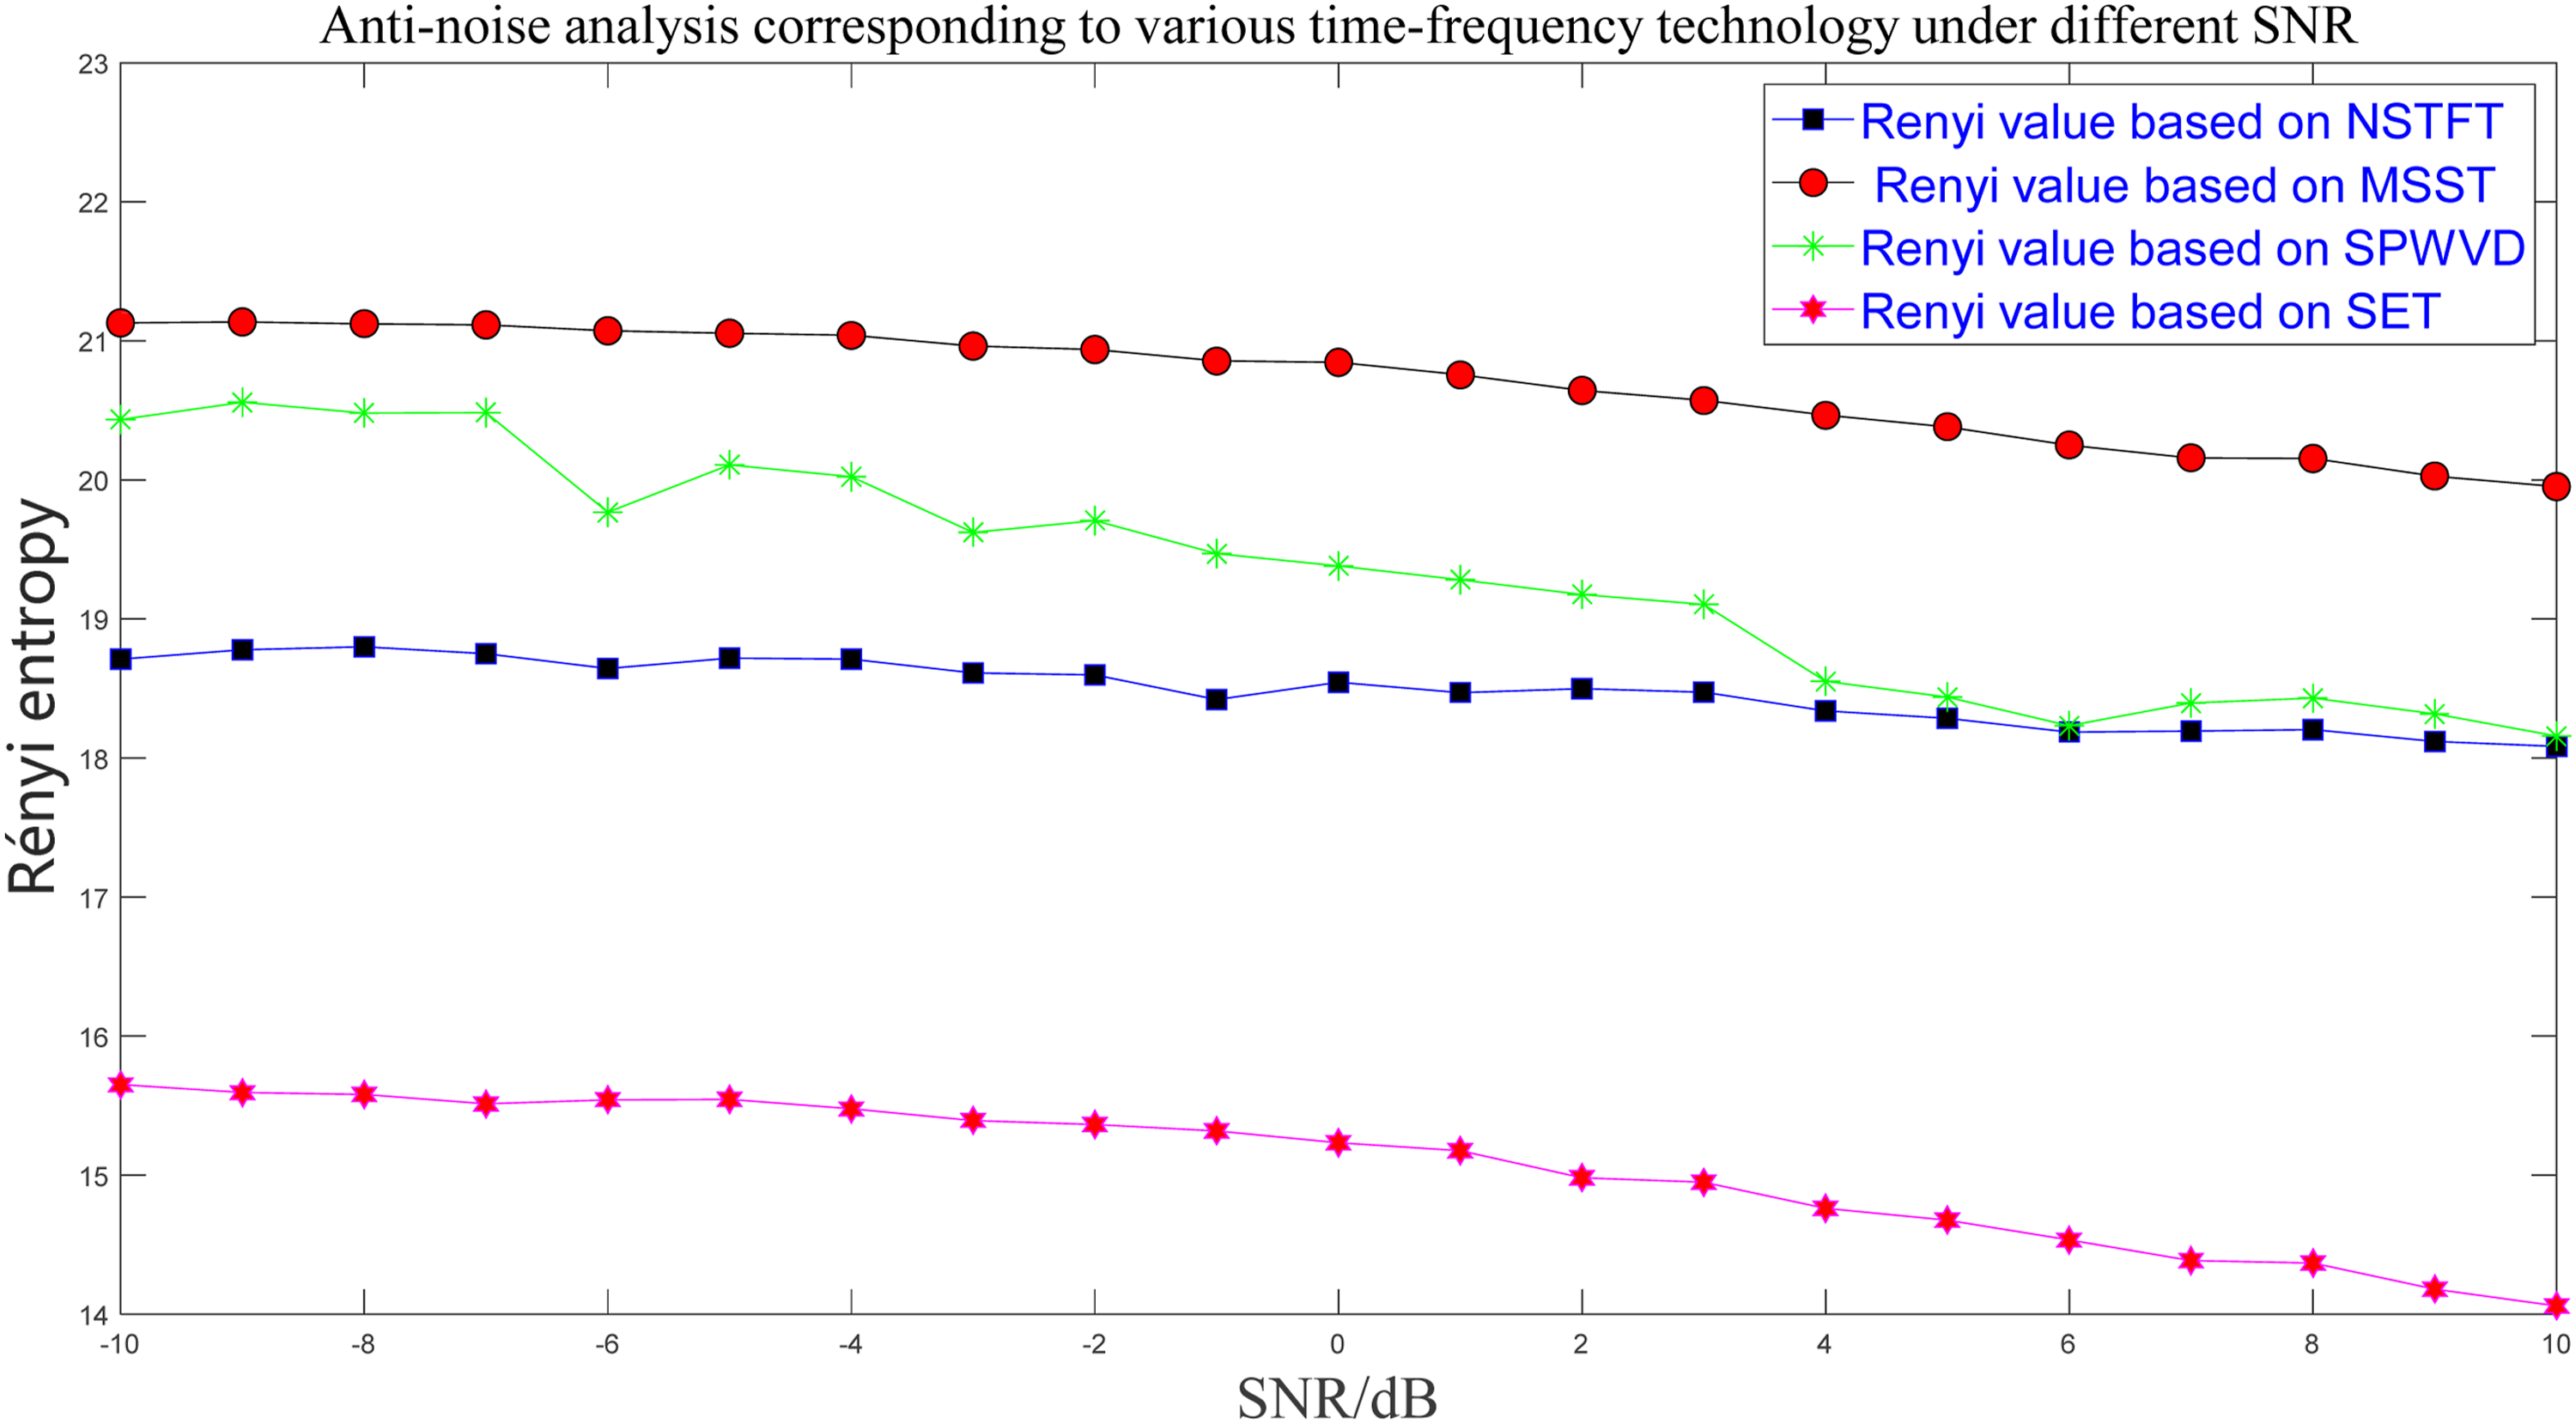
Intuitively, it can be observed that when the SNR varies from -10 dB to 10 dB, the SET exhibits excellent and s TF resolution characteristics, with its Rényi entropy value consistently maintaining around a constant range of approximately 14-16. In comparison, the proposed algorithm is significantly superior to the SPWVD, NSTFT, and MSST algorithms. In summary, within the SNR range of -10 dB to 10 dB, the maximum and minimum Rényi entropy values calculated by SET are 15.65 and 14.06, respectively, indicating that SET possesses excellent global TF aggregation and anti-noise performance.
6. System implementation
For the engineering development of the rotational machinery OA system, this study first used MATLAB to verify the performance of the core OA algorithm. Through vibration signal tests under multiple operating conditions, the accuracy of order extraction in variable-speed scenarios was validated. Subsequently, a visual OA system was built on the LabVIEW platform, integrating modules for data acquisition, and result display, thus achieving the engineering encapsulation and visualization of the algorithm.
The user interface, based on the LabVIEW front panel, enables visual interaction between the user and the system. It includes four core modules: “Configuration”, “Vibration and Speed”, “Colormap”, and “Order Spectrum”, allowing for quick workflow switching. The function button area follows a “process-oriented” layout, covering operations like “Config”, “Start”, “Save”, and “Stop”. The parameter configuration area offers data source switching and signal generation settings, supports importing CSV vibration and speed data, and configures sampling frequency to facilitate algorithm validation.
The front panel of the system is shown in Figure 15. The front panel of the OA system based on the LabVIEW platform.
Meanwhile, Figure 15 illustrates the signal acquisition and generation apparatus. Specifically, a DG1032 signal generator was adopted for signal output, while an NI 9230 module was configured as the signal acquisition unit. Ultimately, the collected signals were visualized by means of the OA system.
On the system front panel, press the selection button, click “Start”, select the CSV-format file of the corresponding dataset, and set the corresponding sampling frequency to 25.6 kHz; the system then initiates operation, with the results illustrated in the following Figure 16. The running results of the simulated signal and the experimental signal.
In Figure 16(a), the upper curve represents the simulated vibration time-domain signal of the system, while the lower curve denotes its time-varying rotational speed curve. The rotational speed exhibits a typical variable operating condition process of “rising - steady - falling”: starting from 1000 r/min, it increases to 3000 r/min, maintains a steady operation for a certain period, and then gradually decreases, fully covering the comprehensive characteristic stages of variable-speed operating conditions. Figure 16(b) Presents the order power spectrum, where the ordinate corresponds to the energy amplitude in the order domain and the abscissa represents the order value. The positions of energy peaks in this figure strictly correspond to the high-energy regions of the order spectrum, quantitatively reflecting the energy intensity of each order component and enabling the quantitative analysis of the order-domain energy characteristics of rotating machinery vibration signals. Similarly, Figure 16(c) Shows the experimental time-domain vibration signal and rotational speed curve from the Xi’an Jiaotong University dataset, and Figure 16(d) Illustrates the corresponding order power spectrum.
7. Conclusion
To address the challenge of order extraction for non-stationary signals under strong noise and sudden speed fluctuation conditions, the proposed combined order extraction algorithm based on NLMS filtering and SET TF analysis retains fault features via dynamic noise reduction, resolves the energy diffusion issue through high-resolution TF characterization, and prevents order aliasing by integrating the “iterative multi-ridge + extraction-energy clearing” strategy. This approach significantly enhances the accuracy and stability of fault feature extraction, thereby providing effective algorithmic support for signal analysis in complex operating conditions. Meanwhile, multi-scenario comparative validations using simulated signals, semi-experimental signals, and measured experimental signals fully demonstrate the effectiveness and robustness of the proposed algorithm across varying noise intensities and both steady and unsteady operating conditions, laying a solid experimental foundation for its engineering application and popularization.
The OA system developed based on LABVIEW enables the automatic extraction and visual display of order features. Breaking through the inherent bottleneck of low efficiency in traditional manual analysis, the system balances real-time performance and usability, and serves as a technical tool directly applicable to engineering practice. In addition, this combined algorithm can be directly applied to the CM of key transmission components of wind turbines, such as gearboxes and main bearings.
The OA system developed in this paper still has room for improvement. Since the system does not integrate the error analysis module for the time being, the error analysis results of order components cannot be visually displayed on the system panel. The functional module will be supplemented and the panel interface development will be completed in subsequent work. Meanwhile, the data acquisition function of the current system fails to meet real-time requirements. Future research will realize real-time monitoring of wind turbine operating conditions by connecting to actual physical channels.
Although this study has made significant progress in order component extraction from rotating machinery, we acknowledge that advanced methods such as the thermodynamically consistent Deep Energy Method have not been applied for more precise validation. 36 This method integrates modeling, simulation, and experimental data within a unified framework, naturally accounting for uncertainties and providing effective approaches for optimization and inverse design. While this method was not incorporated in the current study, we plan to explore and apply it in future research, particularly when simulating and modeling faulted rotating machinery, to enhance the accuracy and robustness of the algorithm. We believe that incorporating such methods will further strengthen the theoretical depth and practical applicability of the research.
Footnotes
Funding
The authors disclosed receipt of the following financial support for the research, authorship, and/or publication of this article: This paper is supported by National Natural Science Foundation of China (Number:62303300) and Shang Hai Professional Technical Service Platform Project (Number:23DZ22905000), Capacity Building Project of Shanghai Local Colleges and Universities of China (Number.23010500900).
Declaration of conflicting interests
The authors declared no potential conflicts of interest with respect to the research, author-ship, and/or publication of this article.
Data Availability Statement
The datasets used and/or analyzed during the current study are available from the corresponding author on reasonable request.