
Abstract
The increasing environmental challenges posed by fossil fuel dependence have accelerated global efforts to adopt renewable energy. Leveraging Egypt’s abundant solar and wind resources, this study develops an optimal framework for hybrid energy systems (HES) in the Shlateen region. The proposed HES integrates photovoltaic panels, wind turbines, diesel generators, and battery storage to ensure reliable and cost-effective electricity supply. An Improved Particle Swarm Optimization (IPSO) algorithm, coupled with the Point Estimate Method (PEM), is applied to address uncertainties in wind speed and solar irradiance. The Loss of Power Supply Probability (LPSP), the Cost of Electricity (COE) and carbon dioxide (CO2) emissions are chosen as three simultaneous objective functions. The number of PVs, WTs, batteries, inverter power, and the diesel engine’s nominal capacity are among the decision variables that are taken into consideration as design parameters via a new meta-heuristic optimization algorithm. Because the design cost is increased and system reliability is degraded, the results highlight the possible consequences for educating industry executives and policymakers about the design and evaluation of HES under uncertain environmental conditions. In order to analyze the suggested methodology, many case studies are explored and presented. Software called MATLAB is used to implement and solve the optimization problem. According to the findings, The lowest LPSP achieved using the IPSO algorithm is 7.149 %, but this value rises to 7.211 % in the PSO alone. The PV/BESU/DG configuration
Keywords
Introduction
Advanced and modified optimization techniques applied in the area of integrating renewable energy systems with distribution network are received many attentions for the sake of improving the overall performance of the systems.1–9 Adaptation to uncertainty in deep learning-driven hierarchical optimization for distribution networks that are primarily powered by renewable energy sources. This model provides adaptive robustness without sacrificing economic efficiency. 1 This study providing reduction of a 25.2% in total cost, increasing of a 19.5% in reliability, and decreasing of a 28.6% decrease in emissions in comparison published work. The sustainable computing-based economic energy scheduling for renewable energy hubs, including stationary and mobile storage in electric and thermal networks, is developed based on dependability and emission control. By using Pareto formulation in accordance with the weighted sum of functions technique as the goal function, the scheme reduces energy loss, operating costs, unfed energy, and network emissions. 2
The Non-dominated Sorting Genetic Algorithm II (NSGA-II), Multi Objective Evolutionary Algorithm based on Decomposition (MOEAD) and Generalized Differential Evolution 3 (GDE3) for multi-objective optimization, and Particle Swarm Optimization (PSO), Differential Evolution (DE), and Genetic Algorithm (GA) for single-objective optimization are the six metaheuristics that are thoroughly evaluated stochastic optimization framework for developing the renewable energy integration with distribution system performance. 3
These days, a country’s ability to sustain its economic growth and the affluence of its people can be gauged by the availability of energy. Indeed, without safe access to energy sources like electricity, no nation can develop and thrive. 4 Rapid population increase and technological advancement in recent decades have led to a massive need for energy, particularly electric power. Electricity is still unavailable in rural regions, particularly in underdeveloped nations. Building off-grid power generation systems or enlarging electricity grids are two ways to address this issue. 4
The U.S. Department of Energy defines a microgrid (MG) as an interconnection of loads and distributed energy resources (DERs) within clearly defined electrical boundaries. A microgrid is capable of operating in both islanded and grid-connected modes. Among its key advantages are reducing power losses, enhancing power quality, improving reliability by restoring loads or portions of loads during utility grid (UG) faults, increasing overall efficiency, and supplying power to remote areas where transmission and distribution infrastructure is unavailable. 5
Energy supply, particularly the provision of electricity, is one of the most significant issues for individuals who live in isolated areas or on islands that are not connected to the main electrical grid. Historically, thermal power plants that are fueled by fossil fuels (diesel and gas) have been used to supply electricity to standalone electrical systems. 6 These systems typically have expensive electrical supplies because of the high cost of purchasing certain parts and the high cost of running them. Additionally, pollutants from fossil fuel sources raise environmental problems.7,8 These systems are especially susceptible to interruptions in the energy supply. In order to achieve system dependability, cost savings, and emission reduction, many islands have recently adopted ambitious renewable energy targets employing hybrid renewable minigrids. 8 Ancillary services are essential on islands and in stand-alone systems in general. On islands, operating reserve needs are crucial and must incorporate a reserve limitation, which should be taken into account while optimizing these systems. 9
Thankfully, the problem has been mostly resolved by the idea of hybrid renewable energy (HRE) systems. 10 HRES is an off-grid or standalone system comprising conventional and renewable energy sources that is intended to produce and store electricity for a specific demand point. Remote and rural locations that are difficult to reach by traditional methods can benefit from the use of HRES to generate electricity. 4 Furthermore, compared to single-source energy generation systems, HRE systems might be less expensive. 11 In order to avoid grid stability issues, batteries are appropriate technologies for supplying supplementary services to non interconnected power systems. 12
Nonetheless, researchers have always been interested in the design, size, capacity, and hybridization policy of HMSs since these factors might pave the way for high efficiency, dependability, and cost-effectiveness in this field. 13 Solar and wind energy are the most widely used renewable energy sources (RESs) because of their complementary roles in power generation. They are widely available globally and offer significant environmental benefits. Recent years have seen a surge in the development of these two RESs due to a number of variables, including simple installation, low maintenance costs, environmental concerns, the need to supplement traditional energy sources, and practical RES policies. Due to its capacity to reduce load demand gaps without causing carbon emissions gaps, solar and wind energy facilities have been extensively installed globally despite their high capital costs. 14 In places where standard electric grids are not economically feasible because of the high cost of installing transmission lines, particularly in rural areas, these renewable energy sources are very helpful.15,16
Numerous nations are planning to continue developing green energy resources after beginning to use RESs extensively. However, there are a number of obstacles to the use and generation of electrical energy from any RES, just like with any other new technology. It has been challenging to investigate RESs in rural and islanded areas due to their unstable behavior, high initial costs, and need for necessary storage facilities. As a result, integrating RES technologies with the existing energy generation infrastructure is more appropriate and feasible. In order to connect traditional techniques like diesel generators to electrical energy provided by solar cells or wind turbines, the Hybrid Microgrid System (HMS) concept has gained popularity. 7
The intermittent nature of PV and WT outputs, which might not always match demand, can be compensated for by integrating storage systems with hybrid systems to improve the economic and technical elements of the MGs, as well as to increase system efficiency and provide a continuous power supply. 17 The efficiency of hybrid systems depends on the storage components’ optimal sizing, which establishes the system’s capacity to consistently and affordably supply energy demands.15,18 In terms of technical elements, the ESSs can be used to support voltage, control frequency, improve power quality, support ride-through, support the compensation of an imbalanced load, improve stability, support reliability, and conduct peak shaving. [microgrid system dimensions, including battery]. 5
Nevertheless, a number of issues confront hybrid systems, such as fluctuating system loads and the unpredictable nature of energy generation sources. 19 Variations from the optimal system sizing, which is attained through optimization, may result from these uncertainties. Since these uncertainties have a major impact on the entire cost and dependability of energy generation, it is imperative to fully examine them in order to build and size these energy systems as efficiently as possible. 20 Because renewable energy sources are unpredictable, these systems rely on a variety of traditional energy sources, such as fossil fuels, and energy storage devices, like batteries, to maintain high reliability.21,22
State of the art
A substantial body of research has explored the allocation of distributed energy resources (DERs) in distribution networks. Most of these studies have focused on photovoltaic (PV) systems and distributed wind energy, both with and without storage integration. The central objective has typically been to determine the optimal placement and capacity of DER units. To achieve this, a wide range of optimization techniques have been applied, which can be broadly categorized into three groups: classical, analytical, and metaheuristic methods. Classical techniques rely on mathematical models and include approaches such as the Lagrange function and linear programming, which are capable of rapidly identifying optimal solutions for small-scale problems. However, as system complexity grows with higher dimensionality and larger numbers of variables, these methods often struggle to achieve the true global optimum. Analytical approaches attempt to solve optimization problems through direct mathematical formulations or algorithms, but they too may converge only to local optima rather than global solutions. Some studies have nonetheless introduced mechanisms that enhance analytical approaches for locating global optima in cases involving multiple distributed generators (DGs). Heuristic and metaheuristic techniques, on the other hand, have been widely adopted for addressing the limitations of classical and analytical methods. These approaches are conceptually simple, computationally versatile, and applicable to a wide range of optimization problems. Unlike deterministic methods, metaheuristics do not require precise formulations such as Jacobian or Hessian matrices, making them attractive for solving complex, nonlinear, and multi-objective DER allocation problems. 23
Numerous studies have proposed different modeling and optimization approaches for the design, sizing, and performance evaluation of hybrid renewable energy systems (HRES). In Ref. 5, a PV/WT/DG hybrid system was optimally sized using two metaheuristic algorithms—Hybrid Firefly and Particle Swarm Optimization (HFPSO) and Moth-Flame Optimization (MFO)—to enhance renewable energy contributions and assess the viability of diesel generators (DGs) as backup or storage alternatives to battery banks. The objectives of this methodology included minimizing overall microgrid costs, reducing harmful emissions, and lowering the cumulative power mismatch between demand and renewable energy generation. Stochastic variations in wind speed, solar irradiance, and temperature were incorporated to capture resource uncertainty.
In another study, the optimal design of a hybrid system for Yanbu, Saudi Arabia, was explored using solar, wind, diesel, and battery storage resources. 7 The problem was formulated as a multi-objective optimization model with cost of electricity (COE) and loss of power supply probability (LPSP) as objectives, solved via the Improved Decomposition Multi-Objective Evolutionary Algorithm (IMOEAD). Similarly, Dufo-López et al. 8 proposed a metaheuristic–stochastic optimization framework for standalone PV–wind–diesel systems with battery and pumped hydro storage (PHS). Implemented in C++, the model optimized energy management to maximize renewable utilization, reduce PHS losses, and extend battery lifespans, while accounting for uncertainties in climate and fuel price inflation.
Several works have also employed commercial tools such as HOMER Pro for hybrid microgrid planning. For example, 10 analyzed a PV/wind/electrolyzer/hydrogen fuel cell and hydrogen boiler system for rural electrification under economic and environmental uncertainties, while 24 optimized a standalone PV/WT/BESS/DG system for Adama Science and Technology University. Similar HOMER-based studies examined hybrid configurations for remote Australian communities, 25 Ethiopian rural villages using a Zebra Optimization Algorithm (ZOA), 26 and techno-economic assessments of Saudi Arabian 27 and Turkish university campus systems. 28
Metaheuristic algorithms have been widely explored to overcome the limitations of deterministic optimization. For instance, the Cloud Leopard Optimization (CLO) algorithm was introduced in Ref. 23 for multi-objective sizing of PV/DG/BESS systems under load and generation uncertainties. Mahmoudi et al. 29 applied the Gravitational Search Algorithm combined with a non-dominated sorting approach to minimize costs, CO2 emissions, and power supply losses while maximizing renewable penetration. Other contributions include the Black-Winged Kite Algorithm (BKA), 30 which was benchmarked against several well-known algorithms, and the Enhanced Arithmetic Optimization Algorithm (EAOA). 10 More recent methods include the Improved Salp Swarm Algorithm (ISSA) for hybrid microgrid sizing, 31 the Dandelion Optimizer (DO), 32 and the Hybrid Particle Whale Optimization Algorithm (HPWOA), 33 which combines PSO and WOA for improved convergence. Comparative analyses demonstrated that these hybrid and advanced metaheuristics outperform traditional techniques such as basic PSO, GA, and standard swarm-based approaches in terms of cost reduction, emission mitigation, and reliability enhancement.
Further contributions address specialized configurations and objectives. For instance, hybrid PV/tidal/fuel cell (PV/TDL/FC) systems have been designed using stochastic–robust optimization 15 ; biodiesel-based microgrids have been analyzed to mitigate DG emissions 34 ; and mixed-integer formulations have been proposed for risk-aware scheduling of microgrids under energy price uncertainty. 35 Additionally, research such as 36 has explored data-driven scheduling techniques for hybrid energy storage systems (ESS), demonstrating reductions in electricity costs and short-term fluctuations.
Overview of the employed techniques in enhancing HRES.
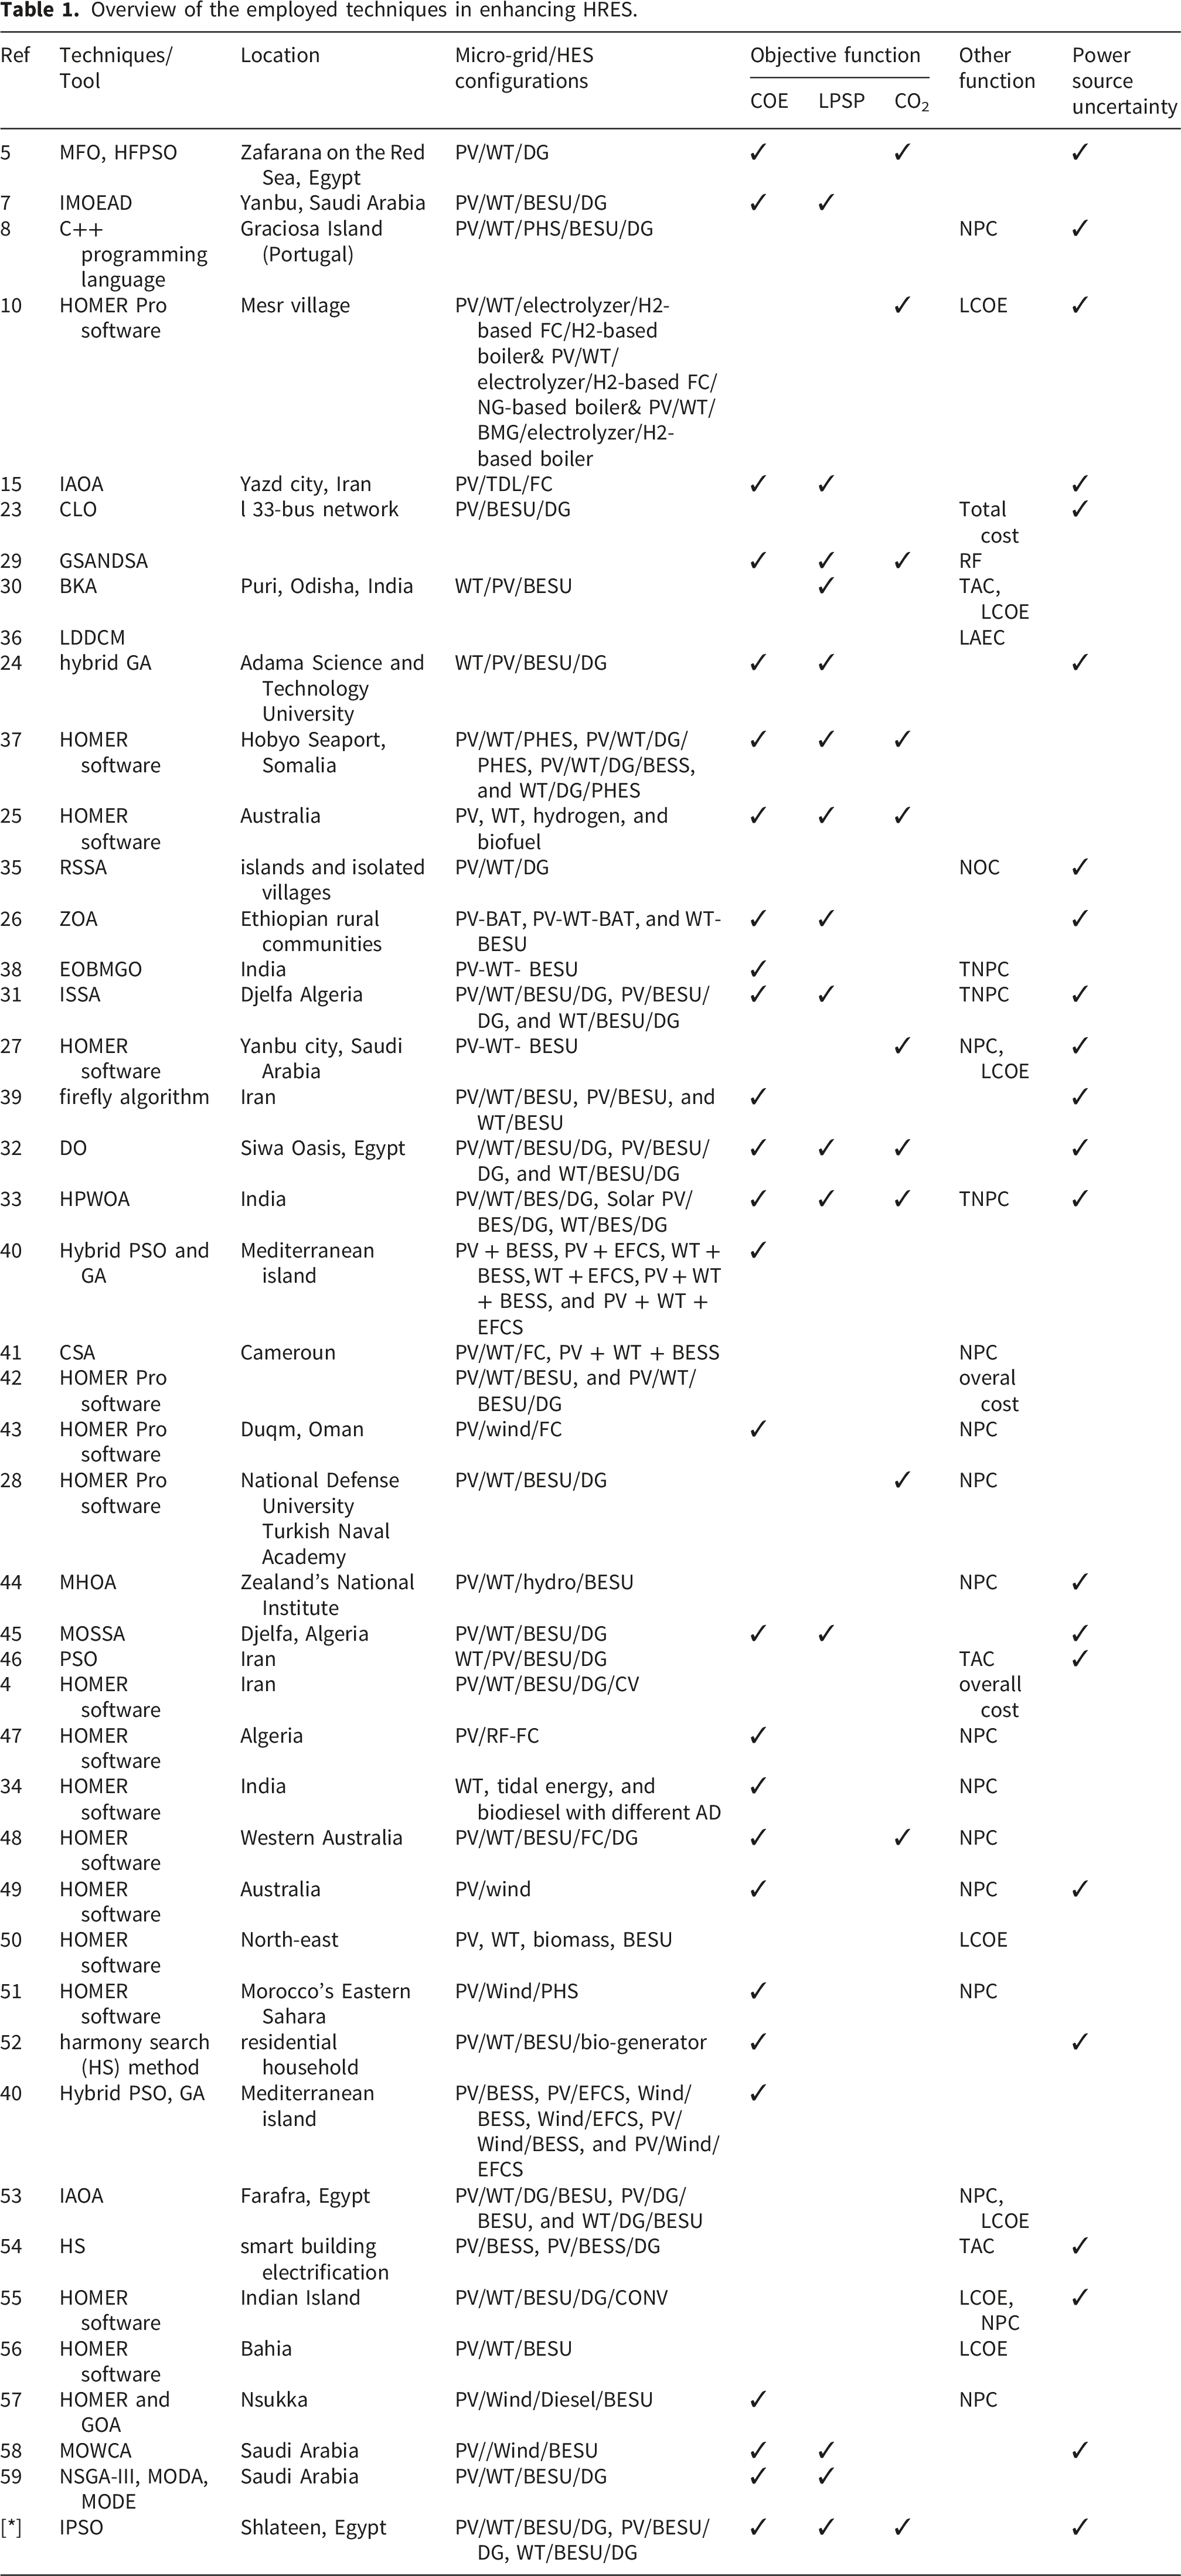
The main outcome of this research is the suggested method for determining the ideal HRE system unit size to implement in isolated rural locations in the face of economic uncertainty. It is primarily found in developing nations, but other comparable countries with islands and remote villages can use it. Furthermore, a thorough review of the literature has revealed that little research has been done on how economic uncertainty affects the ideal unit sizing of HRE systems. It indicates that this work may make a significant contribution to this field. As a result, interested researchers can use this study’s methodology as a reference to size the units as optimally as possible during unstable economic times. The advantages of such a plan are (I) decentralizing power coverage, making rural areas self-sufficient in energy generation, and (III) speeding up the energy sector’s de carbonization.
In order to lower the Loss of Power Supply Probability (LPSP), carbon dioxide (CO2) and the Cost of Electricity (COE) while increasing the penetration of renewable energy, this article introduces the multi-objective water cycle algorithm (MOWCA), which has been used to determine four design variables:
Article contribution and organization
The following succinctly describes the potential innovations and contributions of this paper:
The article formulates problems using the multi-objective approach based on developed optimization technique. Due to its special Pareto Front (PF) feature, which allows it to display the set of solutions to a multi-objective problem in a single shot, The design engineers are able to select from any possible solution by using their knowledge, the design specifications, and the restrictions to verify the objectives of the study.
Using deterministic and stochastic optimization to plan the hybrid PV/WT/batteries/diesel system.
A variety of adaptable features have been added to the PSO algorithm to form robustness and accurate algorithm.
New ideas for social and cognitive learning are created for providing robustness and accuracy to the results.
Exploration and exploitation skills have been enhanced as given in the results.
The current study takes into account the variations of wind speed, irradiation, and temperature i.e uncertainty in the data input to examine the accuracy of the proposed algorithm in developing accurate results in compared with published work.
The study presents a development strategy for renewable energy aimed at a remote area of Egypt devoid of grid infrastructure. Which consider real world network.
The goal of the suggested approach is to determine the ideal size for an MS that consists of PV, WT, BESU, and DG in various configurations: WT/BESU/DG, PV/BESU/DG, and PV/WT/BESU/DG. The performance of various AHPS designs is assessed using the most widely used technical, economic, and environmental indices. The stochastic problem was applied with the unpredictability of solar and wind resources output in mind, and the outcomes were contrasting with the problem without uncertainty. To improve the performance of the MG system under study, the BSUs are utilized for a variety of tasks, such as supply/demand matching and energy arbitrage. A hybrid power generation system model that combines PV, WT, DG, and batteries is examined. Diesel engines are also taken into consideration as a source of energy conversion for greater flexibility.
To provide a summary of this paper’s structure: Section Problem formulation provides a detailed explanation of the issue. In Section Modeling of hybrid microgrid system (HMS), the mathematical model of the HMS is introduced. Hybrid microgrid system energy management strategy is introduced in Section Energy management strategy for hybrid microgrid systems. The new proposed method’s mathematical model is shown in Section Proposed Method. In section Uncertainty Modeling, the uncertainty model is introduced. In Section Techno-Economic Analysis, The Techno-Economic Analysis is presented. Section Simulation results based on IPSO method, presents the simulation results for the suggested approach.
Problem formulation
The system configurations are efficiently modeled and adjusted to minimize carbon dioxide (CO2) emissions, loss of power supply probability (LPSP), and minimum cost of energy (COE). The following is a model of mathematical representations connected to objective functions:
Cost of electricity (COE) of the HMS
The average cost of producing usable electrical energy over a power system’s lifetime is known as the COE, which is frequently used in the context of hybrid energy systems to assess the viability of various asset configurations from an economic standpoint. The net profit cost (NPC) is the most important component in the COE analysis for hybrid energy systems. The expenses of capital, operation and maintenance (O&M), and replacement are all included in COE. All renewable energy sources have significant initial capital costs, but they also have advantages like zero fuel costs, minimal O&M costs, and great reliability. In order to streamline the analysis, the study’s cost components for the hybrid energy system are the purchase prices of PV panels, batteries, wind turbines, diesel generators, and inverters. 7
Equations (10) and (11) can be used to calculate C O E based on the hybrid system’s yearly cost (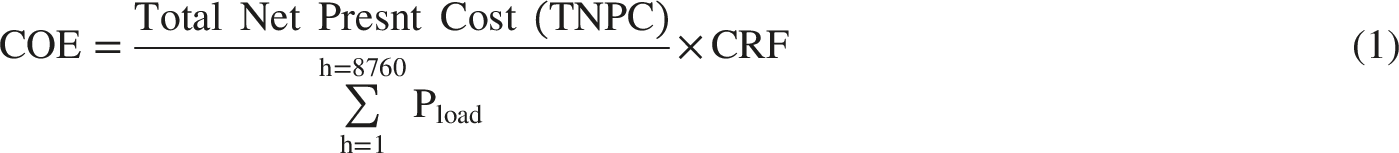

By using the capital recovery factor (CRF), which is calculated using Equation (3), the capital cost is converted to yearly capital cost.32,60
The real interest rate (
The annual capital cost
The following equation can be used to calculate the annual capital expenditures for all of the equipment used in the hybrid system:
Operating and maintenance cost
The following formula is used to determine the system equipment’s annual operating and maintenance costs (O&M):
The annual replacement cost
It will be necessary to swap out some of the hybrid system’s equipment multiple times during the project. The PV modules, which have a lifespan equal to the project’s, are the only piece of system equipment in this study that does not need to be replaced. The following formula can be used to calculate the annual replacement costs of specific system equipment and the sum of these costs:


The fuel cost
The fuel cost (FC) can be expressed in detail using the following equation:
Minimization of power loss (
)
One important statistical method for measuring a system’s dependable power supply is LPSP. It indicates the likelihood that a weak power supply will prevent the load requirement from being met. Economic limitations, RES availability uncertainty, and technological failure can all contribute to this power shortage. 7 By integrating LPSP into the optimization process, optimal solutions that reduce the risk of power supply failure may be found and decisions can be made with greater accuracy. The range of LPSP is 0 to 1. A number of 1 indicates a high likelihood of power supply failure because it shows that the load demand is not being met in any way. Conversely, a score of 0 denotes a very dependable power supply system since it shows that the load requirement is continuously satisfied 32
According to the following statement, LPSP is often measured as the ratio of energy deficit to total energy requirements over a prolonged period of time.7,61
For the purpose of reliability assessment, it is assumed that the aggregate system load is greater than the total power generated.
7

Environmental analysis
As mentioned before, one of the main factors in the deployment of autonomous hybrid power systems is the decrease of greenhouse gas (GHG) emissions. This study focuses on analyzing carbon emissions as the environmental index in designing AHPS. It is crucial to take into account the emissions related to the production and disposal of solar and wind energy sources, even though these sources do not release greenhouse gases when in use. Additionally, there are negative environmental effects that can be seen during the components’ fitting and transportation inside the project region.33,62 When assessing the environmental impact of renewable energy technologies, it is imperative to take a comprehensive approach. However, when compared to fuel-burning-based systems, the carbon emissions linked to renewable energy are far lower. The following formulas can be used to total the CO2 emissions of the different parts of the hybrid system.
63


The relative values of
The control variables that must be optimized in this study are the nominal power of the PV system (PV), the number of wind turbines (WT), and Autonomy Days (AD). The cost-effective features are presented in Figure 1.59,65 Economical parameters of HMS.
Constraint
Certain technological limitations must be adhered to when implementing the optimization program in order to resolve the optimization problem. The following limitations could be stated.17,23
Power balance in the hybrid system
Making sure the hybrid system generates enough electricity to meet the necessary load demand is the main objective of the problem. The following equality constraint is used to examine this constraint
23
:
Renewable factor (RF)
To distinguish between the amount of power generated by renewable and non-renewable sources, the RF is used. This factor (RF), can therefore be used to estimate the RES’s contribution to the overall power supply
7
:
It is preferable to have an RF value of 100%, which indicates that the renewable energy sources meet the entire load demand.
Compliance with PV, WT and DG constraint
The following limitations apply to the minimum and maximum sizes of the components23,24:


Generation unit boundaries
Each generation unit’s output must be within the range specified by the lowest and highest values that are acceptable.
24
:


Constraints related to the battery charging and discharging conditions
One of the main obstacles to batteries being able to resolve battery-related problems is limitations on charging and discharging capabilities. That is, you cannot, for example, charge the batteries to 100% or discharge them to 0%. Furthermore, you are not allowed to add or take power from the load using any current. Generally, the following are the SOC minimum and maximum values24,66:
Loss of power supply probability
Reliability is one of the most crucial metrics for assessing a hybrid MS’s capacity and performance over time. LPSP is employed in this study to find a system’s dependability. The formula used to calculate the constraint is shown below
31
:
Modeling of hybrid microgrid system (HMS)
Details of the hybrid energy system under consideration
Figure 2 presents schematic configurations of a hybrid energy system integrating wind, solar, and diesel generation with battery storage. The system incorporates photovoltaic modules, wind turbines, a diesel generator, and a battery bank, supported by inverters responsible for voltage regulation as well as AC–DC and DC–AC conversion processes.
59
Block diagram of hybrid PV/wind/diesel/battery power system for different scenario.
System component modeling
In this analysis, it is assumed that photovoltaic panels would capture solar power. Given that these panels are only functional during the day, Batteries must be used to store the extra electricity, serving as a backup source when needed. When the sun isn’t shining, wind energy will power a solar-wind system. Batteries and diesel generators serve as backup supplies in a solar-wind-battery-diesel system. 4 Each of the aforementioned pieces of equipment is modeled in the subsections that follow.
Photovoltaic system (PVS)
Based on solar irradiation, the quantity of power produced by a photovoltaic system can be computed as follows4,59:
The electricity output of the photovoltaic system, denoted as Economical parameters of PV module.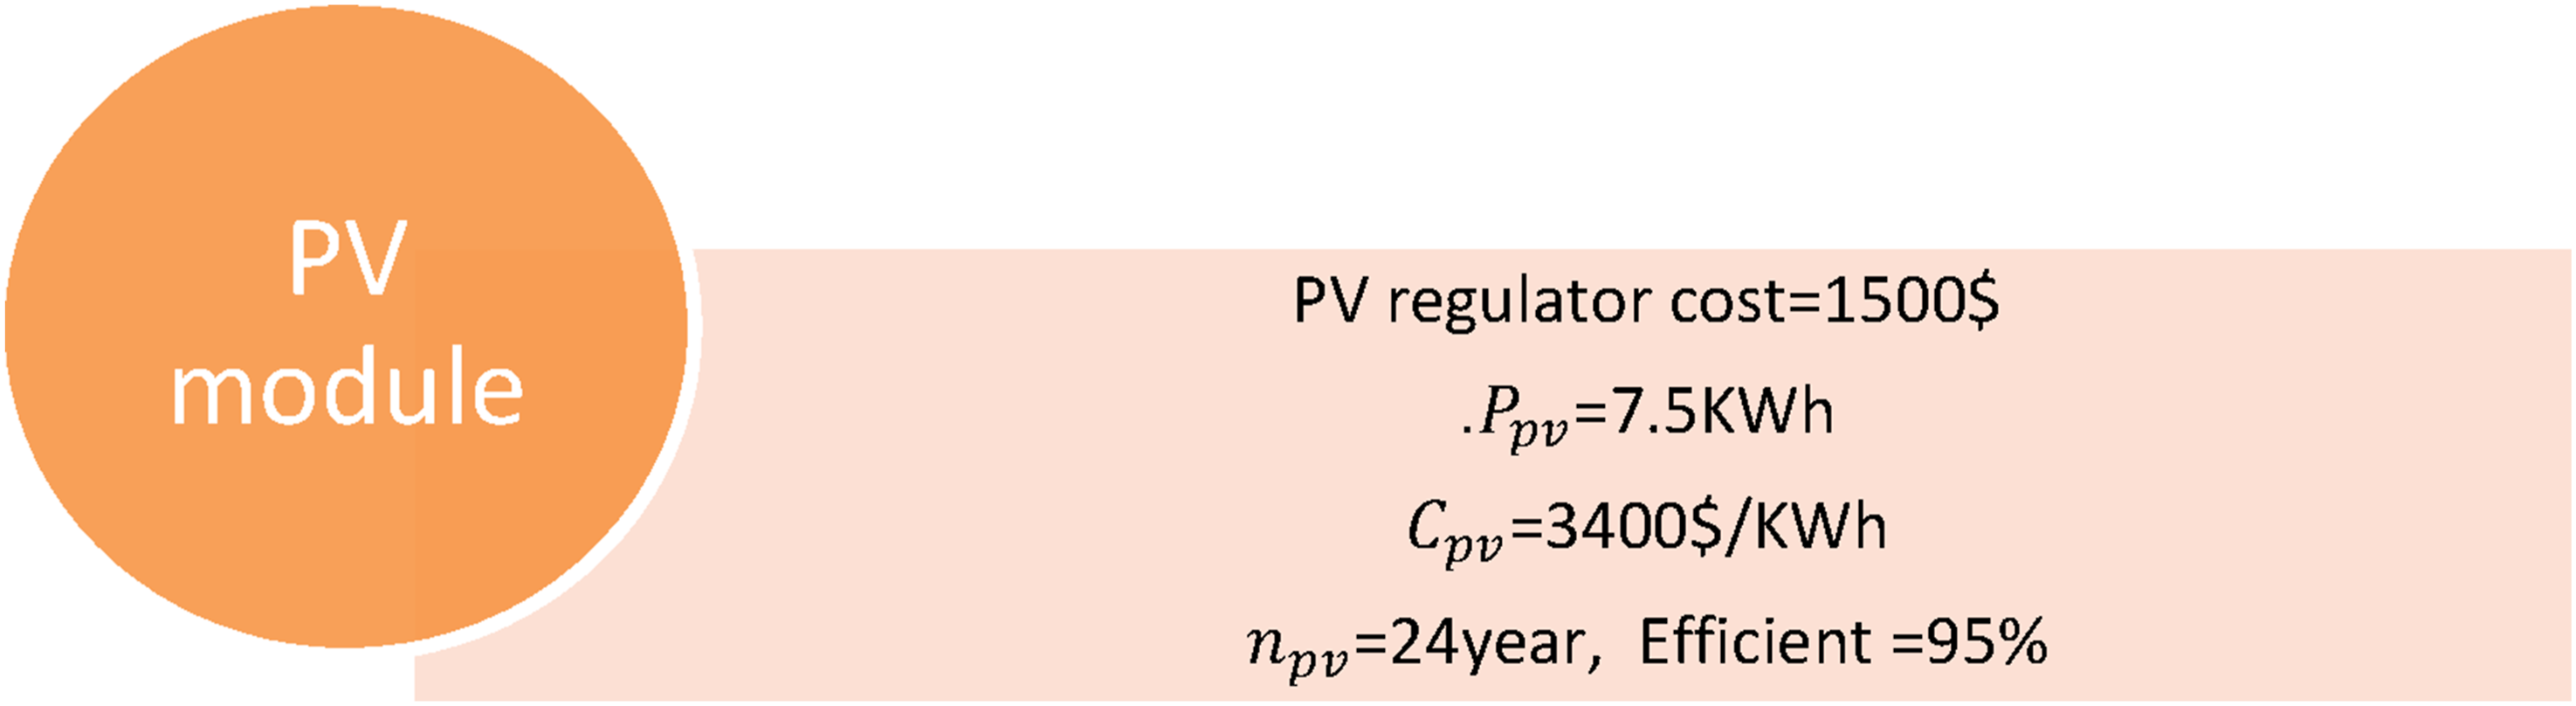
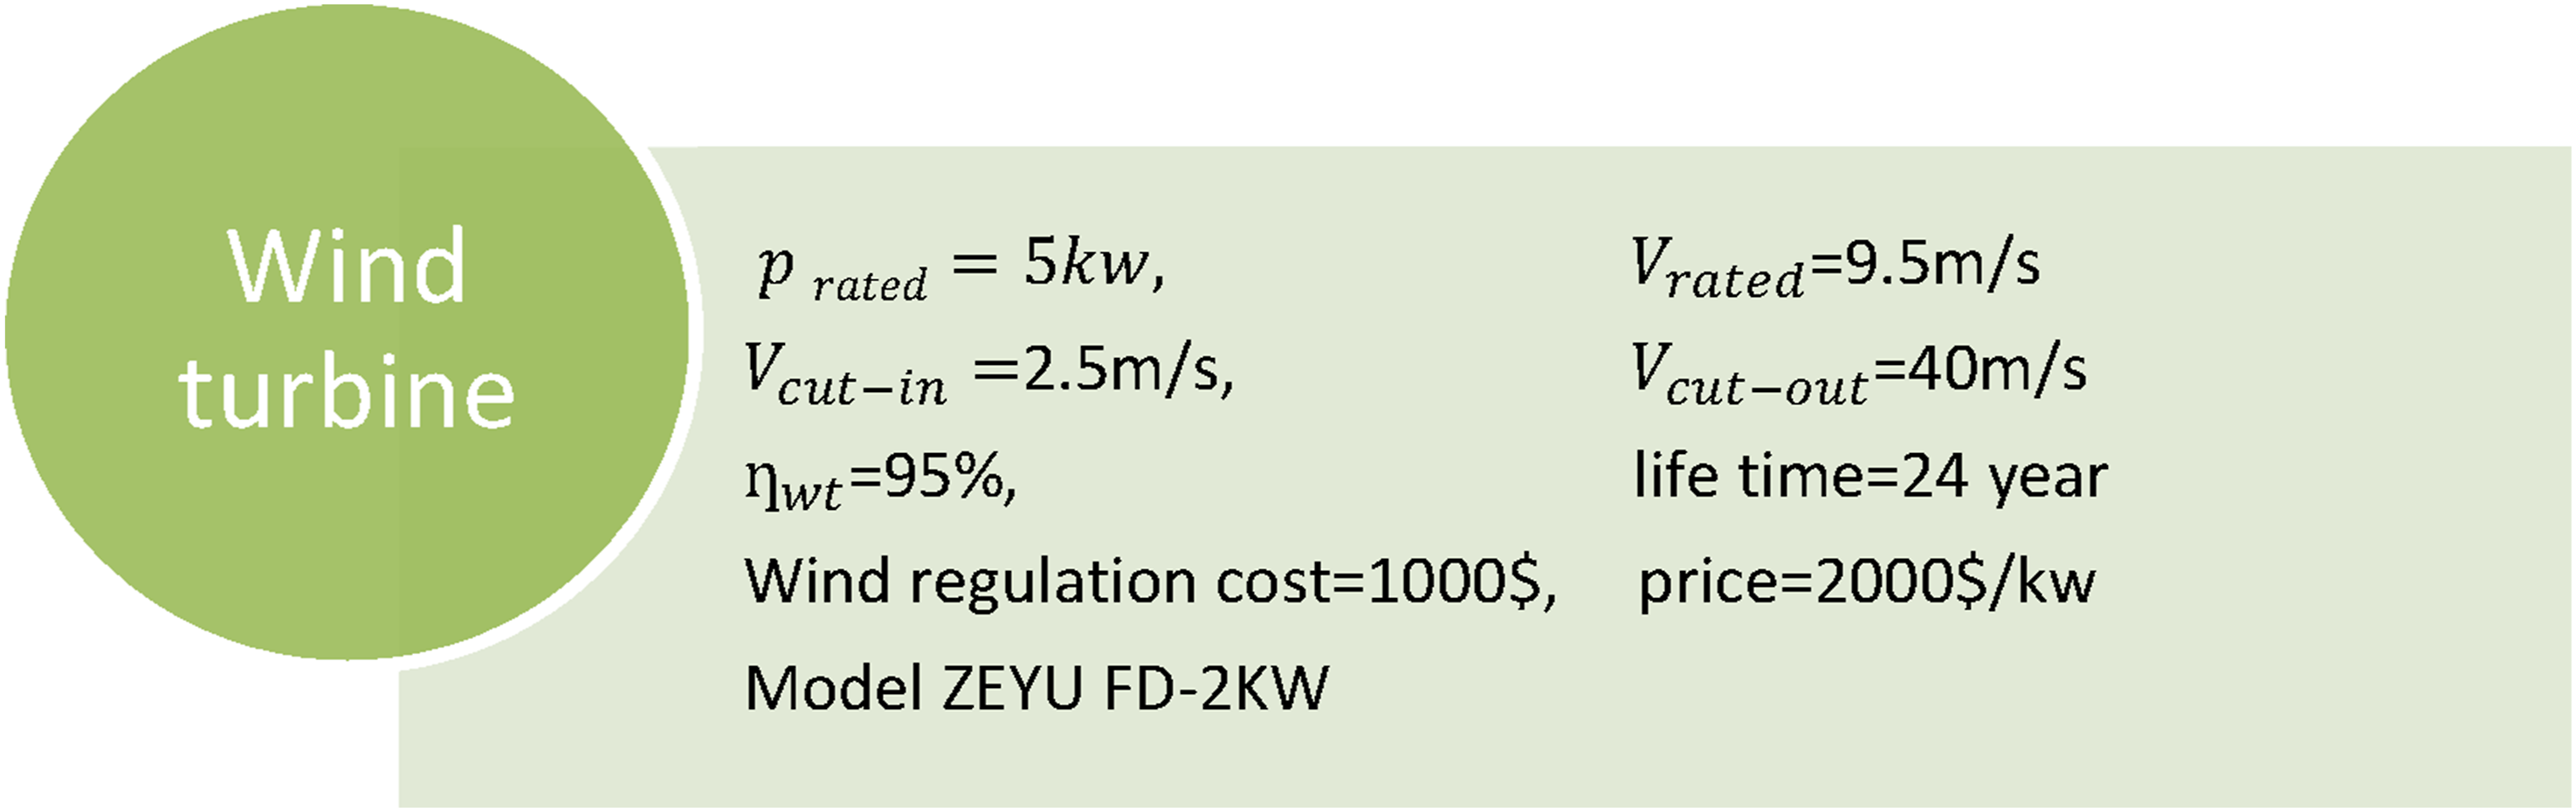
Wind energy system (WES)
Output power (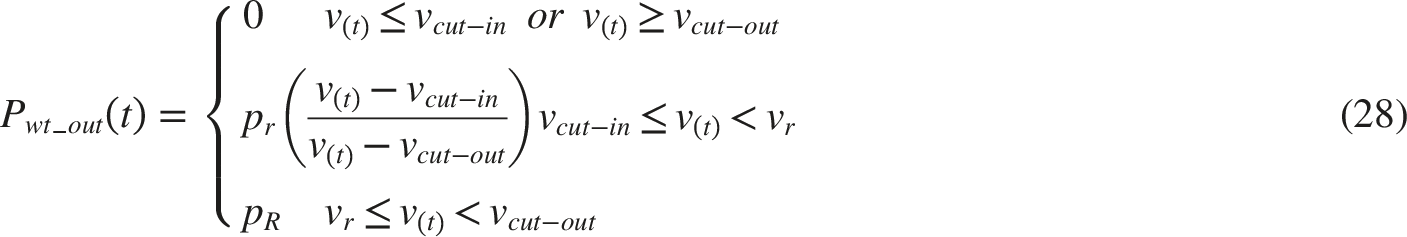
Additionally, if the system in question has a Economical parameters of WT module.
Converter modeling
An inverter and a rectifier are necessary components for the converter, which is one of the most important sections of an HRE system. This allows the conversion from AC to DC and vice versa.
67
The choice of inverter is based on AC loads, and Equation (20) can be used to determine its efficiency.
10
The economical parameters of converter that are taken into consideration are shown in Figure 5.59,65 Economical parameters of inverter module.

Battery modeling
In the majority of microgrid (MG) planning studies, battery storage units (BSUs) are often utilized for a single purpose. This study offers a practical approach for using BSUs to carry out a variety of tasks, such as energy arbitrage and supply/demand matching. This is carried out in accordance with a system strategy that covers every eventuality that could arise in order to effectively utilize the BSUs and optimize the advantage. 5
For the aforementioned hybrid system, the battery’s capacity must be continuously adjusted due to the erratic behavior of the PV and WT output power. The battery is charged when the combined output power of the PV and WT systems exceeds the consumption, and Eq (34) determines how much charging energy the battery has at time t.
27

While the demand exceeds the power set of the PV and WT systems, the battery goes into draining mode. The discharge efficiency is assumed to be 1 in this study. As a result, the current battery charging energy will be as follows: the economical parameters of battery that are taken into consideration are shown in Figure 5.56,62 Economical parameters of battery module.

Energy management strategy for hybrid microgrid systems
Energy management methods involve a diverse set of practices and technological approaches aimed at optimizing energy consumption, enhancing system efficiency, and reducing operational costs across residential, commercial, and industrial applications. For hybrid renewable energy-based microgrids, integrating a robust Energy Management Strategy (EMS) is crucial during the system design and operation stages. The EMS ensures effective coordination and optimal distribution of energy flows among the various components of the autonomous microgrid, such as renewable generators, storage systems, and backup units. Its core objective is to maximize the employment of renewable energy resources while maintaining reliability, diminishing costs, and cultivating overall system performance.24,68 The configuration of the EMS employed in this research is illustrated in Figure 7. The proposed energy management system.
The summary of the strategic EMS’s primary objectives is as follows: a. Significant cost and energy savings can be obtained by putting system efficiency processes into place, which will increase overall energy efficiency. b. Utilizing further renewable energy sources. c. Dipping of fossil fuels usage to save money as well as protect the environment d. To reduce deterioration and increase the battery pack’s lifespan, preserve it.
The proposed Energy Management Strategy (EMS) operates under four distinct modes, depending on the balance between renewable energy generation, load demand, and the state of charge (SOC) of the battery: • • • •
Proposed method
In this work, the new swarm intelligence technique, IPSO, is used to regulate ideal sizes for different parts of the hybrid system. MATLAB software is used to implement the algorithm. These include a new approach based on particle behavior, enhanced exploration and exploitation capabilities, efficient convergence, adaptability to different kinds of problems, robustness, and ease of use.
PSO algorithm overview
PSO is a population-based swarm intelligence technique that uses meta-heuristics First suggested by. 67 The PSO method has garnered a lot of attention lately due to its potent capacity to resolve a variety of challenging optimization issues without necessitating any assumptions regarding the objective function. In their summary of the PSO algorithm’s applications,69,70 categorize them into 26 distinct groups, such as combinatorial optimization problems, power generation and power systems, design applications, control applications, image and video analysis applications, and more.
A bionic program called the PSO algorithm mimics a swarm of birds’ prey behavior. According to the Particle Swarm Optimization algorithm, every optimization issues solution is referred to as a “particle” and is viewed as a “bird” in the search space. One of the two properties of each particle is its position, which is indicated by
Equations are used to update the position besides velocity of every particle:

Related work and contributions
The literature presents diverse applications and enhancements of particle swarm optimization (PSO). For global optimization, PSO was combined with genetic algorithms in Ref. 71. Network reconfiguration in power systems was addressed by an improved PSO in Ref. 72. A multi-strategy, multi-objective PSO was proposed in 73, while Ref. 74 developed a vector-angle-based many-objective PSO incorporating an archive mechanism. Ref. 75 introduced a hybrid gravitational search–PSO method, and Ref. 76 applied PSO techniques to portfolio optimization.
Improved particle swarm optimization (IPSO) method
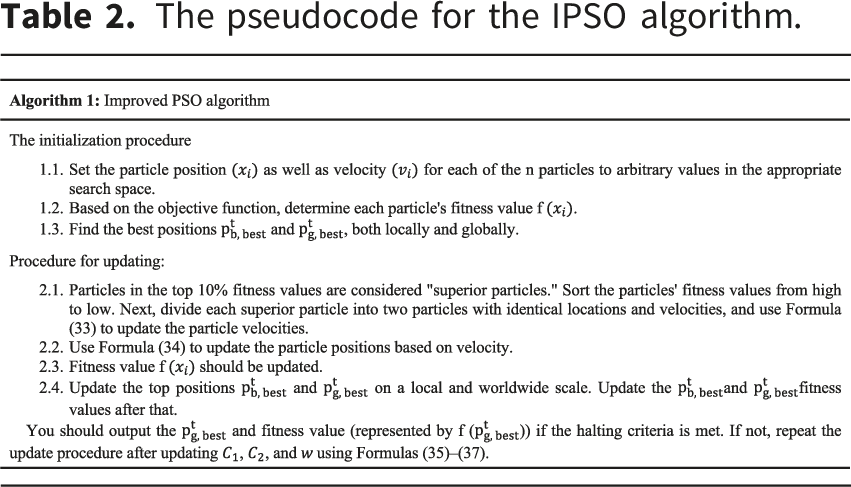
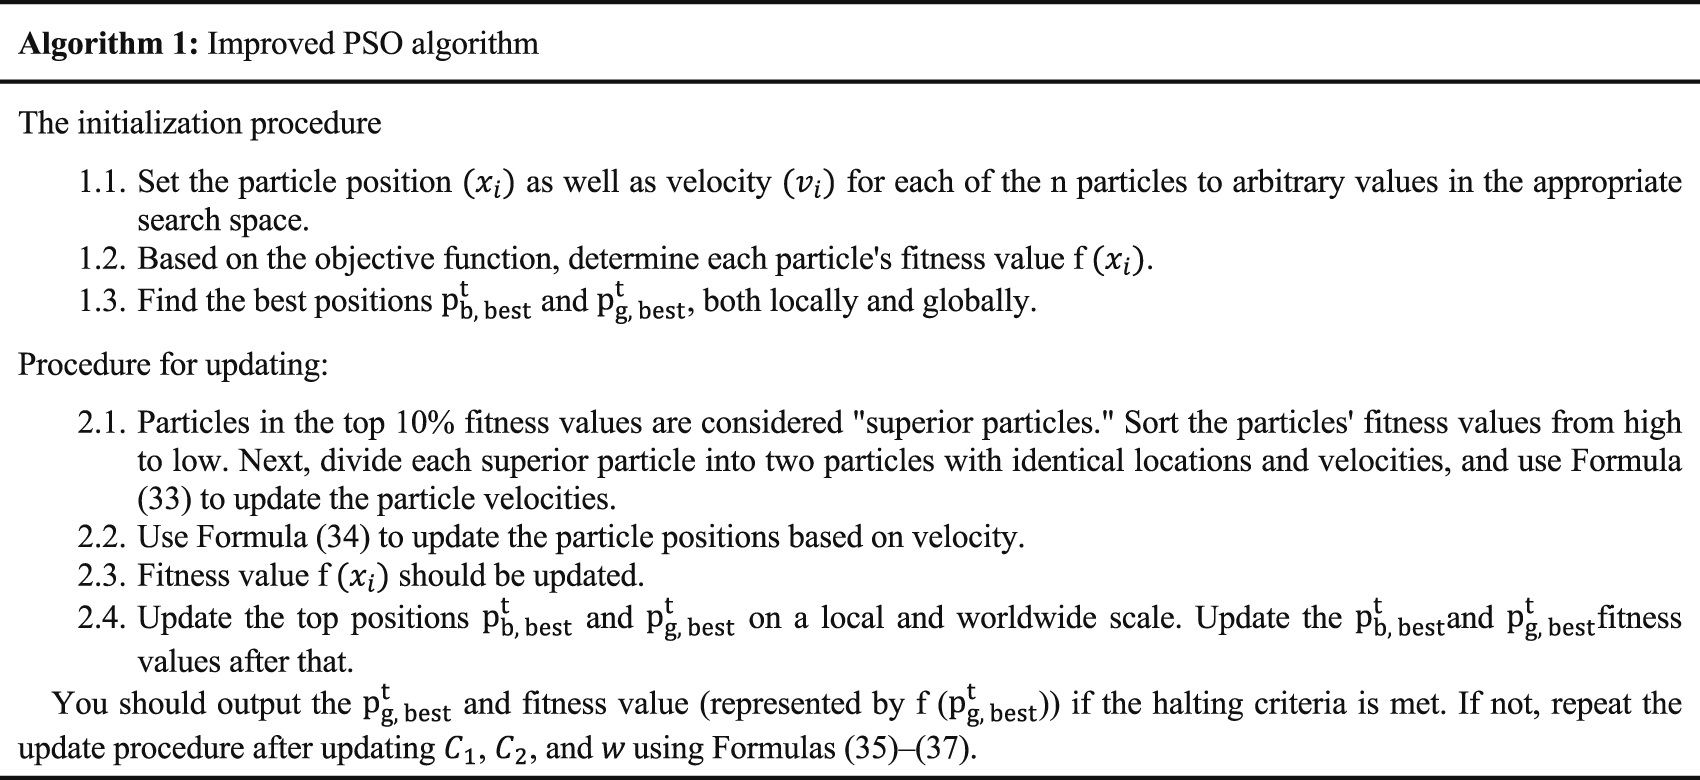
The division of the process into optimization techniques is known as individual cloning. The superior particles are separated from the inferior particles in each cycle. Stated differently, each iteration ranks the particles’ fitness values from high to low. Superior particles are those that have fitness values in the top 10%. The 10% with the lowest fitness ratings would be removed. Next, two particles with the same location and velocity are created from each superior particle. 71
Improvements in dynamic parameters C1 and C2
Dynamic parameters are created by improving C1 and C2.
67


Enhanced particle initial memory
IPSO method has instant memory and the velocity of the each particle doesn’t depend on the previous velocity. The initial memory of particle is calculated by the following equation.77–79

In order to accelerate convergence over time, the
Notably, the control parameter (w) is enhanced tenfold to enhance the exploration capacity to handle the intriguing problem and to boost the inspiration from the birds’ excellent recall.
Each particle’s position and velocity would be updated using the following equations (36) and (37):

The pseudocode for the IPSO algorithm.
In step 1.3 of the minimization problem, the local best is
Uncertainty modeling
There is a common occurrence in real-world problems called uncertainty, where there is a significant chance that the parameters and goals of the problem will differ from their actual and anticipated values. When considering the price instability of the electric market, the governing authorities are at risk. 7 Therefore, it is technically impossible to model these uncertainties deterministically. Because of the significance of uncertainties in micro-grids, stochastic methods are necessary to incorporate them into the system model.
PDFs are used to model the uncertainty in renewable energy resources. The Weibull and beta distributions are commonly used to describe the uncertainty related to wind speed and solar irradiation, respectively. However, a variety of techniques have been employed to address ambiguity and extract the most revealing moments that reveal the true behavior. The precise modeling of renewable energy sources has a big influence on every objective function.
PEM is one of the approximation techniques that addresses uncertainty. Power system operators prefer this approach due to its high computation accuracy and lack of need for knowledge of random variables. PDF. The basic concept of PEM is to focus statistical data of a random variable on K points, where a function (F) creates a relationship between input variables (probabilistic (X) and deterministic (c)) and output variables. All input variables (m) are necessary for the function 
The following equations will be solved in order to determine the standard location 

To calculate 

The output function Z will be computed for each variable and for each concentrated point 
In this research, (2m + 1) Hong’s PEM scheme 


The updated weighting factor 
Techno-economic analysis
The techno-economic analysis is a crucial step in evaluating the performance and feasibility of hybrid renewable energy systems (HRES). It provides an integrated assessment of both technical reliability and economic viability, ensuring that proposed system configurations are not only capable of meeting energy demand but also cost-effective and environmentally sustainable. By combining performance indicators such as the cost of electricity (COE), loss of power supply probability (LPSP), and carbon dioxide (CO2) emissions, this analysis helps identify optimal design strategies that balance reliability, affordability, and sustainability. In this study, the techno-economic evaluation is applied to a hybrid PV/wind/diesel/battery microgrid system designed for remote areas, with real-world case data from Shalateen, Egypt.
Location and load profile
Using the suggested multi-objective optimization techniques, a range of DER types are allocated based on non-renewable energy resources like diesel and renewable energy resources like PV and WT energy sources and batteries’ “storage energies” in order to simultaneously increase the use of RES and decrease the cost of energy (COE), loss of power supply probability (LPSP), and CO2 emission.
In the disputed Halayeb Triangle between Egypt and Sudan, Shalateen is the biggest town. The administrative center for all of Egypt up to the Sudanese border is located at 23°75′4″N 35°35′8″, 520 kilometers south of Hurgada. 60 The optimization procedure for Shalateen City makes use of real weather data.
This study creates a daily load profile of energy consumption for a single house in a location with a similar environment, which is shown in Figure 8. The smallest load is 0.54 kW, and the maximum demand is 5 kW.
60
Hourly load profile for single house (kW).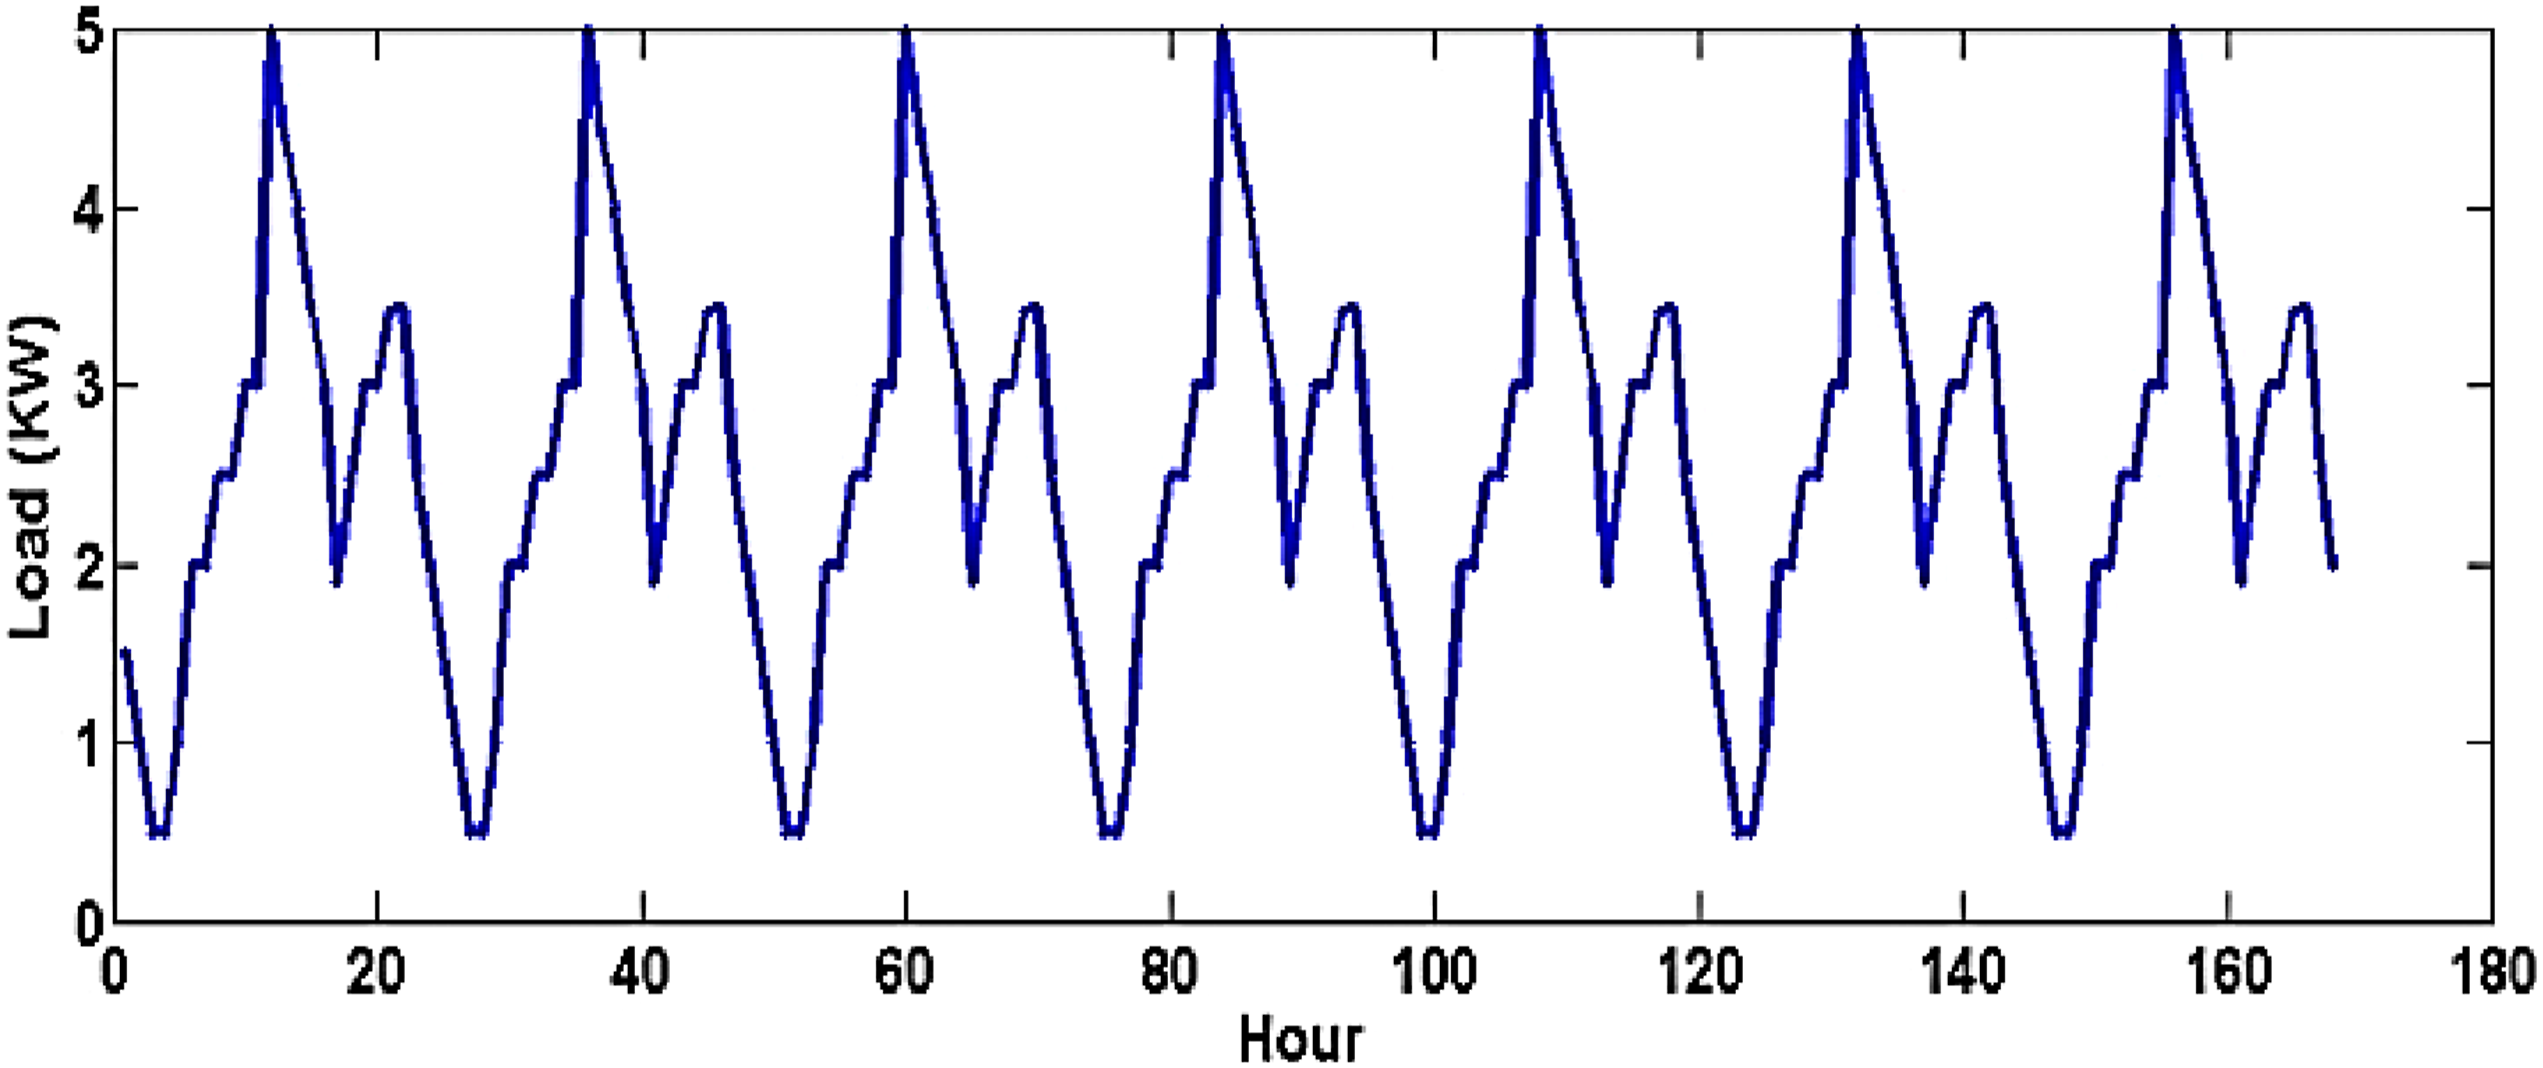
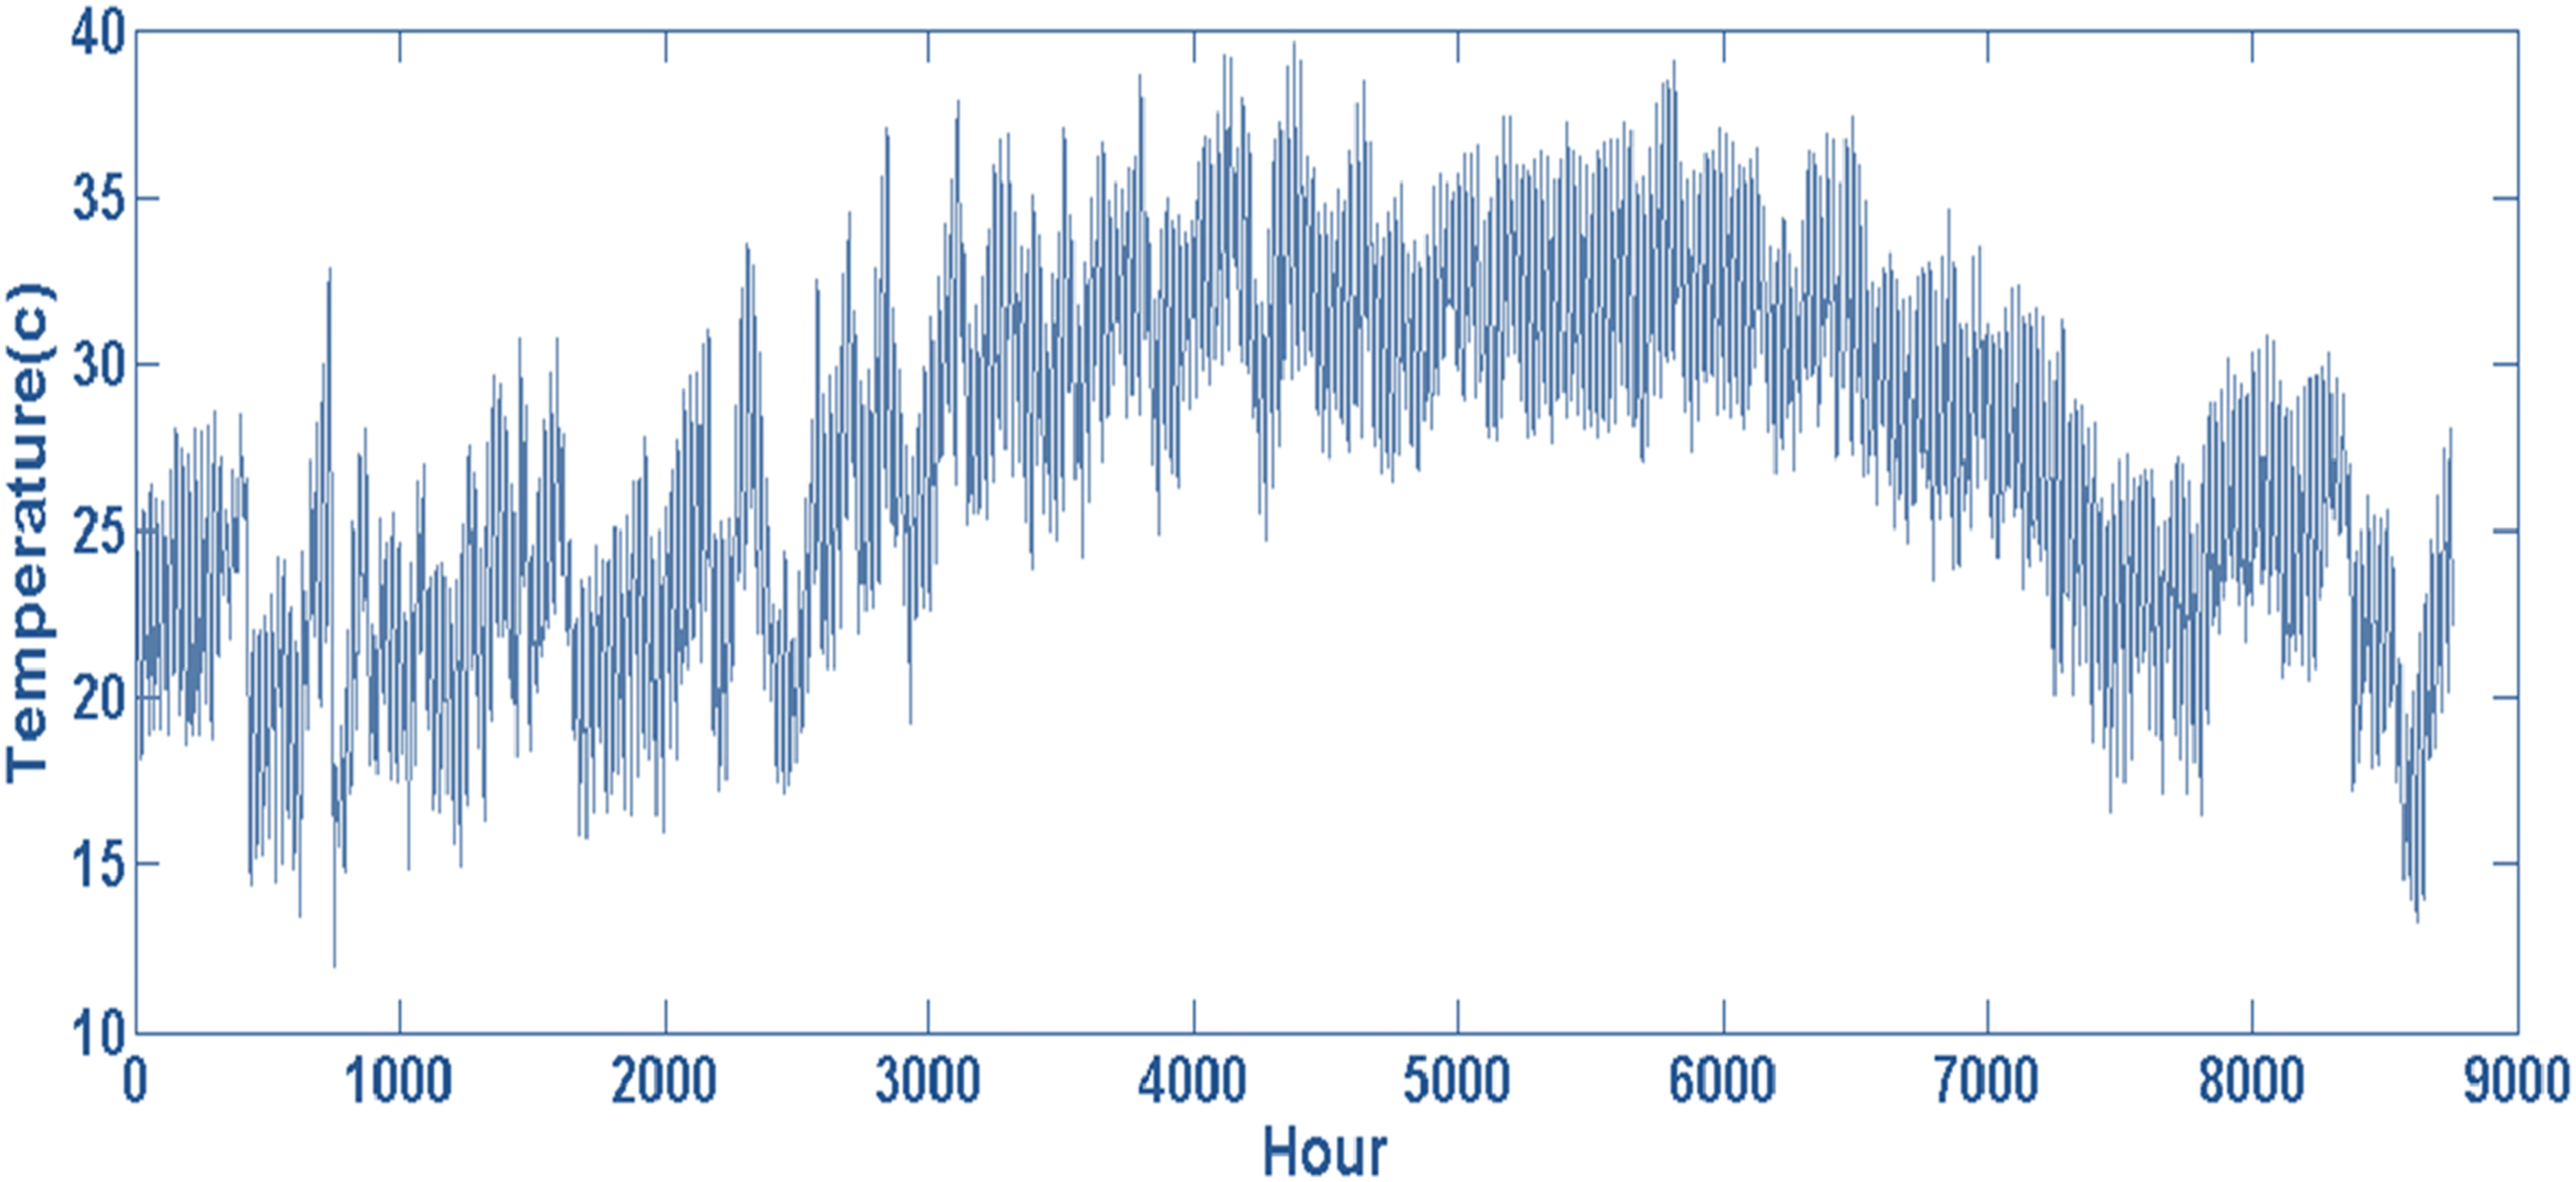
Solar and temperature resources
Figures 9 and 10 display the monthly temperature and sun global horizontal irradiance (GHI) data, respectively.
60
December through January had the lowest average radiation (1081 kW/m2), whereas March through August have the most (Figure 9). Temperatures are at their highest in August and lowest in December (Figure 10). Shalateen city radiation data. Average temperature for Shalateen city.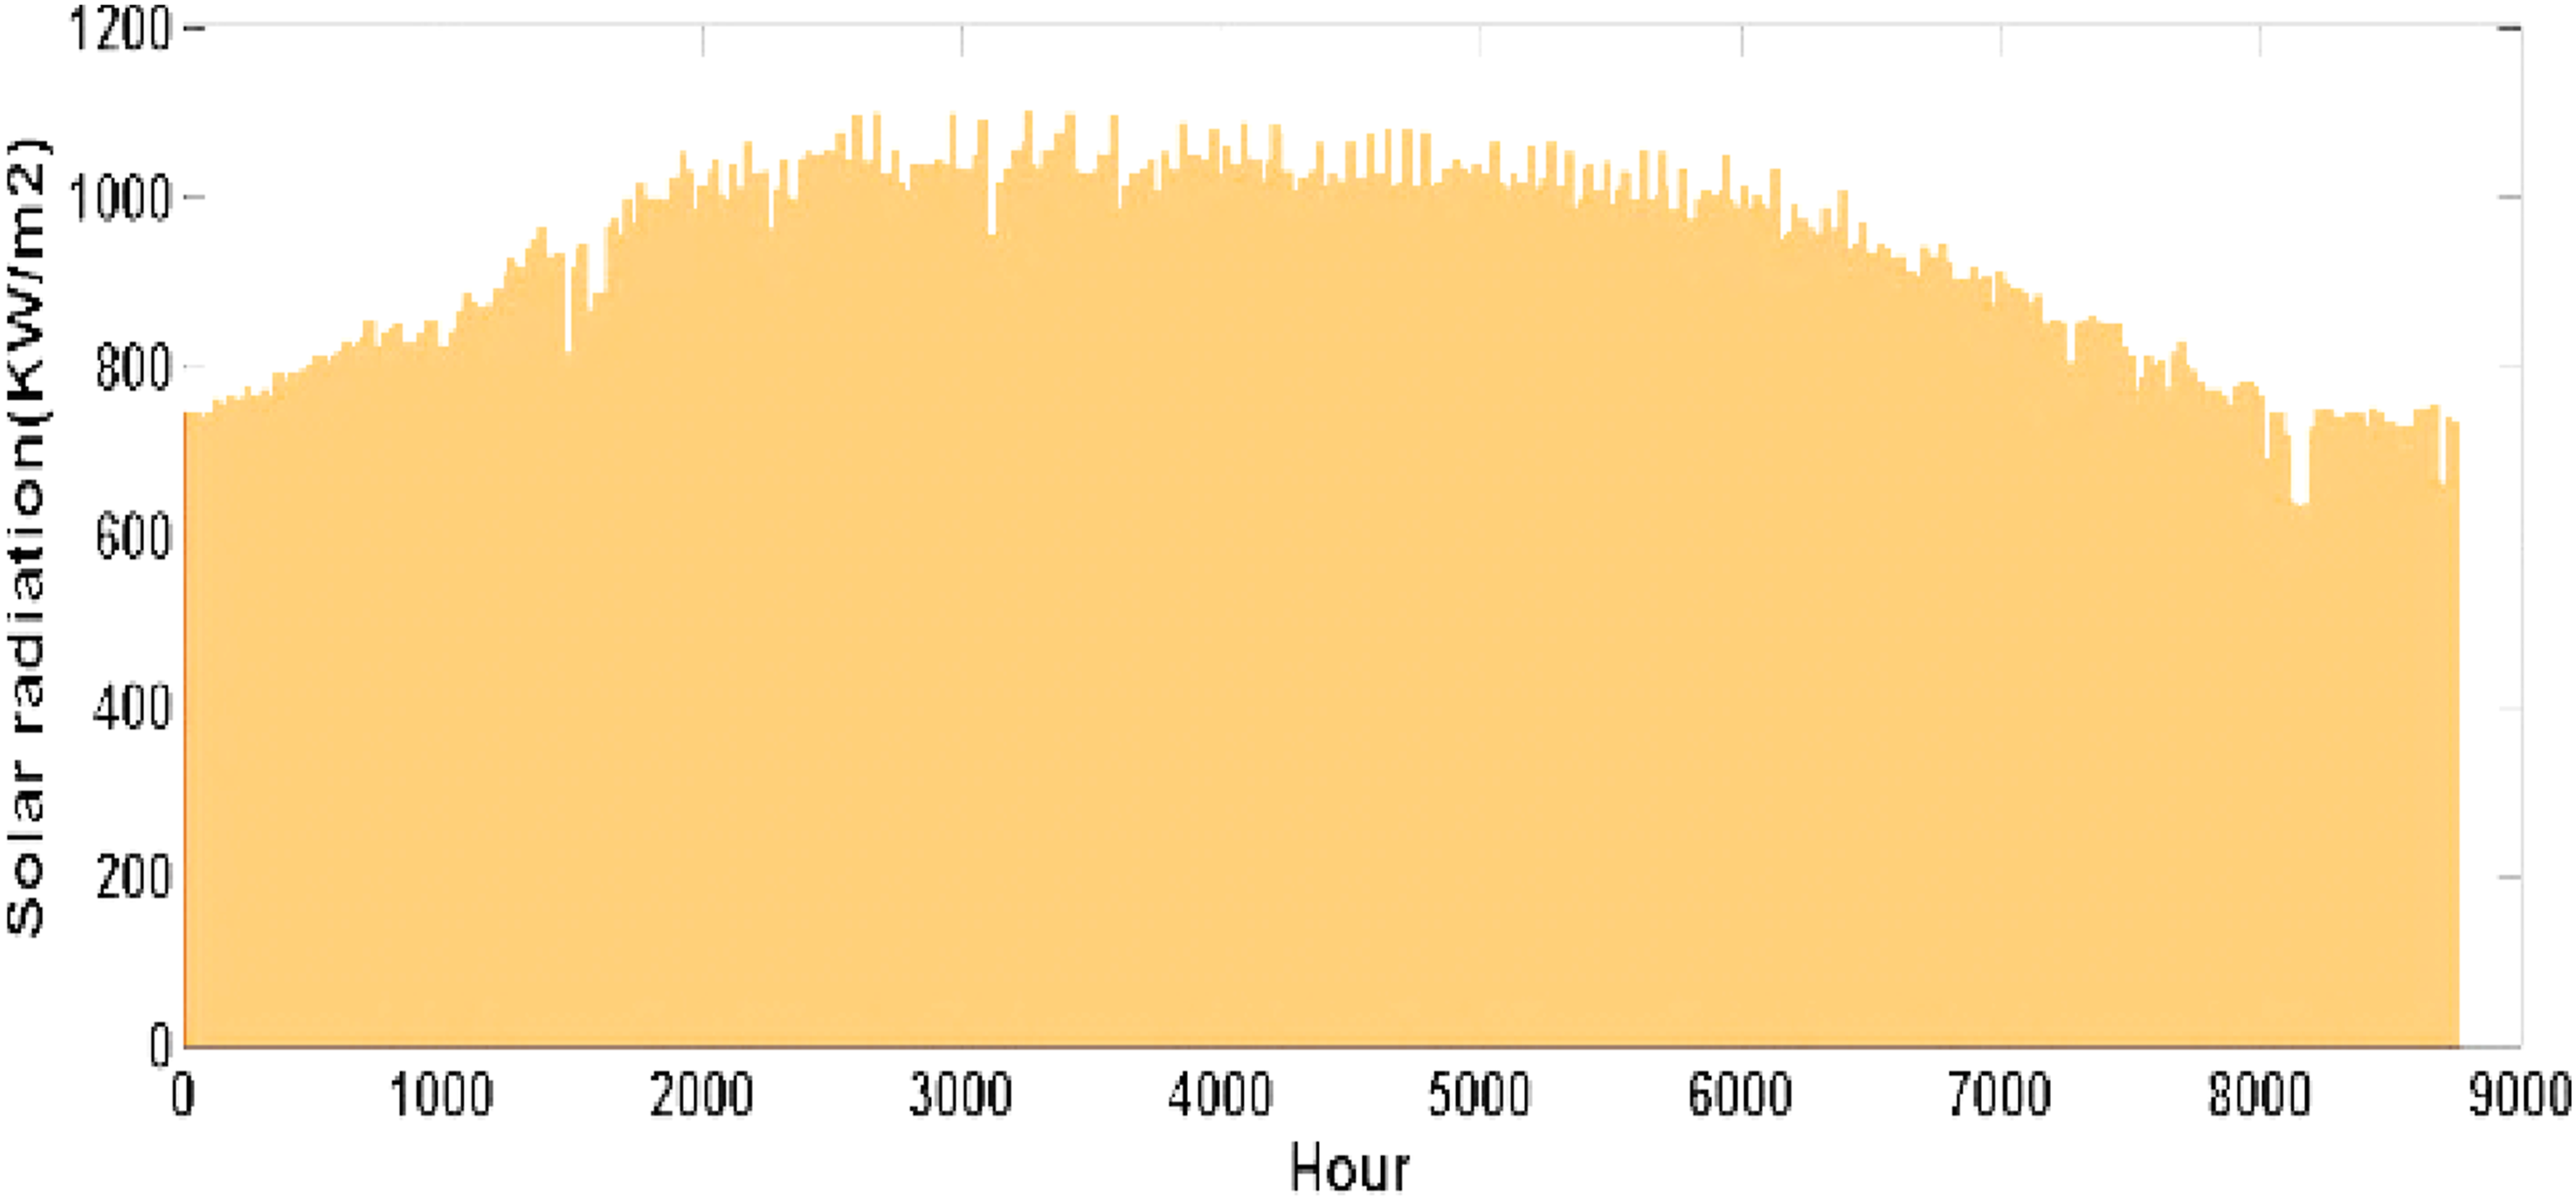
Wind resources
Figure 11 displays the wind resource statistics per month grounded to the local climate. It’s noteworthy to observe that the wind speed usually increases in June.
60
Shalateen city wind speed data.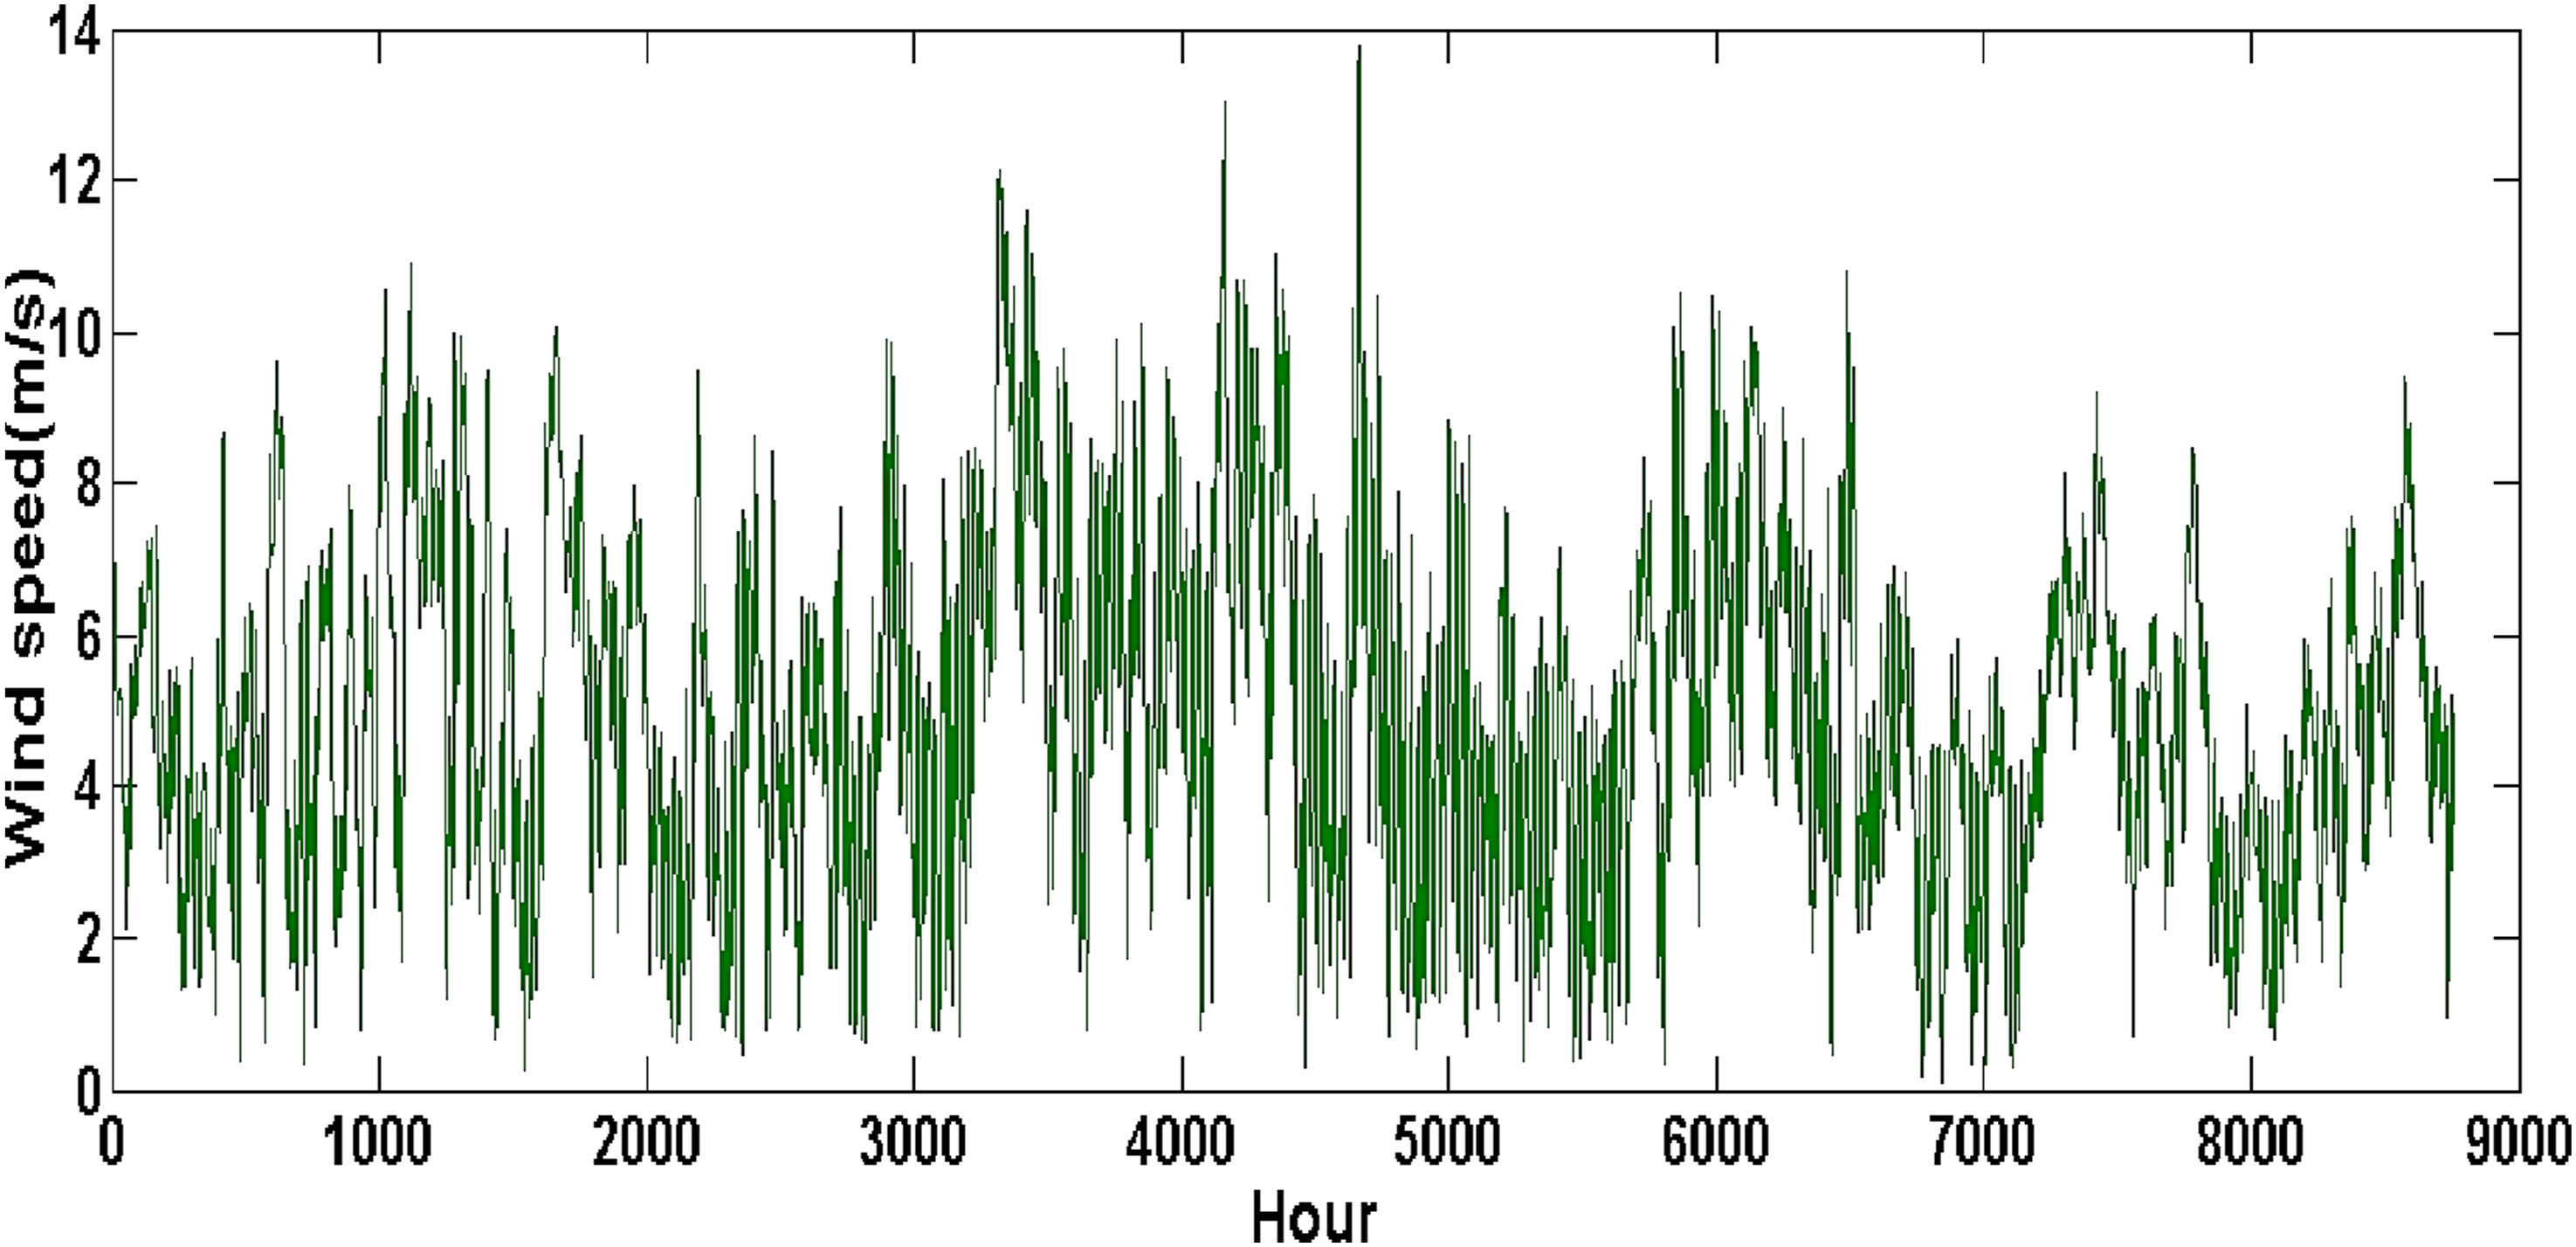
System design
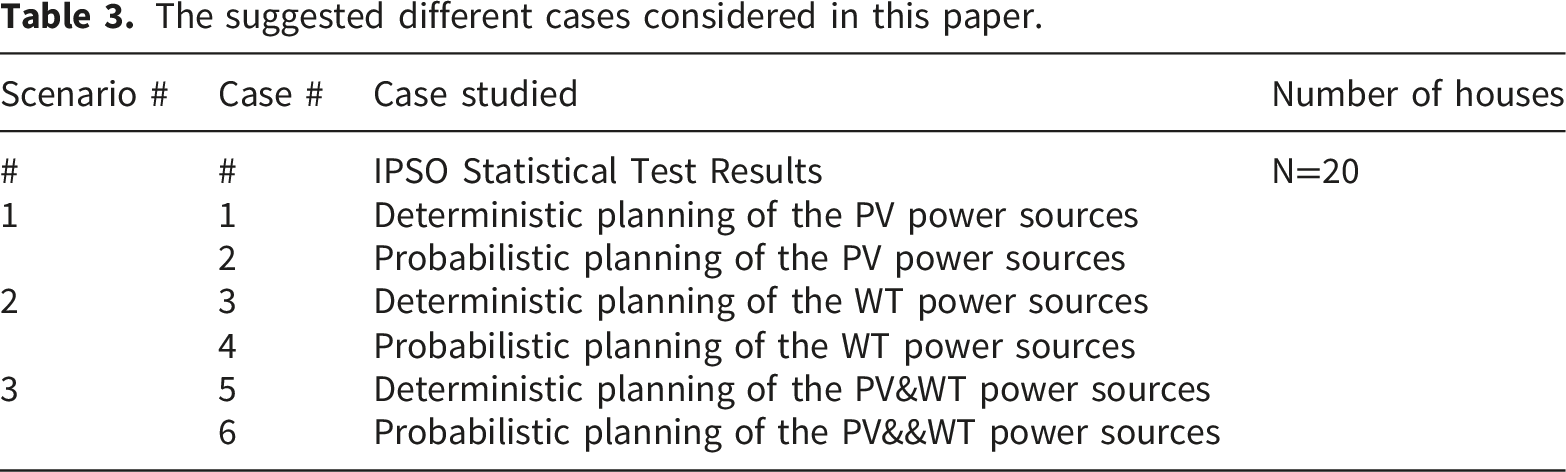
This study uses the multi-objective optimization method to present a number of possibilities to achieve the optimal design of the microgrid being investigated. The Pareto front is a set of optimal solutions generated by this technique. The deterministic and stochastic planning of renewable power generating resources is used to analyze the optimization of a hybrid PV/wind/DG/battery system for Shalateen City, Egypt. Refer to Figure 2, this paper investigates three off-grid power supply systems—the hybrid photovoltaic-wind-battery-diesel generator (PV/WT/BUS/DG), wind-battery-diesel generator (WT/BUS/DG), and photovoltaic-battery-diesel generator (PV/BUS/DG) systems based on three optimization algorithms for the Egyptian city of SHLATEEN.
The suggested different cases considered in this paper.
Simulation results based on IPSO method
This section contains the results of their techno-economic assessments as well as the best off-grid power supply system configurations for Shalateen, Egypt, dependent on the renewable energy resources that are accessible. The basis for techno-economic analysis and optimal sizing is the capacity of renewable energy sources to satisfy electricity demand despite their intermittent nature.
IPSO statistical test results
The convergence curve of the suggested problem’s solution, as determined by the improved Particle swarm optimization (IPSO), Particle swarm optimization (PSO), and water cycle algorithm (WCA), is shown in Figure 12. Notably, the aforementioned algorithms differ in their parameters. These parameters’ values are chosen in Figure 13.
55
Figure 12 shows that the IPSO method was able to arrive at the ideal point faster and that, when compared to other solvers, its objective function value was the lowest (optimal). Table 4 provides additional information on the convergence tendency of several algorithms for distinct case studies. Based on the outcomes of the IPSO algorithm, PSO, and WCA, Table 4 presents the average, best, worst and number of iteration LPSP of the various research situations. All algorithms have a population size of 100 and a maximum iteration of 100. After 50 iterations of the suggested issue, the various values shown in Table 4 were computed in order to assess the outcomes of this part. It is evident from Table 4 that the IPSO’s optimal (minimum) value for the objective function or LPSP has been determined, the lowest LPSP achieved using the IPSO algorithm is 7.149 %, but this value rises to 7.211 % in the PSO alone. Furthermore, Table 4 shows that the worst, best, and average values of the algorithm’s objective function are all near to one another, indicating that the final response’s dispersion is low. In comparison to other algorithms, the IPSO method has low convergence iteration. The IPSO algorithm’s convergence iteration is 10; whereas, the other algorithms’ iterations exceed 50. Additionally, the IPSO method has the shortest computing time. Consequently, the IPSO method, which offers a faster rate of convergence than the PSO Optimizer, and WCA, has the best answer for resolving the given problem. Convergence behavior of various algorithms applied to the problem. Overview of the control parameters used in the adopted optimization algorithms. Statistical performance analysis of different methods applied to the problem.
Comparison and simulation results using IPSO.
Scenario 1: Solar PV/BES/DG configuration
The goal of the Solar PV/BES/DG system is to integrate photovoltaic panels with a DG and BES. This configuration, which may not make use of wind energy, combines two non-renewable sources (DG and BES) with one renewable source (Solar PV) to balance renewable generation with dependable backup power.
Case 1: Deterministic model of the PV power sources
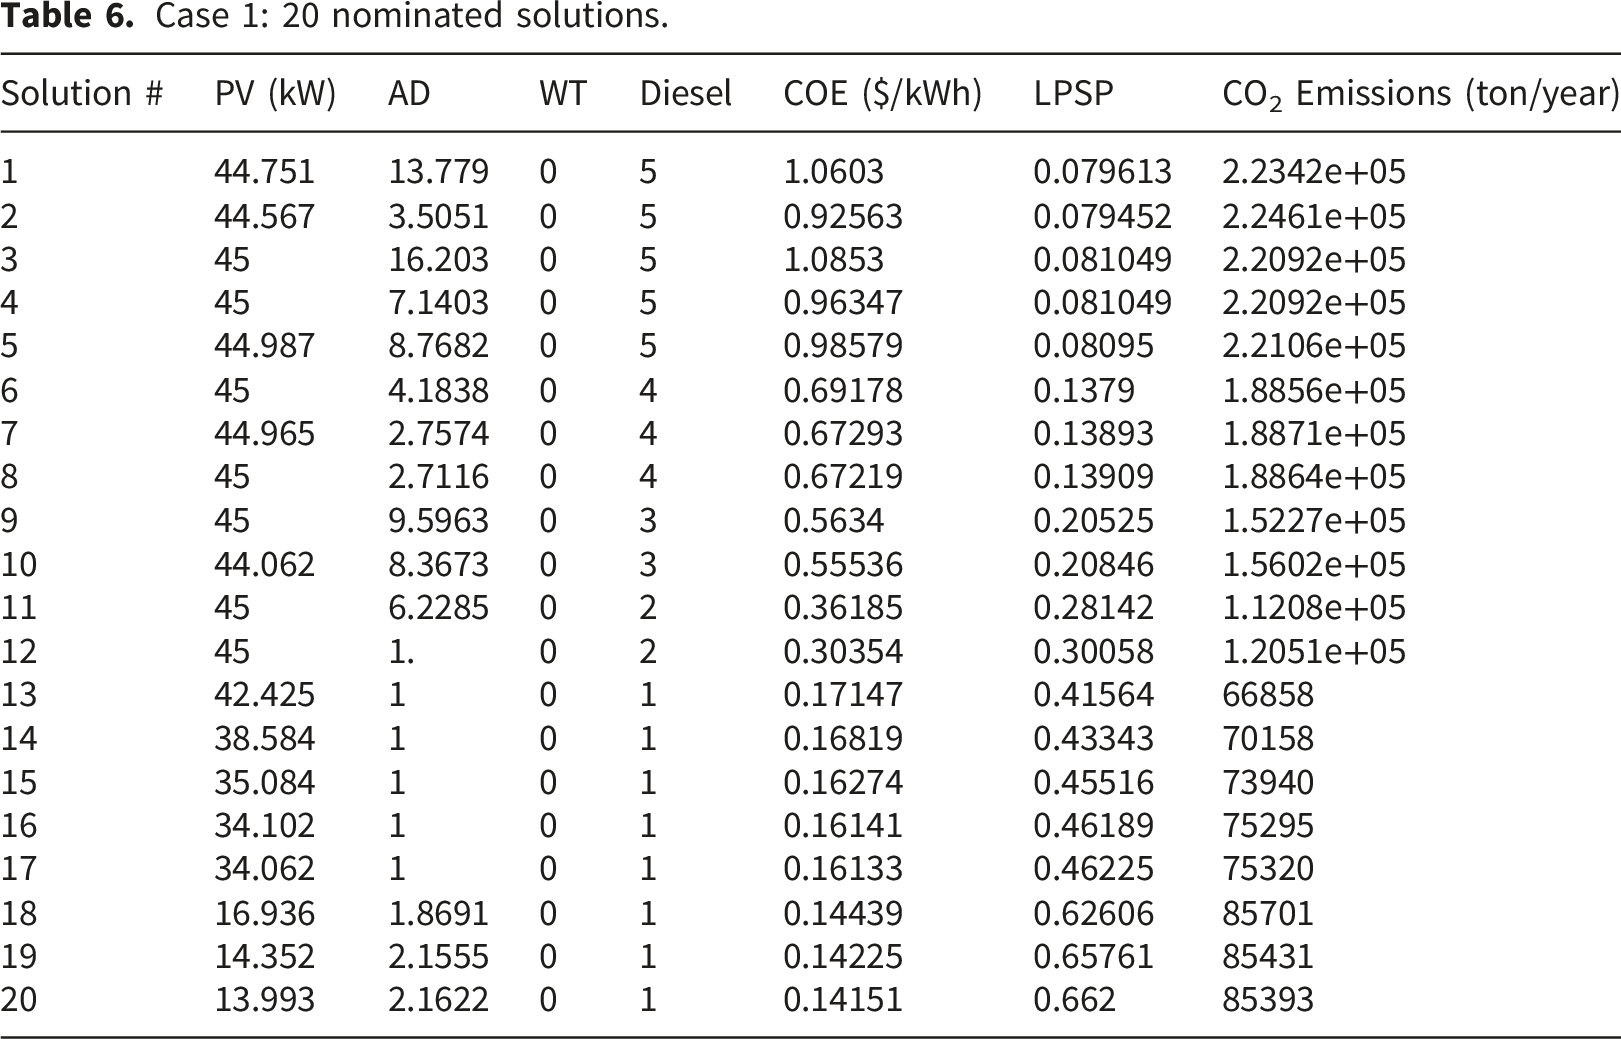
The suggested multi-objective optimization techniques are used to simultaneously lower the Cost of Electricity (COE), the Loss of Power Supply Probability (LPSP), and CO2 Emissions. By distributing PV units and diesel generators with batteries, the random variable of PV units, such as solar irradiance, is regarded as deterministic (without uncertainty). Figure 14 displays the Pareto front of the standalone micro-grid system, which was generated by the proposed algorithm based on LPSP, COE, and CO2 functions. Twenty of the best solutions from the PF that was found are listed in Table 6. Pareto front generated by the proposed algorithm based on the LPSP, COE, and CO₂ objective functions for Case 1. Case 1: 20 nominated solutions.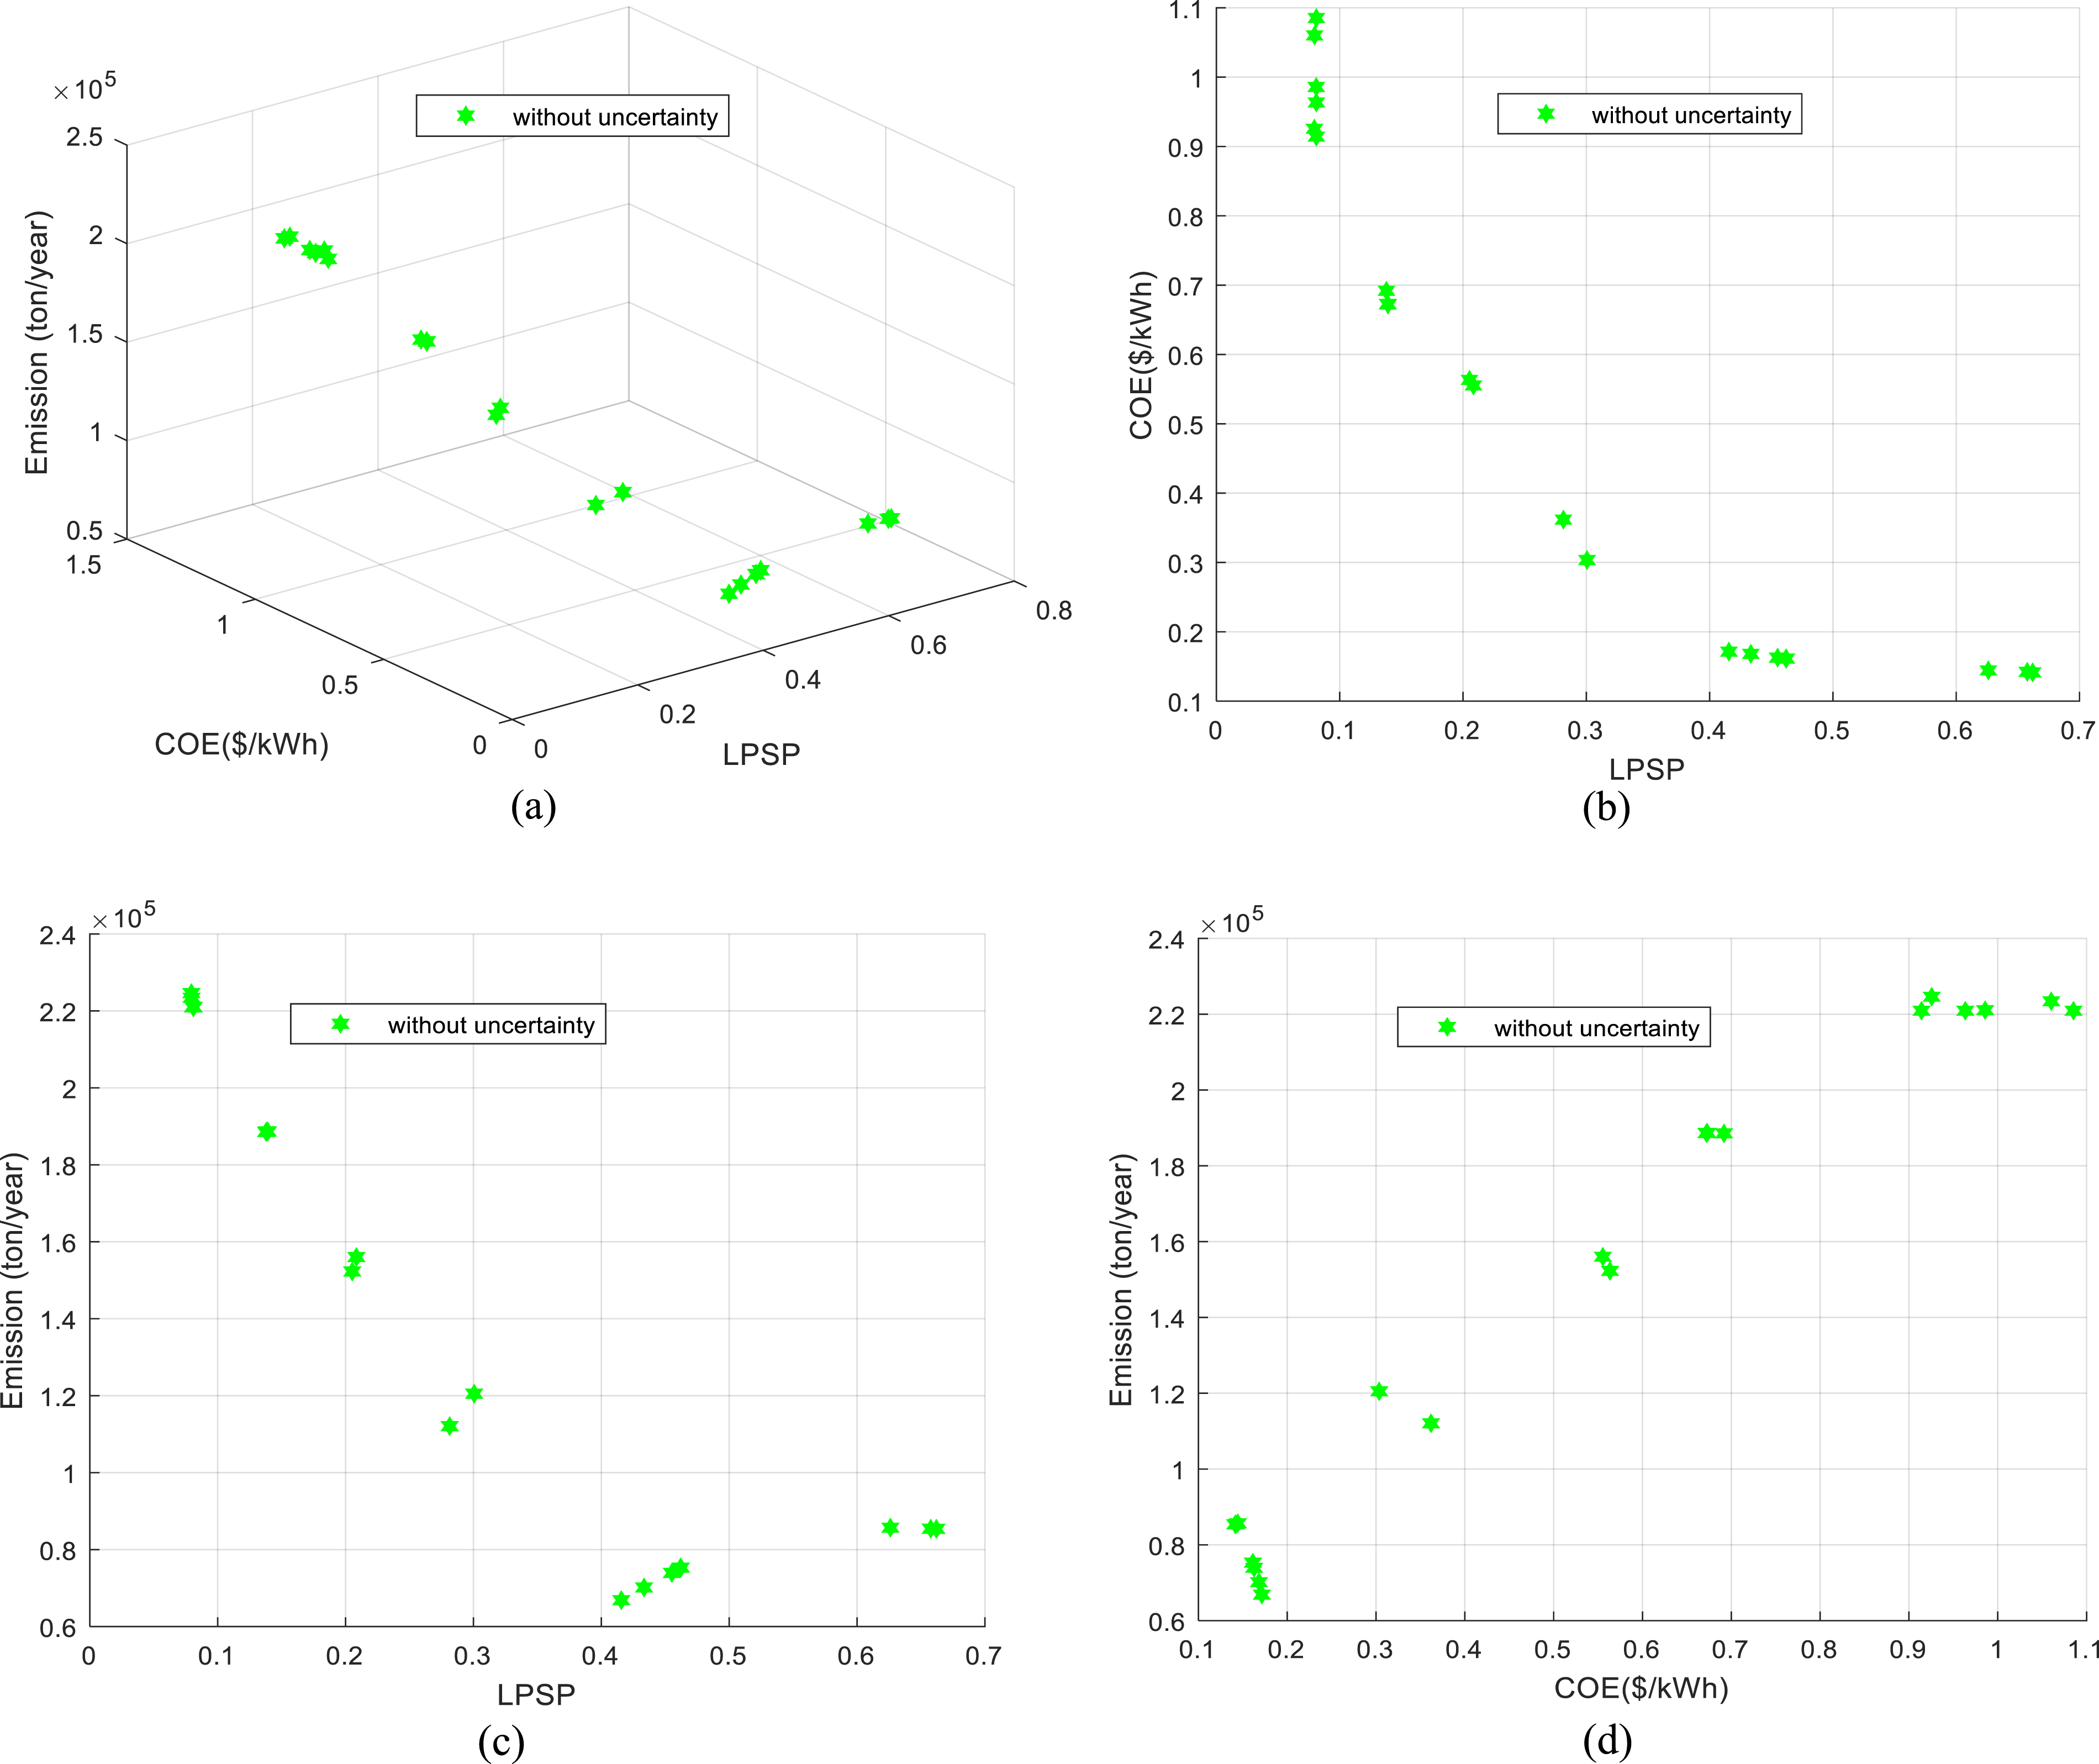
The only solution with a lower COE of 0.14151$/kWh than the others is solution #20, which is based on net metering and the REMC block rate schedule. Accordingly, solar investment is advantageous for solution #20 in terms of COE, but not for all other solutions. At 66.2%, this solution has the highest LPSP.
The suggested approach yields the lowest LPSP of 7.9613% (solution #1) for 44.751 kW of power generated by a PV array, five diesel generators, and the autonomy days, which would be 13.779 days. The off-grid hybrid system’s emissions are computed. According to the electricity grid’s emission parameters, which are 66858 ton/year for CO2, Solution #13 yielded the least amount of pollution.
By using an optimization method with variable values perturbed around the optimal solution, an attempt is made to confirm the optimal solution. For instance, the optimization technique developed in solution #9 calls for three diesel generators, 45kW of photovoltaic panels, and 9.5963 days of autonomy. Following simulation the COE is 0.5634 $/kWh, the LPSP is 20.525%, and the CO2 emissions are 1.5227e+05 ton/year.
Case 2: Stochastic model of the PV power sources
Statistical summary of 20 nominated solutions for case 2.
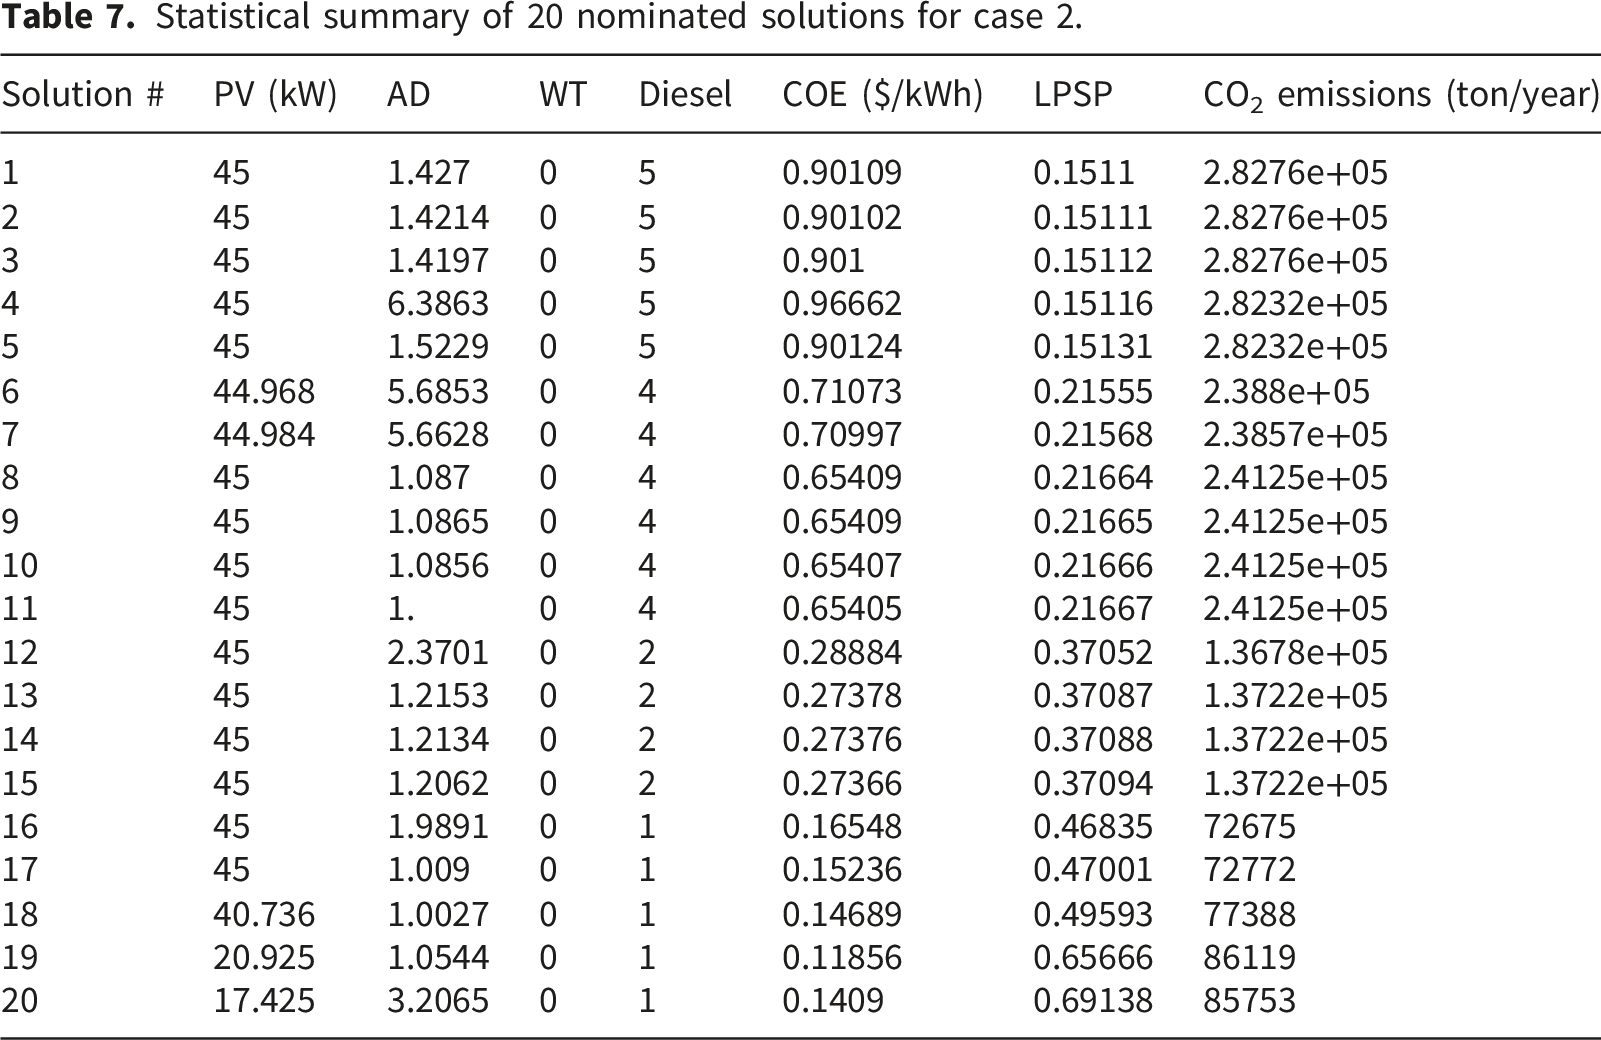
The best ideal solution is offered by solution #10, which requires four diesel generators, 45kW PV panels, and 1.0856 days of autonomy. The COE is 0.65407 $/kWh, the LPSP is 21.666%, and the CO2 emissions are 2.4125e+05 ton/year. In the present method, the number of DG is increased from three units in the original instance to four units, and the optimal PV size is the same as in the original case (case #1 without uncertainty).
LPSP, COE, and emission functions with uncertainty impact are the basis for the Pareto fronts of the standalone microgrid system in Figure 15, which illustrates how the uncertainty generated by the PV power source causes the obtained PF to be non-smooth, hence increasing all objective metrics (LPSP, COE, and Emission). Pareto front of the standalone microgrid system considering PV generation uncertainty based on the LPSP, COE, and emission objective functions (Case 2).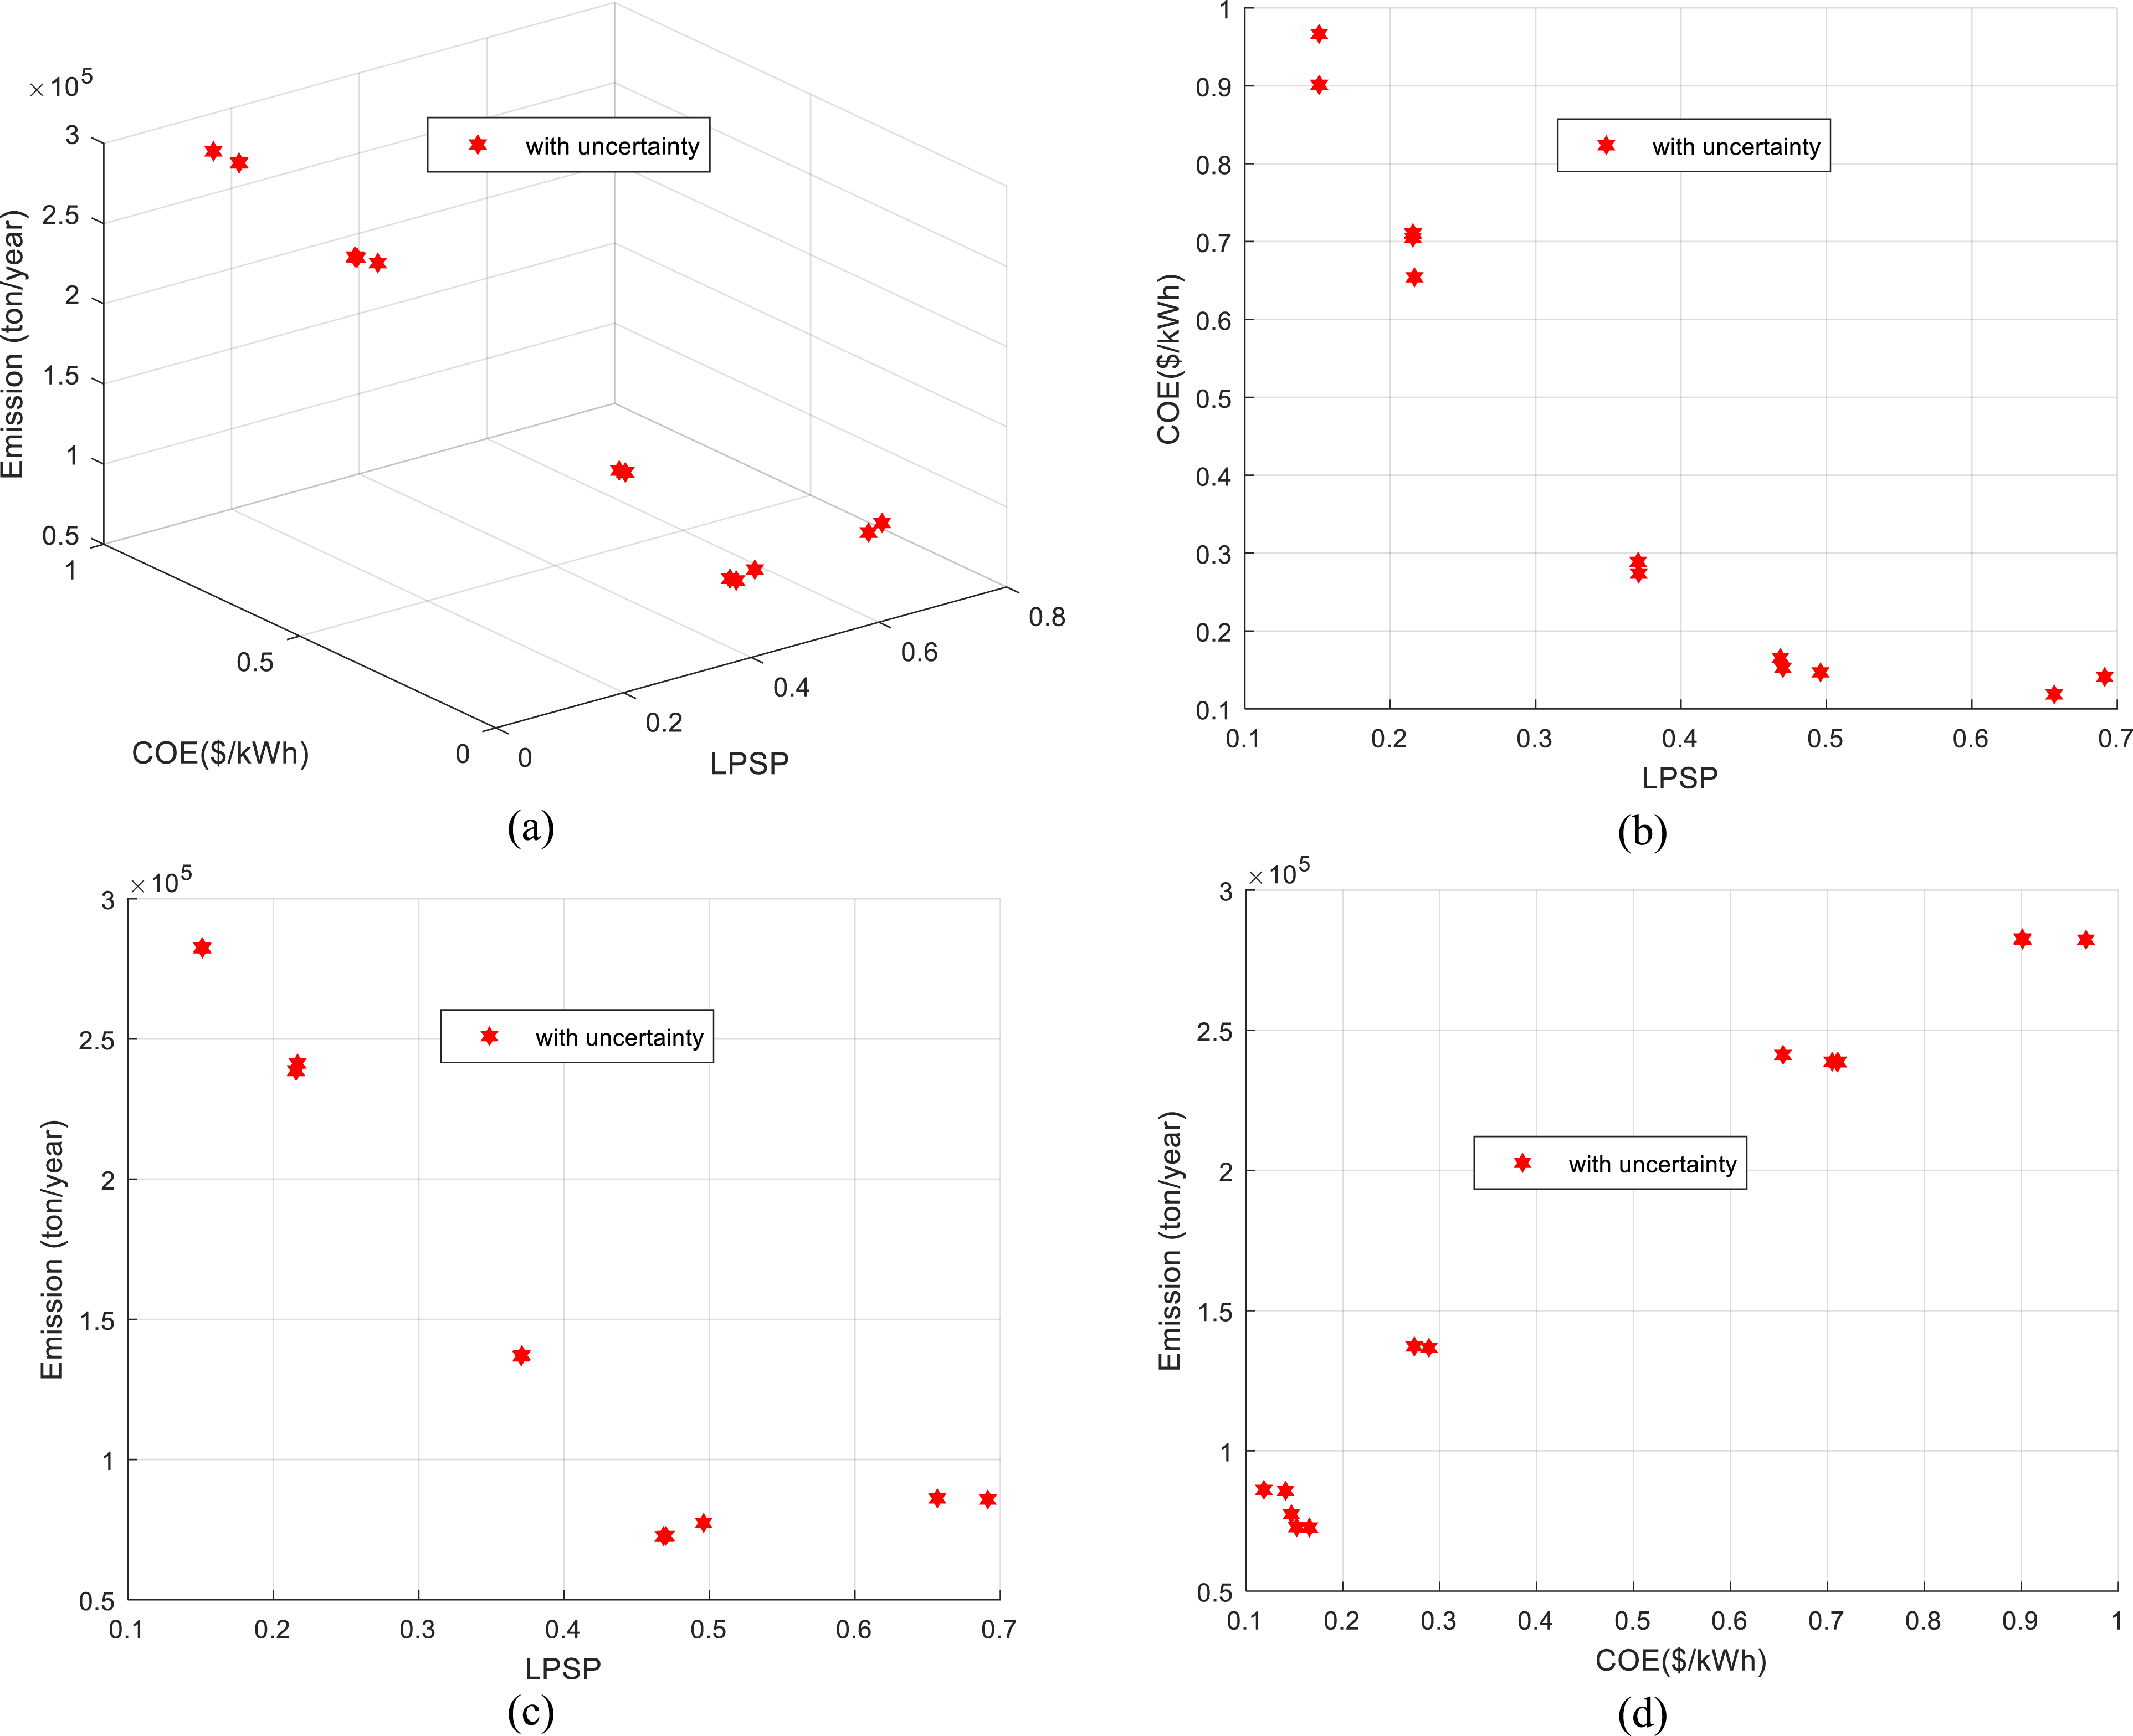
To illustrate the impact of accounting for the stochastic nature of various parameters in the absence of demand-side management (DSM), a comparison is made between the results of the first and second cases.
A comparative assessment of the contributions of microgrid energy generation sources
Figure 16 illustrates the Pareto fronts of the standalone microgrid system with respect to LPSP, COE, and emission functions under both deterministic and stochastic approaches. The results show that the deterministic PV power model outperforms the stochastic model across all objective functions, achieving lower values of LPSP, COE, and emissions. Furthermore, the Pareto front of Case #1 spans a broader range of decision-maker preferences compared to Case #2, offering greater flexibility in trade-off selection. The findings indicate that Case #1 not only provides higher reliability in meeting the system load (lowest LPSP) but also achieves reduced COE and NPC values, confirming its superiority over the other case. Comparative Pareto frontiers and their 2-D projections for deterministic and stochastic approaches.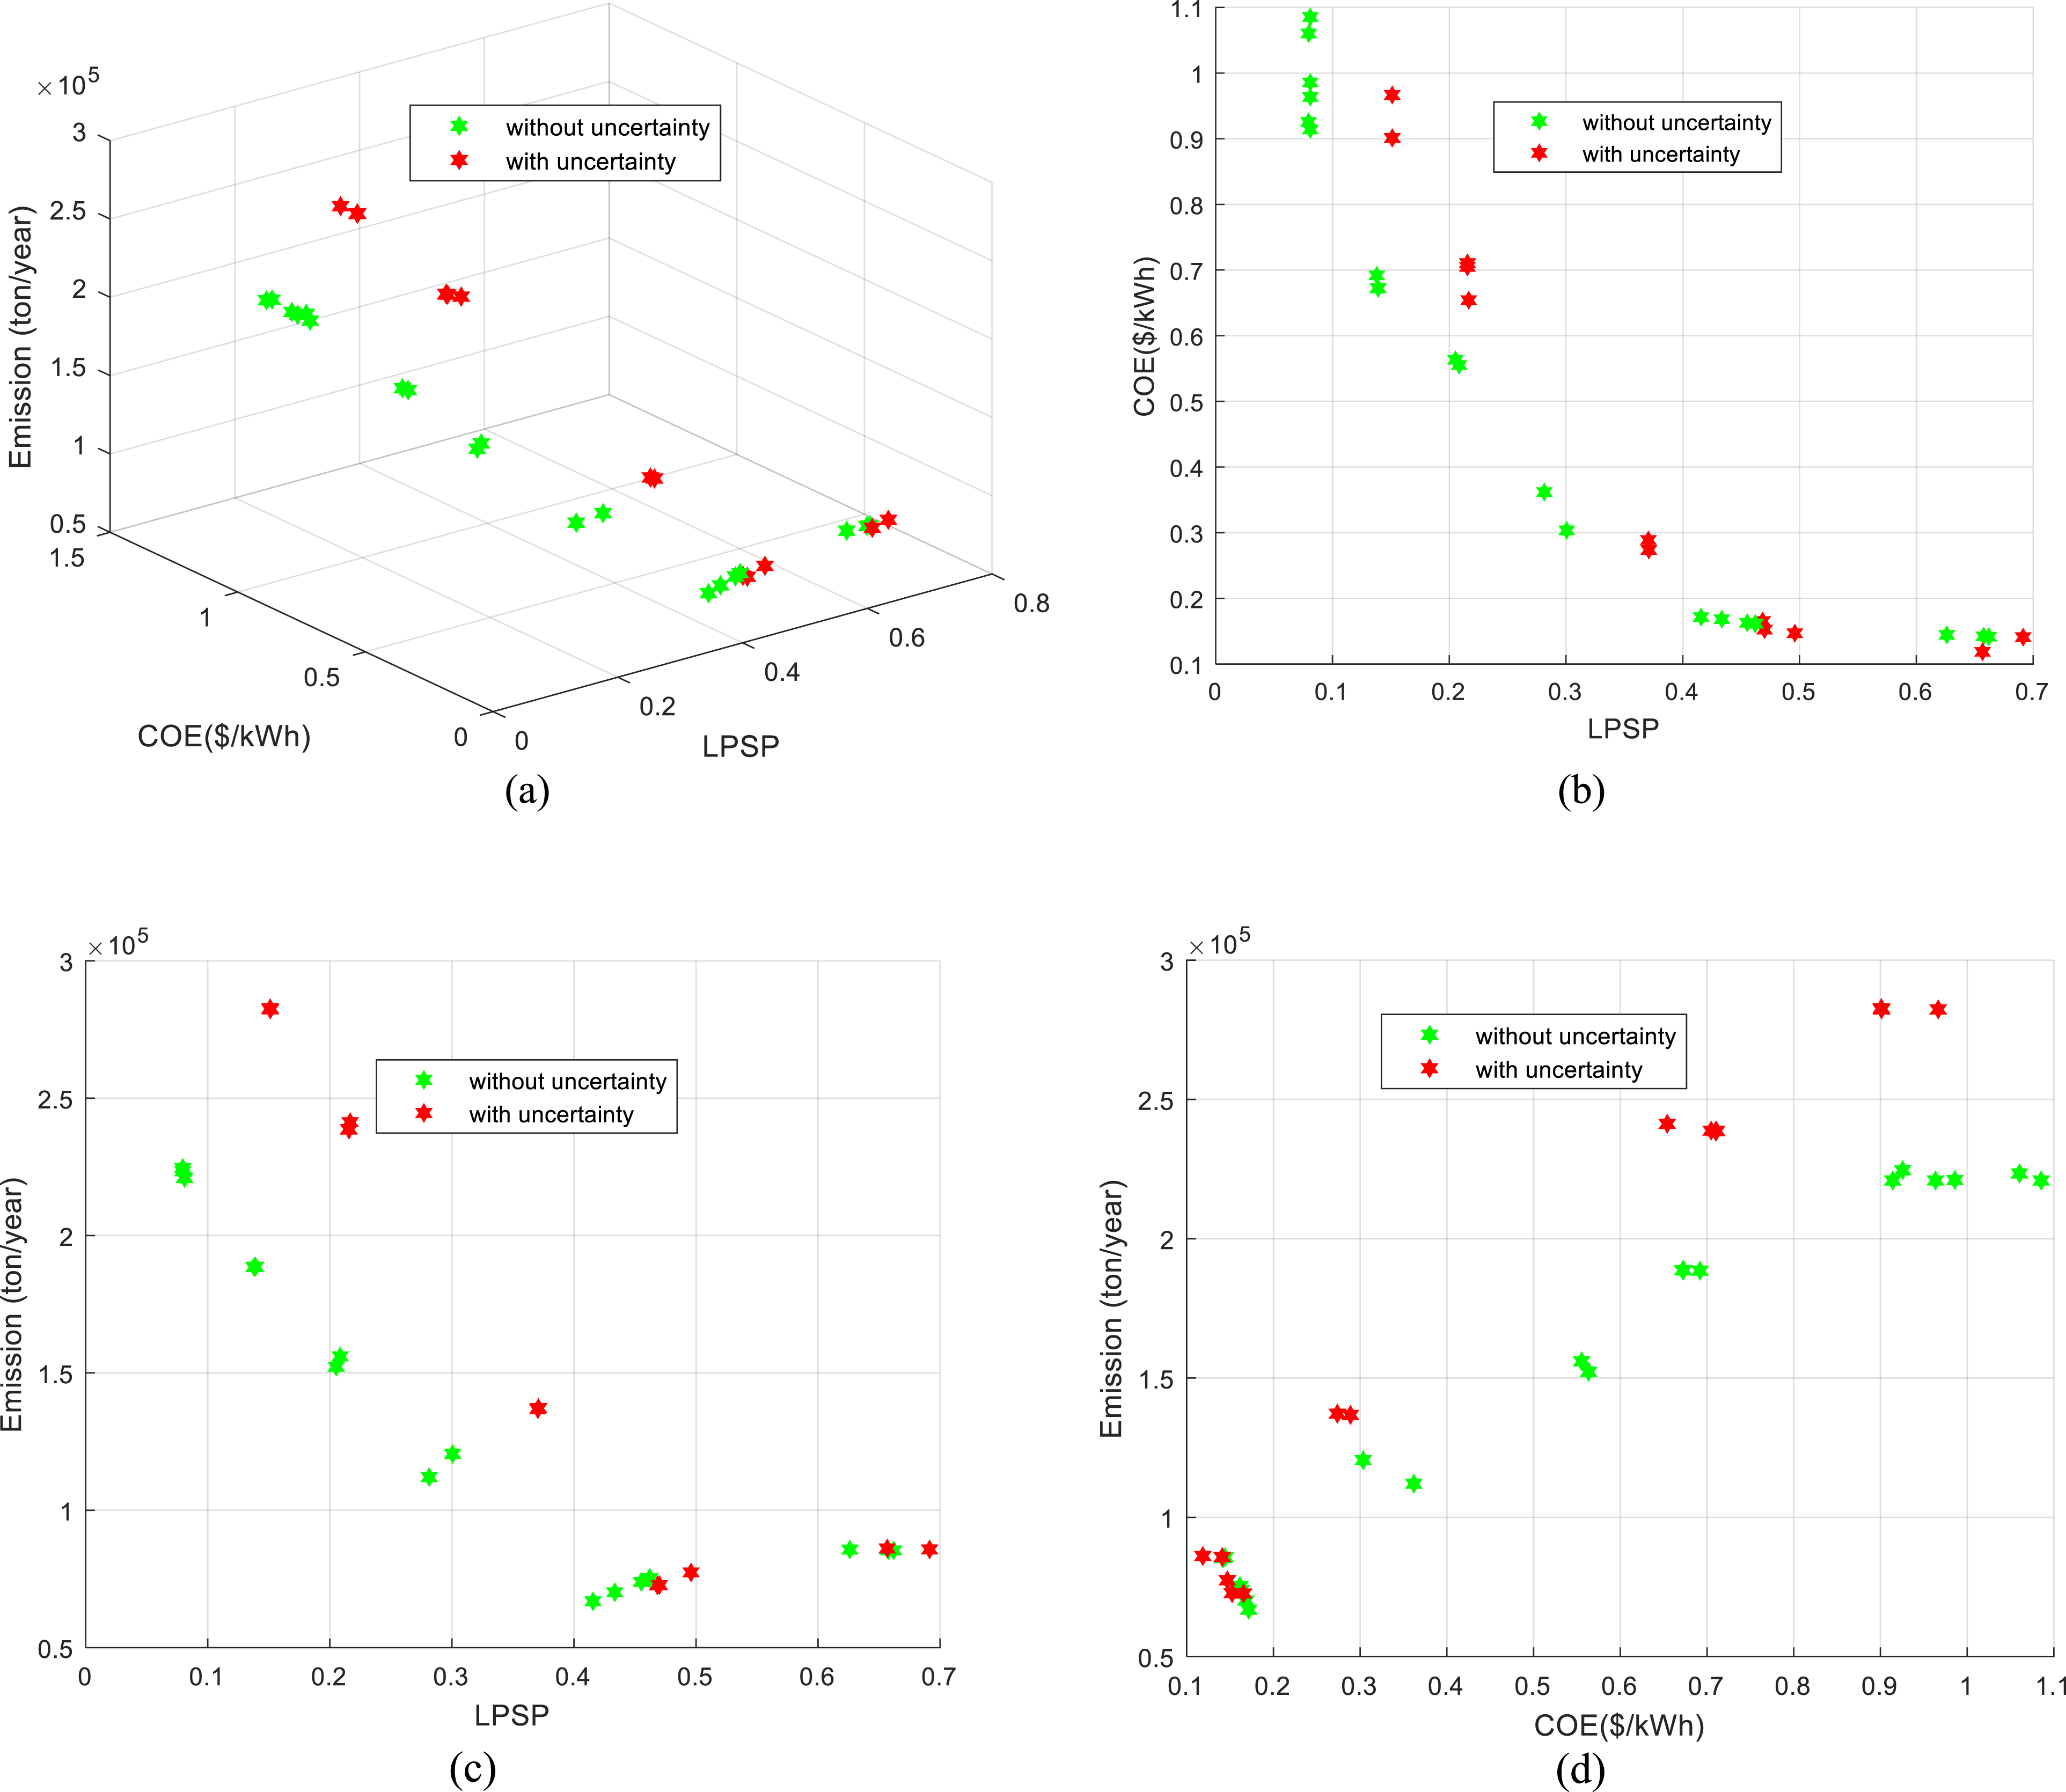
Utilizing suggested design configurations with and without PV uncertainty to compare the energy contributions from microgrid components. ➢ ⁃ The PV sizes range from 13.993 kW to 45 kW for different cases. ⁃ According to the suggested algorithm, the range [1-16.203] produces the narrowest range of AD values. ⁃ There were one to five units of DG. ➢ ⁃ PV power generation makes up a larger portion, ranging from 17.425 to 45 kW. ⁃ The most solar PV systems were produced using the stochastic model. ⁃ The suggested approach produces the narrowest range of AD values in the range [1-1.0856]. ⁃ The range of DG units was 1 to 5. ➢
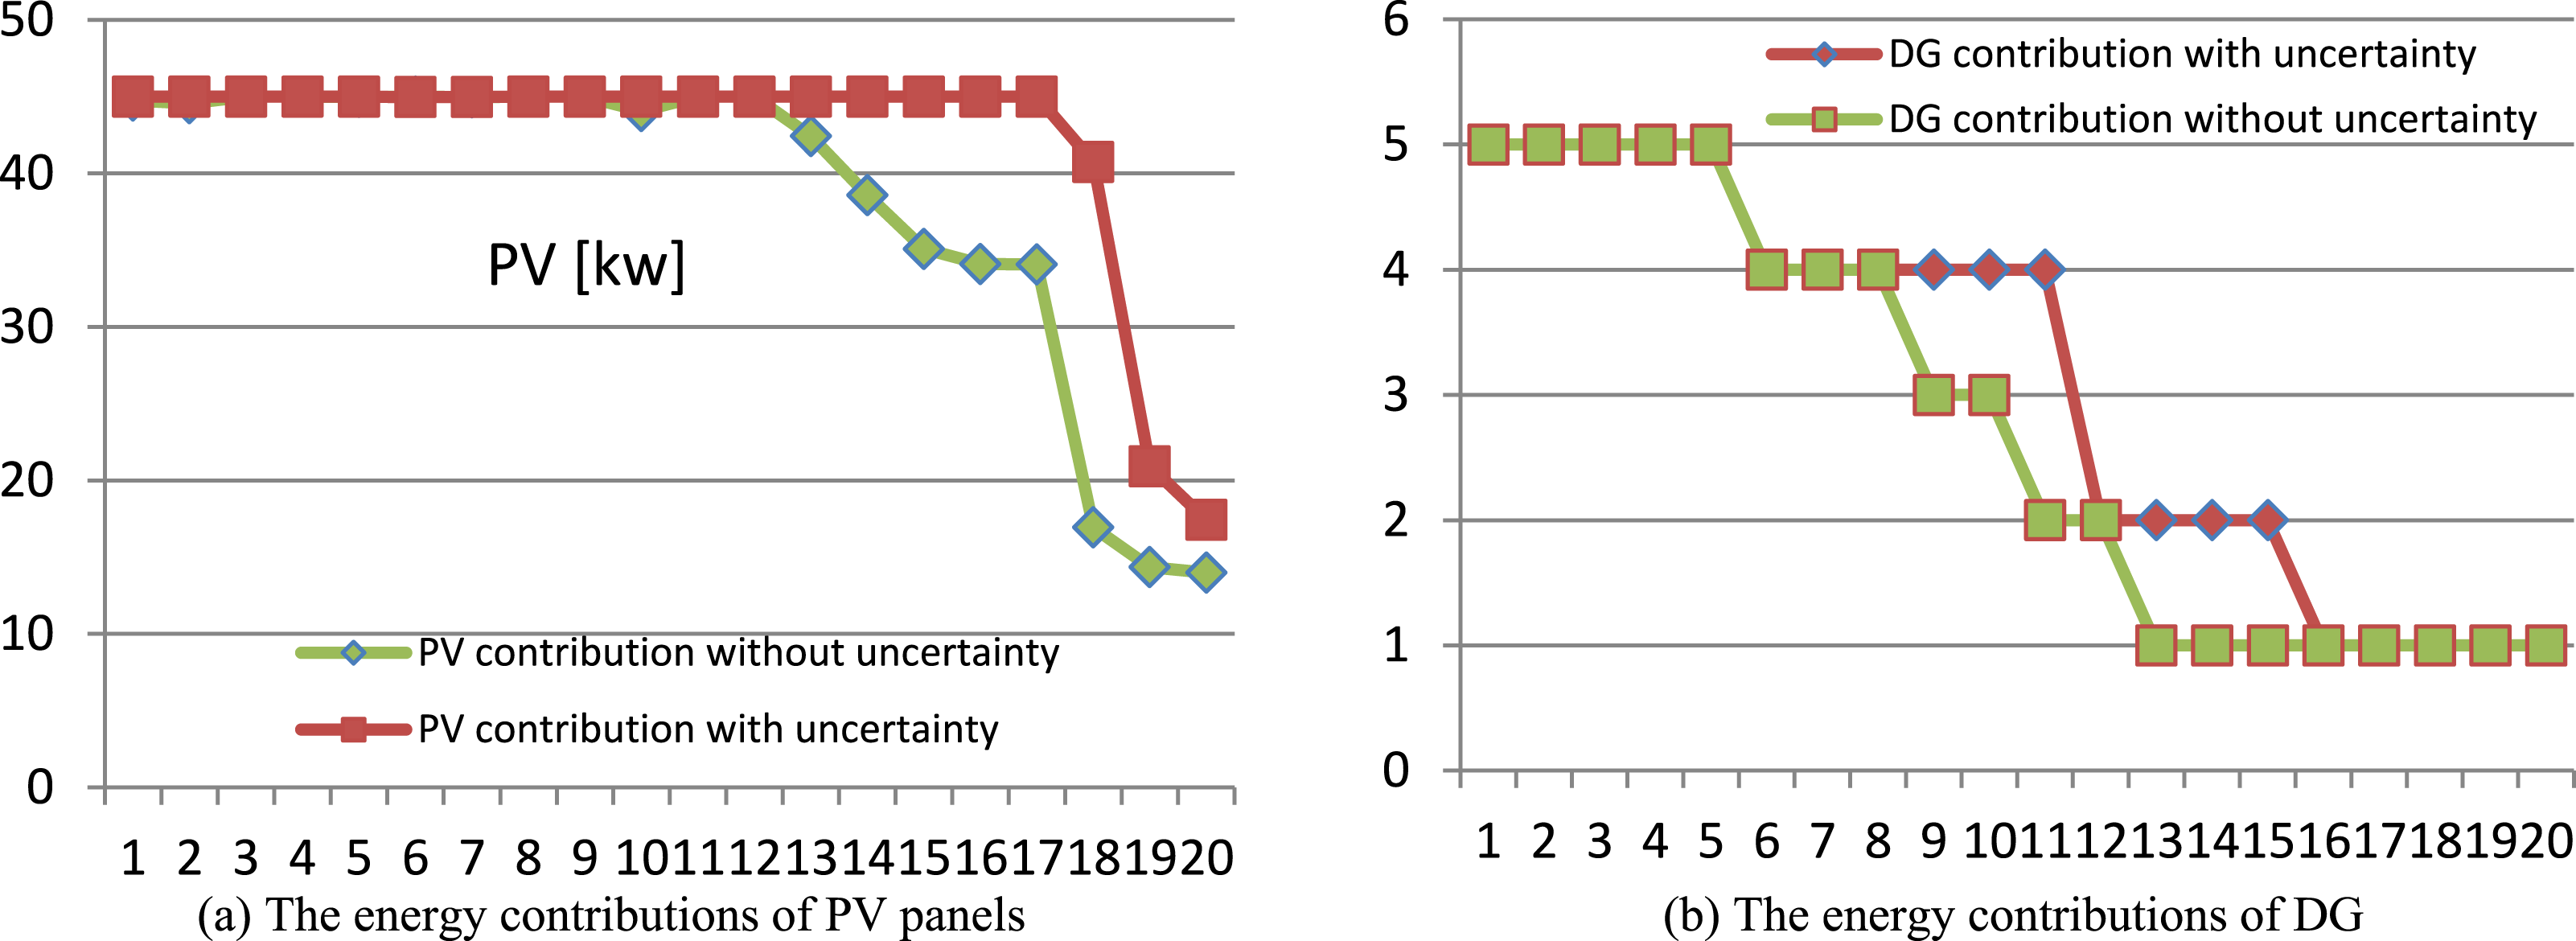
The energy contributions of various sources, such as PV panels, as well as diesel generators, with deterministic (lacking uncertainty) and stochastic (with uncertainty) scaling are contrasted in Figure 17(a) and (b). The results demonstrated that ⁃ The production and consumption power in a case related to the deterministic model is therefore different from its predicted value under uncertain conditions, as well as the production uncertainties could be considered when sizing the energy system. ⁃ The influence of uncertainty causes PV contributions to rise, particularly at the high portion (the PV size increases from 34.062 kW of case #1 to 45 kW of case #2). ⁃ Because of the effect of uncertainty, the power generated from DG is altered and increased in the medium portion (the number of DG is increased from 2 of the case #1 to 4 units of case #2). The energy contributions of various sources, such as PV panels, and diesel generators.
Comparative analysis of the LPSP, RF, and COE
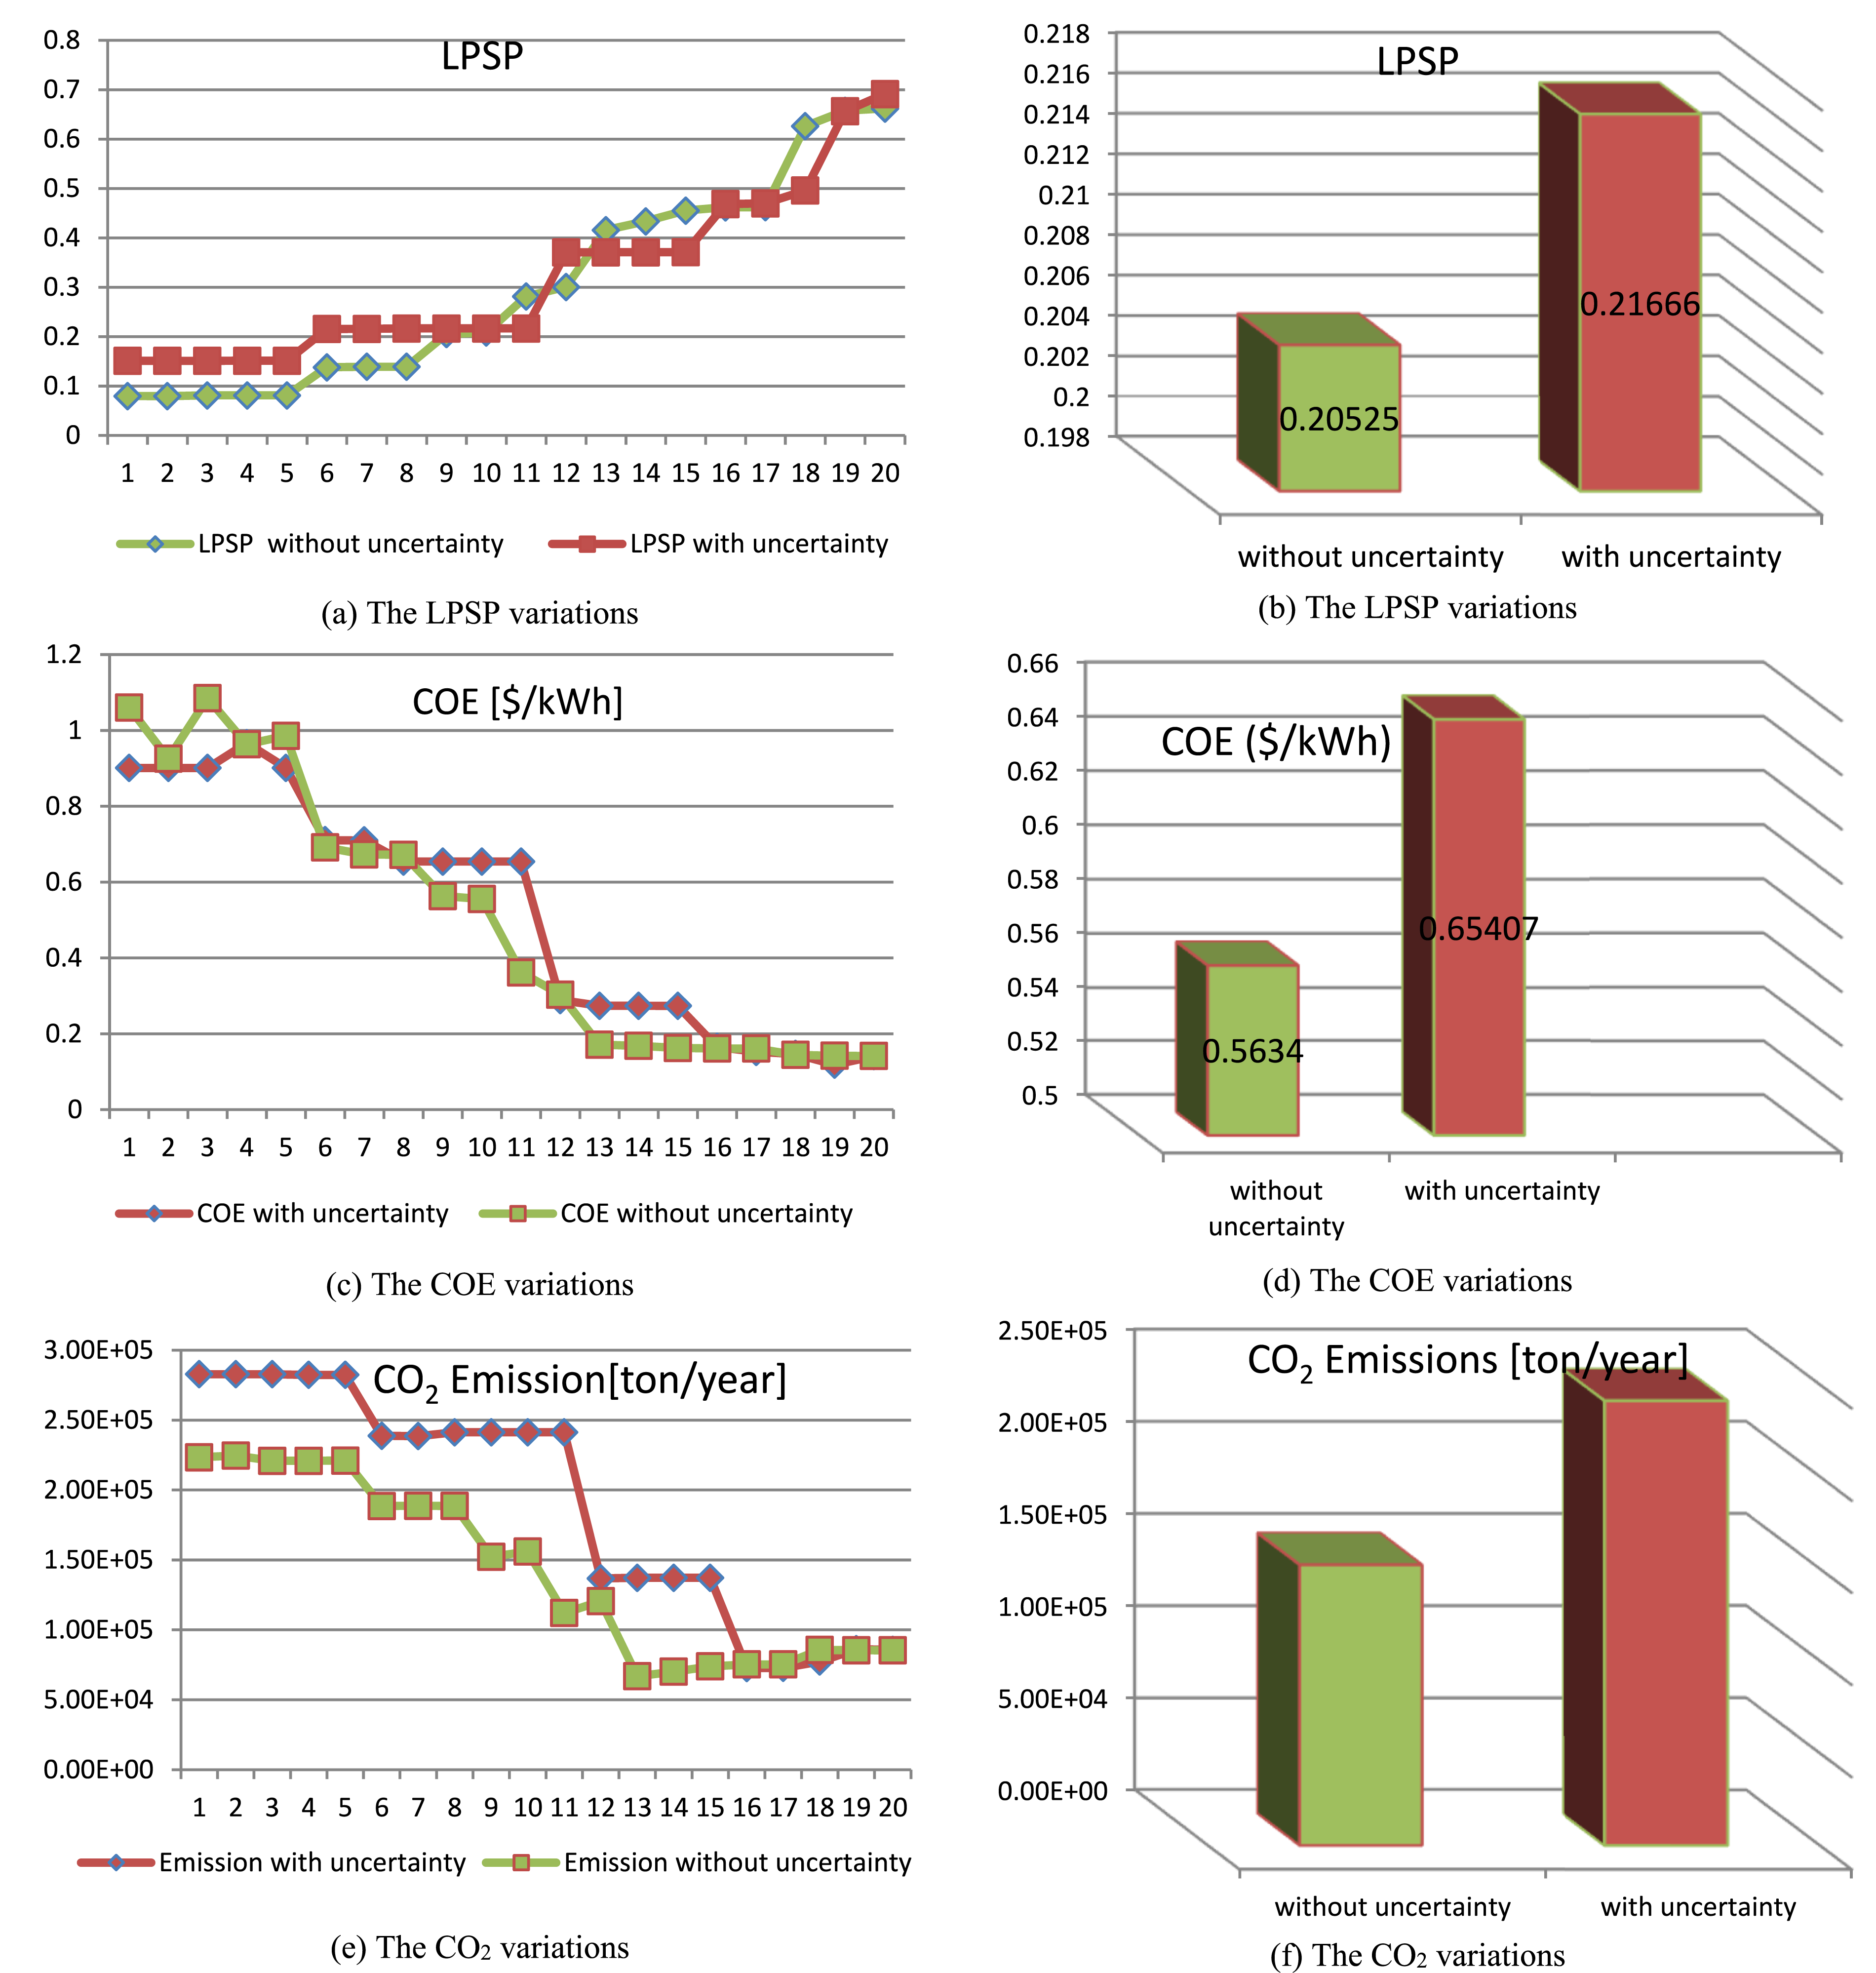
A comparison of the microgrid’s LPSP, CO2, and COE with and without uncertainty was conducted utilizing several design combinations, including PV/DG/BESU. The results show that Case 1 has the lowest COE and LPSP values plus the lowest CO2 value. Cases 1–2 yield COE values of $/kWh 0.5634 and $/kWh 0.65407, respectively, while Cases 1–2 yield CO2 values of 1.52270e+05 and 2.4125e+05 ton/year, respectively. Additionally, the fact that the LPSP is attained at 20.525% and 21.666%, respectively, suggests that case 1 is less likely than the other scenario to fall short of the demand requirement. These fluctuations are caused by the unpredictable nature of both solar energy supply and load demand. Production uncertainties should be considered while sizing the energy system since, in a scenario related to the deterministic model, the production and consumption power diverge from their expected value under uncertain situations.
Figure 18(a)–(f) display the numerical fluctuations of the LPSP, COE, and CO2 indices in deterministic and stochastic sizing models for various instances. As can be observed, ⁃ Particularly at the low portion, the PV/DG/BESU configuration with probabilistic planning of the renewable power generating resource has a high LPSP and is less dependable and effective. ⁃ When taking into account the integrated model with generation uncertainties, the LPSP, COE, and CO2 indicators have all increased. ⁃ As can be seen, when the integrated model with generation uncertainty has been taken into consideration, the LPSP indicators have increased (although slightly) by 5.55%. ⁃ The COE estimate using the deterministic approach was $0.5634/kWh, but it was determined to be slightly higher at $0.65407/kWh (the COE value increased by 16%) once uncertainties were introduced in a stochastic approach. ⁃ Its effectiveness is demonstrated by reaching the lowest CO2 emission value of 1.5227e+05 ton/year. However, case 2 exhibits a significant deficiency in environmental performance, as it attains the highest emission level at 2.4125e+05 ton/year. The LPSP, COE, and CO2 variations for deterministic and stochastic approaches.
Scenario 2: WT/BES/DG configuration
The WT/BES/DG arrangement uses a DG, BES, and WT as the renewable energy source. In contrast to the solar PV-based setup, this combination offers a different balance of energy inputs with one renewable source (WT) and two non-renewable sources (BES and DG).
Case 3: Deterministic model of the WT power sources
Battery “storage energies” are added with various DER types based on renewable energy resources, like WT energy sources, and non-renewable energy resources, like DG energy sources, taking into account the deterministic behavior of the renewable power generation resource. This is done to verify that the proposed algorithm is effective and capable of producing the best possible design with high dependability and low investment costs. Figure 19 displays the Pareto front of the standalone micro-grid system, which was generated by the proposed algorithm based on LPSP, COE, and CO2 functions. Table 8 lists the 20 best solutions from the PF that was received. Pareto front of the standalone microgrid system generated by the proposed algorithm under deterministic conditions considering the LPSP, COE, and CO₂ objective functions. 20 carefully chosen solutions for case 3.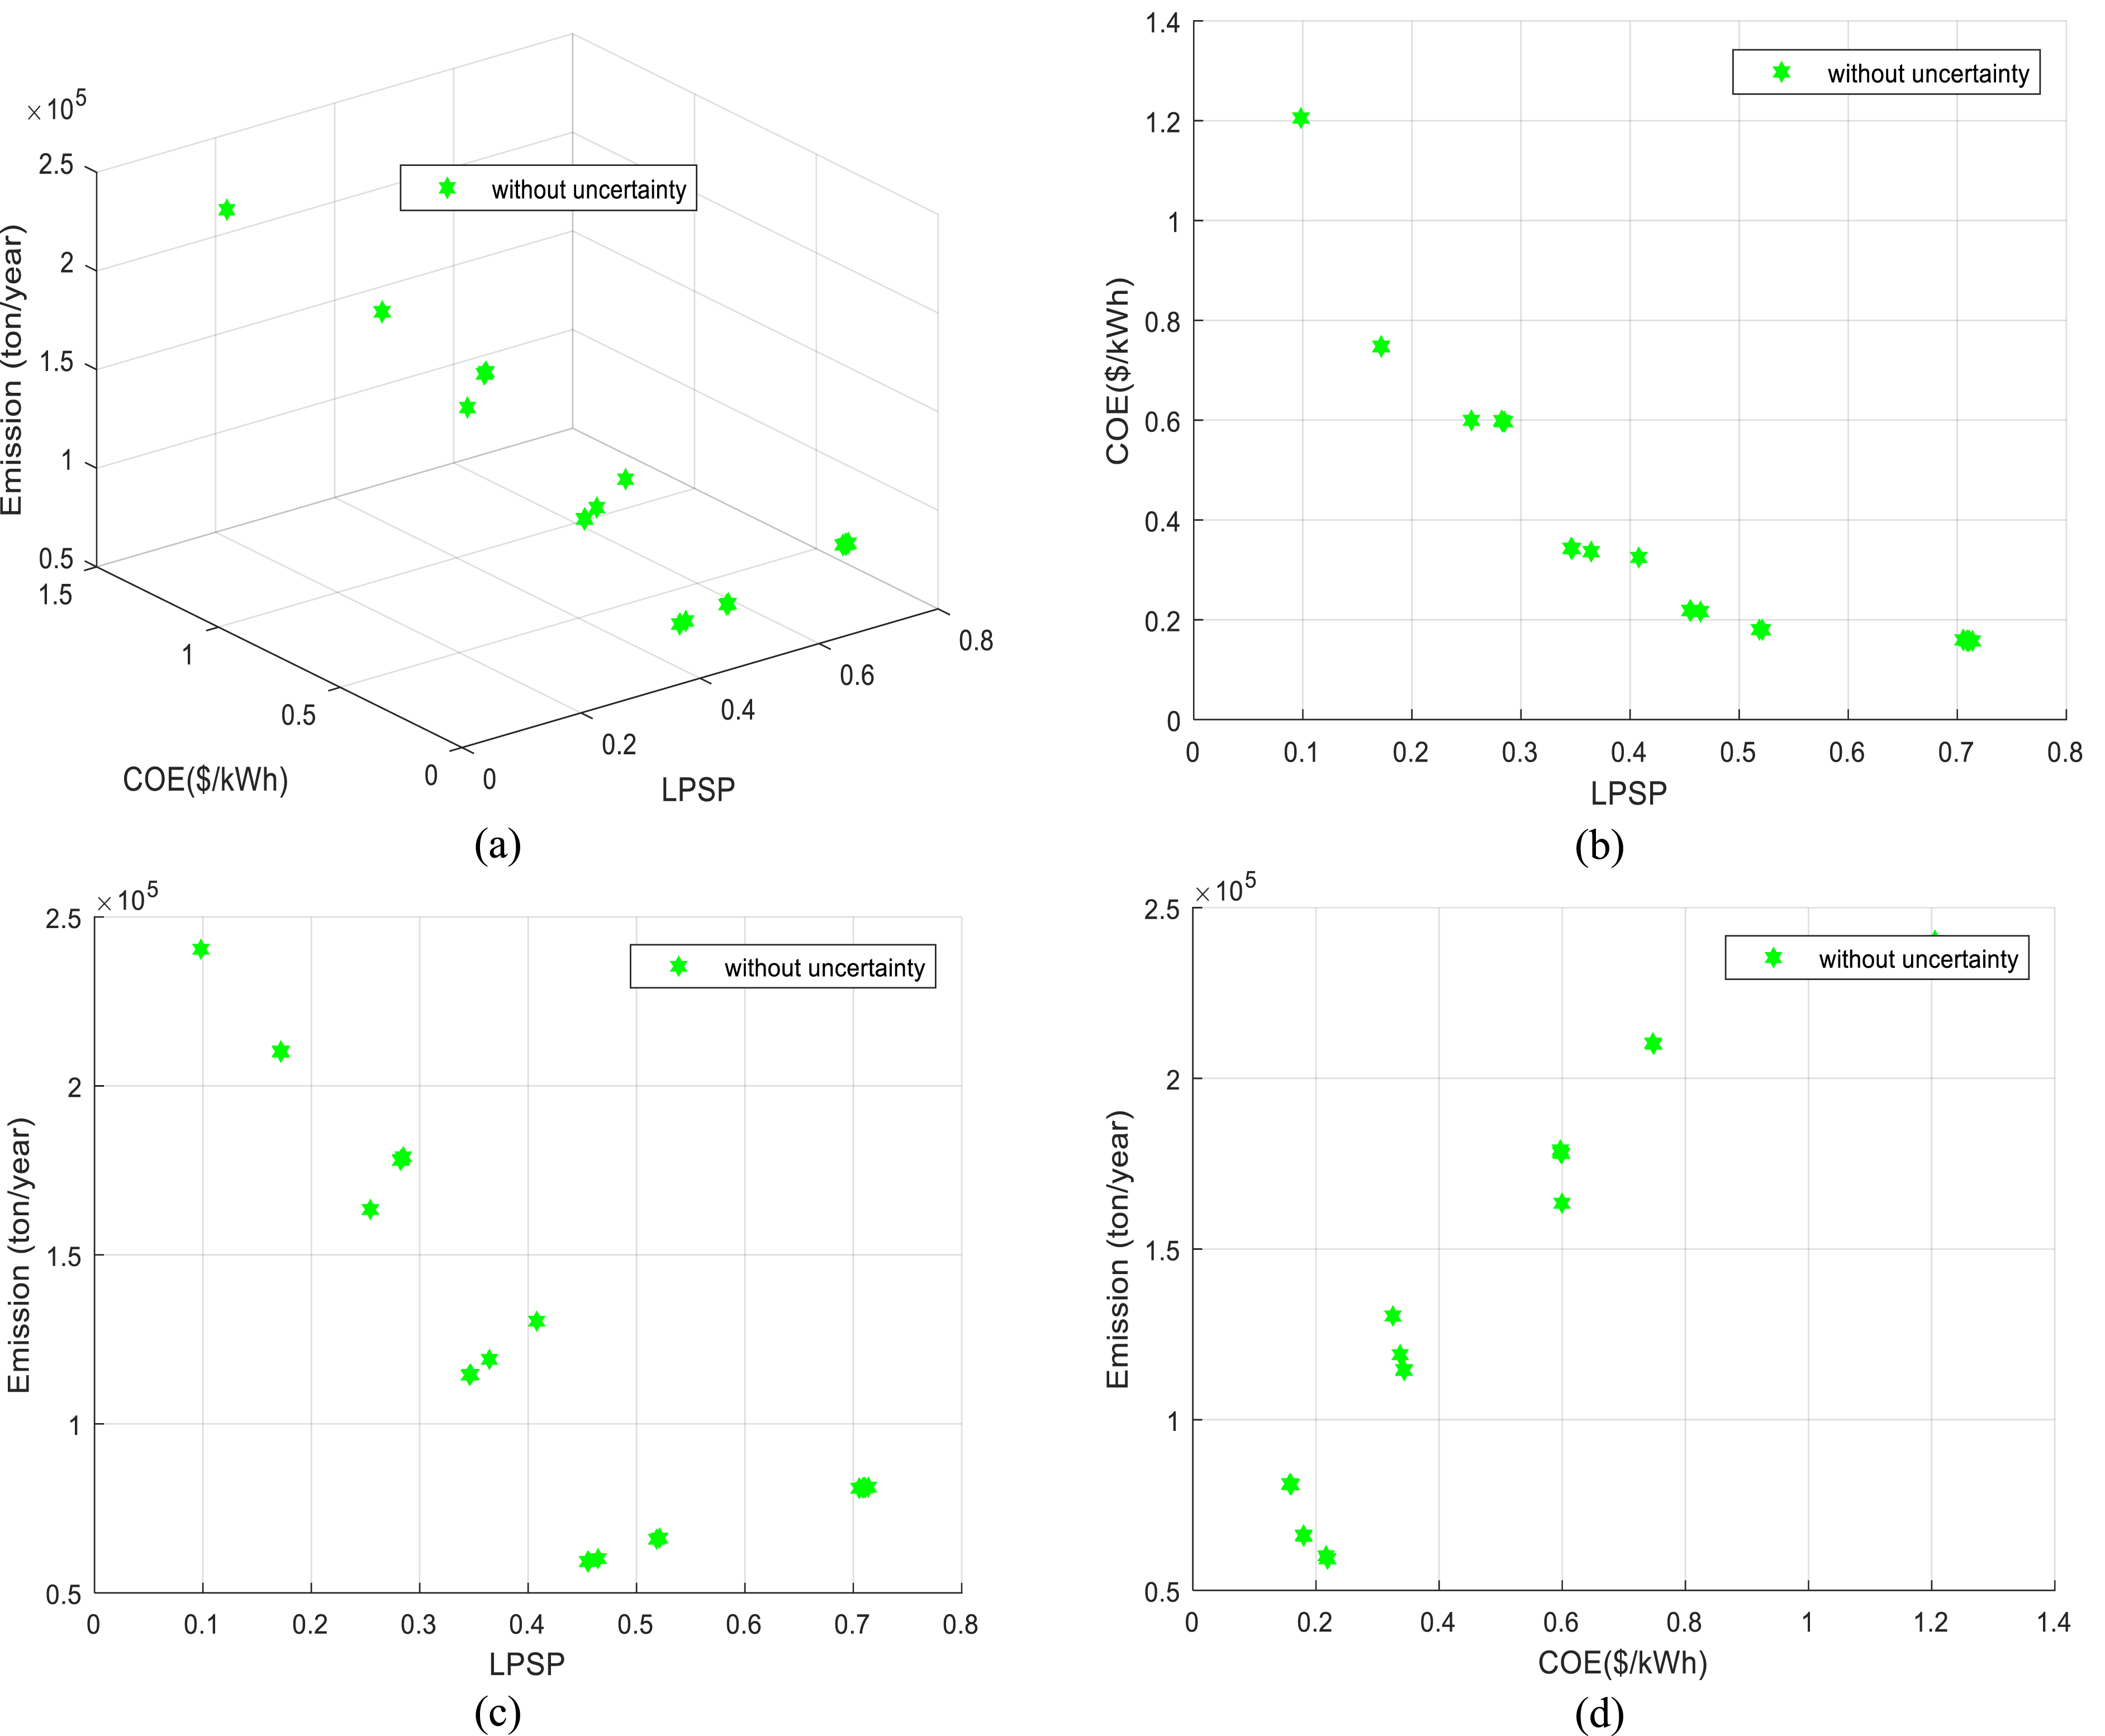
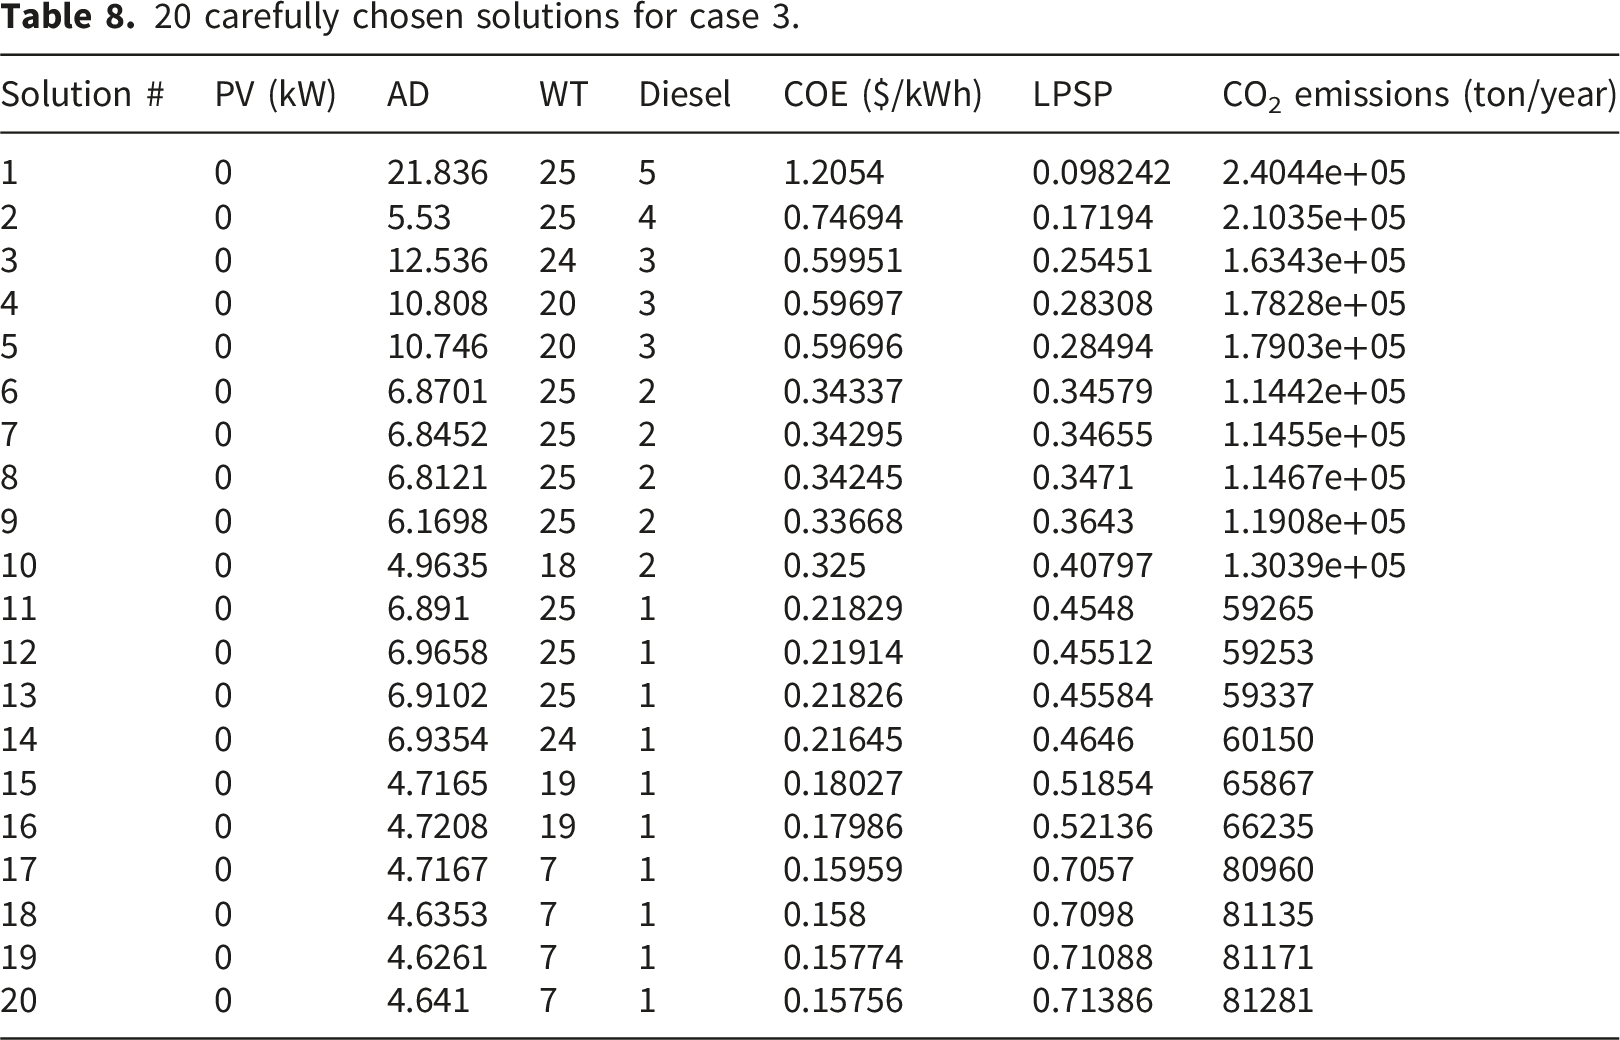
According to the analysis, the WT/BES/DG configuration yields the best case study outcomes when optimized with the suggested approach. Solution #4 attains a COE of 0.59697 $/kWh and a CO2 of 1.7828e+05 ton/year in this setup. The system effectively satisfies all specified requirements, including preserving an LPSP of 28.308%, a sign of a very reliable energy supply. Furthermore, the 10.808-day autonomy of the BES units in this configuration guarantees a dependable backup power source. This solution indicates that a microgrid with three DGs and 20 WT is the ideal configuration.
Case 4: Stochastic model of the WT power sources
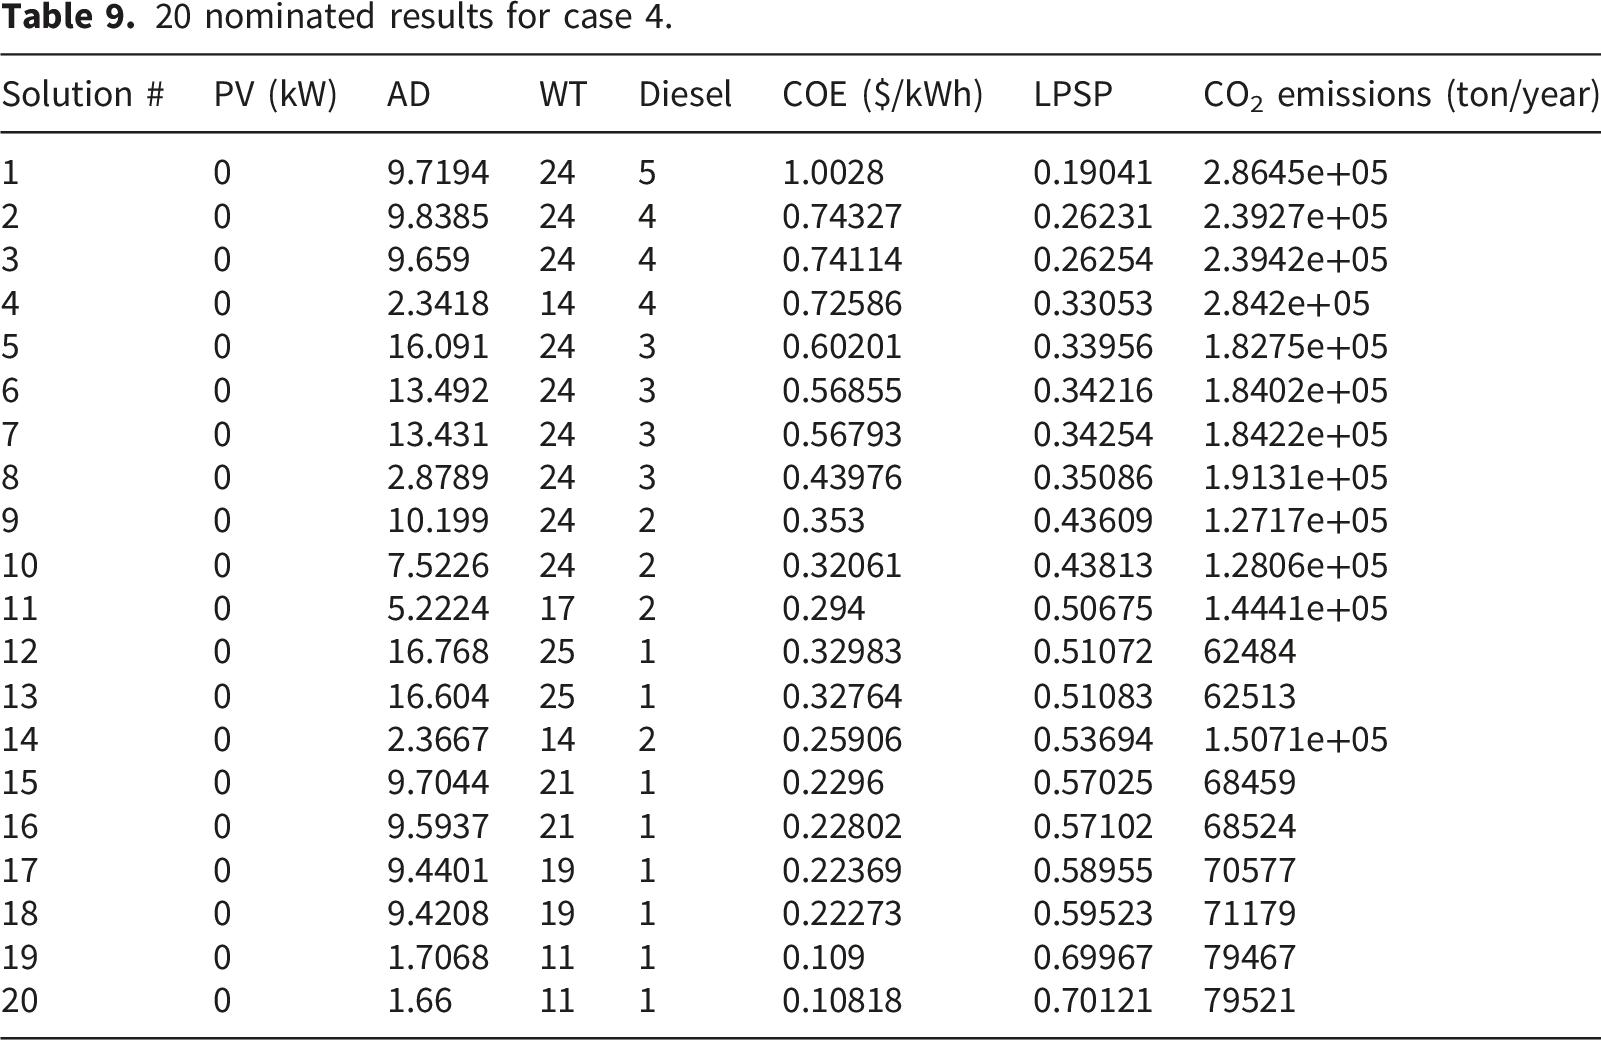
20 nominated results for case 4.
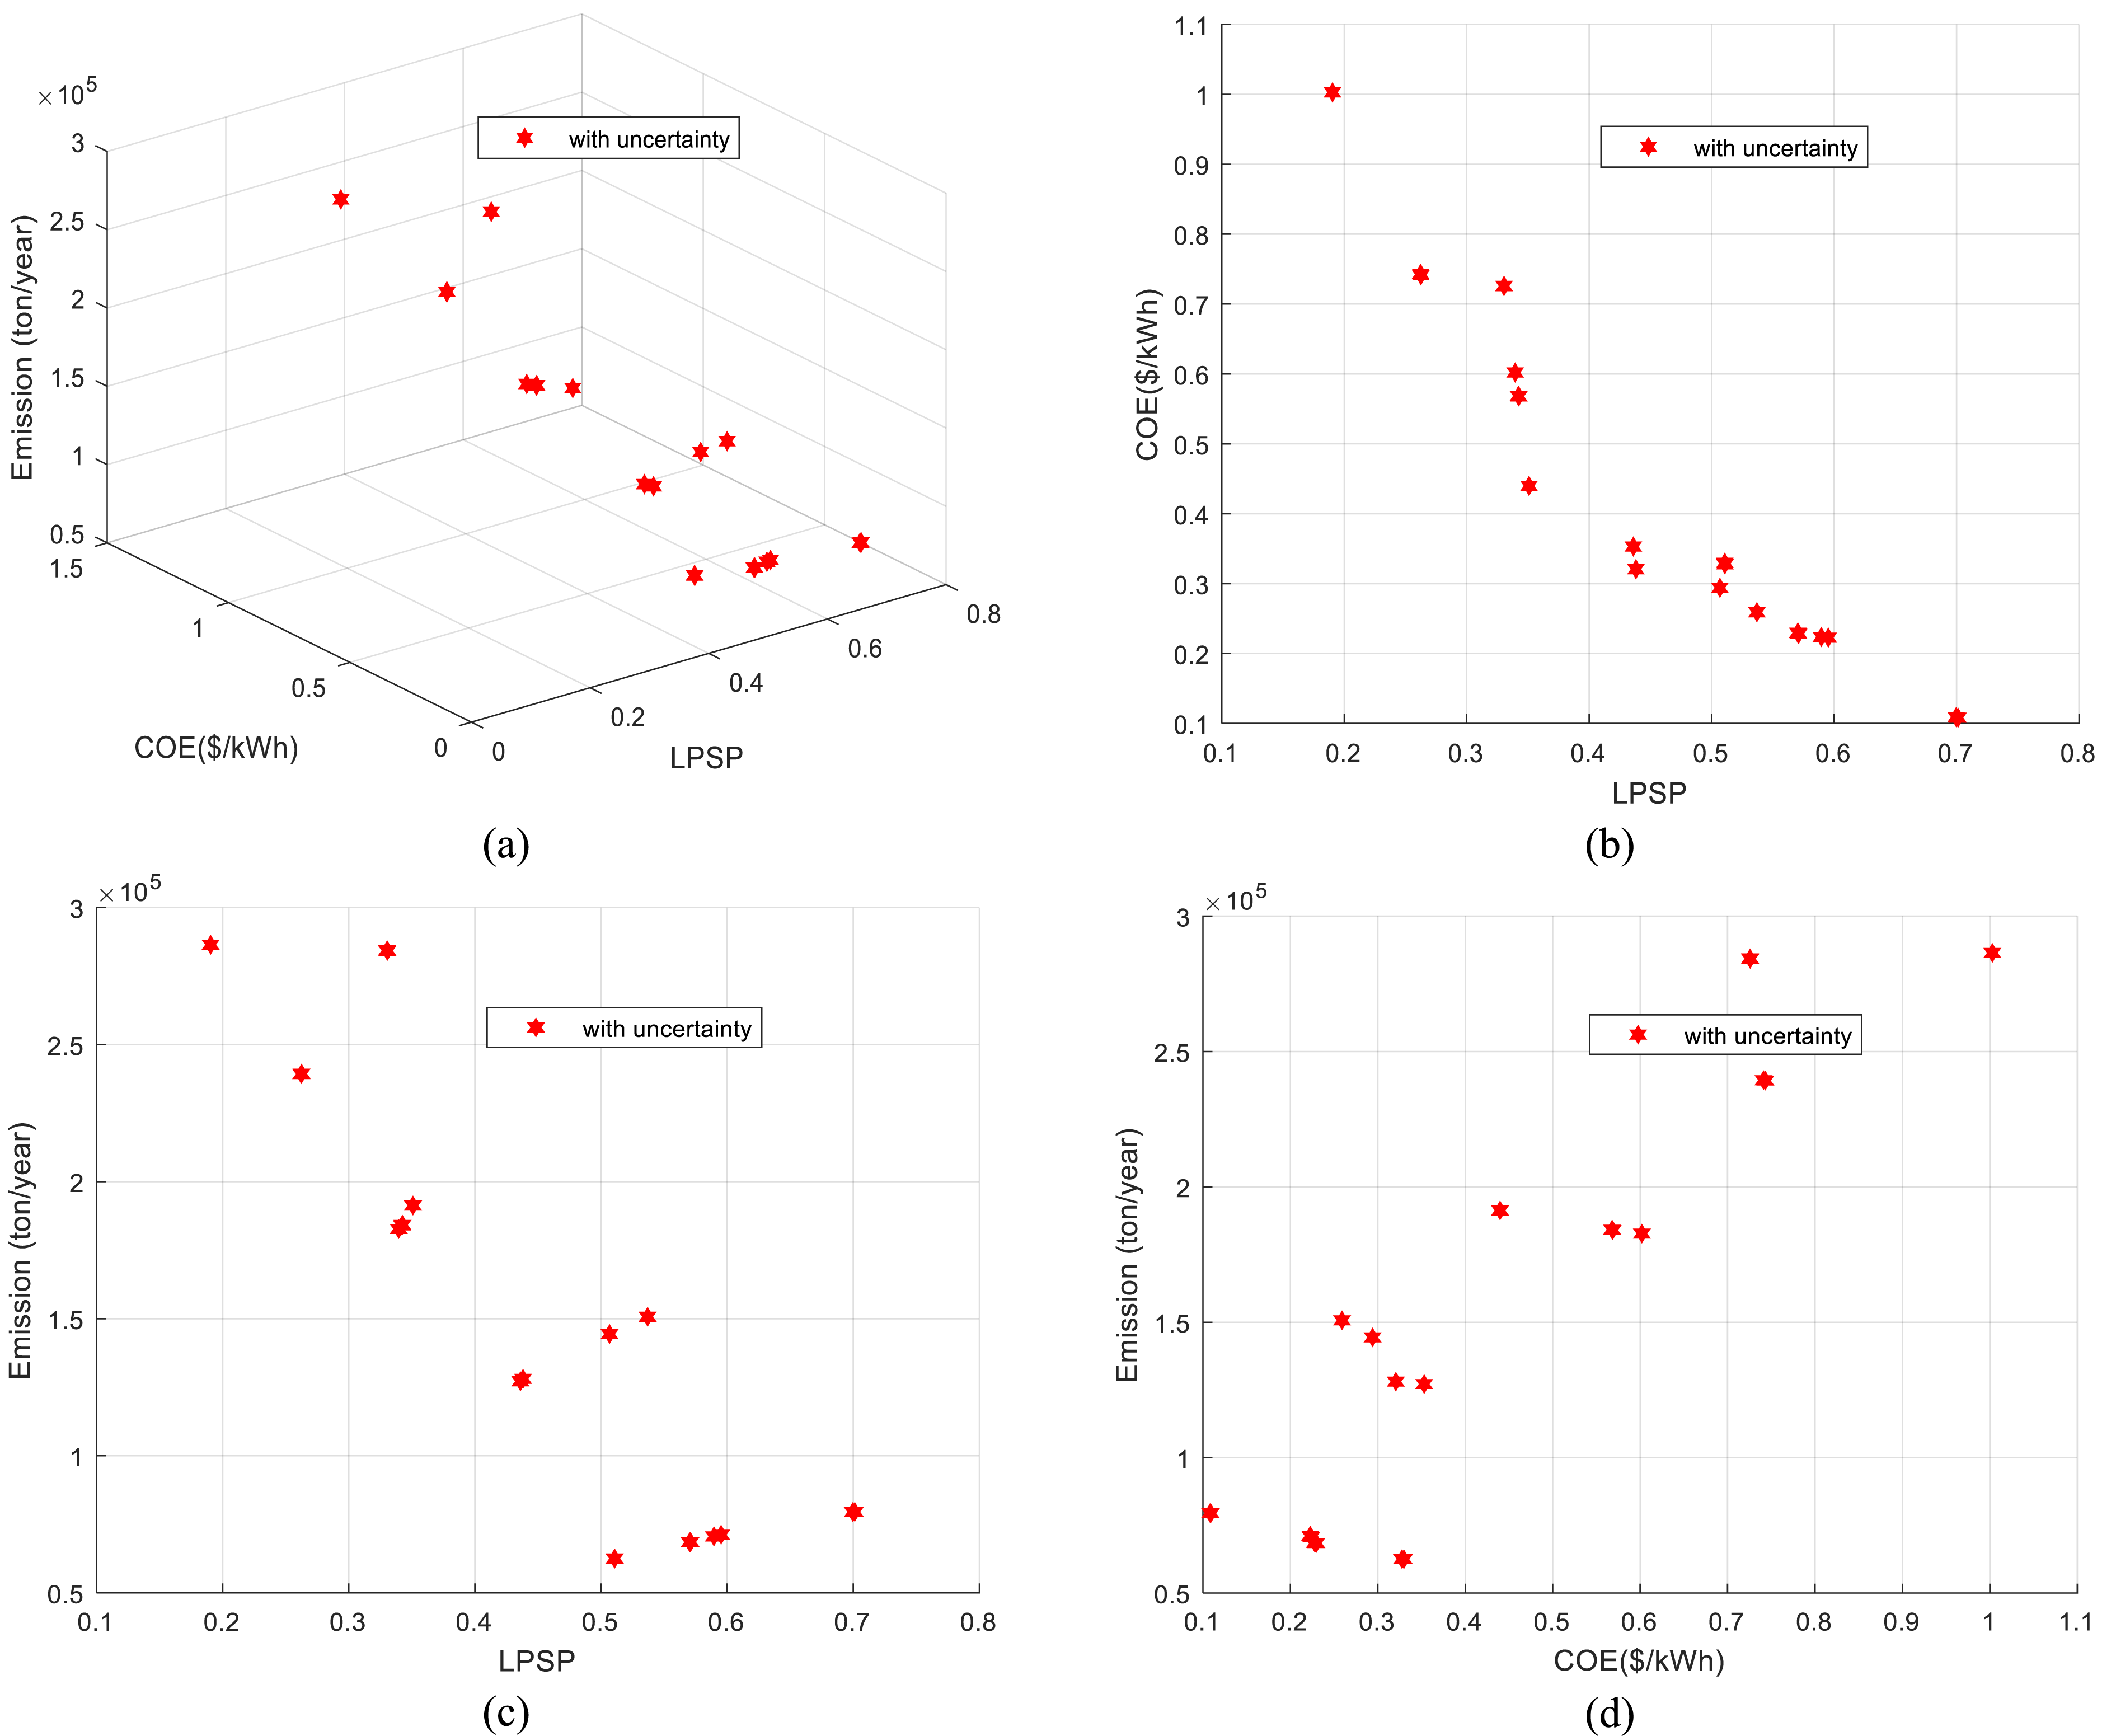
Pareto front of the proposed microgrid planning model under stochastic renewable generation using the PEM optimization method, considering LPSP, COE, and CO₂ emission objectives.
If the designer chooses solution #1, there will be 24 WT, 9.7194 autonomy days, and five DG needed. With this approach, the COE is 1.0028 $/kWh, the LPSP is 19.041%, and the CO2 is 2.8645e+05ton/year. In comparison to the other solutions that are available, it can be observed that the COE and CO2 have larger values while the LPSP has a lower value.
Solution #4 offers the best and most efficient alternative; it requires three diesel generators, 14 wind turbines, and 2.3418 days of autonomy. The LPSP is 33.053%, and the COE and CO2 emissions are 0.72586 $/kWh and 2.842e+05 ton/year, respectively.
Analysis of the relative contributions of energy sources in microgrid generation
Figure 21 displays the Pareto fronts of the standalone micro-grid system based on LPSP, COE, and emission functions for deterministic and stochastic approaches. It’s clear that the performance of the system with the deterministic model of WT power source is found to be better than another curve that of the stochastic model for reducing all objective functions. Compared to case # 4, a larger percentage of the decision maker’s preferences are covered by the Pareto front in case #3. There is a slight variation in the overall power consumption between the two cases, but there are discernible variations in the overall expenses and the dangerous gas emissions. Furthermore, because the second case’s results show the stochastic behavior of the uncertain parameters in the suggested methodology, they are thought to be more accurate. Comparative Pareto frontiers and their 2-D projections for deterministic and stochastic approaches.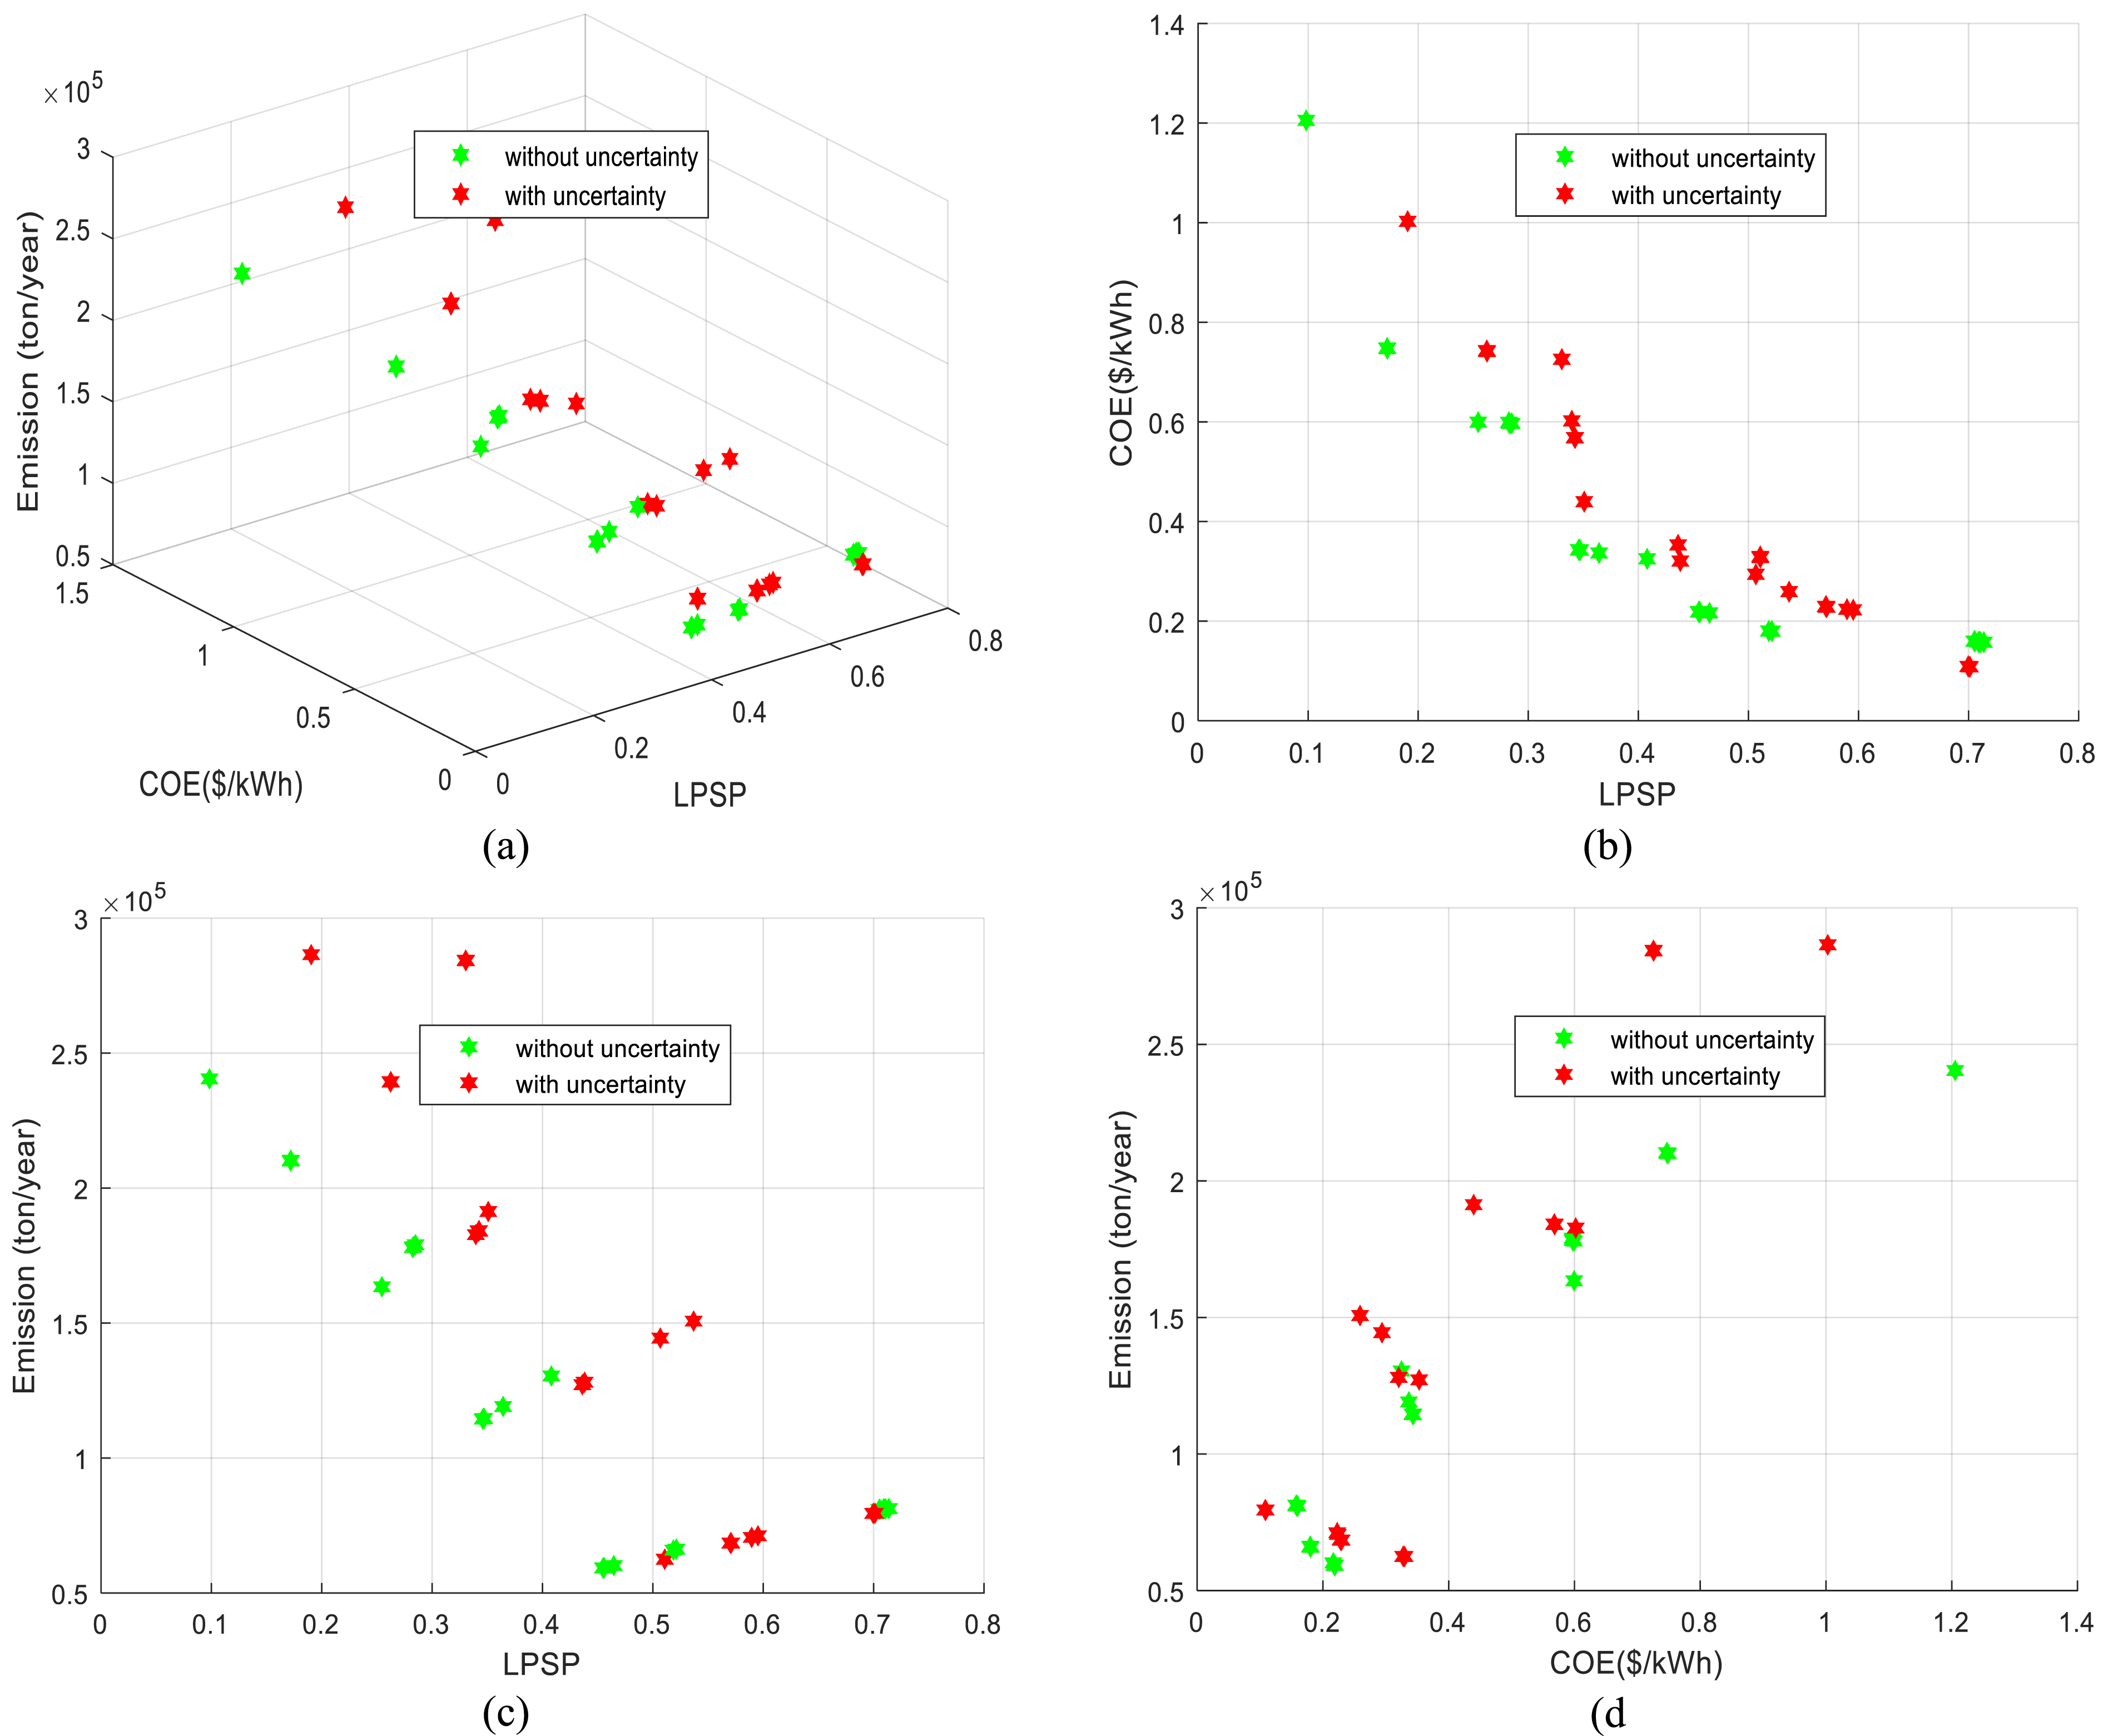
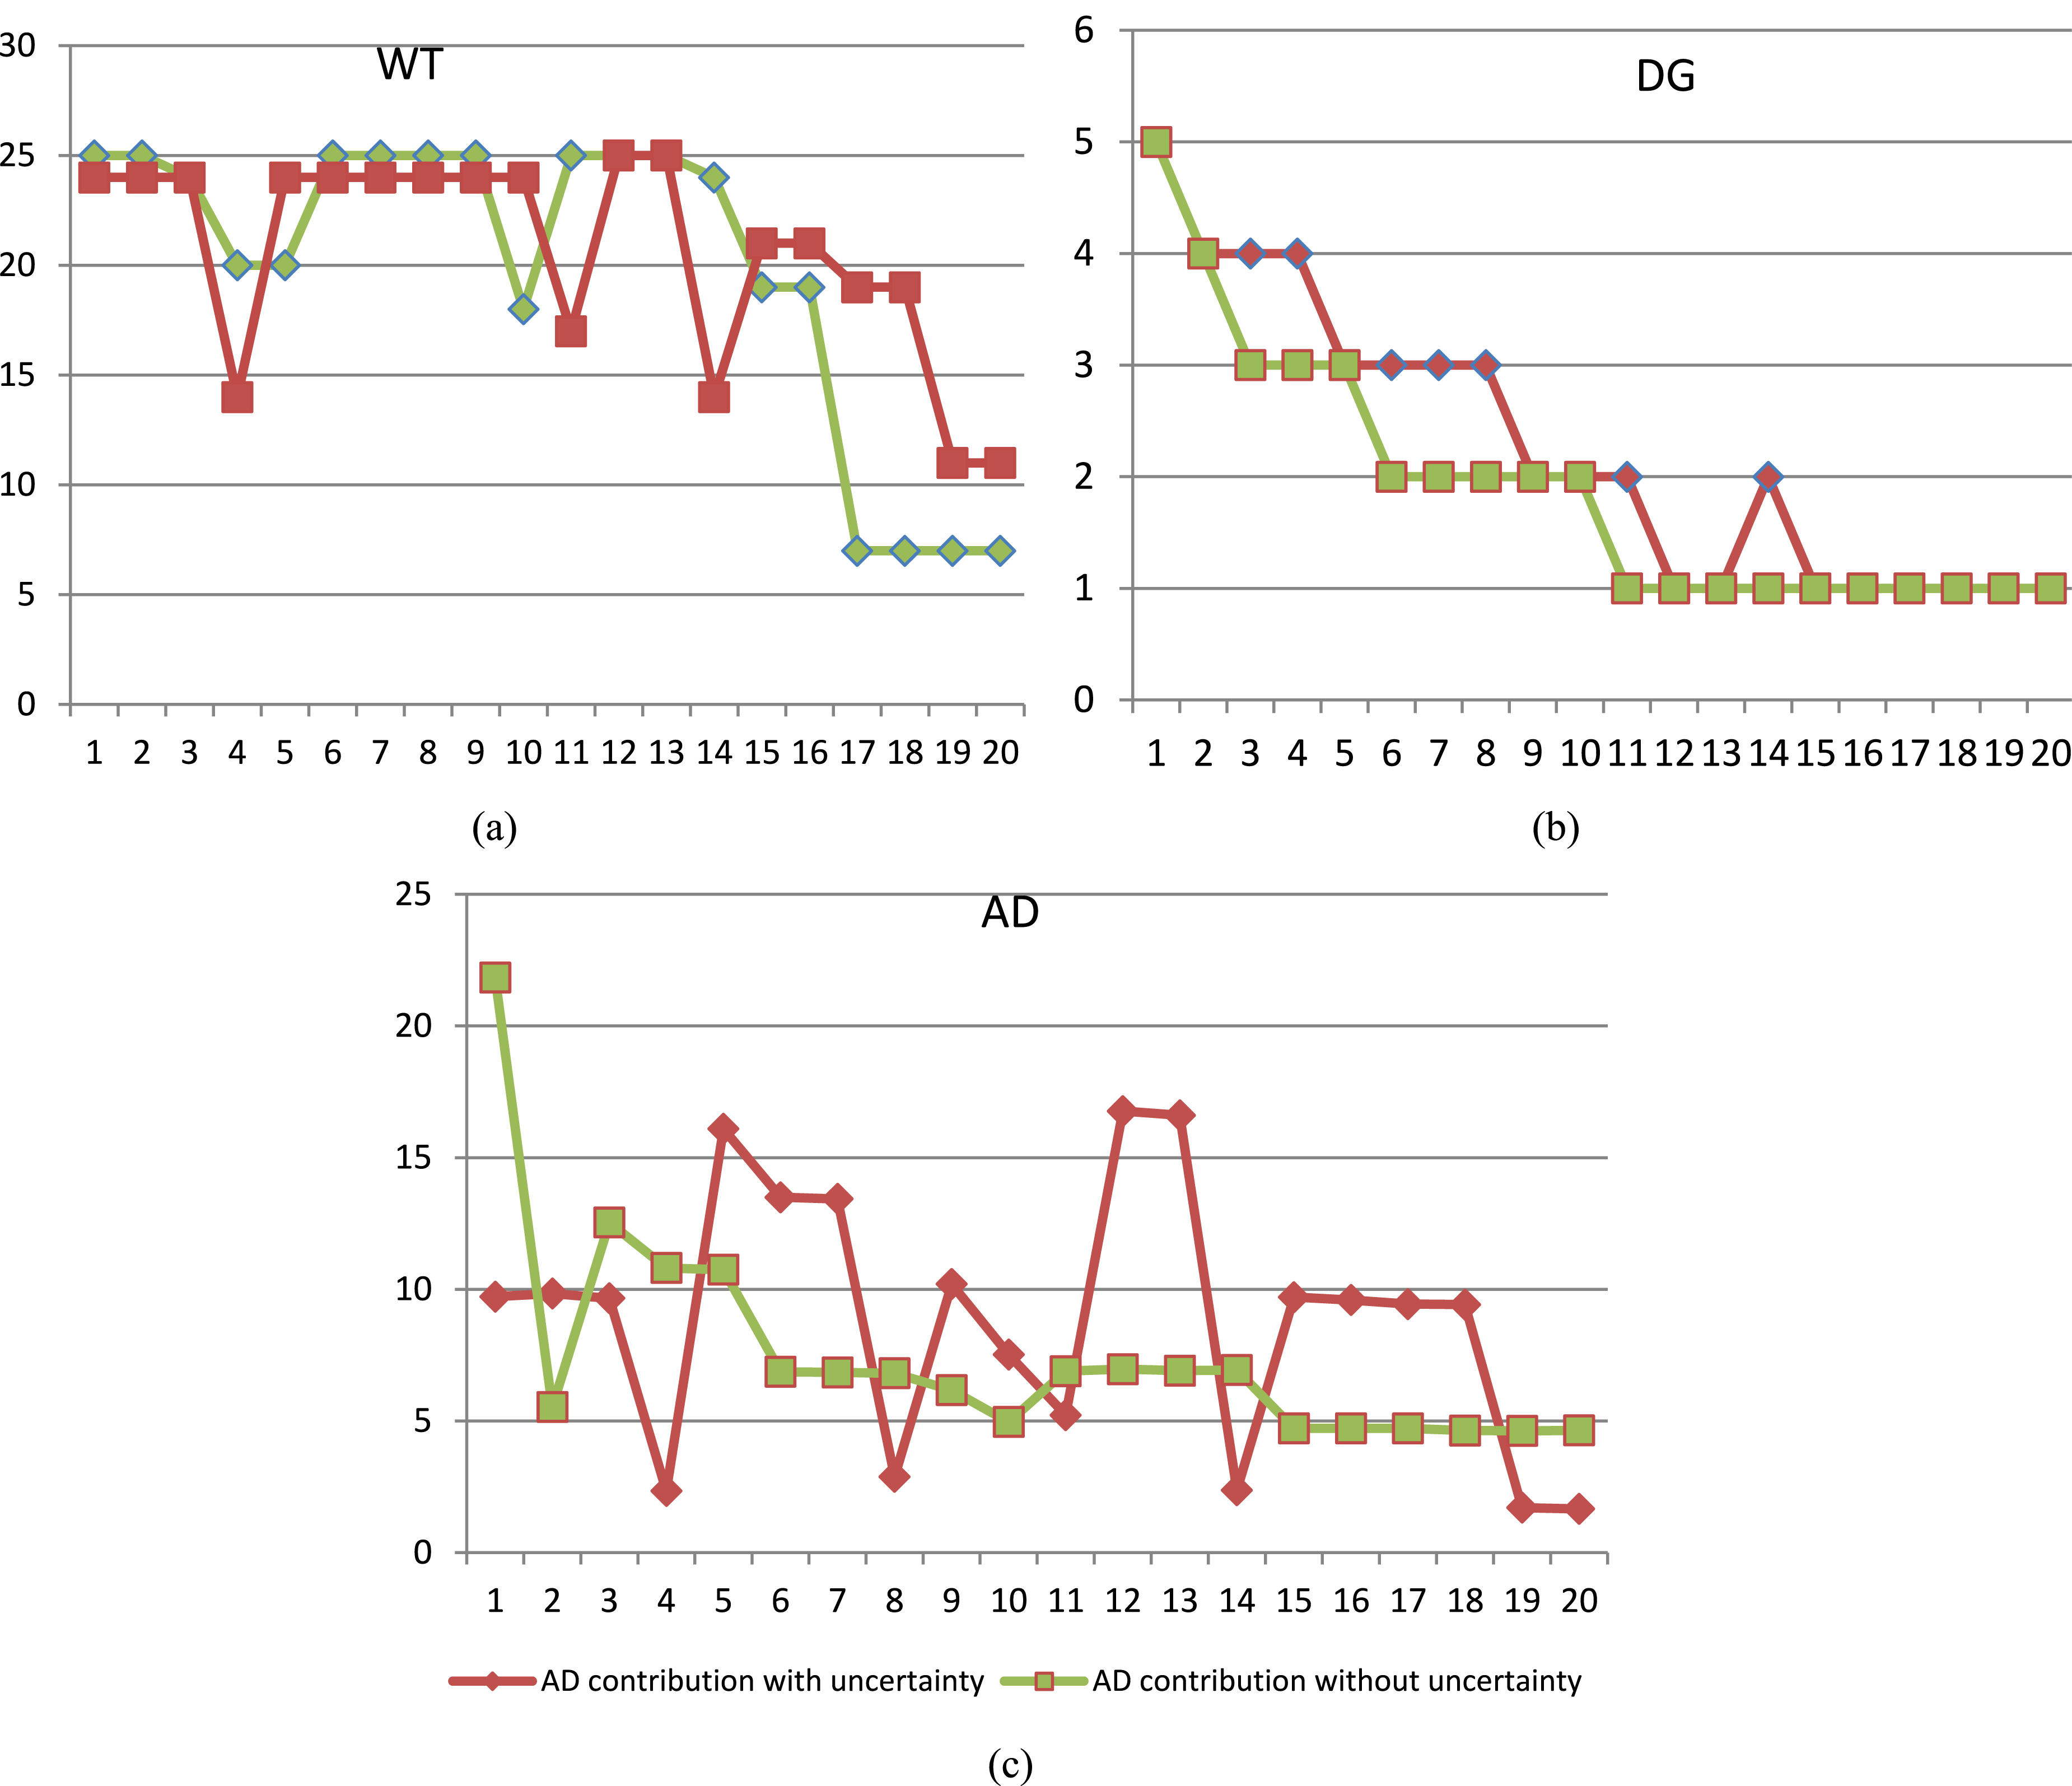
Using suggested design configurations with and without WT uncertainty, the energy contributions from microgrid components are compared. ➢ ⁃ The ideal microgrid architecture has a WT between seven and twenty-five turbines. ⁃ Only four solutions have a WT of seven units, while the majority have the greatest WT number of twenty-five. ⁃ According to the suggested algorithm, the highest range of AD values is produced by the range [4.641 -21.836]. ⁃ The range of DG was 1 to 5 units. ➢ ⁃ The most WT and AD systems were produced by the stochastic model. ⁃ In most solutions, there are more than 19 WT systems. ⁃ According to the suggested algorithm, the range [1.66 – 16.768] produces the narrowest range of AD values. ⁃ There were between one and five units of DG. ⁃
To assess performance, each component of the system was examined separately. With the contributions from WT, DG, and AD highlighted, Figure 22 shows the patterns of electricity production for the two setups. It is clear that. ⁃ When the two sizing strategies were compared, it was evident that raising the uncertainty budget increased demand and the power generated by renewable sources. ⁃ Each power source’s contribution varied depending on the solution. ⁃ Due to uncertainty, WT contributions have increased from 6 to 21 units, particularly at the high portion. ⁃ Particularly at the high part, there is a discernible very slight variation in the overall contributions power of WT difference between the two cases. ⁃ The influence of uncertainty causes distortion and a rise in DG contributions, particularly in the medium and low portions. ⁃ The impact of uncertainty causes the power produced by AD to fluctuate and rise. The energy contributions of various sources, such as WT, DG, and AD.
Comparative analysis of the LPSP, COE, and CO2
The LPSP produced by the applied optimization approach is thoroughly compared in Figure 23. It is important to note that the LPSP values obtained under the two scenarios exhibit greatest variance and are continuously high. The most reliable of them is case #3, which has the lowest LPSP value at 28.308%, while case #4 yields the highest value at 33.053%. The WT/DG/BESU configuration with probabilistic planning of the renewable power generating resource has a high LPSP at the low and medium sections, making it a less dependable and efficient system. The LPSP variations for deterministic and stochastic approaches.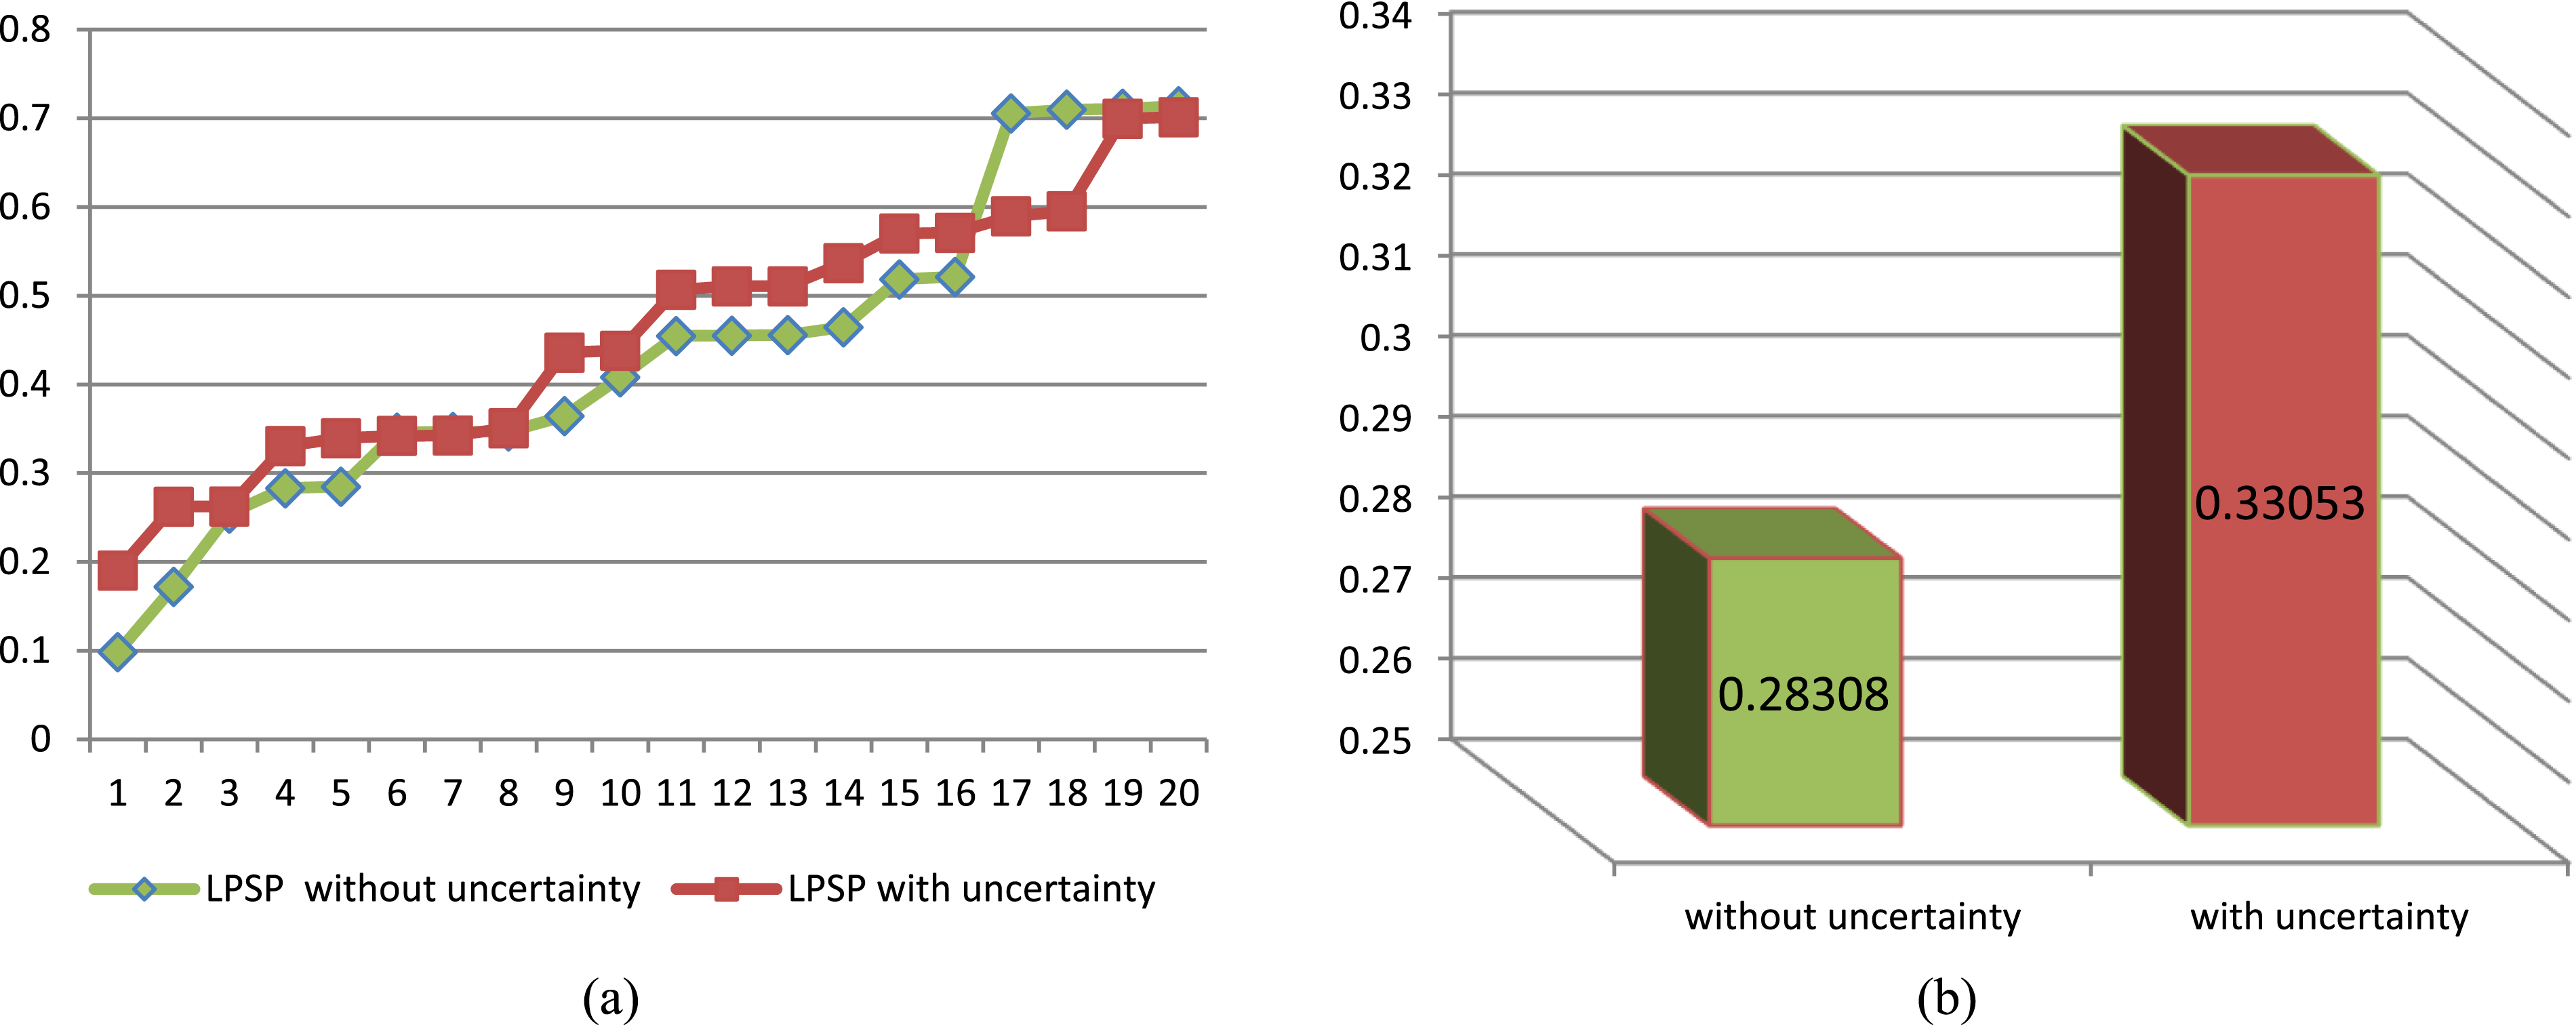
Figure 24 shows the hybrid islanded system’s goal function or planning cost for both modeling and not modeling the uncertainties. The deterministic model accounts for the circumstances in which uncertainty modeling is not taken into consideration. However, uncertainty modeling is taken into account in stochastic optimization. According to Figure 8, the planning cost for studies using stochastic modeling is always greater than that of research using deterministic modeling. This situation results from taking stochastic optimization’s uncertainty modeling into account. This means that in a given scenario, the load may be greater than anticipated while the quantity of power generated by renewable resources may be less than anticipated. As a result, there are more sources and storage devices than in the deterministic model. As a result, the cost of planning in stochastic modeling goes up. The overall costs have gone up by 21.5%. T There is a 21.5% increase in overall costs. Given their increased cost, example #4 might not be long-term economically feasible. The CO2 variations for deterministic and stochastic approaches.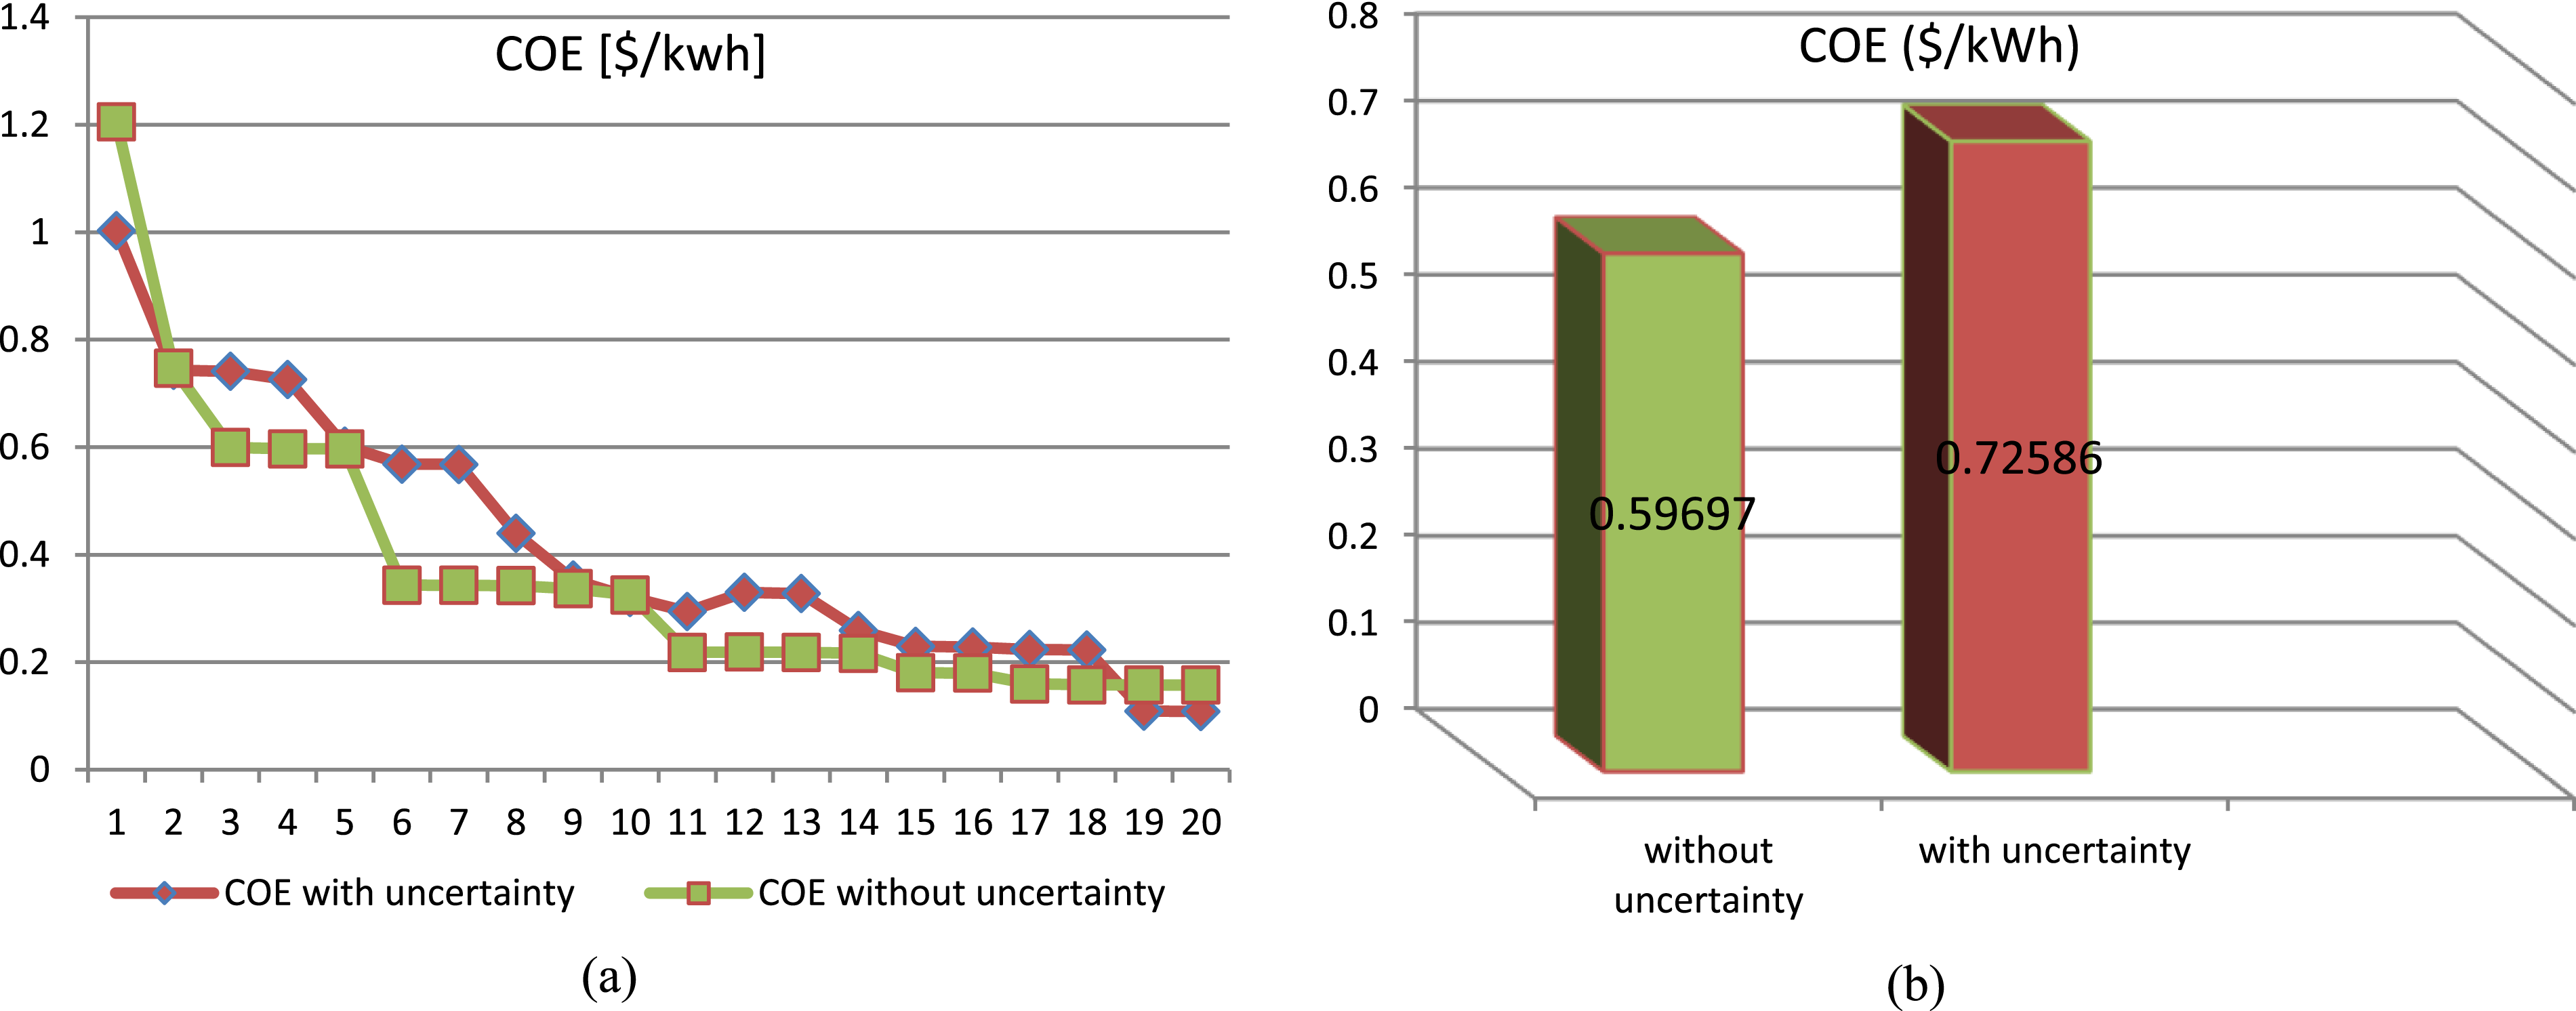
The environmental evaluation of the project under consideration was one of the current study’s other objectives. Different configurations’ effects on the environment are assessed, and the findings are shown in Figure 25. As illustrated in Figure 25, The emissions of each configuration are dependent on the system components and the total energy consumption of those components. According to the findings, case #3 produced less CO2 of power than case #4. Compared to case #4, case #3 produces less CO2 (only 1.7828e+05 g CO2). In comparison to the other example, case #3 is thought to be the most environmentally friendly based on the data in Figure 25. Comparison of CO₂ emissions produced by the different system configurations evaluated in the standalone microgrid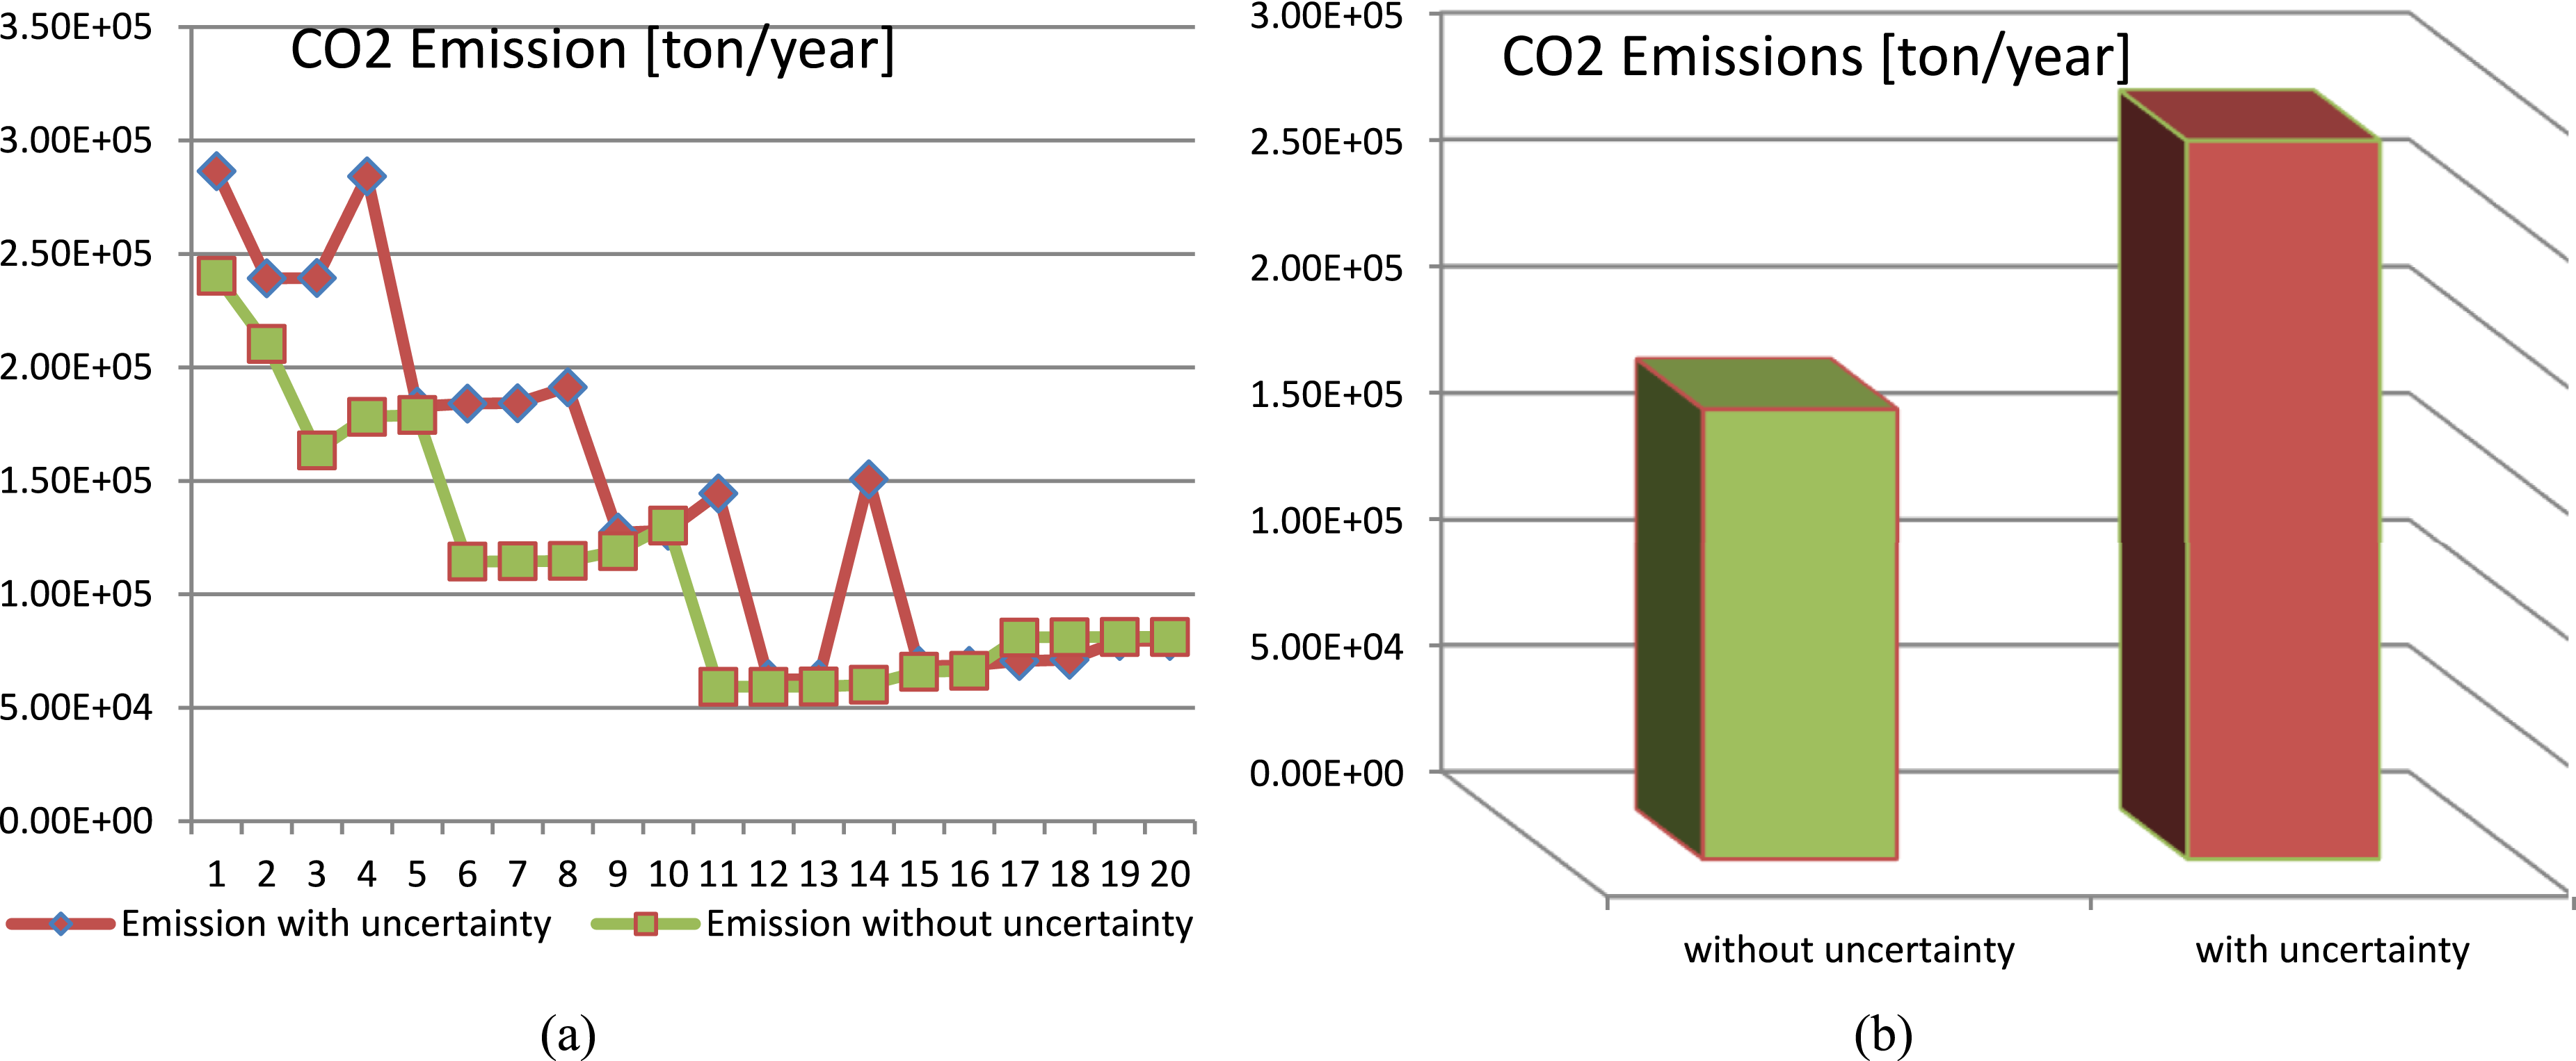
The observed variations stem from the stochastic nature of load demand and the intermittent behavior of photovoltaic and wind energy generation. Under such uncertain conditions, the actual values of production and consumption often diverge from those predicted by deterministic models. Therefore, to achieve a more robust and reliable system design, these uncertainties in both generation and demand must be explicitly modeled and incorporated into the energy system sizing process.
Scenario 3: PV/WT/BES/DG configuration
Together with BES and a DG, the PV/WT/BES/DG system uses PV and WT as renewable energy sources. A distinct mix of energy inputs is provided by this combination, which also includes two non-renewable sources (BES and DG) and two renewable sources (WT and PV).
The PV/WT/DG/Bat arrangement is the recommended one as eliminating any of the parts would result in a less dependable power source and increased expenses. For example, without the diesel generator, renewable energy sources would not be able to supply electricity at night or in bad weather, hence the generator is an essential part. On the other hand, there would be a noticeable rise in pollution if solar panels were removed. Thus, by integrating these components, the suggested approach has determined the ideal system.
Simulation, sensitivity analysis, modeling, and optimization are all steps in the process. The PV panels, WT, storage system (SS), DG, and other system components are set up to effectively fulfill the load demand. The electric load demand (ELoad(t)) is compared to the solar power output (PPV(t)) and WT generation (EWT(t). The load receives the PV and WT output, and any extra electricity is kept in the storage system as long as it is not fully charged (SSSOC < SSSOC, max) with the excess electricity Eexcess (i.e., Pgen (t) ≥ Pd), which indicates that the power created is greater than the power demanded. After the storage system charge to the maximum, any excess energy is denoted as the dump load and used to meet the load requirement. The DG is triggered as a failsafe to supply the required power when EWT(t), PPV(t), and SS are not enough to meet the load demand beside the demand exceeds the specified minimum load ratio. In contrast, an unmet load (PElec(t)) occurs during the 20-year assessment period when the power load demand (ELoad(t)) is less than the minimum load ratio needed for DG activation so it can’t be provided by P(t) or the storage system.
Case 5: Deterministic model of the PV&WT power sources
The deterministic model considers the circumstances in which uncertainty modeling is not made. The PV/WT/DG/BES hybrid energy systems discussed in this section are examined to allow renewable energy sources to serve as the primary energy sources, with energy storage devices providing backup power as needed. In order to satisfy the load demand whereas minimizing LPSP, COE, and CO2 and adhering to the system restrictions, the best option is assessed. The systems were simulated using the suggested method, which took into account the deterministic planning of PV and WT power sources. The standalone micro-grid system’s Pareto front, generated by the proposed method based on the LPSP, COE, and CO2 functions, is displayed in Figure 26. Table 10 presents the numerical outcomes of robust sizing of the PV/WT/DG/BES setup using the suggested solver. Pareto front of the standalone microgrid system generated by the proposed method based on the LPSP, COE, and CO₂ objective functions for Case 5 20 designated results for case 5.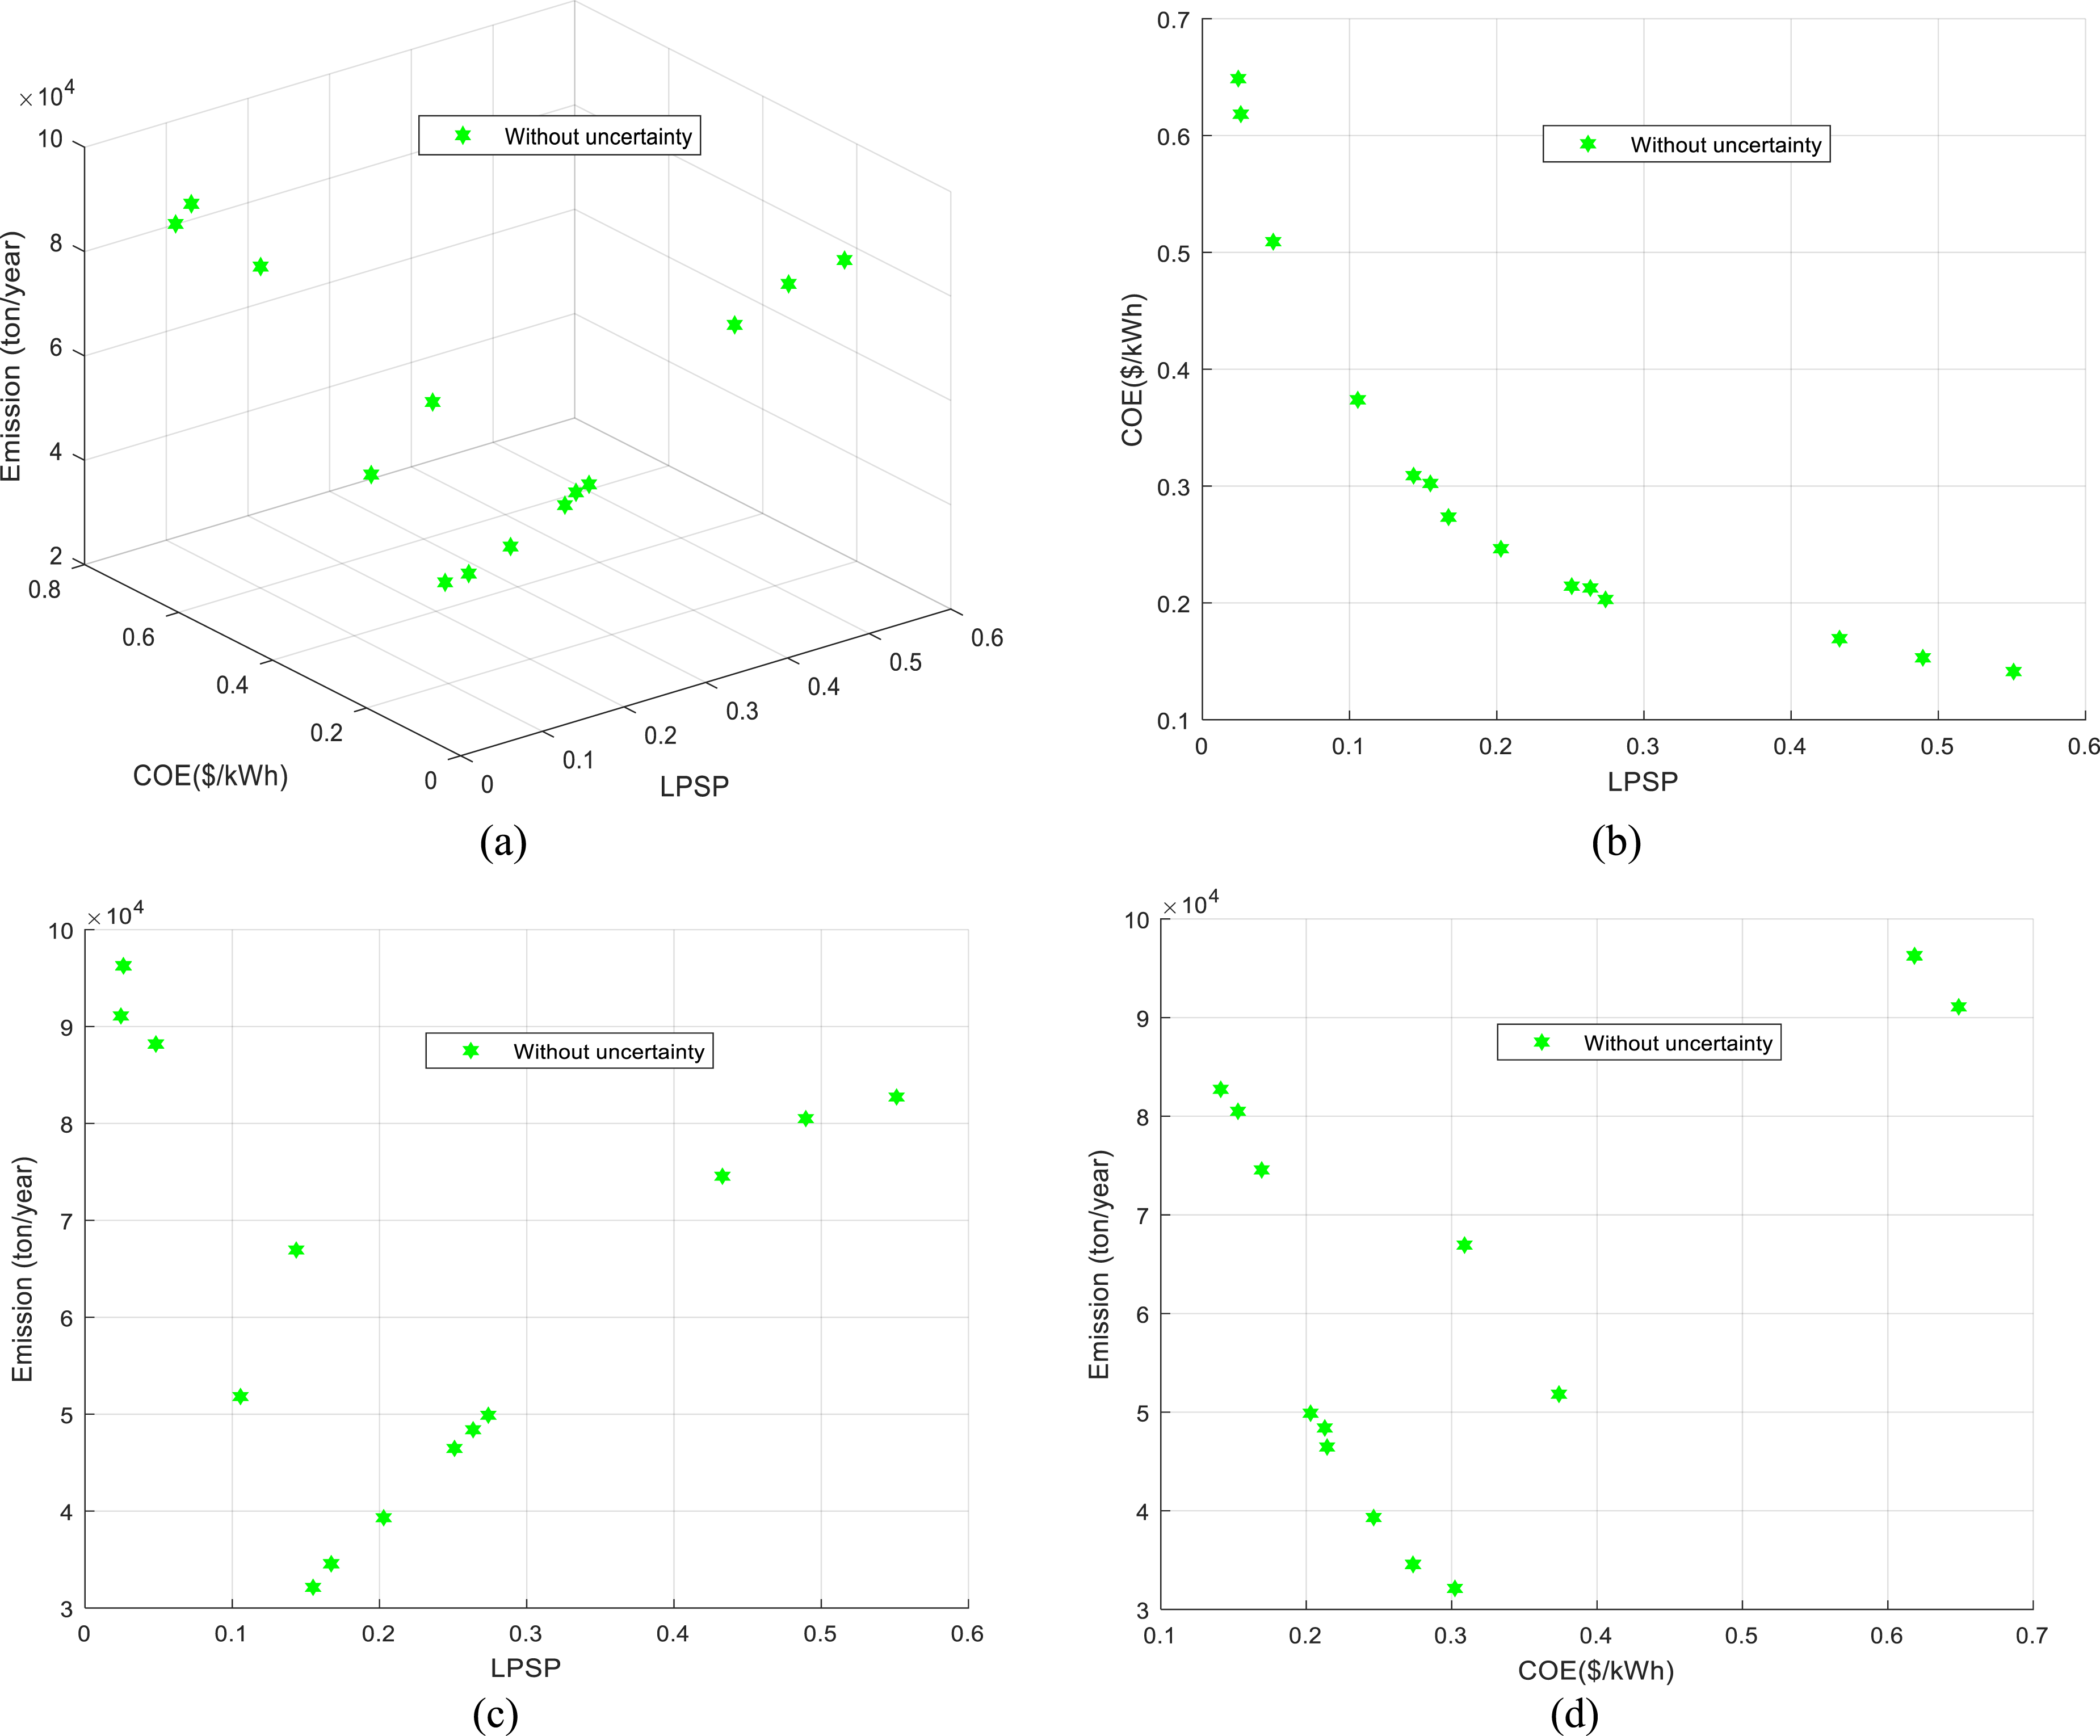
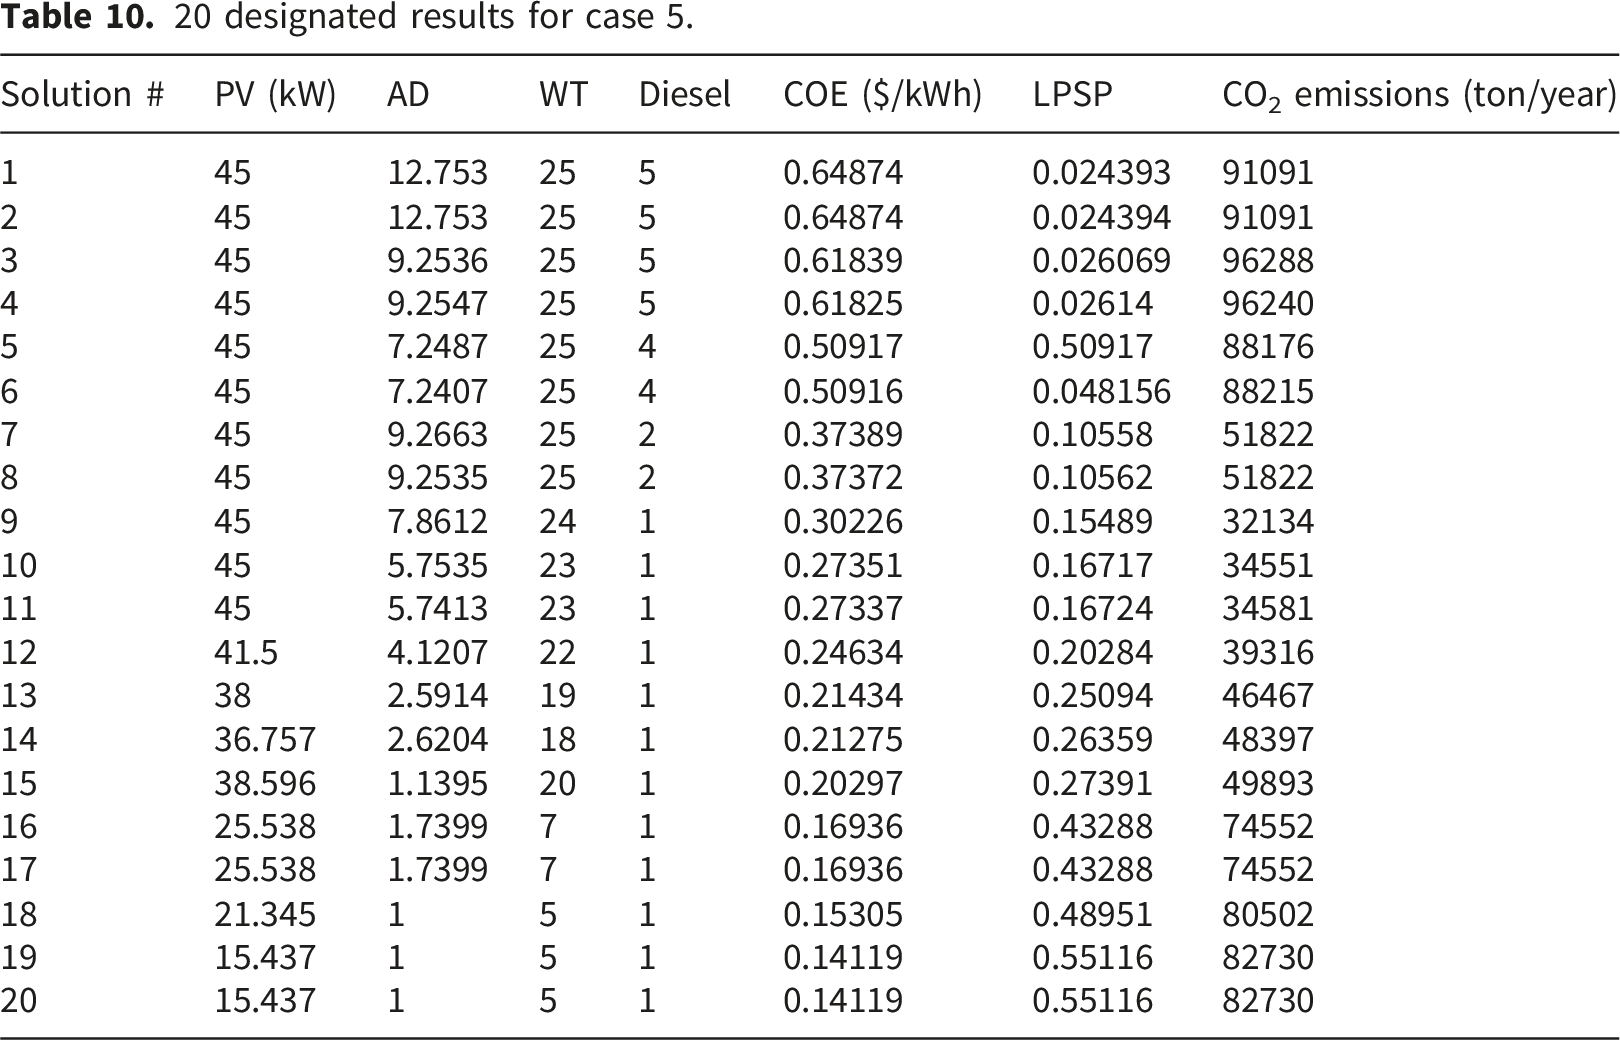
According to the optimization results, a 41.5 kW PV capacity is part of the ideal microgrid HRES architecture, the appropriateness of the designated region served as the basis for determining this capacity. Low wind speeds at the location highlight the site’s great potential for wind power generation, as seen by the proposed method’s choice of 22 turbines out of 25 viable possibilities. Additionally, as a backup power source, the HRES incorporates one DG out of five possibilities, demonstrating the high generating power from renewable power sources. The system has 4.1207 AD, which is intended to store extra electricity produced by the PV and wind systems, to guarantee effective energy storage. The COE, LPSP, and CO2 of this solution are 0.24634 $/kWh, 20.284%, and 39316 ton/year, respectively.
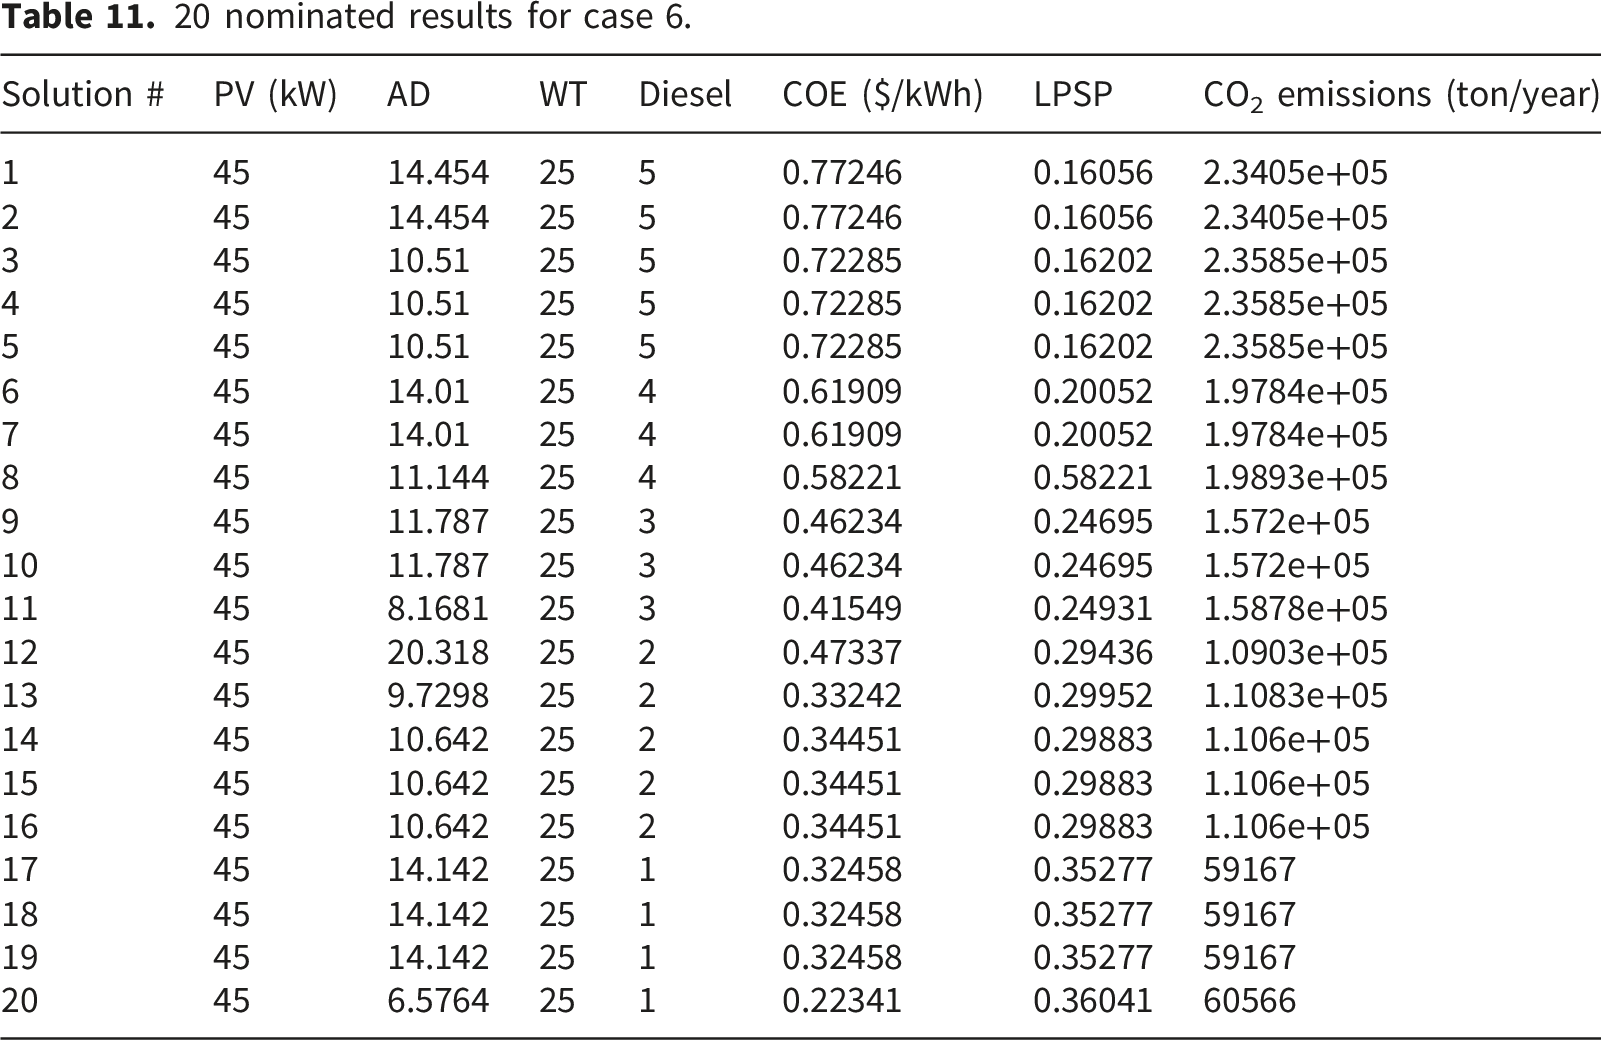
Case 6: Stochastic model of the PV&WT power sources
20 nominated results for case 6.
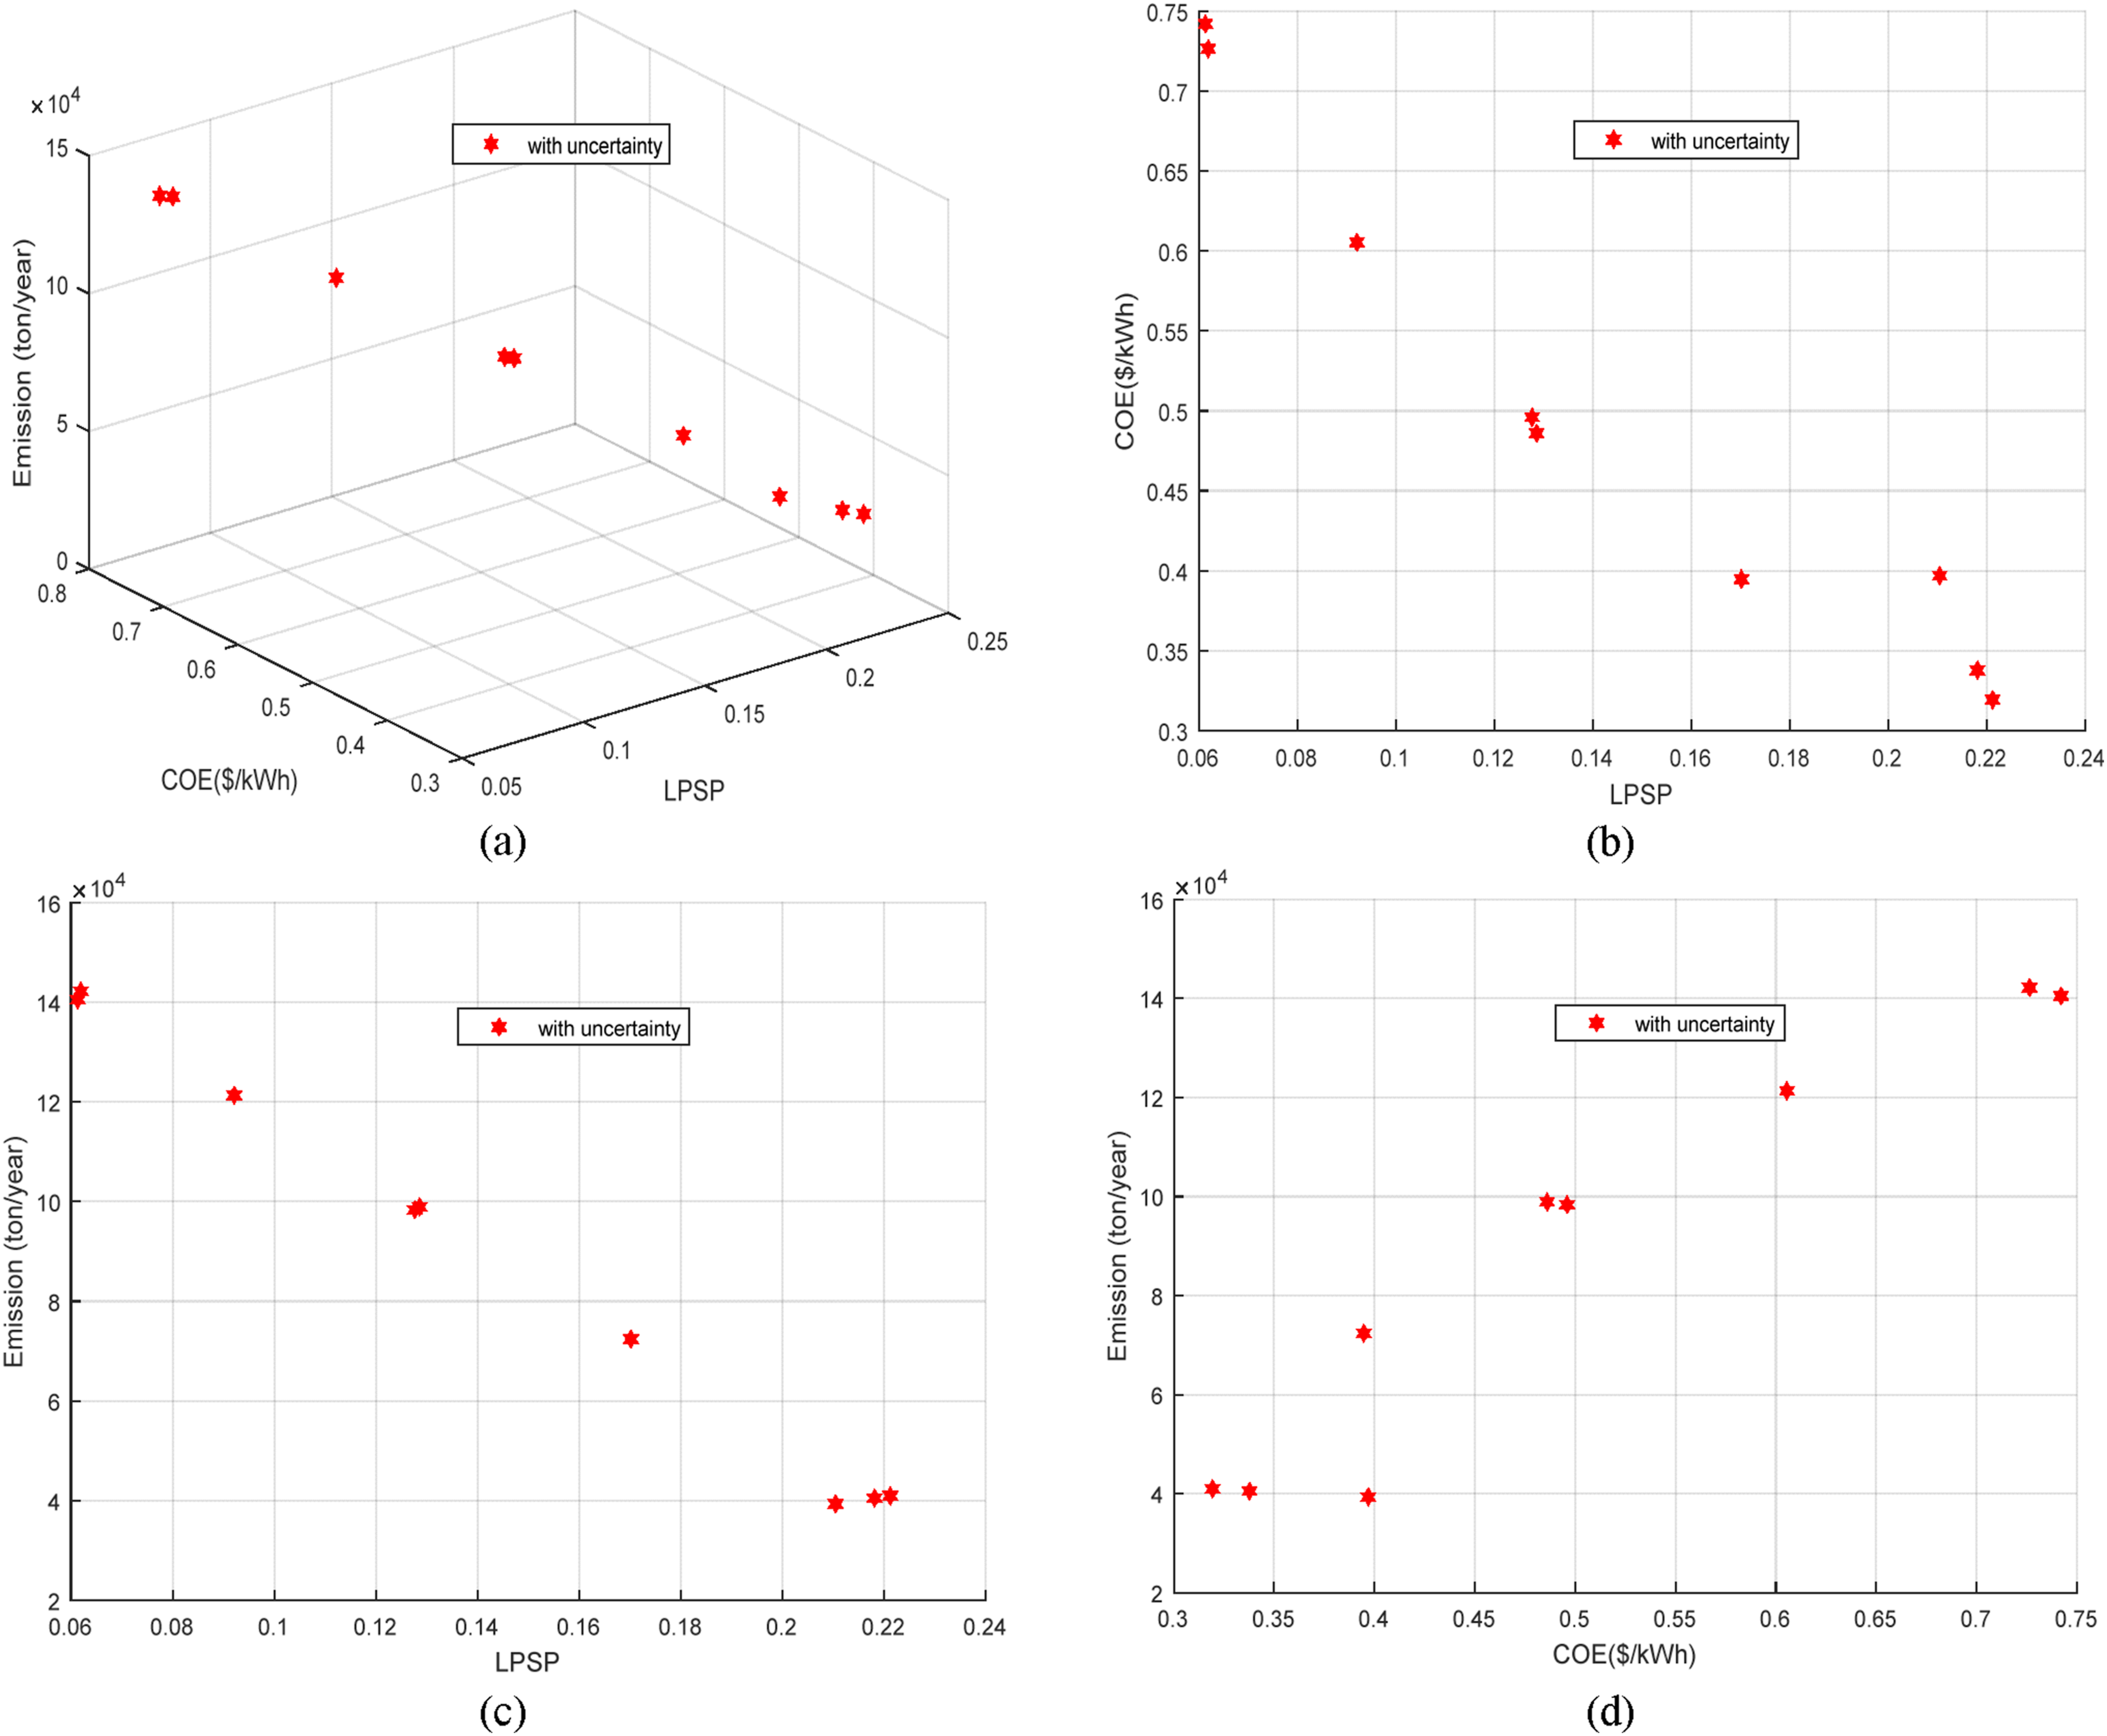
Pareto front obtained for case 6.
This case is developed to permit a high renewable share in light of the present capacity for renewable integration. According to the modeling results, 11.787 AD and 45 kW of PV and 25 wind turbines are enough to replicate the current renewable fraction condition. In the event that one of the WTs needs repair or breaks down, having numerous WTs rather of one bigger size helps to increase the system’s dependability. The suggested strategy optimizes the number of diesel generators, which is three units. This solution is equivalent to a CO2 of 1.572e+05 ton/year, an LPSP of 24.695%, and a COE of 0.46234 $/kWh.
Demonstrating how well the suggested algorithm performs in optimizing the reliability and cost-effectiveness of hybrid renewable energy systems. With the lowest Cost of Energy (COE) of 0.22341 $/kWh, a Loss of Power Supply Probability (LPSP) of 36.041%, and 60566 CO2 Emission, Solution # 20 offers the most economical setup. 45 kW of solar energy, 25 wind turbines (WTs), 6.5764 days of autonomy, and one diesel engine power the optimum system.
Comparative assessment of microgrid energy generation contributions
Figure 28 displays the collection of Pareto optimal solutions for the autonomous microgrid that were produced by the suggested method taking into account two planning models (deterministic and stochastic) based on the LPSP, COE, and emission functions. According to Figure 28, the hybrid islanded system’s objective function has a higher value when the uncertainties are modeled and not. This situation results from taking stochastic optimization’s uncertainty modeling into account. This means that in a given scenario, the load may be greater than anticipated while the quantity of power generated by renewable resources may be less than anticipated. As a result, there are more sources and storage devices than in the deterministic model. In stochastic modeling, this leads to an increase in the planning cost and LPSP. Pareto front generated by the proposed algorithm based on LPSP, COE, and emission functions for deterministic and stochastic planning models.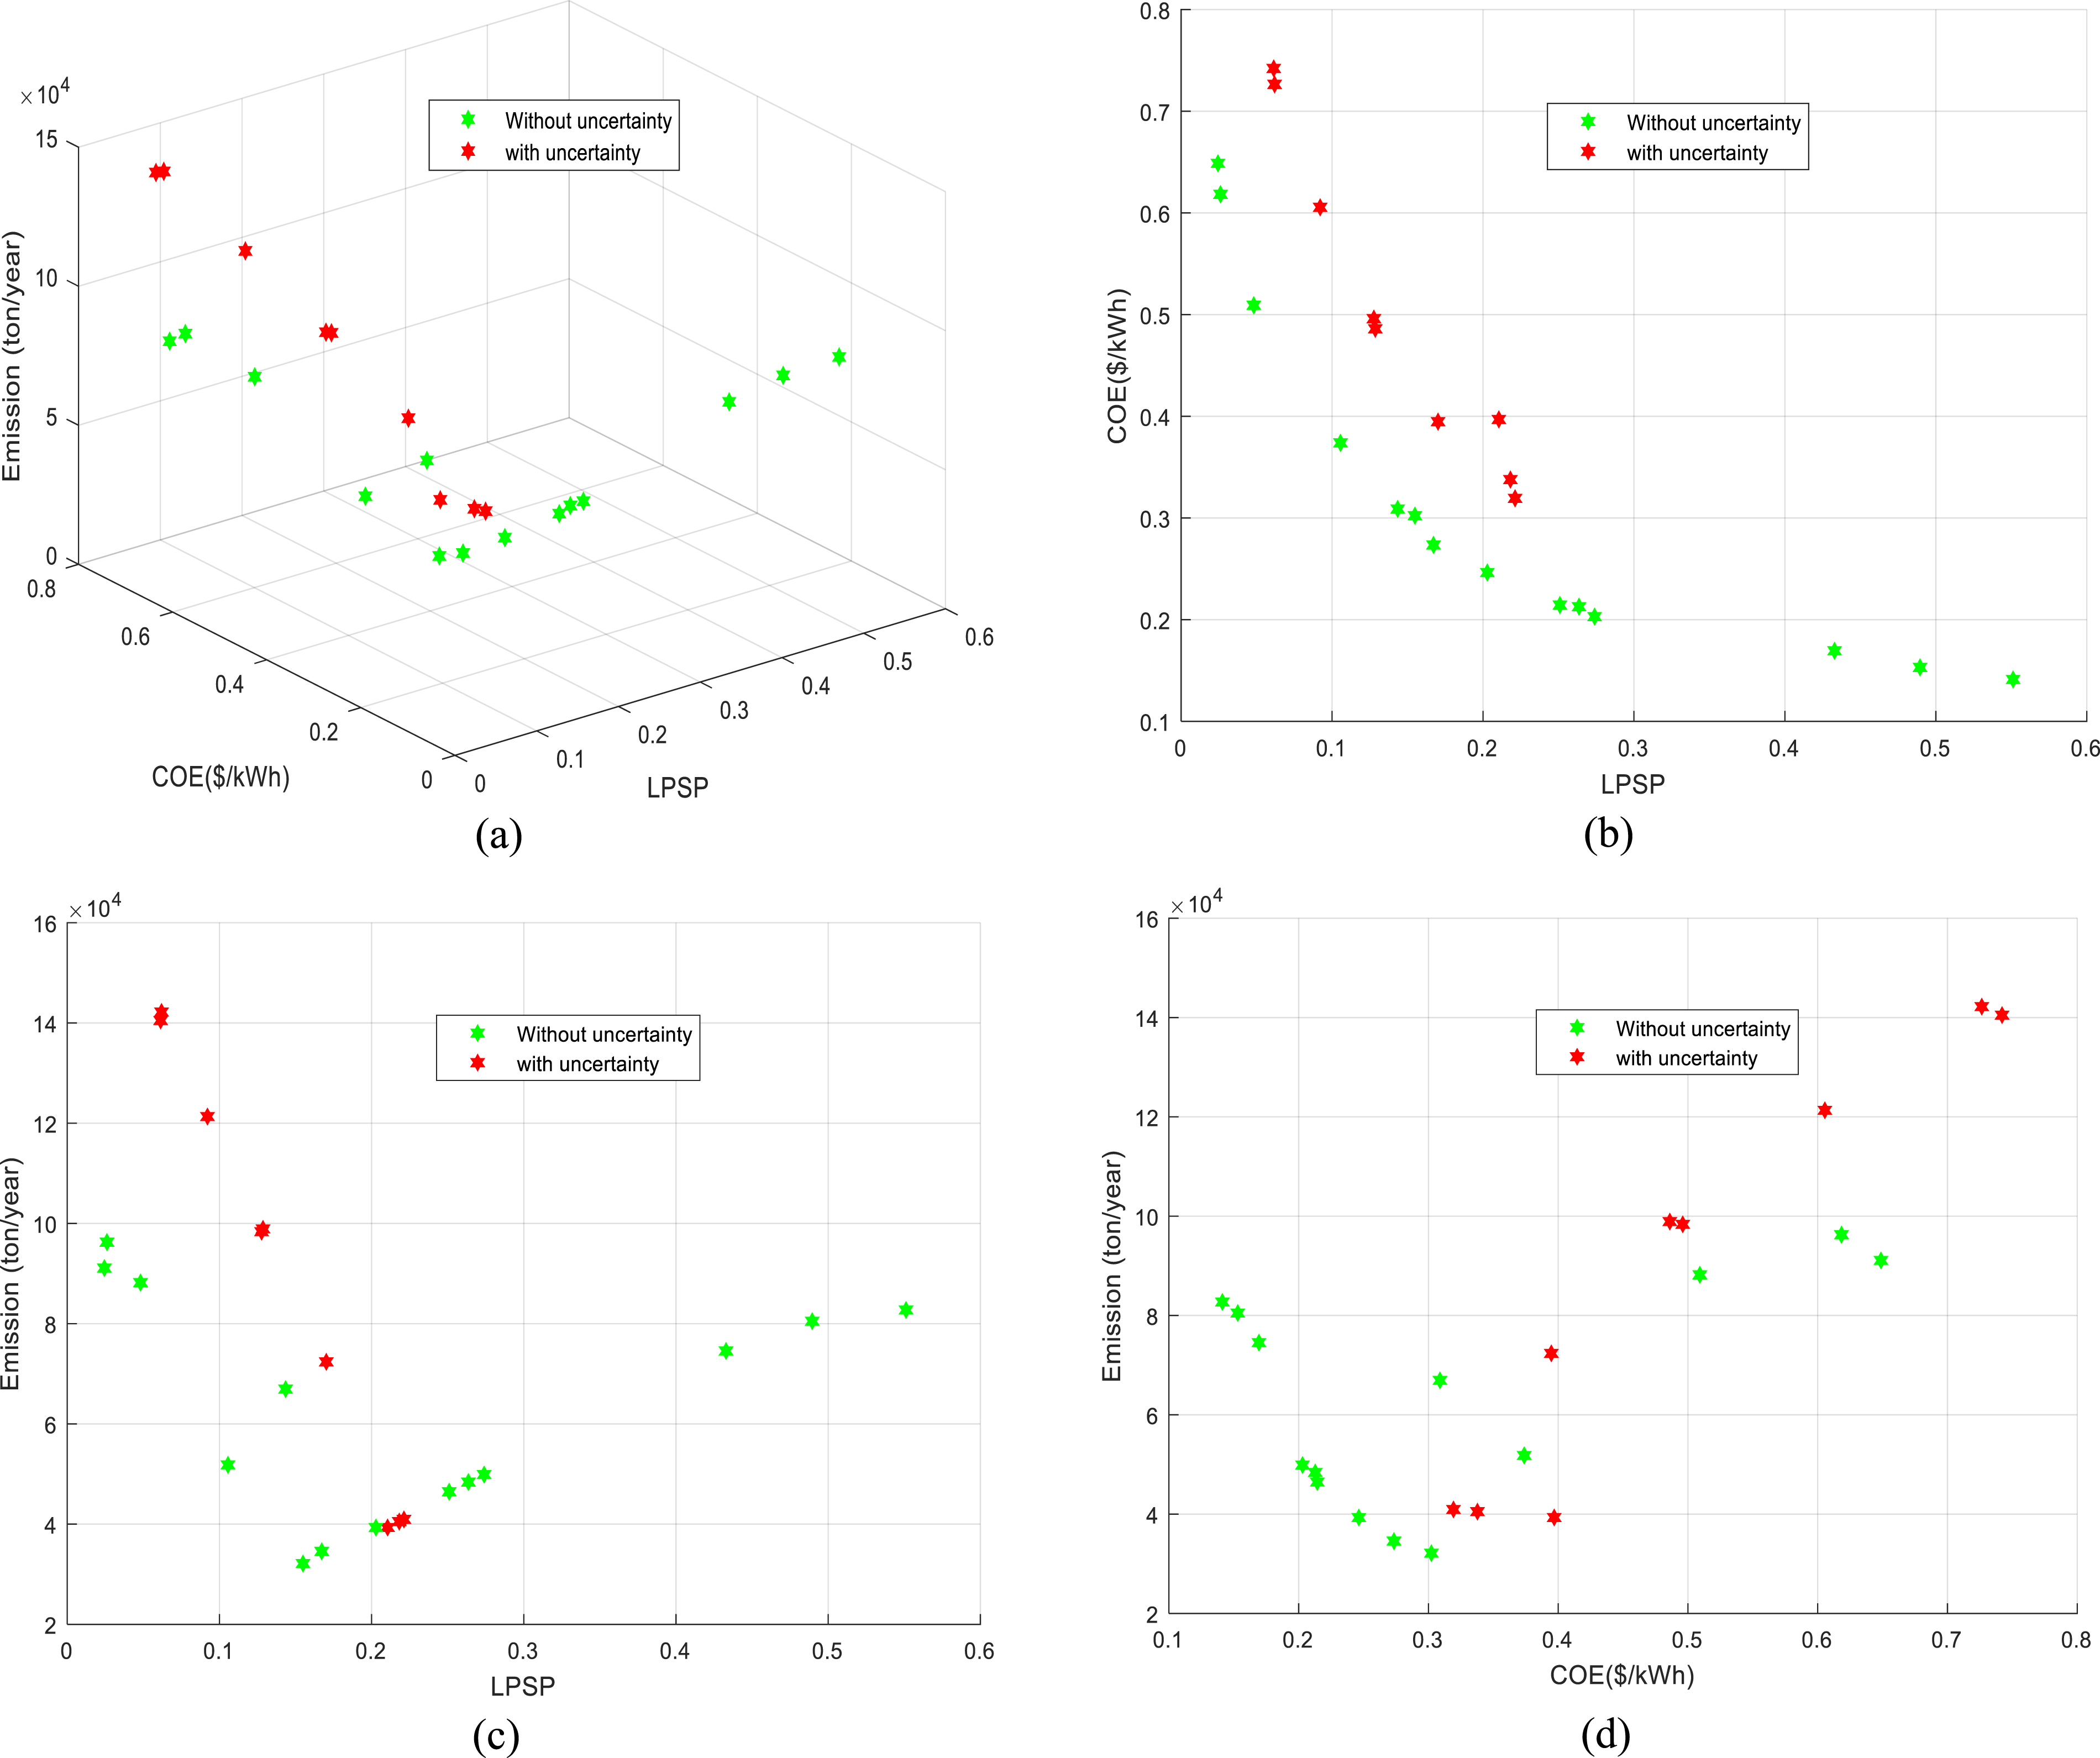
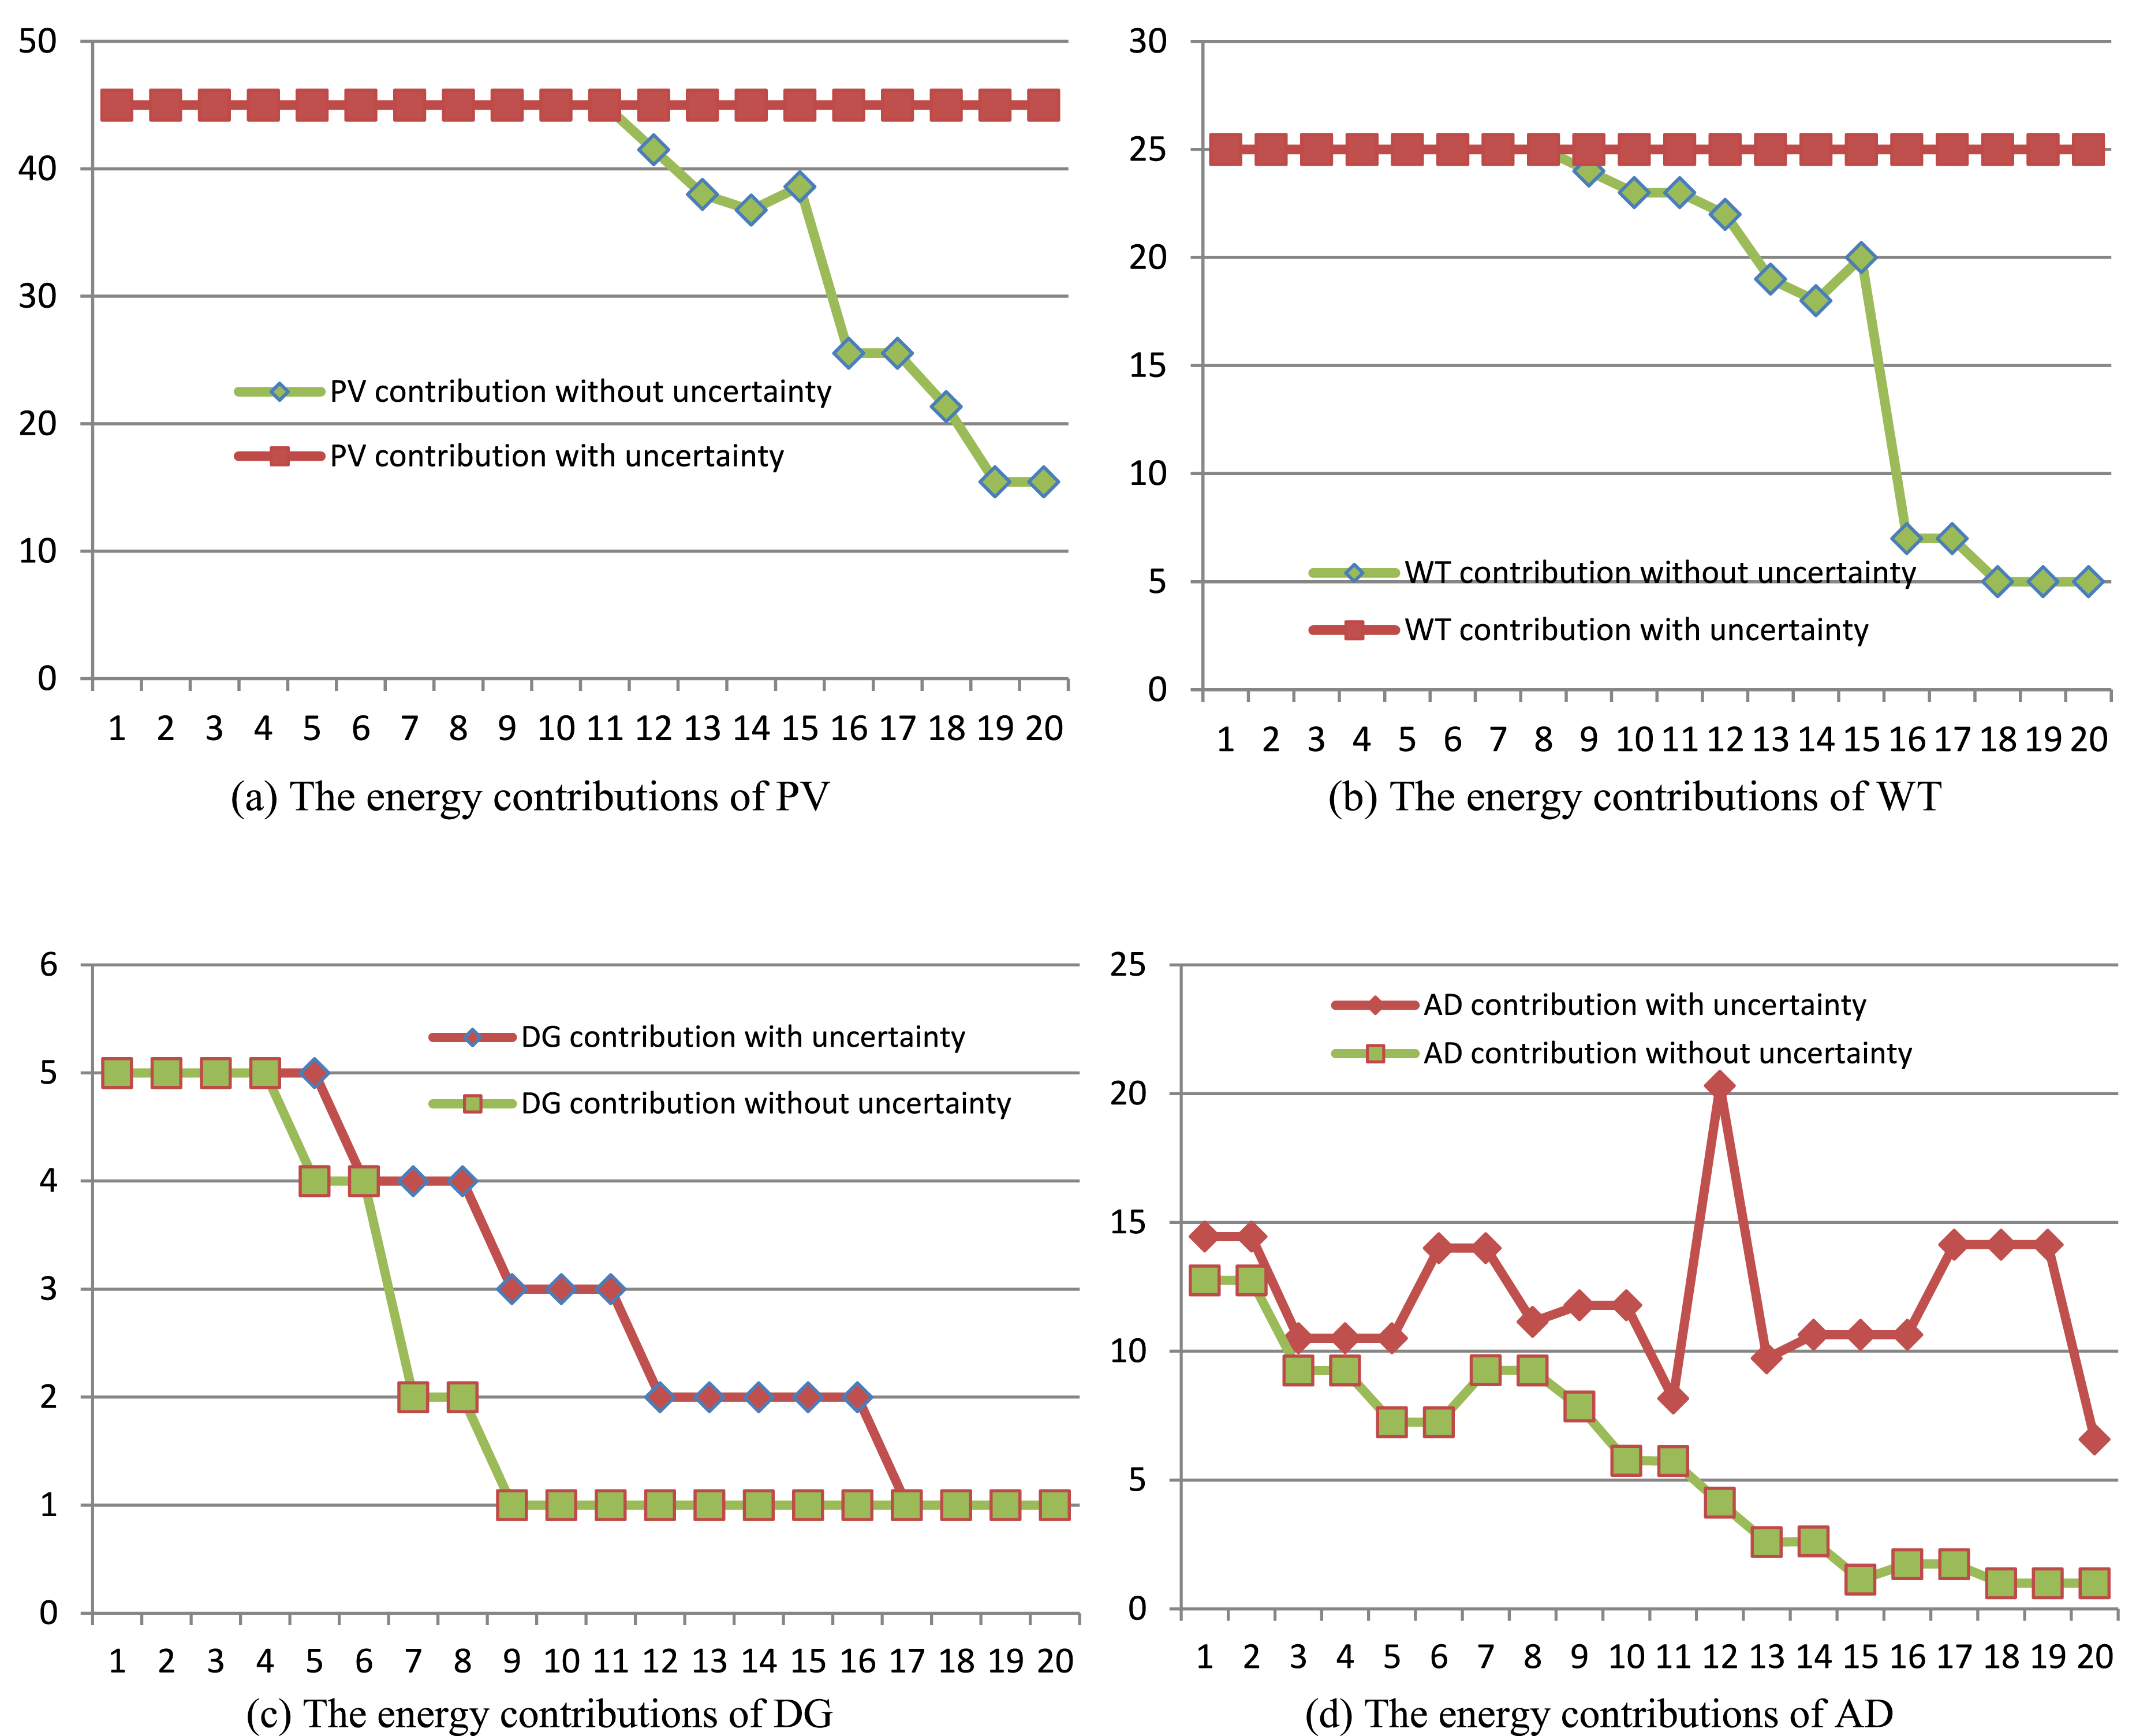
Using suggested design configurations with and without PV&WT uncertainty, the energy contributions from microgrid components are compared. ➢ ⁃ The low solar radiation at the location is reflected in the PV systems’ optimal contribution, which ranged from 44.067 to 45 MW. ⁃ Because of the high load and low wind speed, the proposed method’s selection of 25 wind turbines was limited. ⁃ According to the suggested algorithm, the range [6.2136 -14.514] produces the narrowest range of AD values. ⁃ In order to demonstrate the high generating power from renewable power sources as a backup power supply, the HRES integrates 1-3 DG from a total of 5 possible alternatives. ➢ ⁃ The stochastic model produced the greatest number of WT systems and AD as well as the most distortion. ⁃ The majority of solutions have between five and twenty-five turbines. ⁃ According to the suggested algorithm, the range [1 – 21.753] produces the narrowest range of AD values. ⁃ As a backup power source, the number of DG varied from 1 to 5 units, reflecting the low and fluctuating electricity supply from renewable power sources. ➢
Figure 29 shows the power dispatch change curve based on energy management for PV/WT/DG/BES configuration for two deterministic and stochastic sizes. Of course, ➢ ⁃ The difference between the two scenarios’ total accumulated power (renewable power) is negligible. ⁃ It’s unclear how uncertainty affects the amount of power generated by renewable sources. ⁃ Since the required reserve is less than the real reserve, several diesel generators begin to supply the necessary real reserve if the required reserve is insufficient. ⁃ The overall accumulated power difference from non-renewable resources rises as the effect of PV and WT uncertainty increases. As can be seen, the overall power derived from the battery is marginally impacted by changes in this proportion. ⁃ Nonetheless, the accumulated power difference is more impacted, hence the DG’s ideal size is raised to account for this shift in the accumulated power difference between demand and RES generation. ⁃ Due to the significant contribution power from DG in this area, the low portion produces the most CO2 emissions and the highest fuel usage. ➢ ⁃ Because it captures the stochastic behavior of the uncertain parameters in the suggested methodology, the results of this section are thought to be more accurate. ⁃ The load demand has gone up due to the increase in the uncertainty budget, and naturally, more renewable resources have been produced to make up for this increase. ⁃ From one solution to the next, the contributions of all power sources varied. ⁃ For the PV/WT/DG/BESU setup with uncertainty generated from renewable energy, the range of AD values and the amount of power derived from renewable and non-renewable resources have a significant impact. The energy contributions of various sources, such as PV, WT, DG, and AD.
Comparative analysis of the LPSP, CO2, and COE
The microgrid’s LPSP, CO2, and COE were compared utilizing various design combinations, including PV/WT/DG/BESU with and without uncertainty. According to the results, Case 5 has the lowest COE, LPSP, and CO2 levels by far. In cases five and six, the COE values are $/kWh 0.24634 and $/kWh 0.46234, respectively, whereas the CO2 values are 39316 and 157200 ton/year, respectively. Furthermore, the LPSP is attained at % 20.284 and % 24.695, respectively, which is a reduction of 21.746%. This suggests that instance 5 is less likely than the other instance to fail to meet the demand criterion.
Cost-benefit evaluation
Among the key factors in assessing an energy project, the analysis of cost flows plays a central role. Among the two configurations under consideration, case 5 has the lowest value, while case 6 has the highest value, as indicated by the data shown in Tables 10 and 11. Cost flow analysis is to determine the reason for these discrepancies. The system’s cost flow in the two configurations under consideration is depicted in Figure 30. The figure illustrates that the lowest cost, obtained with case 5, is equal to 0.24634 $/kWh. In contrast, the cost in other cases is higher, up to 0.46234 $/kWh in case 6. Due to the influence of uncertainty, the fraction of power generated from various power sources increases at the upper region of the curve, which raises the MG’s overall expenditures. The COE variations for deterministic and stochastic approaches.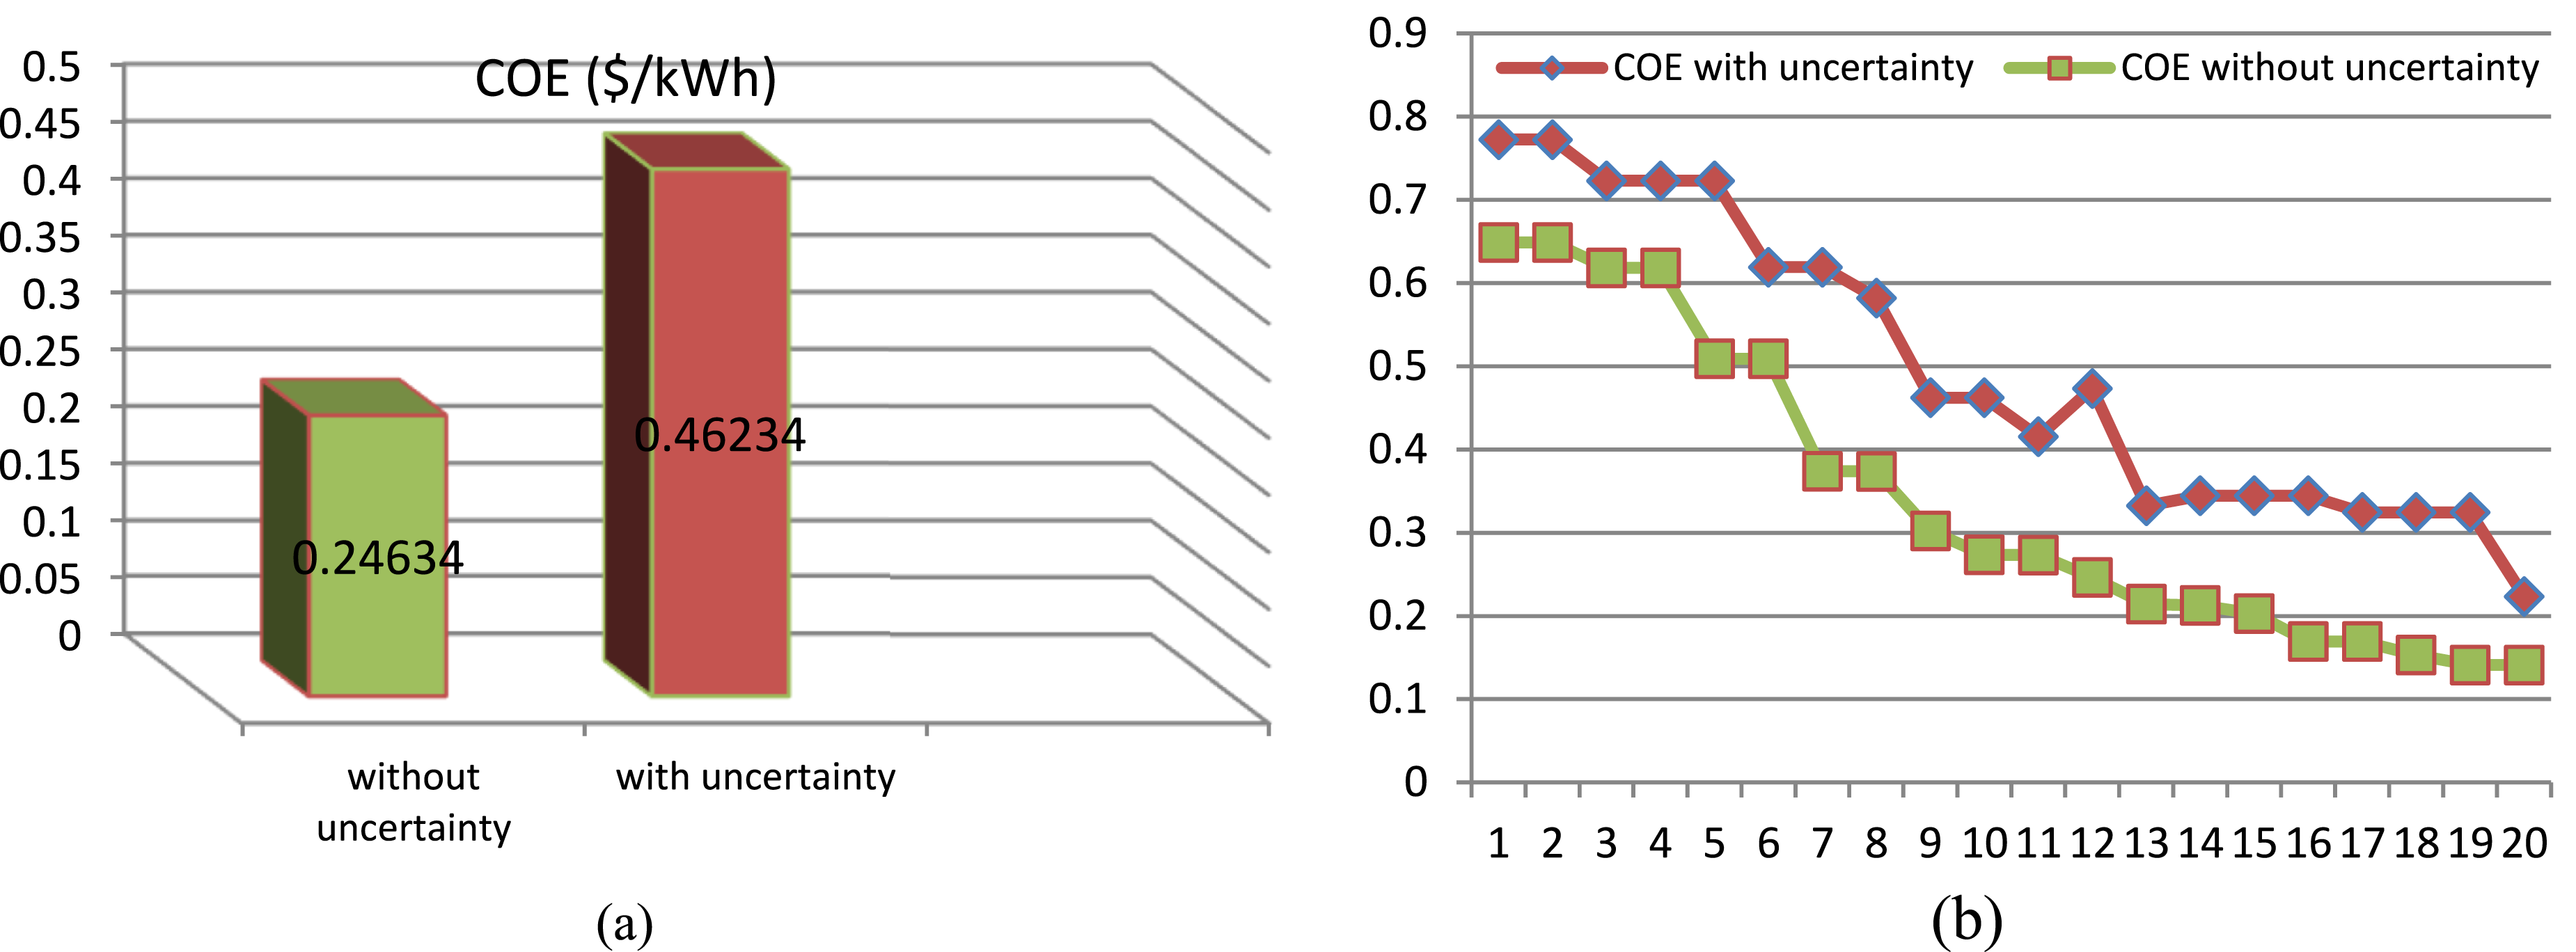
Environmental analysis
One of the main goals of this project is to reduce carbon emissions using HRES. Figure 31 shows that case 6, which is three times more than the reference case system, has the highest CO2 emissions. Case 5’s CO2 emissions are the lowest amount. The CO2 variations for deterministic and stochastic approaches.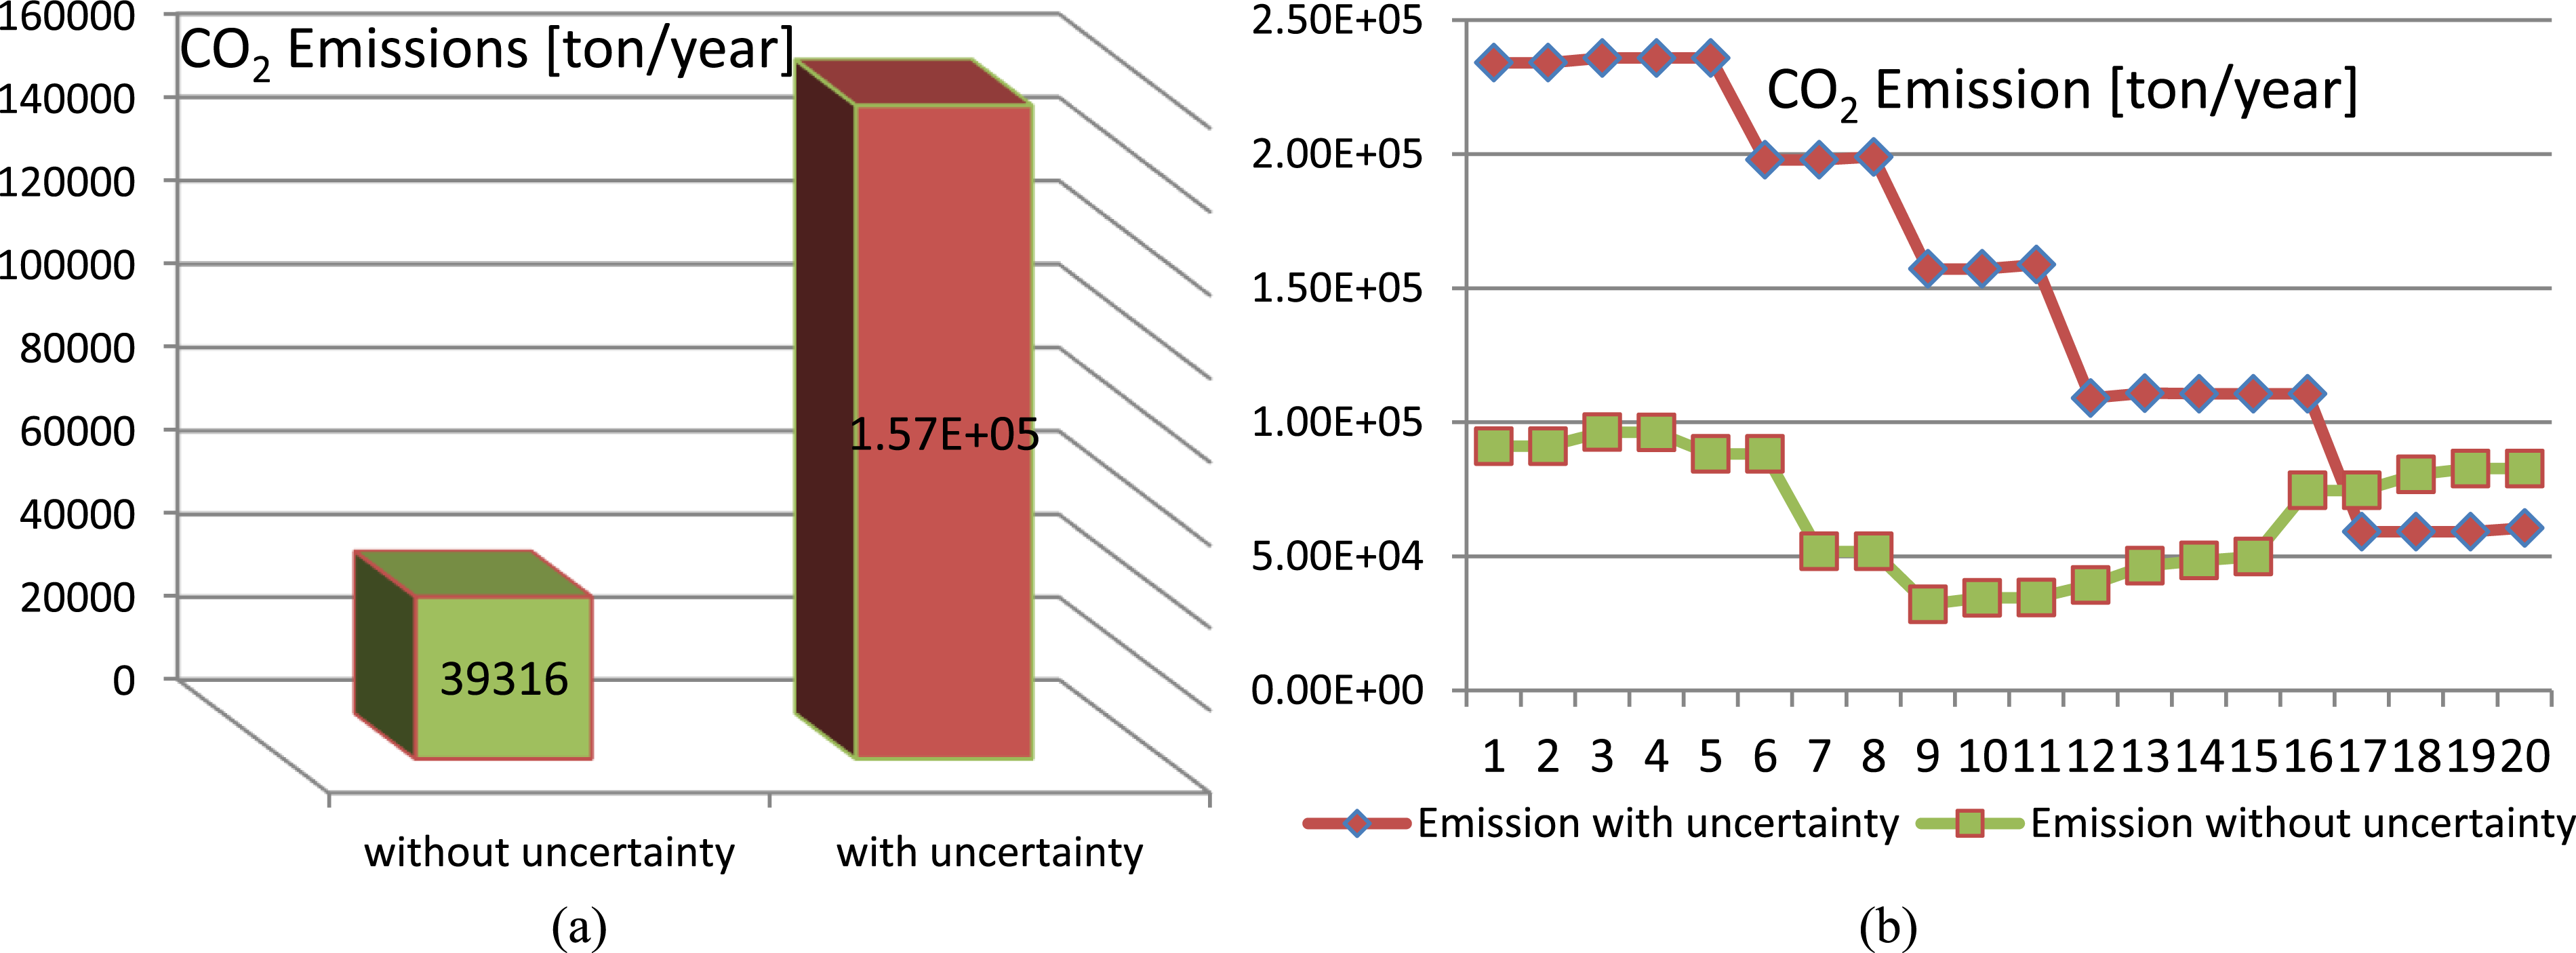
LPSP analysis
A thorough comparison of the LPSP produced by the applied optimization strategy is shown in Figure 32. It is important to note that the LPSP values obtained in the two cases under study exhibit maximal fluctuation and are continuously high. Out of all of them, case # 5 is the most reliable with the lowest LPSP value (20.284%), while case 6 yields the highest value (24.695%). Particularly at the high portion, the PV/WT/DG/BESU design with probabilistic planning of the renewable power generating resource has a high LPSP and is less dependable and efficient. The LPSP variations for deterministic and stochastic approaches.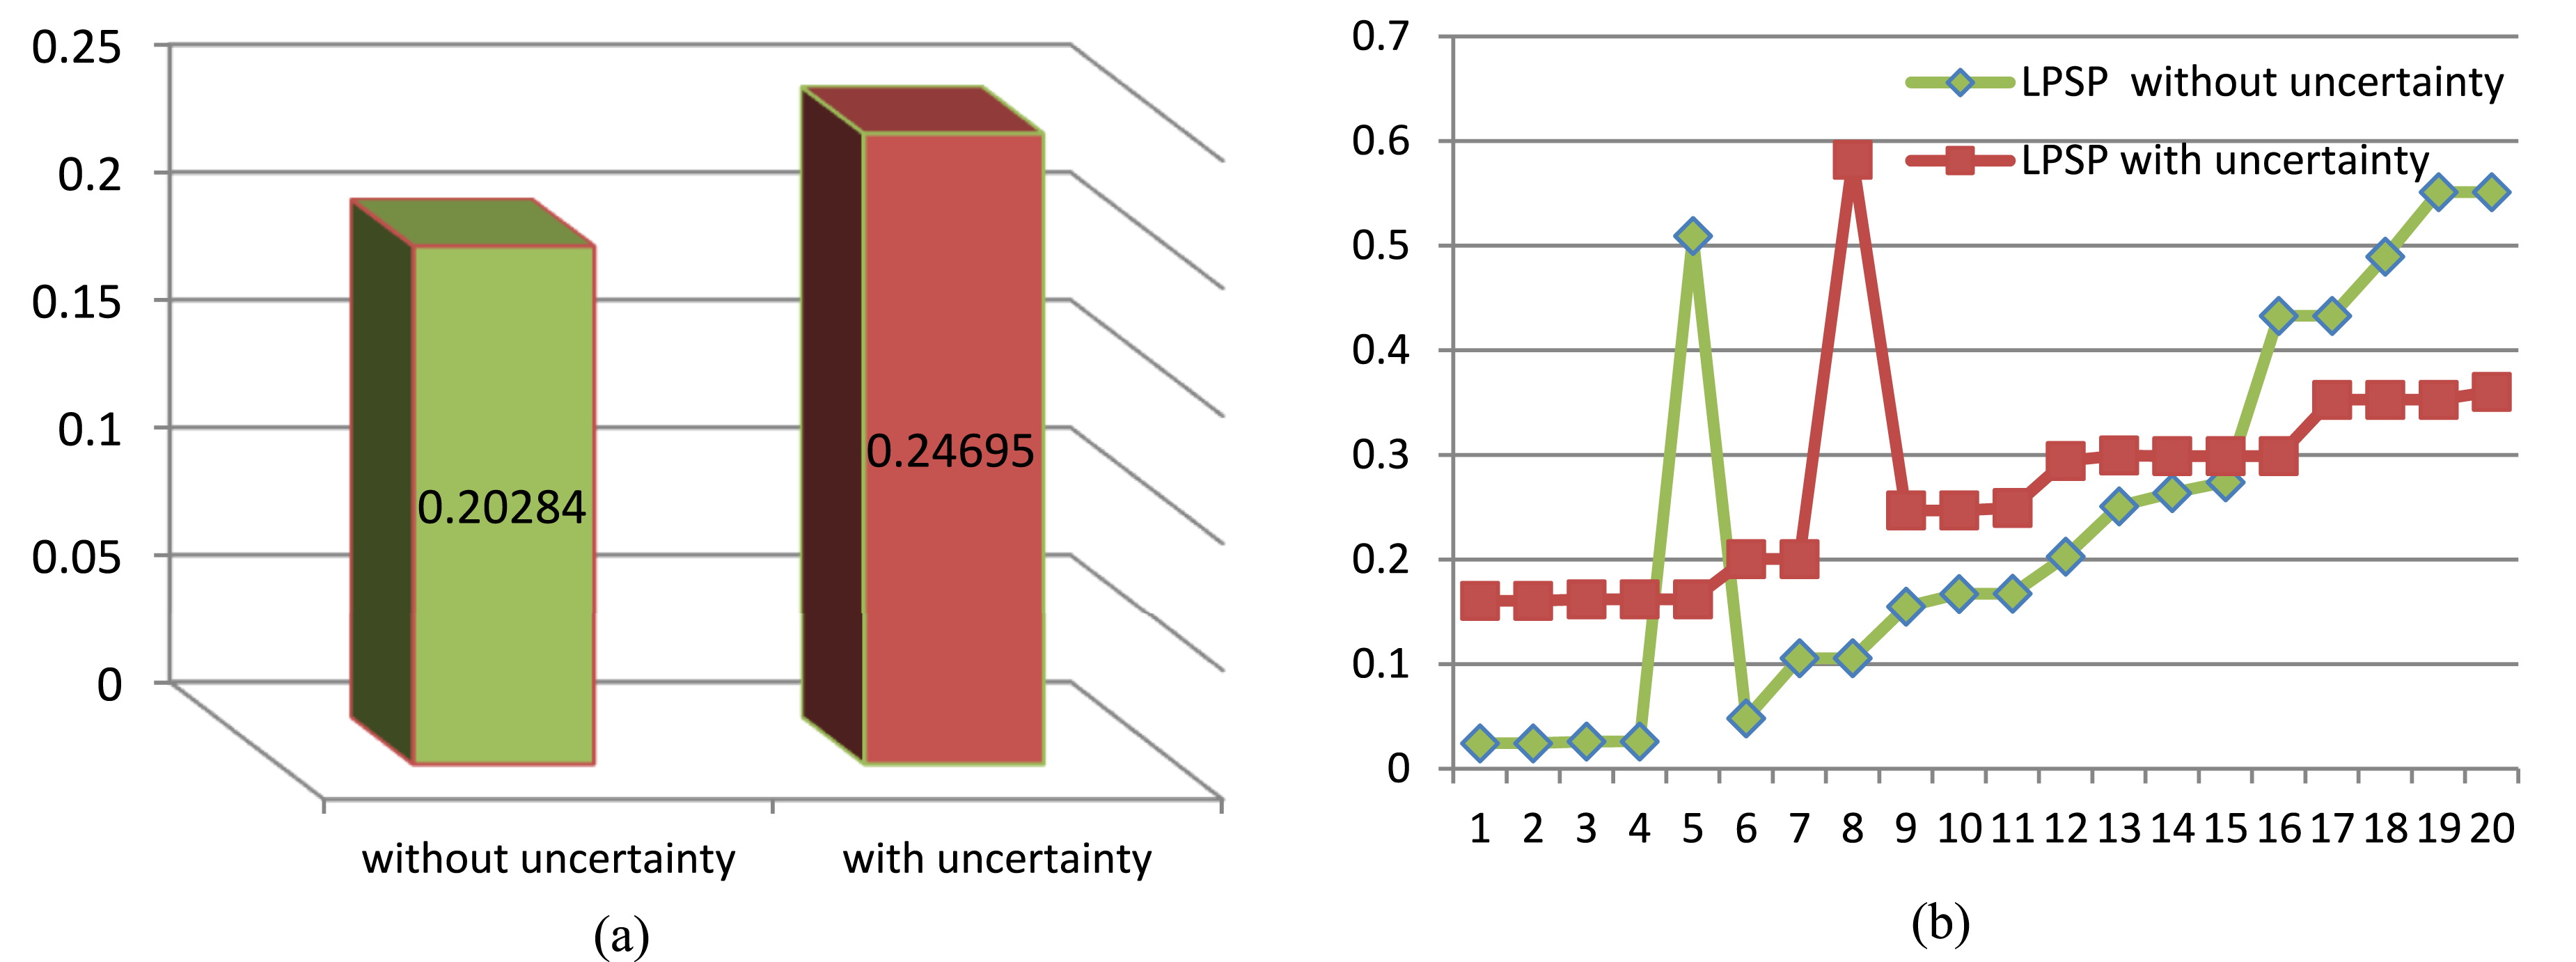
Results comparison of different configurations
The economic, technical, and environmental outcomes derived from the suggested problem model are presented in this section of the article. The following three case studies are looked at: - - -
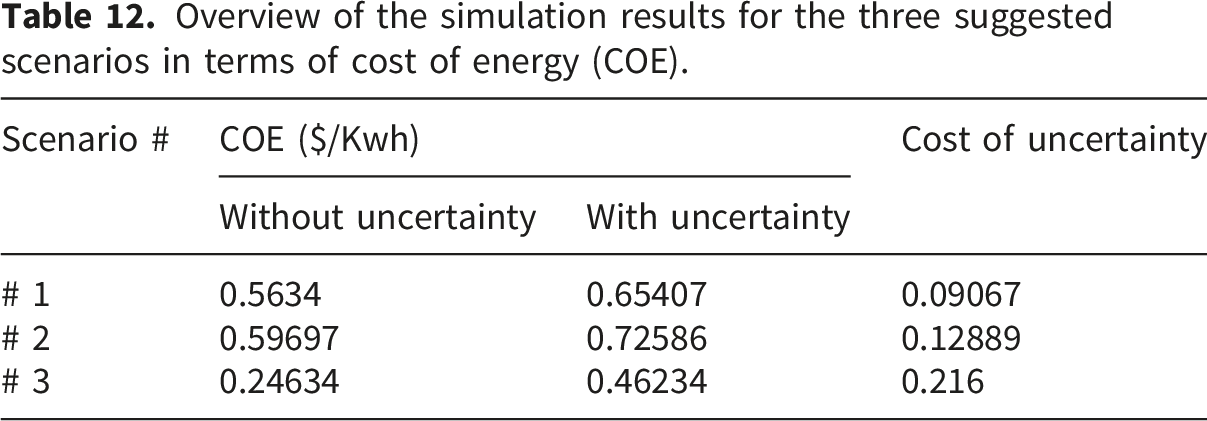
Overview of the simulation results for the three suggested scenarios in terms of cost of energy (COE).
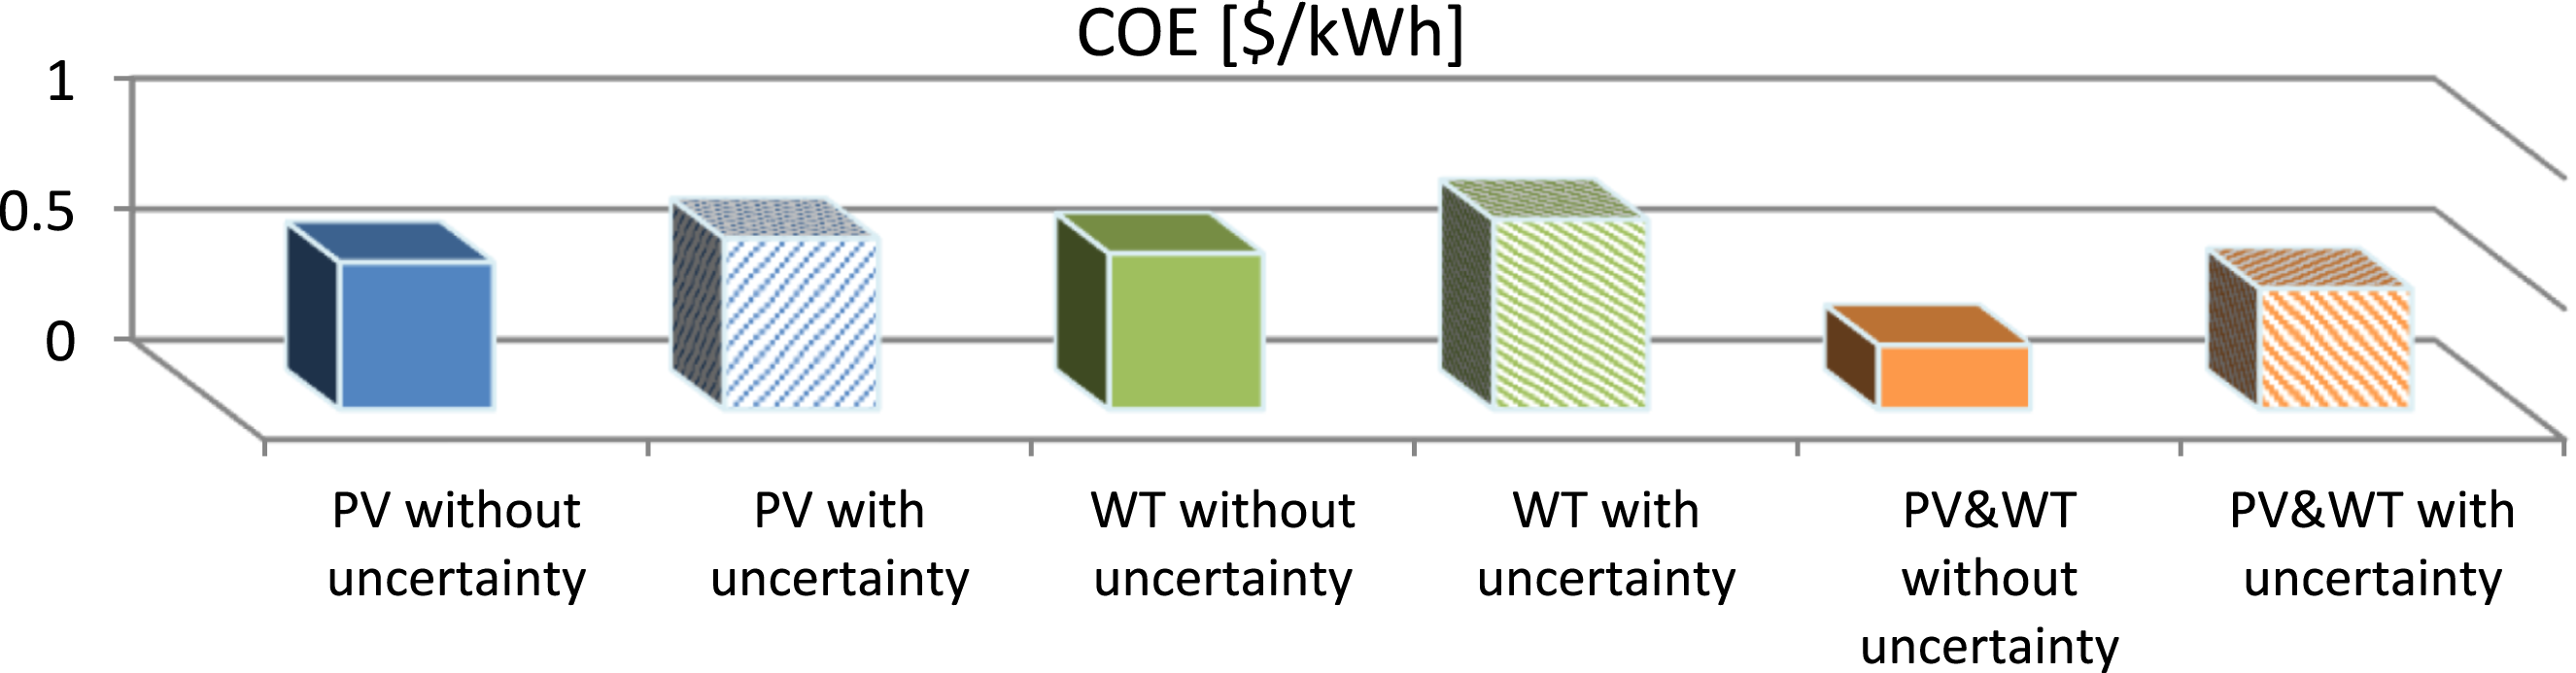
The COE variations for the three suggested scenarios.
It is mentioned how much the hybrid islanded system’s objective function or planning cost would be if the uncertainties were modeled or not. The deterministic model accounts for the circumstances in which uncertainty modeling is not taken into consideration. However, uncertainty modeling is taken into account in stochastic optimization. Table 10 shows that in every study scenario, the planning cost for stochastic modeling is more than that for deterministic modeling. This situation results from taking stochastic optimization’s uncertainty modeling into account. Stated differently, there is a chance that in a given scenario, the load will be more than anticipated while the amount of power generated by renewable resources would be less than anticipated. As a result, there are more sources and storage devices than in the deterministic model. As a result, the cost of planning in stochastic modeling goes up.
The cost of uncertainty modeling, which is equivalent to the difference in planning costs between two deterministic and stochastic models, is shown in the final column of Table 10. According to this table, scenario 2 has the lowest uncertainty modeling cost, whereas scenario 3 has the most. Only PVs, which are off during the majority of the day, are used in scenario 2. Therefore, PV does not create ambiguity throughout the majority of hours. Renewable resources create uncertainty in scenario 3 at all hours, and there are more uncertainties in this scenario than in scenario 2. Thus, scenario 3 has the highest modeling uncertainty cost. Naturally, this expense is equivalent to the cost of gaining access to the islanded system’s trustworthy planning.
Environmental impact
Summary of the 3 recommended scenarios’ simulation results based ON CO2 results.
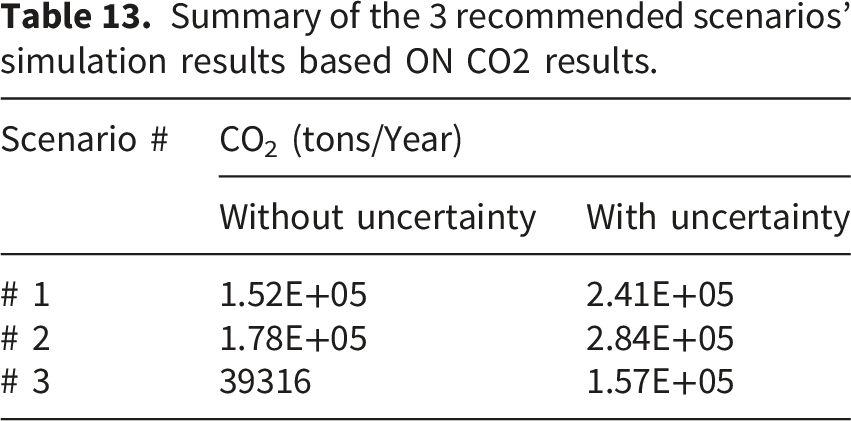
The three suggested systems (PV/DG/Bat, WT/DG/Bat, and PV/WT/DG/Bat) at Shlateen locations have their CO2 emission levels shown in Figure 34. Both the first hybrid system (PV/DG/Bat) and the second (WT/DG/Bat) exhibit notable carbon dioxide emissions each year. Notably, because the generator uses more diesel fuel, the second optimized system has more CO2 emissions than the first. The third scenario (PV/WT/DG/Bat), on the other hand, produces minimal carbon dioxide emissions because it only uses solar panels, wind turbines, and diesel generators. The CO2 variations for the three suggested scenarios.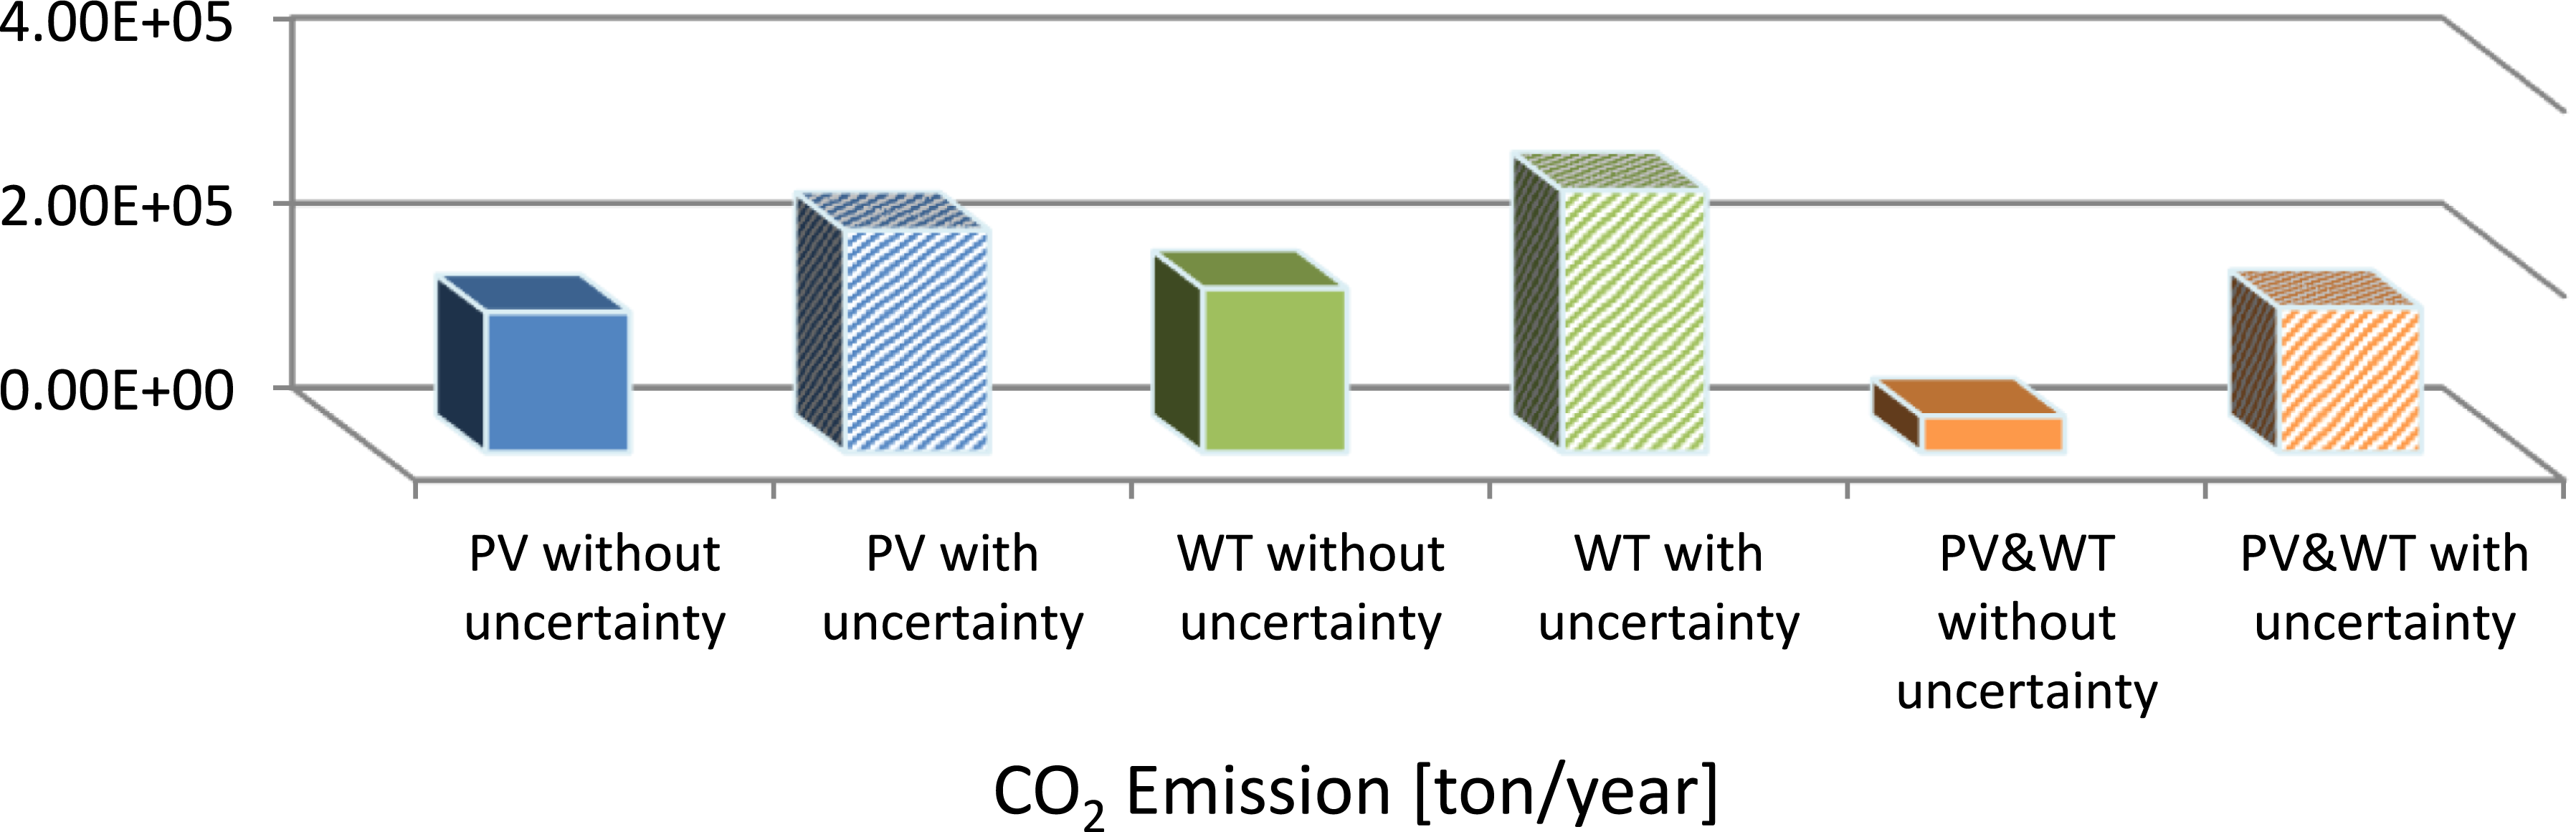
In other words, the third PV/WT/BESU/DG arrangement provides the lowest emissions of CO2. 39316 tons of CO2 emissions per year are the results of the suggested algorithm. The second WT/BESU/DG arrangement, The research showed that this configuration’s maximum CO2 consumption was caused by an increase in electricity generation from non-renewable power sources (DG). 178280 tons of CO2 emissions per year are the results of the suggested algorithm.
Summary of 3 proposed scenarios’ LPSP based simulation results.
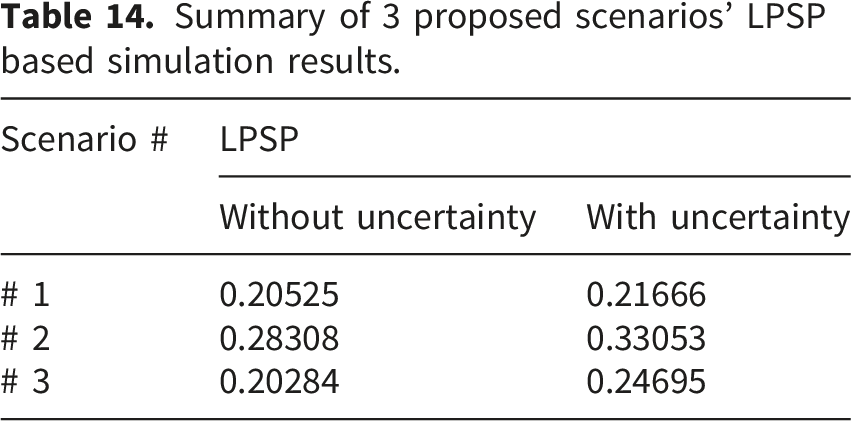
The fact that scenario 3 has the lowest LPSP in Figure 35 while scenario 1 is not far behind indicates that scenario 3 offers a system that is almost as dependable but more cost-effective. Scenario 3 is the recommended choice since it offers a better cost-reliability ratio. The LPSP variations for the three suggested scenarios.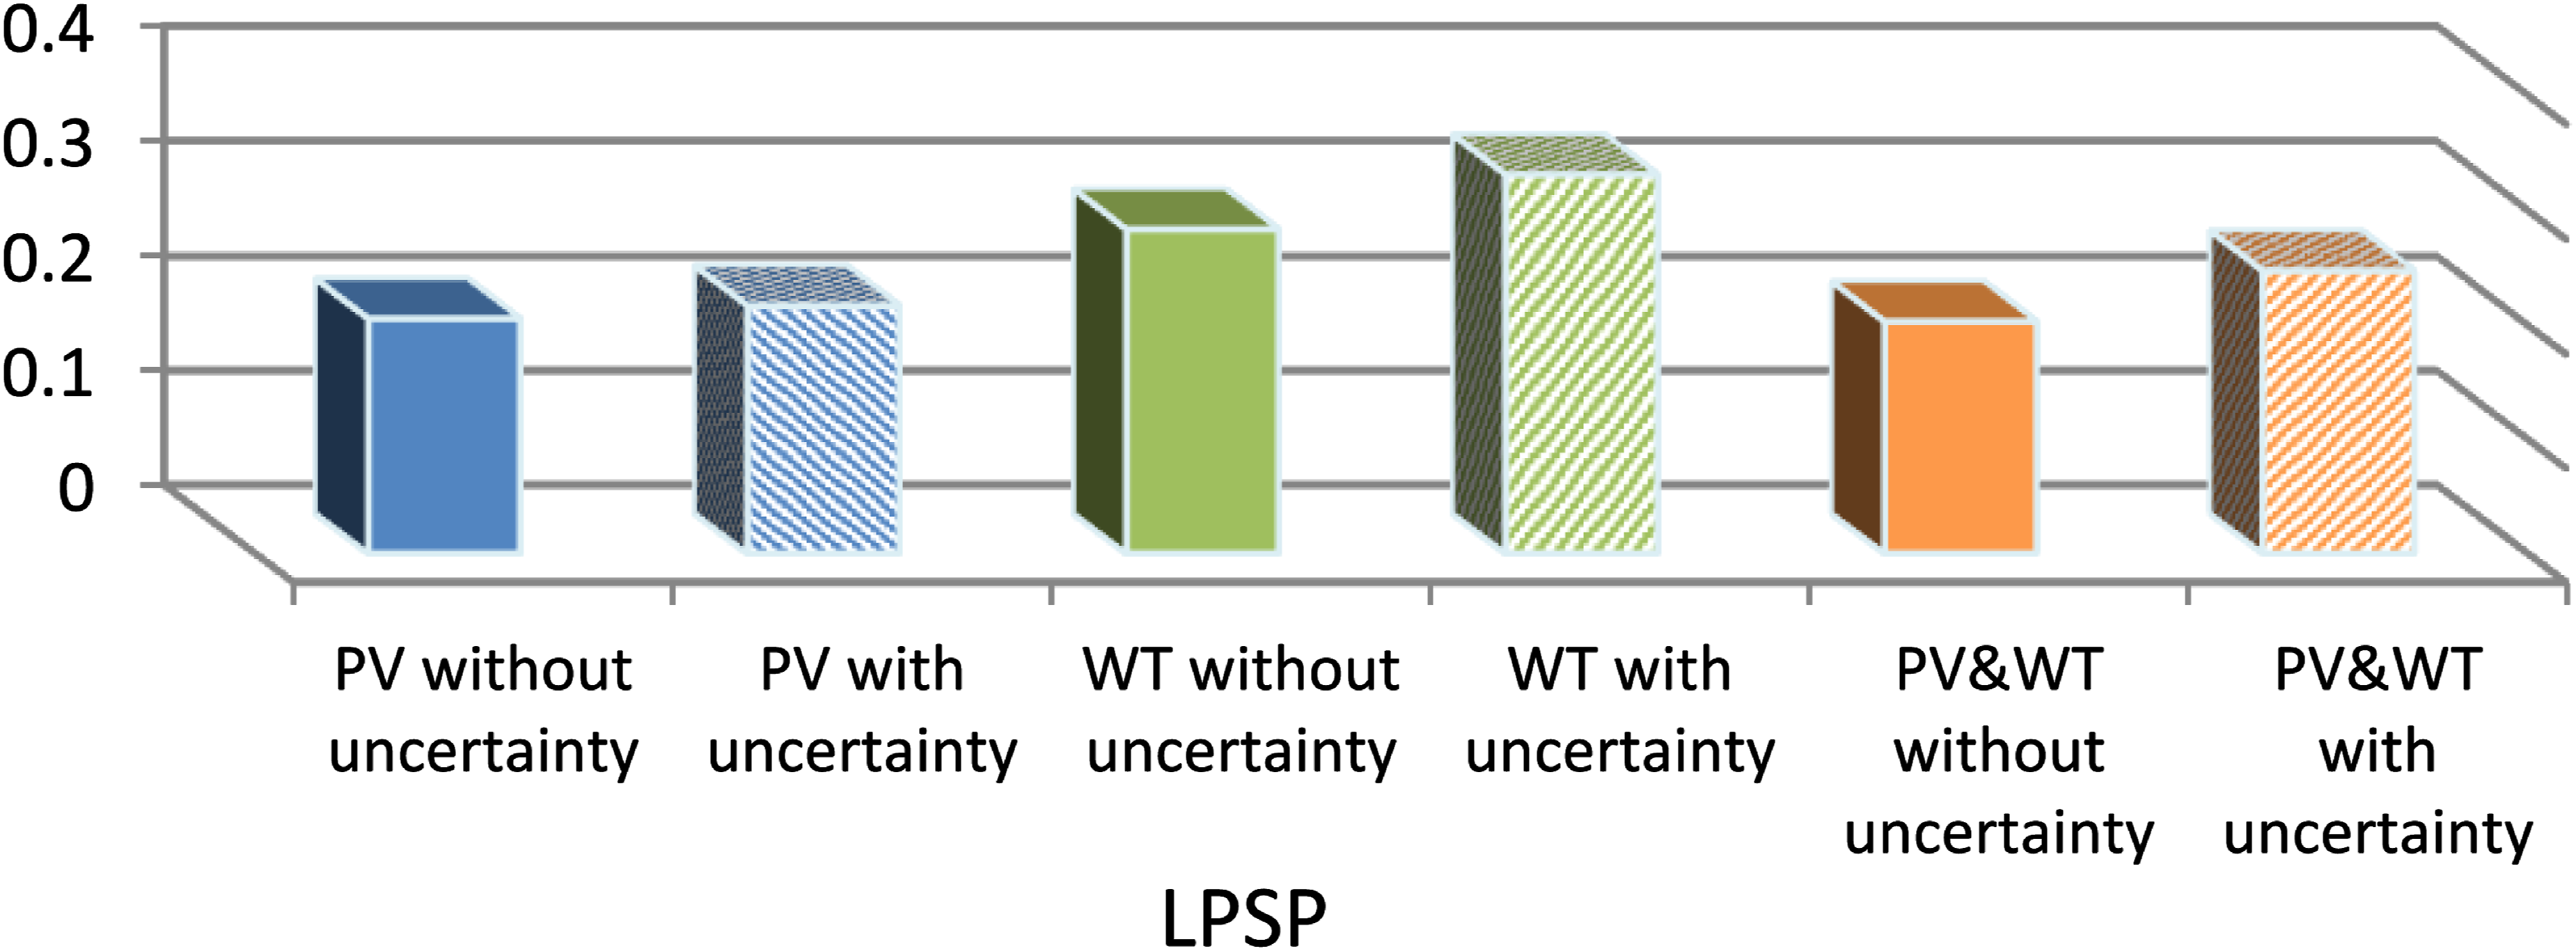
Conclusion
Hybrid renewable energy systems (HRES), which mix renewable and non-renewable energy sources, have become particularly important for rural electrification where uninterrupted supply is essential. This study assessed the feasibility and effectiveness of implementing such a system in Shalateen, a remote region of Egypt, by analyzing its technical, economic, and environmental performance. Three microgrid configurations are considered: PV/BESS/DG, WT/BESS/DG, and PV/WT/BESS/DG. The optimization framework is designed to address uncertainty in renewable resource availability, with the primary objectives of minimizing the cost of energy (COE), the loss of power supply probability (LPSP), and carbon dioxide emissions. Decision variables include the number of photovoltaic panels, wind turbines, diesel generators, and battery autonomy days, while reliability is assessed using LPSP. A new optimization algorithm combined with a management strategy is used to determine the optimal component sizing and power flow.
The results indicate clear trade-offs between cost, reliability, and emissions across the three scenarios. In the PV/DG/BESS configuration, the optimal PV capacity increases from 34.062 kW under deterministic planning to 45 kW under stochastic conditions, with LPSP rising by 5.55% and COE increasing by 16% (from $0.5634/kWh to $0.65407/kWh). This system achieves the lowest CO2 emissions at 1.5227×10⁵ tons/year, though in some cases emissions rise to 2.4125×10⁵ tons/year. In the WT/DG/BESS configuration, wind turbine contributions increase significantly under uncertainty (from 6 to 21 units), but DG dependence also rises, especially at medium and low load levels. This leads to reduced reliability, with LPSP values ranging from 28.308% without uncertainty to 33.053% with uncertainty, alongside a 21.5% increase in overall costs. While case 3 of this scenario yields relatively lower CO2 emissions (1.7828×10⁵ tons/year), it is less economically viable compared to other configurations. The PV/WT/DG/BESS configuration demonstrates the strongest performance considering reliability and emissions reduction. It attains the lowest COE at $0.24634/kWh in case 5, while case 6 exhibits significantly higher costs at $0.46234/kWh due to the influence of uncertainty. Emissions in case 5 are minimal, but in case 6 they rise to three times the reference system. Reliability is highest in this configuration, with LPSP values decreasing to 20.284%, compared to 24.695% in case 6.
Overall, the findings suggest that the PV/WT/DG/BESS system offers the most balanced solution, combining low emissions with high reliability, while the PV/DG/BESS system remains the most cost-effective option. The WT/DG/BESS system provides environmental benefits but suffers from poor reliability and higher costs when uncertainty is considered. The annual CO2 emissions of the three arrangements are approximately 1.52×10⁵, 1.78×10⁵, and 3.93×10⁴ tons/year, respectively. Despite promising results, the methodology depends heavily on the accuracy of input data such as load profiles, wind speed, and solar irradiance. Data limitations can negatively impact optimization outcomes and system dependability. Future work should therefore focus on integrating advanced energy management strategies, incorporating additional renewable sources such as biomass, and assessing the long-term implications of climate change on system operation and design.
Footnotes
Acknowledgement
The researchers would like to thank the Deanship of Graduate Studies and Scientific Research at Qassim University for financial support (QU-APC-2026).
Funding
The authors disclosed receipt of the following financial support for the research, authorship, and/or publication of this article: This work was supported by the Qassim University.
Declaration of conflicting interests
The authors declared no potential conflicts of interest with respect to the research, authorship, and/or publication of this article.