
Abstract
The share of renewable energy based power system (REP) are increasing gradually. The changes caused by these sources are becoming a major obstacle to grid operation. So, the economic and technological optimization of REP becomes inevitable. This paper propose an energy management system of hybrid micro grid system (HMS) considering the actual climate and demand data of Yanbu, Saudi Arabia to meet the city’s load demand. HMS consists of different renewable energy resources (RES) which are wind turbines (WT), solar photovoltaic (PV), and batteries as a storage devices. The network performance is studied in the presence of some uncertainties related to RES and load to get closer to real model. The suggested stand-alone PV/WT/battery hybrid system was optimized and analyzed in this work using the multi-objective water cycle algorithm (MOWCA) considering the loss of power supply probability (LPSP) and the cost of electricity (COE). The point estimate method is utilized for modeling the solar and wind power uncertainties. Nine case studies are examined using three distinct scenarios, which include the impact of load and uncertainty resulting from RES, as well as varying numbers of homes (5 and 15 houses). The recommended method consistently yielded a collection of solutions that constituted a Pareto front (PF). The designer might choose the best compromise option from the PF by taking into account a number of factors. Optimizing the size of HMS components, supplying all loads at the lowest possible energy cost with the highest level of dependability is achieved by MOWCA. The obtained results are then compared with those achieved by multi-objective particle swarm optimization (MOPSO). Their ideal number of component units, LPSP, and COE are better than the others, and the accepted MOWCA is more robust than the other method since it has the lowest variation.
Keywords
Introduction
Nowadays, fossil fuels produce the majority of the world electricity. The main disadvantages of these resources are their rapid depletion rates and the harmful effects that burning has on the environment. Due to growing consumption of fossil fuels, finding other energy sources are vital to keep up with demand. RESs (RESs) can be produced using different types of energy resources, such as biomass, wind, solar, tidal, and other non-polluting, sustainable alternatives. RES have the potential to overtake other forms of electricity generation units in the near future due to their longevity and lack of pollution.1–7
Modern, decentralized, bidirectional micro-grids MGS that are sustainable and modern are the result of recent advancements in electric grid technology. The MGS are capable of supporting energy management systems, REP, energy storage, and power electronic converters. While typical power systems have high fuel and operating costs, the MG system is less expensive and produces less CO2. 8
Combining wind and solar energy which are the most accessible and important renewable resources produces a more dependable and higher quality hybrid system compared to any one of them separately. Actually, solar and wind power are the main energy sources in a hybrid energy system. To increase efficiency and get rid of problems, different DGs could be included in HMS such as diesel generator, fuel cells and energy storage systems. In fact, including storage devices becomes crucial when solar radiation or wind speed drops below standard operating points or when demand exceed peak point. 9
Every community needs access to a steady supply of energy since it raises living standards through bettering healthcare, education, and the local economy as a whole. When determining if a micro-grid system is appropriate, two important elements should be considered: the system’s cost-effectiveness and service quality. A key challenge in creating hybrid systems is finding the ideal equilibrium between cost and reliability. 10
The high cost of renewable energy technologies has caused several nations to adopt them slowly. Therefore, it is essential to optimize the system size and available resources to minimize costs and surplus energy production. The sizing of the hybrid system must meet LPSP, which assesses the system’s capability to fulfill the load requirements. The system’s cost must be considered to identify the system with the smallest cost once the lowest configurations have been identified. 11
Hybrid systems are classified into two types: grid-connected systems, which is not considered in this study, and stand-alone systems. In stand-alone systems, wind turbines units and PV panels are the main source of power.12–14 However, in order to get around the stochastic nature of solar and wind energy, diesel generators and storage devices are also employed.15,16 The system’s components are efficiently linked by an AC network, allowing generation components to be installed anywhere on the site and facilitating easy system expansion.17,18
Off-grid or independent hybrid power systems are the more promising forms of renewable energy. To improve reliability of the system that cannot be assured with just one RES, this system combines numerous RESs. The combination of different energy sources, such as wind, PV, battery, super capacitor, and fuel cell, are more effective. Multiple energy sources can create higher quality power and slow down rapid changes in output power. 19 Since stand-alone systems can be utilized for isolated power generation, they appear promising in the near future. Due to its cost-effectiveness and efficiency, hybrid power system could be beneficial for many isolated areas, for road signage and small lighting. 11
Researchers are paying significant attention to enhance economic and technological performance of hybrid energy sources, for both stand alone and grid-connected applications. When hybrid energy sources are integrated, the system performs better and is more cost-effective than when PV or wind energy systems are integrated separately. 20
Uncertainty in their behavior is one of the primary drawbacks in managing solar and wind based power systems. The gap between the predicted and real values is known as uncertainty. 21 OPF must therefore considering the intrinsic uncertainty of wind speed and solar radiation in order to provide a practical solution.
Literature state of the art
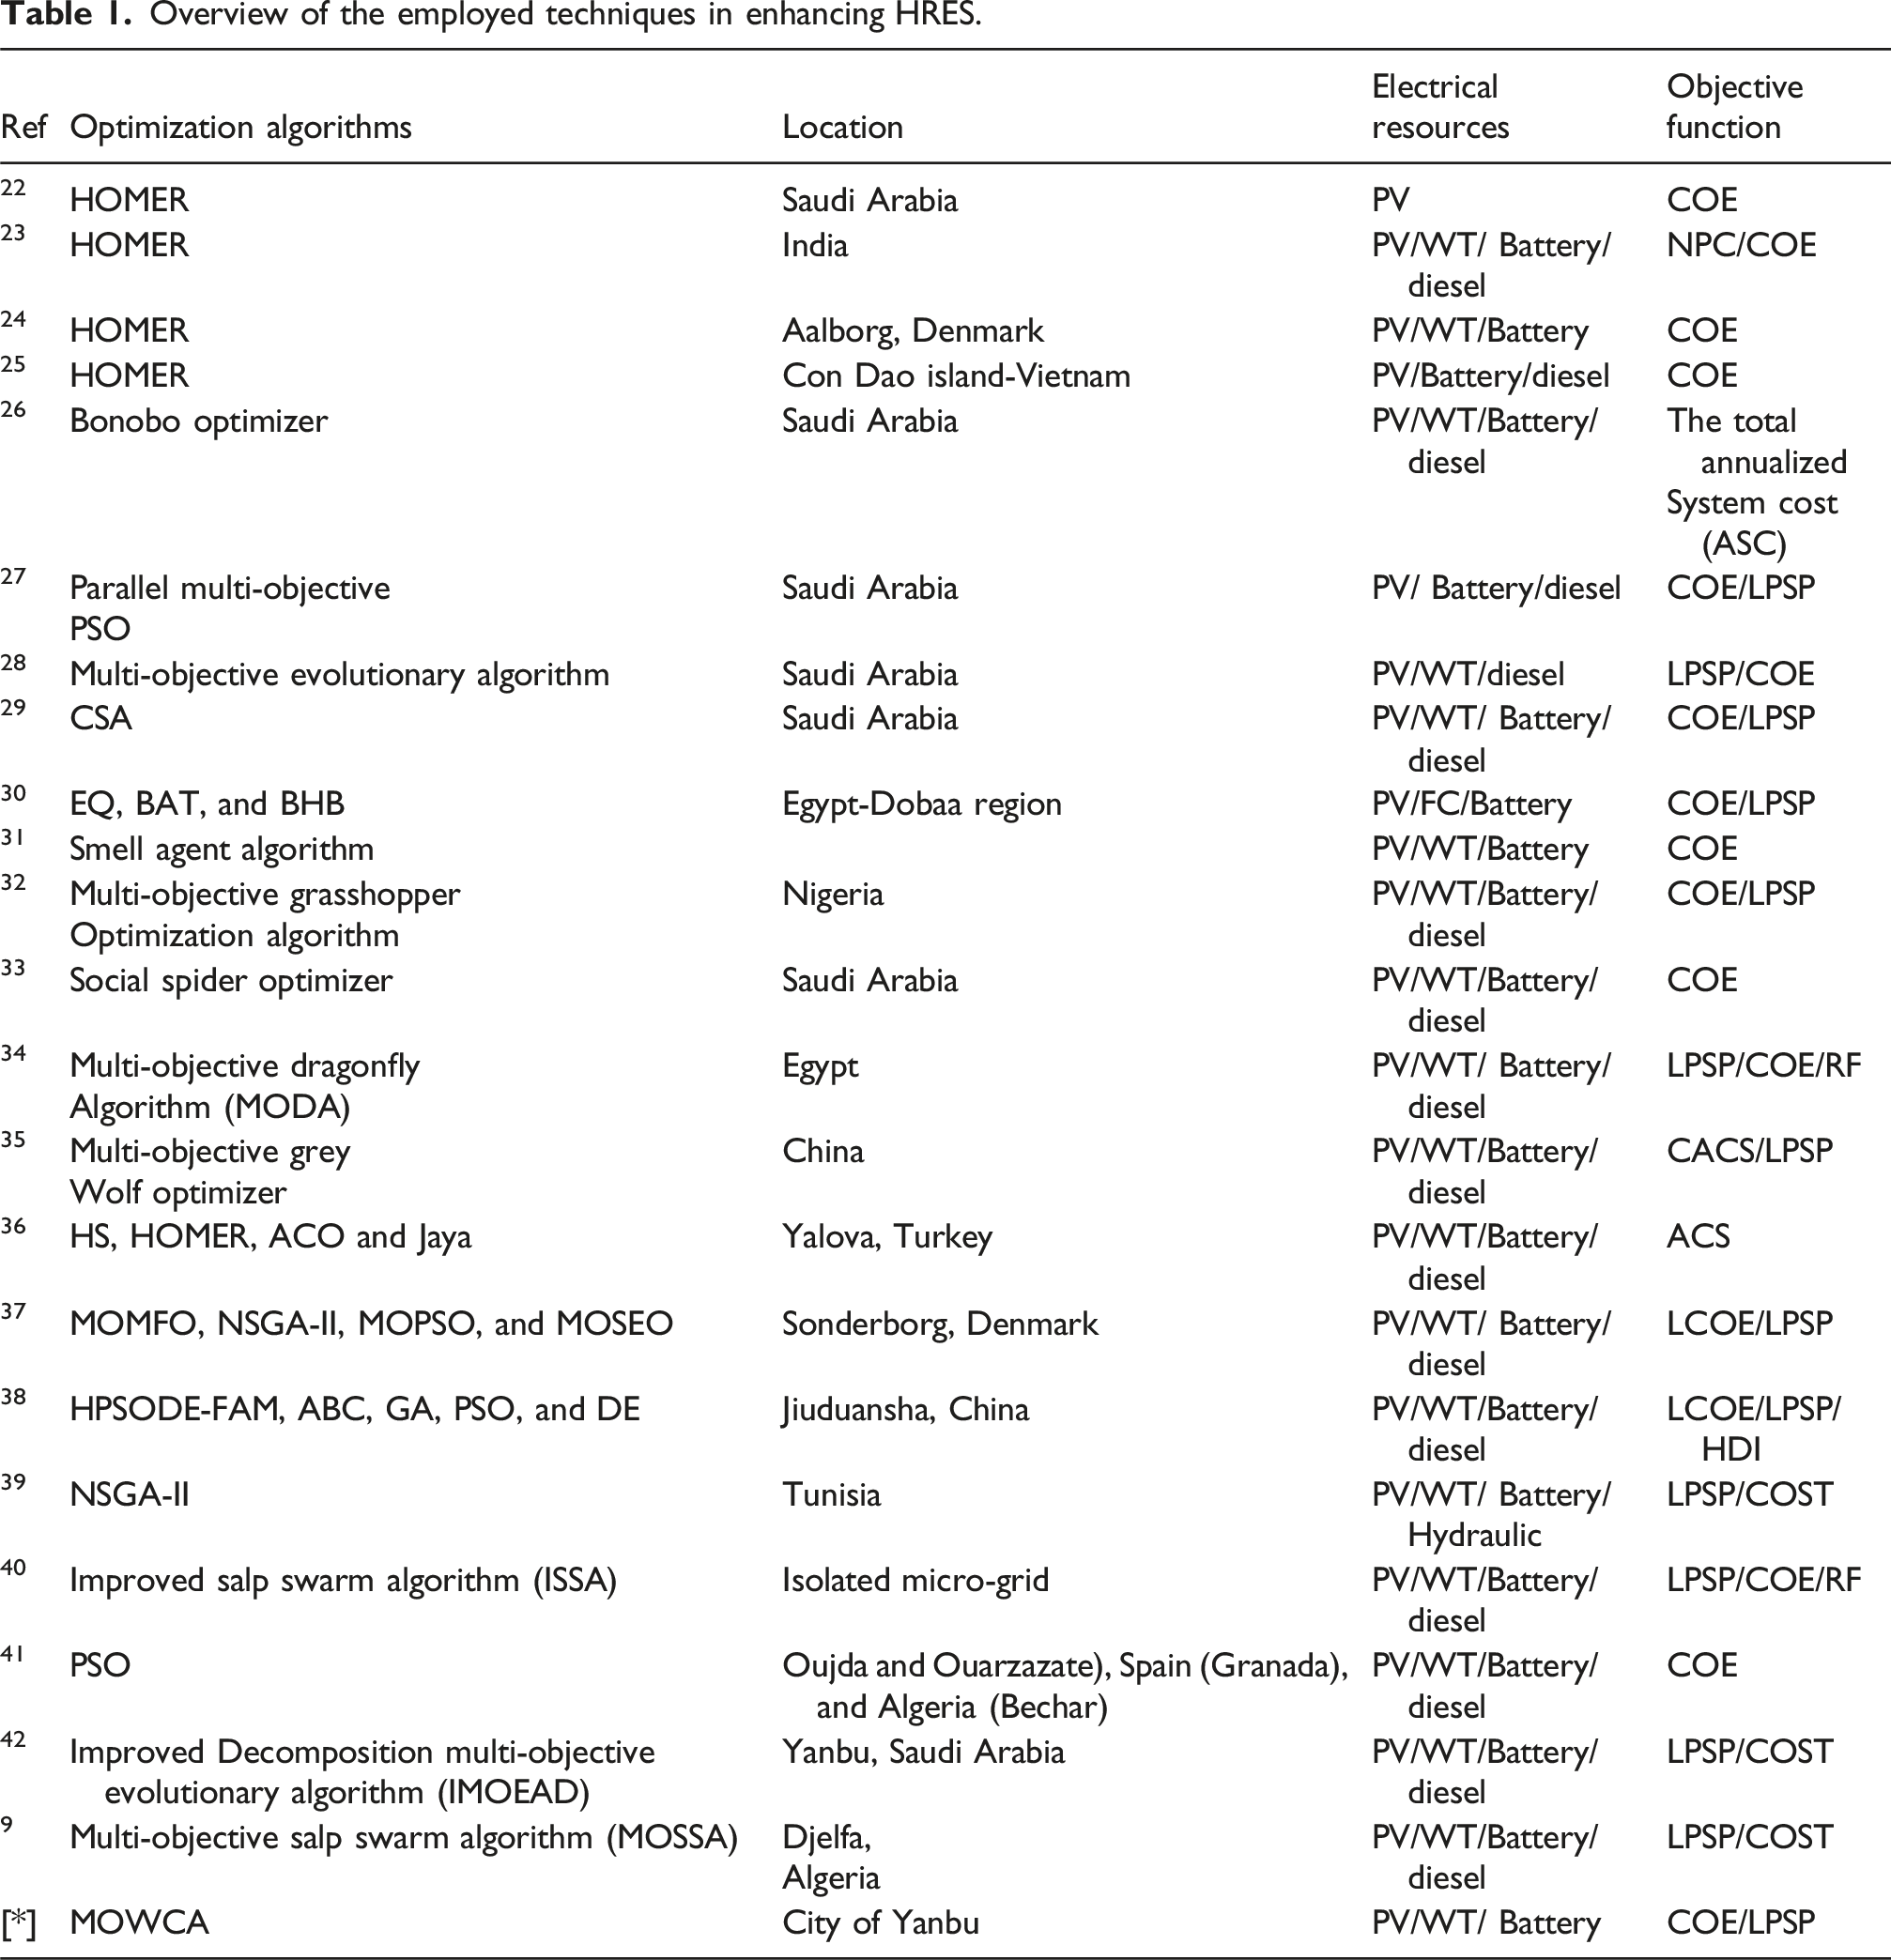
In the area of hybrid micro-grid system sizing, numerous studies have been published. Earlier approaches to sizing can be divided into various groups. 9 The first category, which includes software tools like HOMER, was used to optimize micro-grid systems.22–25 Meta heuristic algorithms for micro-grid problems fall under the second category; many of these algorithms have been used in the literature to address optimization issues, In order to ascertain the ideal sizing of an HRES-integrated micro-grid, the authors in Ref. 26 introduced the Bonobo Optimizer. The total annualized system cost serves as the fitness function for this group, which includes PV, WT, battery, and DG in Saudi Arabia.
The authors in Ref. 27 have applied the parallel multi-objective PSO to optimize the size of MGS based on LPSP and COE as objective functions in Saudi Arabia. The best system configuration with diesel, PV, and batteries has been investigated. In Ref. 28, the authors have used multi-objective evolutionary algorithm to present the best design for an off-grid HRES in Saudi Arabia that incorporates diesel, WT, and PV. This latter study has been applied to the analysis of COE and LPSP. Levelized Loss of Power Supply Probability (LPSP) and Cost of Energy (LCOE) are two Indonesian objective that have been taken into consideration when optimizing a hybrid power generation system on the CSA that consists of diesel, PV systems, WT, and battery energy storage (BES). 29
A hybrid optimization method that incorporates three algorithms (EQ, BAT, and BHB) was developed in Ref. 30 to optimize size of a stand-alone hybrid system comprising solar, fuel cell energy system, and battery. This technique is currently in use in the Egypt-Dobaa region. In Ref. 31, the Smell Agent Algorithm was presented, addressing COE as a single goal for an HMS system that included battery energy storage, WT, and PV systems. In additional locations, the authors of Ref. 32 suggested a multi-objective problem formulation to use the Multi-objective Grasshopper Optimization Algorithm to solve the optimization task. In Nigeria, LPSP and COE have been analyzed using this latter study. In order to best design an HMS while taking load uncertainty into account, another study introduced the Social Spider Optimizer. 33
To meet load demand in Saudi Arabia, an HMS system that combined a diesel generator, batteries, solar, and wind was implemented, with COE as its sole goal. HMS system consisting of three power sources wind, PV, diesel generator, and battery was introduced in Ref. 34 to meet the load requirement in Shlateen, Egypt. Two scenarios have been studied, wind/PV/battery is the first, and wind/PV/battery/diesel is the second. Three objective functions, LPSP, COE, and RF based on MODA have been considered. In Ref. 35, the Multi-objective Grey Wolf algorithm has been used to optimize a hybrid photovoltaic, wind turbine, diesel, and battery micro-grid system that was installed in China.
Overview of the employed techniques in enhancing HRES.
This article presents MOWCA, which has been applied to optimize three variables, the number of wind turbines, the output power of photovoltaic, and days of autonomy for battery. MOWCA has been used considering two objective functions reducing LPSP and COE. Nine cases studies are examined using three distinct scenarios, which include the impact of load and uncertainty producing from RES, as well as varying numbers of homes (5 and 15 houses).
Article contribution and organization
The contributions of this study could be summarized in the following points: (i) This analysis suggests the ideal size for Yanbu, Saudi Arabia’s energy management MGS considering RES and storage system. (ii) Multi-objective optimization techniques have been proposed for problem formulation. (iii) The economic and technical benefits are increased and covered. (iv) Integration of different type of RES units such as PV, and WT units with optimum size, and location is provided. (v) Optimizing locations of RES has been obtained under different load levels (N = 5, and N = 15). (vi) The model of a hybrid power generation system that uses batteries, WT, and PV is discussed. (vii) Robust planning is achieved based on deterministic and probabilistic planning including renewable energy system and load uncertainty. (viii) A comparison between deterministic and probabilistic planning is done. (ix) MOWCA has been presented; the least LPSP and LCOE can be achieved by using this approach to identify the system’s ideal component sizes (WT, PV with Battery). (x) The MOWCA cost and losses analysis results have been compared to the MOPSO method to find the most cost and losses-effective one. (xi) Two crucial features (variability and uncertainty) of RES and load uncertainty have been included in the study to assess its impact on the complete design.
This is how the remainder of the paper is structured: The problem is explained in full in Section. The HMS's mathematical model is presented in Section Mathematical model of Hybrid Micro Grid system. Section Proposed Method presents the mathematical model of the suggested approach. The uncertainties model is presented in section Uncertainty Modeling. The simulation results for the proposed method are provided in section Simulation results based on MOWCA.
Problem formulation
This work aims to minimize COE and LPSP in order to achieve both technical and financial benefits. Objective function-related mathematical representations have been modeled as follows.
1 cost of electricity (COE) of the HMS
The first objective will be discussed in this article is COE; it is a crucial element to take into account when planning. Electricity costs include unique capital, operating, and maintenance costs. The following calculation defines it as the price per unit of energy produced by the HMS ($/kWh).40,43

The real interest rate could be formulated by equation (3):
The total NPC could be formulated by equation (4):
The sum of the expenses of each MS component determines the investment cost, also known as the initial capital cost. Equation (5) is used to calculate investment cost:
All system components’ operation and maintenance costs have been calculated using their total expenses over a 12-month period. These expenses are determined by the interest rate and the system’s lifespan. It could be formulated as follows:
The MS component replacement cost can be computed using the formula below:


The following equation provides a detailed expression for the fuel cost (FC):
Minimization of loss of power supply probability (LPSP)
LPSP will be the second goal discussed in this research. When the micro-grid is operating in islanded mode, the probability of a power outage is high and the system reliability is low. Minimizing of LPSP is an important issue to guarantee supplying load without interruption. LPSP could be mathematically represented by equation (11)11,44:
Constraint
The components’ minimum and maximum sizes are subject to the following constraints
40
:


Mathematical model of hybrid micro grid system
System configuration
This study uses wind turbines, PV system, an inverter, and a battery bank to illustrate the HMS. Figure 1 displays an HMS schematic.40,45 DC power from solar PV modules is transformed into alternating current (AC) and passed to the AC bus bar. The AC power generated from WT is passed to the DC bus bar through AC/DC converter. In order to connect battery storage, WT units, and PV panels to the AC bus bar so that it can supply the AC loads, an inverter is utilized. Block diagram of hybrid PV/wind/battery power system.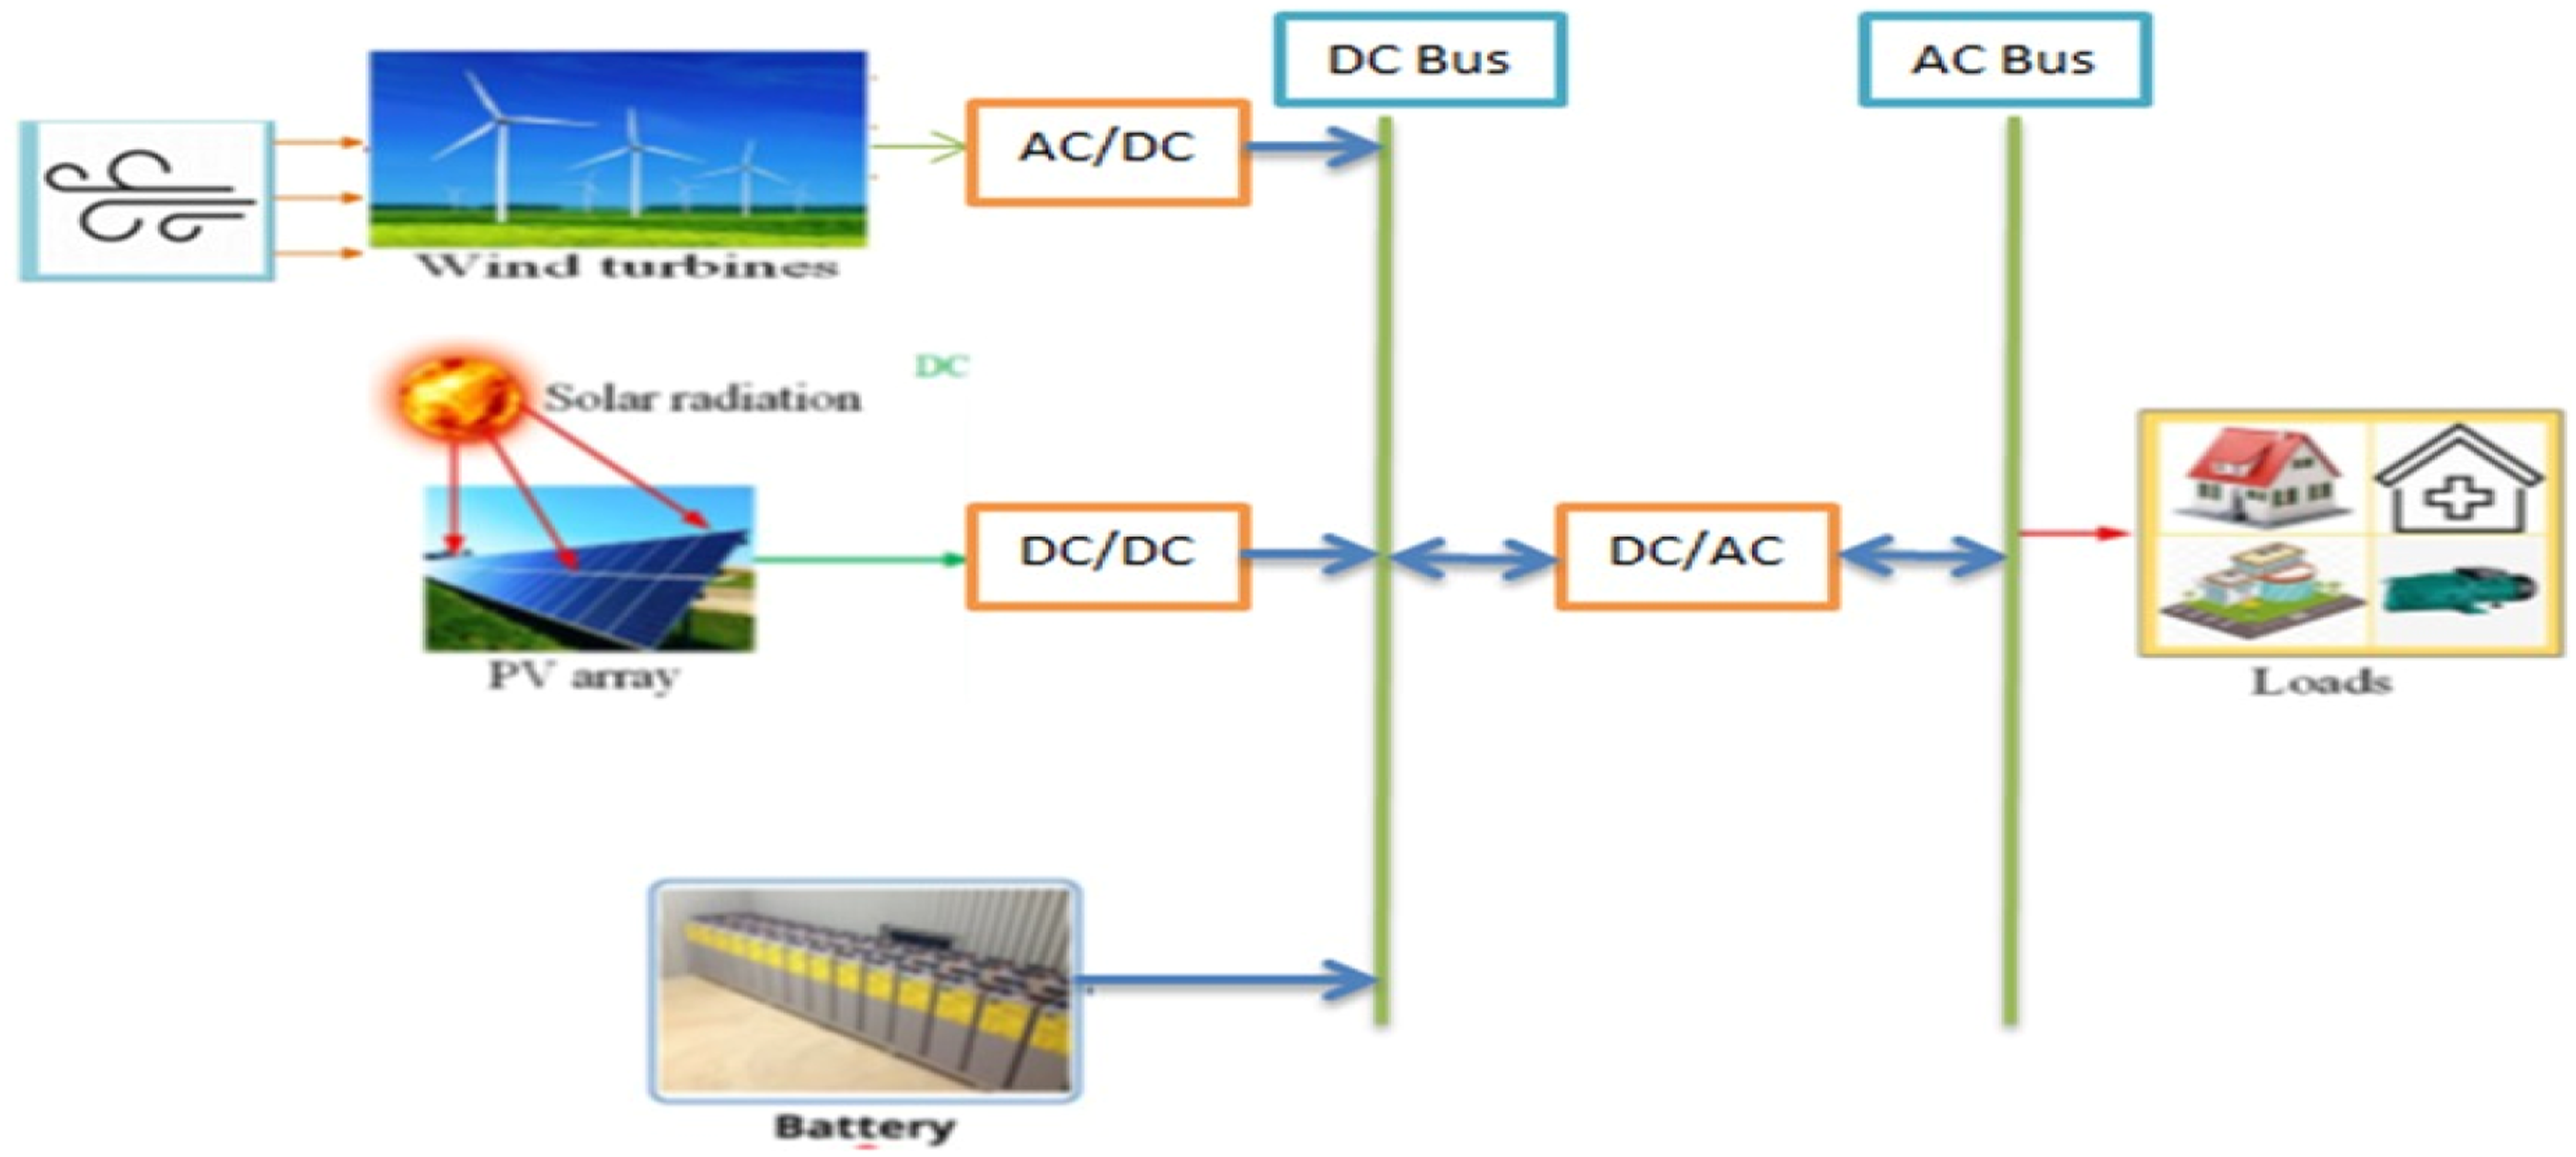
System component modeling
Photovoltaic system (PVS)
A photovoltaic generator uses sunlight to create electricity. The first power source is the solar generator, and the following formula is presented to find the PV panels’ output power40,46:
The temperature of the cell 
The following is an expression for the total power generated by a group of PV panels:
Wind energy system (WES)
The secondary source of power is the wind energy system. The wind speed varies significantly with height as shown in equation (20). The power law equation can be used to convert wind speed obtained at anemometer height to the desired hub height.40,47
The temperature, wind speed, roughness of the terrain, elevation above the ground, time of day, and season are some of the factors that determine α.
48
Various terrain types are frequently used to define it in technical literature; however, IEC standards prescribe a friction coefficient value of 0.11 for strong wind conditions and 0.20 for typical wind circumstances. A wind turbine’s anticipated power production is stated as47,49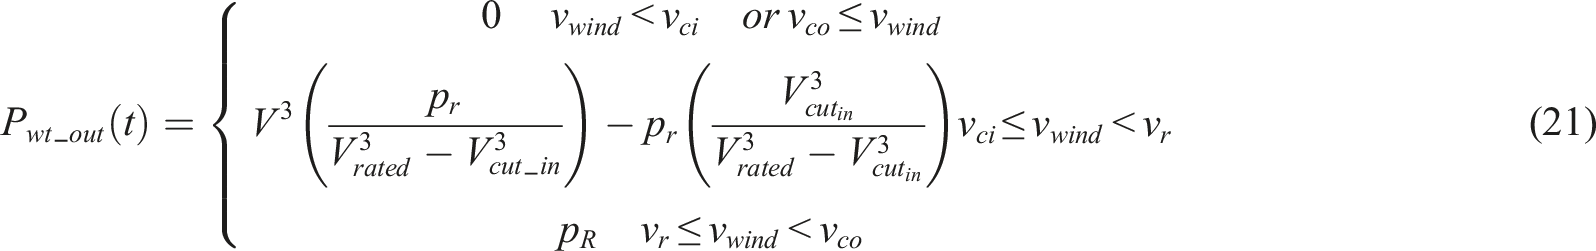
An expression for the total power produced by a set of WT is as follows:
Inverter
This is how the inverter’s rated power, 
One way to calculate the inverter’s efficiency is to


Battery
Battery energy storage system (BESU) must be incorporated into the autonomous micro grid since WT and PV sources are unpredictable. In this instance, BESU is used by HRES to store excess energy, which is then used when renewable energy is insufficient or unavailable. The following equation is presented to find the BESU’s capacity40,52:
As demonstrated below, The number of parallel connected BESU is 
Additionally, 
Finally, as shown below, the product of 
Therefore, if 
The BESU’s autonomous days are crucial and must be considered when constructing the storage system in order to prevent power shortages caused by RS (WT and PV) because intensity of solar irradiance and wind speed are unpredictable. When energy levels are too high, the surplus energy is used to charge the BESU to be used again later. The BESU’s power output can be shown using the following formula:
There is a deficit in energy generation when
One important component that affects the performance of BESU and indicates its current capacity is its state of charge (SOC). Under these circumstances, the SOC has two modes: charging and discharging. If the BESU’s power output from the RES exceeds the demand, it is in charging mode; if not, it is in discharge mode. Charging and discharging time t is calculated using the following formula: • if; • if


The BESU’s overall capacity (
Proposed method
The optimal DERs allocation problem formulated above belongs to the class of nonconvex, nonlinear, and large-scale optimization problems. To solve this problem, we need a powerful and efficient search technique. In that respect, Water Cycle Algorithm (WCA) as promising tool can be regarded to deal with such complex high-dimensional problems with enhance search qualities.
Water cycle algorithm (MOWCA)
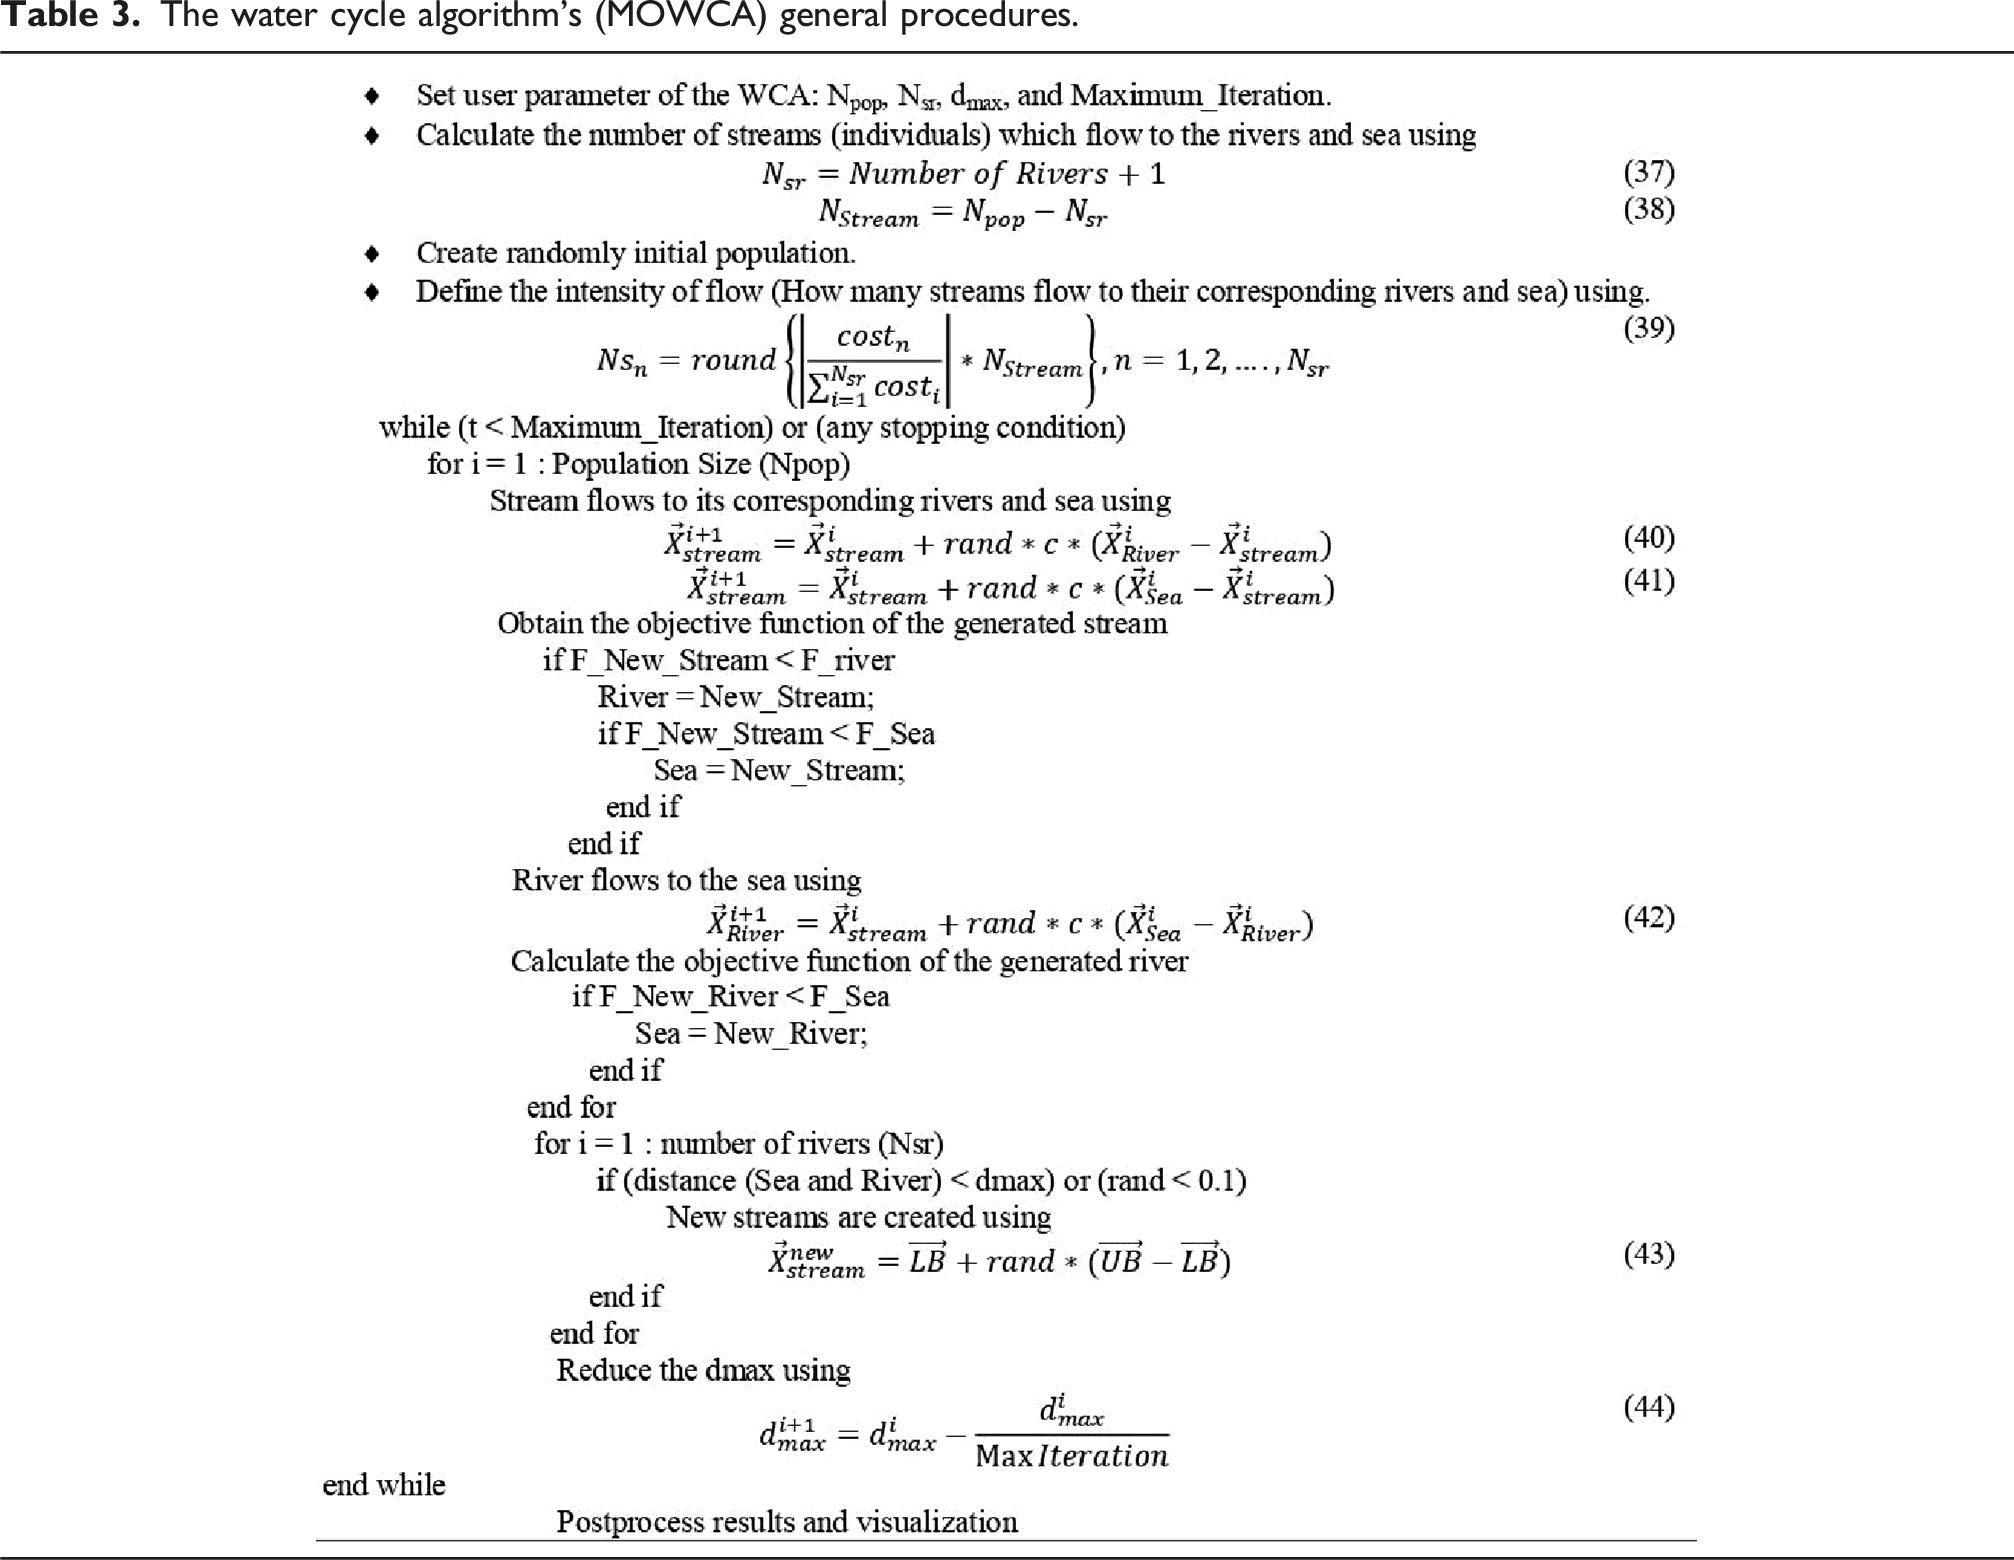
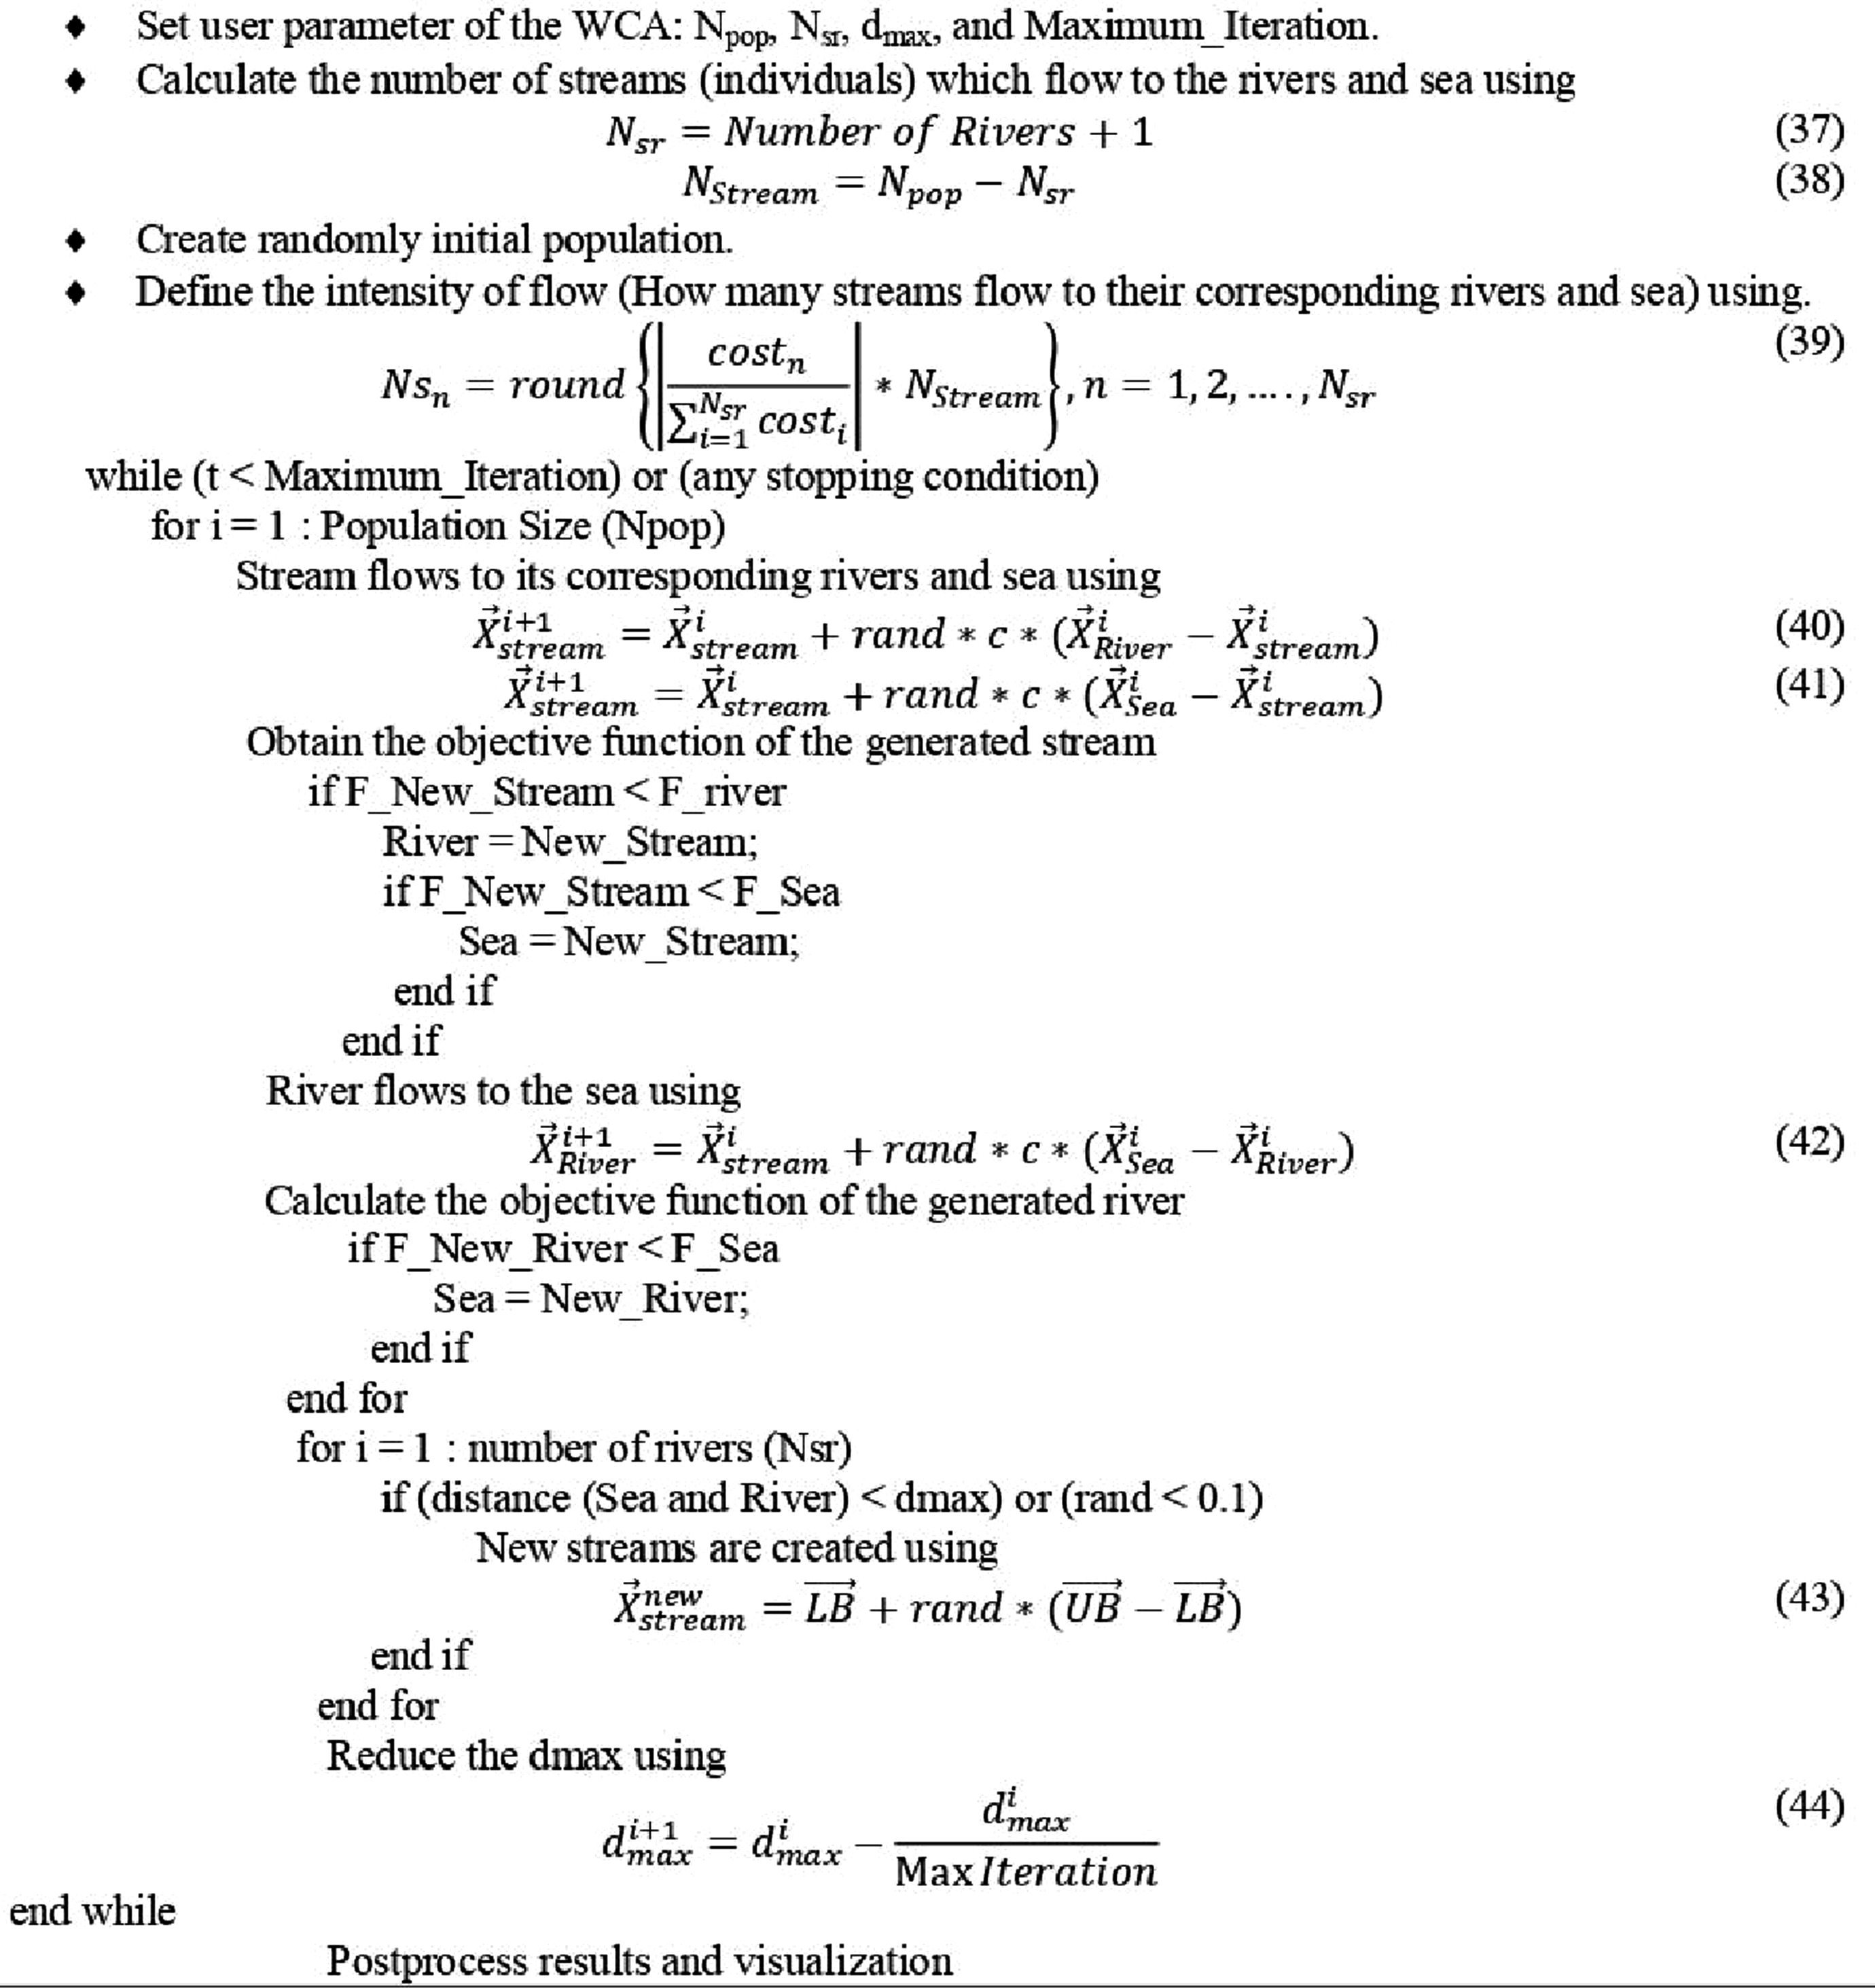
The proposed optimization method in this article is based on water cycle algorithm (WCA). The water cycle algorithm (WCA), which was developed by observing the water cycle process, simulates how rivers and streams move toward the sea. 53 Assume for the moment that precipitation or rain is occurring, following a rainstorm, a random beginning population of design variables (stream population) is created. The sea is selected as the best individual (i.e., the best stream), categorized according to having the lowest cost function. While a few good streams that is, those with cost function values near the current best record are selected as rivers, and all other streams then flow to the rivers and sea. 54
The water cycle algorithm’s (MOWCA) general procedures.
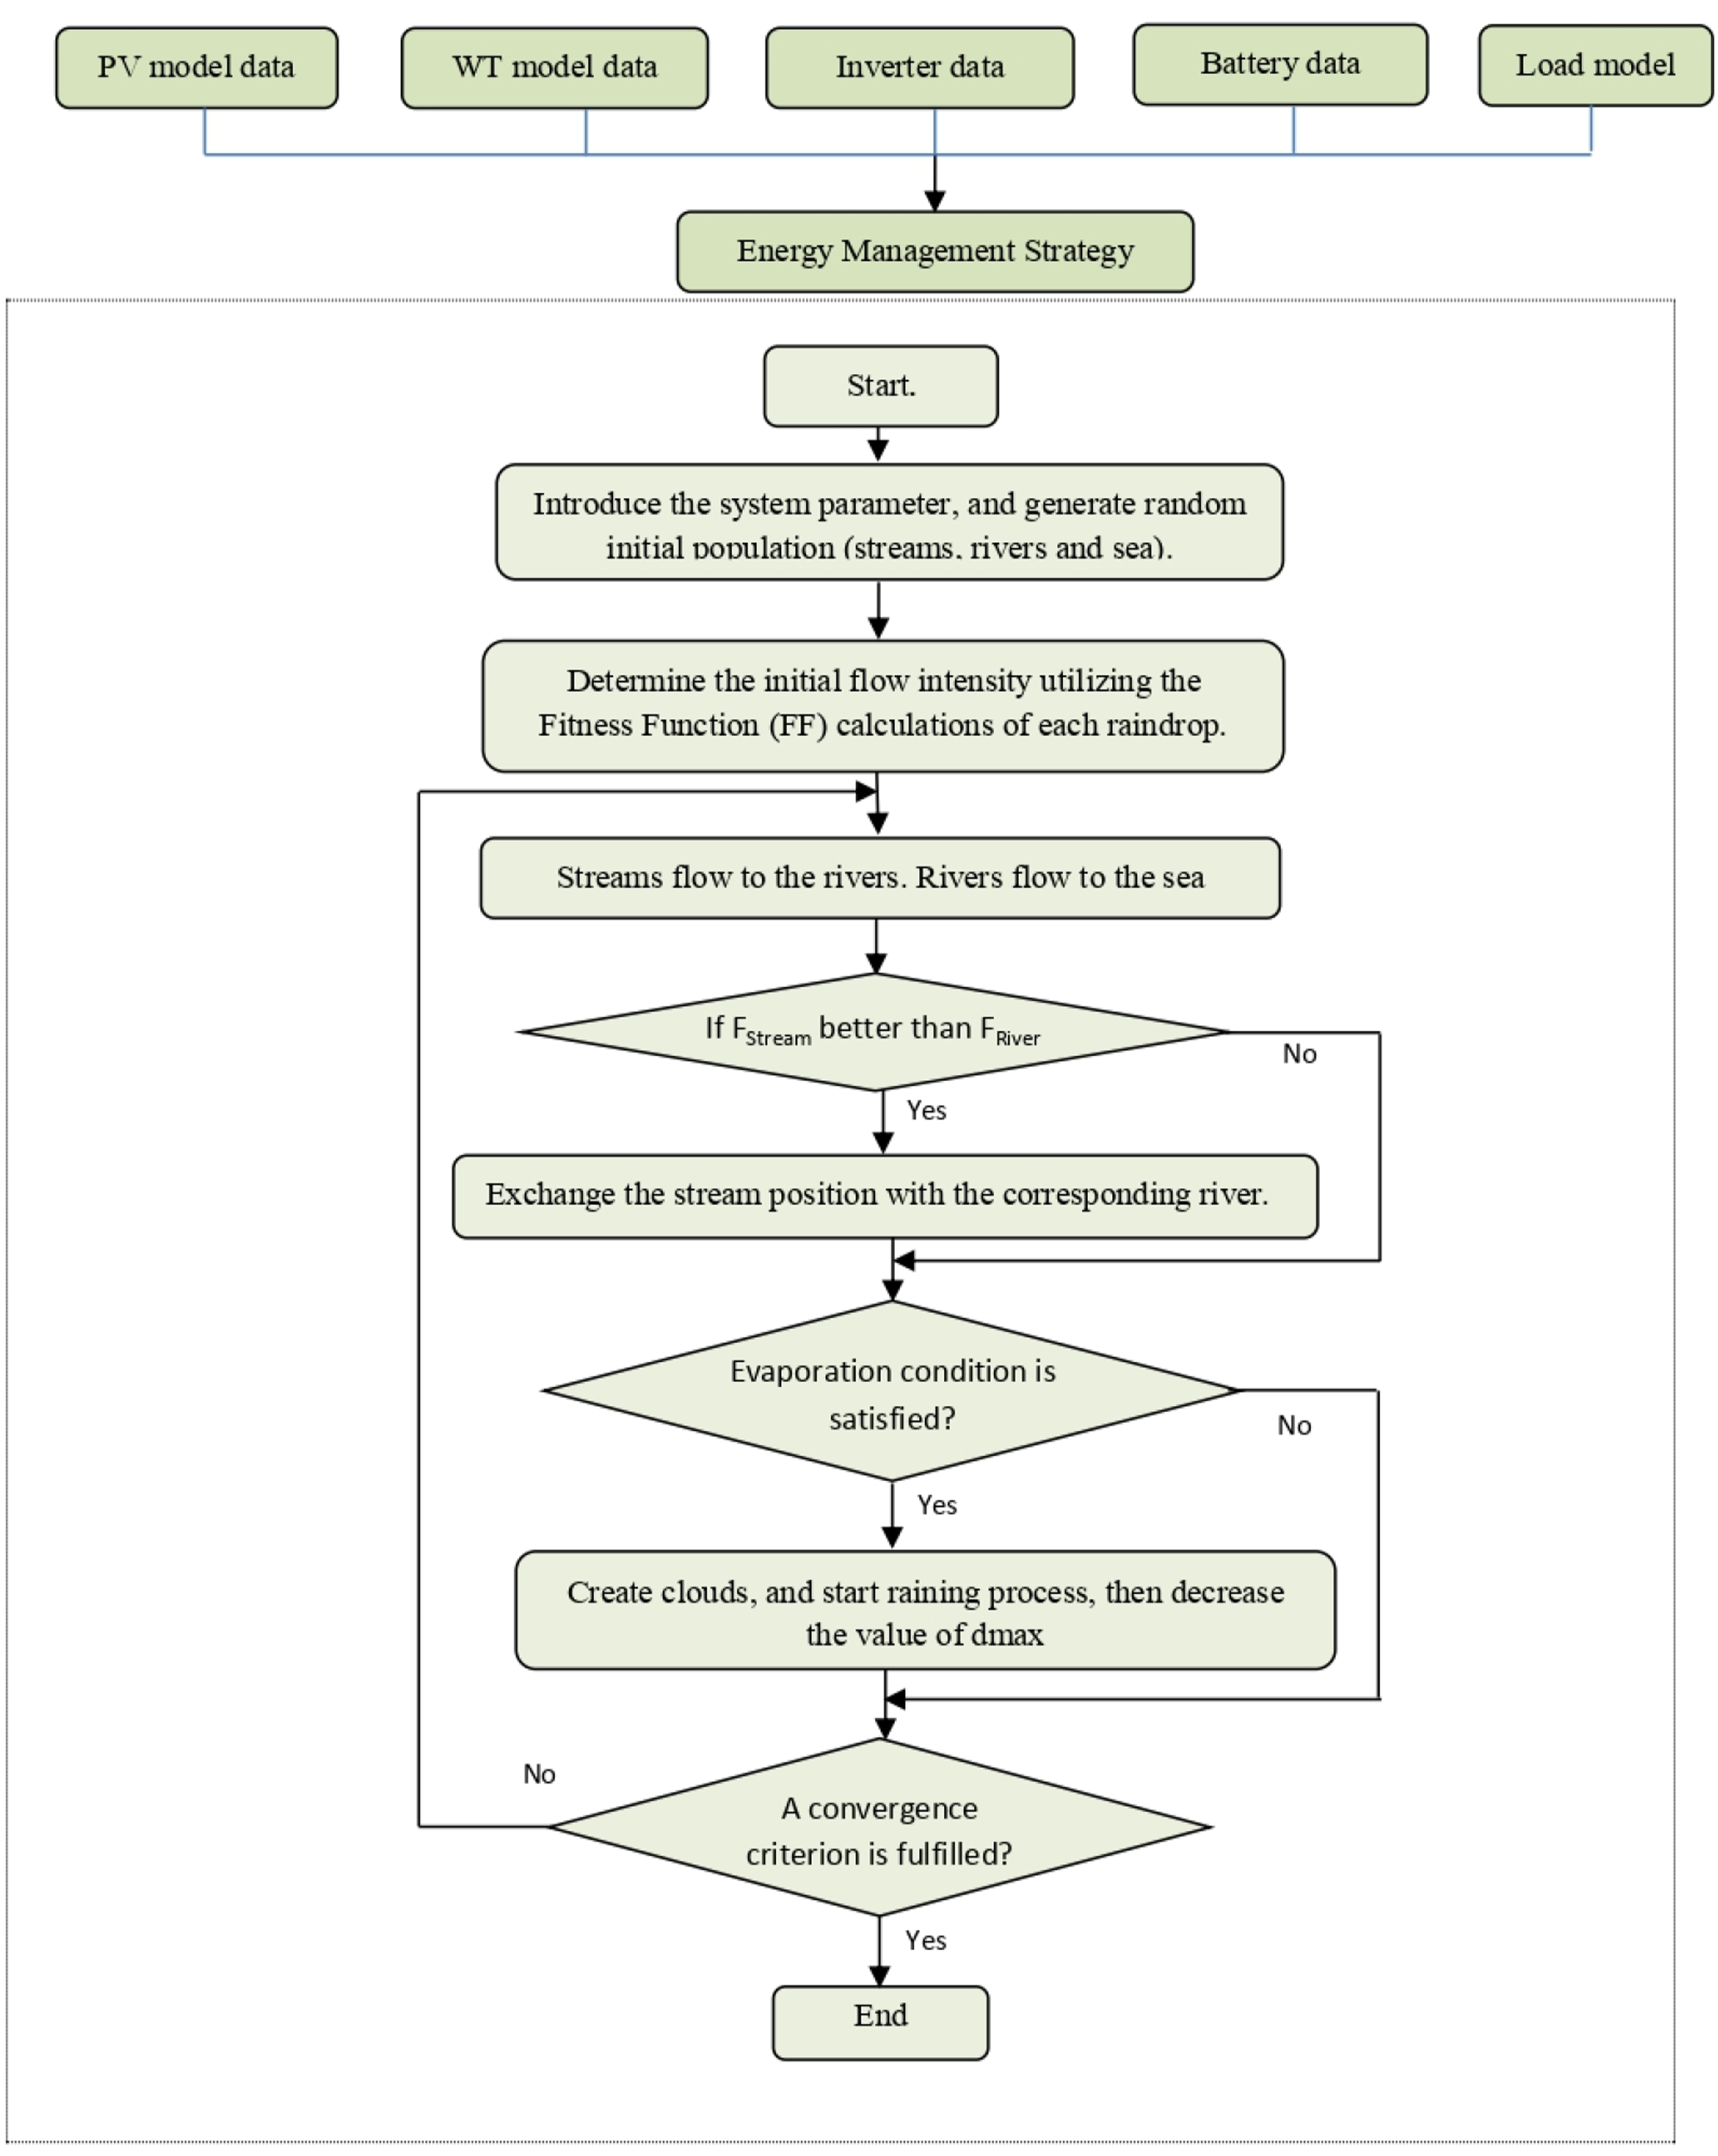
Flowchart of MOWCA.
Multi-objective water cycle algorithm (MOWCA)
LPSP and the COE are two competing objectives that must be addressed simultaneously in the considered problem, as they are in many other real-world optimization situations. In order to address these objective functions concurrently, the suggested optimization technique is enlarged in accordance with the idea of Pareto dominance, also known as Pareto optimality. The following is a presentation of the multi-objective optimization problem under equality and inequality constraints:
Minimize:
Subject to:


Pareto optimality
The best compromises between the conflicting objectives of a multi-objective issue are made using the Pareto optimality principle. To explain the dominance connection of Pareto optimality, four definitions are necessary57,58:
Pareto domination
Assume that there are two workable solutions to minimization problems: 

Non-dominated set
Assuming that a local Pareto group (S) contains two solutions, x and y, a solution x ∈ S is a Pareto optimal solution with regard to solution y if and only if
Pareto optimal set
The set of Pareto optimum (
Consequently, all other solutions in the whole search space are subordinated to the members of the Pareto optimum set.
Pareto optimal front
The Pareto optimum front (
Similar to that in Ref. 59, the MOWCA uses an archive (repository) to hold a finite number of the best Pareto optimum solutions (N_Archive) found up to the present iteration. By comparing each individual with every repository resident using the aforementioned Pareto operators, this archive collection is updated during the evolutionary process. The only solutions kept in the repository for the following generation are those that are part of the Pareto optimum set.
Fuzzy set theory
To determine the optimum compromise among the provided collection of Pareto optimal alternatives, the fuzzy set theory is used. The value of the membership function 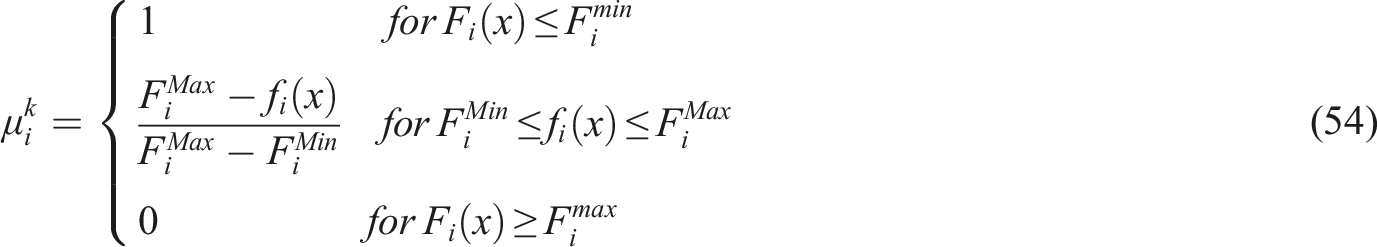
The normalized membership function 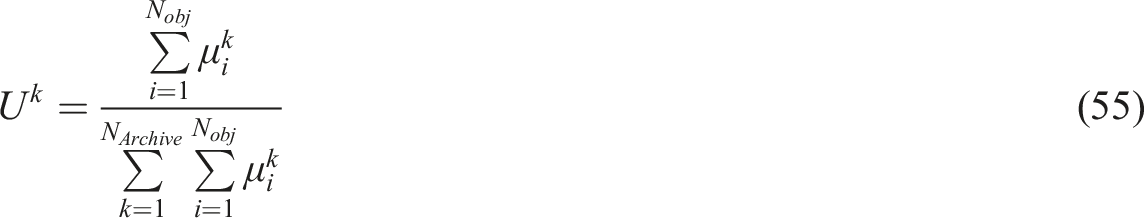
The member of the archive set with the highest value of
Uncertainty modeling
In real-world problem, there is a pervasive phenomenon known as uncertainty, where there is a high probability of difference between the real and expected values in the parameters and objectives of the problem. There is a risk to the controlling authorities when the price uncertainty of the electric market is taken into account. 42 Deterministic modeling of this uncertainty is therefore mathematically impossible. As a result, given the importance of uncertainties in micro-grids, stochastic approaches must be used to include them into the system model.
In RES, the uncertainty is modeled using PDFs. Beta and Weibull distributions are accepted widely for modeling the uncertainty associated with solar irradiance and wind speed, respectively. On other hand, different methods have been used to deal with uncertainty and extract the best moments that clearly identify the actual behavior. The accurate modeling of RES has a significant impact on all objective function.
Model of uncertainties based on point estimate method
The PEM approach is utilized to represent the uncertainty associated with RES. This method’s main goal is to establish the statistical information about a random variable (
For every random variable (
The weighting factors 

The following formula will be used to determine 

Once all pairs (
In this paper, the output uncertainties power of PV and WT energy sources are modeled using (2m + 1) Hong’s PEM scheme 


The following is how the new weighting factor 
Load uncertainties model
The load uncertainty has been represented by normal distribution. This is to enhance flexibility, resilience, and accuracy of the system under study. According to Ref. 61, the load power’s probability density function, 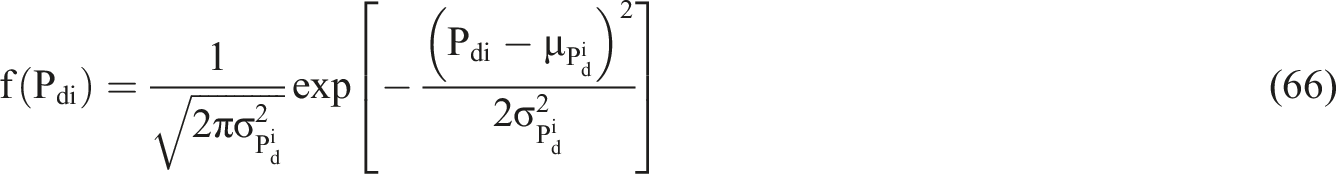
With a zero mean (
Stochastic and deterministic models
One might consider the concept of a predictable model as a forerunner to a probabilistic one. In the former, the output may be precisely produced from the specified set of inputs, and the necessary parameters are either previously known or easily ascertained. The outcomes derived from these models may differ from the actual situation, where unexpected changes to various parameters may take place. However, developing a predictable model can provide a fair approximation and lay the foundation for probabilistic modeling. Predictable models could potentially evolve over time. If there is no time fluctuation, the model is called a steady-state deterministic process.
On the other hand, when the input parameters of a deterministic model change gradually over time, a time series of steady-state deterministic processes is employed. The final category includes dynamic deterministic models, which have known input values for every state and rely on multiple incremental series, including time and space. Forecasting studies usually benefit from this category.40–42
Utilizing many different kinds of methods for integrating the inherent randomness in the process to be modeled is the main goal of stochastic modeling. The inputs are not fixed for a given state; rather, there is a margin of uncertainty. Any value within a given range could be a parameter. This indicates that each independent run of a stochastic model is likely to produce a different set of results. Consequently, this procedure can yield a probability distribution. Brownian, Markov, and Poisson processes are a few instances of stochastic modeling.
Water Cycle Algorithm (MOWCA) simulation is a mathematical method that can be used to predict the probability of various outcomes of a process with random parameters. Each of the input parameters is randomly assigned a value within the designated parametric uncertainty range in order to incorporate the randomness. A unique set of inputs is generated at random for each run of the model, which is run for a large number of iterations. Lastly, a probabilistic output can be obtained by using a statistical toolset. Numerous applications, such as optimization and numerical integration, frequently use this technique.
Simulation results based on MOWCA
Several options are presented in this research for the best design of the micro-grid under study using MOWCA method. This method produces a collection of ideal solutions called the Pareto front. A hybrid PV/wind/battery system’s optimization is examined for Yanbu, Saudi Arabia under the deterministic and stochastic planning of the load and RESs.
Saudi Arabia boasts a hot, dry climate, and a richness of RESs, including wind and solar power. Yanbu is an industrial city located in the Kingdom’s western area (latitude of 24o05’200” N and longitude 38o03’490” E) It is located along the Red Sea coast and has excellent wind potential in addition to good levels of solar irradiation; the study takes into account an average yearly wind speed of 3.53 m/s and solar irradiation of 5.95 kWh/m2/day.
45
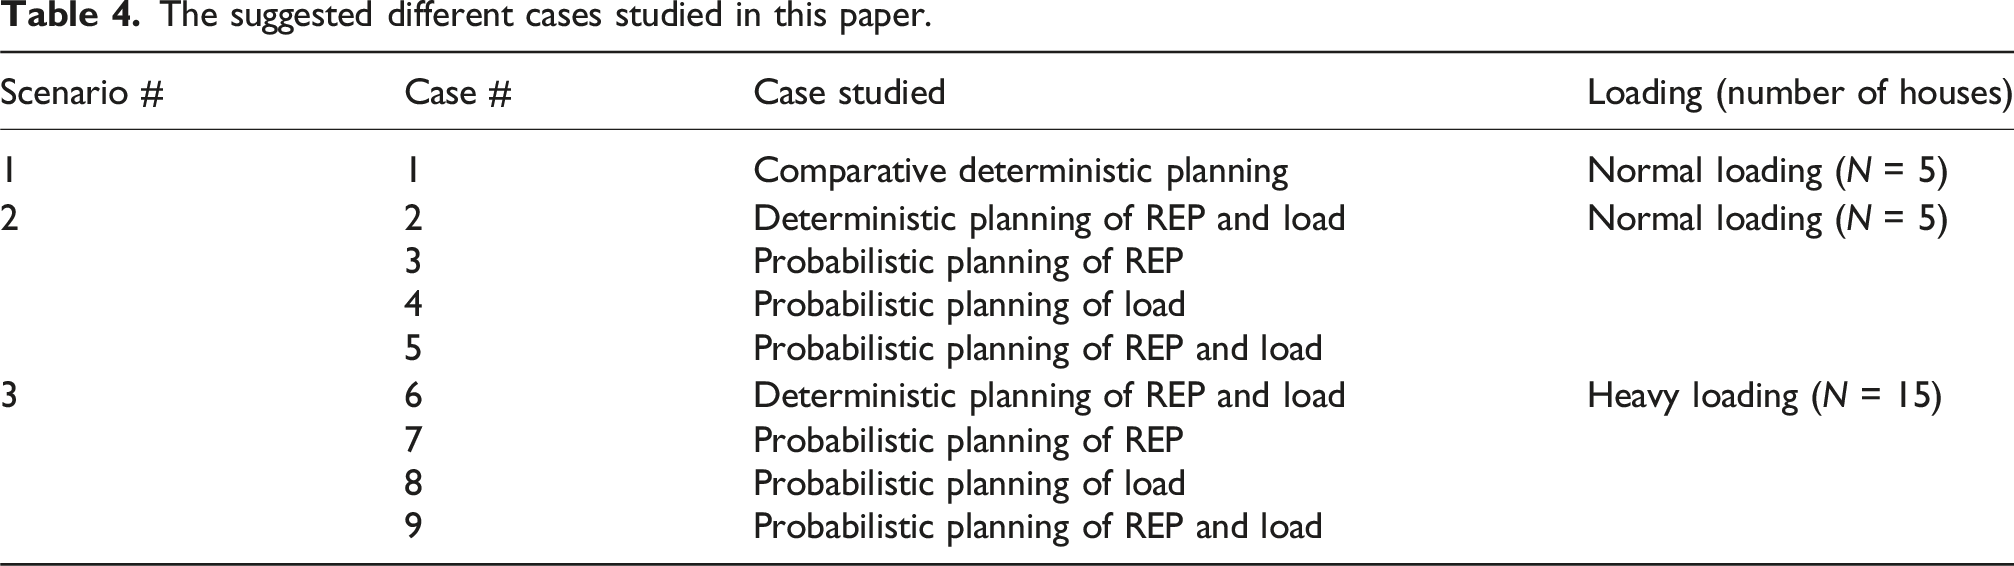
The hourly wind speed is displayed in Figure 3(a), and the city’s hourly sun irradiation is displayed in Figure 3(b). The city experiences temperatures ranging from 15 to 40°C, with an average yearly temperature of roughly 29°. Yanbu’s actual weather data is used in the optimization process. For PV, WT, and AD, the corresponding lower and upper bounds are [15 45], [0 10], and [15]. Nine different case studies based on three scenarios are investigated correspond to comparative and number of houses, which are summarized in Table 4. The hourly wind speed and solar irradiation. (a) The hourly wind speed and (b) The hourly solar irradiation. The suggested different cases studied in this paper.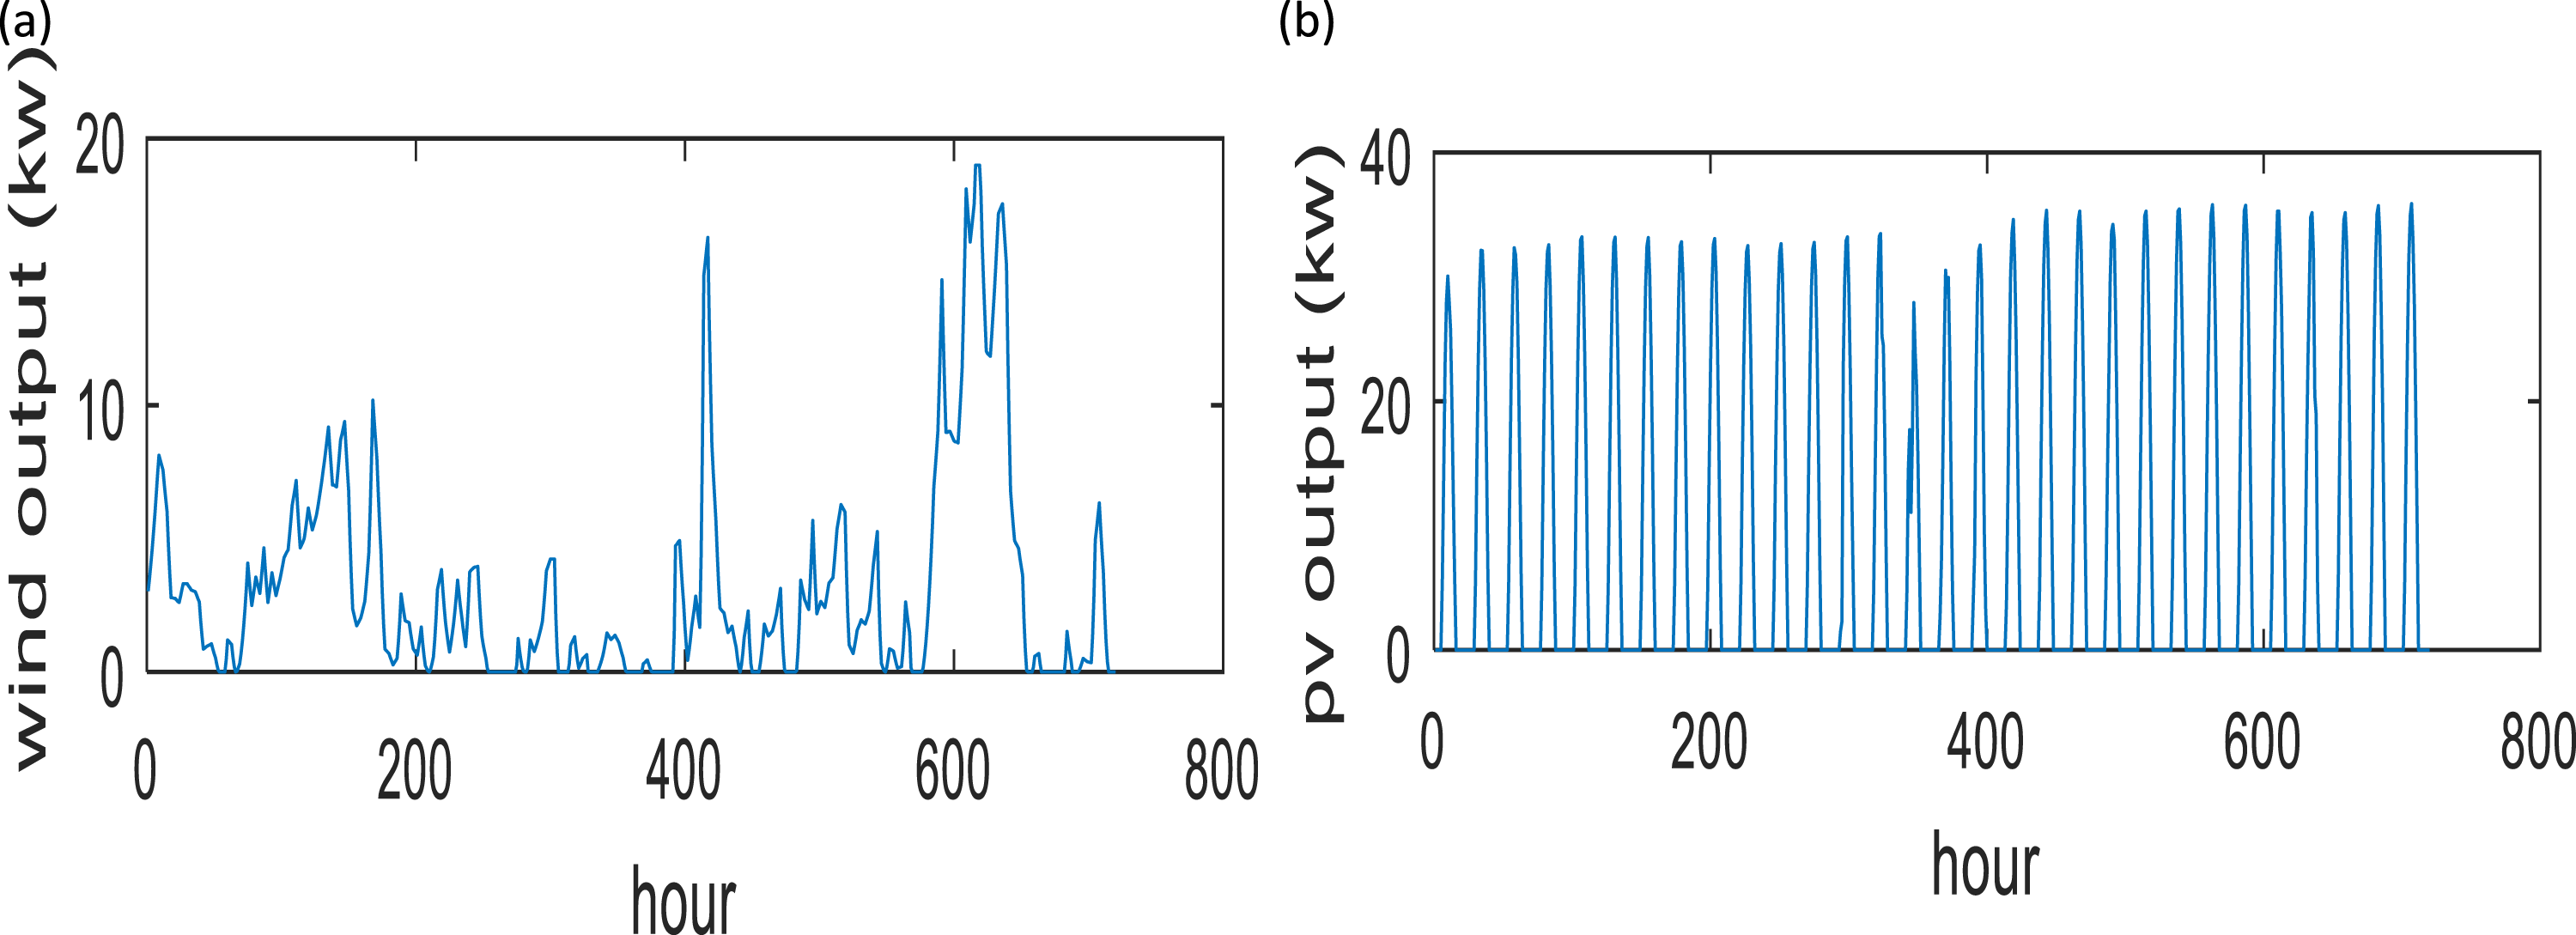
Scenario 1: Comparative deterministic planning of REP and load
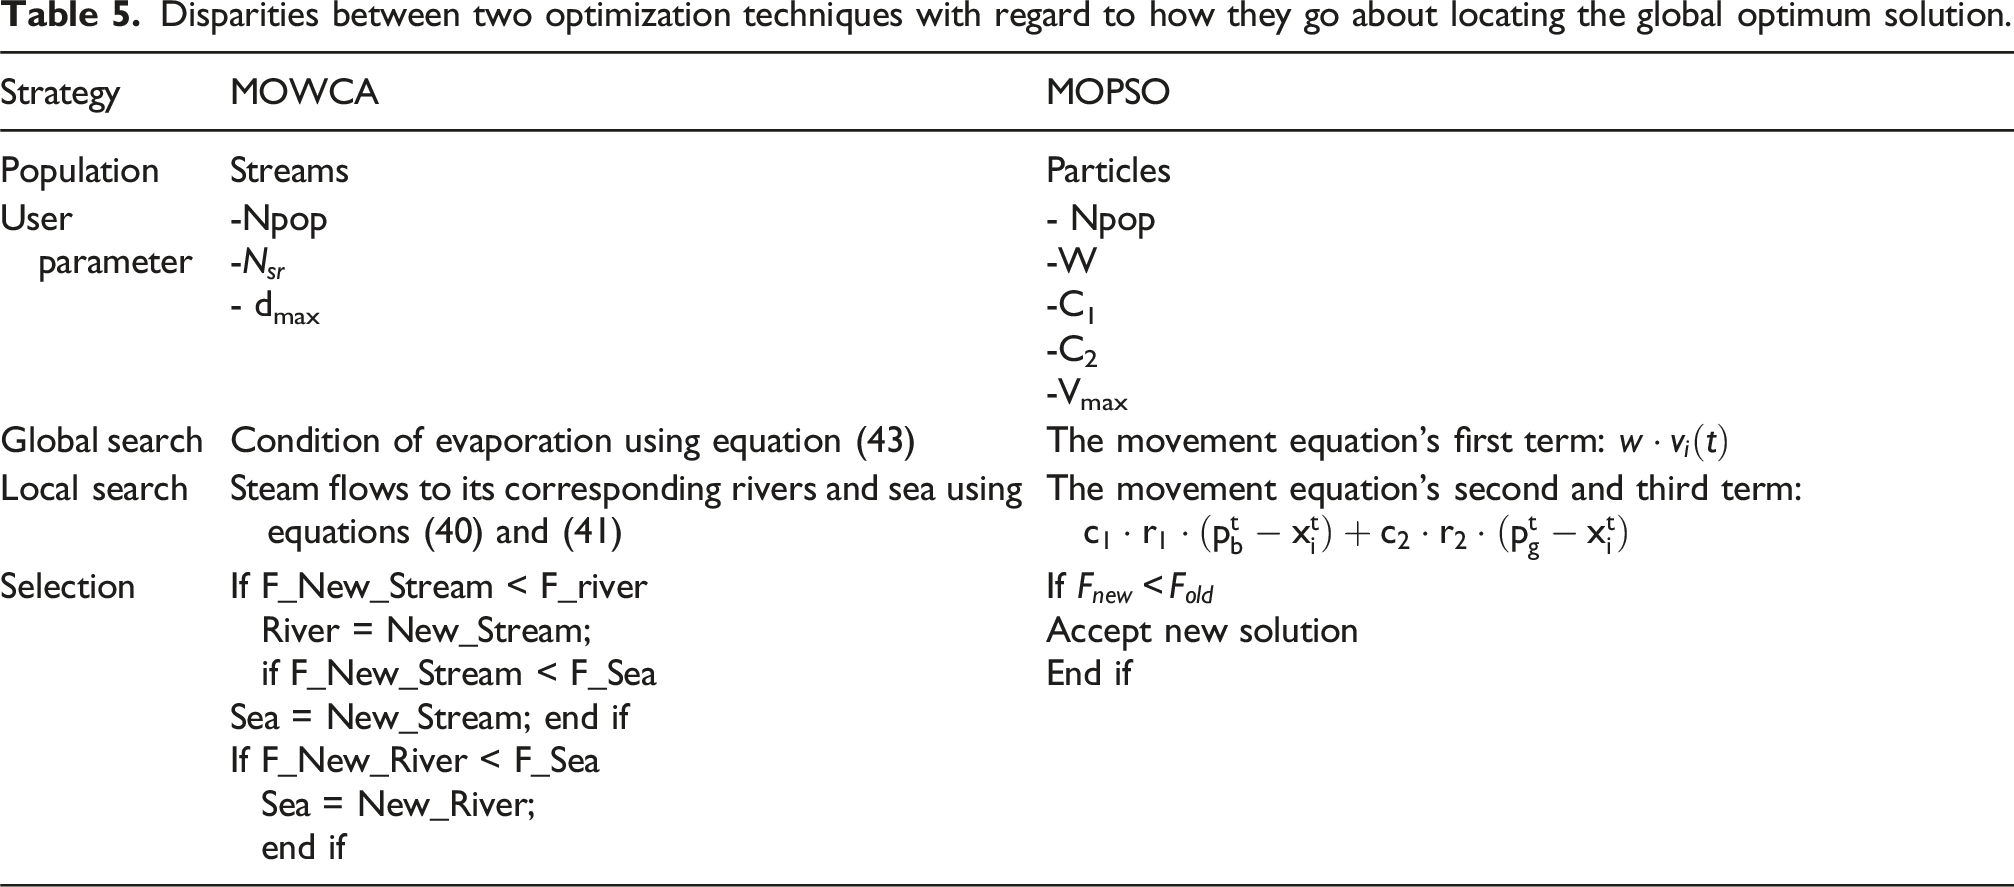
Disparities between two optimization techniques with regard to how they go about locating the global optimum solution.
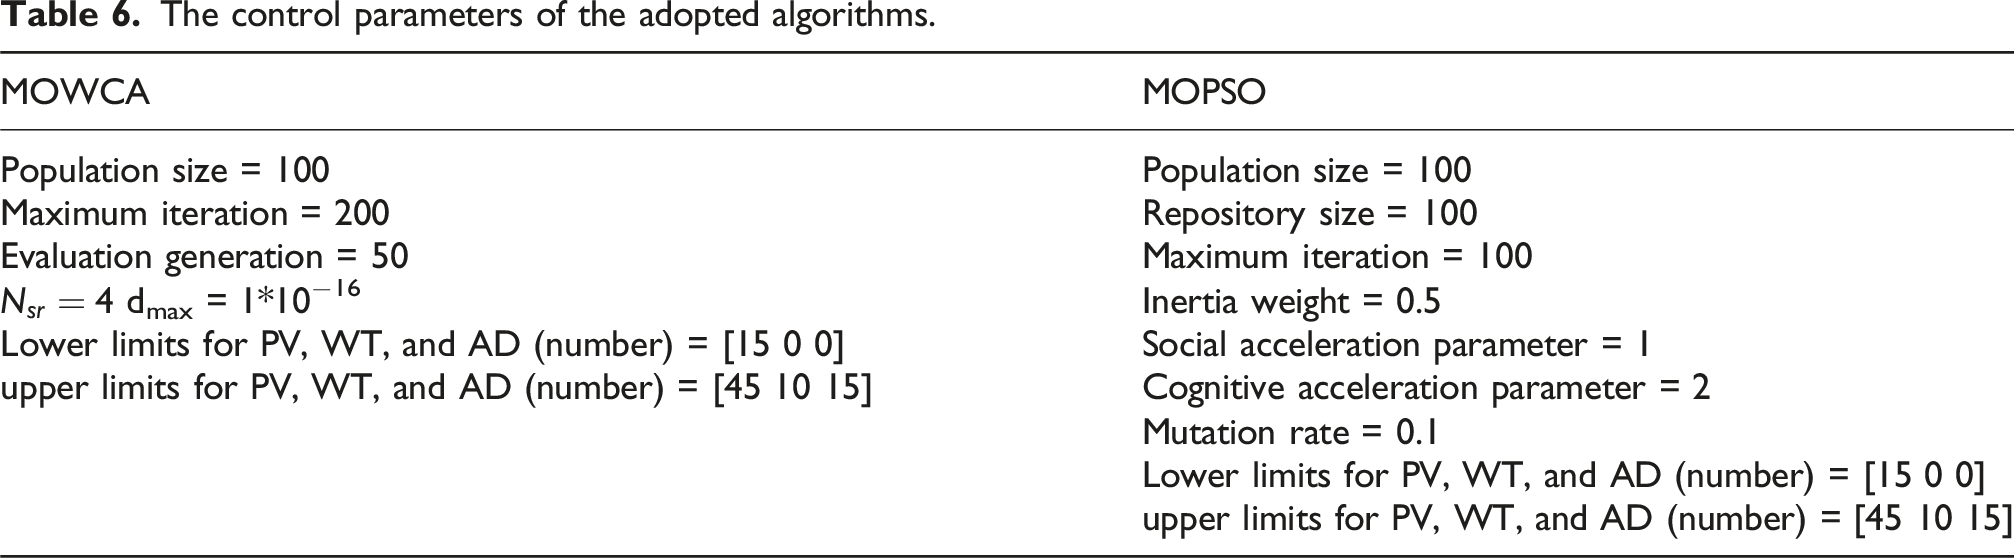
The control parameters of the adopted algorithms.
Case 1: Comparative case
In this case, the system is studied under normal loading condition considering the deterministic operation of RES and load. The optimization results have clearly shown that the proposed MOWCA method is effective in reducing all objective functions to maximize the technical and economic benefits. The Pareto front of the two algorithms is shown in Figure 4, it is clear that, in comparison to the MOPSO, the Pareto front of the proposed MOWCA provides and covers a greater portion of decision maker preferences. Comparison between the PF obtained for case 1 using the two proposed approach.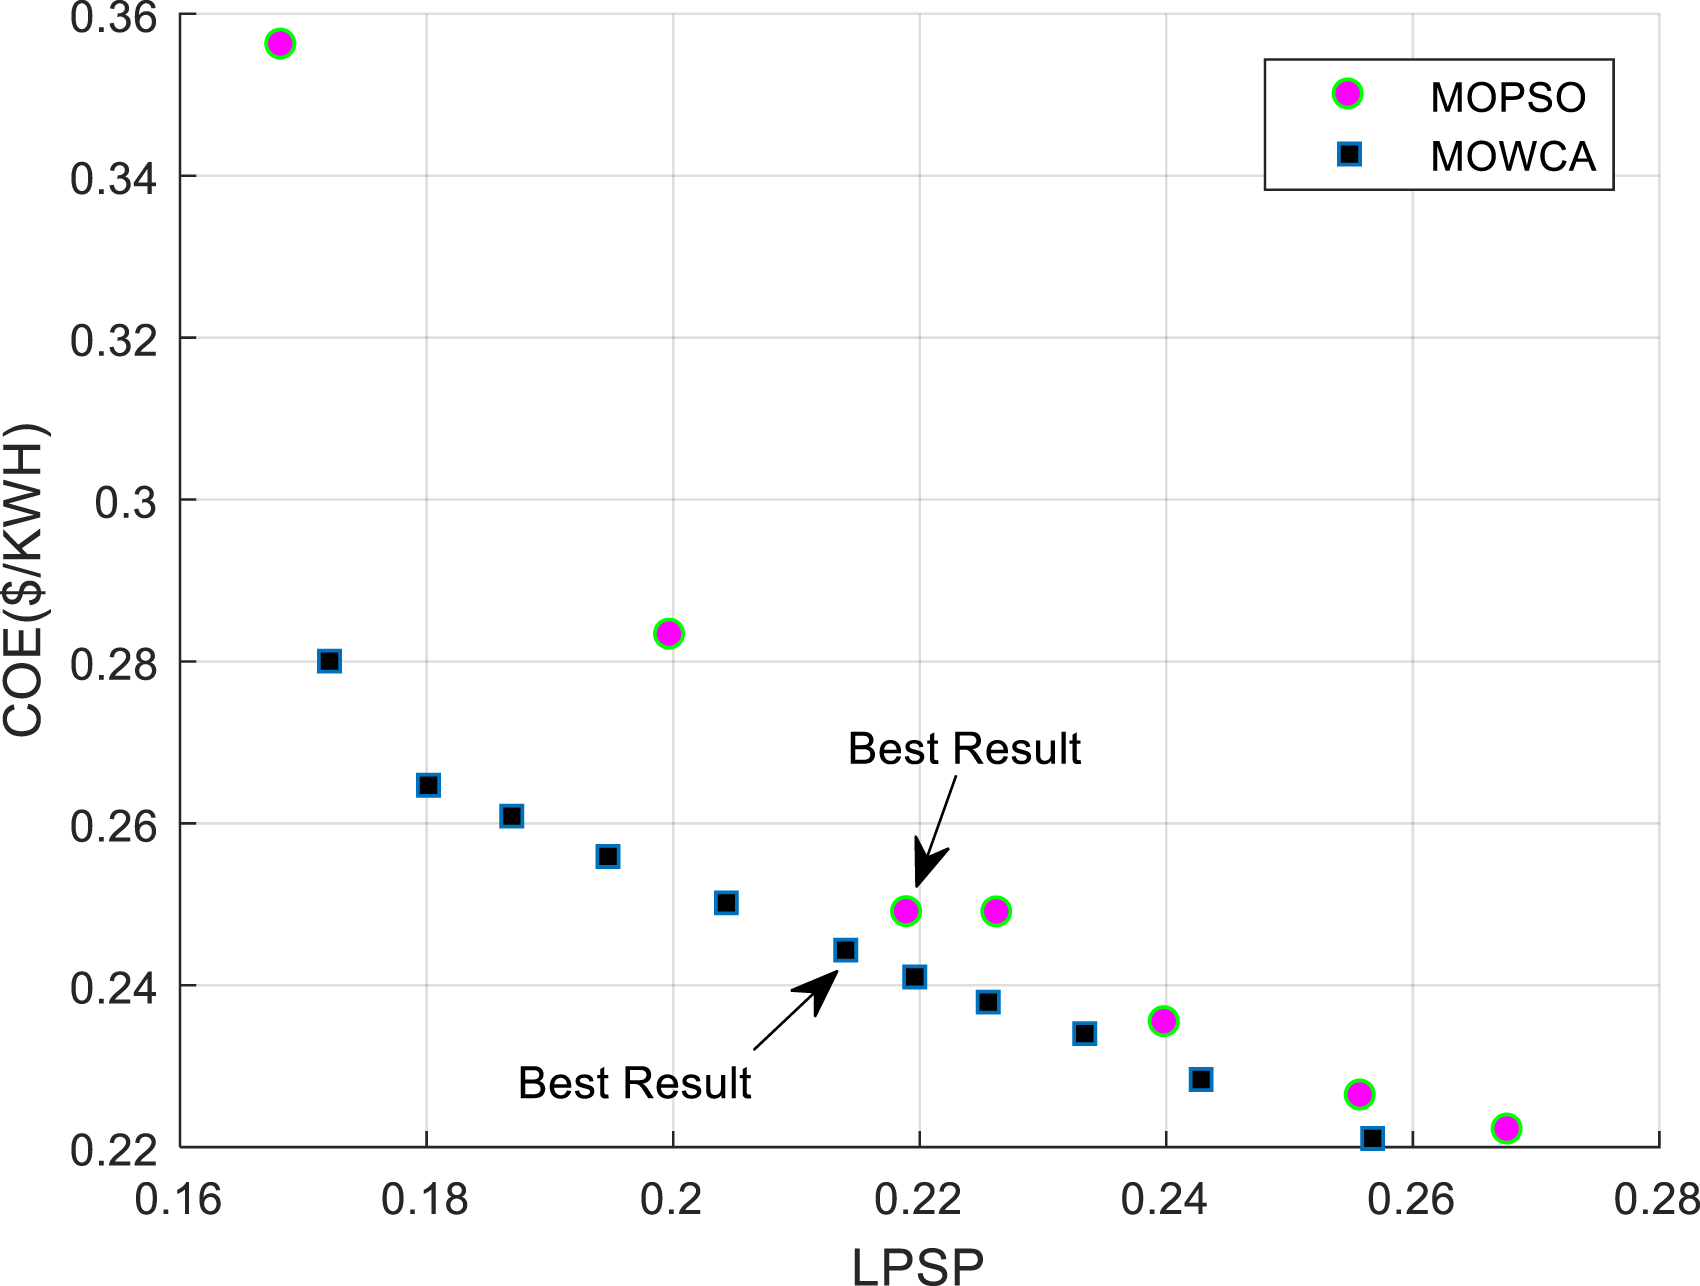
The MOWCA Pareto front shows a smallest value of COE 0.18,872 $/KWh, which corresponds to a maximum value of 33.124% for LPSP, and a maximum value of 0.39358 $/KWh, which corresponds to a minimum value of 11.839% for LPSP. MOPSO’s COE value ranges from a minimum of 0.22108 $/KWh, which corresponds to a maximum LPSP value of 25.674%, to a maximum of 0.29,101$/KWh, which corresponds to a minimum LPSP value of 15.886 %.
Optimization results for case 1.
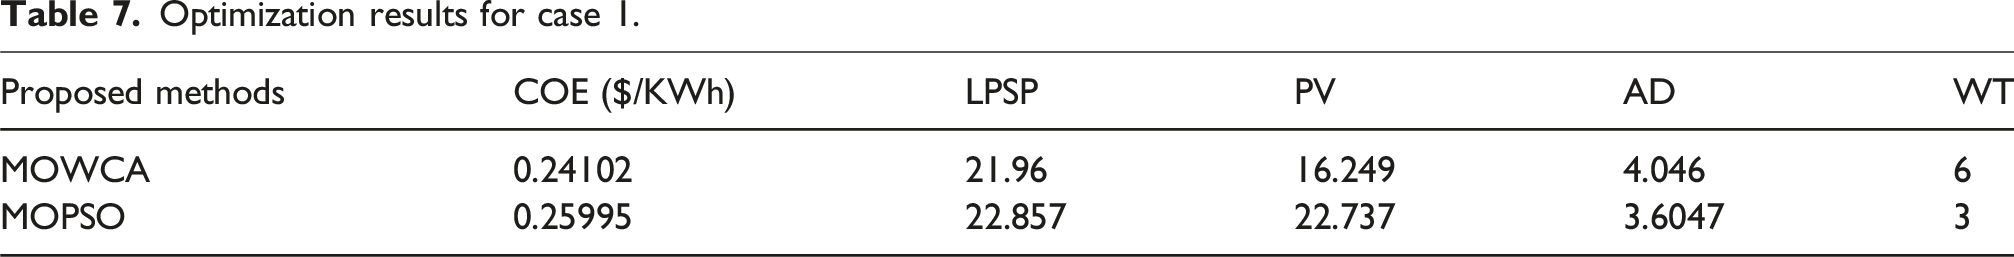
The complete optimal results obtained by two applied algorithms (MOWCA and MOPSO) are displayed in Figure 5(a). According to the MOWCA, there will be 4.046 days of autonomy, 6 wind turbines, and 16.249 kW of solar PV. Figure 5(b) displays the LPSP and COE metrics using the two suggested methods MG. The MOWCA provides the lowest COE and LPSP, at 0.24102 $/KWh and 21.96%, respectively. Performance comparisons for case 1. (a) Power shearing and (b) objective function.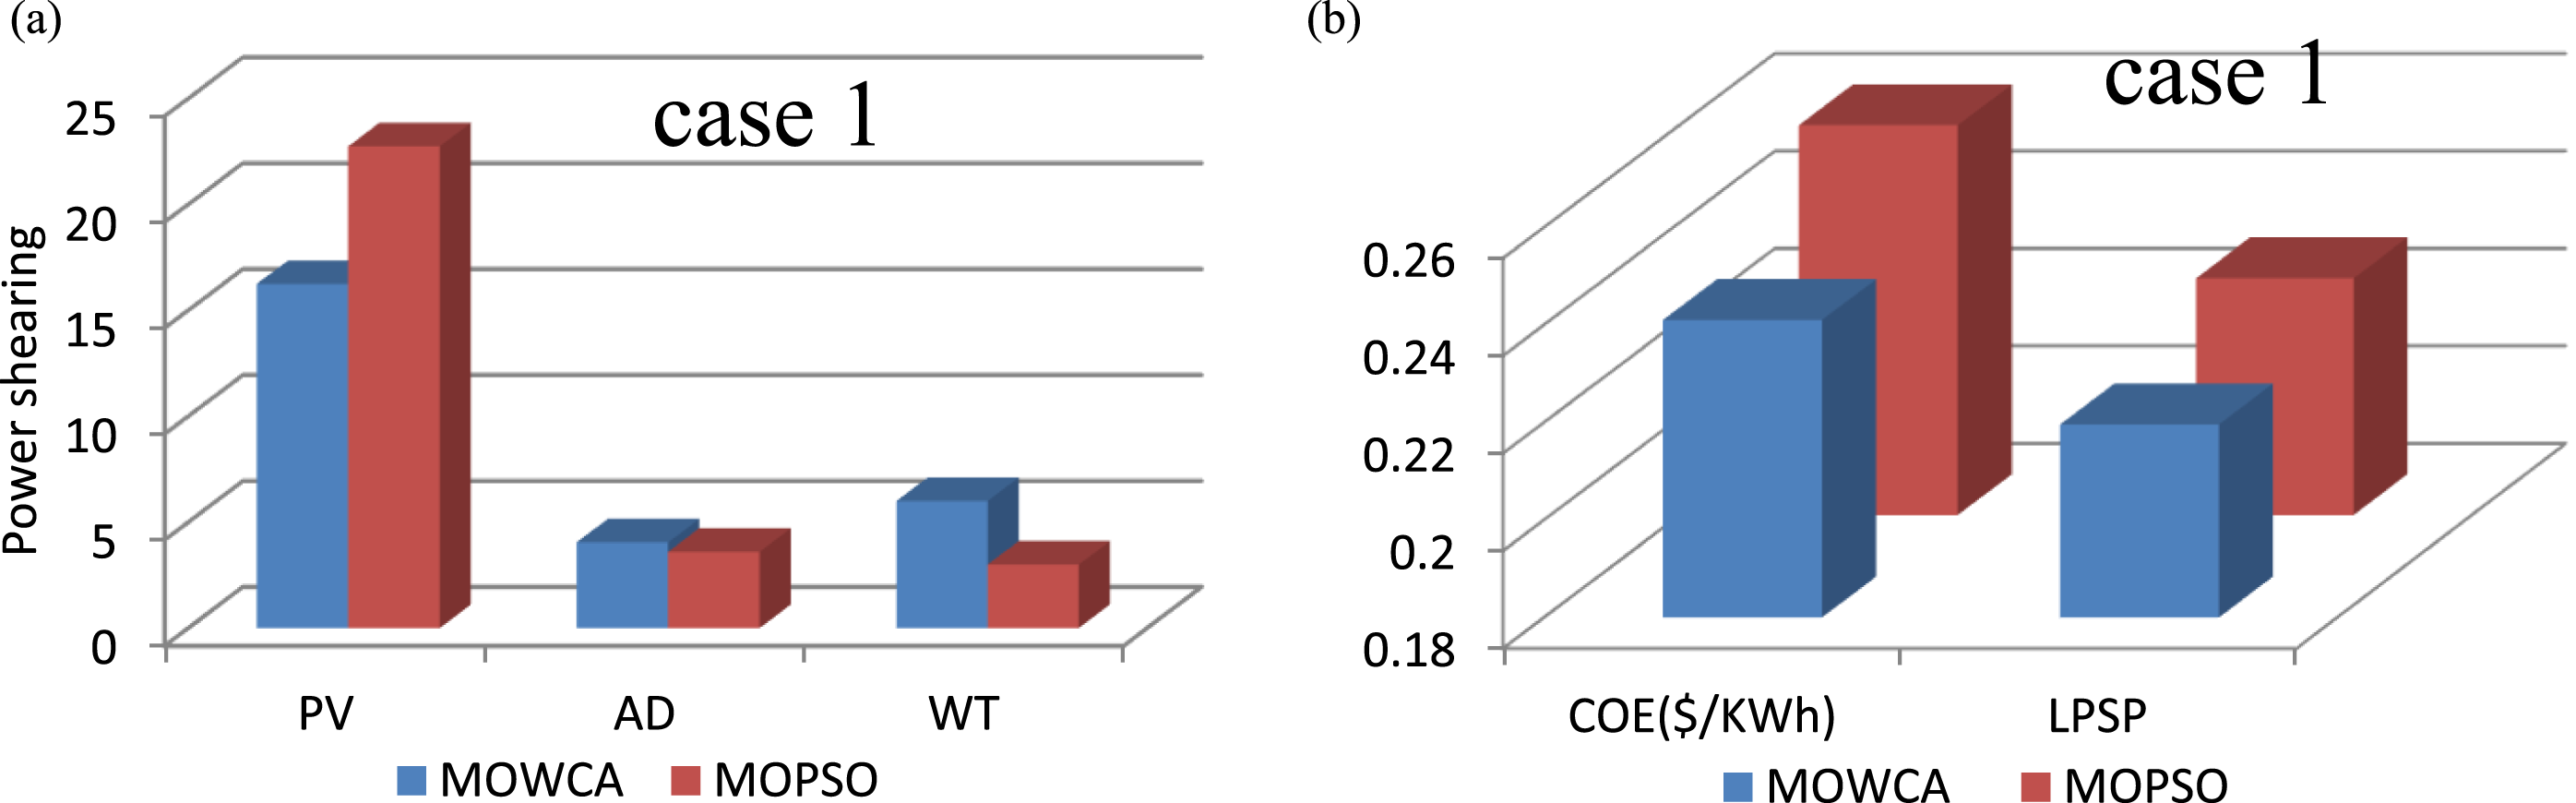
Scenario 2: Normal loading condition (N = 5)
The micro-grid works under normal loading condition based on the number of housed. Applying the suggested method (MOWCA) to cases 2, 3, 4, and 5 has been done under the assumption that there are five houses under deterministic and stochastic planning. The deterministic model accounts for the circumstances in which uncertainty modeling is not taken into account. In stochastic optimization, uncertainty is an integral part of the modeling process.
Case 2: Deterministic planning of REP and load
To confirm that the suggested algorithm is efficient and capable of producing the best possible design with high dependability and low investment costs, Battery “storage energies” are added with multiple types of DER types based on RES, such as PV and WT energy sources considering the deterministic behavior of REP and load under normal loading condition.
Twenty selected solutions for case 2.
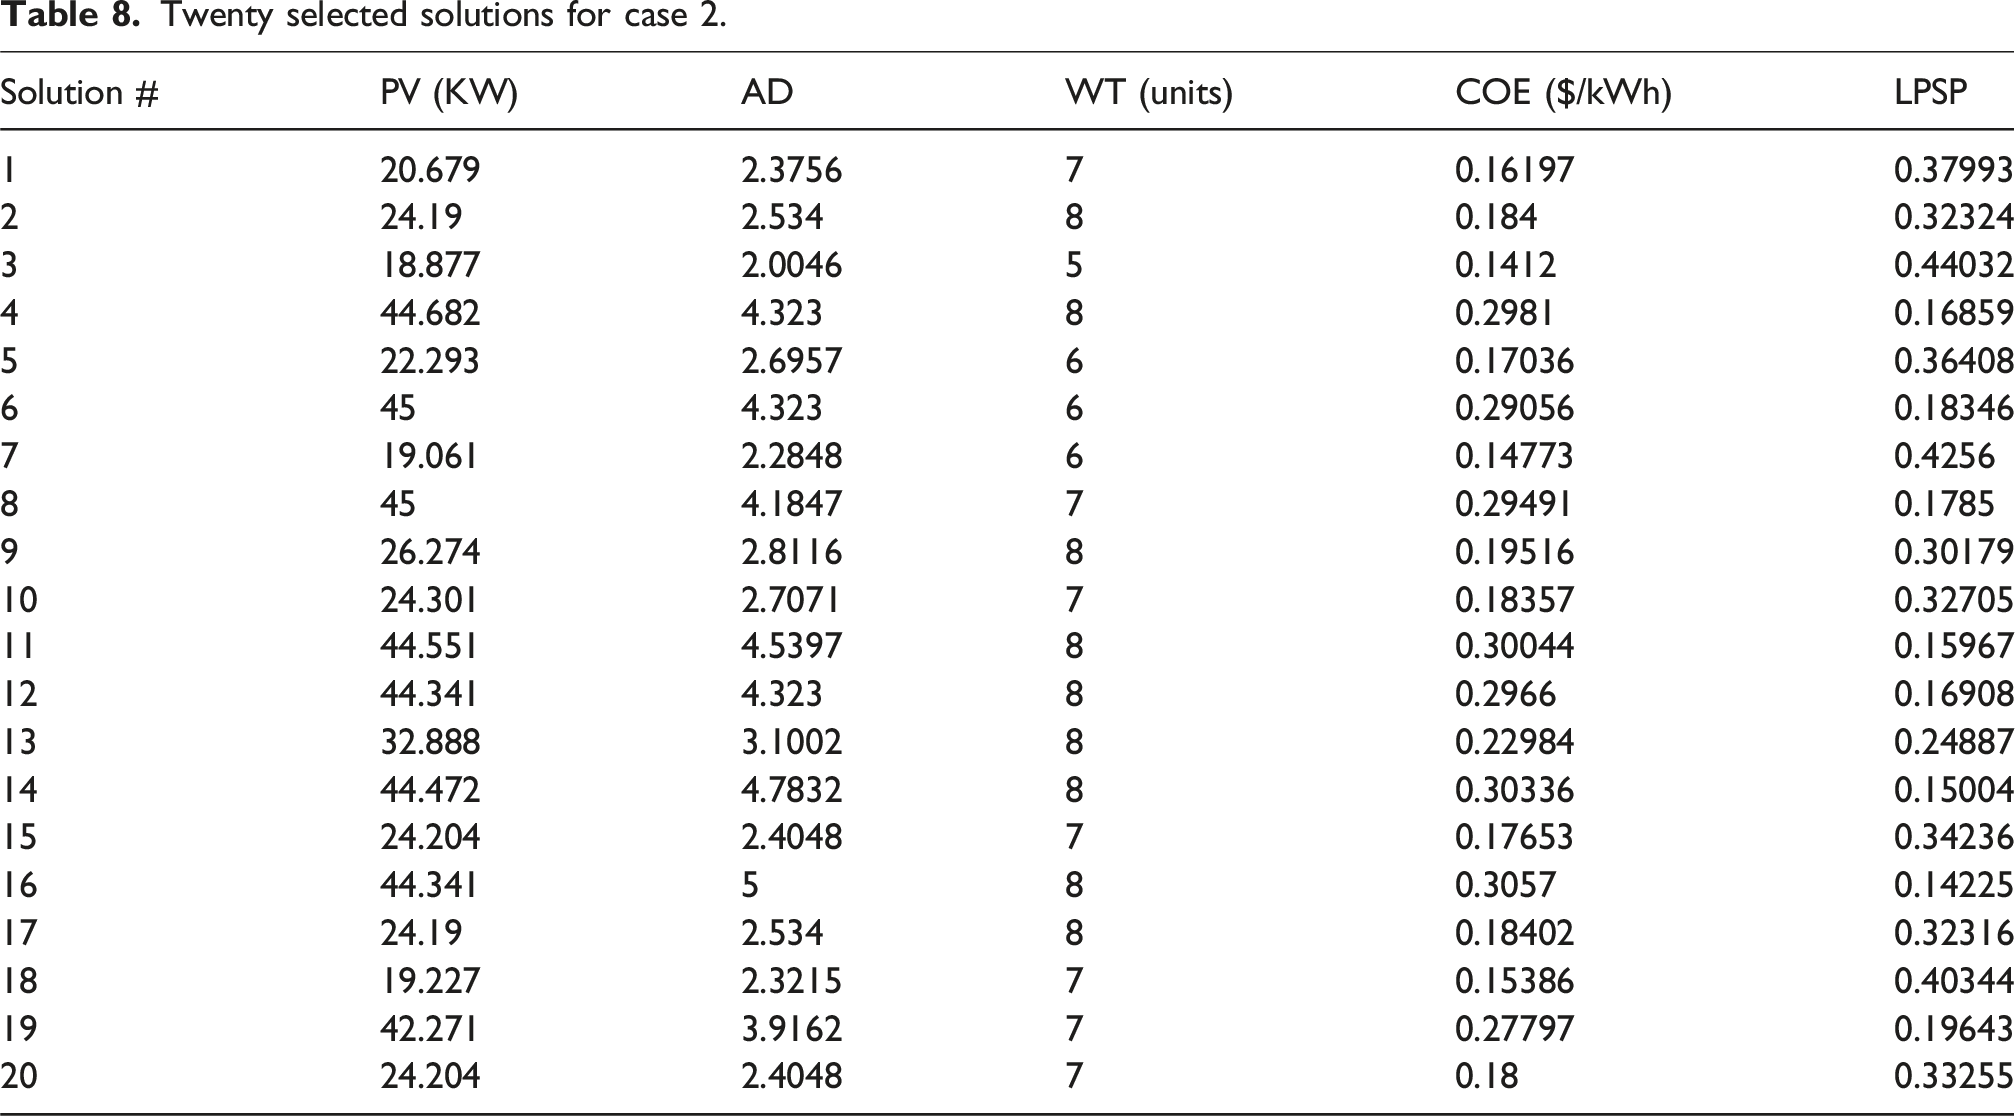
The system for solution #7 of the same case has 6 WTs, 2.2848d days of autonomy, and 19.061 kW of PV panel power. Eight wind turbines, 5 days of autonomy, and 44.341 kW of PV panels make up the system for the sixteenth solution.
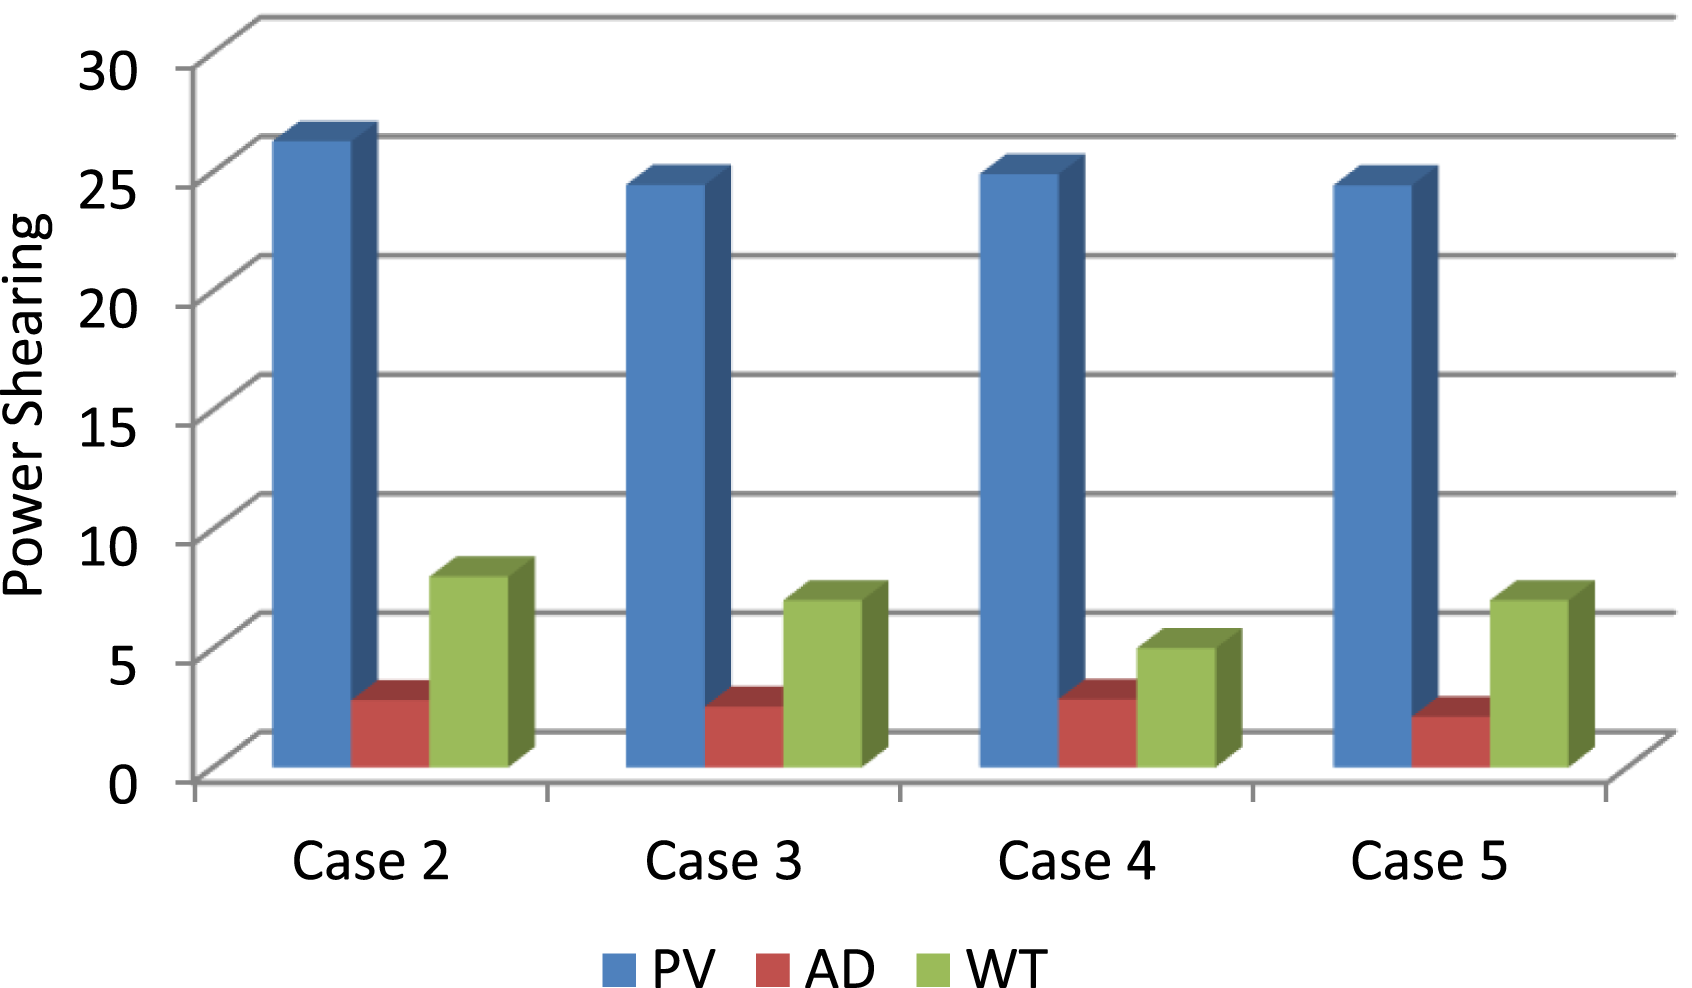
The mid-point solution is the optimal compromise for the suggested algorithms, which is COE 0.19516$/KWh and 30.17% LPSP. The PV panels are capable of producing 26.2740 kW of power, eight wind turbines are needed, and the autonomy days is equal to 3, as shown by the Pareto frontiers obtained from the proposed approach for case 2 in Figure 6(a). Batteries, wind turbines, and photovoltaic panels are among the source types whose energy contributions for three solutions are displayed in Figure 6(b). System performance for case 2. (a) The Pareto solutions for proposed algorithm for case 2 and (b) Power shears by different sources of HMSs.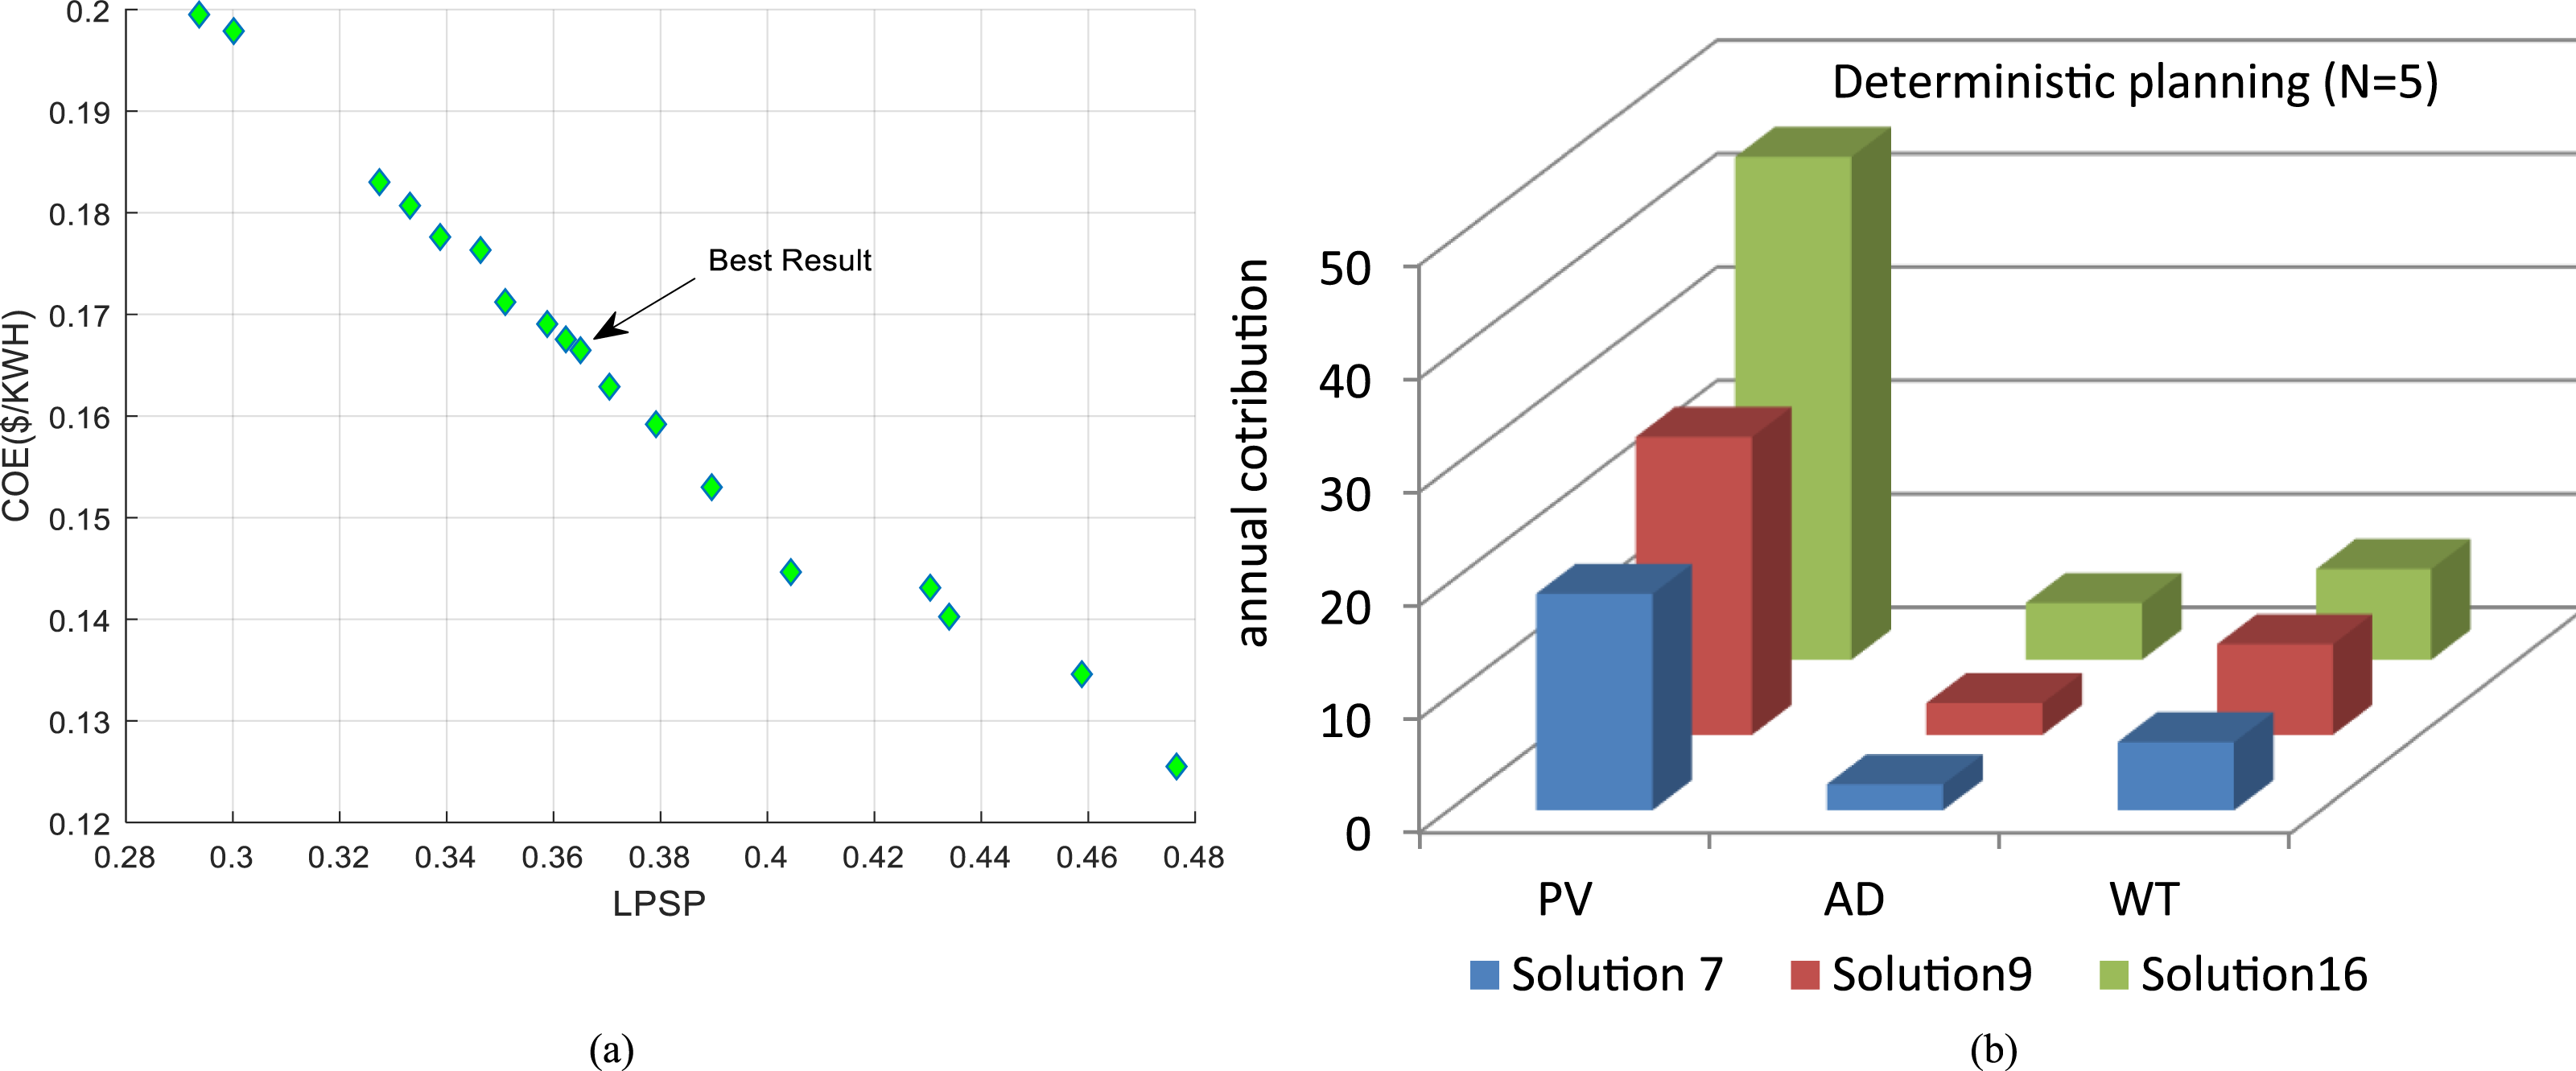
Case 3: The probabilistic planning of REP
REP stochastic behavior is taken into consideration when presenting REp like WT and PV energy sources in order to increase the robustness and flexibility of the suggested network planning and increase the reliability of the analysis. The uncertainties related to RES are modeled using the PEM approach. To find flow solutions for the optimization problem, these estimated scenarios are used. In this instance, there are five houses on display.
The Pareto front of the stand-alone micro-grid system, which was produced by the suggested algorithm based on LPSP and COE functions, has been shown in Figure 7(a). Twenty chosen solutions obtained from PF are tabulated in Table 9, it is evident that the amount of energy that PV panels contributed varied between 18.109 kW and 27.11 kW. The range of WT units was 5 to 8. System performance for case 3. (a) The Pareto solutions for case 3 and (b) Power shears by different sources of HMSs. Twenty selected solutions for case 3.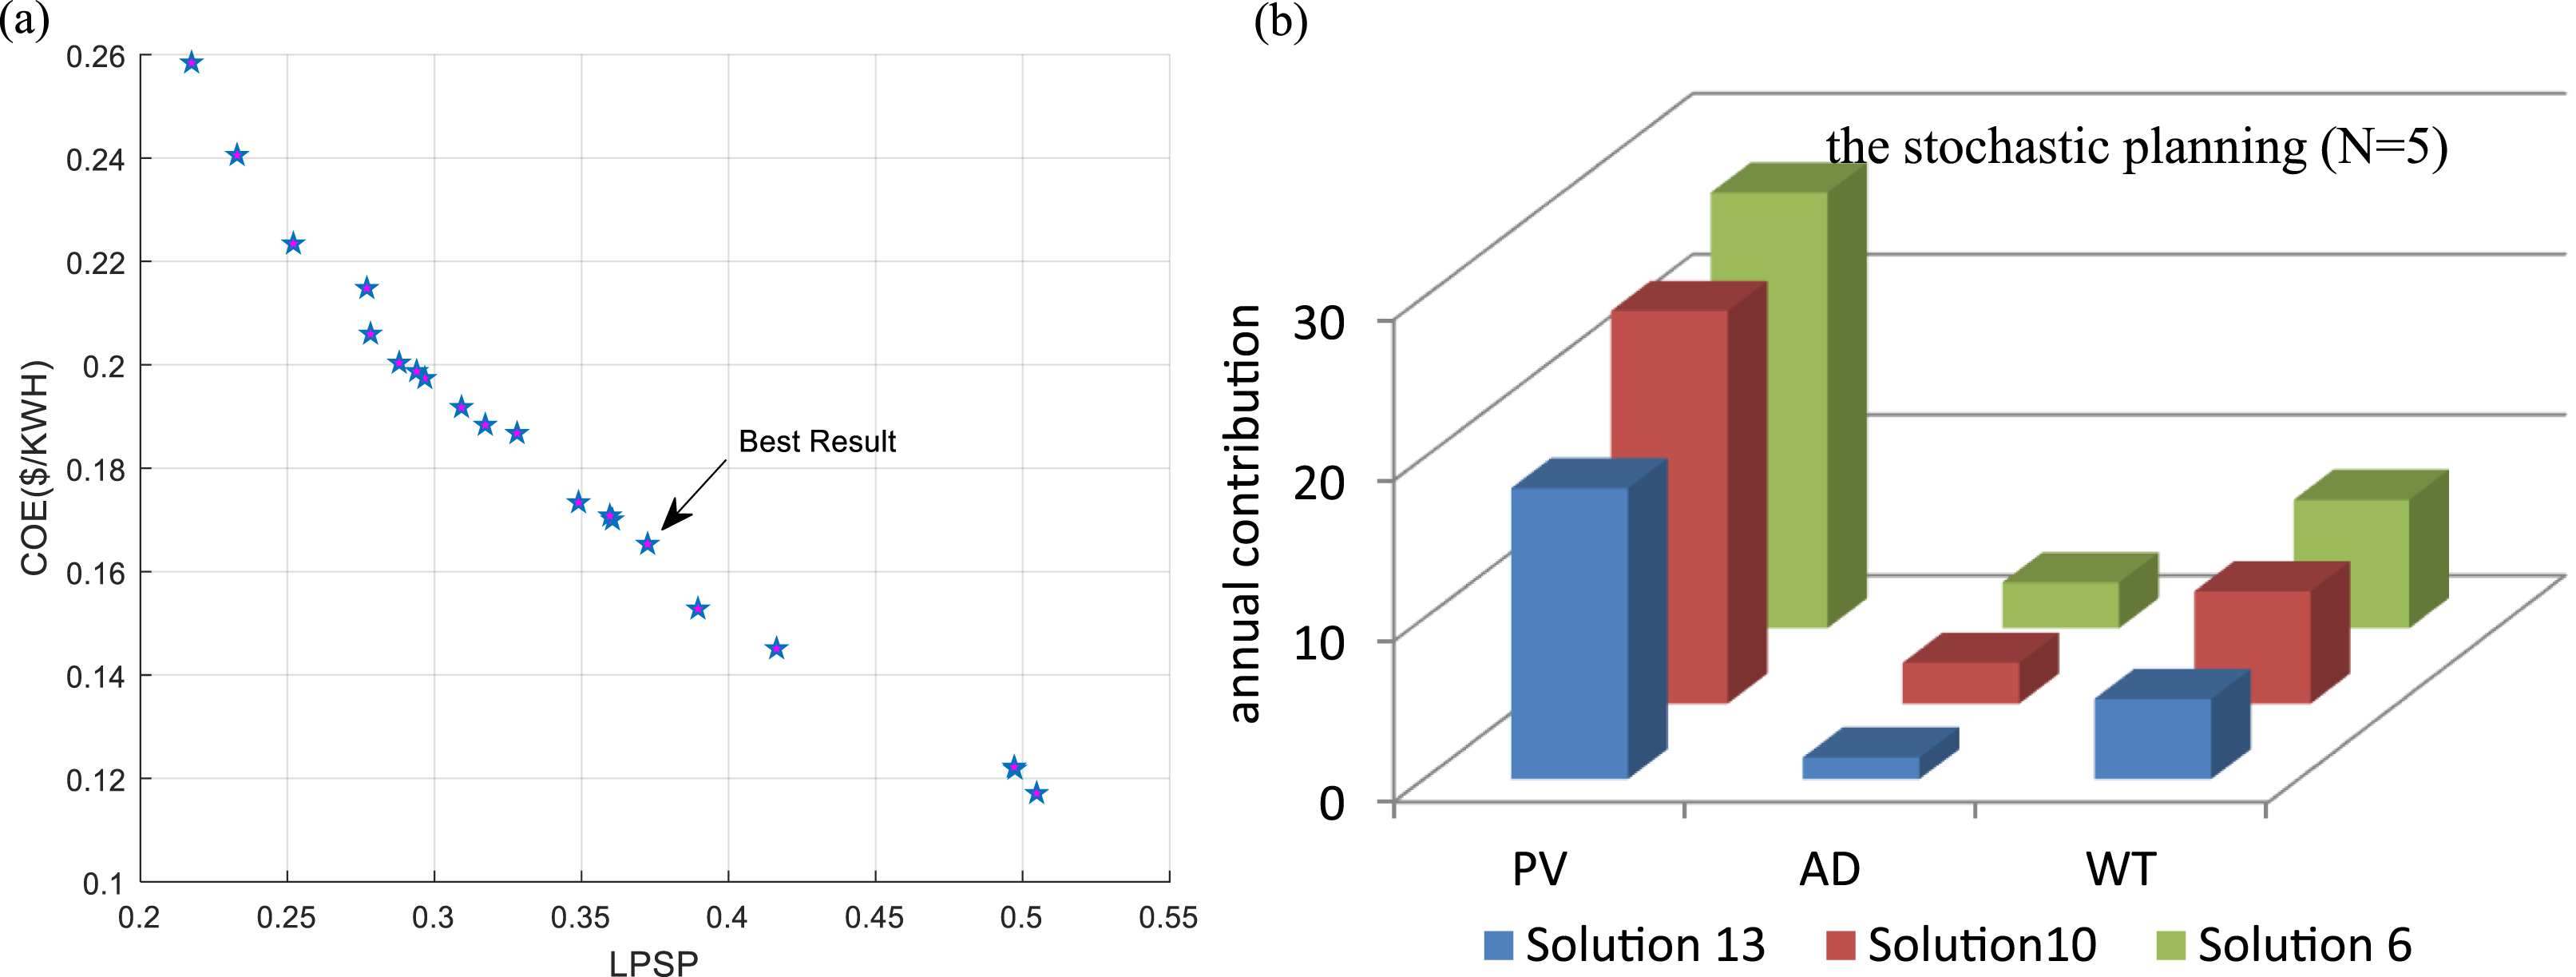
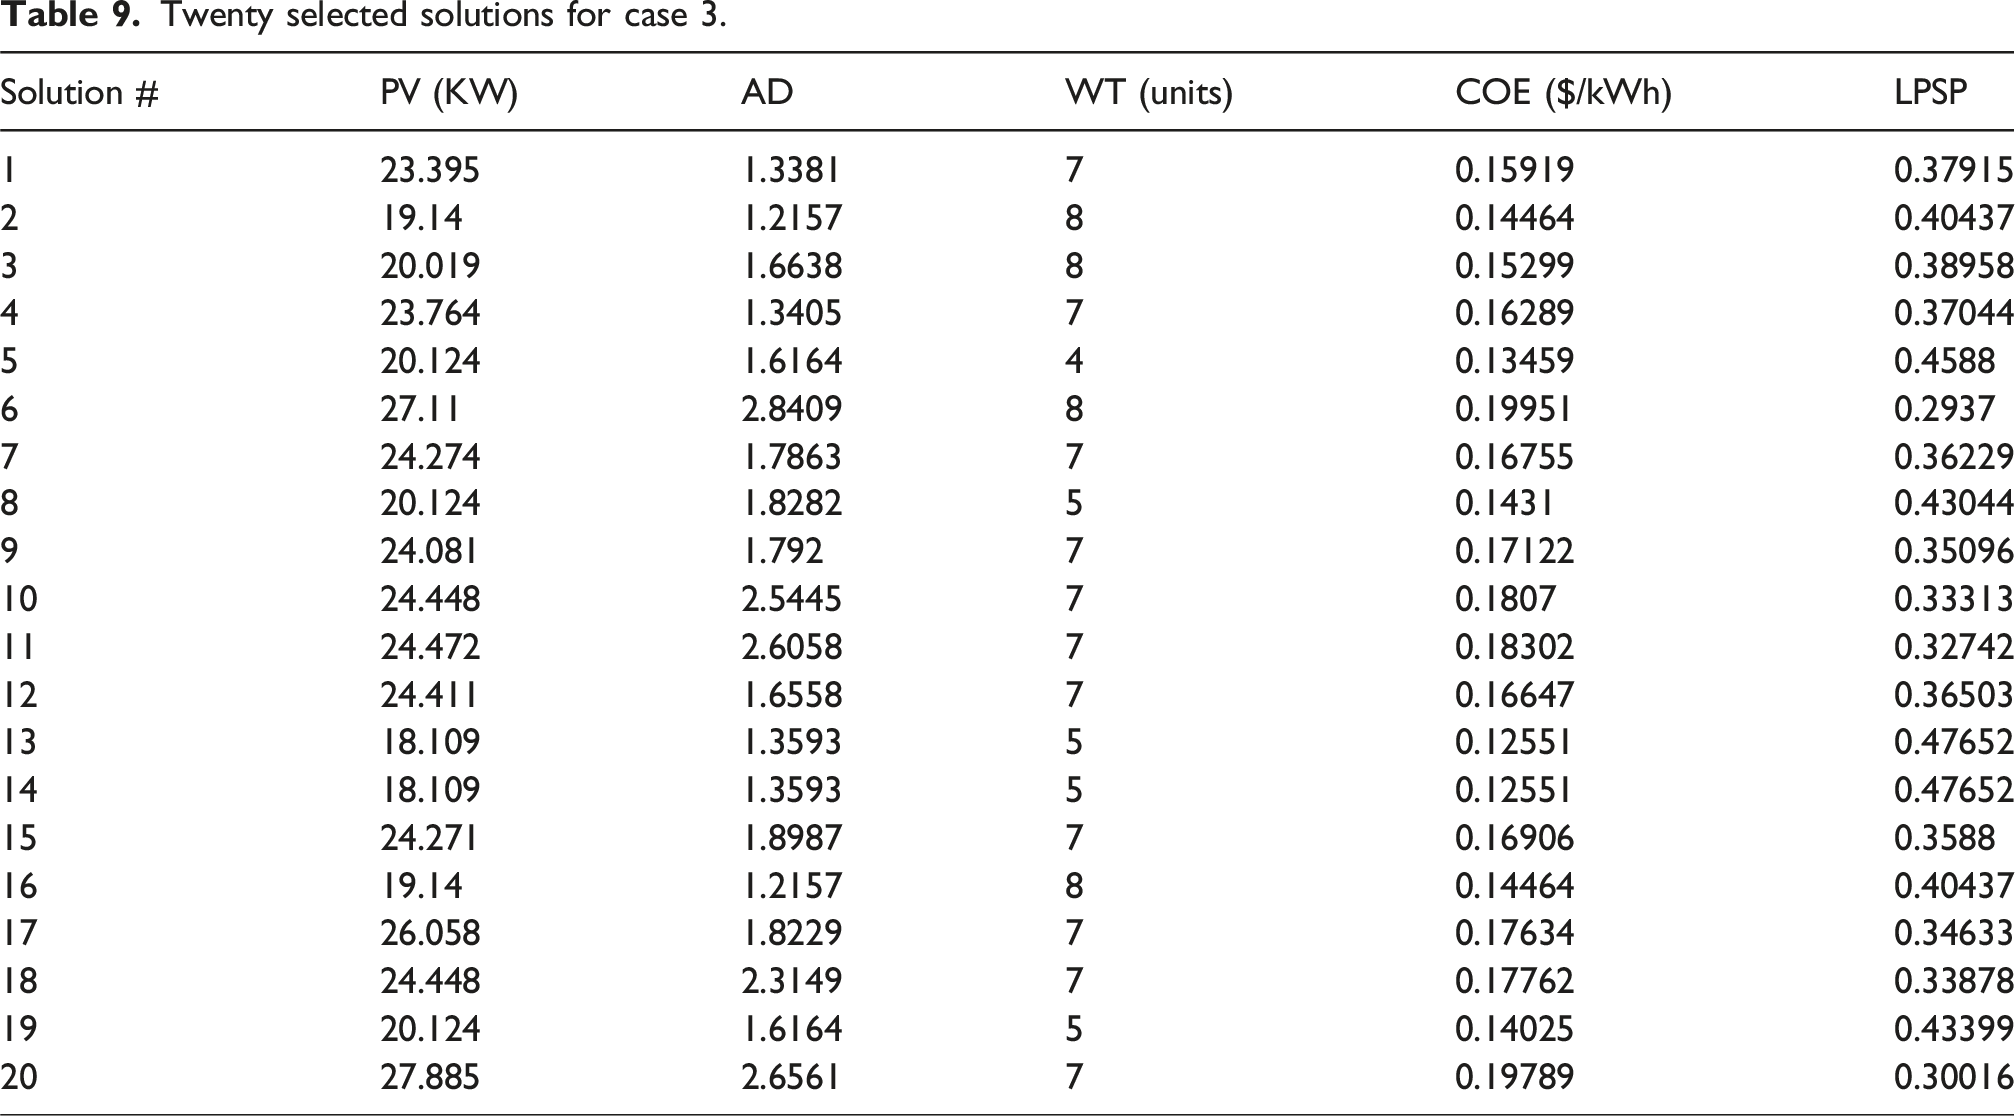
When comparing the outcomes of solution #13 with those of solution #6, it was found that the COE decreased from 0.19951$/kWh to 0.12551$/kWh and the LPSP increased from 29.37% to 47.7% as a result of the PV panels’ energy contribution reducing from 27.11 kW to 18.109 kW. WT’s contribution was reduced from eight to five.
Seven wind turbines, 2.5445 days of autonomy, and 24.448 kW of PV panels make up the system for the tenth solution. This corresponds to an LPSP of 33.313% and a COE of 0.1807 $/kWh.
In this case (involving stochastic modeling), the planning LPSP of 33.313% is higher compared to deterministic modeling of 30.179%, the generation of power from renewable resources is falling short of its expected levels. As a result, there are less sources of renewable energy (PV and WT) than in the deterministic model.
Figure 7(b) shows the energy contribution of each type of source, such as batteries, wind turbines, and photovoltaic panels, for three different solutions. It is evident that the contributions of each power source vary from one solution to the next.
Case 4: The probabilistic planning of load
The results on the Pareto front display a range of design decision options (non-dominated solutions) in addition to an optimum solution. The results of the MOWCA approach are presented in the following section after load uncertainty is taken into account. The load uncertainties are modeled using the RO optimization method.
Twenty selected solutions for case 4.
System performance for case 4. (a) The Pareto solutions for case 4 and (b) Power shears by different sources of HMSs.
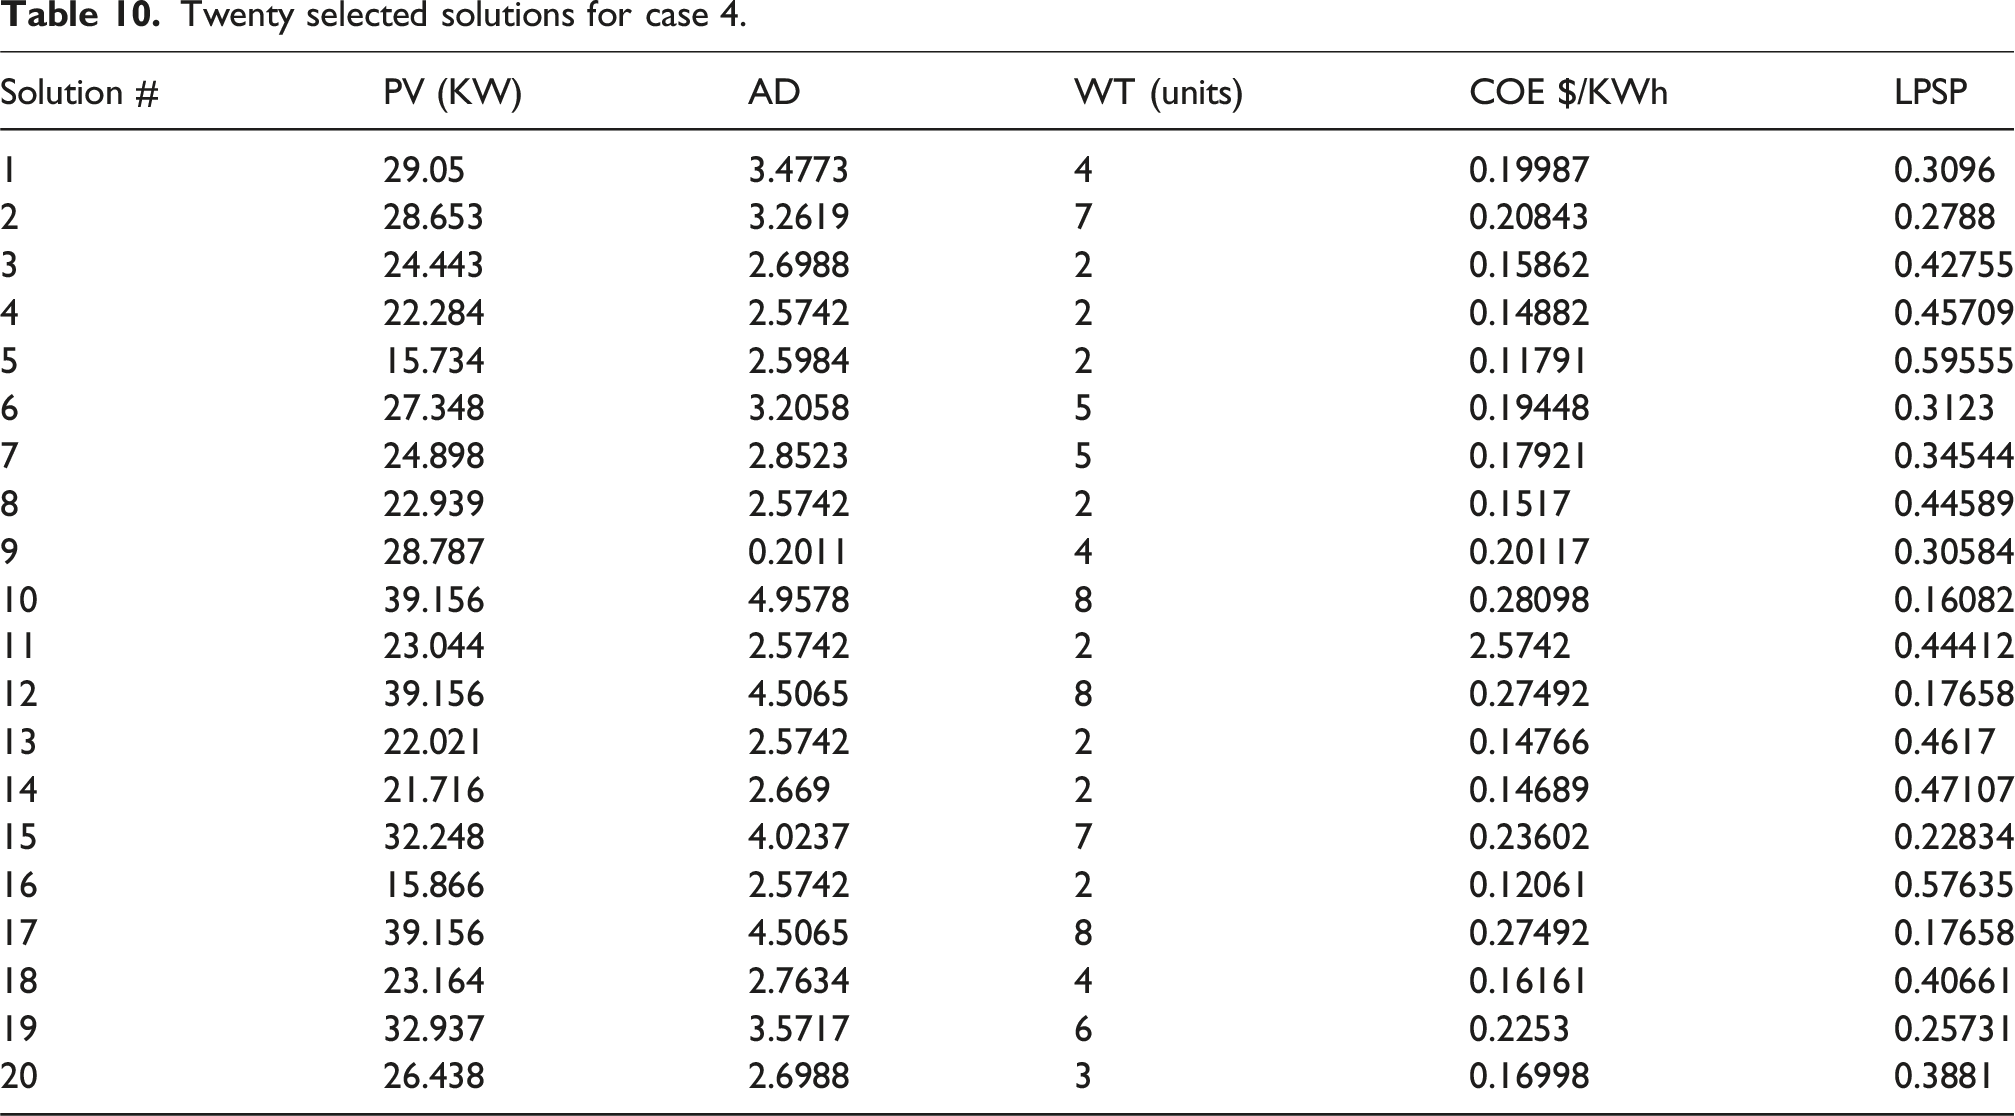
The PV panels will produce 39.156 kW of power, the autonomy days will be 5 days, and eight wind turbines will be needed if the designer chooses solutions #10. It can be observed that, in comparison to the other solutions that are available, compared to the other solutions that are available, the LPSP of 16% has lower values, and the COE 0.28098 $/kW h has higher values.
In the event that the designer selects solutions #16, two wind turbines are needed, the autonomy days equal 3, and the power produced by the PV panels is 15.866 kW. This solution has an LPSP of 57.6% and a COE of 0.12061 $/kW h.
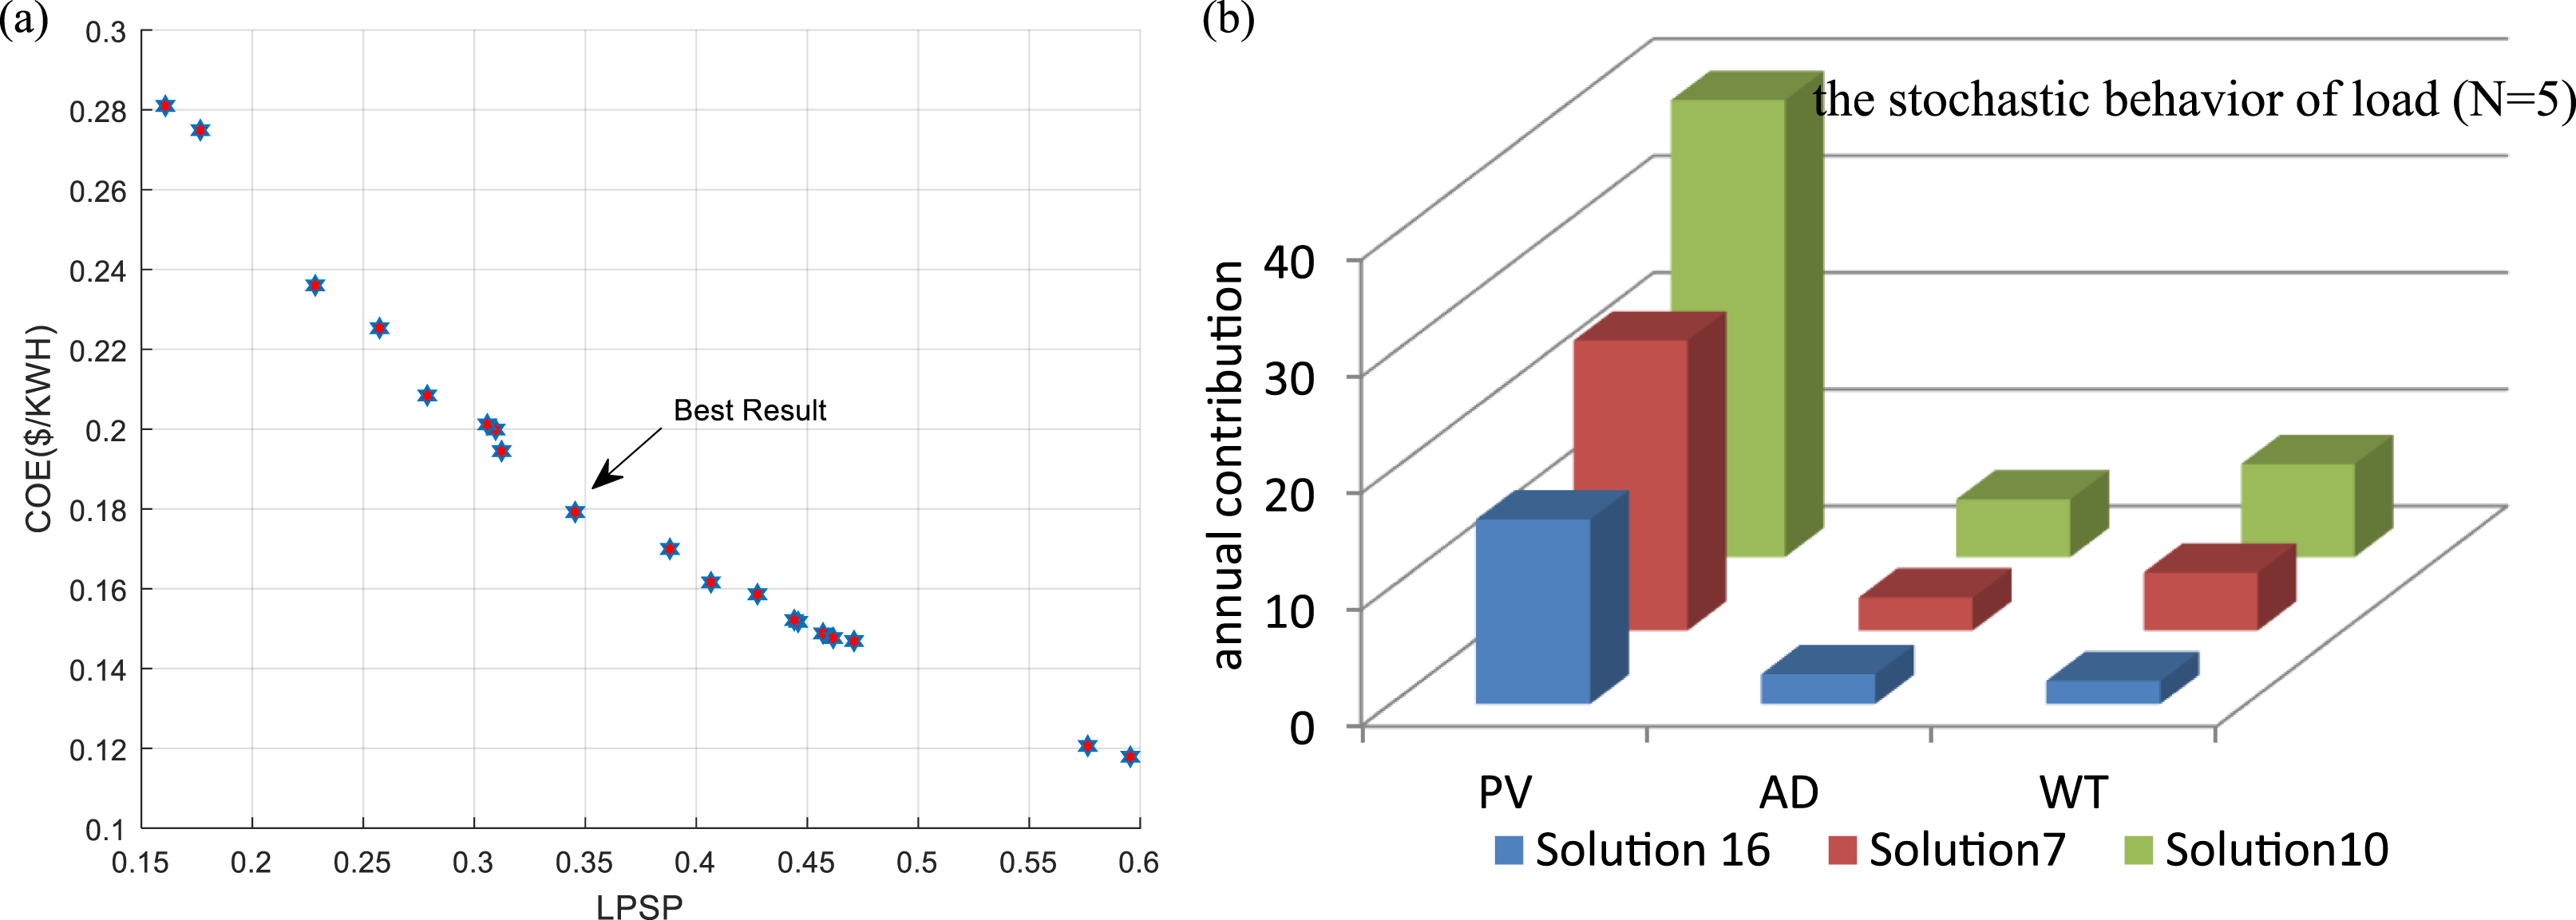
Solution #7 provides the best optimal solution; it is made up of five wind turbines, 24.898 kW of PV panels, and 2.8523 days of autonomy. The LPSP is 34.544% and the corresponding COE is 0.17921 $/kWh. As compared to case 3, the effect of load uncertainty in the current case raises all objective values (LPSP and COE) as well as the total output of the AD, PV, and WT units.
In this case, the planning LPSP of 34.544% is higher compared to deterministic modeling of 30.179% (case 2), Power generation from RESs is not meeting anticipated levels. Consequently, there are fewer renewable energy sources like photovoltaic and wind turbines compared to what the deterministic model predicts.
Case 5: The probabilistic planning of REP and load
In this case, Numerous DERs that rely on RESs, like photovoltaic and wind turbine energy sources and storage systems, are included taking into account the random behavior of these resources and load in order to increase the economic and technical benefits by minimizing COE and LPSP. This improves the robustness and flexibility of the suggested system planning and increases the reliability of the analysis. PEM and RO optimization methods are presented to model the RES and load uncertainties, respectively.
Figure 9(a) displays the Pareto fronts derived from the MOWCA method according to the uncertainty generated by the load and REP (the random variable of PV units like solar irradiance and WT unit such as wind speed is considered as probabilistic). The annual energy contribution for wind turbines, PV panels, and batteries is shown in Figure 9(b). The detailed results for 20 selected solutions based on PF have been listed in Table 11. System performance for case 5. (a) The Pareto solutions for case 5 and (b) Power shears by different sources of HMSs. Twenty selected solutions for case 5.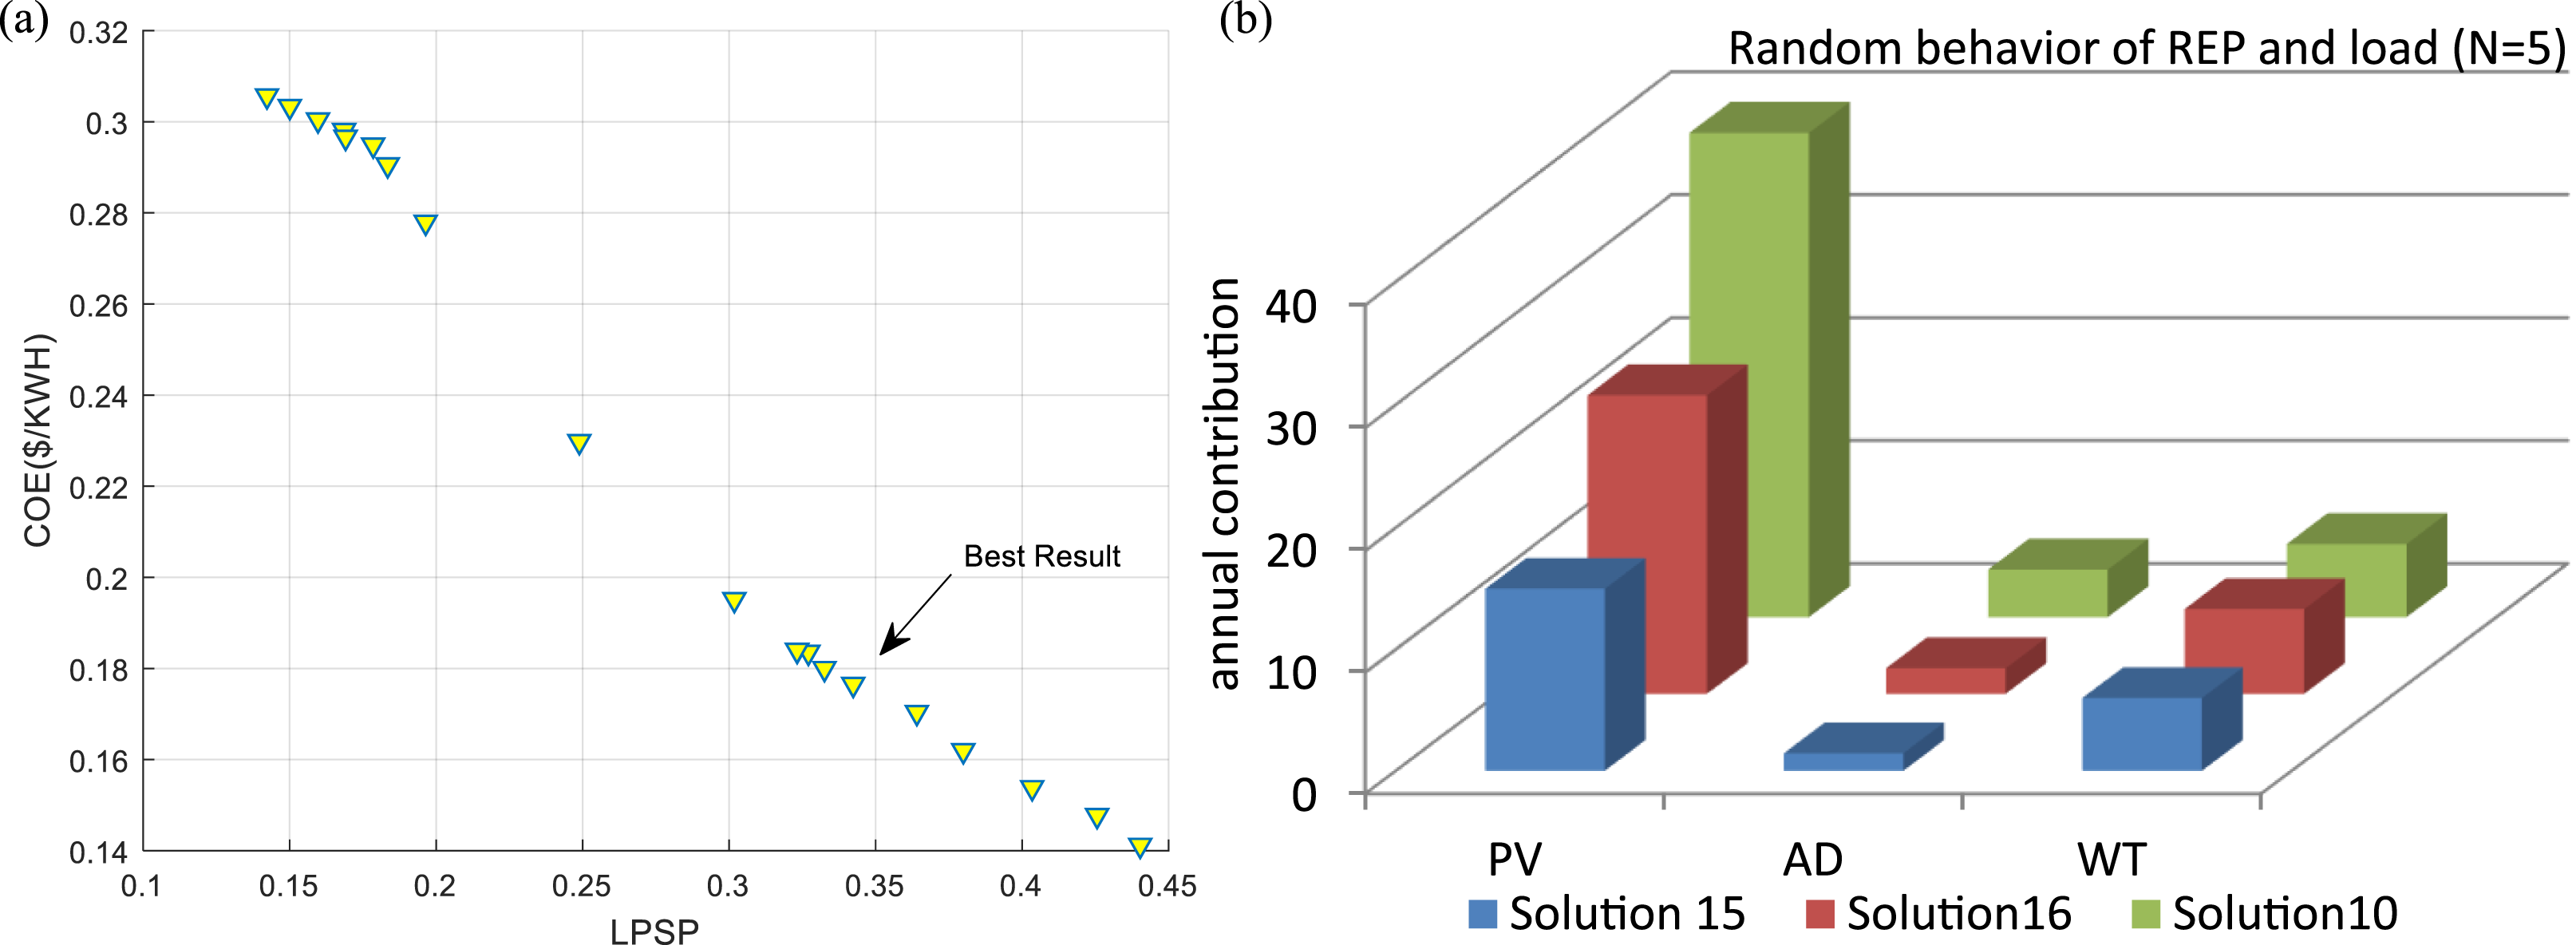
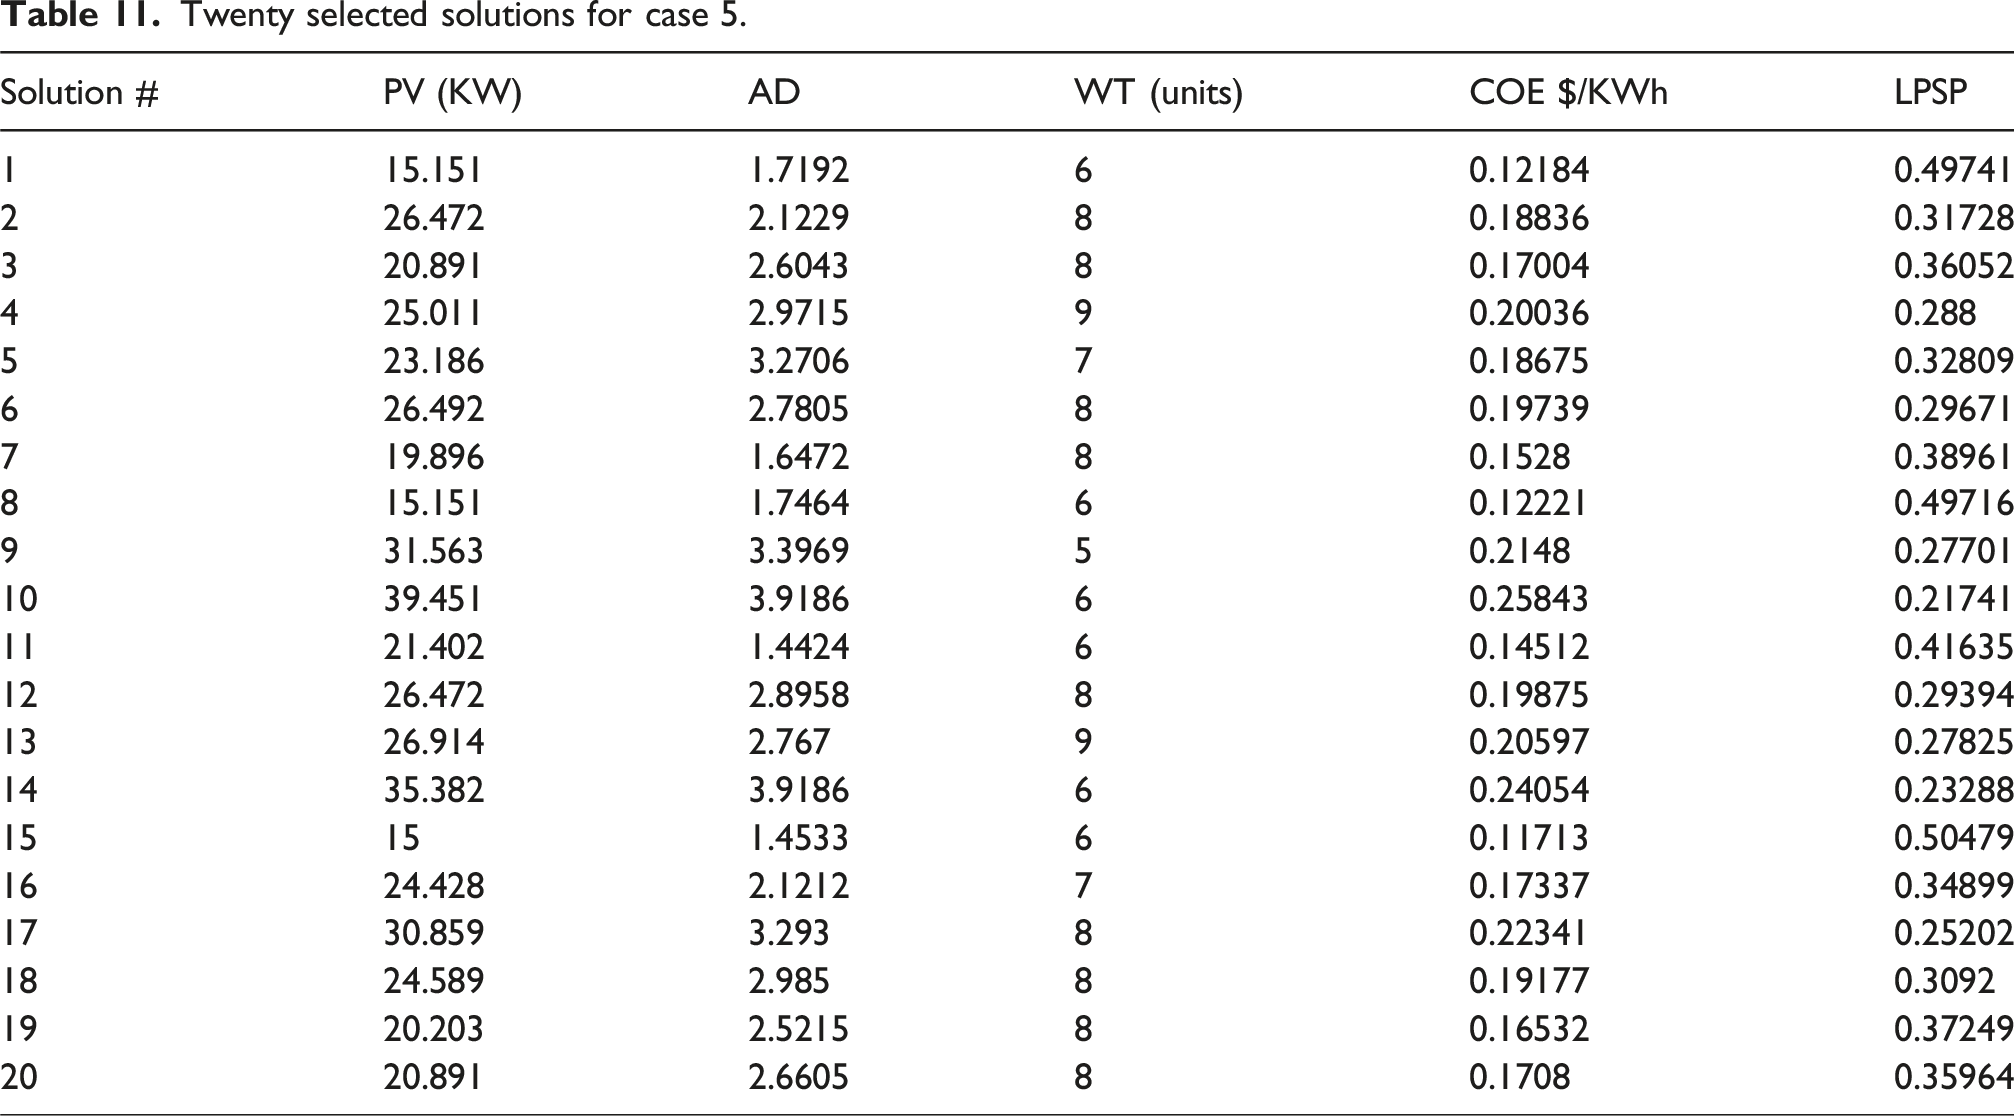
The solution #10 uses 6 wind turbines, 4 autonomy days, and 39.451 kW of power from PV panels. This solution has a COE of 0.25843$/kWh, and an LPSP of 21.7%. Notably, the LPSP has a lower value and the COE has a higher value than the other alternatives.
If the designer selects solution #15, 15 kW of power is generated by the PV panels, the autonomy days are 1.4533 days, and six wind turbines will be needed. It is evident that the COE of 0.11713 $/kW h has a lower value and the LPSP of 50.479 % has a higher value when compared to the other solutions.
Solution #16, which includes seven wind turbines, 2.1212 days of autonomy, and 24.428 kW of PV panels, is the best solution. The LPSP is 34.899 %, and the corresponding COE is 0.17337 $/kWh. Compared to case 3 (RESs uncertainty), and case 4 (load uncertainty), Because of the uncertainty created by RESs and load increasing all objective values (LPSP and COE) in addition to increasing the total capacity of AD, PV, and WT units), these are the worst outcomes that have been found. As compared to case 2, the effect of uncertainty in the current case raises LPSP from 30.179% to 34.899 %. In all case studies, the planning LPSP associated with stochastic modeling tend to be higher than those for deterministic modeling.
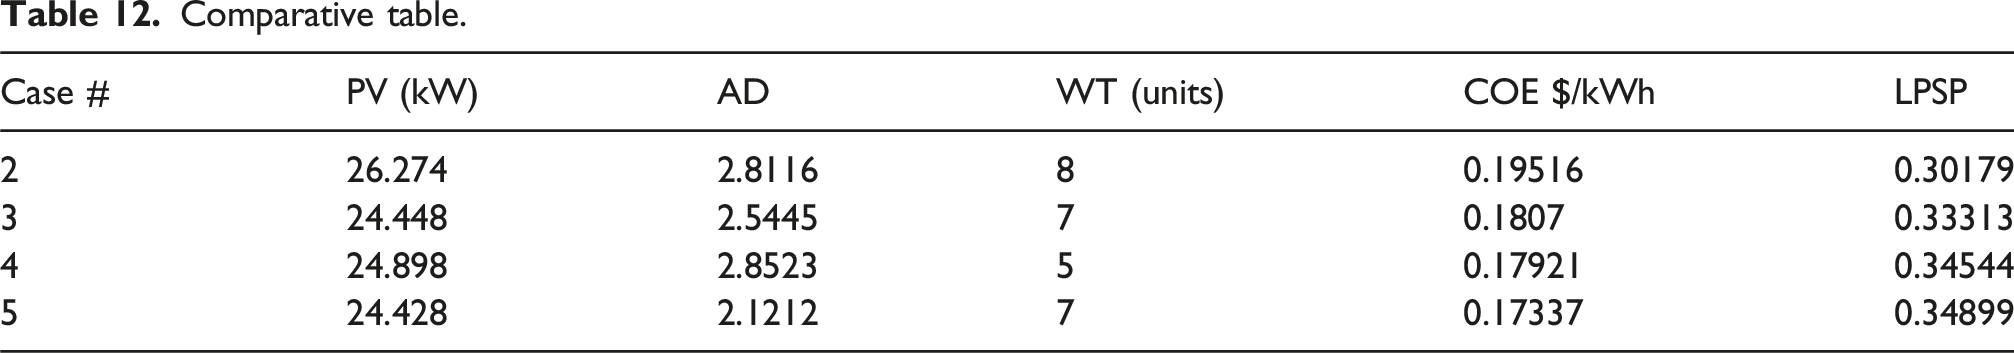
A comparison of micro-grid energy generation’s contribution
Comparative table.
Energy shares by various sources of HMSs.
The losses in case 5 are greater than the losses obtained in the same loading operation without an uncertainty effect because the influence of probabilistic modeling of wind, solar powers, and load is taken into consideration.
For the PV/WT/BESU configuration without considering the impact of uncertainties, the amount of energy provided by renewable resources (WT and PV panels) are 8 wind turbine and 26.274 kW, which are higher as compared to other contribution.
In comparison to the outcomes of case 2, the amount of electricity that comes from renewable resources is lower for the PV/WT/BESU configuration with RES uncertainty and PV/WT/BESU configuration with load demand uncertainty.
With load and RES uncertainties, the suggested algorithm produced the worst optimization result (max loss) for the PV/WT/BESU configuration. As the size of HMS reduced, the cost objective function reduced as well.
A comparison between an LPSP and a COE using various architecture combinations was conducted. Figure 11(a) and 11(b) illustrate the results of an analysis of the suggested algorithm for each architecture. The first configuration has the lowest LPSP of 30.1% and highest COE of 0.19516$/kWh. The fourth configuration earned the greatest LPSP of 34.8%, and the smallest cost of PV and WT components (COE) of 0.17337 $/kWh. Different objective function for scenario 2. (a) COE for each case and (b) LPSP for each case.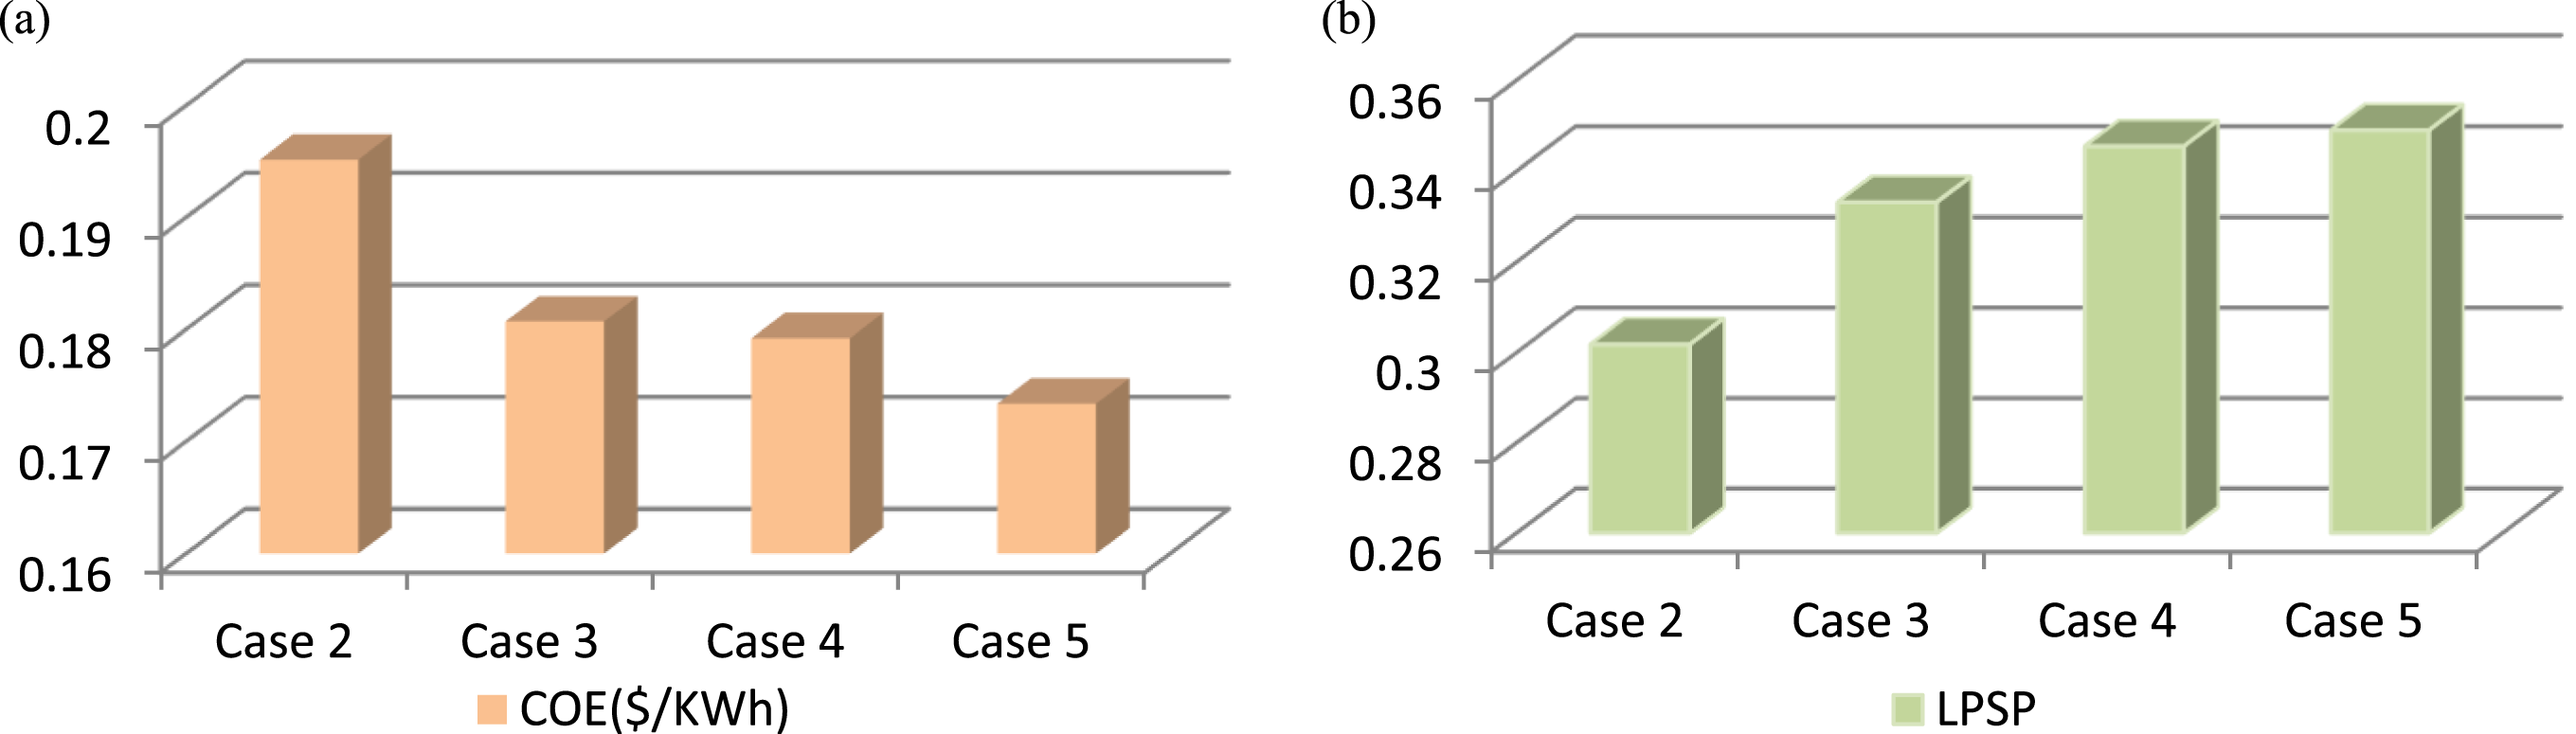
Scenario 2: Heavy loading condition (N = 15)
Based on the number of houses, the micro-grid operates under heavy loading conditions. To confirm the efficacy and capability of the suggested algorithm (MOWCA), several kinds of DER types based on RES, like WT and PV energy sources and batteries, or “storage energies,” are added when the number of houses equals 15. The increase in the number of homes from 5 to 15 in comparison to scenario 2 results in higher power generation from RESs (PV and WT) with storage systems, which raises the values of all objective functions (COE, LPSP).
Case 6: Deterministic planning of REP and load at N = 15
When the number of houses is equal to 15, a variety of DERs depend on RES, such as PV and WT energy sources and batteries, or “storage energies,” are added to confirm the efficacy and capability of the suggested algorithm based on deterministic behavior of the load and RES, the resulting Pareto fronts are displayed in Figure 12(a). System performance for case 6. (a) The Pareto solutions for case 6 and (b) Power shears by different sources of HMSs.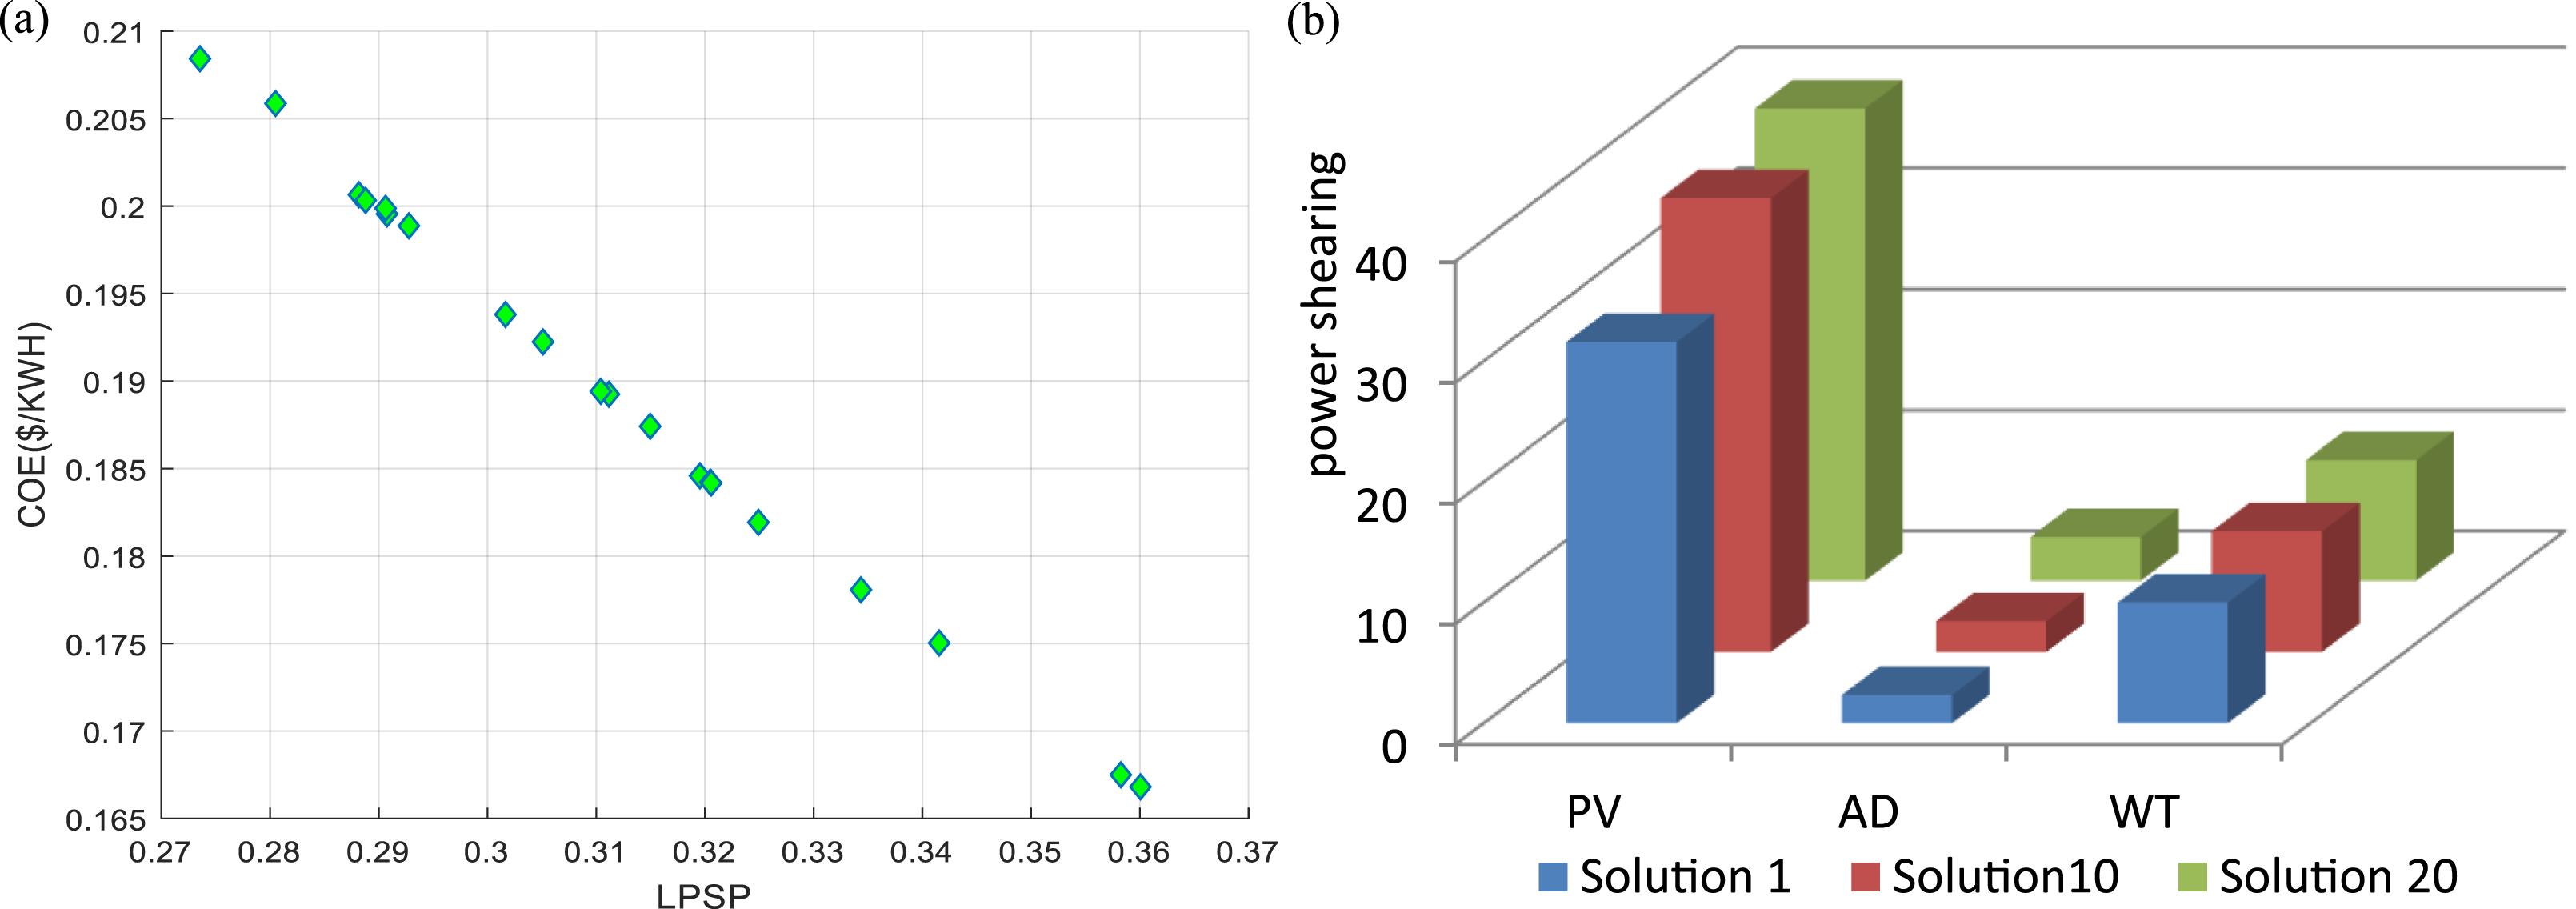
Twenty selected solutions for case 6.
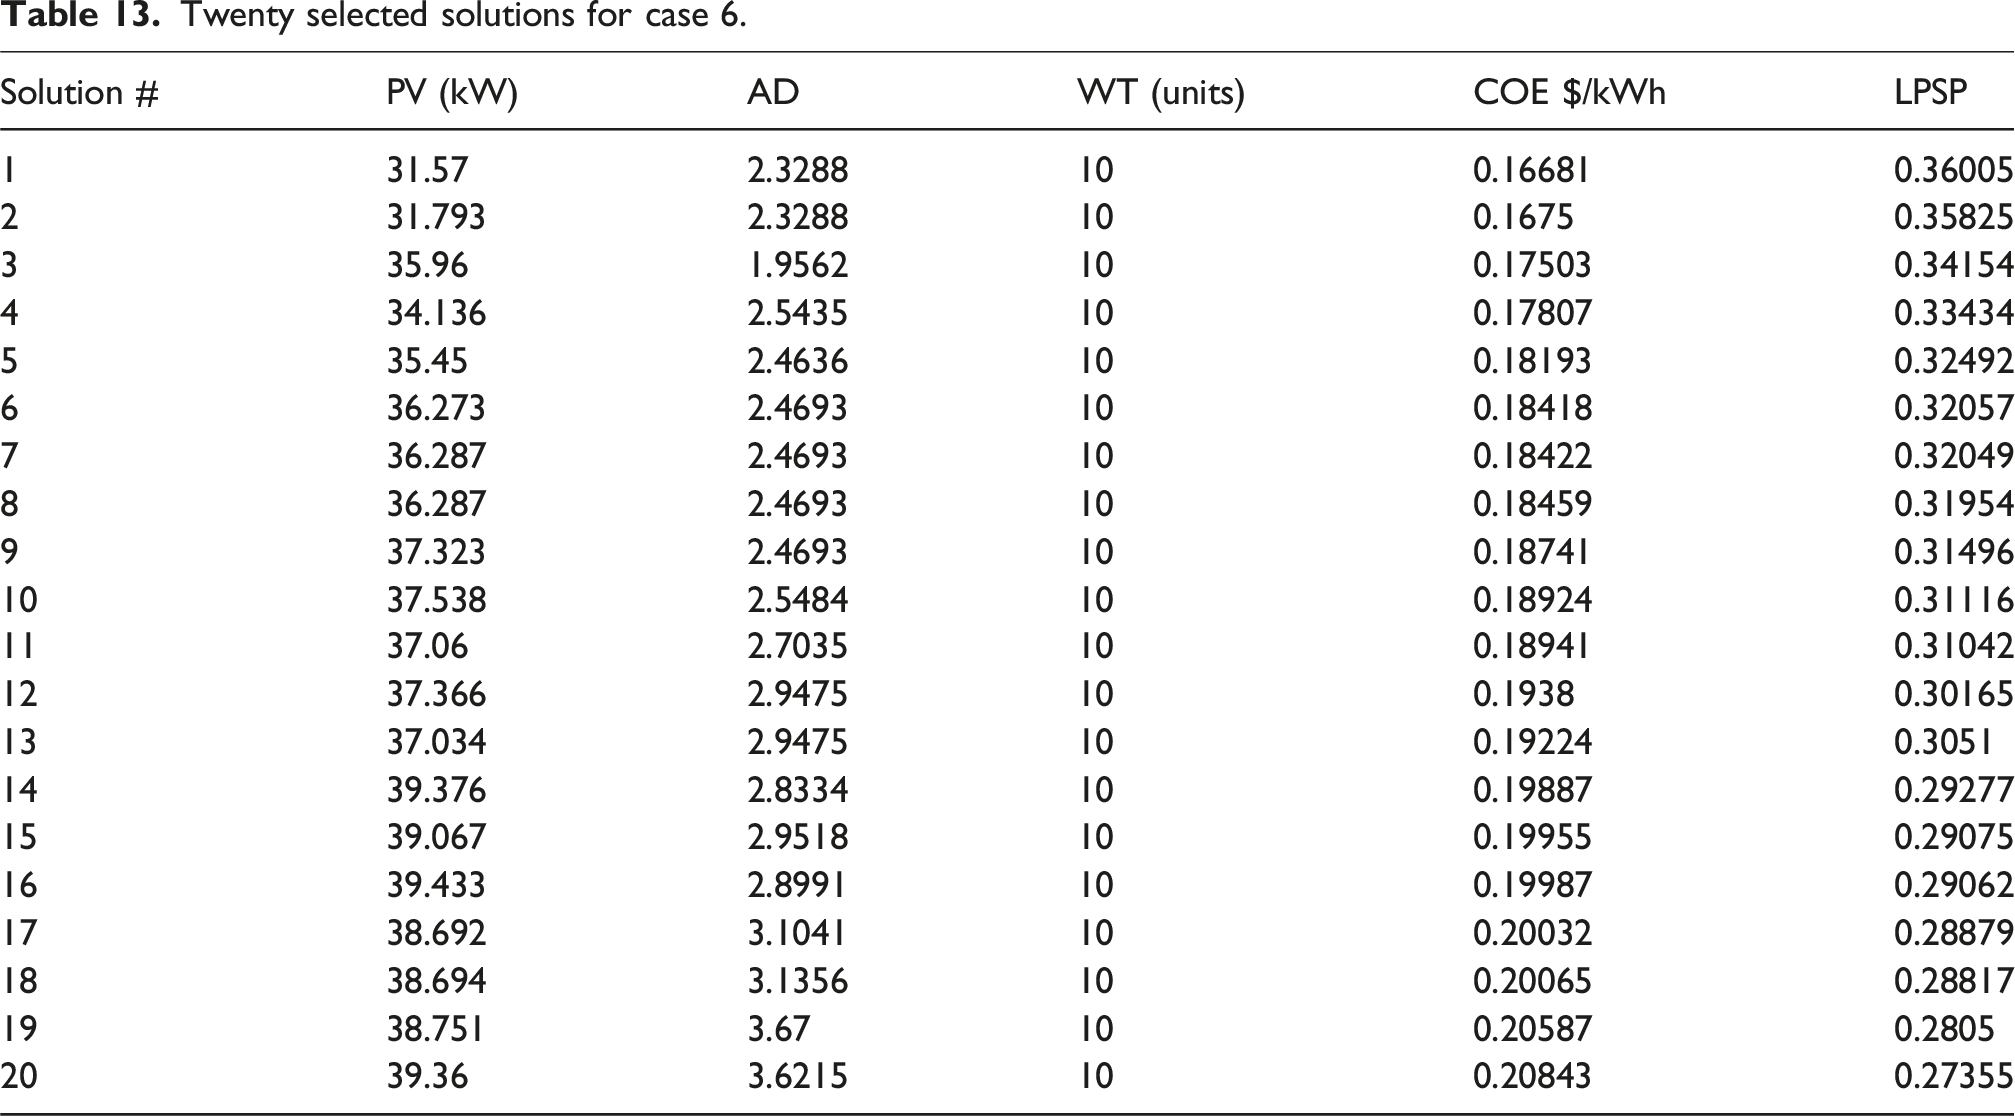
The system in Solution #1 of CASE 6 consists of 10 WTs, 2.3288 days of autonomy, and 31.57 kW of power from PV panels. For this solution, the corresponding COE and LPSP values are 36.005% and 0.16681 $/kWh, respectively.
For solution #20 in the same case, the system has 10 WTs, 3.6215 days of autonomy, and 39.036 kW of PV panels’ power. The COE and LPSP for this solution are 0.20843 $/kWh and 27.355%, respectively.
The system for the tenth solution includes 10 wind turbines, 2.5484 days of autonomy, and 37.53 kW of PV panels. This corresponds to an LPSP of 31.116% and a COE of 0.18924 $/kWh.
Relative to case 2, the increase in houses from 5 to 15, prompts arise in power generation from PV panels from 26.274 kW to 37.53 kW, the amount of WT augmented from 8 to 10 wind turbines. This would bring about higher COE values from 0.19516 $/kWh to 0.18924 $/kWh, LPSP is found at 30.179% and 31.116%, respectively.
Figure 12(b) for three solutions shows the energy produced by each type of source, such as wind turbines, batteries, and photovoltaic panels. It is evident that the number of WT units is close to the maximum number (WT = 10), and the contributions of other units (PV and AD) are nearing to the maximum limits.
Case 7: The probabilistic planning of REP
In this instance, RES like PV and WT energy sources are presented taking into account their stochastic behavior in order to increase the robustness and flexibility of the suggested system under planning and increase the reliability of the analysis. The uncertainties of RES are modeled using the PEM method.
The Pareto front of the stand-alone micro-grid system, which was produced by the suggested algorithm based on LPSP and COE objective functions, is shown in Figure 13(a). Table 14 shows the results of 20 selected solutions from the obtained PF. It is evident that the contributions of WT units are constant for all solution except solution #1, where the number of WT units is 9. Because of REP stochastic behavior, the LPSP value is larger than the outcomes shown in case 6. System performance for case 7. (a) The Pareto solutions for case 7 and (b) Power shears by different sources of HMSs. Twenty selected solutions for case 7.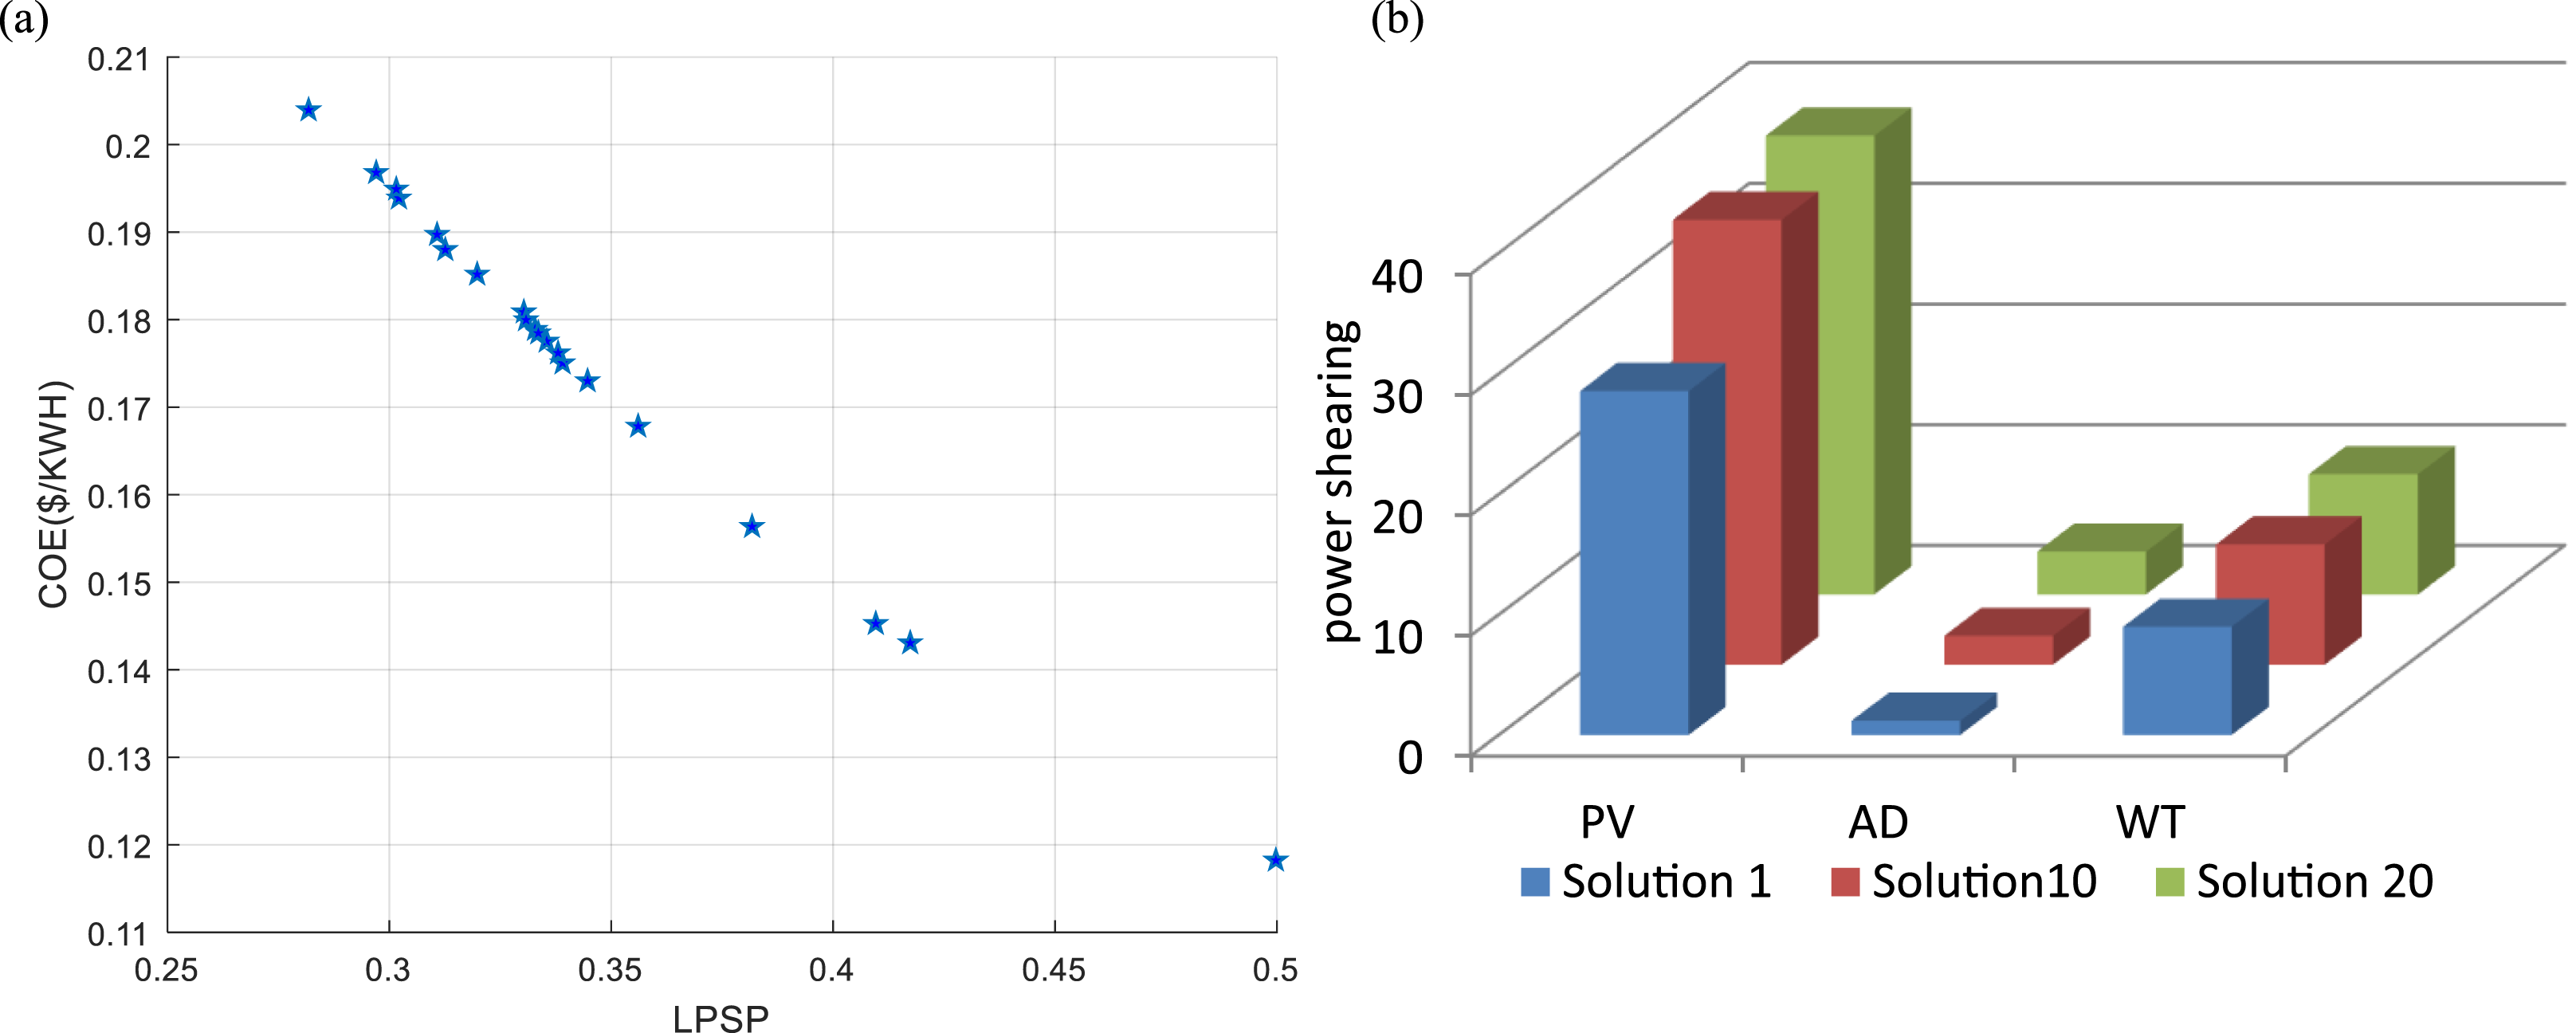
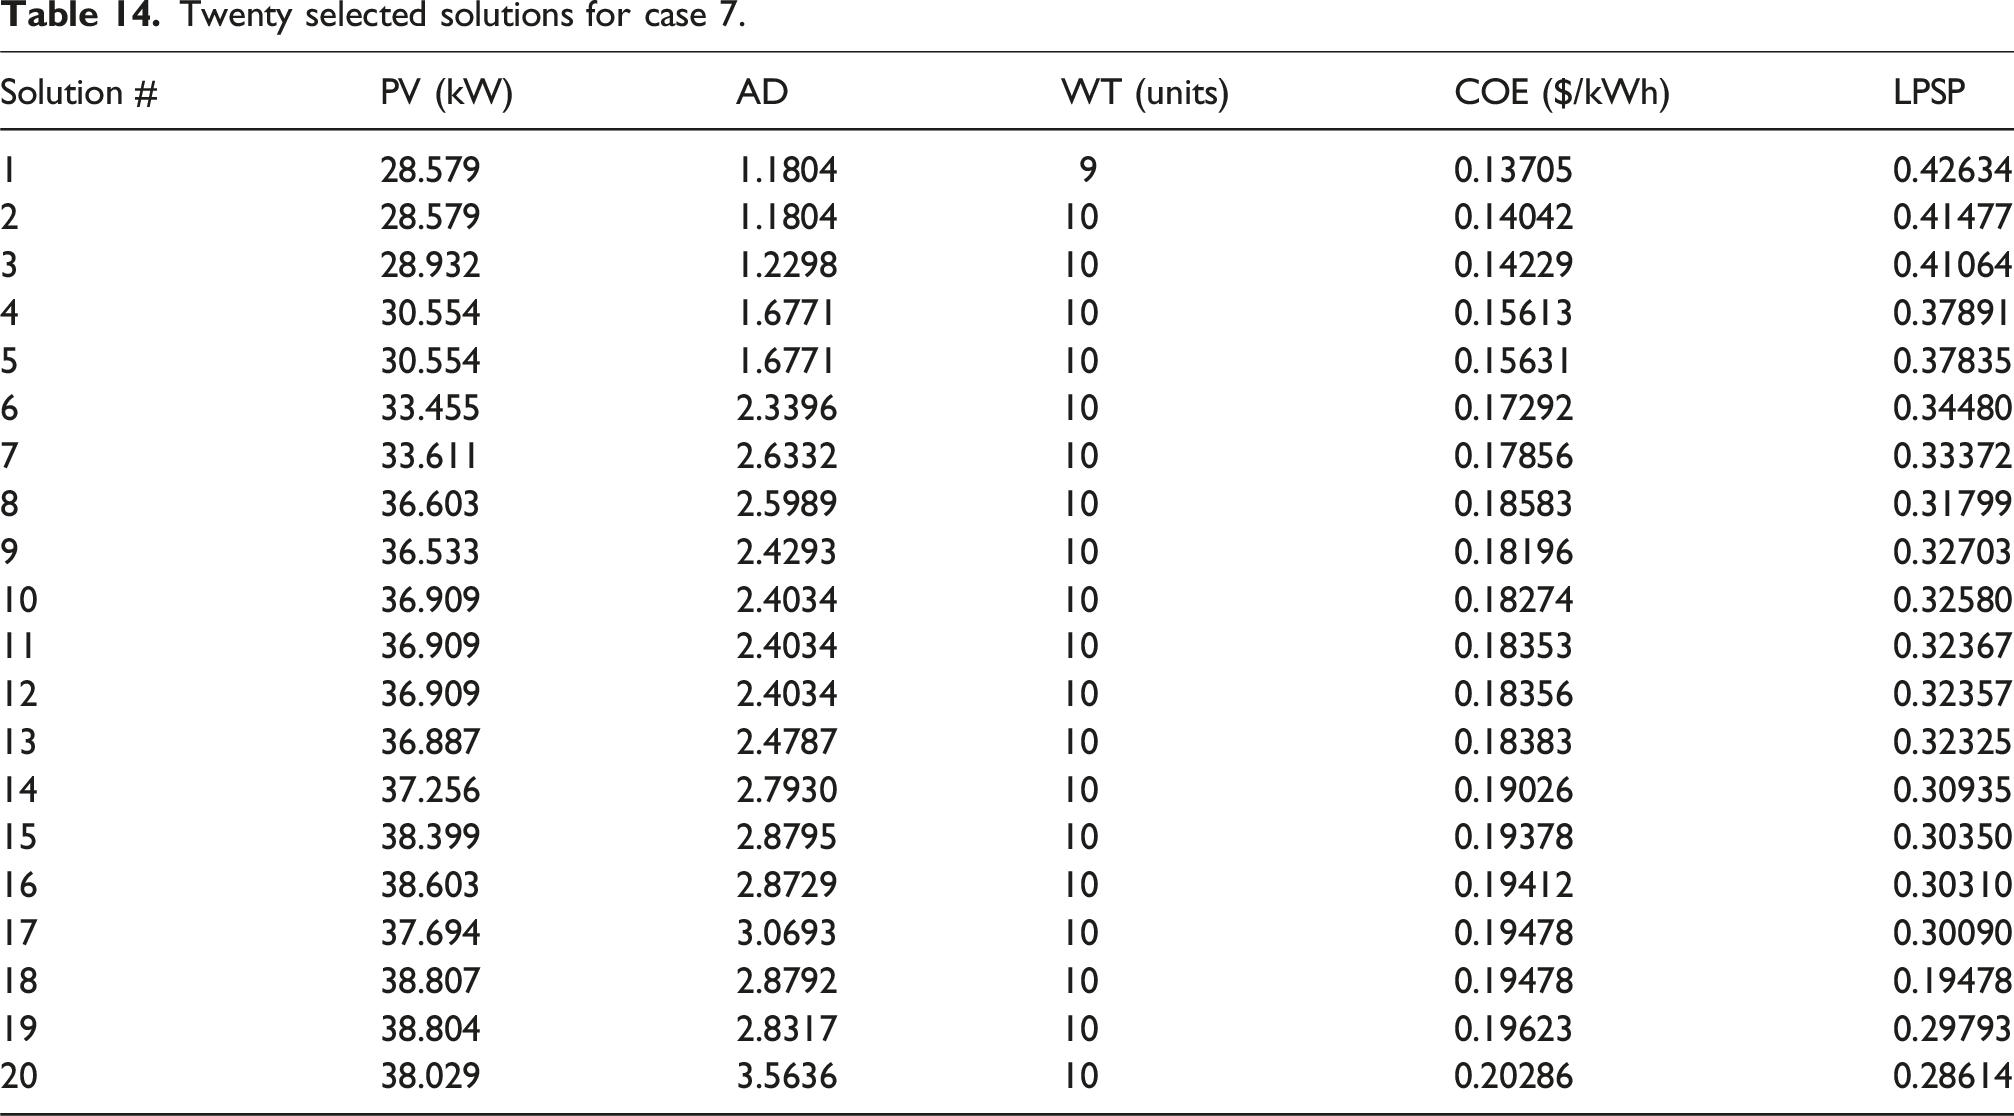
Solution #1 of case 7 can be described by a system that includes 9 WTs, 1.1804 days of autonomy, and 28.579 kW of power from PV panels. For this solution, the corresponding COE and LPSP values are 42.634% and 0.13705$/kWh, respectively.
Solution #20 is an additional solution that will be discussed here. This solution’s system has 10 WT, 3.5636 days of autonomy, and 38.029 kW of PV power. This gives a COE of 0.20286 $/kWh, and an LPSP of 28.614%.
Ten wind turbines, 2.4034 days of autonomy, and 36.909 kW of PV panels make up the system for the tenth solution of case 7. The associated COE is 0.18274 $/kWh, and the LPSP is 32.58%, which is higher compared to deterministic modeling (case 6) of 31.116 %. As a result, there are less sources of renewable energy (PV of 36.909 kW) than in the deterministic model (PV of 37.53 kW). Additionally, Figure 13(b) displays the various contributions of each component for three solutions (solutions #1, 10, and 20).
In comparison to case 3, the impact of increasing load (number of houses) in the present case elevates all objective values (LPSP and COE) as well as the overall output of the AD, PV, and WT units.
Case 8: The probabilistic planning of load
The results on the Pareto front display a range of design decision options (non-dominated solutions) in addition to an optimal solution. The MOWCA technique’s results are shown in the following section.
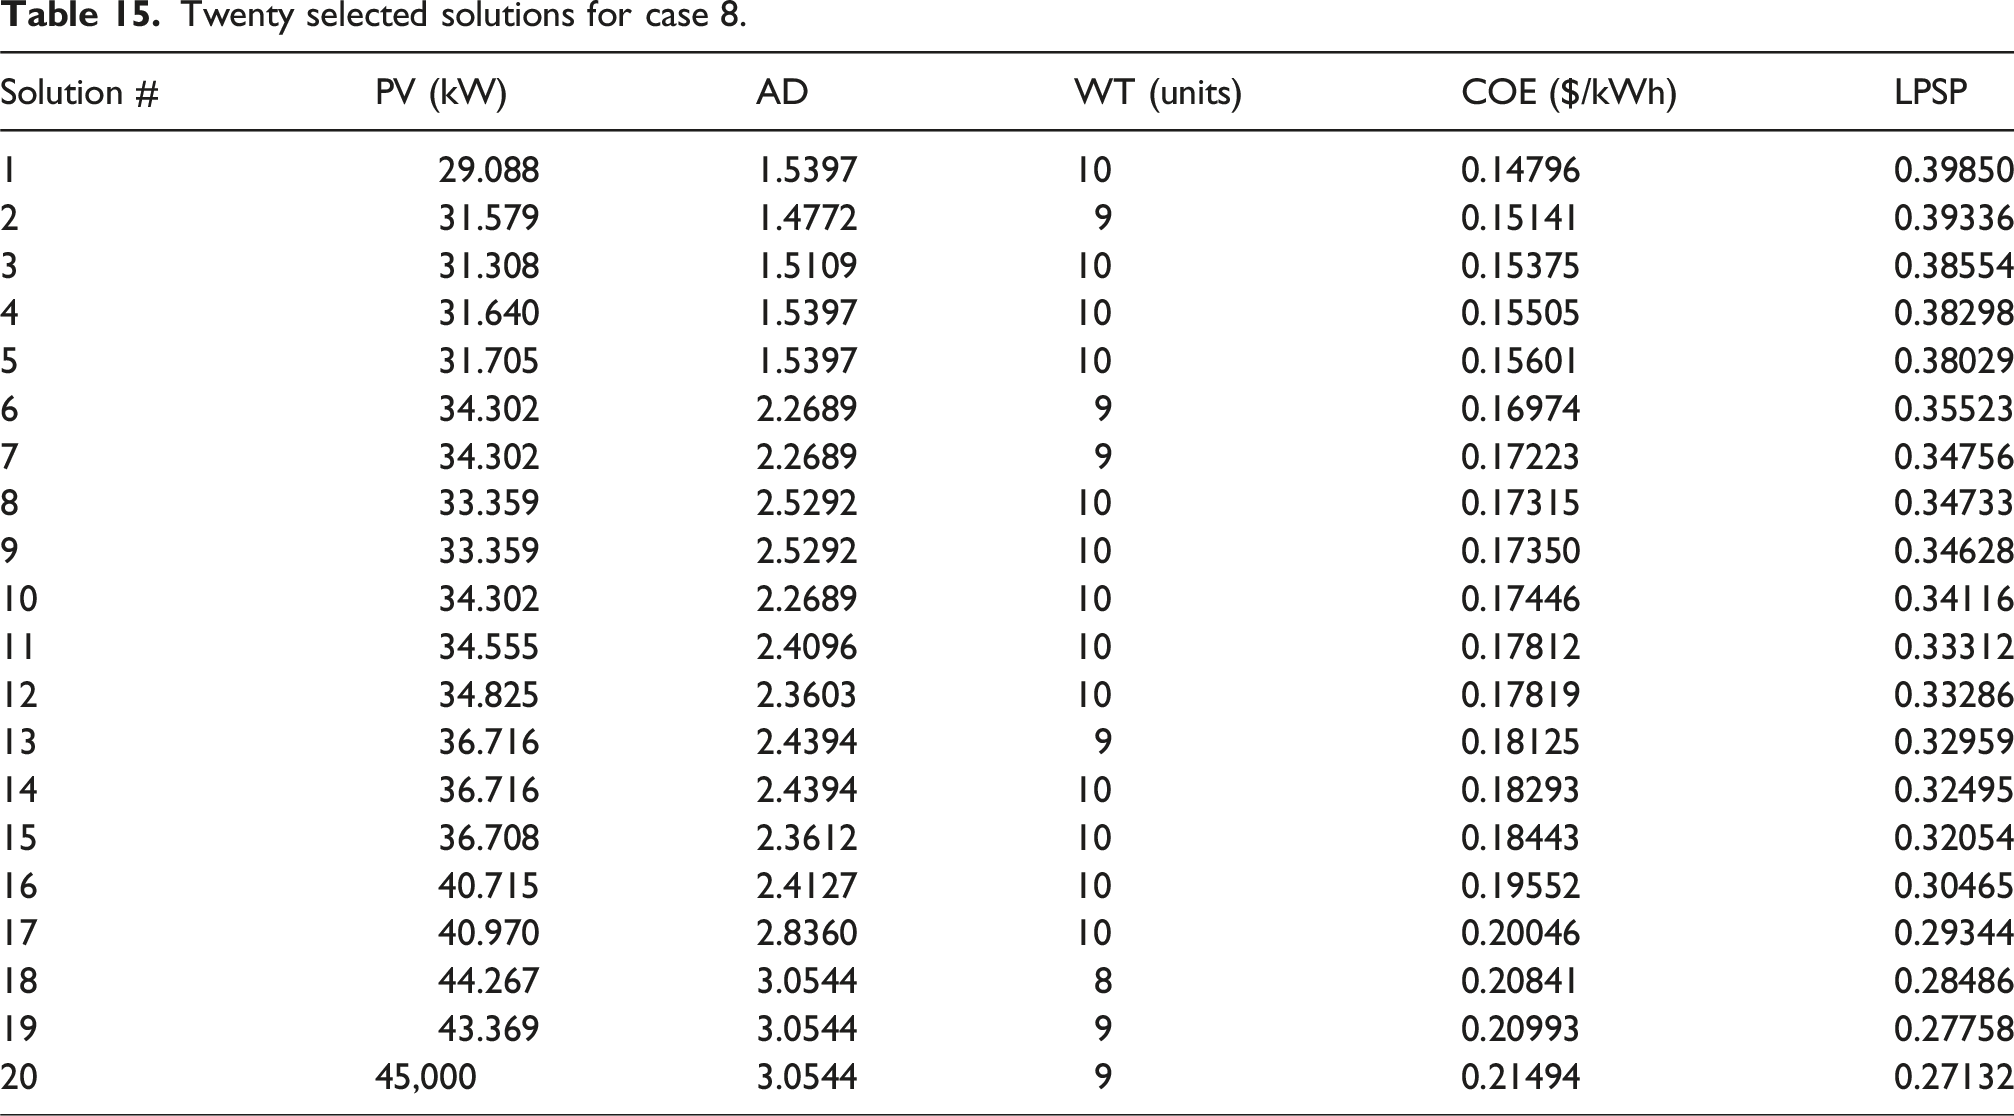
Twenty selected solutions for case 8.
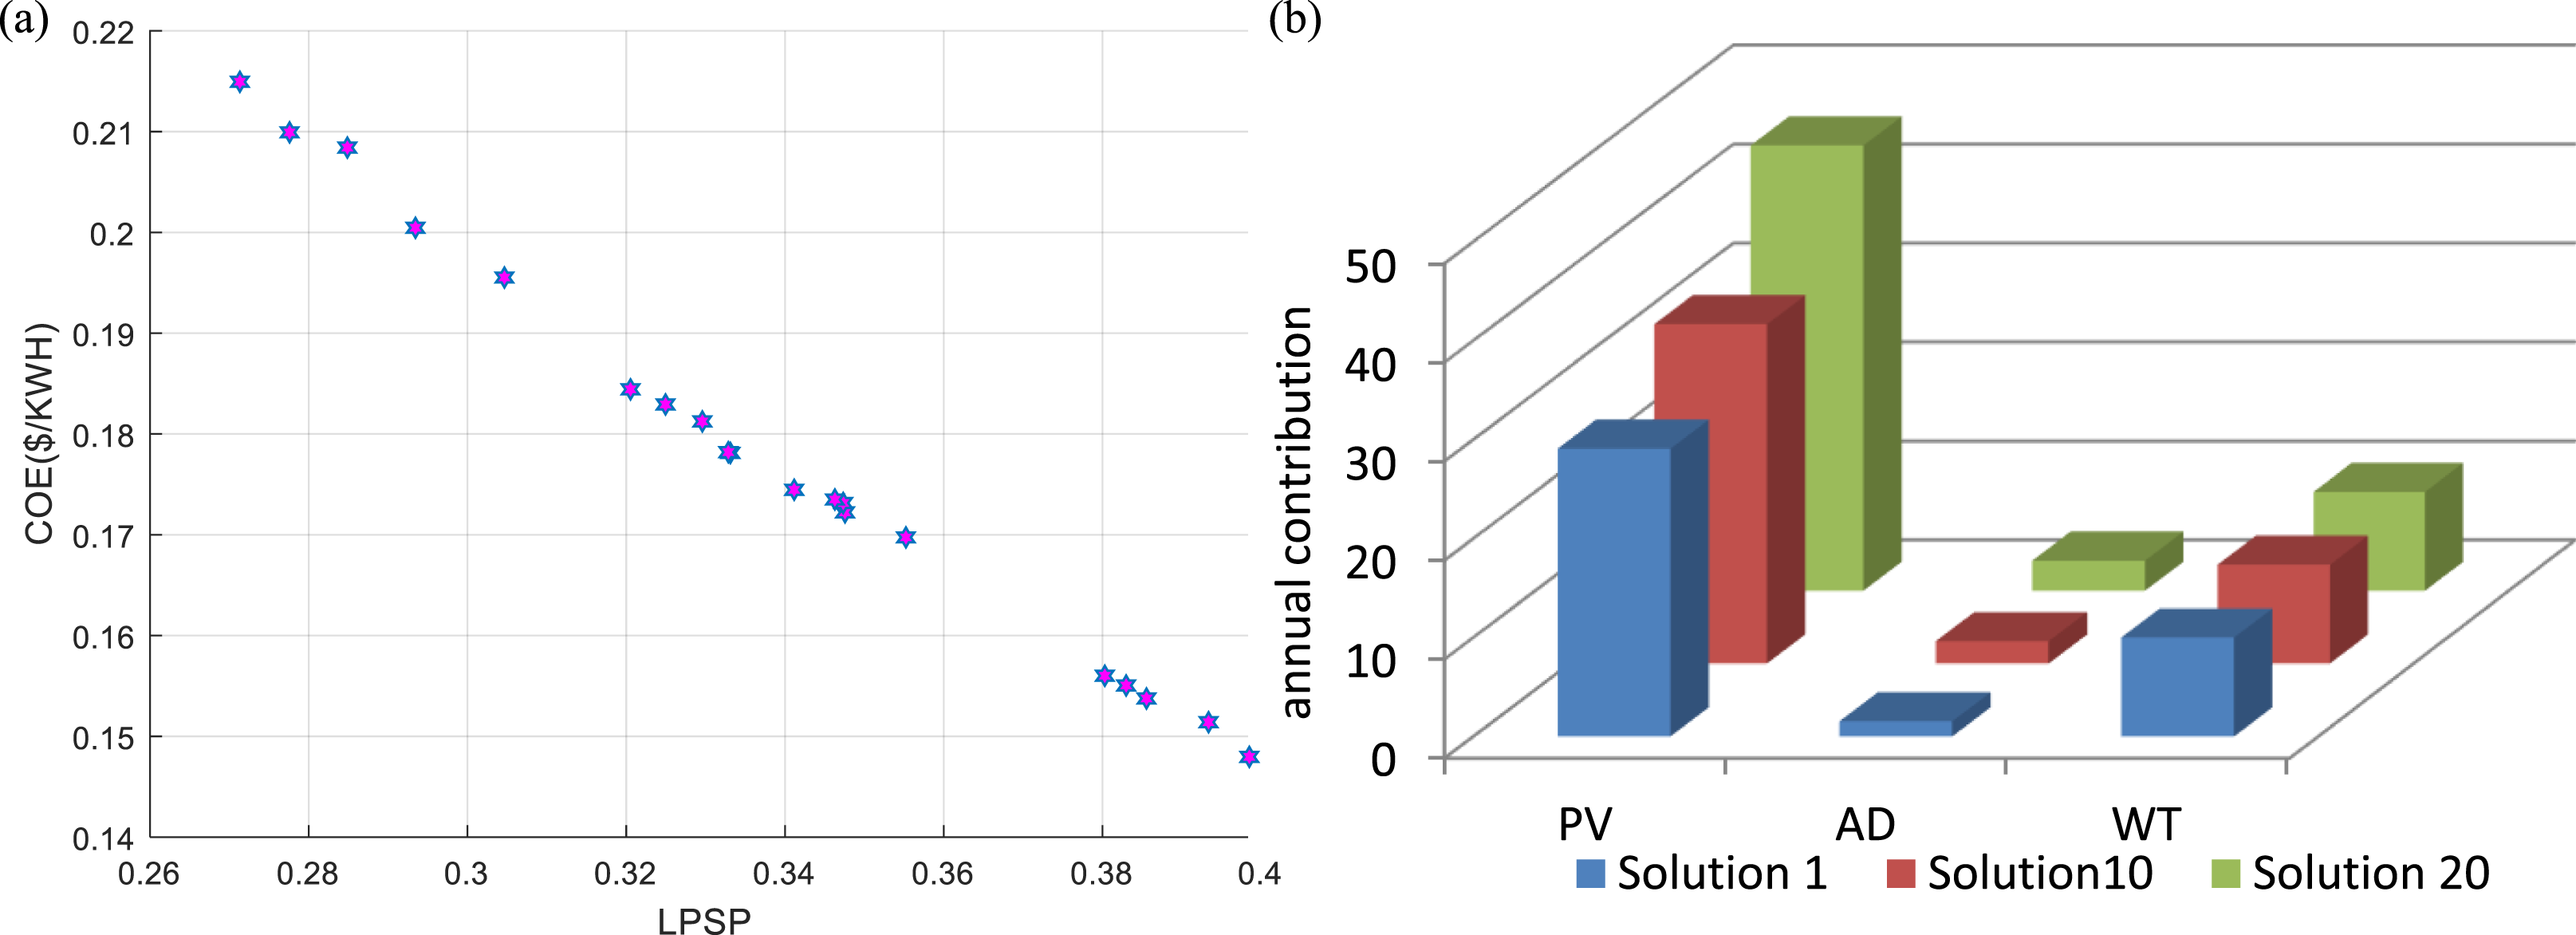
System performance for case 8. (a) The Pareto solutions for case 8 and (b) Power shears by different sources of HMSs.
If the designer chooses solution #1, the power produced from the PV panels is 29.088 kW, the autonomy days are 1.5397 days, and 10 wind turbines are needed. This solution is equivalent to an LPSP of 39.85% and a COE of 0.14796 $/kW h. It is obvious that the LPSP has a greater value and the COE has a lesser value when compared to the other solutions that are available.
If the designer chooses option #10, the PV panels will produce 34.302 kW of power, the autonomy days will be 2.2689, and 10 wind turbines will be needed. This solution is equivalent to an LPSP of 34.116% and a COE of 0.17446 $/kW h.
The designer will need nine wind turbines, 3.0544 autonomy days, and 45 kW of total power production from the PV panels if solution #20 is chosen. An LPSP of 27.132% and a COE of 0.21494 $/kW h are associated with this solution.
In contrast to case 7 (RESs uncertainty), the impact of load uncertainty in the present case increases LPSP from 32.58% to 34.116%. Here, the planned LPSP of 34.116% exceeds the 31.116% observed in deterministic modeling (case 6). This indicates that power generation from renewable energy sources is falling short of expected levels. As a result, there is a reduced deployment of renewable energy systems, such as photovoltaic panels and wind turbines, compared to the predictions made by the deterministic model.
The yearly energy contributions from the PV, WT, and AD sources in the power generation system under study for solutions #1, #10, and #20 of the suggested algorithm have been shown by Figure 14(b). It is evident that the energy production from the PV panels in solution #1 is lower than that of solutions #10 and #20, with an annual contribution of 29.088 kW. The WT and AD provide 10 units and 1.5397, respectively. The energy contribution of the WT and AD in solutions #10 and #20 is substantially higher than this.
Case 9: The probabilistic planning of REP and load
Twenty selected solutions for case 9.
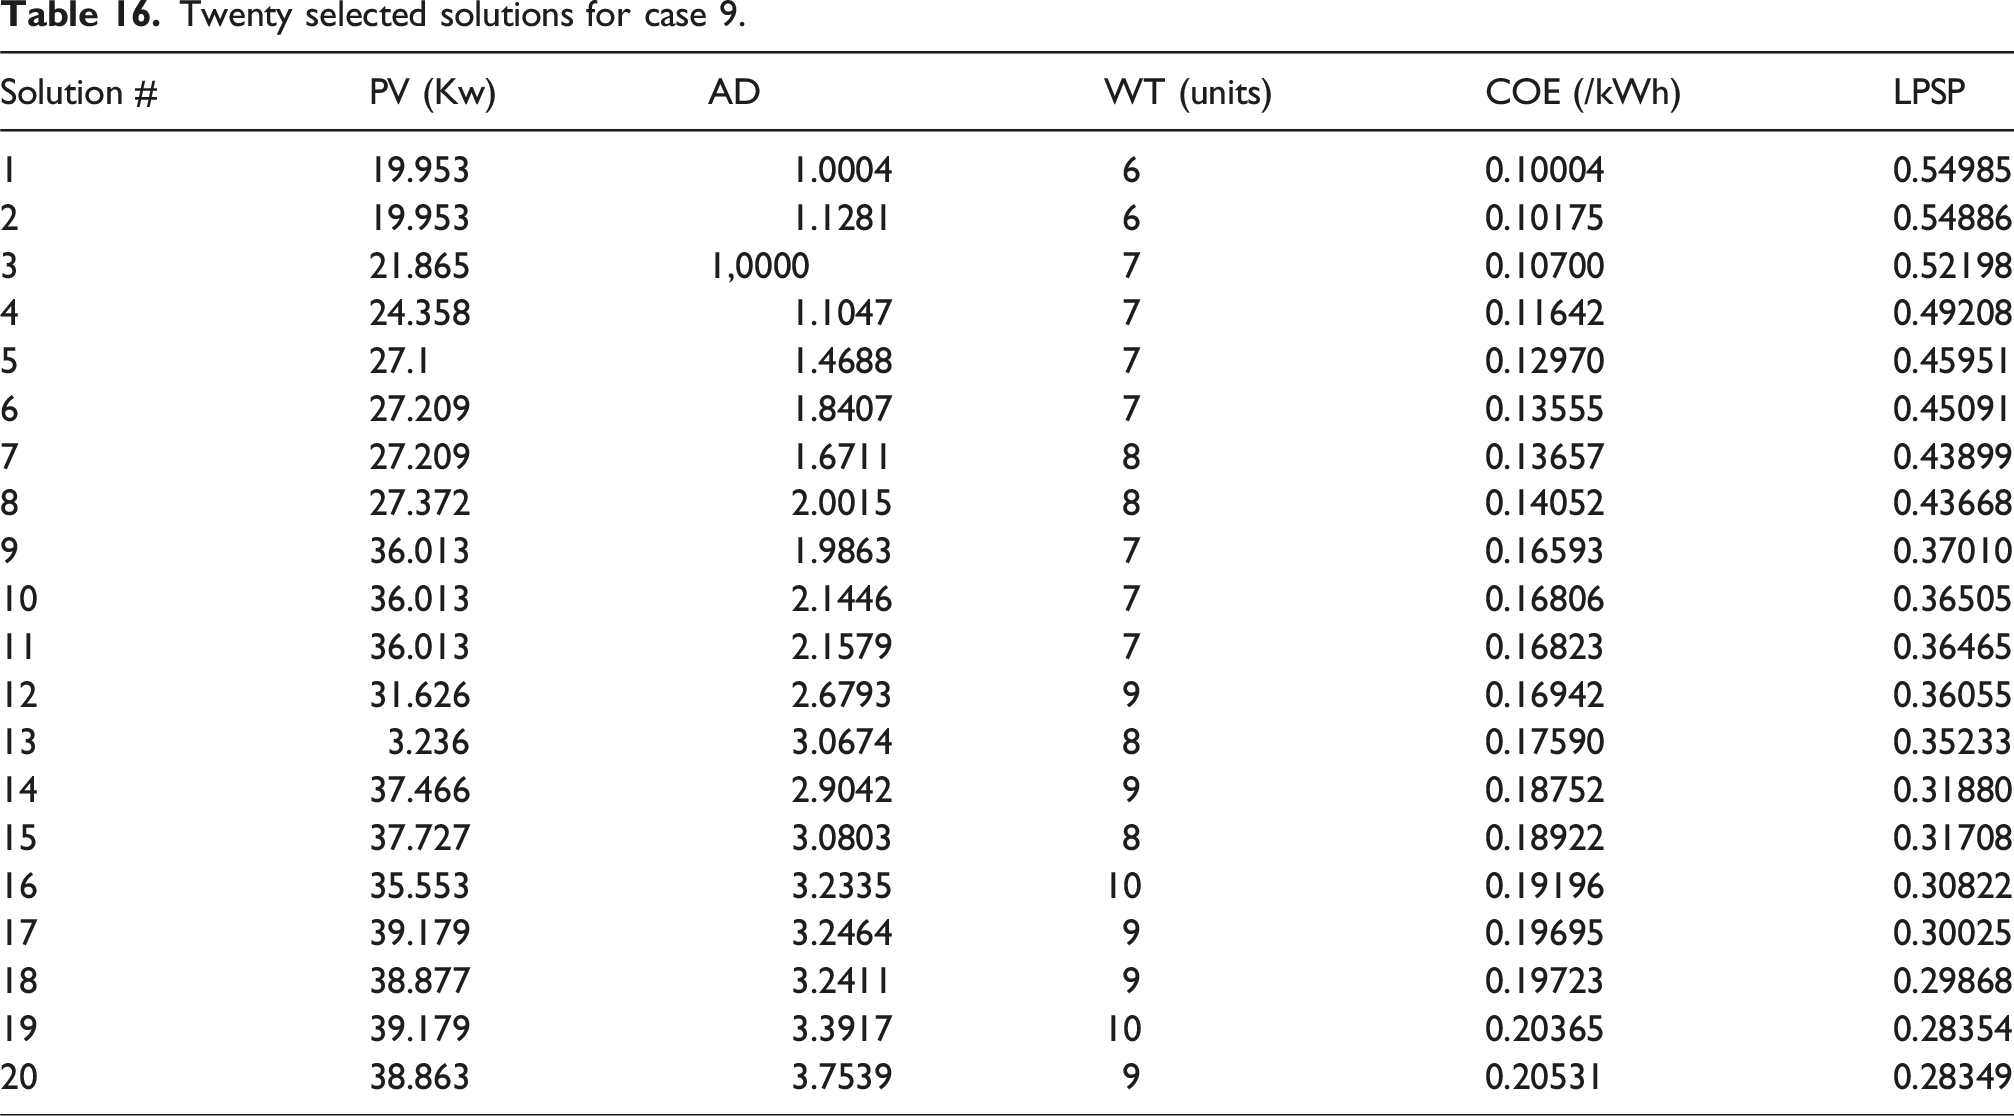
A summary of the MOWCA algorithm’s optimal configuration performance is provided in Figure 15(a), which supplies the load demand of 15 houses for the cities under study. System performance for case 9. (a) The Pareto solutions for case 9 and (b) Power shears by different sources of HMSs.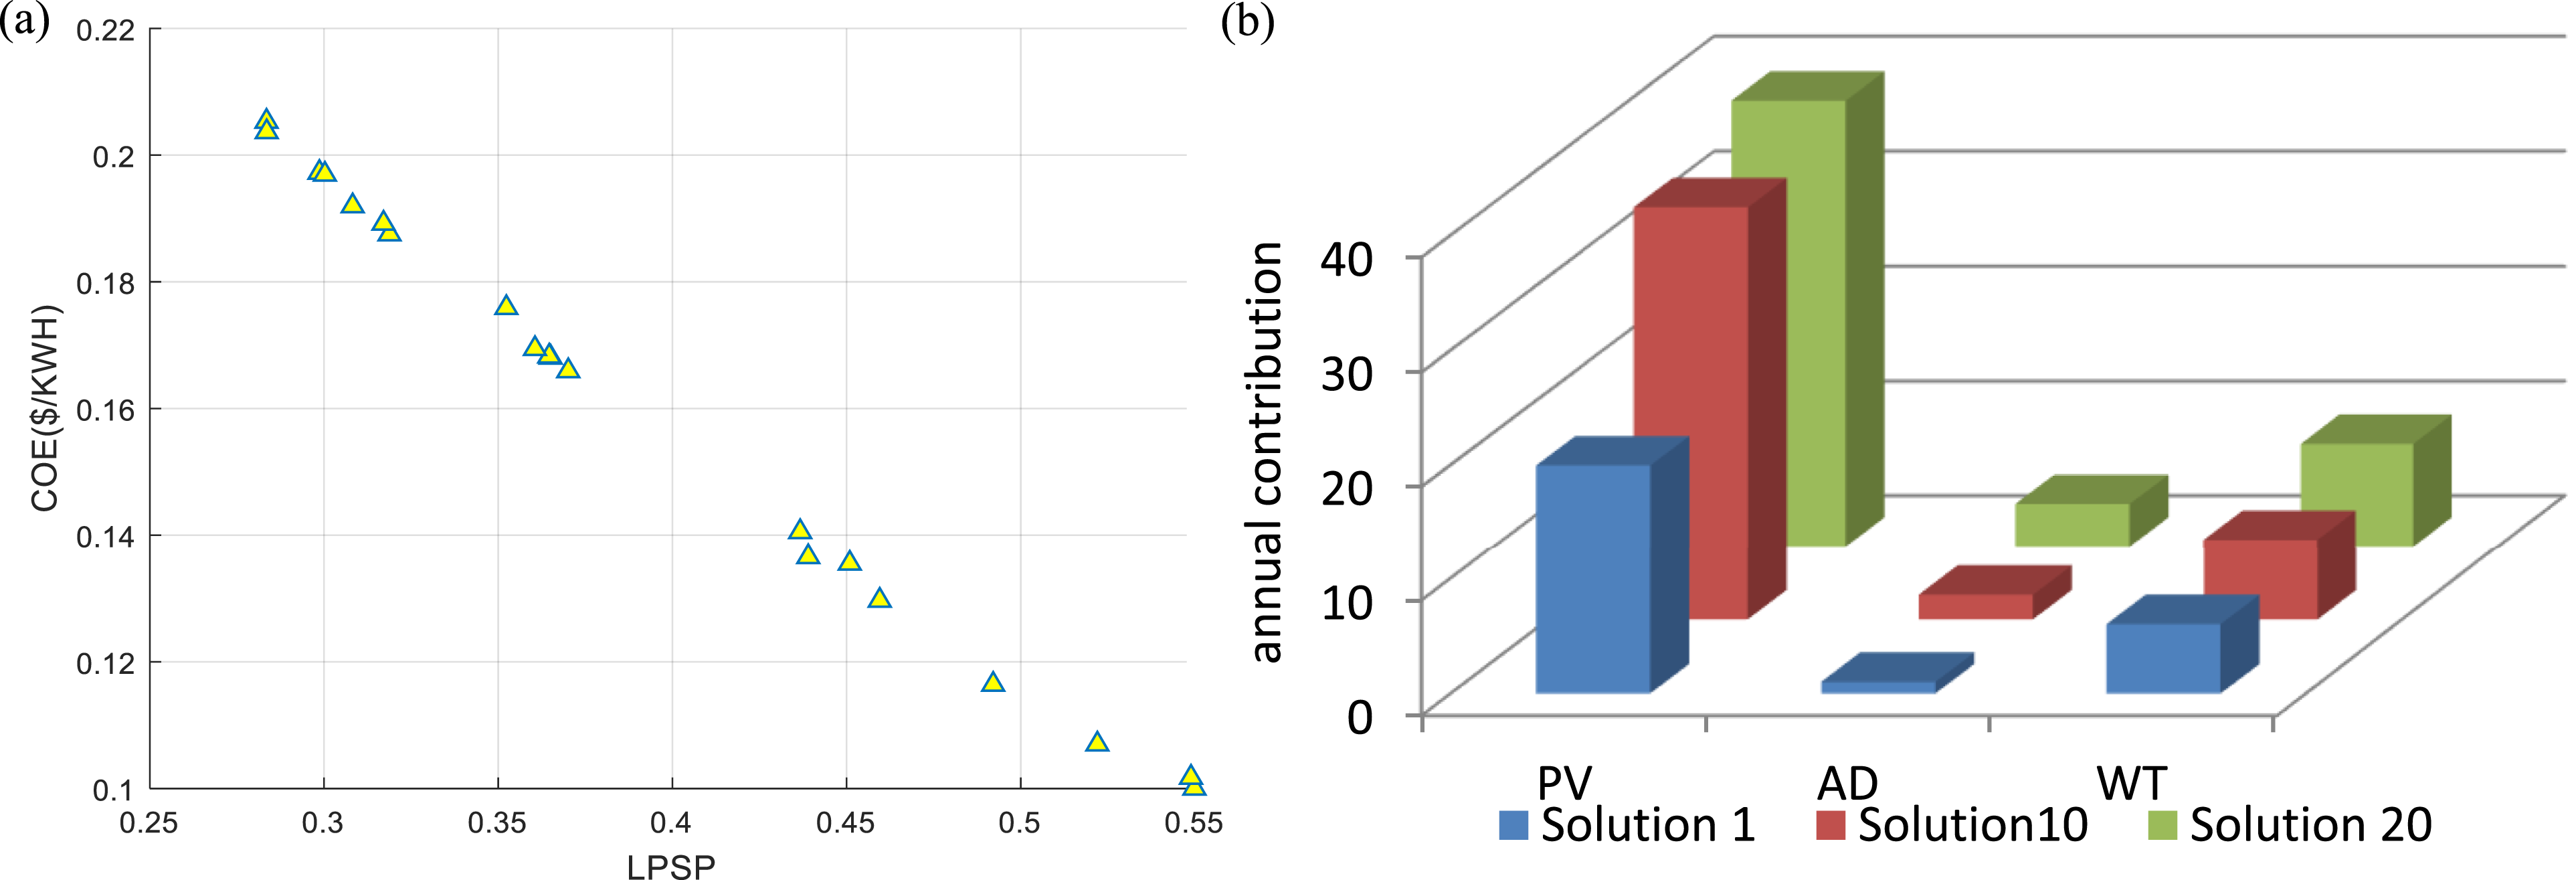
Figure 15(b) illustrates the yearly energy contributions of the PV, WT, and AD sources in the power generation system under study for solutions #1, #10, and #20 of the suggested algorithm. The annual energy contribution of the PV panels in solution #1 is 19.953 kW. It is evident that this production is less than that of solutions #10 and #20, where the WT and AD contribute 6 units and 1,0004 units, respectively. In solution #10, the annual energy contributions from the PV, WT, and AD are 36.013 kW, 7 units, and 2.1446, respectively. In solution #20, the annual energy contribution from each source [PV, WT, and AD] is 38.863 kW, 9 units, and 3.7539, respectively.
In comparison to all previous cases (case 7 (RESs uncertainty) and case 8 (load uncertainty)), the uncertainty produced from the RESs and load growth results in the highest increases in all objective values, including LPSP and COE. Additionally, it leads to a significant rise in the total capacity of AD, PV, and WT units. These represent the most unfavorable outcomes observed.
Comparison of power flow analysis
Based on the number of houses (N = 5 and N = 15), this section investigate the performance of power flow for the optimized MGS (PV, WT, and AD) using the best possible combination of micro-grid components. The MOWCA algorithm was utilized in order to identify the ideal setup. We analyzed four cases: Deterministic planning, probabilistic planning of REP, the probabilistic planning of the load, and the probabilistic planning of REP and load. Each case had two number of houses (N = 5, and N = 15) analyzed.
Figure 16 provides a clear illustration of the contributions from different sources. With regard to deterministic and probabilistic energy management, it is evident from the optimization results that the contributions from different sources (PV, WT, and AD) vary with the load level (N = 5 and N = 15). The annual energy contribution for different architectural combinations of the MGS. (a) Deterministic planning of REP and load, (b) The stochastic behavior of REP, (c) Random behavior of load, and (d) The stochastic behavior of REP and load.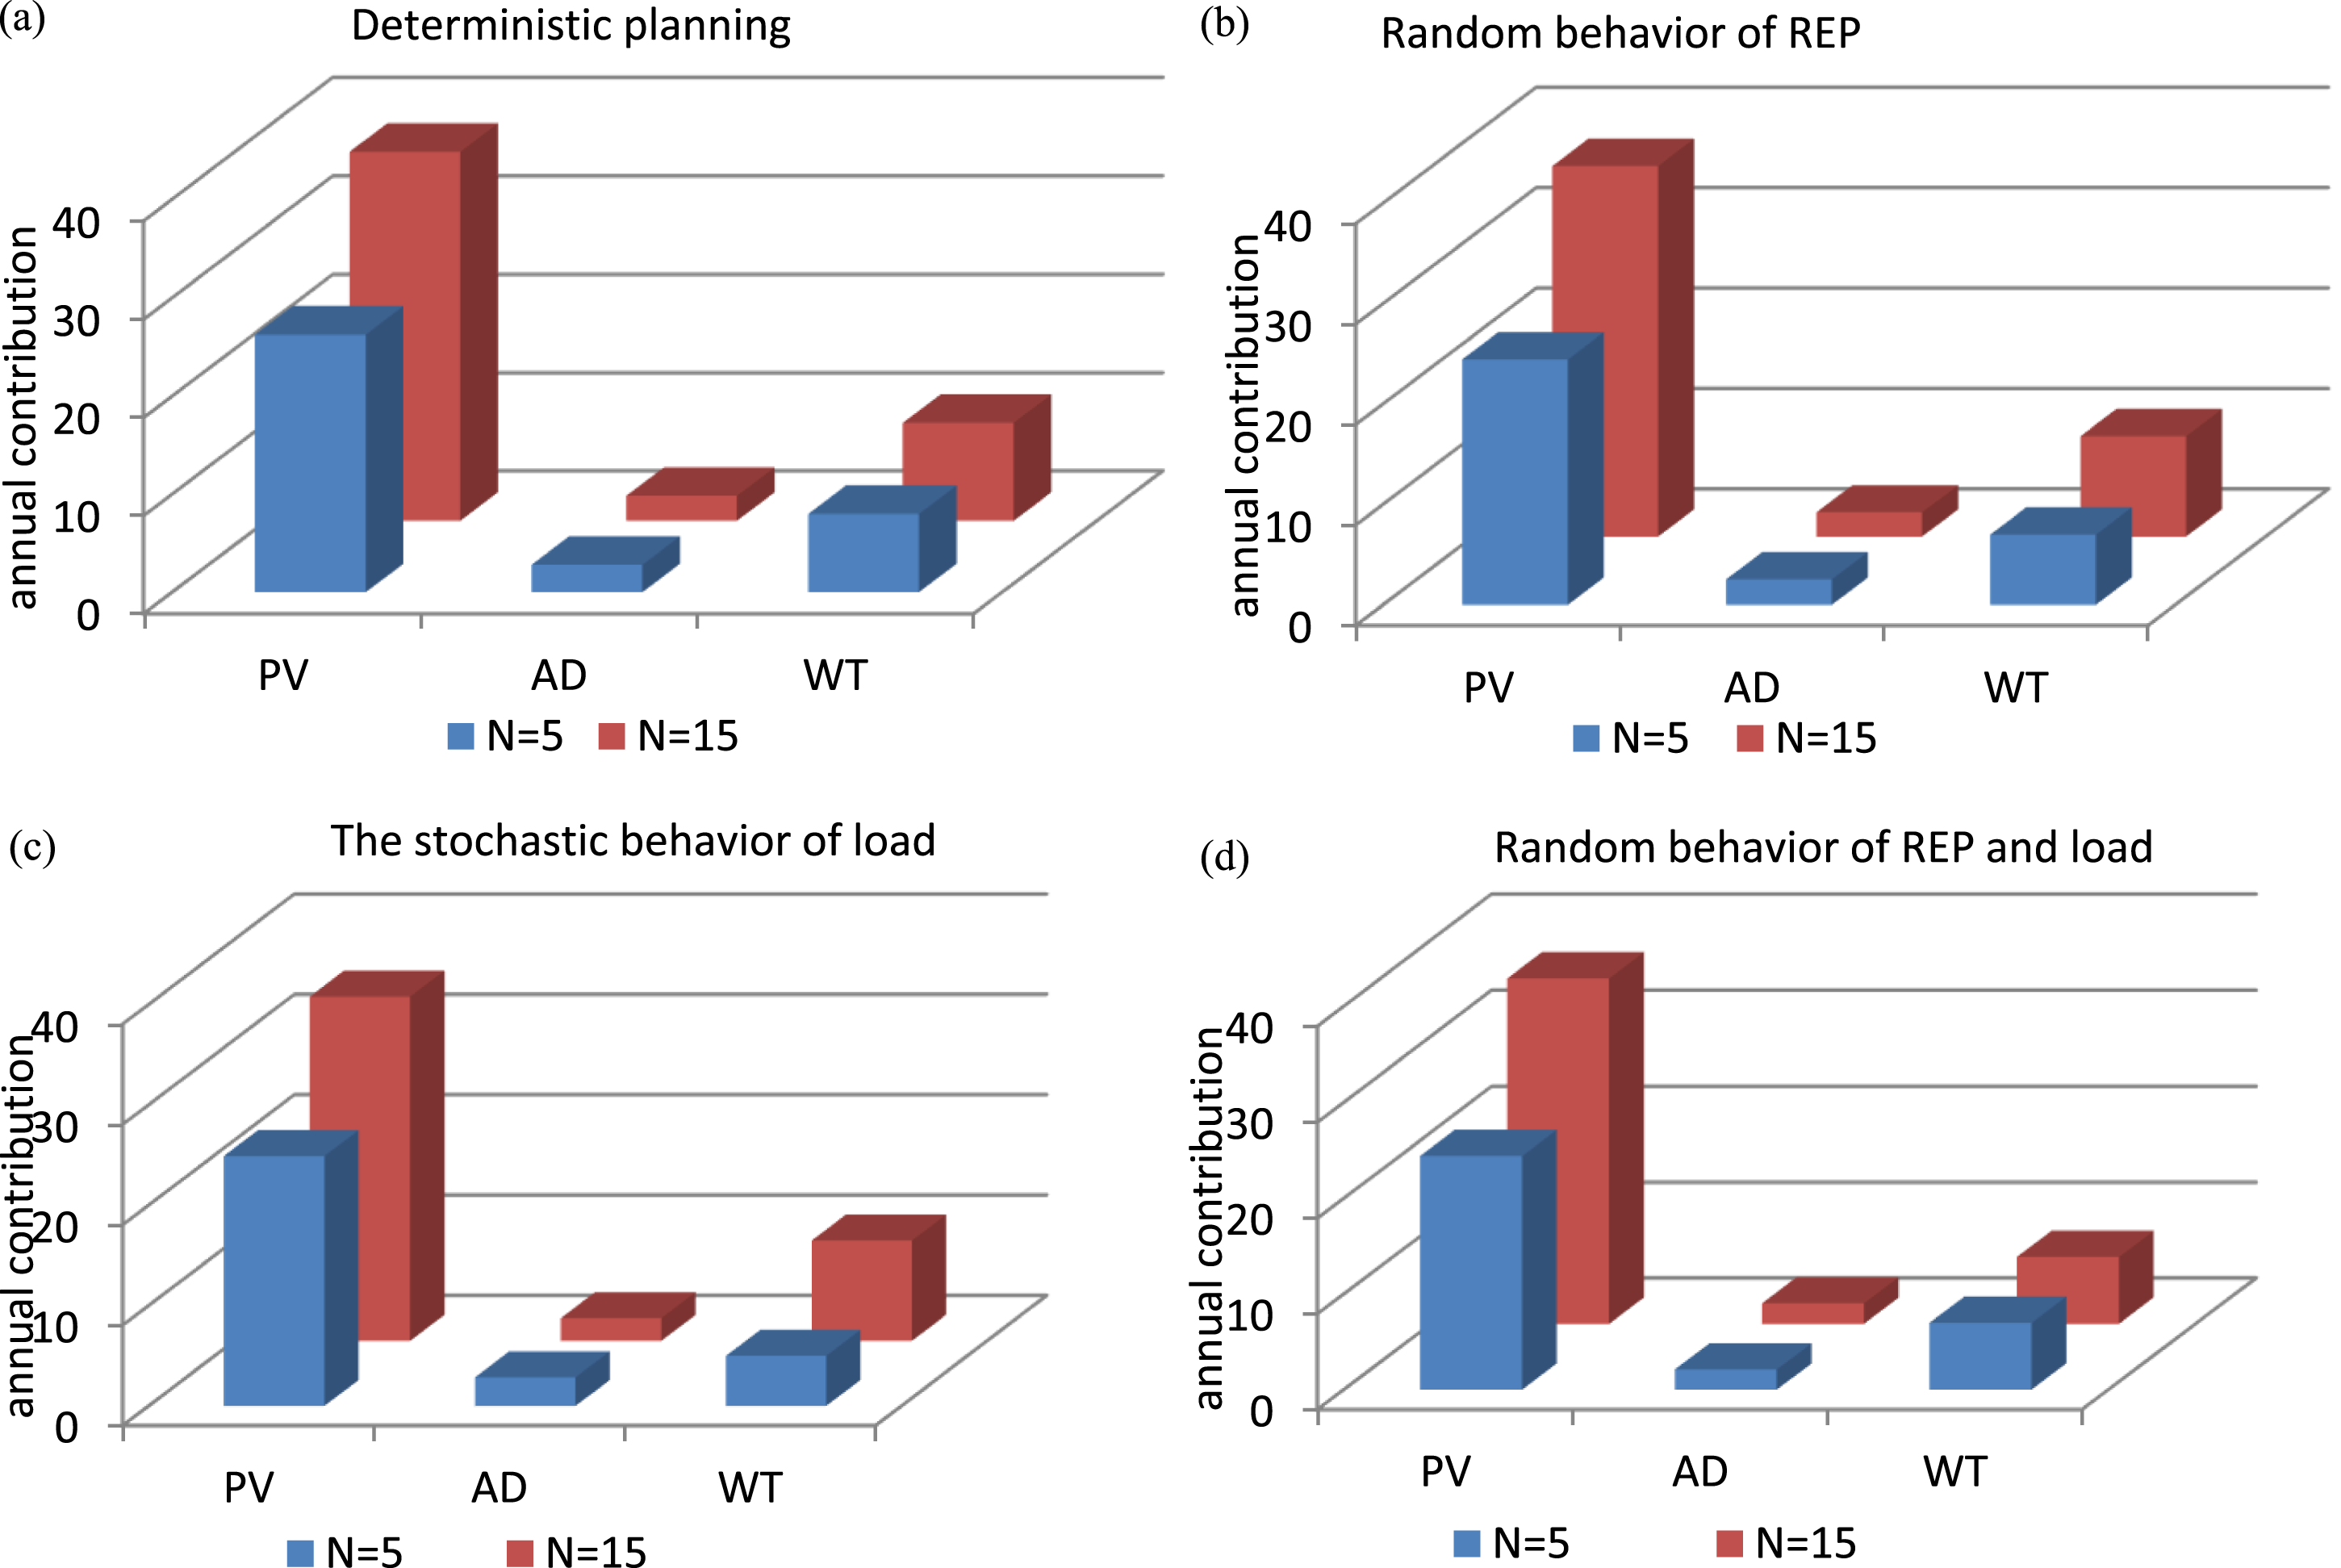
The most power is generated by deterministic planning, since it uses three components with absence of the probabilistic behavior of the load and REP.
The probabilistic planning of REP and load design produces less energy than the other architecture since it studies various power sources (PV, WT, and AD) with the effect of its uncertainty.
Comparative analysis of the LPSP and COE
Using two distinct scenarios classified according to the number of houses (N = 5 & N = 15) has been illustrated by Figure 17. An analysis was conducted to compare the micro-grid’s LPSP and COE. The proposed algorithm for each architecture is analyzed to find their respective performances. The first scenario configuration shows the lowest LPSP and COE for the small number of houses. In the second scenario (N = 15), increasing the load operation conditions has increased all objectives (LPSP and COE) and power sharing of REP (PV and WT). The comparative analysis of the two number of year in terms of LPSP, and COE. (a) Deterministic planning of REP and load, (b) The stochastic behavior of REP, (c) Random behavior of load and (d) The stochastic behavior of REP and load.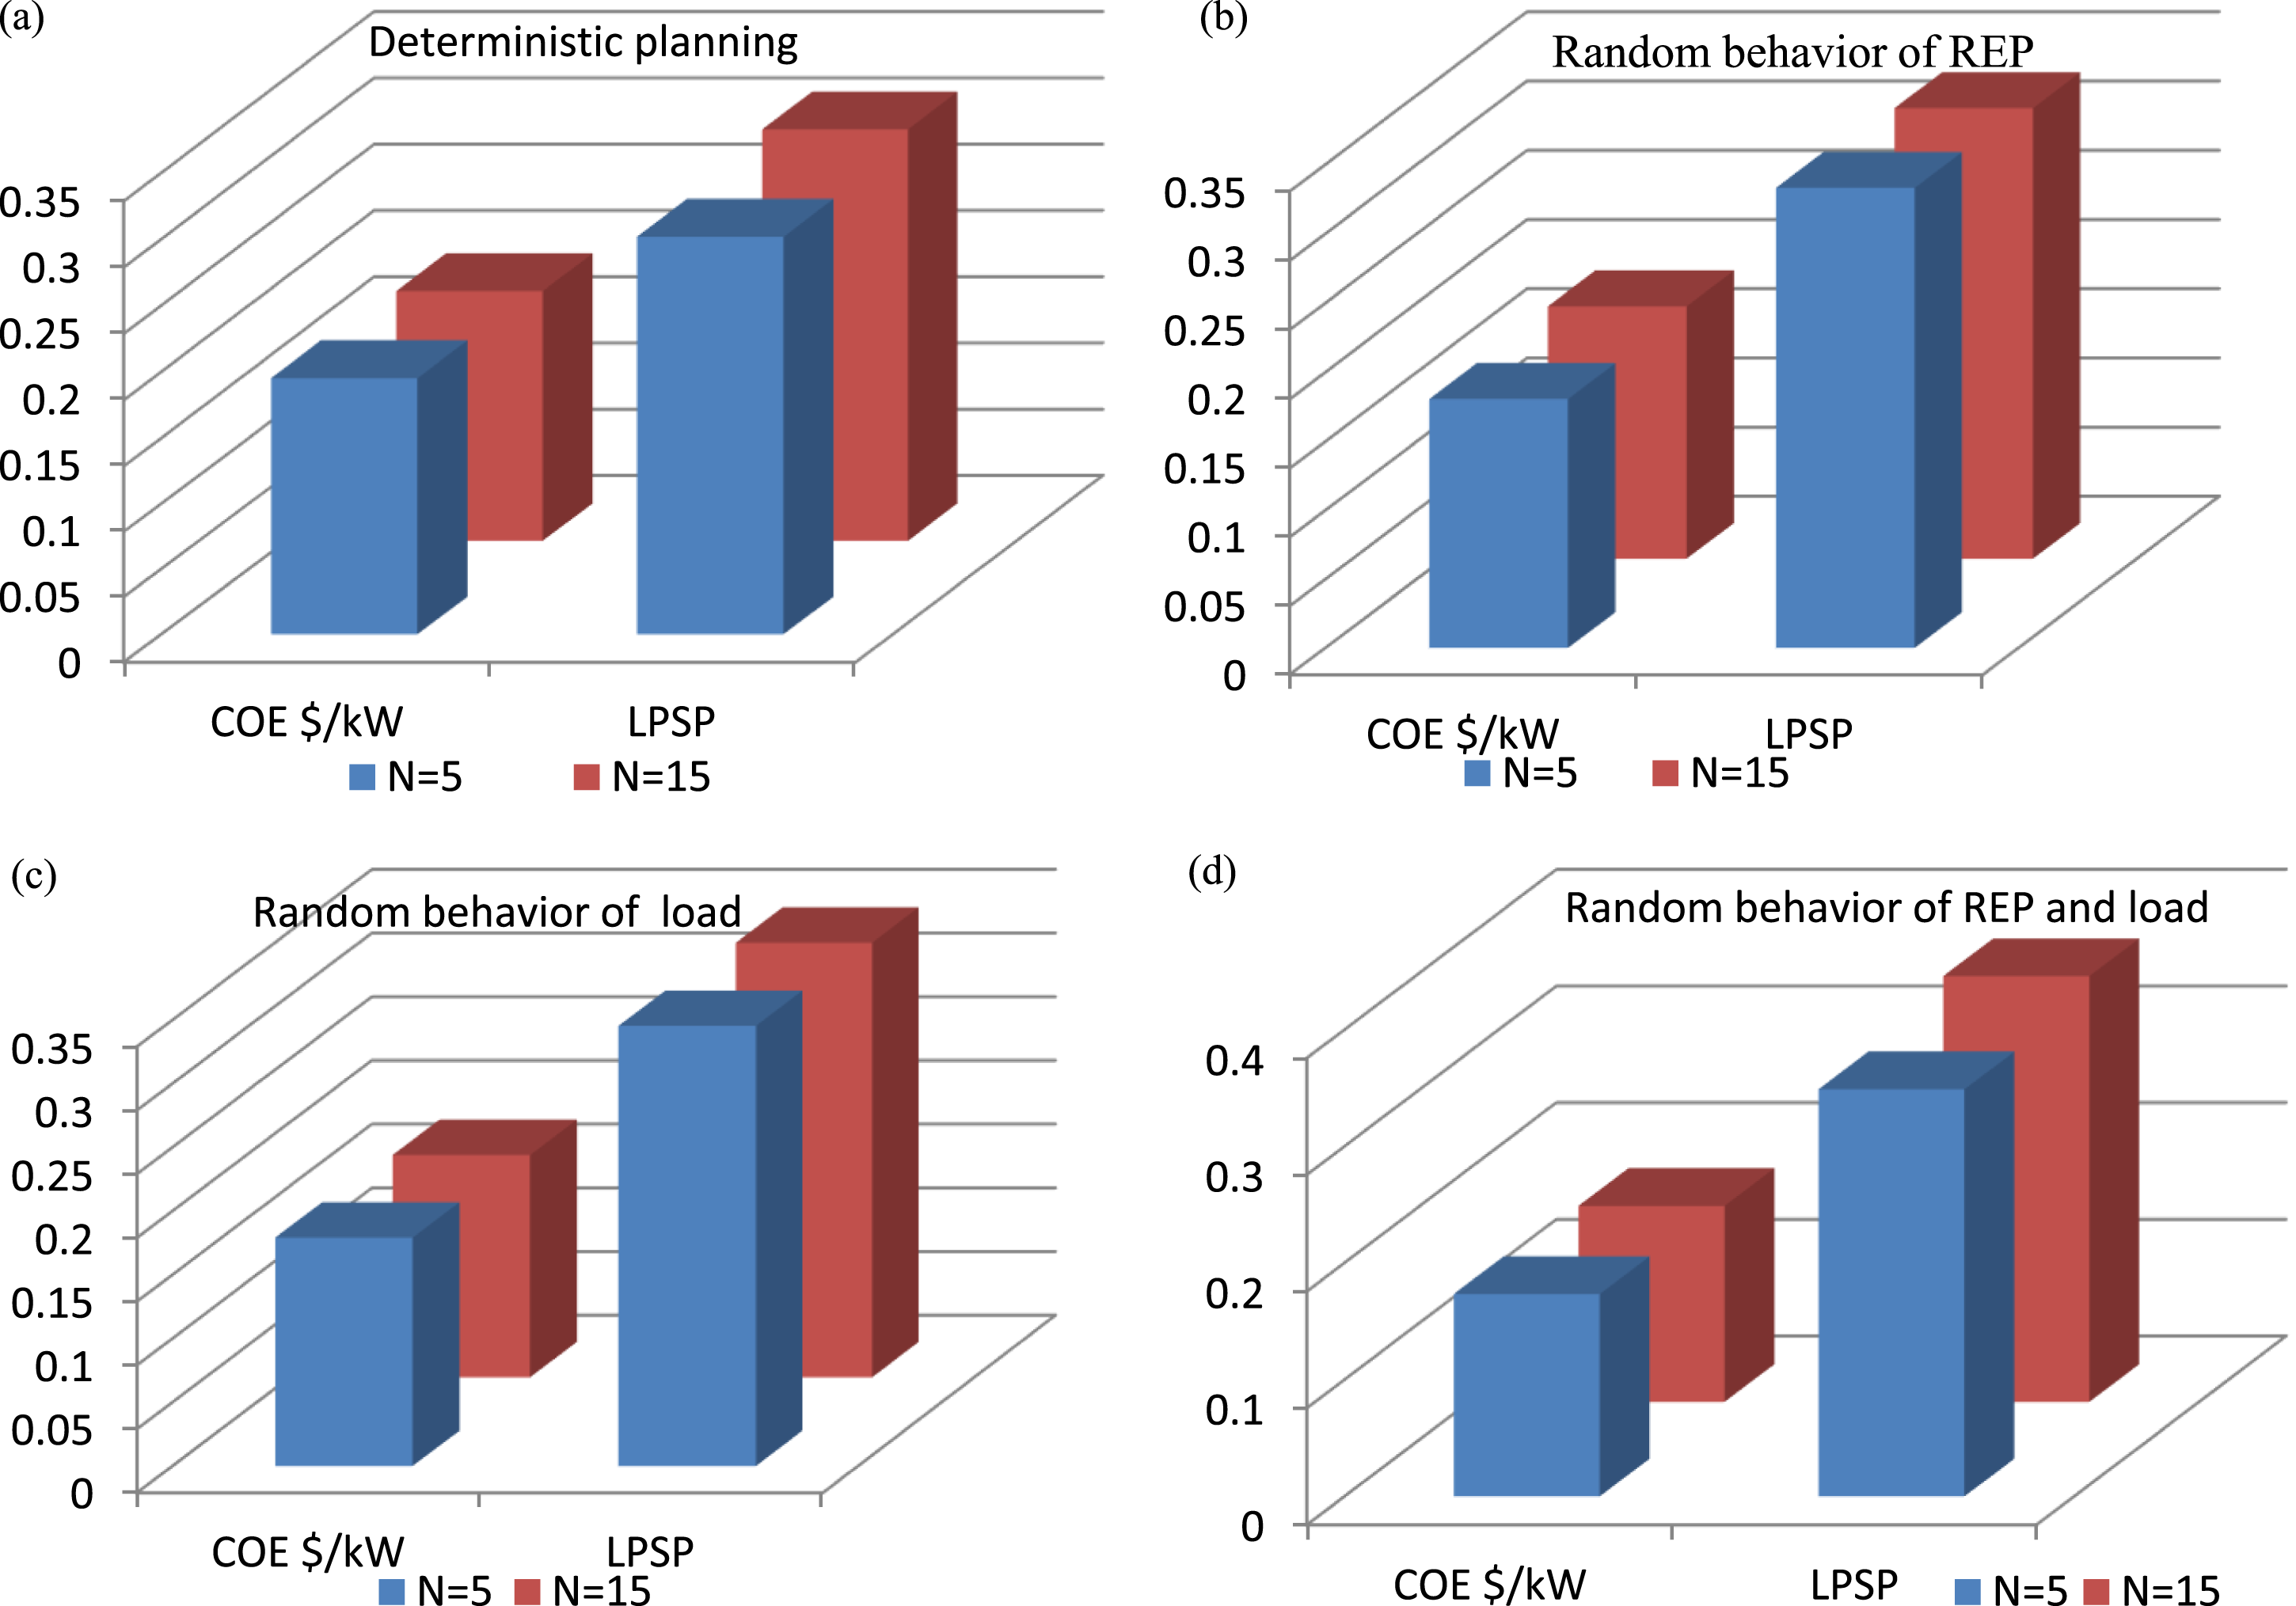
Conclusion
This paper has suggested a method for the ideal sizing of a stand-alone micro-grid system that is powered by hybrid energy sources like batteries, wind turbines, and photovoltaic panels. The system consists of two buses, one DC and one AC that are connected in both directions by a power electronics conversion system. This work aims to provide a reliable hybrid RES to meet load requirement while having the lowest possible energy costs. This could be obtained by varying the number of houses and considering weather conditions in the selected outlying region (Yanbu city). An optimization design based on MOWCA has been presented to simultaneously determine the minimum potential for electrical loss (LPSP) and the minimum cost of electricity (COE).
With a fixed number of houses (5 and 15), the optimization study’s goal was to select the best combination of PV panel (NPV), wind turbine number (NWT), and days of autonomy for battery capacity (AD). The experimental study comprised nine examples, each of which represented a unique case based on three different scenarios for 5 to 15 houses; consequently, this study covers a number of MATLAB simulation and optimization topics. The uncertainties in wind and solar electricity are modeled using the point estimate method.
Furthermore, this study discovered that the influence of the load, solar, and wind power uncertainty was a significant. In each case the set of non-dominated solutions or the obtained PF covered a wide range. The HMS designer or engineer can use these findings to help select the best solution while taking into account additional constraints or factors that are not amenable to mathematical modeling. (i) The results of the suggested energy management system based on the MOWCA algorithm have been compared with those of the MOPSO algorithm. The results indicate that the MOWCA algorithm can establish the system’s lowest LCOE, LPSP, and minimum number of component units for the system, with a COE of 0.24102 $/kWh, a LPSP of 21.96%, a PV panels’ power of 16.249 kW, 4.046 days of autonomy, 9 WTs. (ii) The obtained results show that the PV/WT/BESU configuration with deterministic planning of REP and load is the most LPSP effective and reliable system • In order to supply the load requirement for five homes, the simulation findings of (contribution of PV, NWT, AD, COE, and LPSP) were (26.274 kW, 2.8116, 8 units, 0.19516 $/kWh, and 30.179 %) • The best combination solutions to meet the load requirement for 15 homes (contribution of PV, NWT, AD, COE, and LPSP) were (37.538 kW, 2.5484, 10 units, 0.18924 $/kWh, and 31.116 %) (iii) the PV/WT/BESU configuration with probabilistic planning of REP and load is the less LPSP effective and reliable system • In order to supply the load requirement for five homes, the simulation findings of (contribution of PV, NWT, AD, COE, and LPSP) were (24.428 kW, 2.1212, 7 units, 0.17337 $/kWh, and 34.899 %) • The best combination solutions to meet the load requirement for 15 homes (contribution of PV, NWT, AD, COE, and LPSP) were (36.013 kW, 2.1446, 7 units, 0.16806 $/kWh, and 36.505 %)
The paper’s findings can serve as a power reference for PV and WT’s cost-effective operation. The findings are also helpful for operating the set points of PV and WT generators, guaranteeing a dependable power supply within a typical range, offering an ideal energy storage system, and lowering the cost of RES, notably solar PV and WT, and to increase the competitiveness of goods for usage in the energy market and industry, thereby boosting the growth of RES and energy diversification strategies.
Footnotes
Funding
The Researchers would like to thank the Deanship of Graduate Studies and Scientific Research at Qassim University for financial support (QU-APC-2025).
Declaration of conflicting interests
The author(s) declared no potential conflicts of interest with respect to the research, authorship, and/or publication of this article.