
Abstract
This study investigates the causal relationship between renewable energy sources and clean environmental economic growth among South Asian economies. This study comprises the panel data sets for eight (8) South Asian countries, and data start from 2003 to 2017. This study implies a Hausman test to identify which particular tests are more suitable and selected a fixed effect test and granger causality test for effective analysis perspective. Moreover, this study further relies on the panel vector error correction model (PVECM) test to suggest for long-run relationship existence among variables. Furthermore, the evaluation of the panel and the dynamic ordinary least squares regression shows that the production of renewable energy has compelled an effect on economic growth. While other sources of energy for instance, hydropower, geothermal, wind, and solar, have valuable and considerable influence on the economic growth of South Asian economies. The results reveal with these remarks the existence of positive associations among productions of renewable energies, energy dependence, and gross domestic product per capita. The obtained results reveal that renewable energy sources show a momentous effect on the economic growth of South Asian economies.
Introduction
Energy resilience is the outcome of sustainable energy through a structure that is decentralized. It decreases the influence instigated by possible failures of technical nature or attacks, which might considerably impair the national electricity grid. Consequently, it transmits profits via oil resources and can run insecure states at the governmental level (Valentine, 2011). The intake of 1% of renewable energy marks the real GDP growth of 0.12%, per capita GDP of 0.16%, from rural households income per capita on annual base as 0.44%, whereas households income from the urban region shows 0.37% increase per capita annually (Fang, 2011). Greenhouse gas emissions are reduced by 0.5 per unit approximately due to consumed fossil energy consumption in European Union countries (Boluk and Mert, 2014). Renewable energy can provide sustenance to the goal of reduction in emissions in 2050 by 8.2%, roughly, forestry with 5.3%. Forest carbon sequestration could not pass by renewables sources without the aid of the government (Vass, 2017).
Technologies related to renewable energy can assemble into mainstream energy technologies and emerging energy technologies (Hussain et al., 2017). According to Kele and Bilgen (2012), renewable resources should not harm the environment, boundless, and renewable energy should be low-priced over protracted periods apart from satisfying the desires of the community accompanying with the future and actual civil rules. Short-term socio-economic benefits can be gained by the renewable distribution that affects the vigorous green growth, which is vital for the transition to the green economy (Arif et al, 2020; Gasparatos, 2017; Pahle et al., 2016; Shabbir and Yaqoob, 2019). The interaction among the dispersion of renewable energy and the value of the fossils fuels discussed by Foster et al. (2017). The “green paradox theory” of Sinn (2008) suggests that the strategy complying with reducing global warming may accelerate the use of fossil fuels despite being expensive. Energy technologies are apprised for sustainability and are overlooked as renewable energy sources in various fields such as energy security, progress related to socio-economic aspects, security for energy, and alleviation in climate change (Carrera and Mack, 2010; Saleem and Shabbir 2020; Sen and Ganguly, 2017). The welfare of residents gets threatened with the sound of wind turbines, or the danger of reflecting sunlight units with photovoltaic type through solar energy, threatening the health and renewable energy of nearby residents (Botelho et al., 2016; Chiabrando, 2009).
Renewable energy is a crucial source for sustainable economic growth, particularly in developing countries and less developed economies to attract foreign investment. This study investigates the impact and relationship between renewable energy sources and sustainable environmental economic growth among South Asian economies such as Afghanistan, Bangladesh, Bhutan, India, Maldives, Nepal, Pakistan, and Sri Lanka. We did not find any comprehensive study on this topic where they develop a relationship between five renewable energy sources, for instance, (biomass, geothermal, hydropower, solar, and wind) and sustainable environmental economic growth among all eight South Asian countries. Whereas, some individual countries’ studies highlight the importance of renewable energy sources and its impact on different dimensions. These studies include Shahbaz et al. (2015) who investigated if renewable energy consumption adds to economic growth using an application of auto-regressive distributed lag model in Pakistan. Aized et al. (2018) examined energy security and renewable energy policy analysis of Pakistan. Moreover, Ishaque (2017) studied, is it wise to compromise renewable energy future for the sake of expediency? An analysis of Pakistan's long-term electricity generation pathways.
We have divided the contributions of the present study into five distinct points. First, the novelty of this research explains the effects of renewable sources of energy, by type or total, on the sustainable environmental growth level for South Asian countries from 2003 to 2017. Successively, the underlying connection of renewable energy, GDP (per capita), and energy dependence are investigated by an empirical approach. This study uses five different sources of renewable energy and their effect on South Asian economies. This study is different from the preliminary investigation to some extent, particularly the innovation of this research supervenes from investigating the consequences of renewable sources from the energy sources. Second, the paper demonstrates the causal relationship between the production of renewable energy sources, energy dependence, and economic growth, regarding capital formation, consumption of renewable energy, and labour force regarding the South Asian economies.
Third, our research contributes to the existing body of knowledge on the given subject matter by analysing the association of the consumption of renewable energy in the form of hydroelectricity and its impact on economic growth. The importance of this topic also comes to light when we consider the fact that the eight countries were chosen for the purpose of this study with some countries rank as top pollutants, considering the minimal impact of hydroelectricity on the environment. The present research is contributing to a limited set of studies consisting only of two prior studies to be precise first by Omay and Kan (2010) and second by Apergis and Payne (2012) who had earlier utilised the utilised technique of “nonlinear panel smooth transition vector error correction model” in order to assess the impact of electricity consumption on the growth of the economy. Omay and Kan (2010) analysed the consumption of total electricity; meanwhile, Apergis and Payne (2012) used the total consumption of renewable electricity for their analysis. For the purpose of this study, we mainly focus on the consumption of hydroelectricity as the previous studies seem to lack this aspect; at the same time, we utilize the same technique i.e. “nonlinear panel smooth transition vector error correction model,” for our analysis as justified by literature review. The fourth contribution relates to the fact that we have used panel data rather than time-series data in order to establish the causal relationships between the above-mentioned factors as this approach reduces the issues relating to multicollinearity and provides much better estimates as compared to time series data. Fifth, this study addresses the following research objectives and questions respectively; to what extent renewable energy sources increase the clean environmental economic production. Do renewable energy sources improve the clean environmental economic growth level among South Asian economies?
Literature review
The existence of causal relationships amongst the economic growth and generation of electricity from renewable sources such as wind, hydroelectricity, geothermal sources, etc., was examined by Ohlers and Fetters (2014) using the data of twenty OECD countries ranging from the period of 1990 up to 2008. The framework of the production function is applied by them. In order to ascertain the properties of time series of panel data, they used as many as six separate panel unit root tests resulting in first-order integration of all variables. Since they applied Pedroni (2004), the results indicated the existence of a co-integrated relationship among the variables in question. Granger causality test pointed to the favourable bidirectional relationship of hydroelectricity with growth of GDP in the short run. Meanwhile, their results also indicated that hydroelectricity had a major impact on real GDP in the long-term, when it came to renewable energy sources. investigated the relationship between environmental innovation, knowledge spillover and firm’s productivity. The results indicate that mix coherent policy implementation has increased economic growth sustainability. The ecological deprivation escalates with the growing income up to the stage that borders the excellence of ecology level with the increased income per capita. On the other hand, there has been no unanimity among the connotation from energy sources and development sector of the economy from the samples selected, features of states explored, variables employed and quantitative methods used (Bhattacharya et al., 2016; Liu et al, 2020; Nguyen et al, 2020; Payne, 2009; Shabbir and Wisdom, 2020; Yu et al., 2020).
In addition, various studies have yielded dissimilar results, such as a study conducted in 82 countries from 1972 – 2002, which are categorized as “higher income, upper middle income, lower middle income, and low income.” The neutral hypothesis supports the category of small income countries and recommends the preservation hypothesis to middle income (Huang et al., 2008). Ozturk and Acaravci (2010) used the ARDL method from 1980 to 2006 to use the VEC model that exposed Hungary's feedback hypothesis but gave the neutrality hypothesis in Romania, Bulgaria, and Albania. Al-Mulali (2013) observed in a survey of 108 countries. It found that causality and bi-directionality exist in 79% of countries, with one-way causality in 2% of countries, and a fully modified OLS regression where the sample from growth to renewable energy and neutral causality is within 19%.
The feedback hypothesis has shown economic development and usage of biomass energy for Q1 of 1991 to Q4 of 2015 for the countries of BRICS region (Shahbaz et al., 2016). There exists a positive influence of biomass energy usage and economic development in G7 nations for 1980 to 2009 and 51 states of “Sub-Sahara Africa” for 1980 – 2009 according to growth hypothesis (Bilgili and Ozturk, 2015). The association among consumption of biomass energy and economic development in long term causality that is unidirectional for Argentina, Nicaragua, and Bolivia whereas long-run unidirectional causality is observed for Costa Rica to GDP through biomass energy for El Salvador, Cuba, Jamaica and Panama from ten emerging and developing states for 1980 to 2009 (Bildirici, 2013). Among seven Latin American countries for 1970 to 2012, long-run bidirectional causality has been observed among economic development and hydroelectricity usage in Venezuela and Argentina, long-run unidirectional causality is supported from use of hydroelectricity to growing economy in Chile, Brazil, Ecuador, Colombia and Peru (Solarin and Ozturk, 2015). The hypothesis proposed for the GDP or the basic per capita ISEW, and consumption of energy and feedback hypothesis proposed for energy consumption and solid ISEW per capita by applying the ARDL panel model (Menegaki and Tugcu, 2017). The response hypothesis reinforced in the case of the ISEW framework and neutrality supported in the case of GDP framework according to this study and computed ISEW for 20 American countries from 1990 to 2013. They followed fixed effects and quantile regression with the PVECM approach.
Murshed (2018) describes that an improvement in trade openness facilitates renewable energy transition gathering evidence from selected South Asian economies. Moreover, some studies from developed economies, such as Bilagi and Ozturk conducted a study regarding bioenergy and economic growth from G7 countries. Bildirici and Gokmenoglu (2017) examined the relationship between environmental pollution, hydropower energy consumption and economic growth generating evidence from G7 countries. Apergis and Payne (2010) investigated renewable energy consumption and economic growth relying on evidence from a panel of OECD countries. Apergis and Payne (2011) studied about renewable energy consumption-growth nexus in Central America. Muhammad et al. (2020) explored the nexus between willingness to pay for renewable energy sources from Turkey. The findings of this study indicate that people are willing to pay more for renewable energy sources in order to get better facilities. Finally, Li et al. (2021) explored the relationship between renewable energy sources and economic growth of SAARC countries.
Methodology
This examination takes a panel data set regarding south Asian economies for the period 2003– 2017. The data were obtained from “World Development Indicators” (WDI), World Bank. The usages system of multi-variation consists of total national output per capita as measure for sustainable economic growth (Amri 2017; Chontanawat et al., 2008; Huang et al. 2008; Jebli and Youssef 2015; Koçak and Sarkgüne, 2017; Shabbir et al., 2020; Lin and Moubarak, 2014; Sadorsky, 2009). This study measures the renewable energy (general and by category) and controls the measures at the national level. The goal is to enhance the impact of sustainable energy demand by using panel data. This study implies a fixed-effect regression model with the following general specifications

The Y signifies the dependent variable, one-to-one regarding logarithmic values as GDP per capita, X indicates the expounding construct for the renewable energy sources, by type and overall, Z denotes control variables at the country-level,
Unit root test
Some studies like Inglesi-Lotz (2016), Kahia et al. (2017), Ejaz et al. (2017), Shabbir (2016), and used Im Pesaran and Shin (IPS) test established by Im et al. (2003). But this study employed a “heterogeneous panel cointegration test” established by Pedroni (1990, 2000), which permits interdependence between the cross-sectional unit on account of different individual effects.


By combining the third equation into the second equation, the following form takes place

Whereas, Pi denotes the sum of lags in the amplified “dickey fuller regression.” This study employed a panel cointegration analysis. To investigate “panel cointegration,” it is compulsory to check the presence of a unit root test of the data series. This study has used Im Pesaran and Shin IPS analysis (Im et al., 2003) based on “dickey fuller procedure”. IPS proposed the test for a unit in panel. It combines statistics with the “time series” dimension along with cross-sectional. Whereas Saleem et al. (2019) used this method in their research to estimate panel data. The t-bar (t) is then standardized, and it is showing the standardize t statistics convergence to the standard normal distribution as N and T tend to infinity. While the IPS (2003) shows that the t-test performs better, mainly when N and T are small, where errors in different regressions contain common and specific components, the proposed cross-section diluted versions of both tests are used.

Where the parameters

Where the parameters

The above equation (5c) defines the parameters as

Therefore, in subsequent steps, researchers used “modified ordinary least squares” (FMOLS) and dynamics (DOLS) as did by Shabbir (2020), Saleem et al. (2019). The empirical analysis estimated the PVECM intends to perform a Granger causality test. In this study, Engel-Grange's two-step process is used to obtain the projected residuals. Through expressing the lagging residuals in the 5th eq as “error correction” (ECT), the subsequent “dynamic error correction model” is framed:
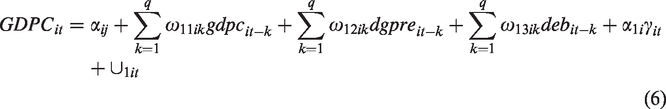
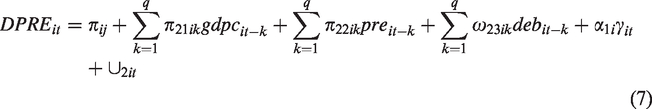
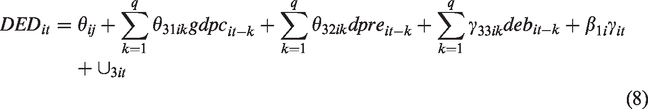
The above describes the values as D (“first difference operator”), q (“lag length criteria set at one as per likelihood ratio test”), and u (“serially uncorrelated term”).
Descriptive statistics of the variables
The empirical findings in Table 1(a), (b) and (c) show descriptive statistics. The correlation analysis investigates stationary or non-stationary among variables. The summary statistics regarding above tables show that, mean values of renewable energy sources in gross final usage regarding energy is 13%, fuel consumption in transportation is 2%, electricity generation by renewable resources in terms of electricity generation by percentage is 16%, final renewable energy usage in the household part is 15%. However, Table 1 (d) indicates descriptive statistics for country-level control variables. Whereas, less value of mean RD as (0.02) and higher value as GGE (81.16).
Renewable energy and sustainable economic growth (a), variables towards renewable energy by type as biomass (b), hydropower, geothermal energy, wind, and solar energy (c), and country-level control variables (d).
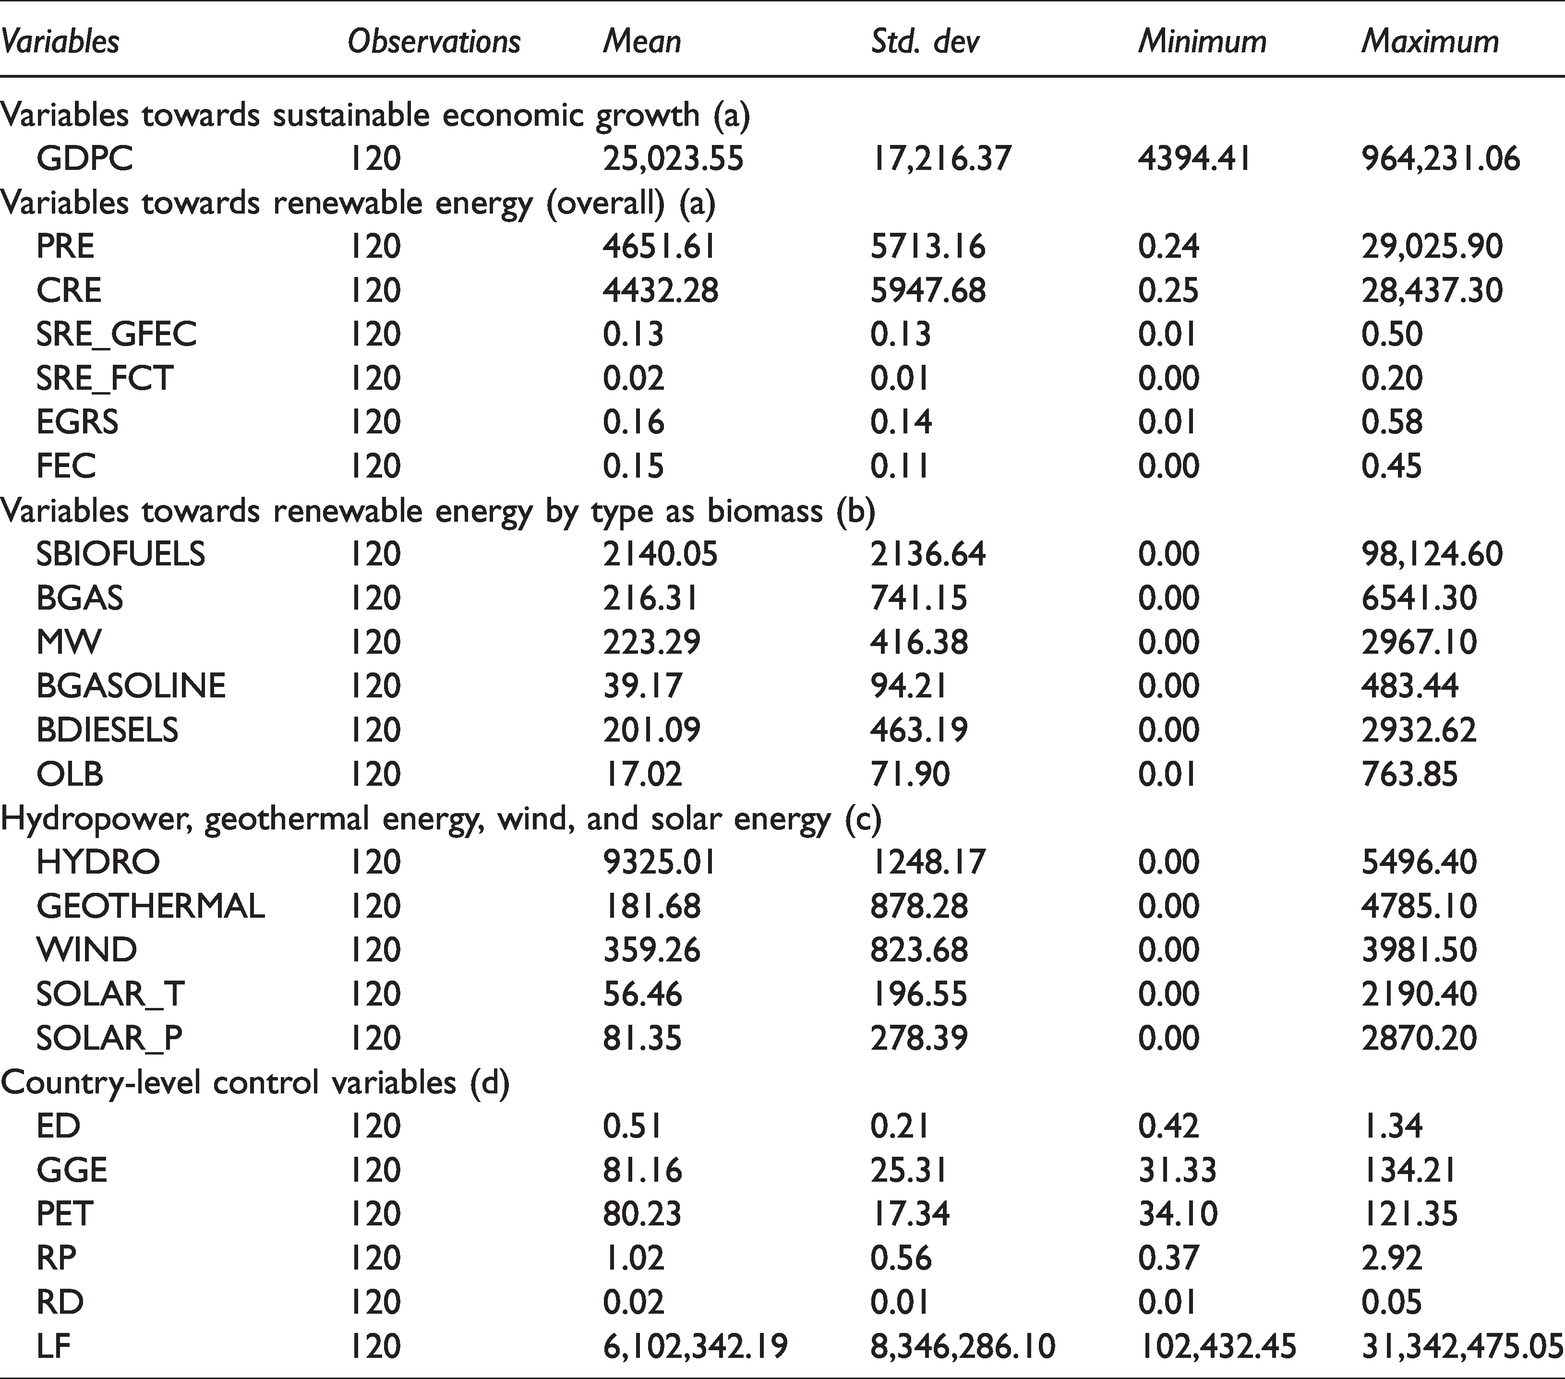
This study observed all primary variables, such as the production of solid fuels excluding charcoal (SBIOFUELS), production of biogas (BGAS), municipal waste (MW), biodiesel (B-diesels), other liquid fuels (OLB), with all of the registered highest mean values among variables. Whereas, “Hydro, Geothermal, Wind, Solar_ T, and Solar_P” all of these main variables also showed the highest mean values, except, biogasoline, other liquid fuels (OLB) in Table 1(a) and solar-t in Table 1(b) which showed lower mean values. Moreover, cross-sectional level control variables for the energy dependence of specific country(ED), resource productivity (RP), research and development expenses in terms of GDP percentage (RD) are showing low mean values as compared to greenhouse gas emission(GGE), pollutant emission from transport (PET).
The above Table 2 shows correlation and a high correlation observed among the relevant measure of renewable energy. The Pearson correlation (PC) indicates to what extent, there is an association of population exists between dependent variable with other independent and explanatory variables. This study develops a hypothesis in order to better understand the correlation among variables. The null hypothesis shows that there is zero correlation between the dependent and independent variables. Which means that no relationship exists between renewable energy sources, environmental economic growth and other explanatory variables. Whereas the alternative hypothesis of this study explains that a correlation present among variables. The above table clearly indicates that a correlation exists among variables, it could be positive or negative relationship, but no zero relationship found here. Therefore, a distinct panel regression model was used to avoid multicollinearity problems.
Correlation matrix.
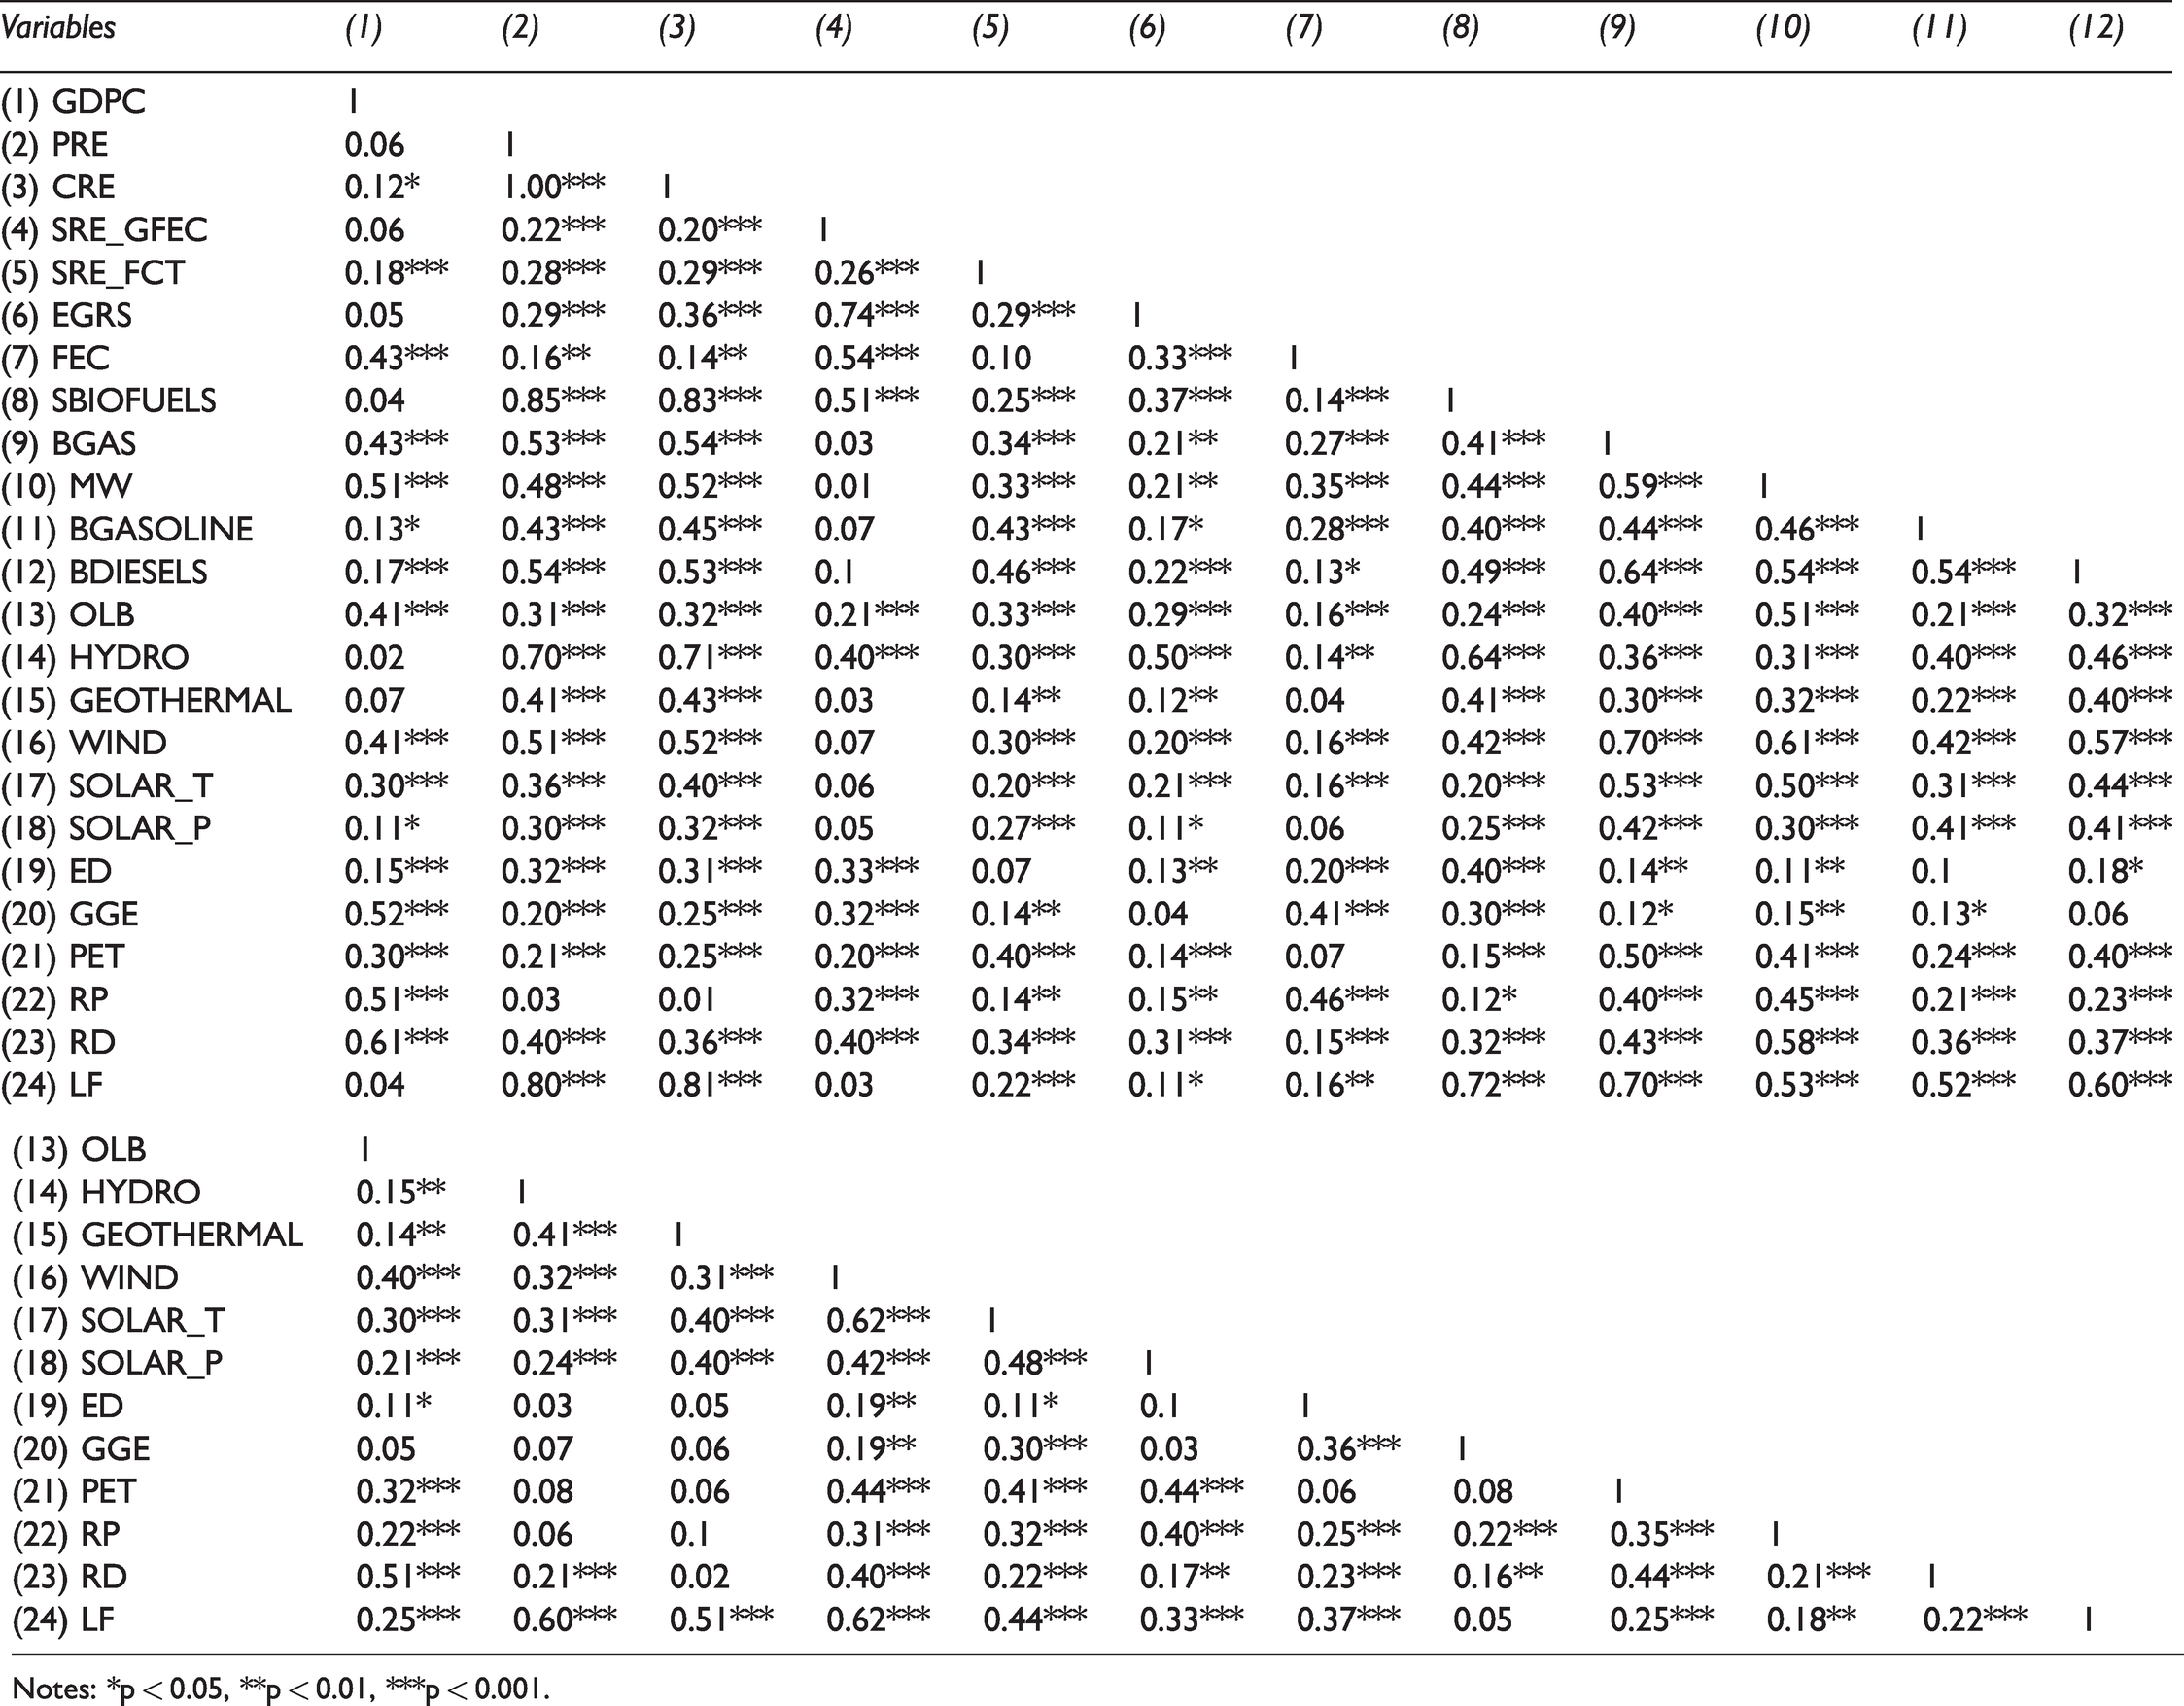
Notes: *p < 0.05, **p < 0.01, ***p < 0.001.
Cointegration and causality examination
In Table 3a, column 1 shows the relationship between LLC with other variables. The results show that the test LLC reveals “GDPC, PRE, CRE, SRE_FCT, SBIOFUELS, BGAS MW, BGASONLINE, BIOESELS, HYDRO, WIND, SOLAR_T, SOLAR_P, pet, RD, AND LF” are at stationary level.
Co-integration.
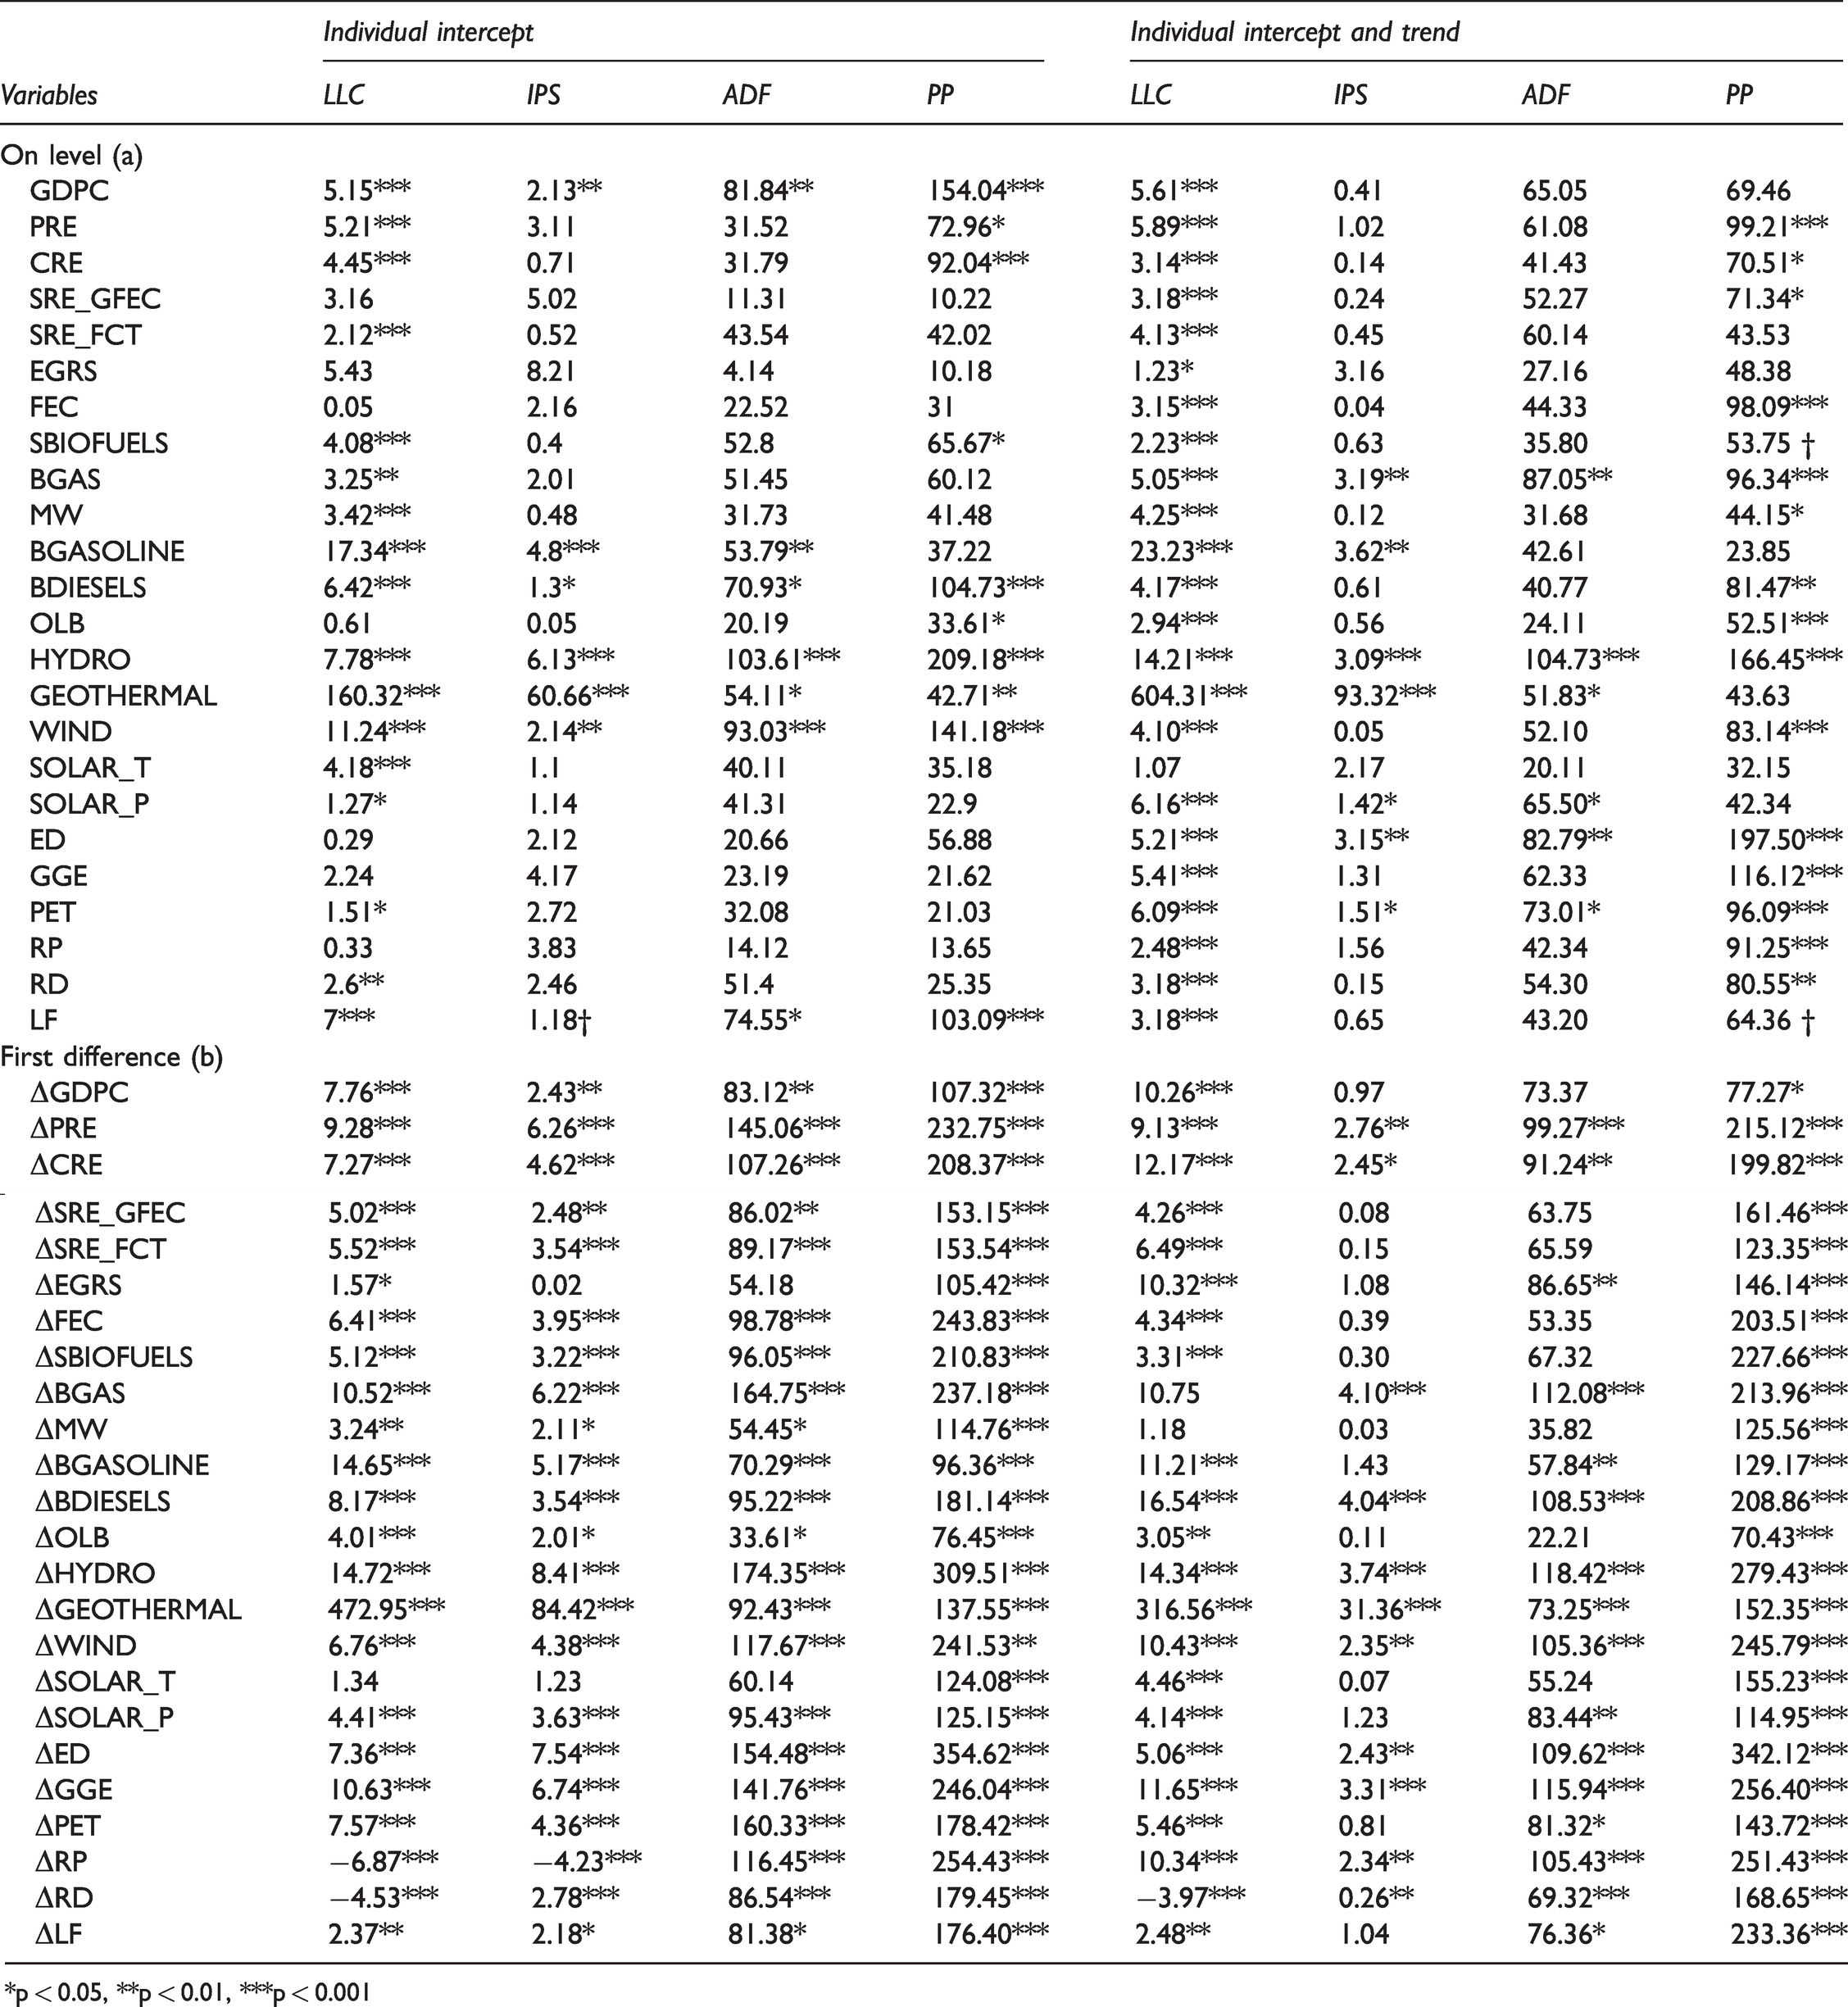
*p < 0.05, **p < 0.01, ***p < 0.001
Table 3 discloses the output of “panel unit root” examination. By observing examination results, all the indicators are at fixed level. Pedroni has three parts like individual intercepts, “individual intercept and trend’ and no intercept or trend. This study addresses two statistics. When the majority of variables are significant, the cointegration exists in the model among the variables. When fewer variables are significant then there is no cointegration. The next step is to deal with determining number of co-integration vectors. The FMOLS statistics indicates the rejection for the null hypothesis of no co-integrating vectors under both the trace and maximal Eigen value forms of the test. When the cointegrated exist in the variables the (FMOLS) panel model can be used.
Table 4 explains the case of Model 1 variables PRE and GGE that have notable association with sustainable growth. In model 2, another variable CRE included and excluded PRE variable that positively associated with sustainable growth. Our third model shows that SRE_GFEC has a direct and major effect on growth. In Model 4, the SRE_FCT is also having a substantial influence on sustainable growth. Similarly, in model 5, another variable EGRS included, which has also a significant effect to determine the growth level. Hausman test is applied to data set for the heteroscedasticity problem. The above table indicates significant outcomes and meet the asymptotic assumption of Hausman fixed test regarding renewable energy and environmental economic growth. In other words, the data set does not have heteroscedasticity problem. This study did not reveal any systematic variation between fixed and random effect coefficient. According to the statistical results of Table 4, the coefficient of the random model is more effective than the fixed model of renewable energy and growth level regarding South Asian economies. On the other hand, facts and figures of the above table show that the coefficient for the fixed model is efficient for both sources of renewable energy and economic growth.
Estimations of fixed-effects.
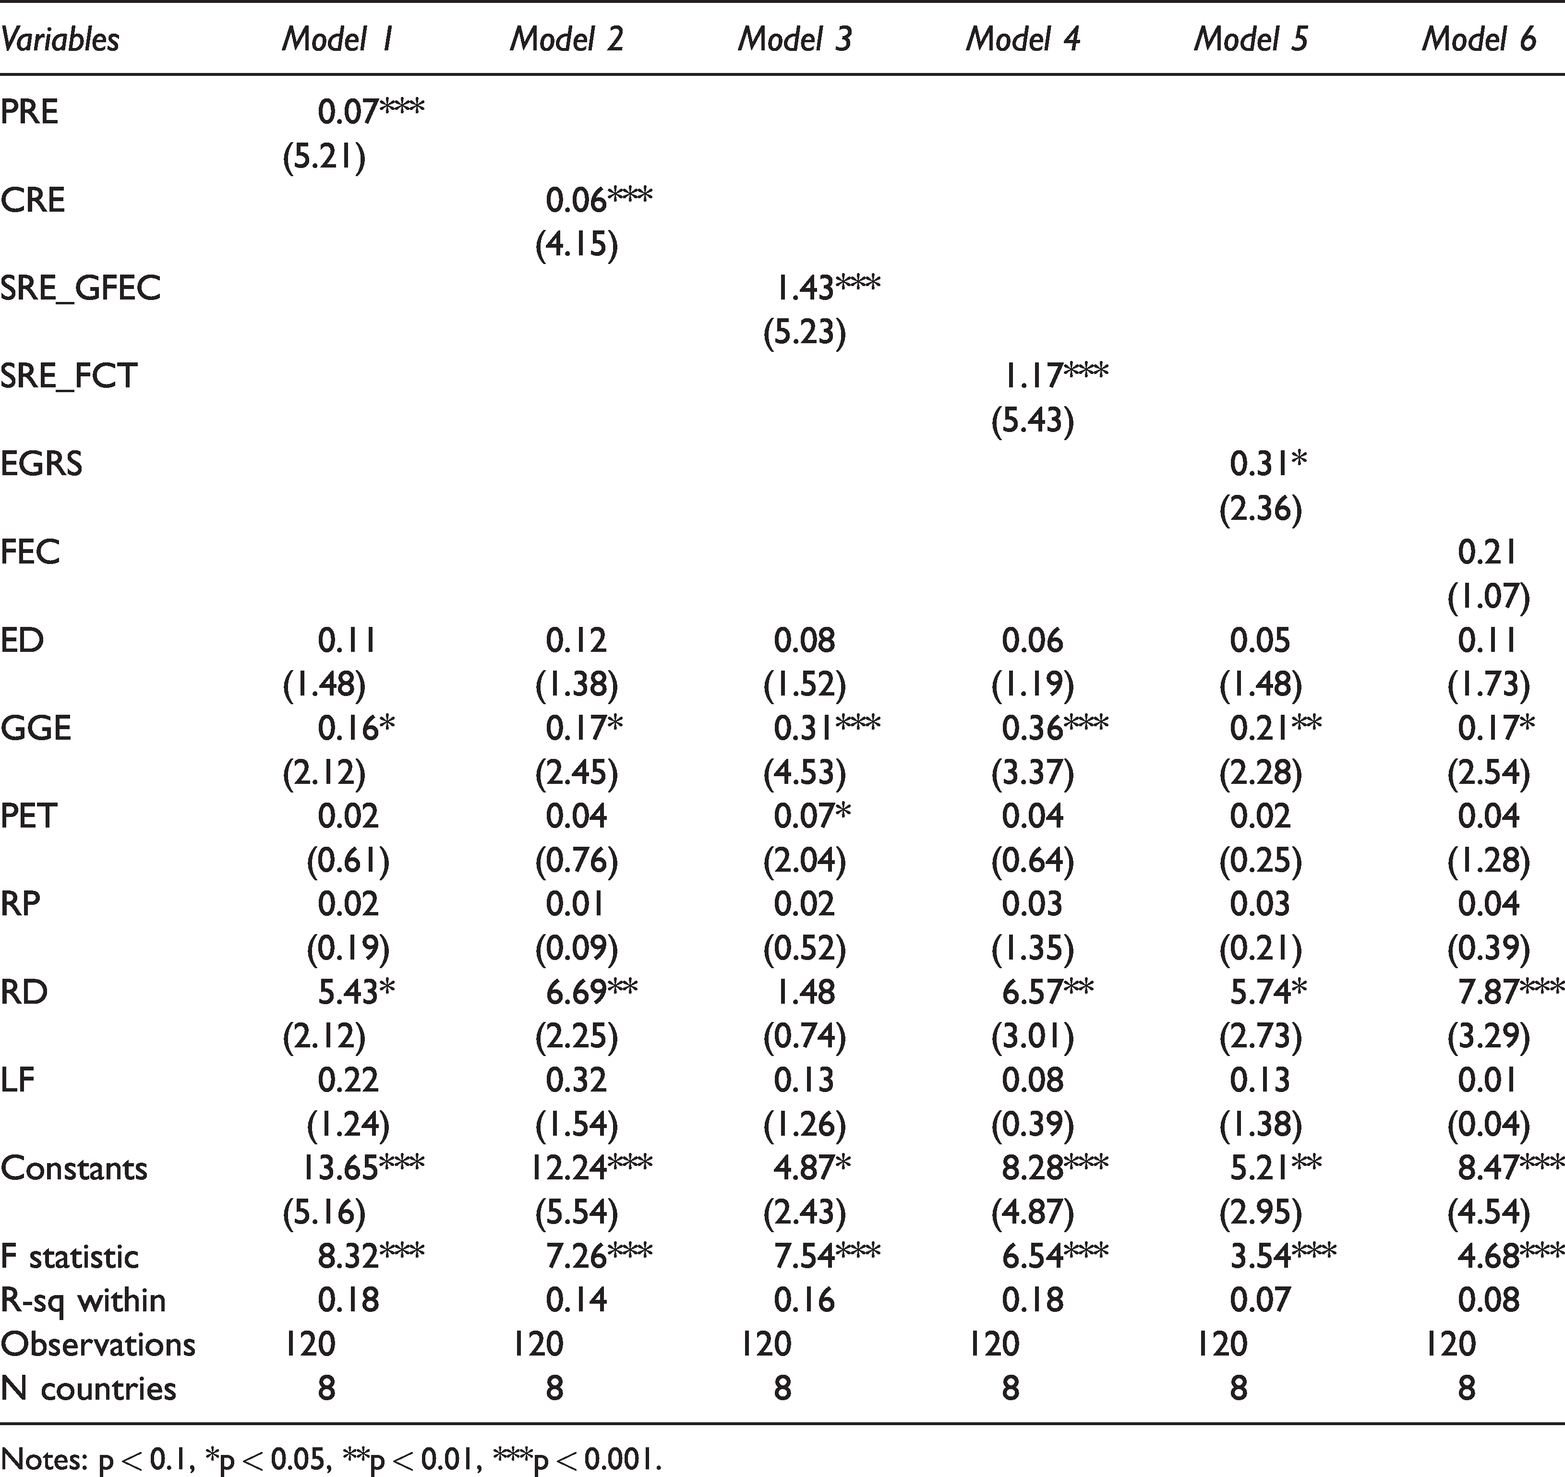
Notes: p < 0.1, *p < 0.05, **p < 0.01, ***p < 0.001.
The above Table 5 is about biomass energy. The results show the case of Model 1; the variable SBIOFUELS has notable relation to sustainable growth. In Model 2, this study includes another variable BGAS and excluded SBIOFUELS that has a major influence on sustainable growth. Our third model shows as MW has a noteworthy effect on growth. In Model 4, the BGASOLINE also has a substantial influence on sustainable growth. Similarly, in Model 5 the study includes another variable BDIESELS to determine the growth. From the viewpoint of an economic indicator, renewable energy sources and economic growth both reflect significant outcomes regarding South Asian economies. However, liquidity and inflation are inversely related to environmental economic growth of South Asian economies. Based upon the above-mentioned results we reject null hypothesis that there is a relationship exist between renewable energy sources and growth level for South Asian region. This suggests that the industrial growth of the economy affects the energy demand in the country.
Estimations of Fixed-effects for biomass energy and economic growth sustainability.
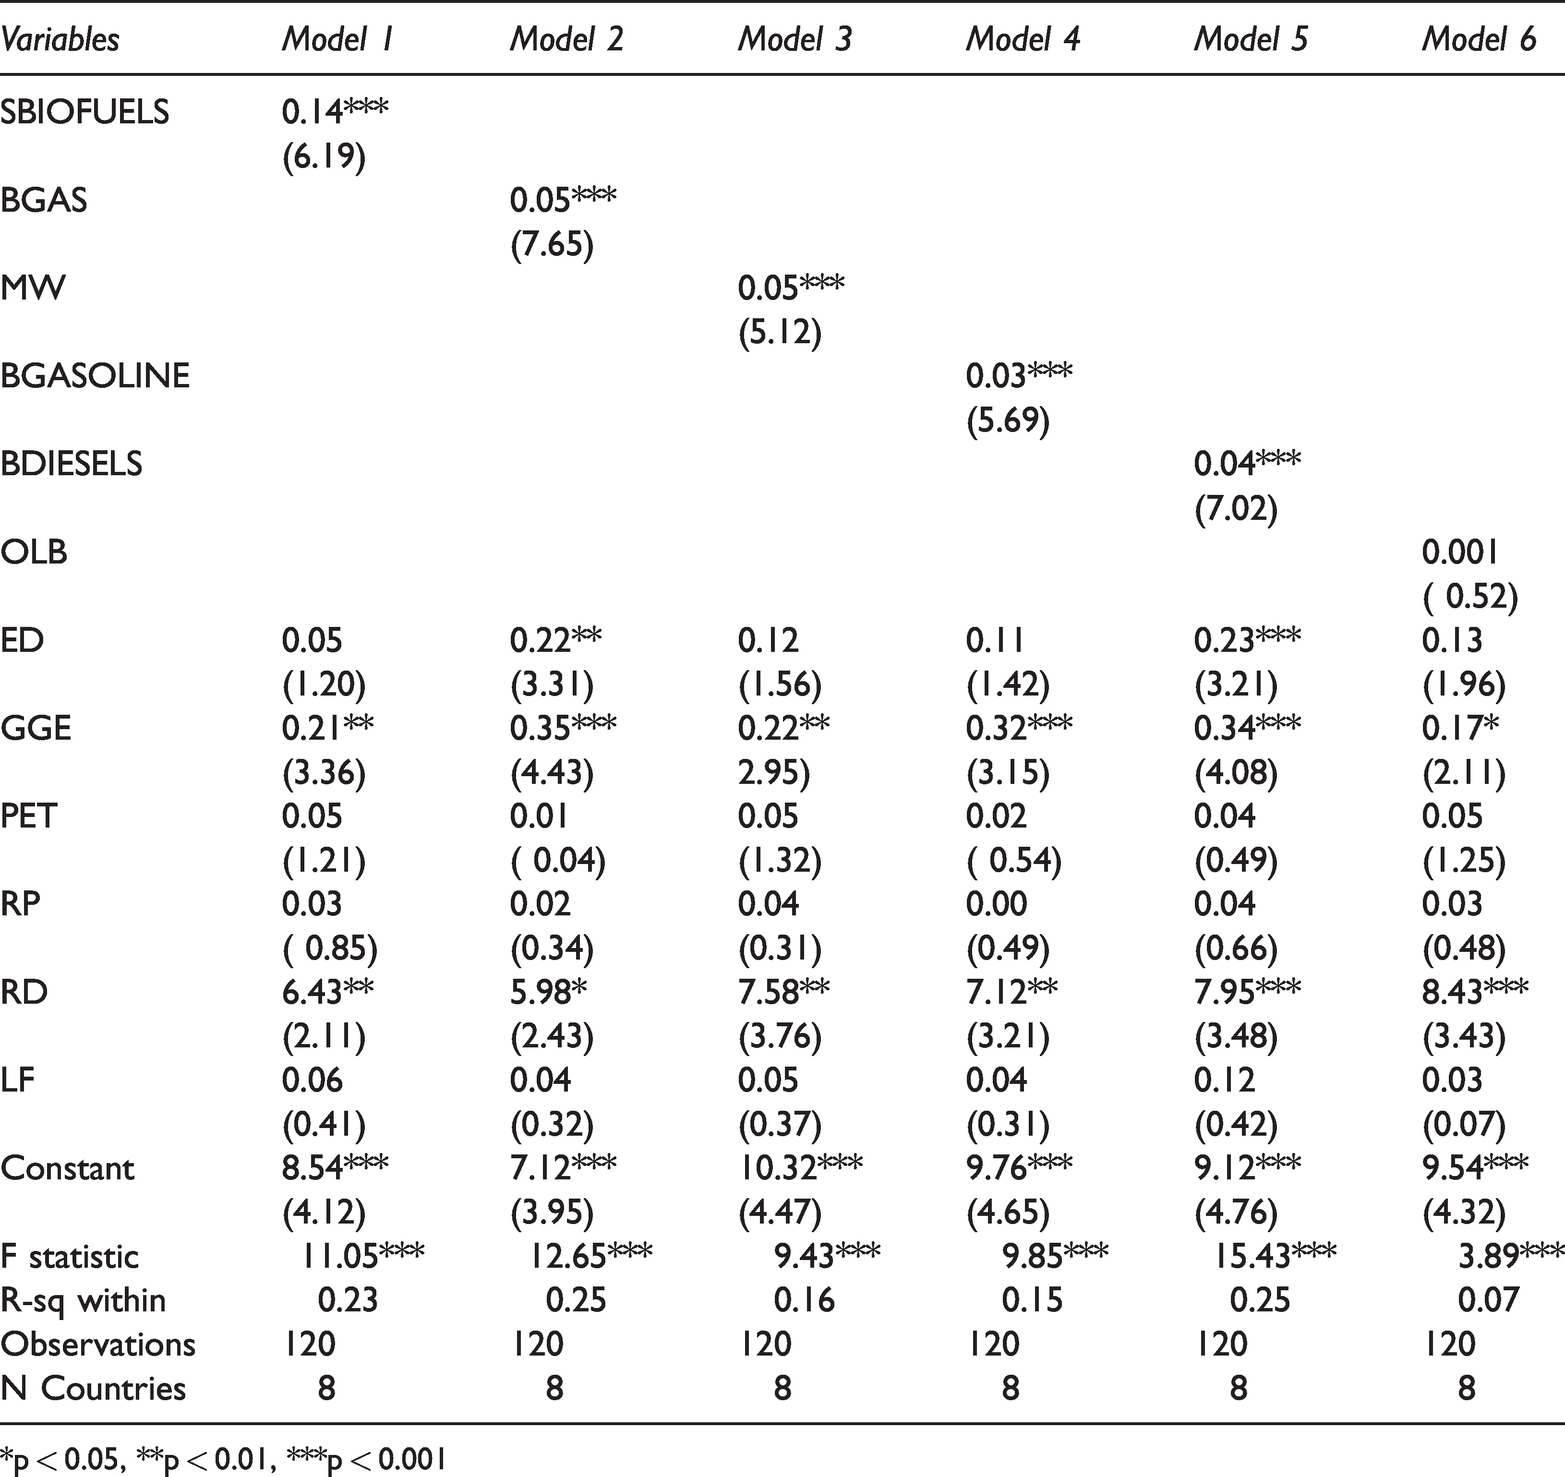
*p < 0.05, **p < 0.01, ***p < 0.001
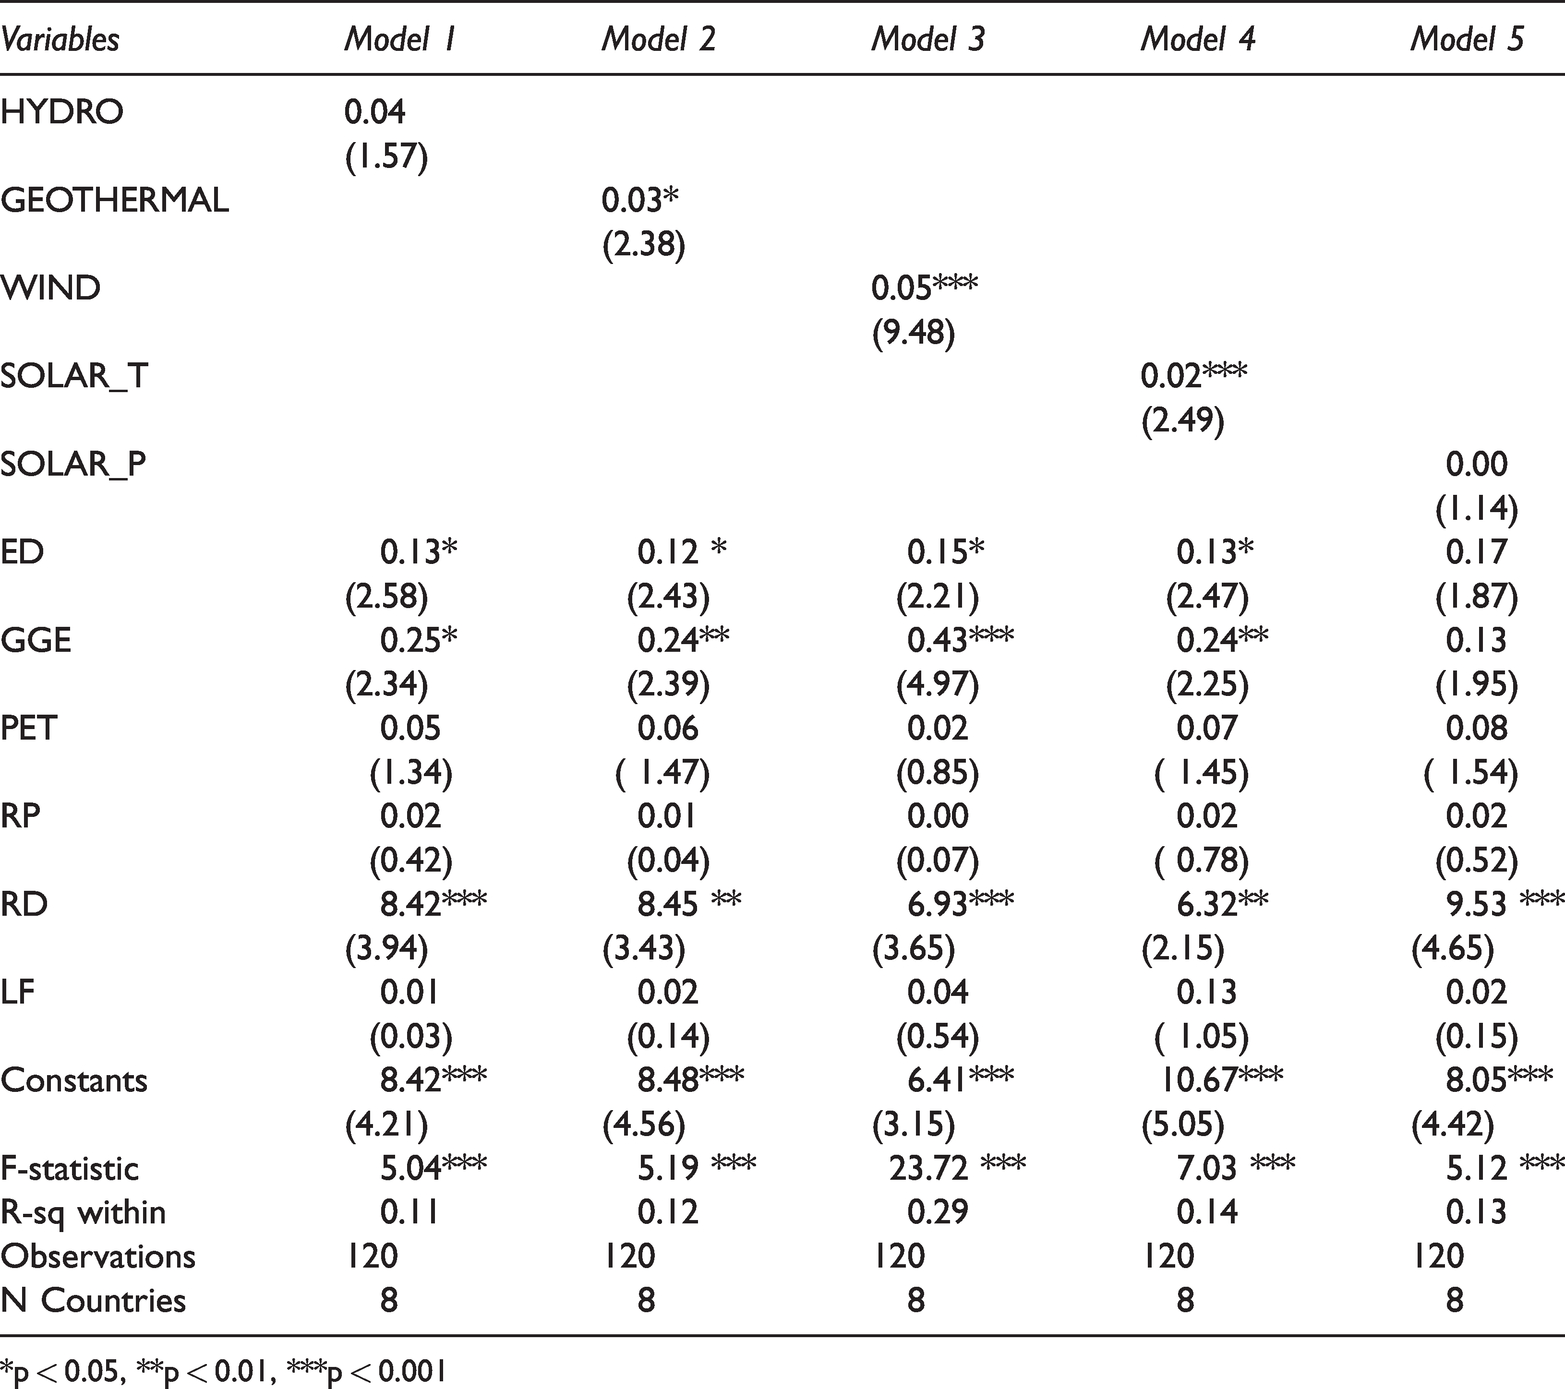
Table 6 shows the impact of “hydropower, geothermal energy, wind energy, and solar energy” on sustainable economic development. The outcomes of this research show that in the case of Model 1, the variable HYDRO is insignificantly influencing sustainable growth. This implies that conserving the hydroelectricity by adopting the energy conservation policies in these countries will have no impact on economic growth. In Model 2, GEOTHERMAL is included, and it shows the direct and significant effect on sustainable growth. Our third model as WIND shows momentous influence on growth. In Model 4, the SOLAR_T has major influence on economic growth. Our empirical findings are in line with those of Ewing et al. (2007), Bildirici and Gokmenoglu (2017), Shabbir et al. (2020), Tugcu (2018), Bilgili et al. (2019), Bulut and Inglesi-Lotz (2019), who all concluded similar results as our study results.
Estimation of Fixed-effects regarding hydropower, geothermal energy, wind, and solar energy on economic growth sustainability.
*p < 0.05, **p < 0.01, ***p < 0.001
Similarly, the Johnson method with Fisher influence known as “Fisher-type panel cointegration test” applied for further analysis. The results reject the non-cointegration null hypothesis. Subsequently, the experimental results in Tables 7 and 8 show that the degree of long-term stability is close between the necessary durable power, vitality, and per capita GNP (Table 9).
Pedroni (Engle-Granger based) test results.
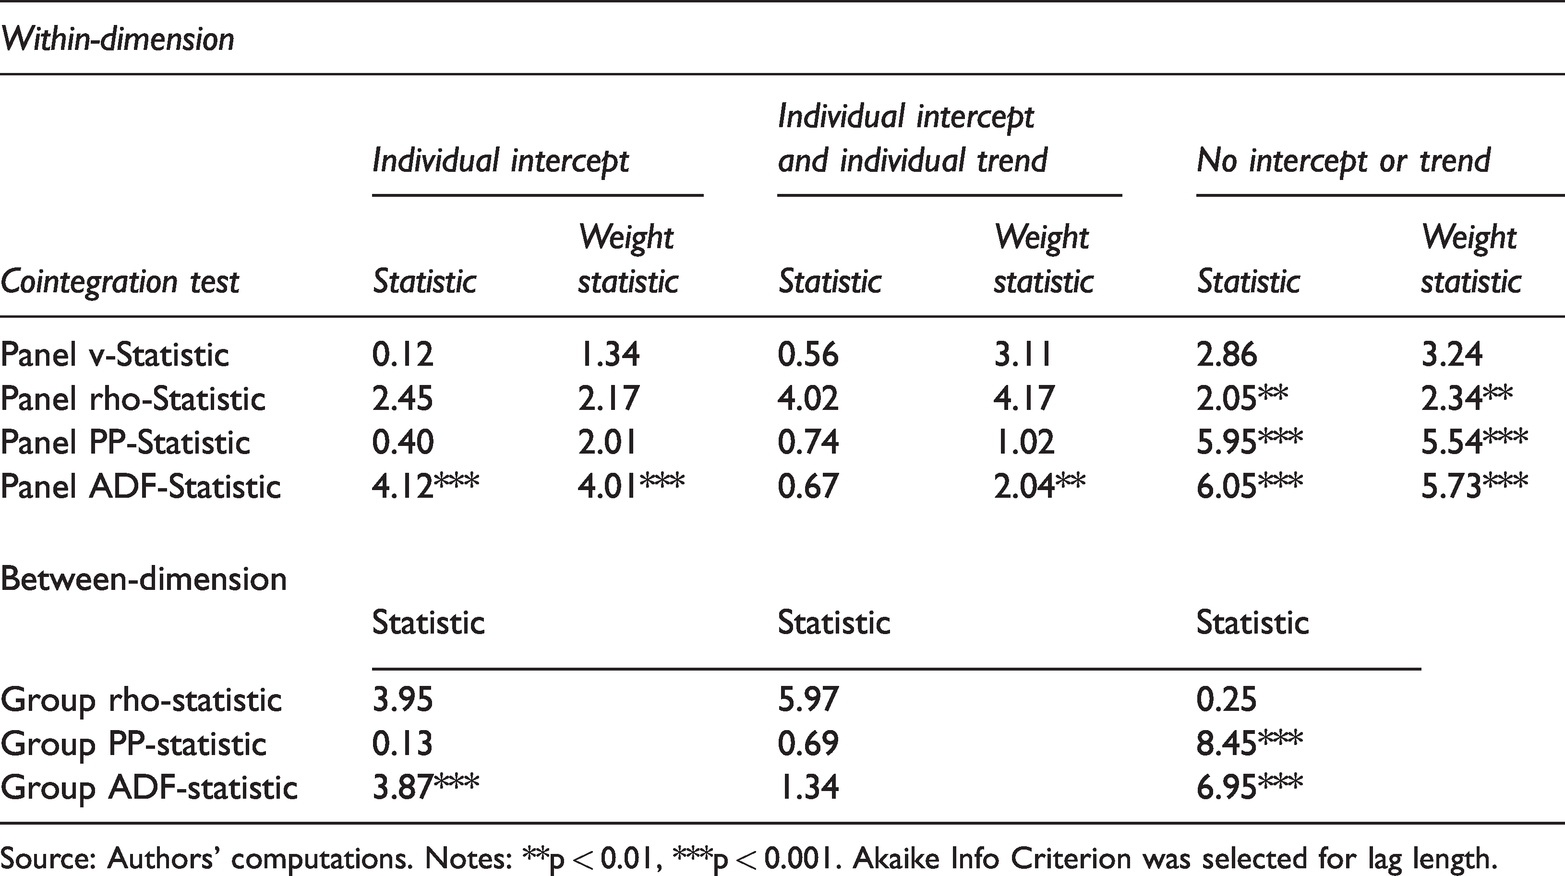
Source: Authors’ computations. Notes: **p < 0.01, ***p < 0.001. Akaike Info Criterion was selected for lag length.
Kao (Engle Granger based) test results.
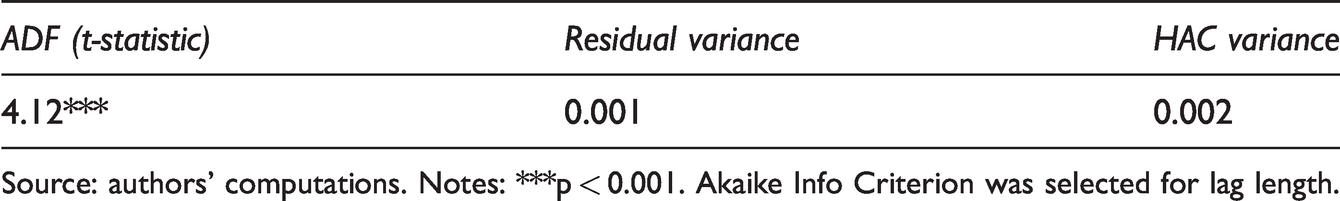
Source: authors’ computations. Notes: ***p < 0.001. Akaike Info Criterion was selected for lag length.
Fisher (combined Johansen) test results.
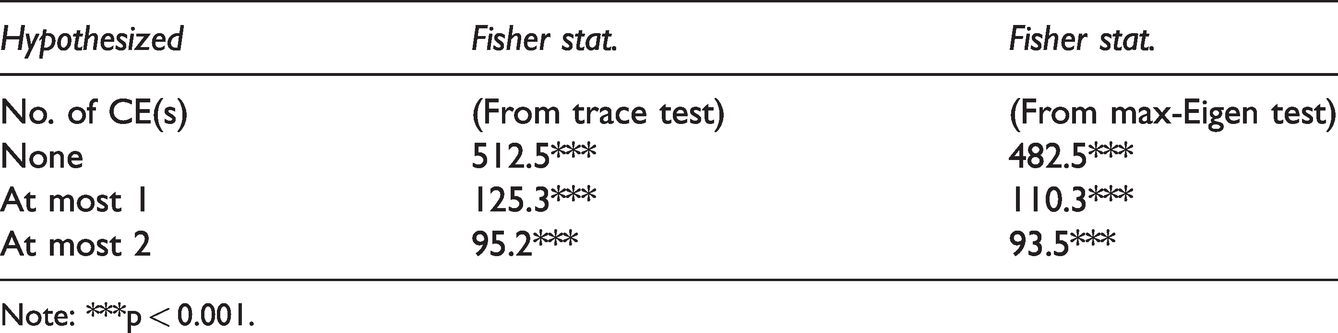
Note: ***p < 0.001.
Table 8 states the Kao test results. The Pedroni test evaluates uniform cointegration relationships through pooled regression and considers each fixed effect. Based on ADF panel cointegration to prove that the cointegration vector is consistent, there is cointegration hypothesis between specific variables.
The hypothesis for the nearness of a lasting relationship was affirmed. The following stage includes the evaluation of this association for the panel pooled method. The outcomes from Table 10 uncovers 1 percent expansion in the power sources builds total national output per capita by 0.06 percent (if there is an occurrence of “FMOLS”) or 0.05 percent (in the event of “DOLS”). The Akaike information criterion was nominated for lag length. The possibilities are calculated by using the “asymptotic Chi-square distribution method.” The relationship examined using the FMOLS model for panel data analysis. The FMOLS model is very important to test the relationship because in the econometric relationship, it gives satisfactory results as compared to the other data analysis models. The panel data FMOLS test results are illustrated that earning spread and money supply growth is significantly affected the renewable energy sources among South Asian countries.
The output of the panel fully modified OLS (FMOLS) and dynamic OLS (DOLS).
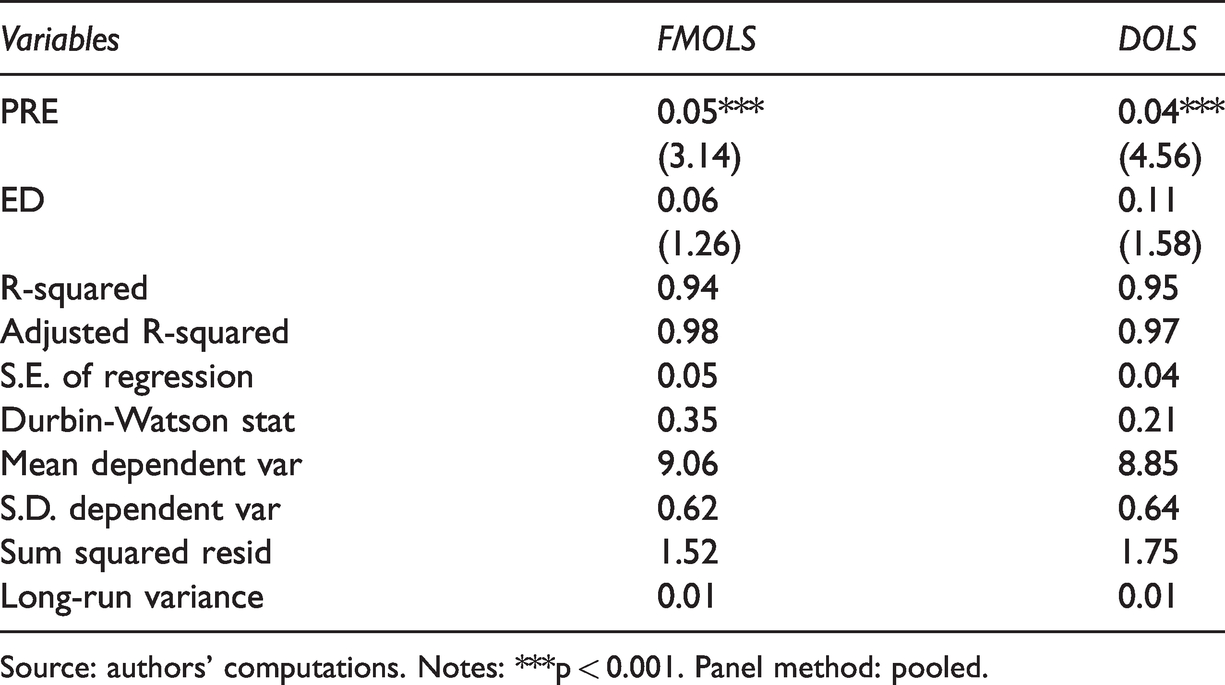
Source: authors’ computations. Notes: ***p < 0.001. Panel method: pooled.
In the essential sustainable energy power generation, there is a causal relationship between vitality dependence, and the per capita GNP was checked by using the “PVECM Granger causality” and the results are transmitted in Table 11. It demonstrates approximate post-effects assumptions for short- and long-term transport factors as shown by equations (6) to (8). Schwarz information criterion has two lags. Whereas, ECT tells the coefficient of the “error correction term.” The equation (6) has the essential creation of sustainable sources of the power and vitality reliance has a measurably immaterial effect on total output of national per capita in the short term. The equation (7) shows GDP per capita that affects the important generation of maintainable power sources in the short-run, along these lines, the protection theory being upheld comparable. While the equation (8) has the essential, creation of sustainable power sources emphatically influences vitality reliance in the short-run. Finally, the outcomes support for monetary development, vitality reliance on the essential generation of sustainable power sources, and the reinforcement of the conservation hypothesis. As per the findings of our research, the increase in renewable sources of energy and its consumption enable GDP to expand. Besides that, renewable energy, coupled with energy-saving and shocks in energy supply, have a determinant impact on GDP and slows down the growth rate of the economy. So, for policymakers to balance the need for renewable sources of energy, the economic impact has to keep in mind.
Granger causality based on the panel vector error correction model (PVECM).
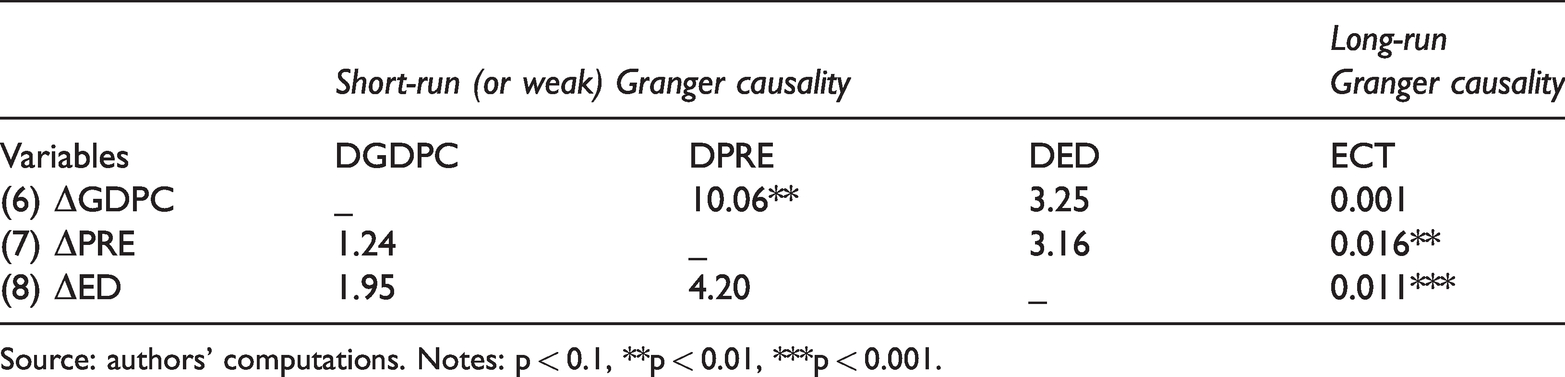
Source: authors’ computations. Notes: p < 0.1, **p < 0.01, ***p < 0.001.
Conclusion
This study analyses the causal association among renewable sources of the energy and sustainable development of economics both by large and by type among South Asian countries. It uses the panel data set of “South Asian countries” for the period 2003–2017, from “World Development Indicators” (WDI) of World Bank. The total national output per capita is used as a proxy for sustainable economic development measures of renewable energy.
The fixed-effects regression model was used for statistical analysis. This study has used the heterogeneous panel co-integration test. This technique allows the interdependence of cross-sectional analysis with separate effects that support in overcoming neglected variable bias. The outcomes of Solar_T model has a major effect on sustainable growth. The renewable energy results show a momentous effect on the economic growth of South Asian region. Besides this, environmentalists and energy experts have similar studies to get the views of local communities and organizations. The current study focuses on the Asian countries, but in the future, researchers can choose specific geographical or economic regions to study the impact of hydroelectricity on the economic growth and environmental well-being of both developing and developed countries. They can also consider the substantial positive environmental impact of hydroelectricity on the CO2 omissions around the world in conjunction with its economic impact. The other variables that can also be included may include R&D budgets of companies and governments dedicated to exploring different options of hydroelectricity and its impact on financial and economic devilment of communities etc.
Footnotes
Declaration of conflicting interests
The author(s) declared no potential conflicts of interest with respect to the research, authorship, and/or publication of this article.
Funding
The author(s) received no financial support for the research, authorship, and/or publication of this article.