
Abstract
As a promising non-contact blade vibration monitoring technology, the blade tip timing (BTT) method is crucial for monitoring the operational state of rotating blades in large turbo-machinery through recording vibration signals of blade tips. Repeated loads and harsh conditions induce high-cycle fatigue cracks in blades. These cracks generate nonlinear tip vibration responses through the blade’s “breathing effect.” The main challenge in identifying blade cracks using the BTT measurement method lies in the difficulty of establishing an analytical relationship between tip displacement and blade damage state. Additionally, due to limitations on the sampling principle of BTT measurement, the useful information gathered by the BTT method is further constrained. In this paper, BTT signals from two probes of testing blades are transformed into envelope diagram images, and an optimized convolutional neural network (CNN) model called BladeNet model with an attention mechanism (BladeNet-AM) is utilized to extract implicit nonlinear dynamic information from these images, enabling the identification of breathing cracks. The effectiveness of the proposed method is validated using the dataset derived from simulations and experiments. The advantage of this method lies in its ability to exploit a richer set of blade dynamics information by converting BTT test data into image format, providing a more comprehensive understanding than analyzing digital signals. By utilizing a limited number of probes, this method exhibits high accuracy and robustness against measurement uncertainties, presenting a novel approach specifically tailored for diagnosing breathing cracks in rotating blades.
Keywords
Introduction
As key components of gas turbines, compressors, and aero-engines, rotating blades are often subjected to repeated temperature and pressure loads under harsh working conditions. 1 The risk of fatigue cracks will rise after long-term operation suffering from those cyclic excitations. Therefore, structural health monitoring and fatigue crack detection are crucial for preventing crack growth and reducing catastrophic accident risks.
Vibration signals are commonly used for blade fault diagnosis. As a novel non-contact blade tip vibration monitoring method, the BTT technique exhibits not only simplified installation but also flexible maintenance procedures. 2 Compared with traditional contact measurement method, the main drawback of BTT is the under-sampling of test signals. Since the emergence of BTT technology, a large number of researchers have attempted to overcome the difficulties in vibration analysis caused by under-sampled measurement signals by developing innovative signal analysis algorithms. 3 At the same time, by improving signal preprocessing methods, they have reduced measurement uncertainties and improved measurement accuracy. 4 These technologies have laid the foundation for BTT to become a feasible technical approach for blade condition monitoring.
Although various methodologies have been developed for identifying blade dynamic parameters via BTT techniques,2,3,5 a significant gap persists between current BTT-based blade vibration monitoring approaches 6 and their practical engineering implementation for crack detection. The current BTT measurement based cracks detection methods are mainly divided into two categories. One category of fault detection methodologies relies on monitoring alterations in the dynamic characteristics of blades. Specifically, blade dynamic analysis reveals that crack emergence induces measurable deviations in vibrational response signals.7,8 These deviations are quantified using BTT signals, enabling crack fault determination through analysis of parameter variations. Another category relies on data-driven techniques, employing intelligent classification of BTT data from damaged and undamaged blades to identify crack faults. According to the dynamic analysis of rotating blades, it has been seen that crack damage will cause the decrease in natural frequency of blades. 9 Frequency identification methods based on BTT measurement have been proposed to calculate vibration frequency of blades and detect abnormal ones. As applications of this principle, Diamond 10 and Wu 11 selected resonance frequencies and amplitudes of blade tips as crack diagnosis indicators to classify the crack through the K-means cluster method. Cao 12 proposed a cracked blades identification method that calculated the natural frequency of blades with a single probe. Dong 13 proposed a method of synchro-resonance frequency identification to detect blades with crack faults. However, taking into account the industrial application of BTT technology, the above methods possess two shortcomings: First, the type of blade damage is considered as a “notch” rather than a “breathing crack.” 14 The linear dynamic model suits blades with notch damage, whereas the nonlinear dynamic model is essential for capturing the behavior of blades with breathing cracks. 15 Unlike the linear model, it is challenging to analytically establish a mapping relationship between blade tip displacement responses and nonlinear blade dynamic parameters. Second, considering with the blade mistuning 16 and the signal noise, 4 frequencies of different blades identified through BTT will be inevitably different. Therefore, relying solely on frequency changes as a criterion for crack fault diagnosis is prone to misdiagnosis in practical applications.
Nonlinear dynamic characteristics of breathing cracks will lead to multi-frequency responses in blade vibration signals.6,17 Several researches have been applied for multi-frequency detection based on under-sampled BTT signals. Lin 18 and Pan 19 induced sparse representation theory into blade tip vibration frequency reconstruction and detected vibration frequency components. Wang 20 applied multiple signal classification (MUSIC) algorithm to identify the asynchronous frequencies of the blade from the under-sampled BTT signal. Chen 21 proposed a blind interpolation method to reconstruct full period sampling blade vibration data. However, over three probes are needed to obtain reliable results in those methods and the accuracy of frequency reconstruction is relied on the precise of probe layout positions. Consequently, descriptions that extract multi-frequency features from vibration signals in BTT data for crack detection are scarce in currently published literatures.
With the development of intelligent classification algorithms, many researches focus on detecting abnormal blades from sampled BTT data directly. Neural networks, as a widely used data-driven approach, can classify input data labels without signal preprocessing. To operationalize this approach, Zhu 22 develops a crack fault diagnostic method by integrating neural networks with BTT measurement data. Zhang 23 also proposed a blade defect diagnosis method by fusing raw under-sampled BTT and tip clearance data based on neural networks. Chen 24 introduced deep learning into BTT vibration reconstruction and proposed a deep compressed sensing method. However, the aforementioned methods, which utilize notch fault data, show a limitation in generalized adaptability when faced with typical fatigue cracks encountered in compressor blades. Moreover, data-driven approaches demonstrate limited interpretability due to the lack of integration with dynamic models of breathing cracks.
To overcome limitations above, a breathing crack identification method based on envelope diagram image using dual-probe BTT signals is proposed. To address the challenge of conventional nonlinear models in establishing analytical relationships between crack parameters and blade tip displacement, this study integrates blade dynamics with an enhanced CNN-based image recognition algorithm for BTT signal analysis. By transforming BTT data into the image domain and extracting dynamic features via advanced CNN, the method enables classification of blades with breathing cracks. The crack evaluation criterion of the proposed method is interpretable and universal for various rotating blades, while it does not impose strict restrictions on the placement of two BTT sensors.
This paper is organized as follows: in Section 2, the dynamic model of blades with cracks is established and nonlinear vibration characteristics of tip responses are analyzed. In Section 3, the crack identification method based on an optimized CNN model called BladeNet-AM is presented in detail. Simulation and experimental results are presented to evaluate the feasibility of proposed methods in Section 4 and Section 5. Finally, conclusions are reported in Section 6.
Dynamic characteristics of tip responses of cracked blades
In this section, dynamic model of the blade with breathing crack is established firstly. Then the dynamic response signals of the blade tip are calculated based on the proposed model and their nonlinear characteristics are analyzed. Finally, these characteristics are verified through a frequency sweeping test.
Dynamic model of rotating blades exhibiting breathing crack faults
The rotating blade, which is fixed on the rotating disk, can be simplified as an Euler beam model, as illustrated in Figure 1. Considering the excitation load, the dynamic response of blade tip displacements can be simplified to a single degree of freedom lumped parameter model using the Galerkin method
25
: Model of the blade with a breathing crack. L, w, and h are the dimensions of the blade length, width, and thickness. h
d
is the depth of crack.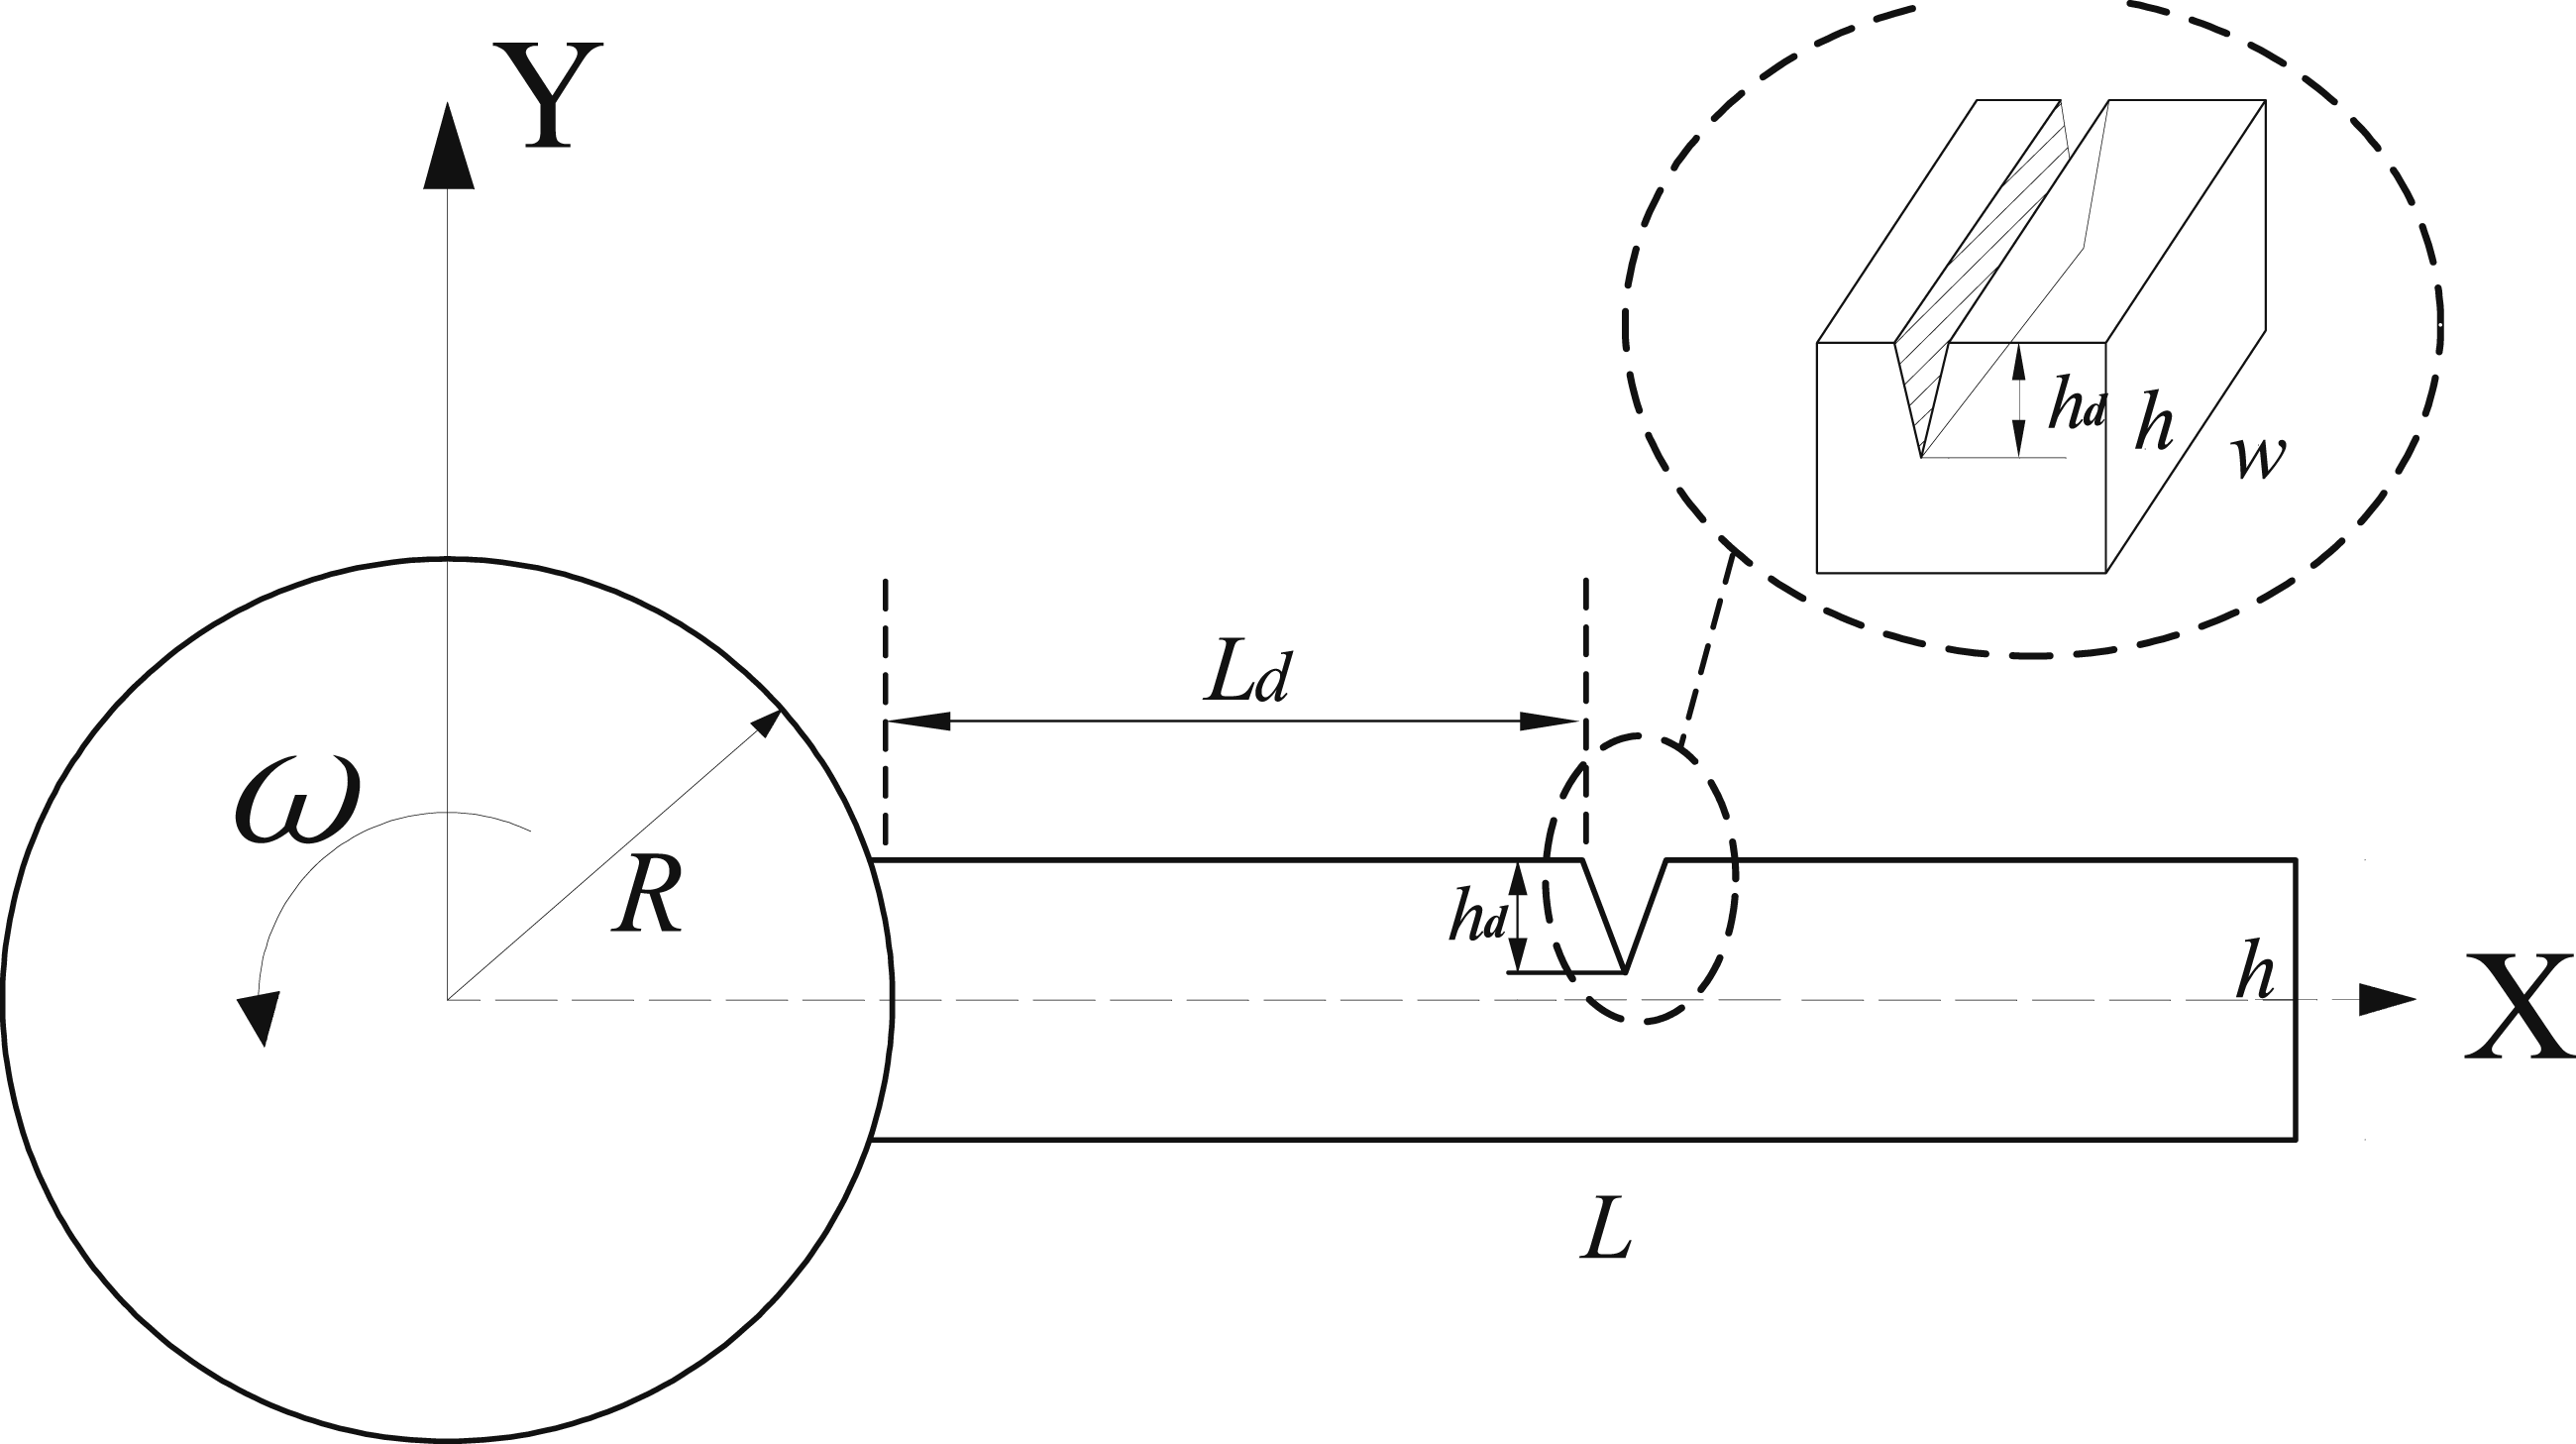

Assuming that the first-order bending vibration of the blade is the dominant component of the blade tip’s vibration, its mode shape is represented as:

Thus, the equivalent mass of the rotating blade may be calculated as
26
:

Neglecting the centrifugal stiffness, the stiffness of blade without crack fatigue can be obtained as:

This model for Euler-Bernoulli blade with breathing crack operates under two fundamental assumptions
27
: • The crack does not penetrate the blade’s neutral axis, thereby preserving global structural integrity and deformation behavior of the system; and • Crack propagation is neglected during the vibration monitoring interval.
To quantify crack-induced dynamic modifications, a lumped flexibility formulation 28 is implemented by introducing additional flexibility terms caused by the presence of the crack.
As shown in Figure 2, when the blade is subjected to excitation loads, two surfaces of the crack are contacted and separated alternatively. Such behavior will cause the changing of flexibility and stiffness of the blade. Therefore, the breathing crack model is induced to describe this kind of fatigue. Schematic diagram of the breathing crack.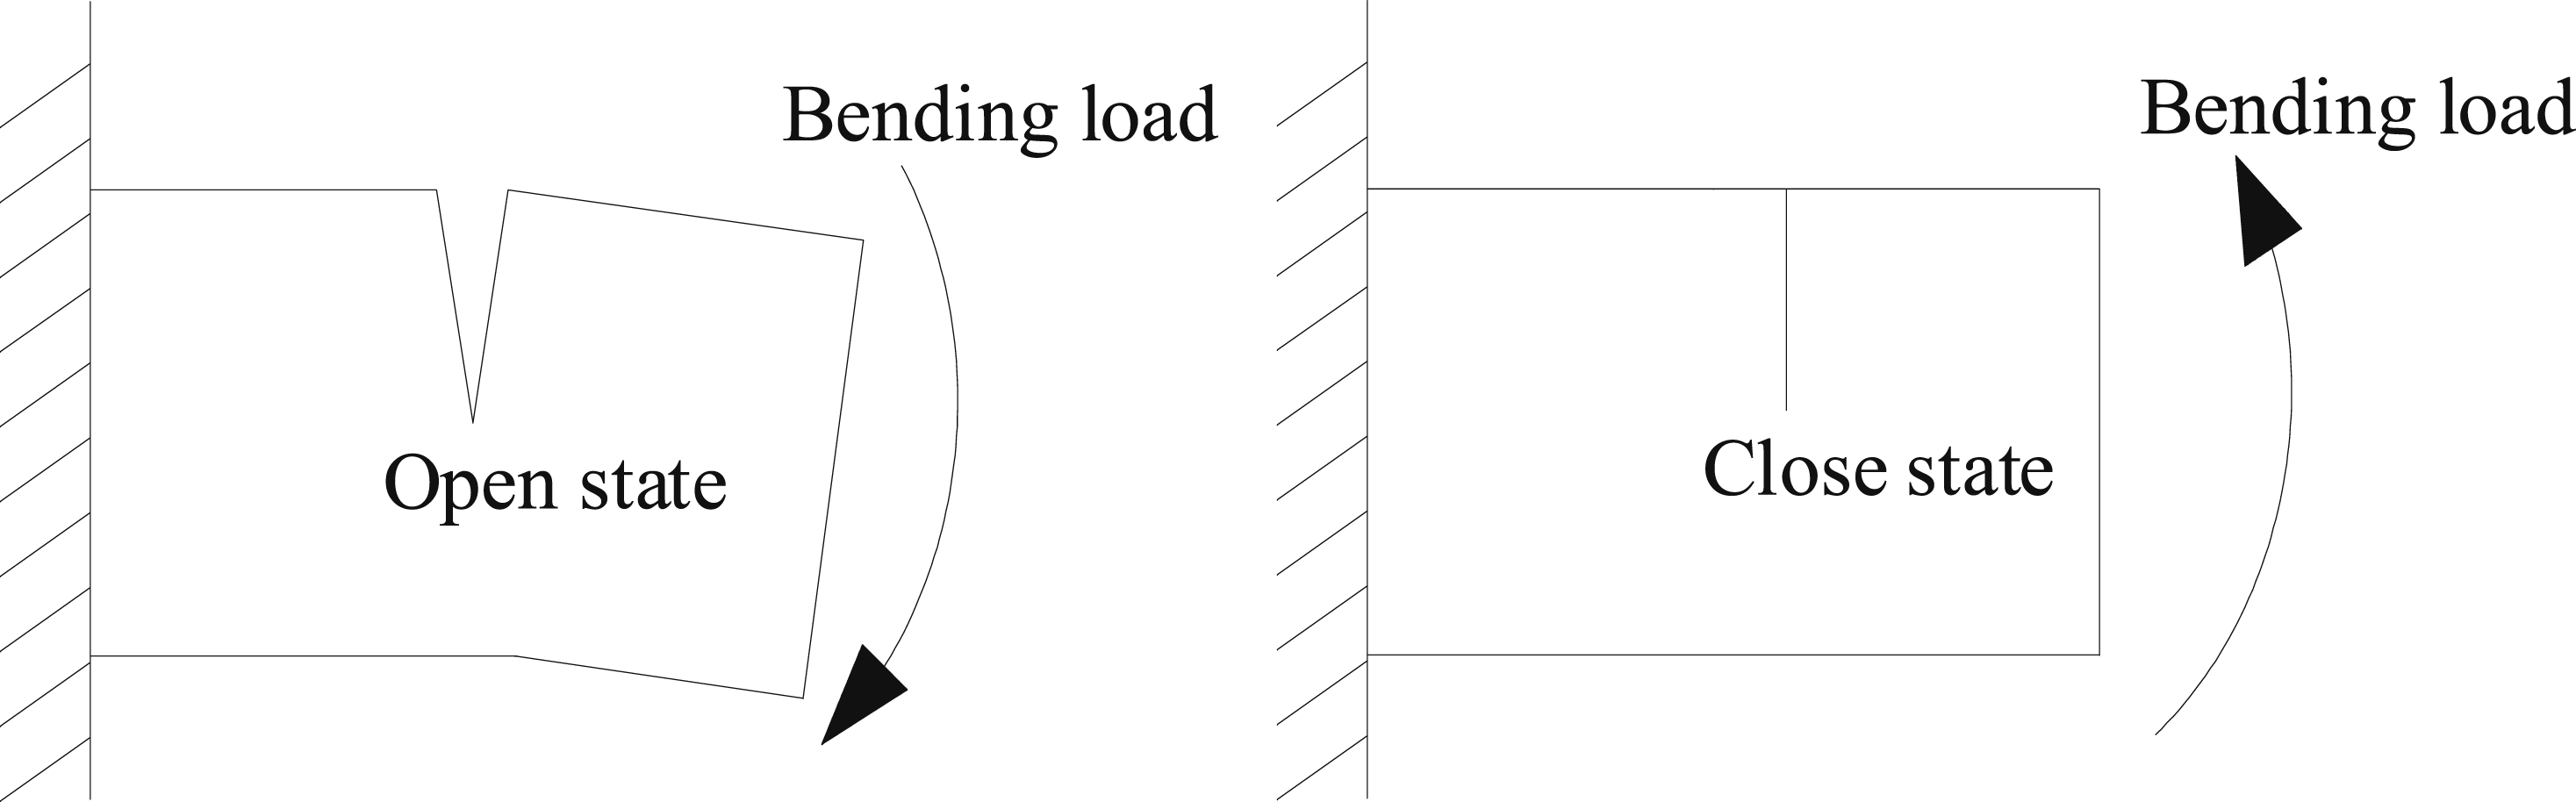
For the cracked blade shown in Figure 1, variation of local flexibility caused by the fully open crack in the blade is calculated as
29
:

With the influence of additional stress concentrated near the crack tip, the stiffness of the cracked blade can be calculated as follows:

Apparently, open and close behavior of the crack in the blade is keeping pace with the alternative external force. As for the rotating blade, the external force which mainly generated by the flow field will be given by:

Suppose a typical operating mode with constant sweep velocity, the phase function θ(t) during the process of uniform acceleration will be presented as:

Figure 2 illustrates the alternating behavior of the breathing crack during blade operation. The opening and closing behavior of the crack is determined by the contact stress on the crack section
31
:
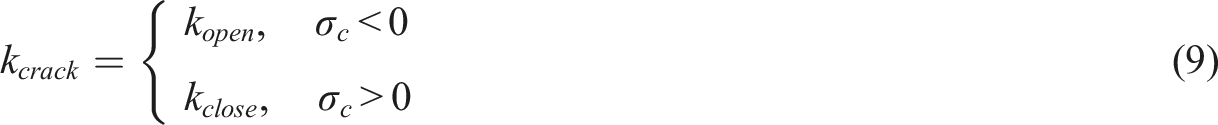

Based on the effect of time-varying forces, a time-varying breathing crack stiffness model is proposed to simulate the equivalent stiffness of the blade dynamic model:

Equation (11) indicates that: With positive bending load (F (t) > 0), the breathing crack is closed, preserving blade stiffness equivalent to the undamaged condition. Conversely, under negative bending load (F (t) <0), the crack opens, allowing blade stiffness to be determined via equation (6). Hence, the response of the cracked blade dynamic model presented in equation (1) exhibits nonlinear characteristics.
The crack damage of the blade will also change its damping. The damping of a single-degree-of-freedom (SDOF) lumped parameter model can be calculated as follows:

Considering the friction between crack surfaces, the damping ratio of the blade with the breathing crack will be calculated by adding the friction damping to the original damping ratio of the undamaged one
32
:

The detailed calculation processes of the friction damping are described by many related scholars.32,33 Many factors, such as material, crack position, and crack depth, will cause the changing for the friction damping. The precise values of the friction damping are measured through vibration experiment of cracked blades. The experiment result shows that the friction damping ratio for the same blade increases proportionally with the expansion of the breathing crack depth. 33 Thus, both the stiffness and the damping ratio of a blade with a breathing crack vary from those of the intact blade, leading to the complex characteristics in the blade tip dynamic responses, and pose significant challenges in deriving an analytical solution for the blade tip response. In this article, blade tip displacements at various time intervals are generated numerically through the dynamical model described in this subsection.
Dynamic characteristics analysis of tip responses in cracked blades
According to the dynamic model built in equation (1), the difference in dynamic parameters between a cracked blade and an intact blade lies in the damping c and stiffness k (t). In this subsection, a specimen is designed to calculate and display tip displacement responses with 100 mm in length, 40 mm in width and 2 mm in depth. The material of the specimen is chosen as duralumin alloy. Another same specimen is selected to simulate the cracked blade with the crack depth ratio h
c
/h = 0.4. The excitation force determined in equation (7) are added to intact and cracked specimen blades for generating the tip response signals with the working condition parameter EO = 5. The blade vibration near resonance regions can be approximately formulated as a linear dynamic model:

Parameters of the model can be calculated according to the theory in Section 2.1, where
The general solution for the transient response of the blade tip displacement,
34
denoted as:
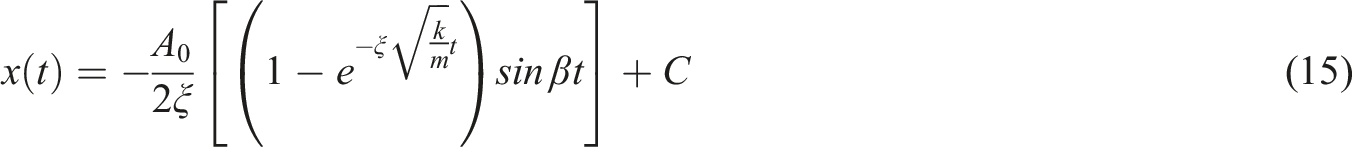
It is evident from the formula that the vibration response signal is expressed as a damped oscillatory equation, in which
Taking the blade set mentioned above as an example, Figure 3 shows the transient response of blade displacements calculated based on various damping ratios, with a given resonance frequency Transient response diagram with different damping ratios.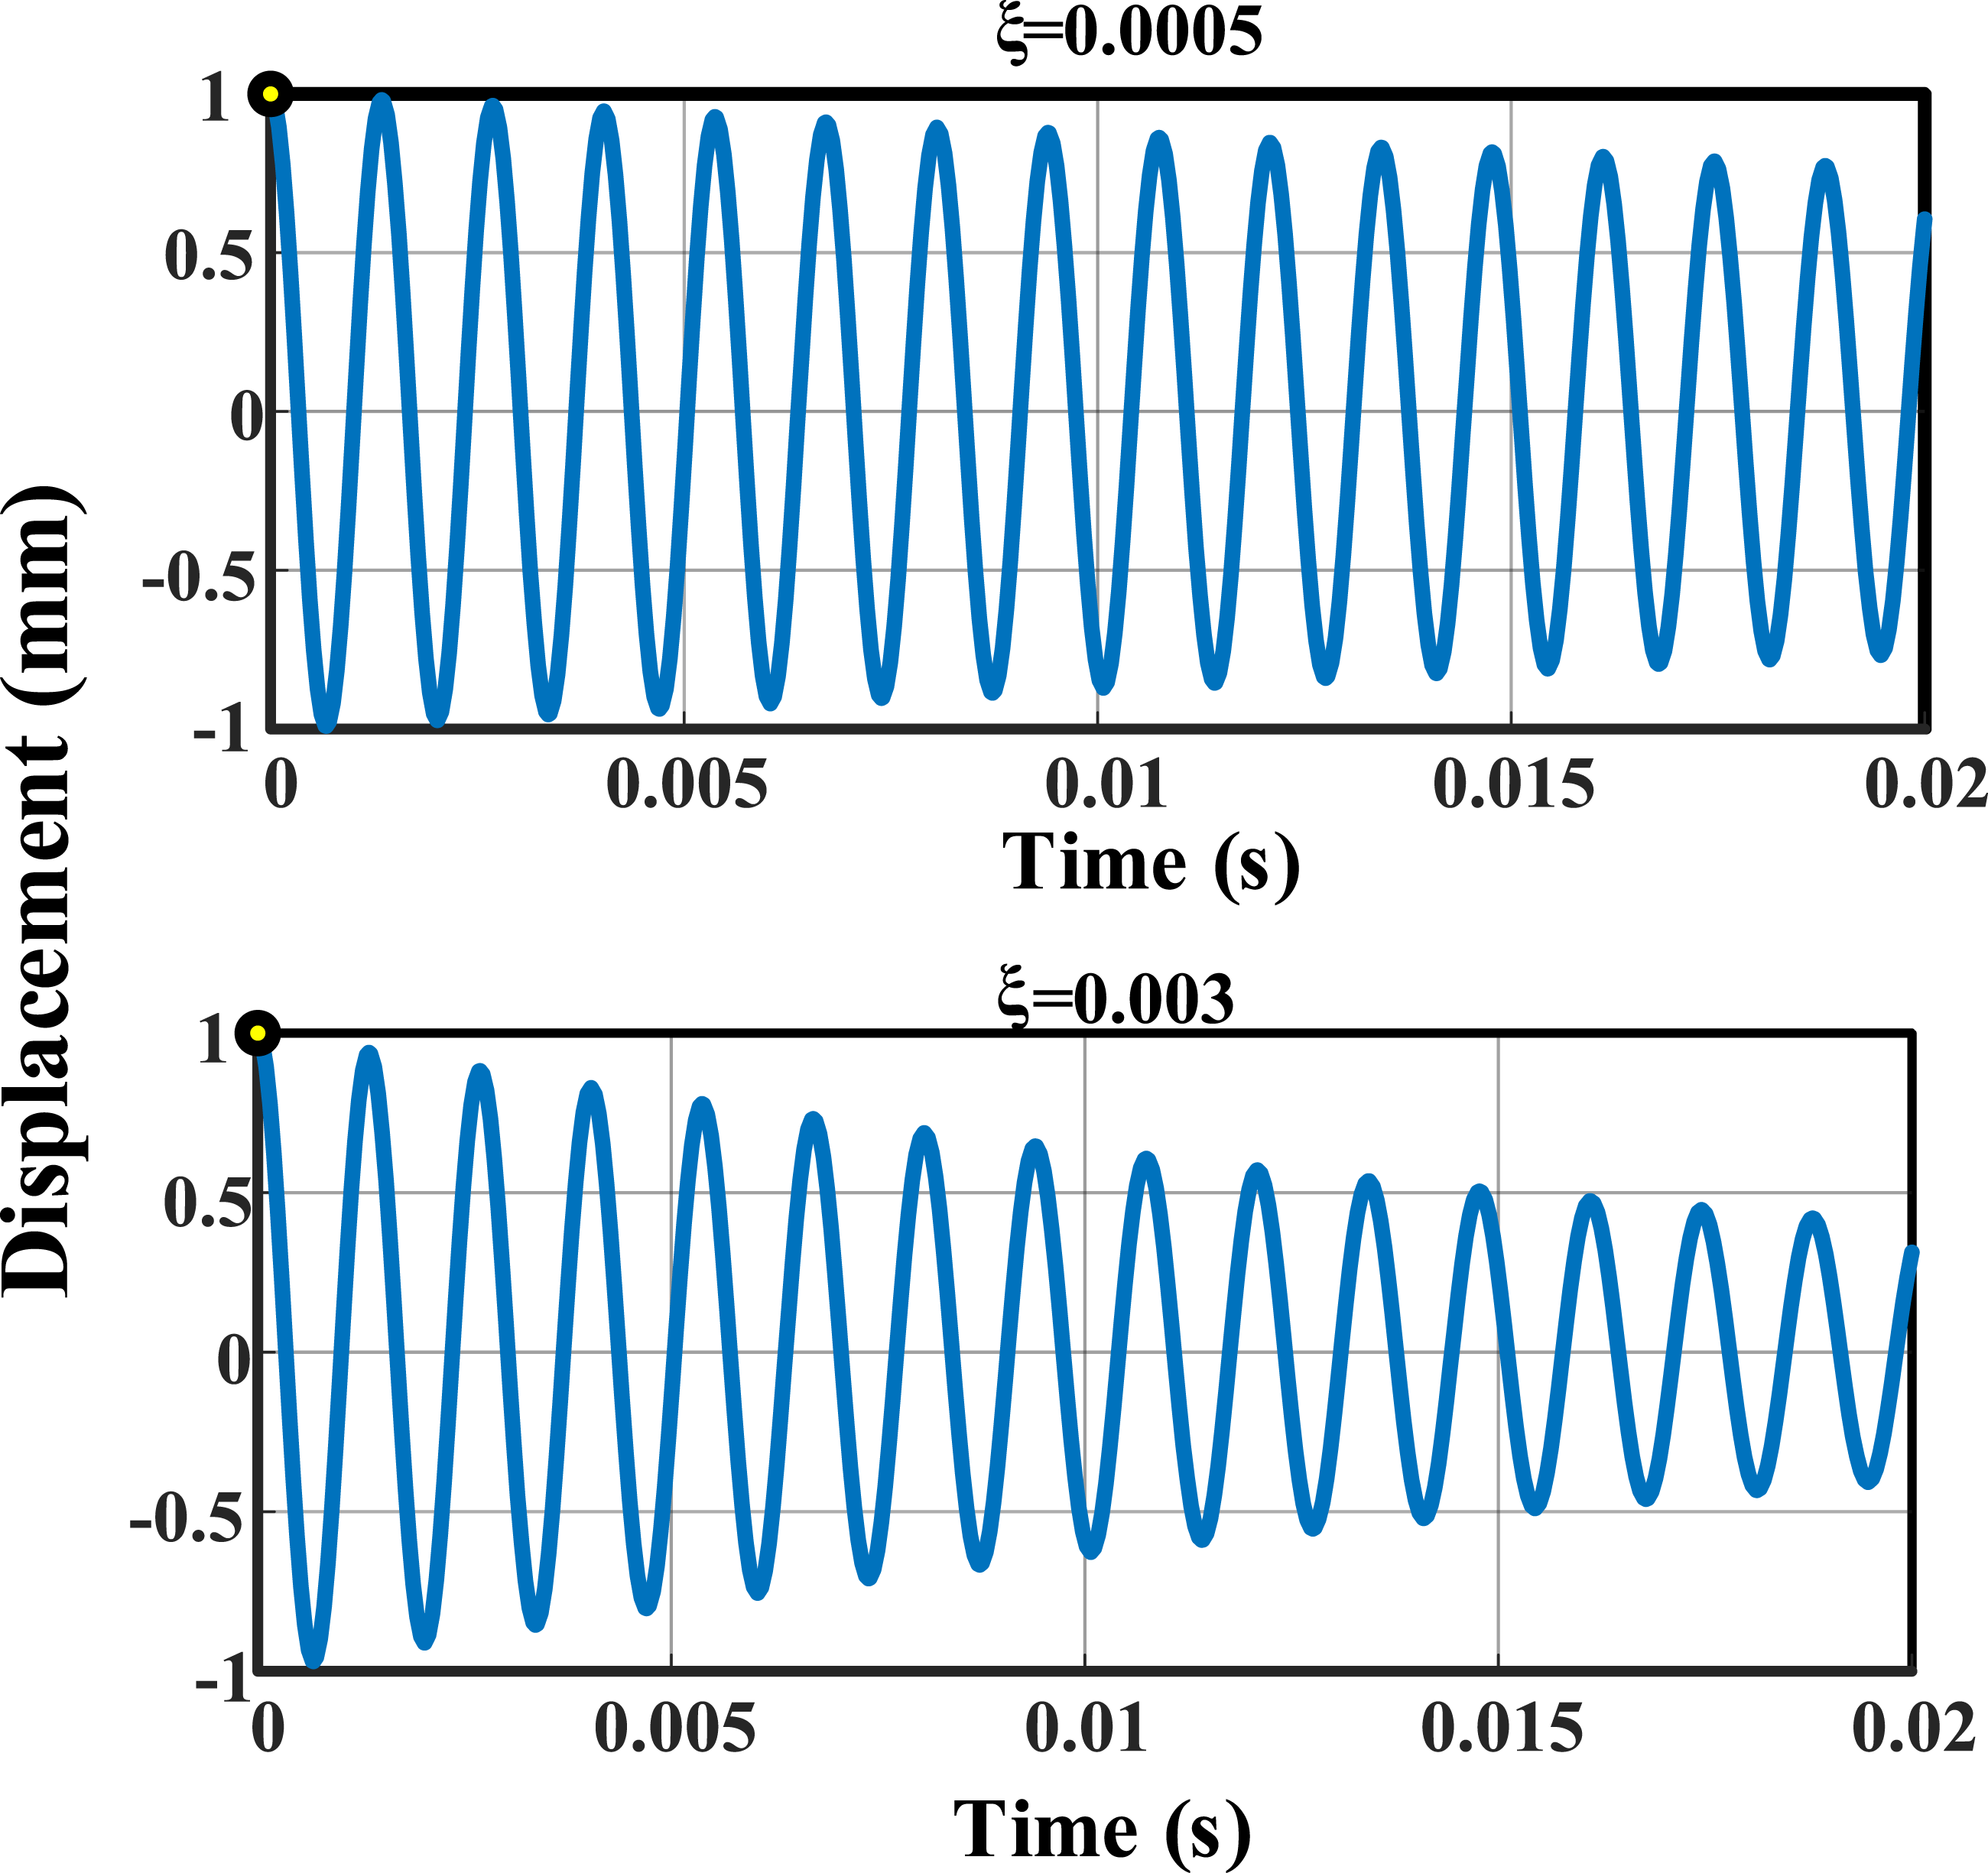
Because of the existence of breathing cracks, the stiffness k of the blade dynamic system is not a constant but a time-varying function expressed in equation (11). The vibrational response of tip displacements of the aforementioned cracked blade during uniform acceleration is shown in Figure 4. It can be observed from the figure that, in addition to the resonance peak excited near the resonant frequencies, sub-harmonic resonance also occurs at half the main resonant frequency on the displacement response curve.
35
The sub-harmonic resonance peak in the sub-harmonic resonance response phenomenon is relatively small compared to the main resonance peak. However, as the crack depth increases, the sub-harmonic resonance peak intensifies significantly. Therefore, monitoring the sub-harmonic resonance response within a certain time interval surrounding the resonance region can serve as a criterion for crack fault detection. Vibration responses of the cracked blade during uniform acceleration.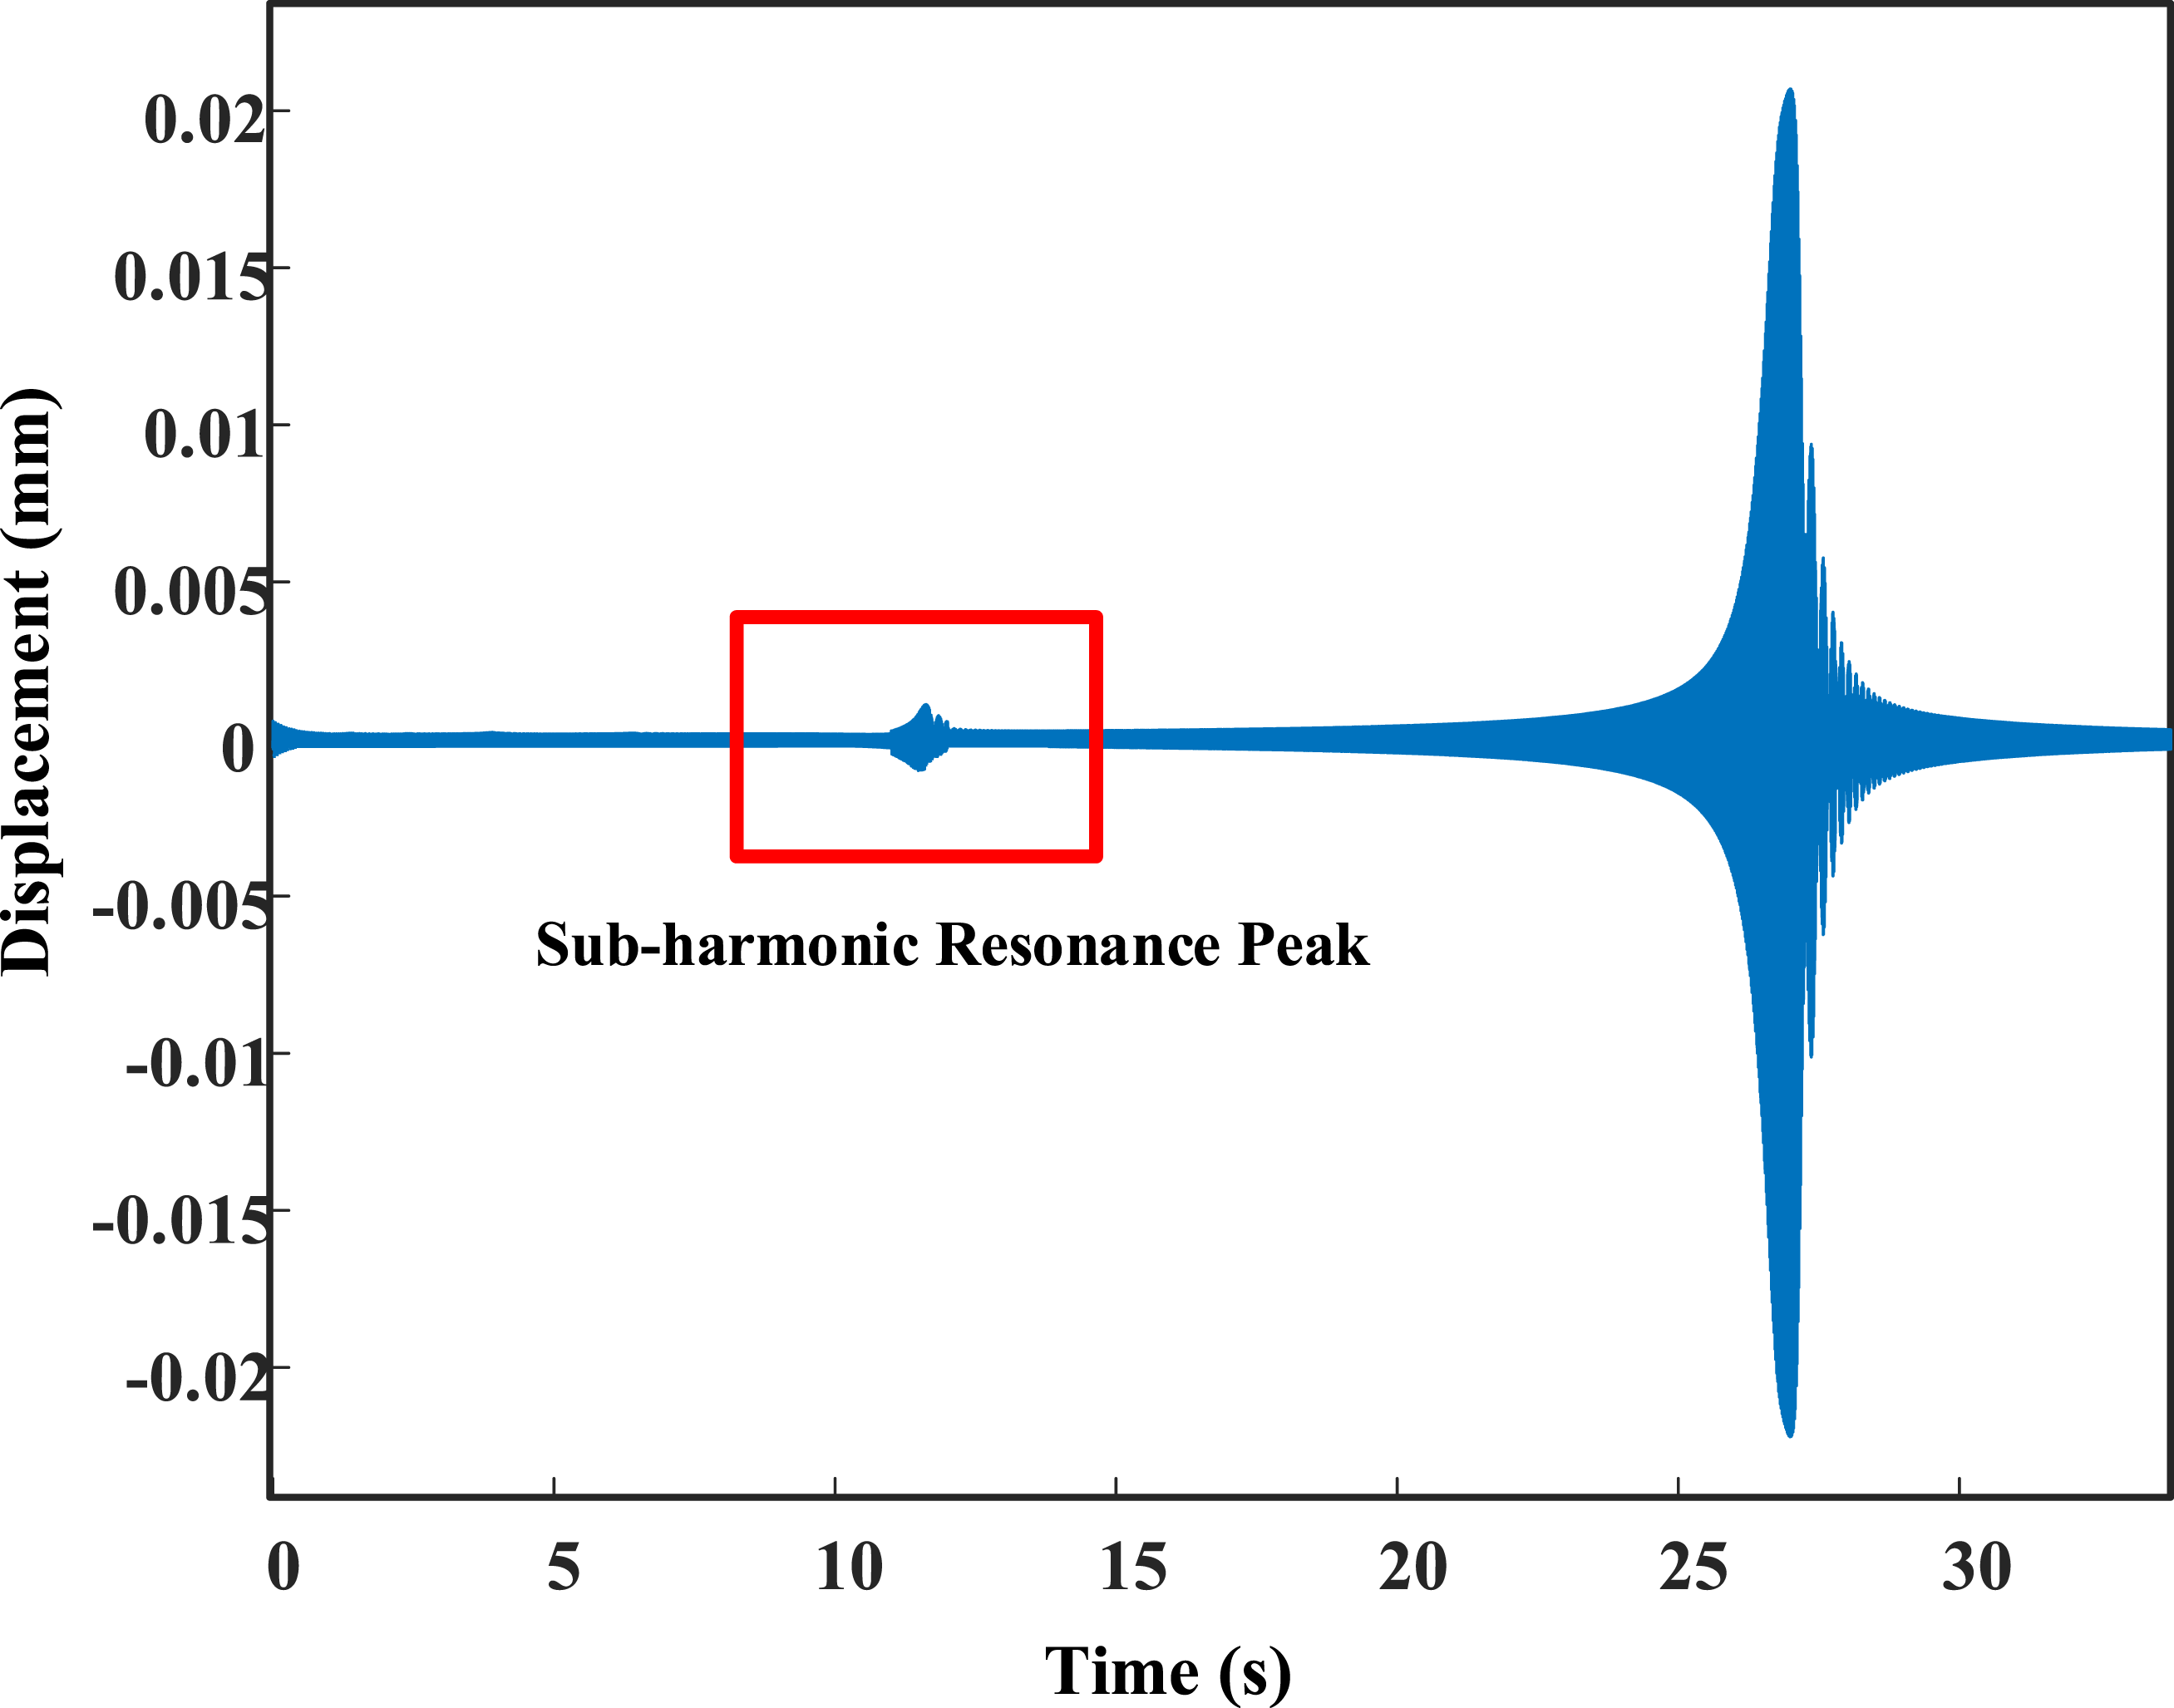
With the influence of nonlinear parameter k(t), the amplitude–frequency curve 36 of a nonlinear vibration system is fundamentally different from that of a linear vibration system. For the blade vibration pattern proposed in this article, the envelope curves of the dynamic response signals demonstrate the variation of amplitude as the excitation frequency changes.
Set the damping ratio of both specimen to the same value as ξ = 0.001, tip displacement responses of the intact and cracked blades are generated only considering the difference of stiffness k (t). The vibration response envelope curves of the cracked blade and its corresponding intact blade from this simulation have been zoomed in on the peaks of the resonance region, and they are plotted simultaneously in Figure 5. It can be inferred from the Figure 5 that the shape of the peak on the resonance curve of the cracked blade exhibits an inclined shape, with unequal slopes on both sides of the highest point. In contrast, the shape at the same position on the intact blade is smooth and symmetric. Therefore, the difference in the shape of the blade tip displacement response curve in the resonance region is also a diagnostic feature for identifying blade crack faults. Vibration response envelope curves of the cracked blade and its corresponding intact blade.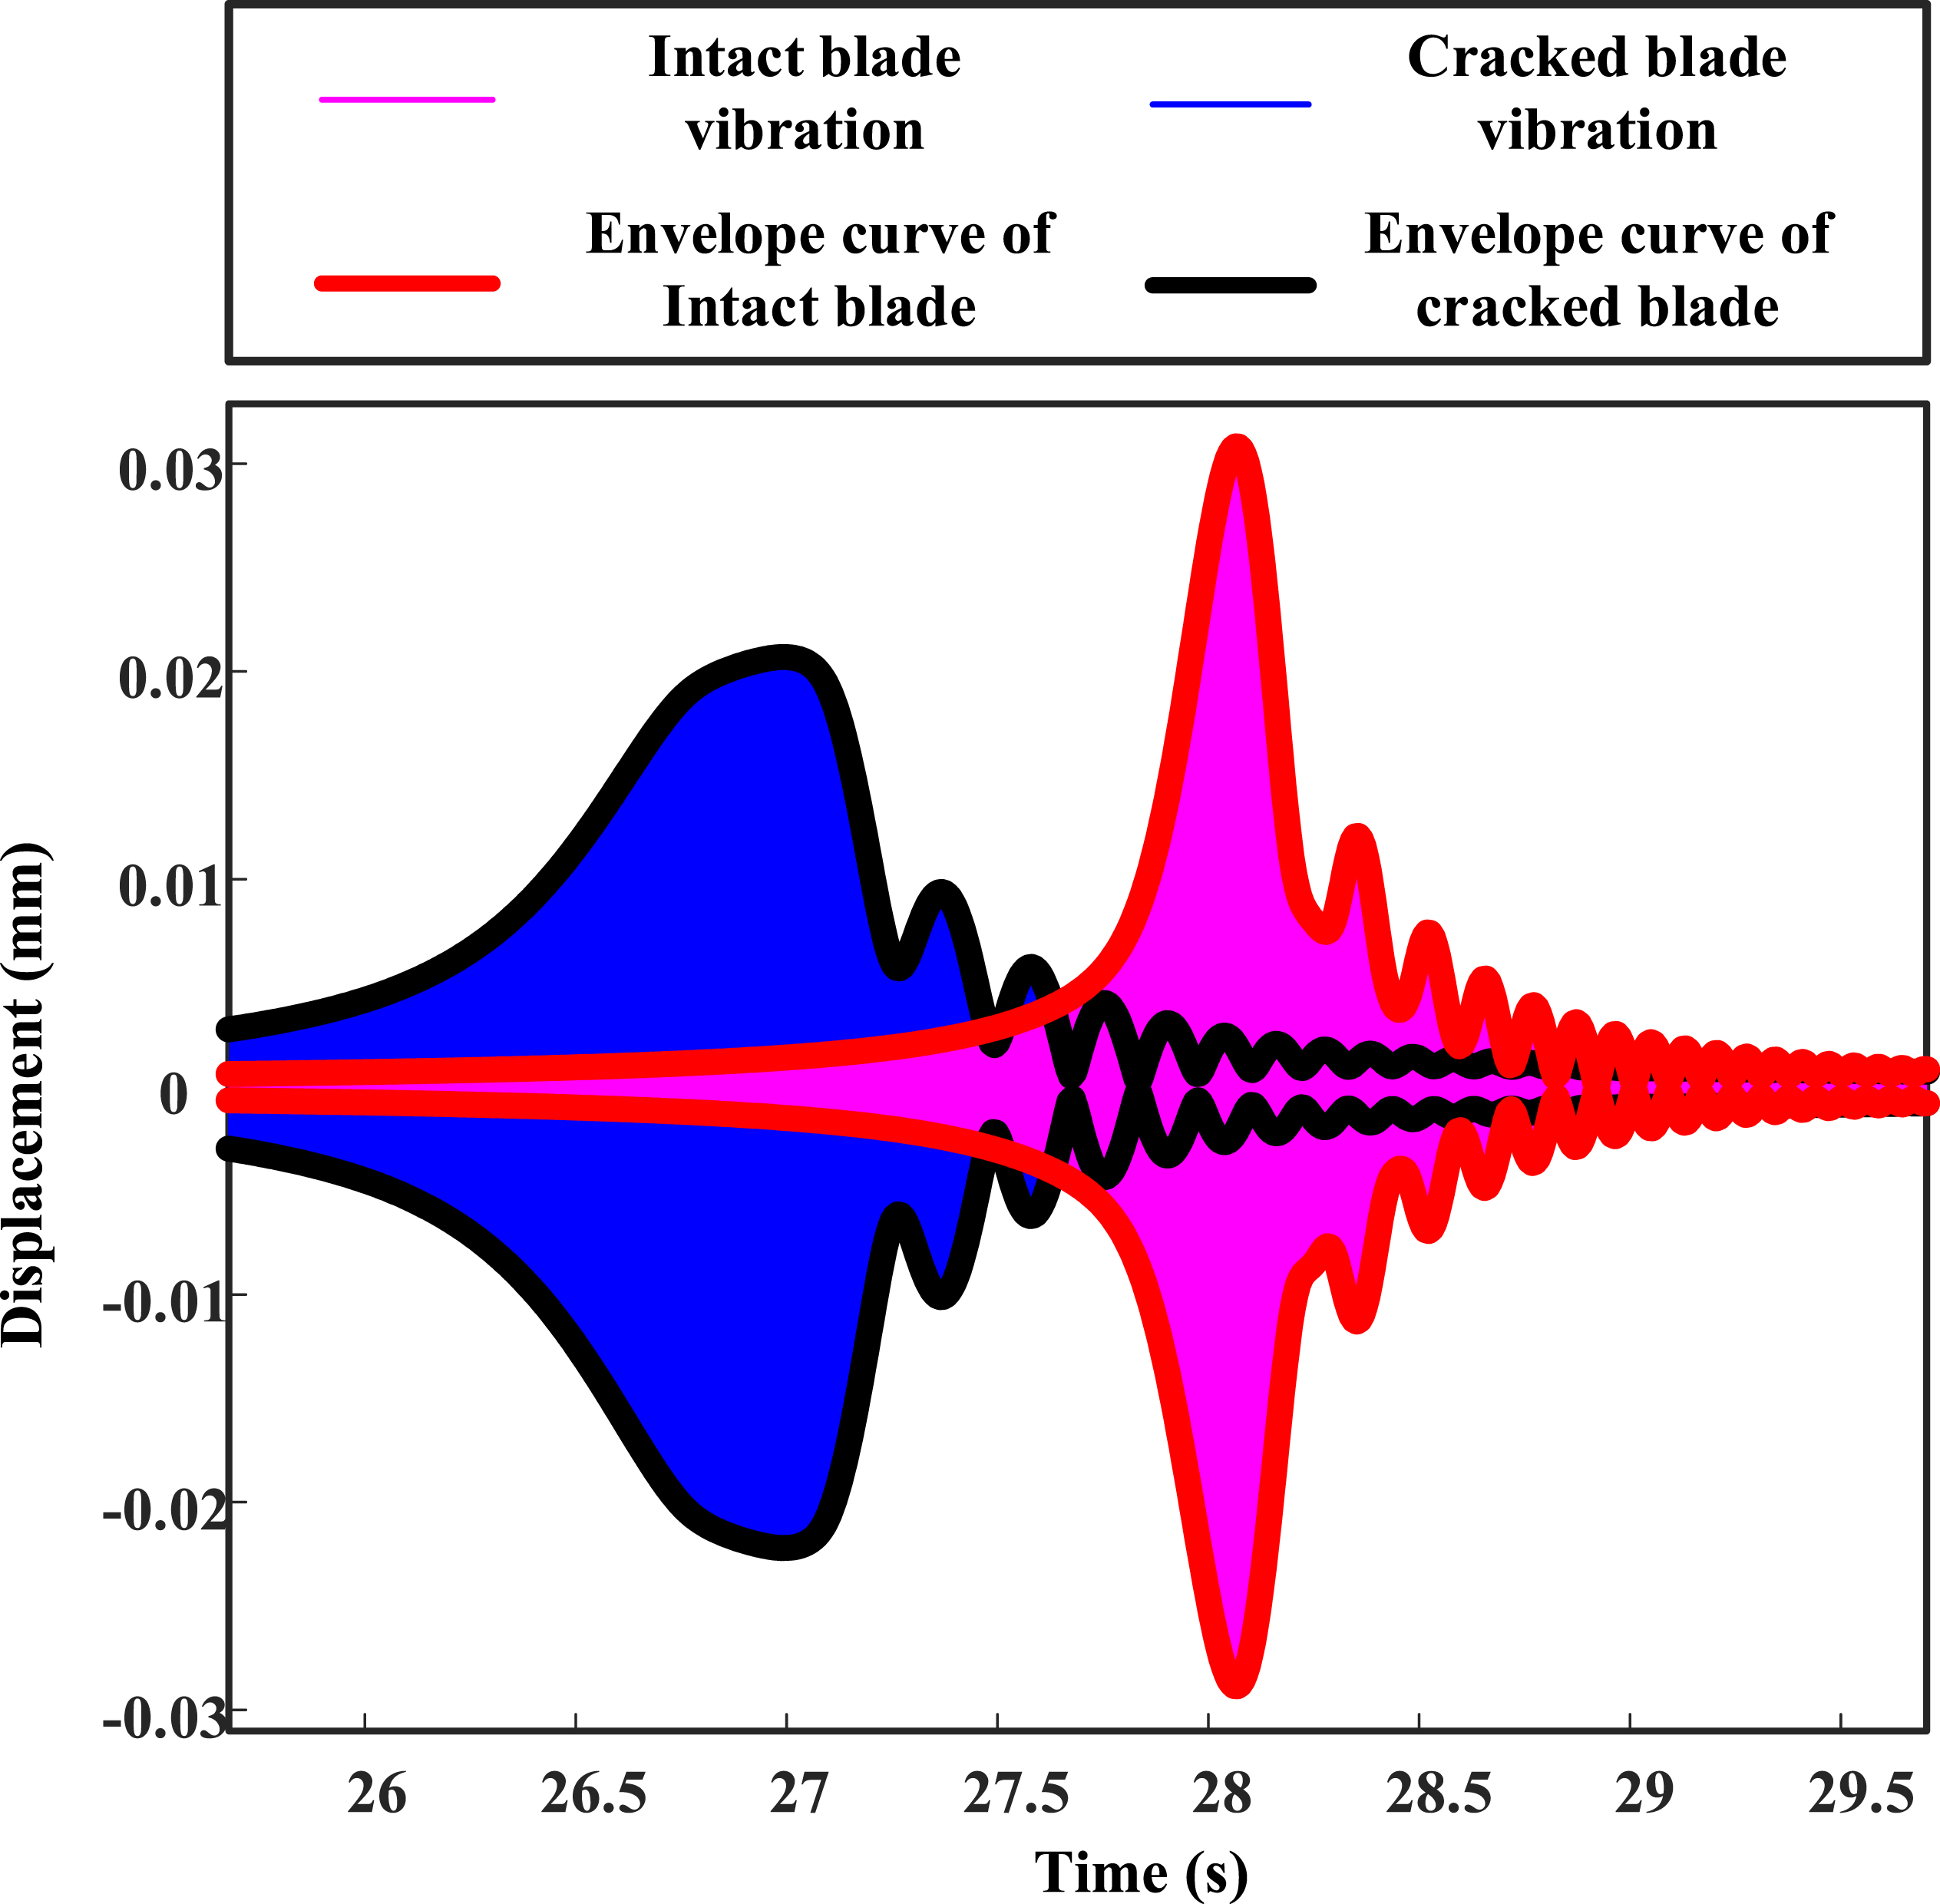
Nonlinear dynamic characteristics are induced in the blade tip response signals due to breathing cracks. By analyzing the dynamic model of blades with breathing cracks, the main characteristics of the response signals can be summarized as follows: First, the decay rate of the oscillatory behavior in the response curve increases with changes in damping caused by the cracks. Second, sub-harmonic resonance peaks, resulting from sub-harmonic vibrations, are present in the response signals of cracked blades. Finally, the shape of the peak region in the displacement response curves varies between intact blades and those with cracks.
Vibration validation based on experiments
To validate the characteristics of dynamic response signals in blade tips, a frequency sweep test is conducted. The frequency sweeping test is run using the DC-3200-36 electrodynamic shaker and the vibration signals of the blade tip is acquired through the LK-G5000 laser displacement sensor. The breathing crack is simulated by bonding two beam using cyanoacrylate adhesive, and the contact surface of the crack are not bonded together.
37
The structure of the cracked blade specimen and the test rig is shown in Figure 6. Test rig for frequency sweeping experiments.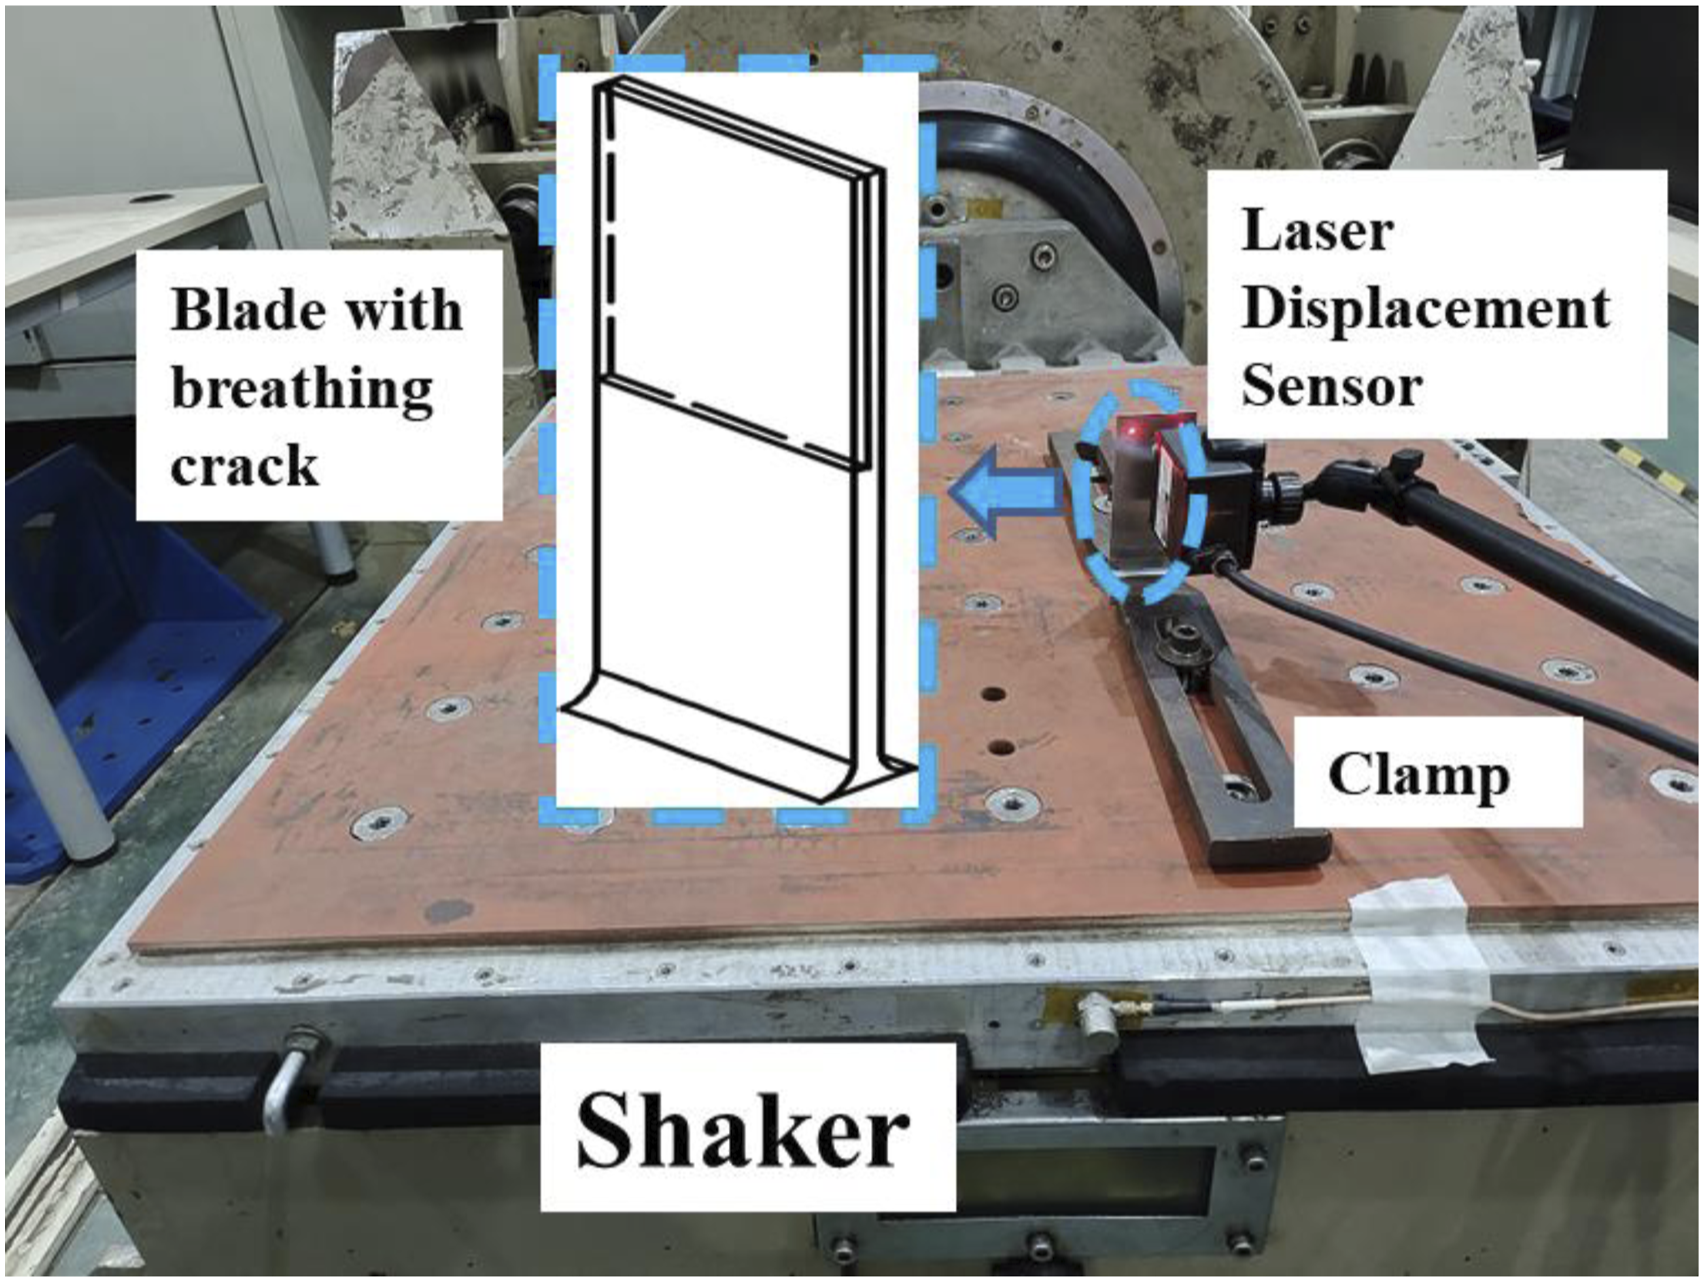
Specimens for the test are selected according to the parameters defined in subsection 2.2. Two aluminum alloy blades are both L = 100 mm in length, w = 40 mm in width and h = 2 mm in thickness. For the cracked specimen, the crack depth is designed as hc = 2*0.4 = 0.8 mm. The bottom of the intact blade and the cracked blade are clamped on the shaker, respectively, to collect the displacements of the tip, and excitations for both specimens are set as 0.5 g (g = 9.8 m/s2).
The excitation frequency increases steadily to match with the uniform acceleration operating condition of rotating blades. The final results of the blade tip vibration displacements under frequency sweep excitation for both specimens are shown in Figure 7. Response signals and their envelope curves are plotted simultaneously. Based on a comparison of the dynamic characteristics analyzed in Section 2.2, the following conclusions can be inferred from the signals shown in the figure: First, the simulation dynamic responses of the blades and the sampling displacements of the frequency sweeping test are close to each other. Second, the three features of the envelope curve’s shape match the experimental results. Finally, nonlinear dynamic characteristics of cracked blades can be depicted through the geometry of envelope curves and regions they enclose. Tip displacement data sampled by frequency sweeping test (a) cracked test specimen (b) intact test specimen.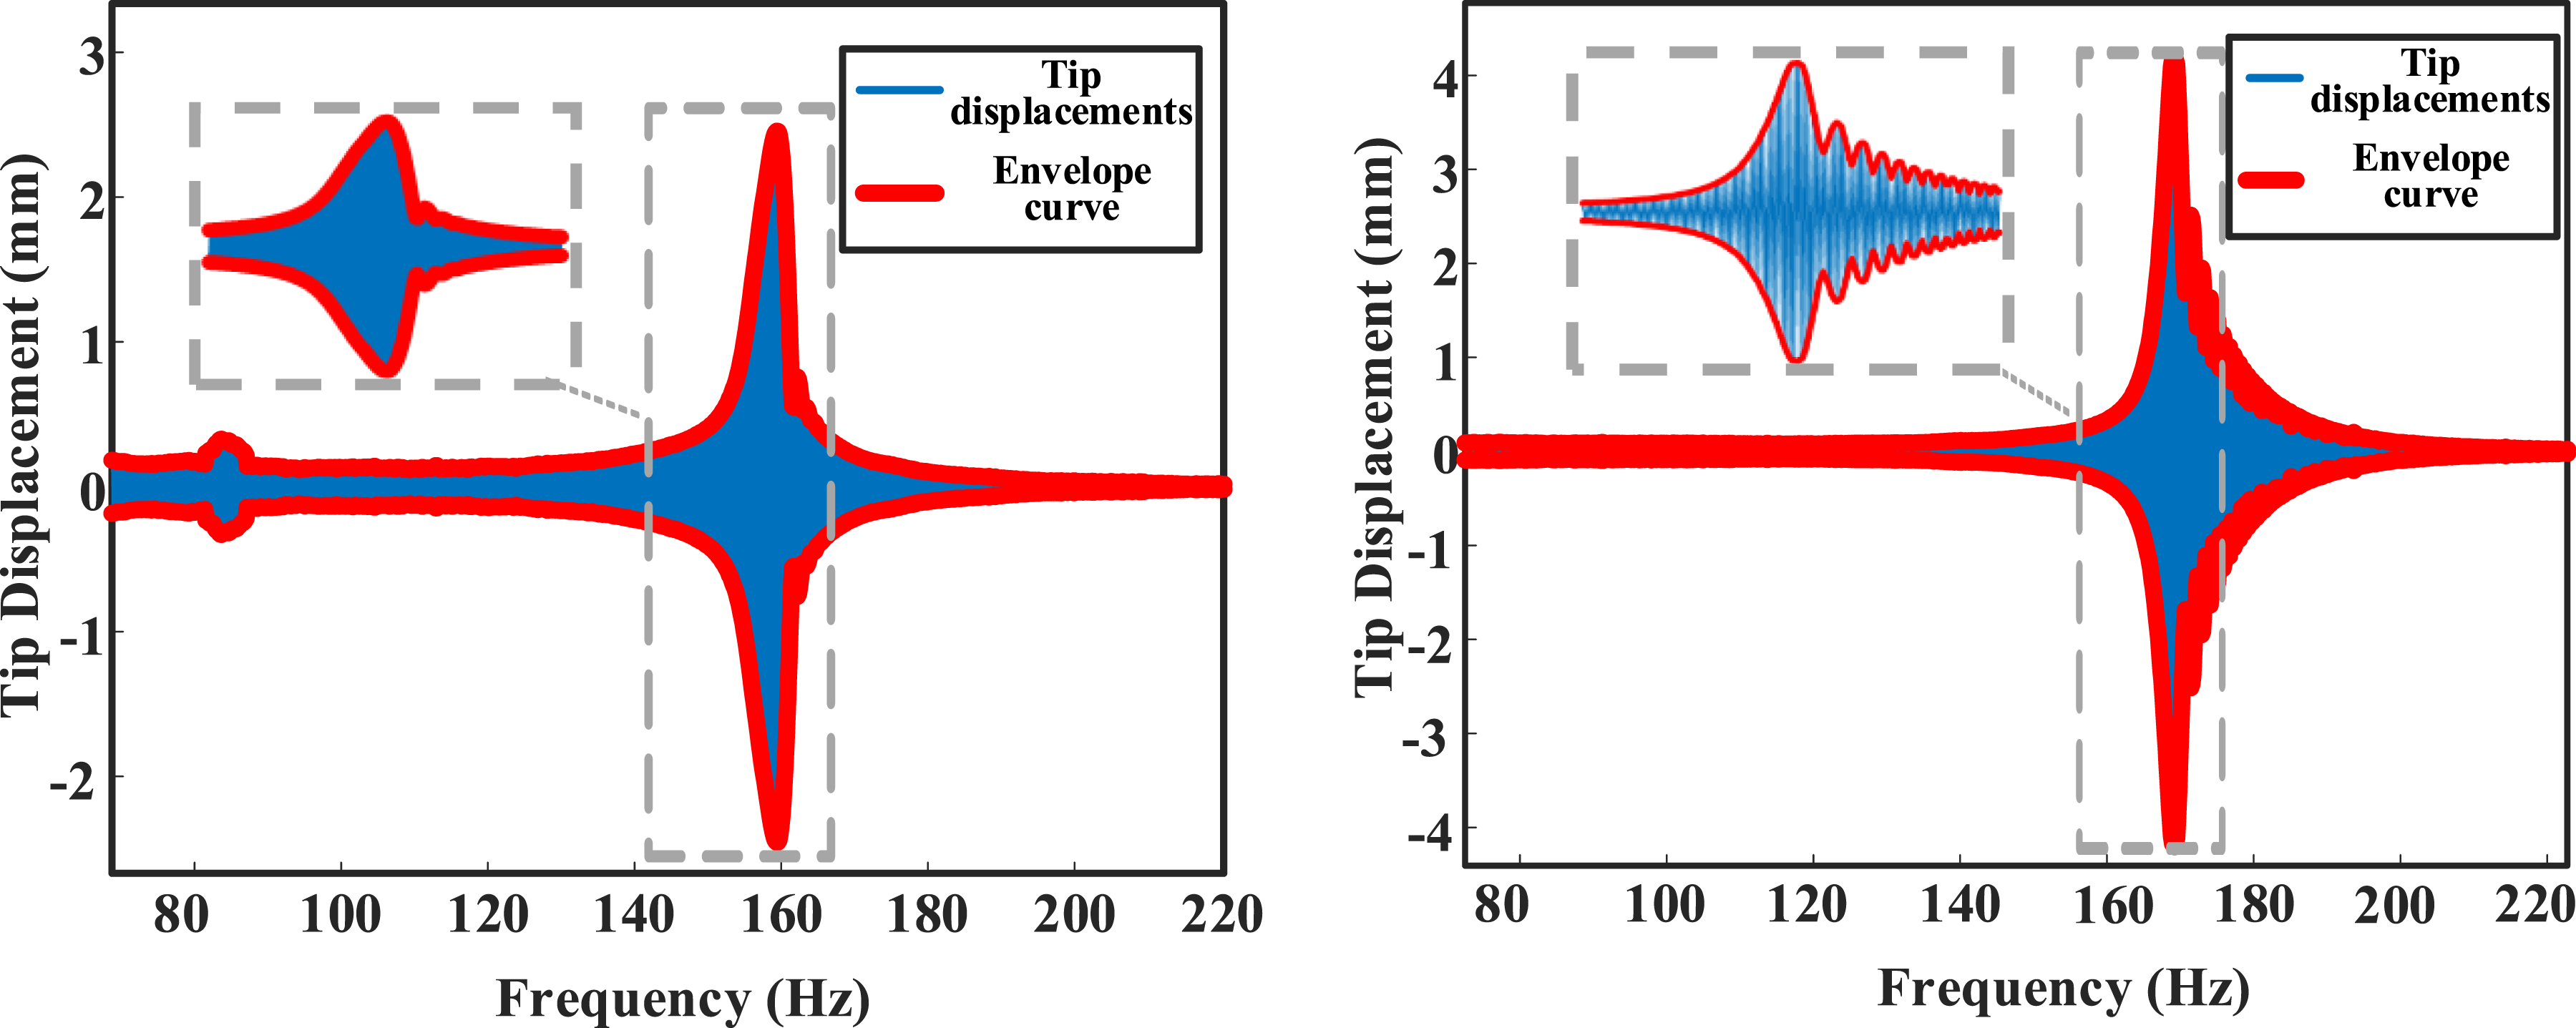
Methodology
For the nonlinear dynamic model of the cracked blade described in Section 2, it is difficult to describe the displacement of the blade tip in the form of analytical equations. Additionally, due to the limitations of the measurement principle, the BTT measurement technique cannot record enough vibration data. Therefore, this paper proposes a method to convert the time-domain measured by BTT into the image domain which contains dynamic characteristics for crack identification.
In this section, the procedure of the proposed method is presented. First, the principle of BTT measurement is introduced. Second, the feasibility of transforming the dual-probe BTT signals into the envelope diagram is proved. Then, a network named BladeNet-AM is designed to distinguish the envelope diagram of cracked blades from those of intact ones. Finally, an implementable method for training the network is introduced.
Principle of BTT measurement
The schematic of BTT is shown in Figure 8. The once-per-revolution (OPR) probe is installed above the shaft to record the start time of each revolution. Other BTT probes are installed around the casing to record the time of arrival (TOA) for all the rotating blades. Typical types of those probes are selected as optical fibers or capacitance.
3
BTT measurement system.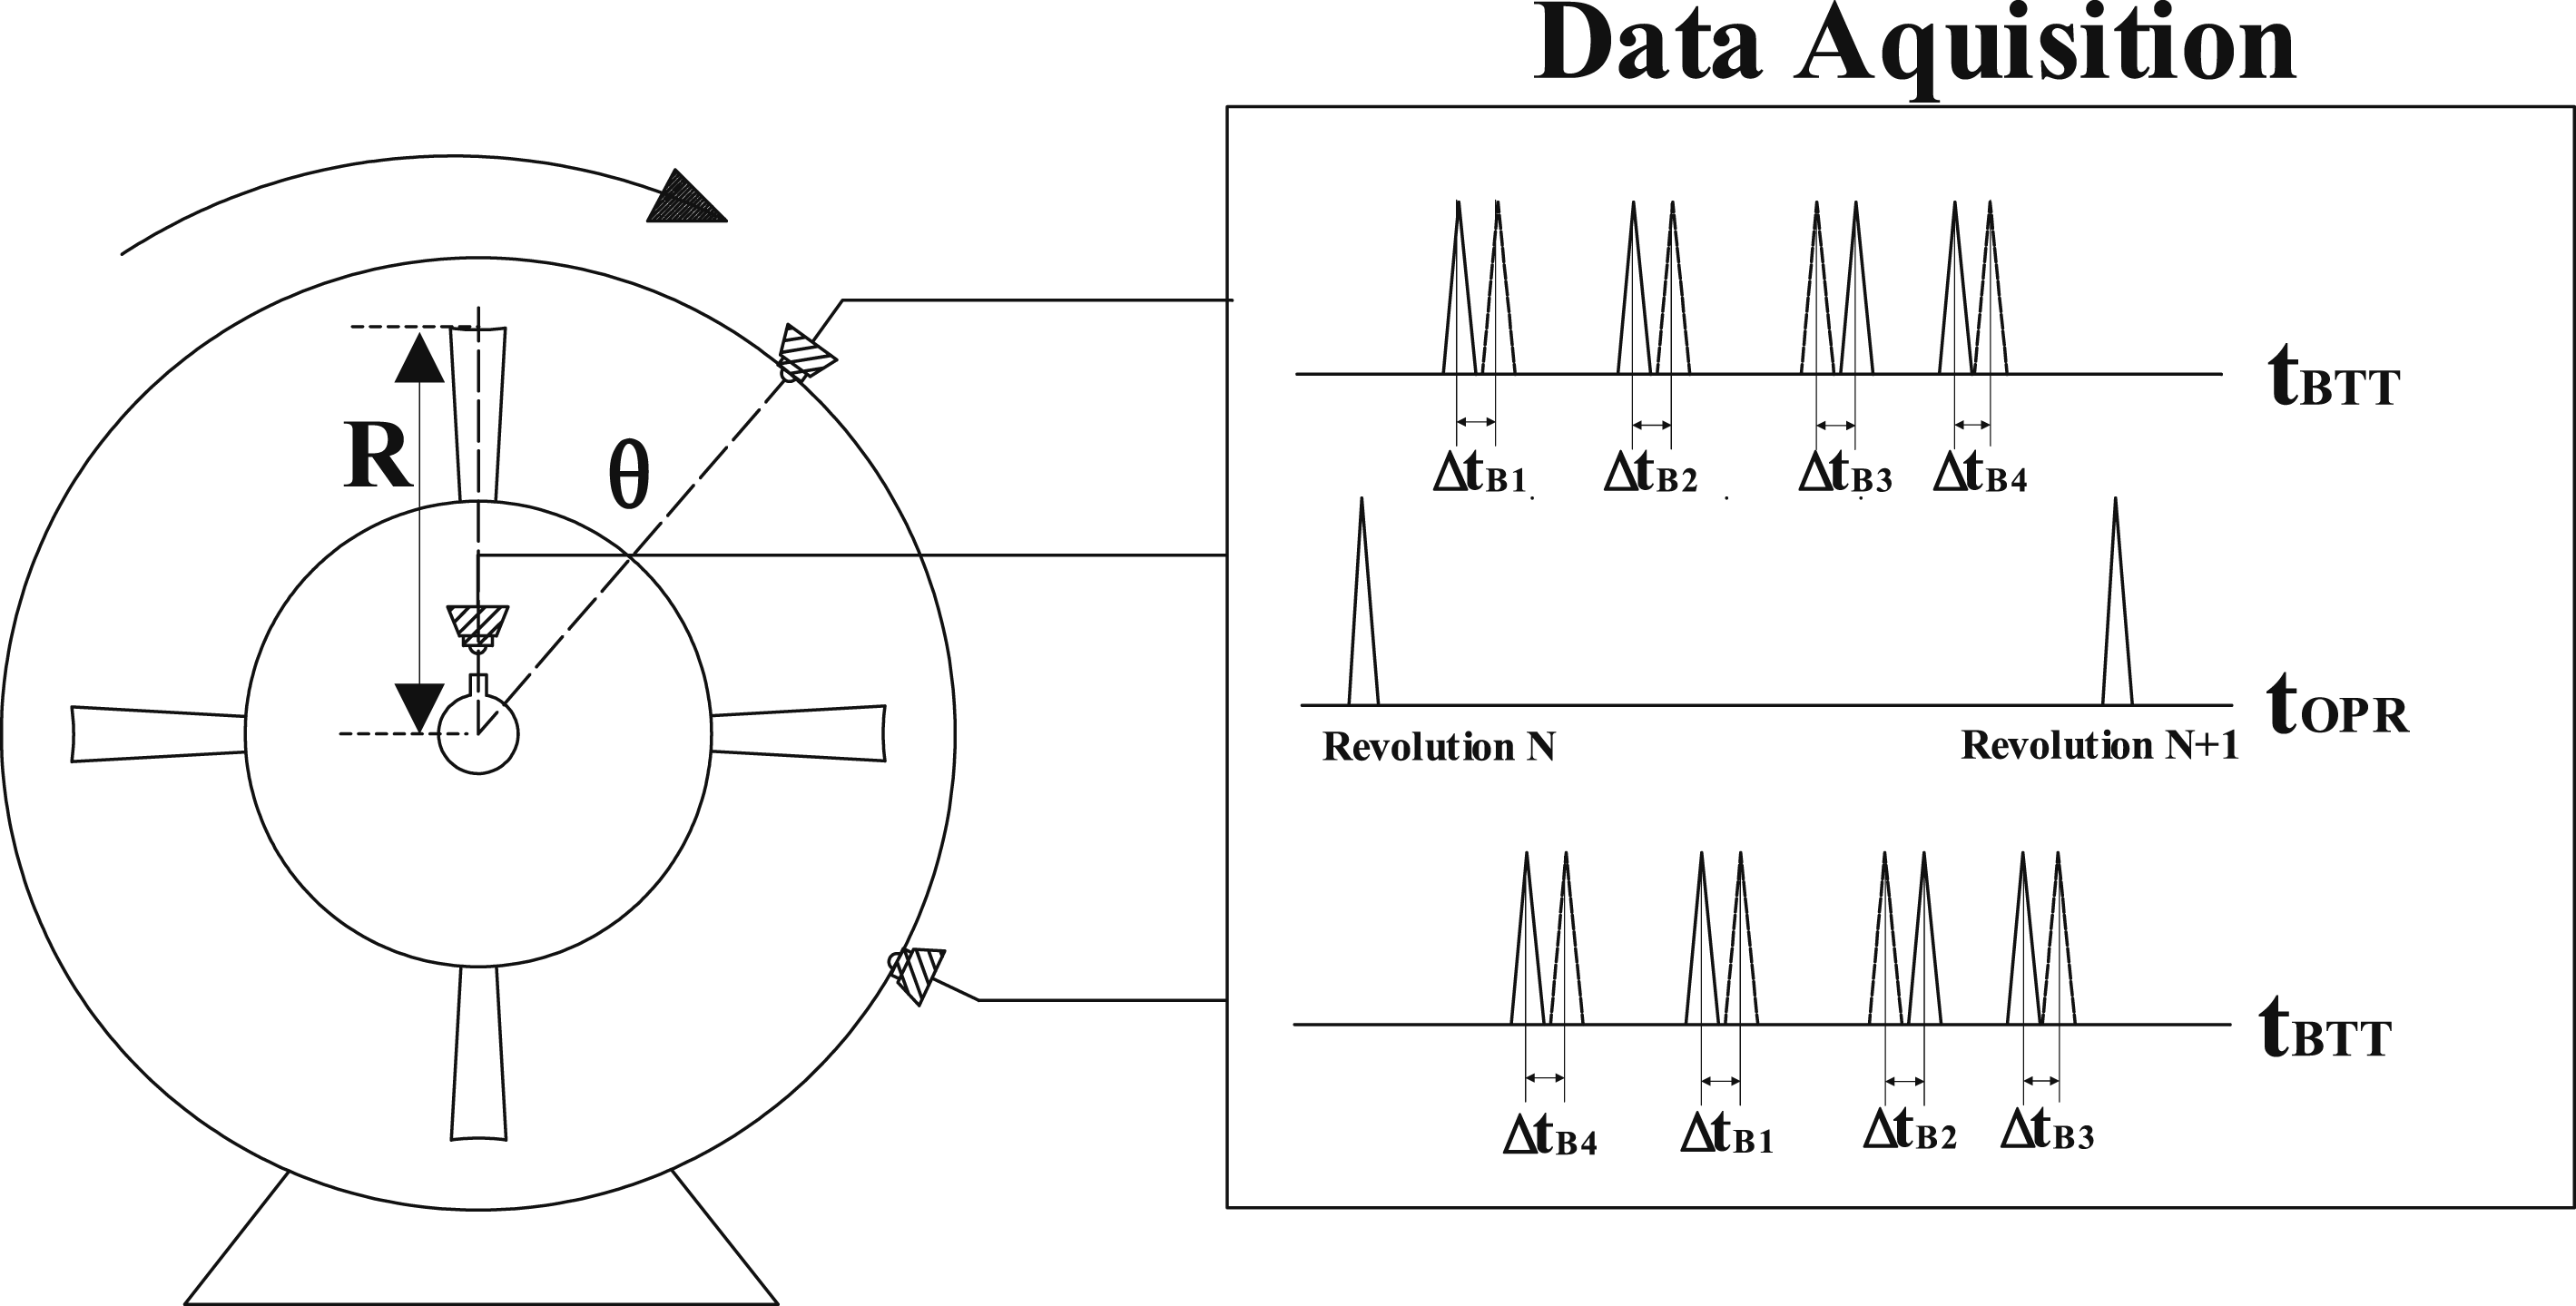
During rotating of the engine, times are recorded by signal pulses from test probes. For each revolution, the rotating speed can be calculated through OPR sensor:

Supposing no deformation of the blade during rotation, the ideal TOA of the ith blade rotating below the BTT probe in the Nth cycle can be calculated as:

However, considering the vibration of the blade tips, the true value of TOAs may be different from the expected ones:

As the differences of TOAs are caused by the blade vibration, the displacement of blade tips can be calculated as follows:

It can be seen from the aforementioned principle of BTT measurement, the advantage of measurement is that the non-contact method will not change the structure of the blade during the operation of the machine. However, the disadvantage lies in the fact that for each rotation of the blade disk, the number of vibration displacements measured for a single blade is equal to the number of BTT probes, thus resulting in a limited amount of test data.
Dataset introduction
According to the blade dynamics model proposed in Section 2.1, when the parameters such as blade material, shape, and operating conditions are known, numerical computation methods can be employed to solve tip displacements of the blade from equation (1). Furthermore, according to the BTT sampling model proposed in Section 3.1, BTT measurement signals can be sampled from the entire displacement signals during the blade’s operation period. Both the generated vibration signals and sampled BTT data are plotted on Figure 9(a). Schematic diagram of dataset creation (a) Collection of BTT signals (b) Extraction of outer contours of scattered plots (c) Creation of an Envelope diagram.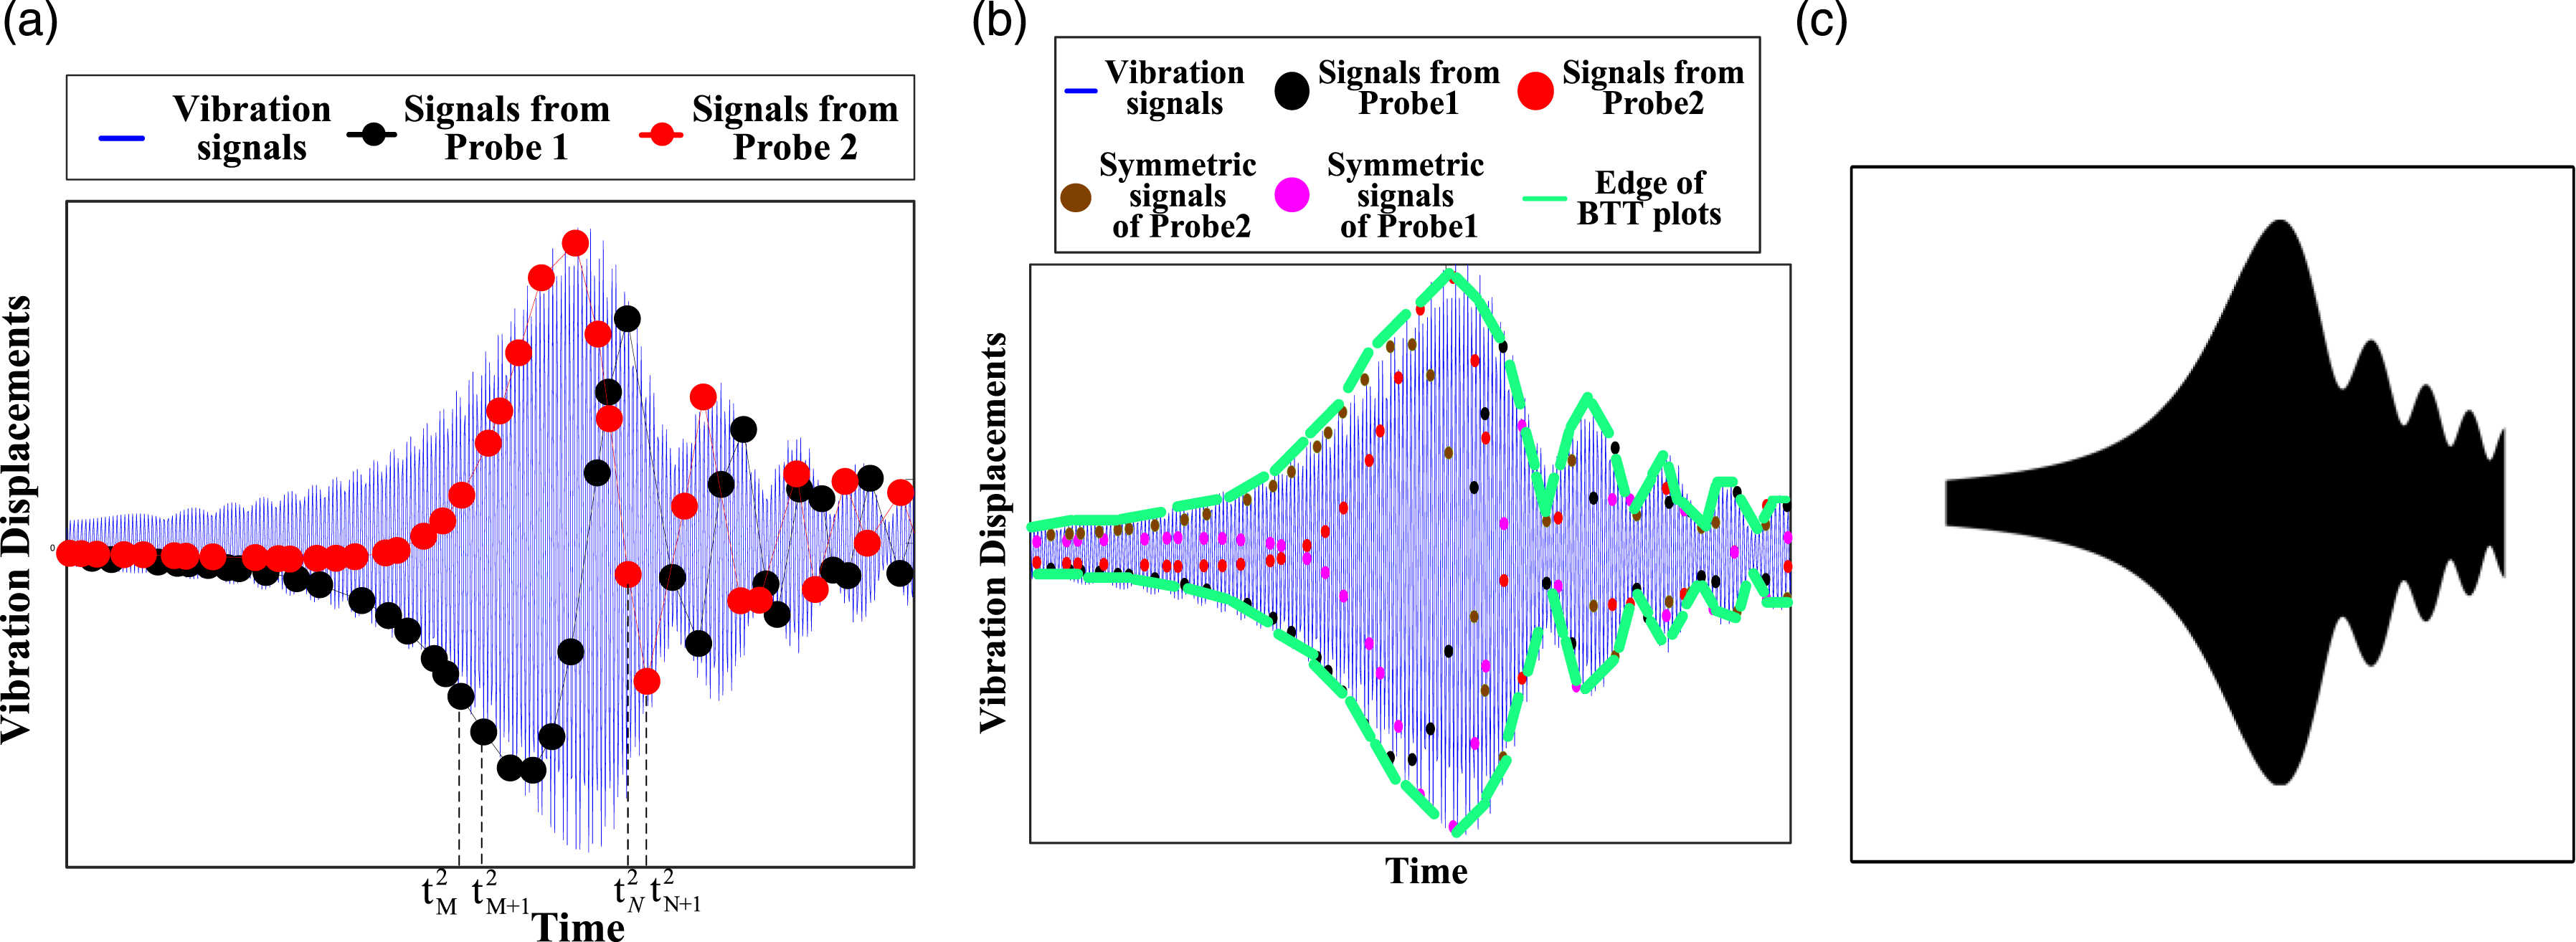
Although efforts are made to prevent blade resonance excitation during turbine steady-state operation, the traversal of resonant zones is unavoidable owing to variations in operational conditions. 38 Throughout the acceleration and deceleration process, the vibration response signals of blade tip displacements, which can be approximated as continuous simple harmonic oscillations, exhibit slight variations in amplitude, period, and phase across consecutive cycles as a result of changes in rotational speed. 39 The envelope diagram formed by the displacement response curve of the displacement signal of the blade near the resonance region is shown in Figure 9(c). As mentioned in Section 2, the response curve can be used to analyze the vibration characteristics of structures. Thus, identifying the features of the envelope diagram within the resonant region enables the diagnosis of blade faults.
As depicted in Figure 9(a), the quantity of BTT signals acquired via resonance is limited. Consequently, to derive the envelope diagram image from these BTT signals, the application of signal processing techniques are required. According to principle of BTT measurement, the blade tip vibration displacement recorded by the single probe can be expressed as

The aforementioned passage describes the methodology for the generation of envelope diagrams from sources of both numerically computed blade vibration displacement signals and BTT measurement signals. The displacement response curves in the blade’s resonance region exhibit peak amplitudes and convey rich blade dynamics information. Thus, blade tip displacement signals spanning varying duration ranges around resonance peaks are selected to generate envelope diagrams. These envelope diagram images are then resized to a uniform dimension of 256 × 256 pixels and saved as envelope diagram samples. The crack diagnosis process begins with the selection of a diverse set of blades, varying in type, fault patterns, and operating conditions. These blades are then subjected to displacement response calculations using the proposed dynamic model. Subsequently, envelope diagram images are generated from the numerically simulated blade vibration displacements. Each image is labeled to indicate either a healthy blade or the presence of a breathing crack fault. These images collectively constitute the dataset for blade fault classification, with the specific composition of the dataset samples detailed in Section 4. Figure 10 presents examples of two kinds of envelope diagrams from this dataset. To increase the diversity of the samples, signals within different lengths of time windows that cover the resonance region are selected to plot the envelope diagram. By training on this simulated dataset, an image classification network capable of identifying cracked blades is developed. Finally, in practical applications, the envelope diagram of the testing blade, generated from BTT measurement signals, is input into this network for identification. Examples in the envelope diagram dataset (a) Cracked Pattern Blade (b) Healthy Pattern Blade. The displacement response signals from the same blade, within different time windows of varying lengths that cover the resonance region.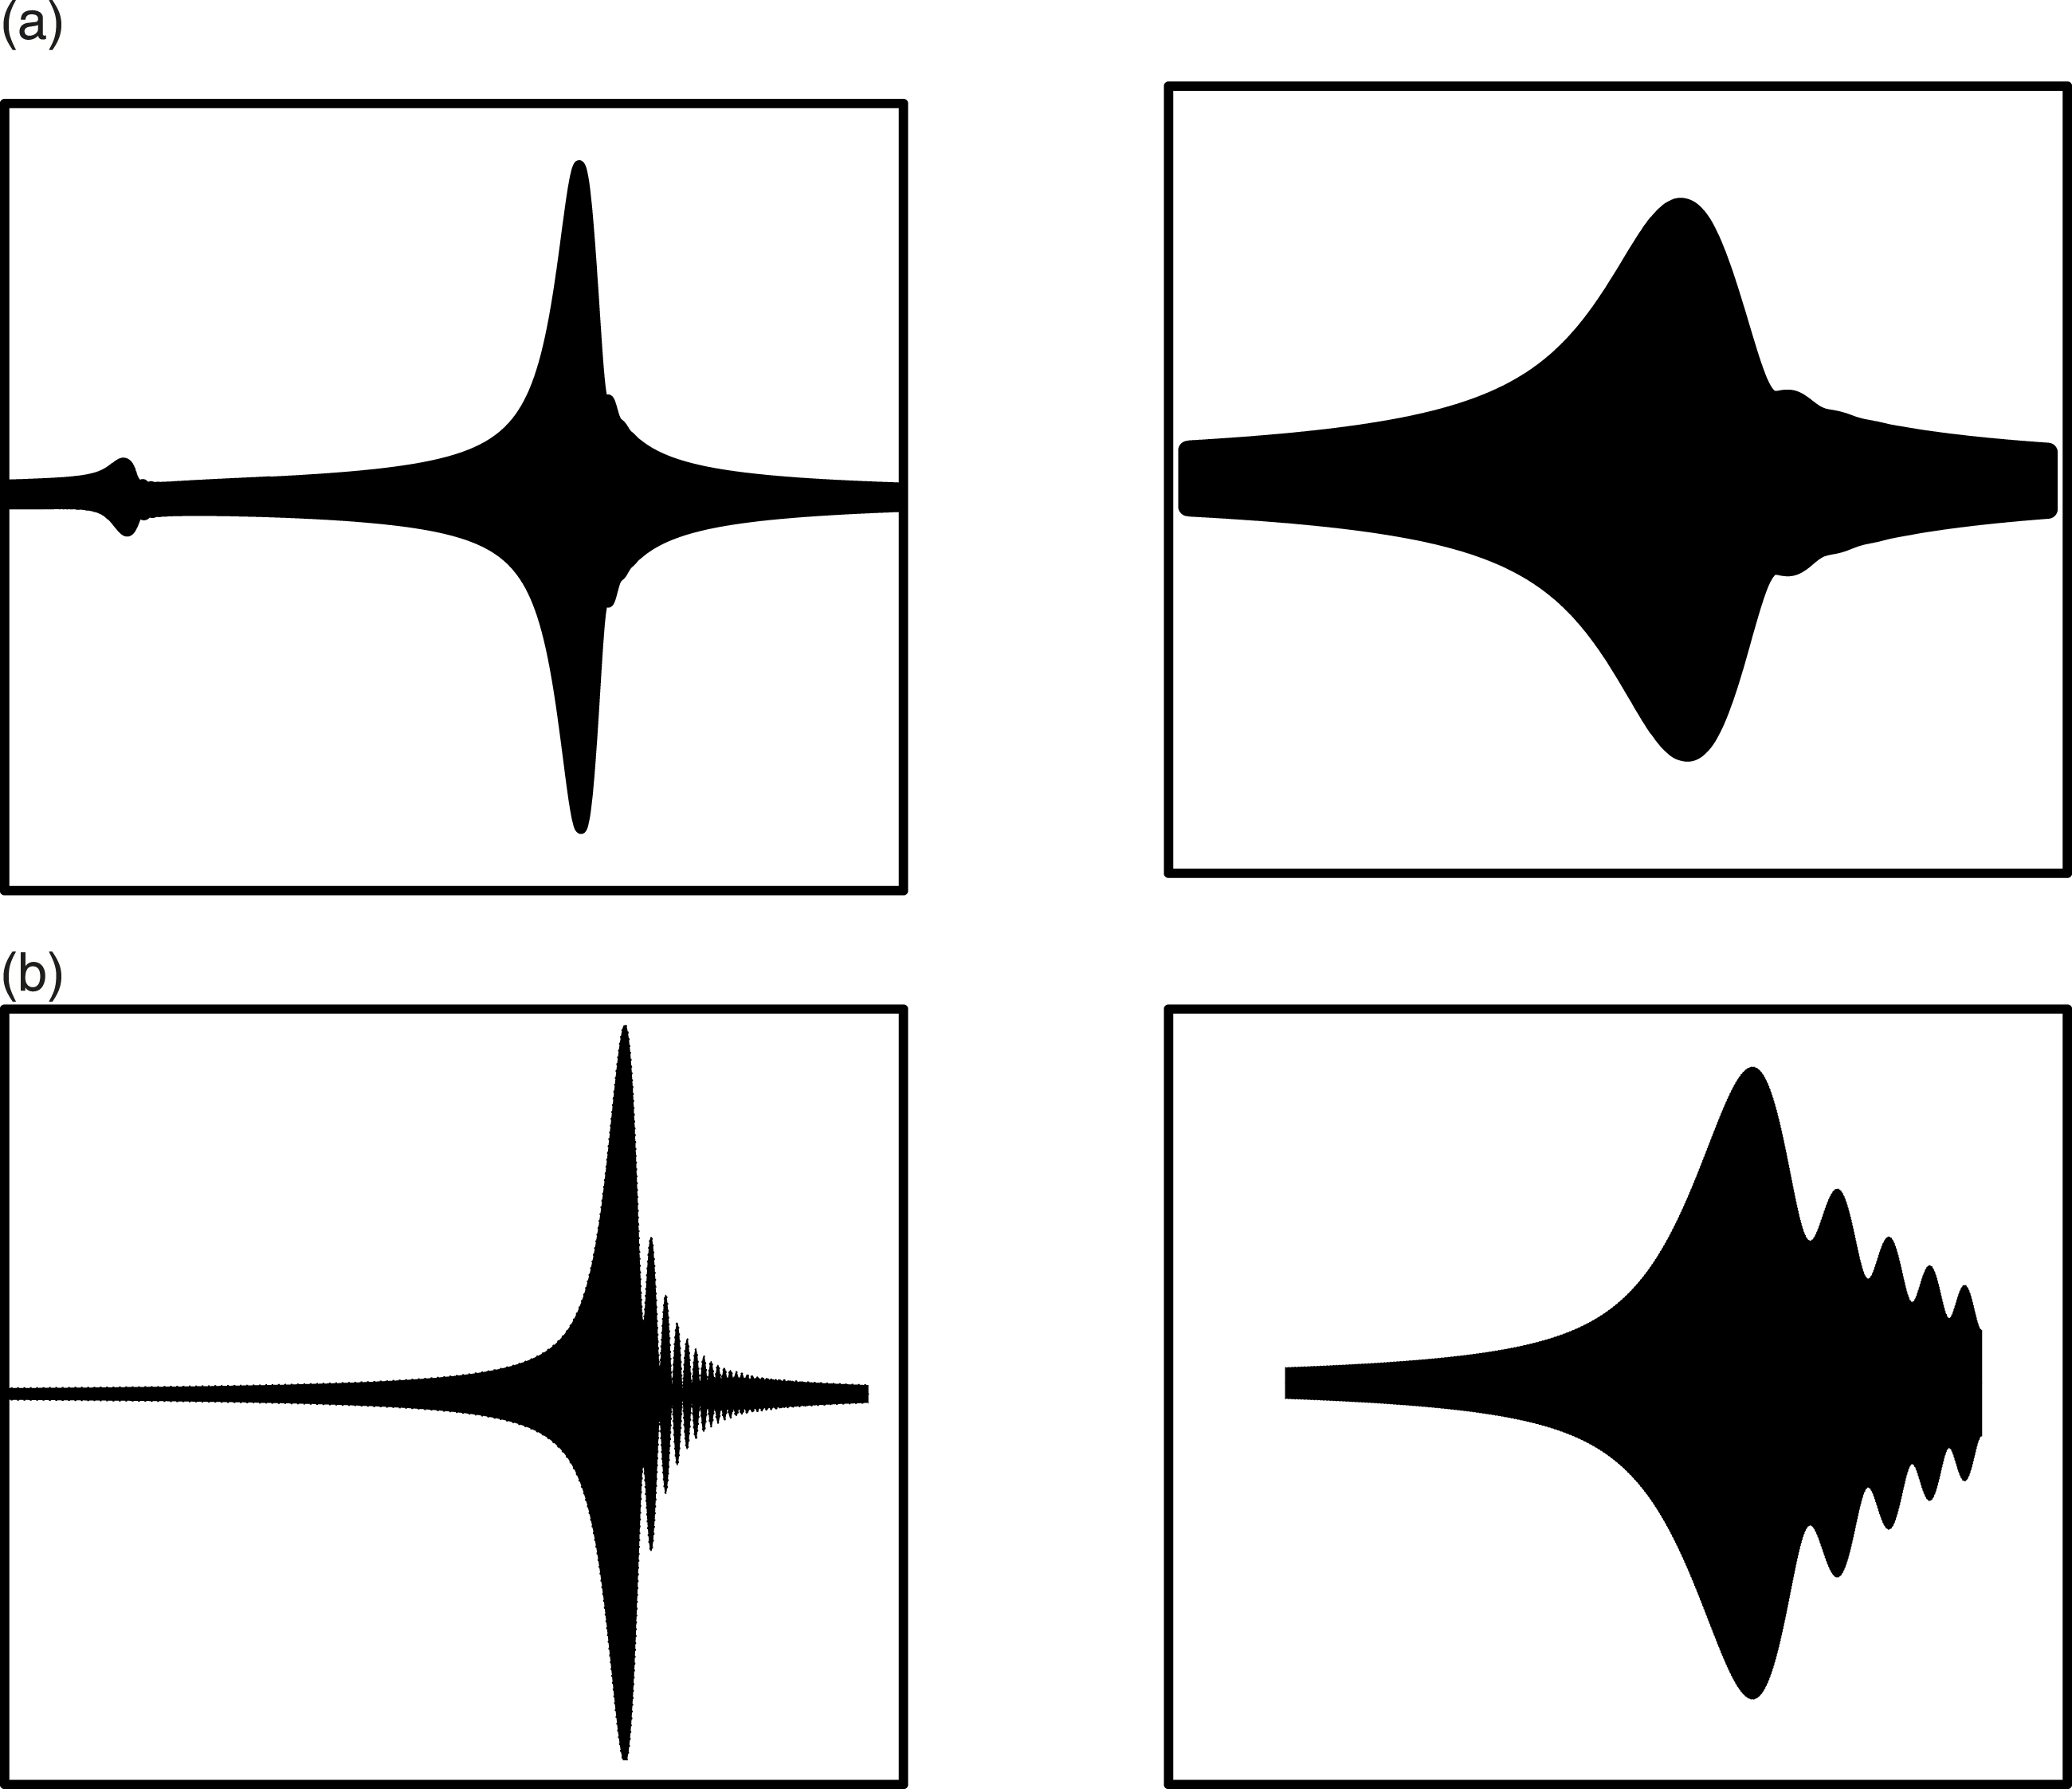
BladeNet-AM model based envelope diagram classification
Blades with breathing cracks can be identified by classifying the enveloped diagram image generated through BTT samples. Convolutional Neural Networks (CNNs) are powerful tools in capturing high-dimensional feature information from images.
41
Based on the traditional CNN image classification network, the BladeNet with an attention mechanism (BladeNet-AM) model was proposed to classify the condition of the blade from enveloped diagrams. As shown in Figure 11, the proposed CNN architecture named BladeNet-AM consists of five convolutional layers, three pooling layers, three fully connection layers, and an attention mechanism. By alternating convolutions and pooling, higher-level image features with improved classification abilities are extracted. Architecture of the BladeNet model with an attention mechanism (BladeNet-AM model).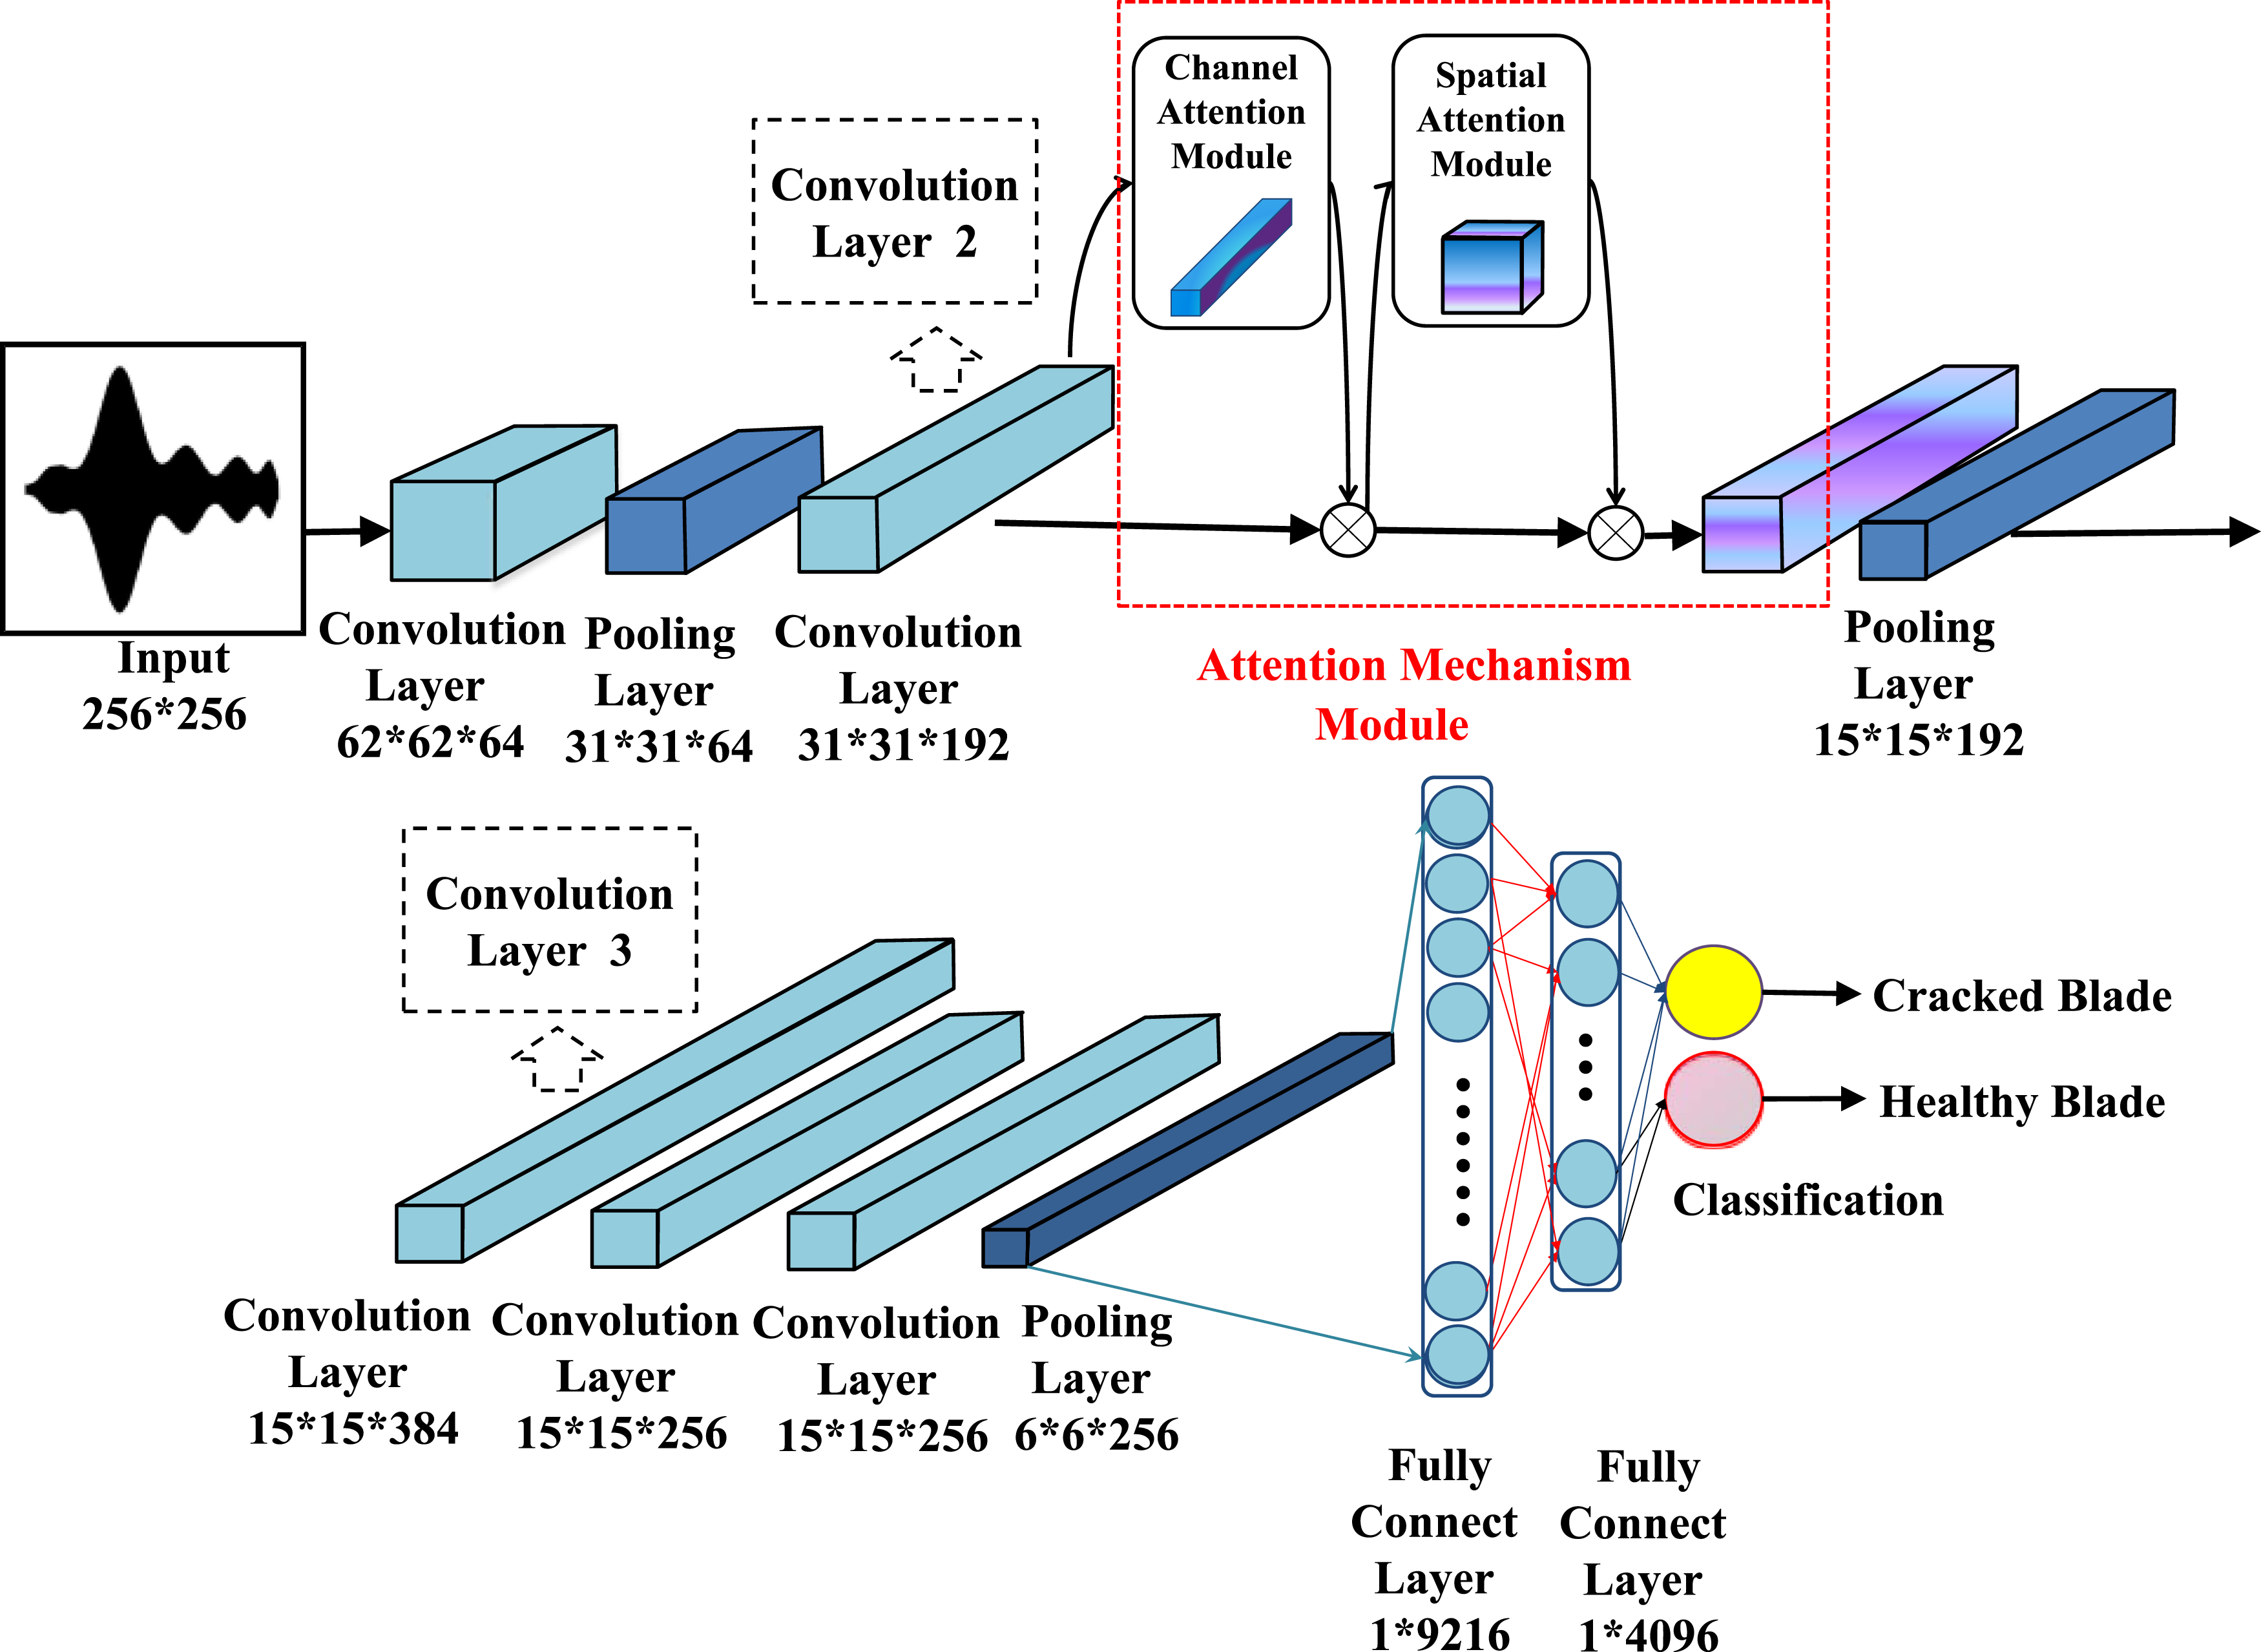
Convolutional layers at different levels of BladeNet-AM network architecture exhibit distinct focuses when extracting feature maps from input images. To foster comprehension of the network’s inner workings, feature visualization techniques are utilized to project feature maps of the target layer onto the pixel space.
42
The top 6 strongest activations from the second and third convolutional layers in the BladeNet network, which lacks an Attention Module (AM),
43
are depicted in Figure 12. As shown in the images, the shallow network, which is closer to the input layer, mainly extracts detailed features such as textures and edges. Conversely, the convolutional layers at deeper levels gain the capability to capture more abstract and higher-level features. However, for the specific case of blade envelope diagram images, the most prominent feature is undoubtedly the edge contour of the envelope section. Nevertheless, some feature maps in Figure 12(b) have deviated from the intended region of interest. Visualization of features in convolution layers of trained BladeNet model (a) 2nd convolution layer (b) 3rd convolution layer.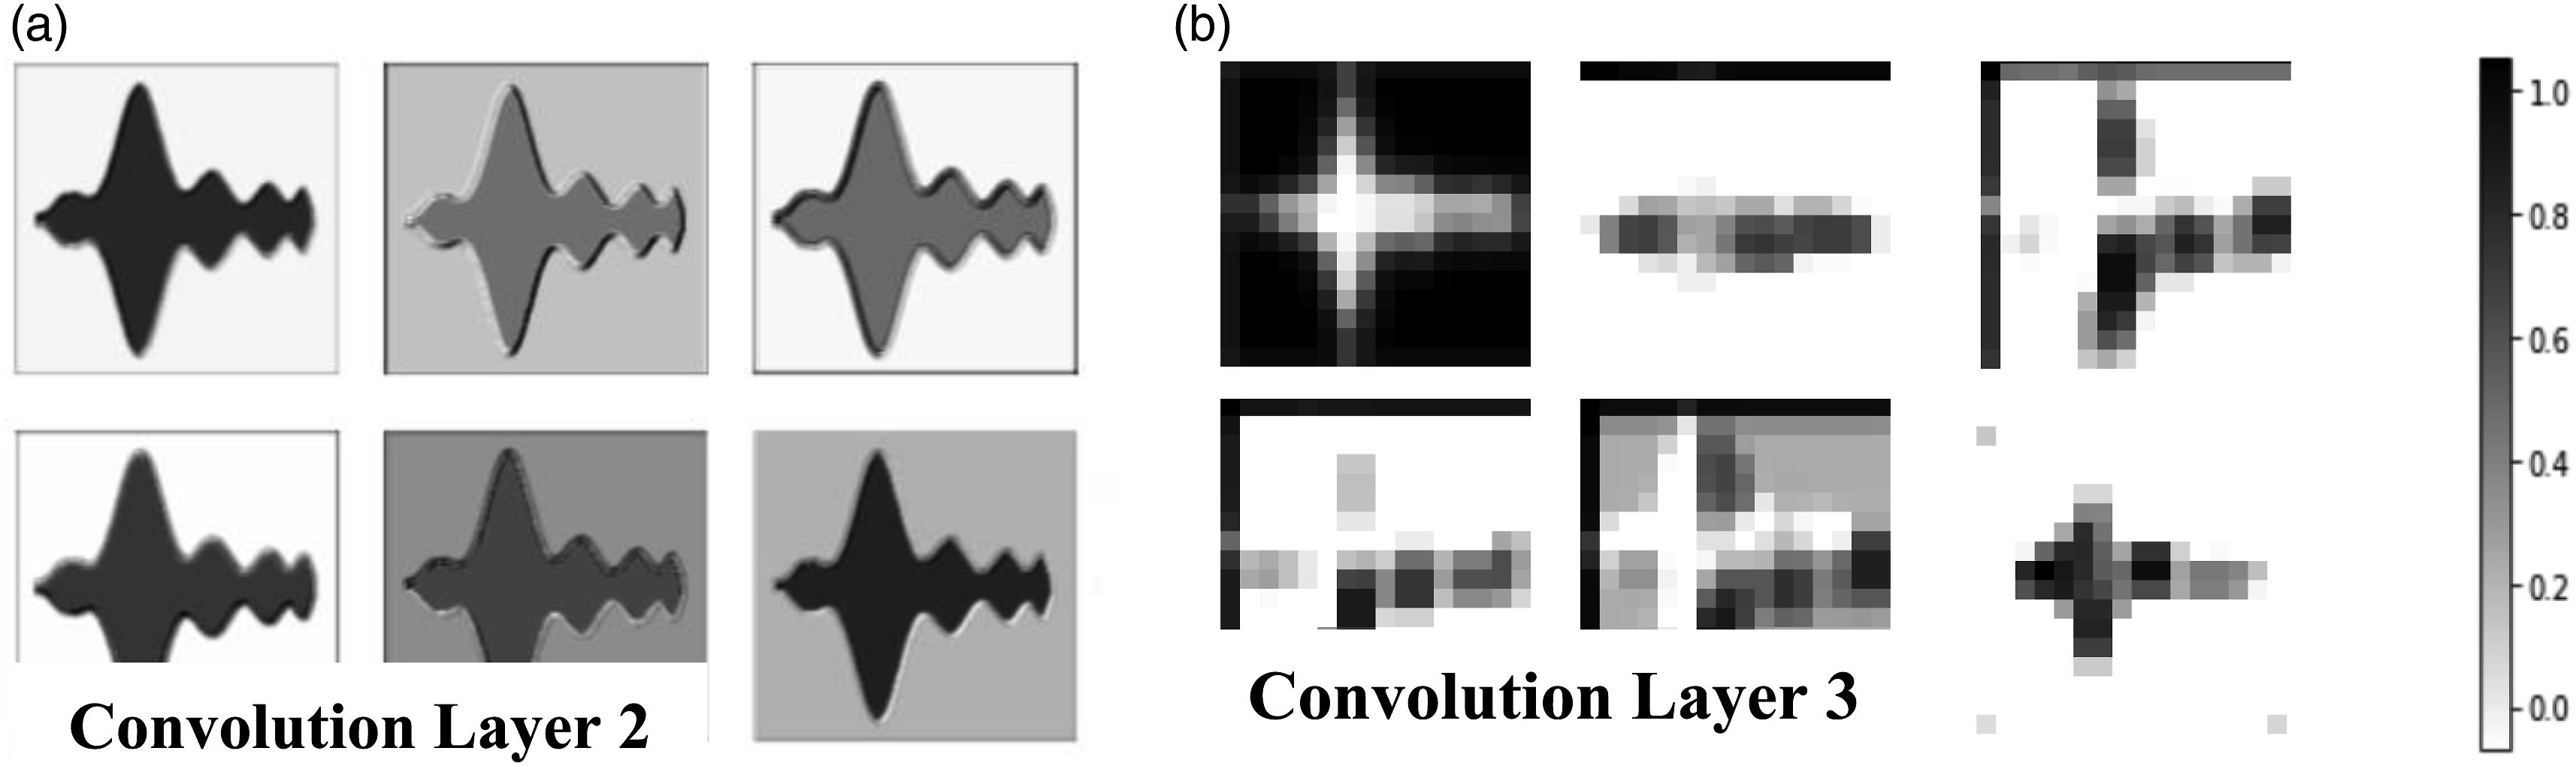
To overcome this obstacle, an attention module has been inserted after the second convolutional layer of the BladeNet model, as shown in Figure 11. As analyzed in Section 2, the edge regions of envelope diagrams contain critical features for crack identification. Consequently, the AM block is strategically incorporated between the second and third convolutional layers to filter out features from the input information that are beneficial for model prediction and assign higher weights to these features. This allows the network to focus on the characteristics that significantly impact crack identification. The structure of attention module is shown in Figure 13,which includes the channel attention module (CAM) and the spatial attention module (SAM).
44
As shown in Figure 11, the AM module connects the front of the second convolution layer to the start of the second pooling layer in order to fully use the different importance degree of input inner features. Attention mechanism structure.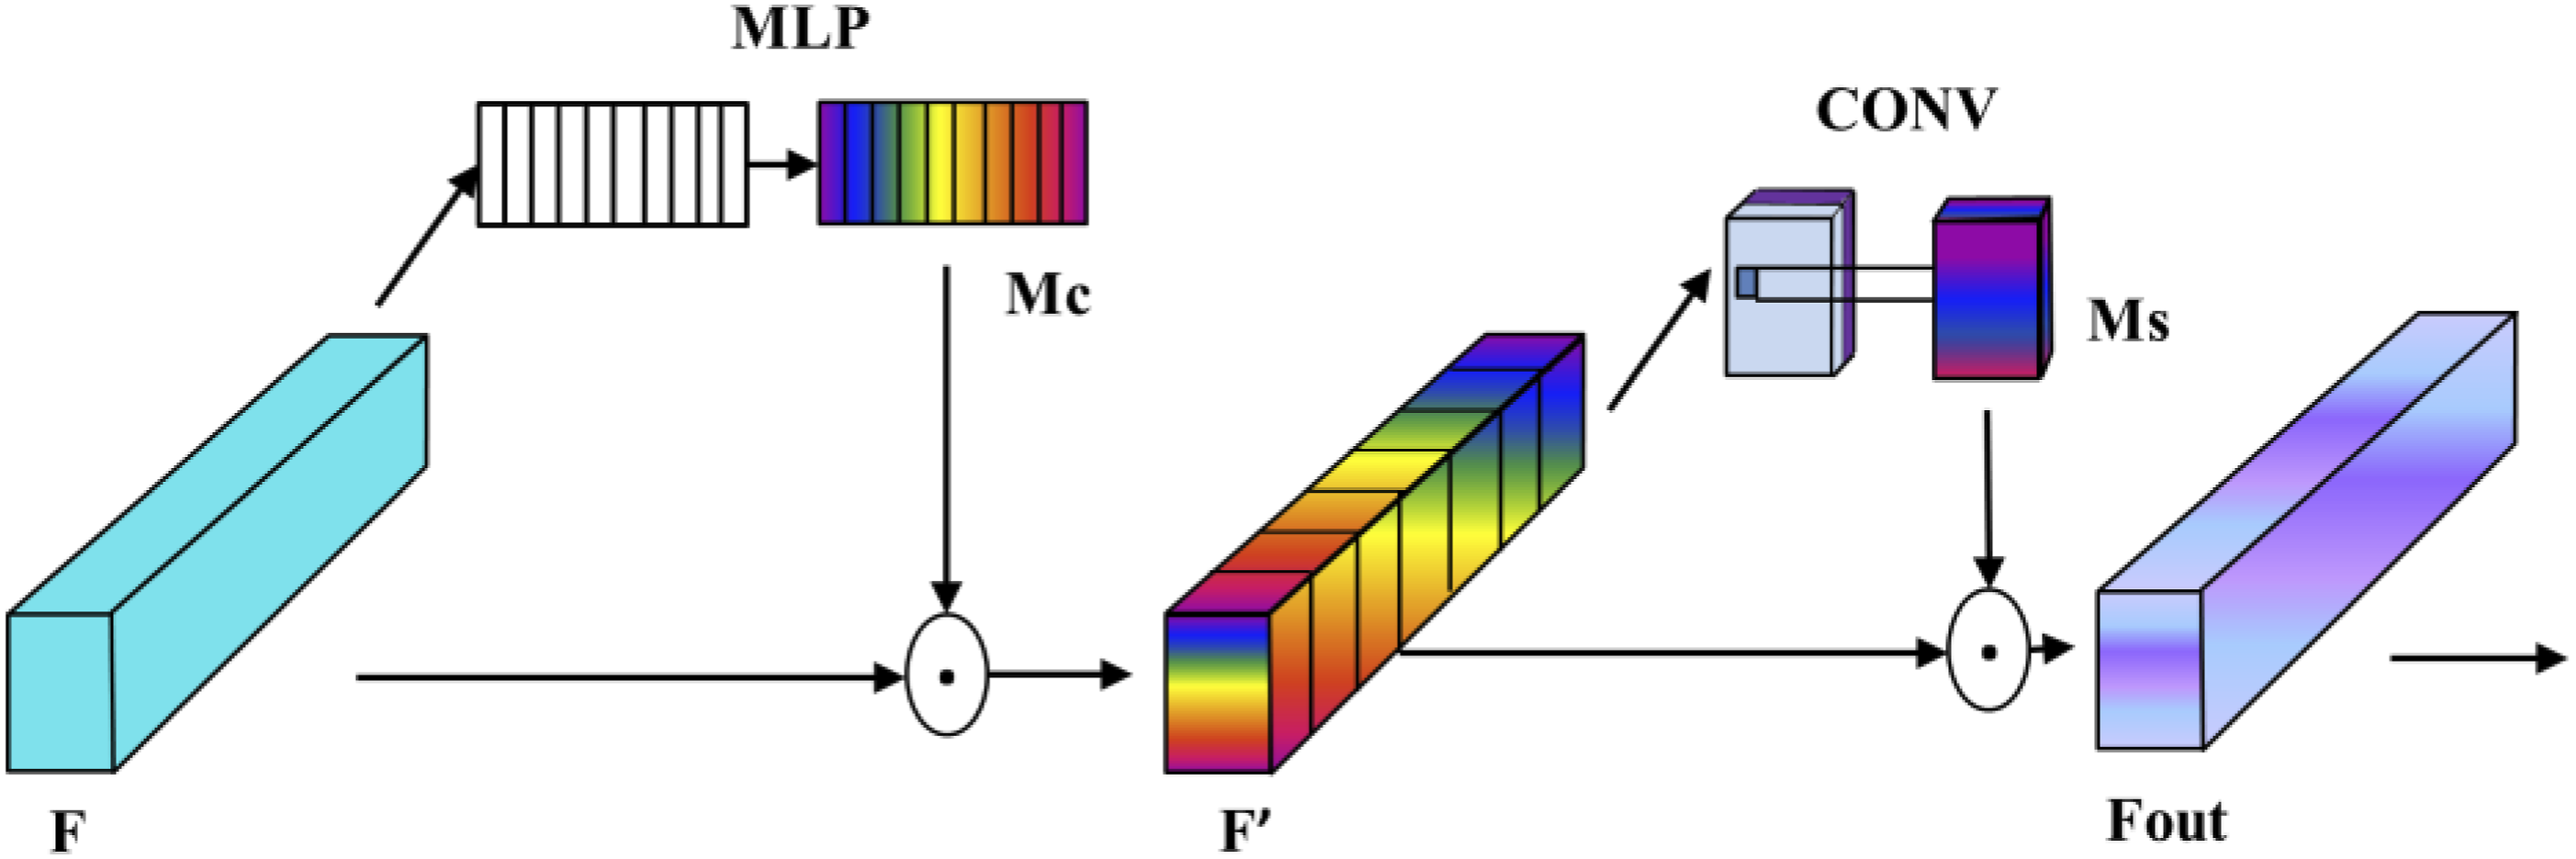
Although deep convolutional networks increase the number of feature map channels and extract intricate features, they also introduce ineffective channels that must be removed. Consequently, a CAM block is incorporated following the convolutional layer, which takes the matrix output from the preceding convolutional layer as input. First, the input feature map F is subjected to global pooling across its spatial dimensions. The resulting pooled features are then passed through a shared Multi-Layer Perceptron (MLP)
44
for learning. Subsequently, the output of the MLP is processed by a Sigmoid activation function to generate the channel attention weight matrix Mc. Finally, Mc is multiplied with the input matrix F to produce a refined channel attention feature map F´:

Following the implementation of the CAM block, an SAM block is introduced to further enhance the accuracy of sample recognition by focusing on effective spatial information in image classification. The SAM takes the output matrix F′ from the preceding layer as input, applies both max pooling and average pooling to obtain to two 2D features, which are then collapsed to a spatial attention weight matrix Ms through a convolutional layer and an activation function. This weight channel is multiplied with the input to yield the output of the attention module. The output of AM module can be obtained as:

BladeNet-AM network employs BladeNet to extract features from enveloped diagram images of blade tip displacements around resonance regions. An attention mechanism block is integrated to adaptively learn the importance of envelope image features, assigning appropriate weights to enhance recognition accuracy.
After integrating the attention mechanism module, Figure 14 presents the top 6 activation maps with the highest activations, which were obtained from the input image following processing by the third convolutional layer. Remarkably, the addition of the attention mechanism module in the network has resulted in a more pronounced focus on the edge regions of the envelope diagram, aligning with the physical significance of the envelope diagram analyzed in Section 2.2. By means of end-to-end training, the network learns to extract task-specific features and selectively emphasizes the most critical regions in the feature maps for accurate image classification. Therefore, the enhancement to the network facilitates the improved extraction of useful features from the input envelope diagram images, ultimately enhancing the interpretability of the model. Visualization of features in the 3rd convolution layers of trained BladeNet-AM model.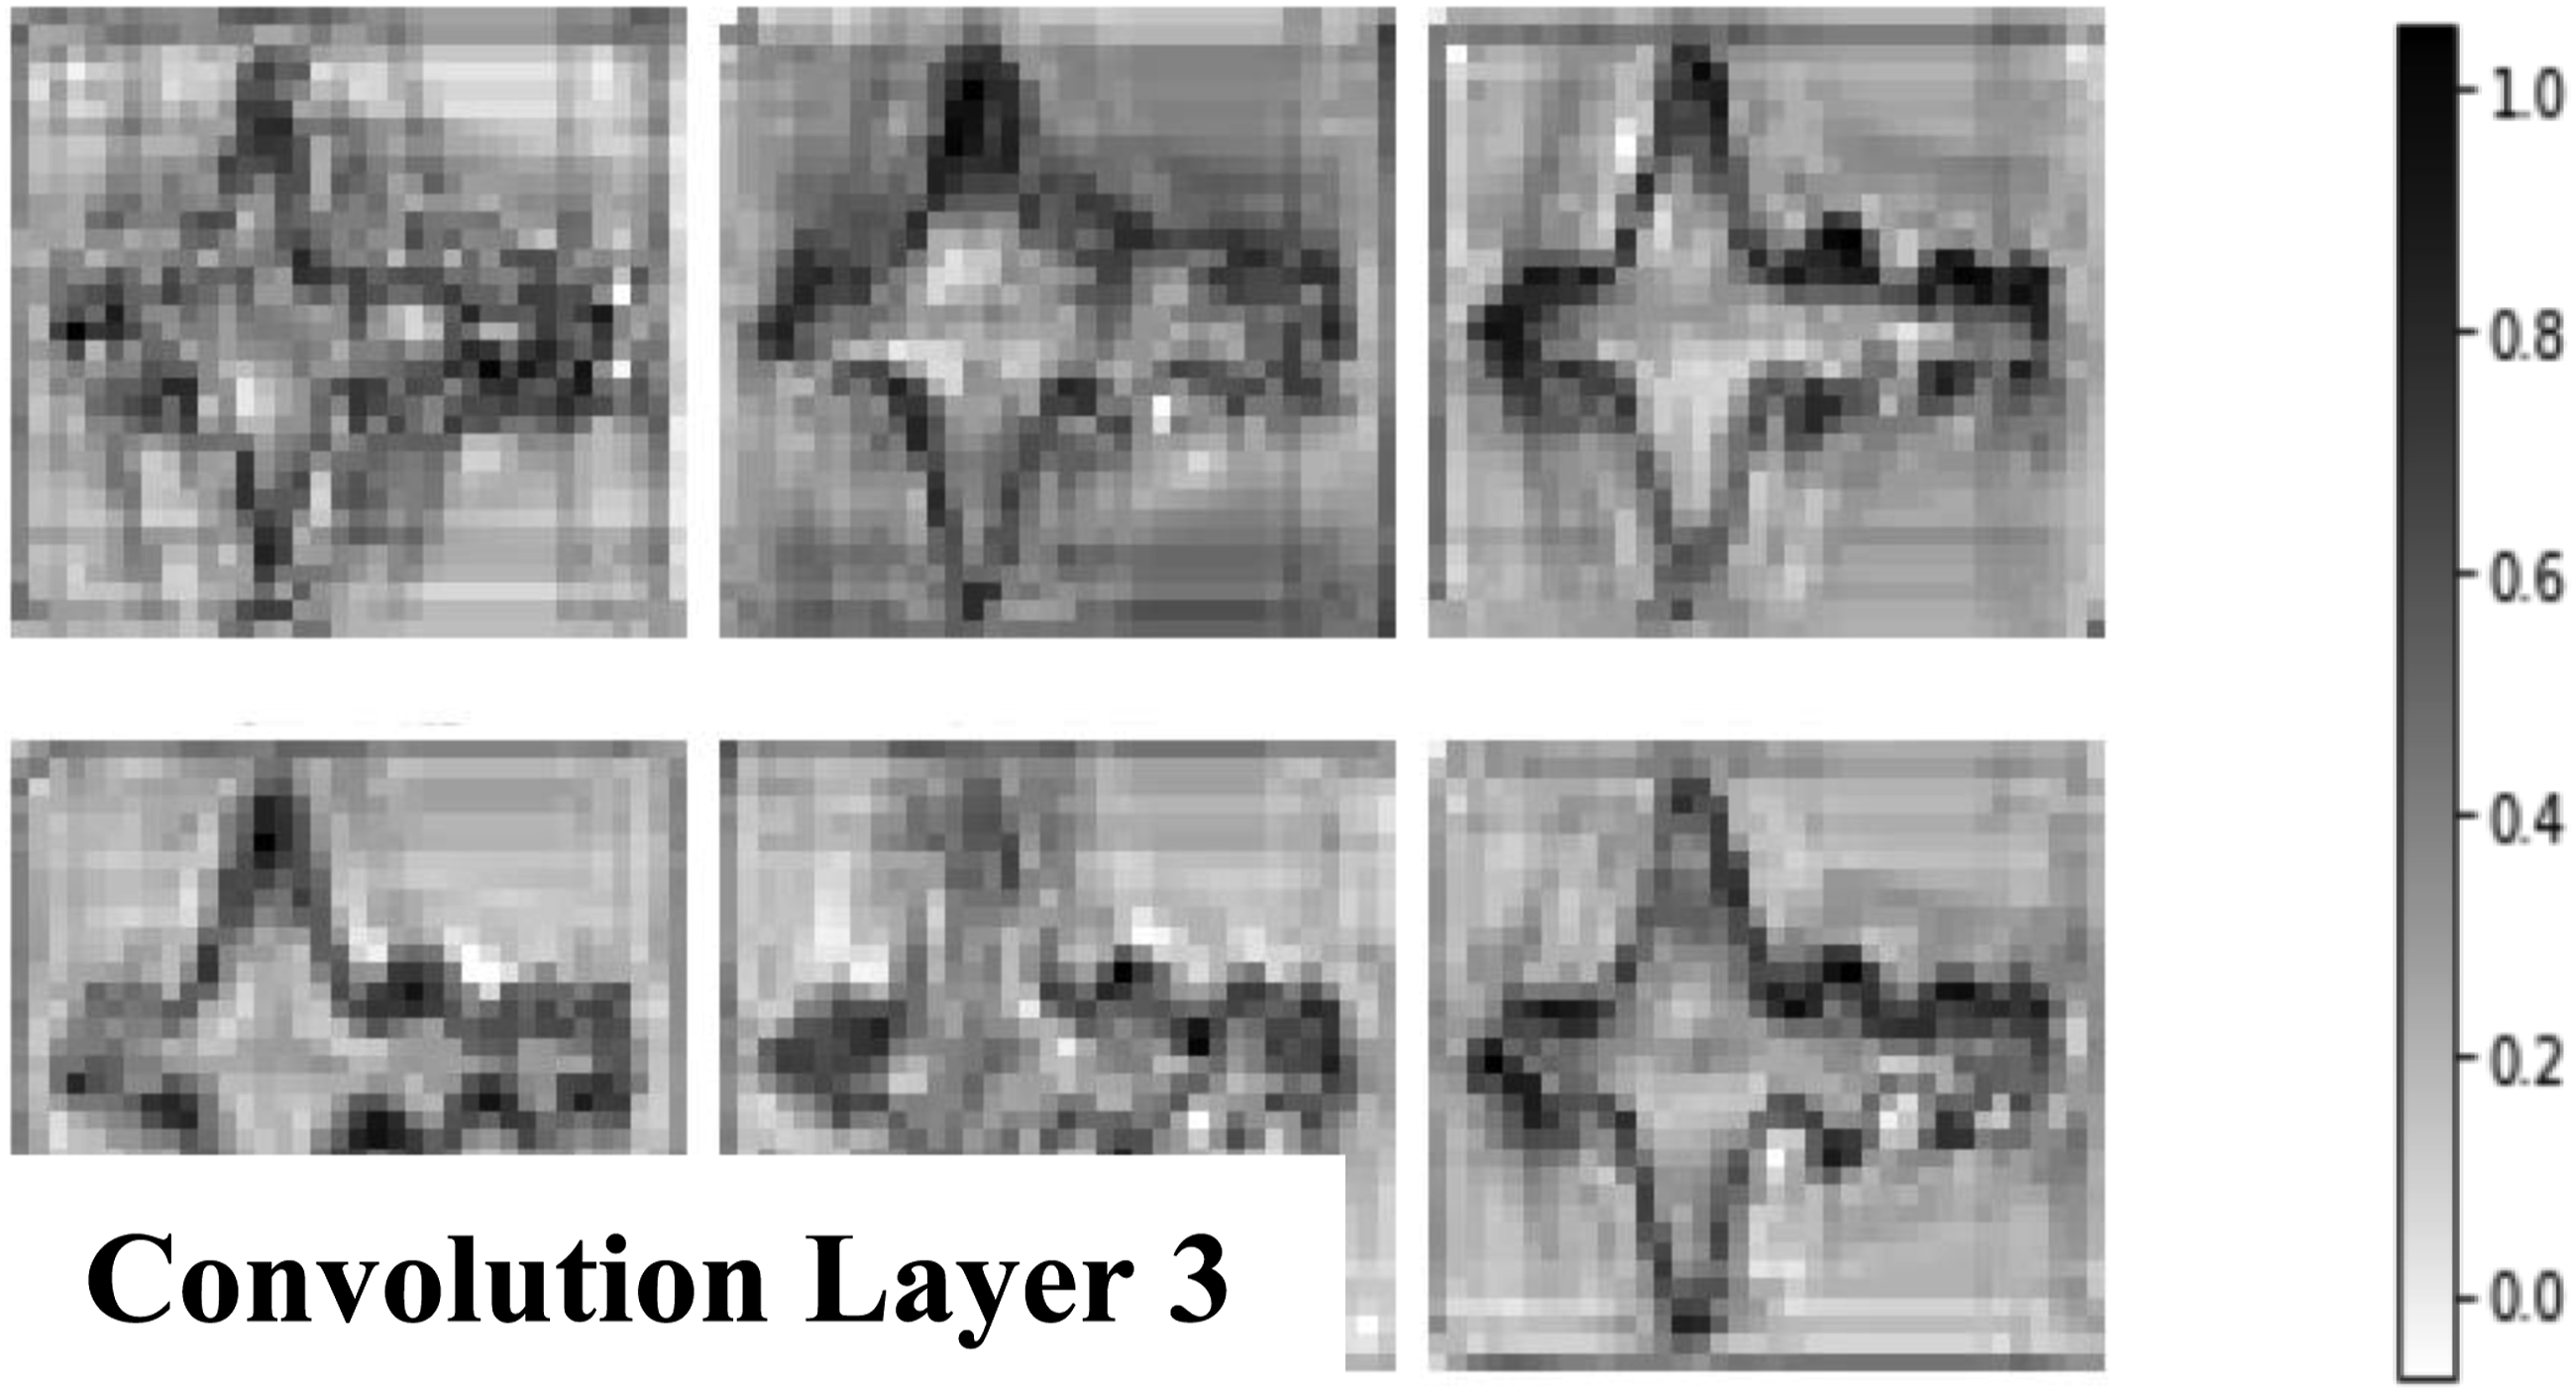
Model training and fine-tuning
To improve the recognition accuracy of the BladeNet-AM model, considering the limited sample size from dynamic simulations, the pre-training and fine-tuning approach in transfer learning theory is applied to initialize the parameters of the proposed model. Transfer learning
45
aims to efficiently learn new network parameters θ on a target dataset D, based on a set of pre-trained network parameters θ
0
:

The procedure of the pre-training and fine-tuning of the BladeNet-AM is shown in Figure 15. Initially, the envelope diagram dataset serves as the target domain for achieving crack identification, while the Chinese Style dataset,
46
comprising black-and-white images similar to those in the target domain, is designated as the source domain. Following this, multi-epoch training is conducted to optimize the recognition performance of the Chinese Style dataset, efficiently leveraging the pre-trained network’s source parameters. Finally, BladeNet-AM model was trained with fine-tuning by using the envelope diagram image data. Flowchart for the pre-training and fine-tuning of the BladeNet-AM method.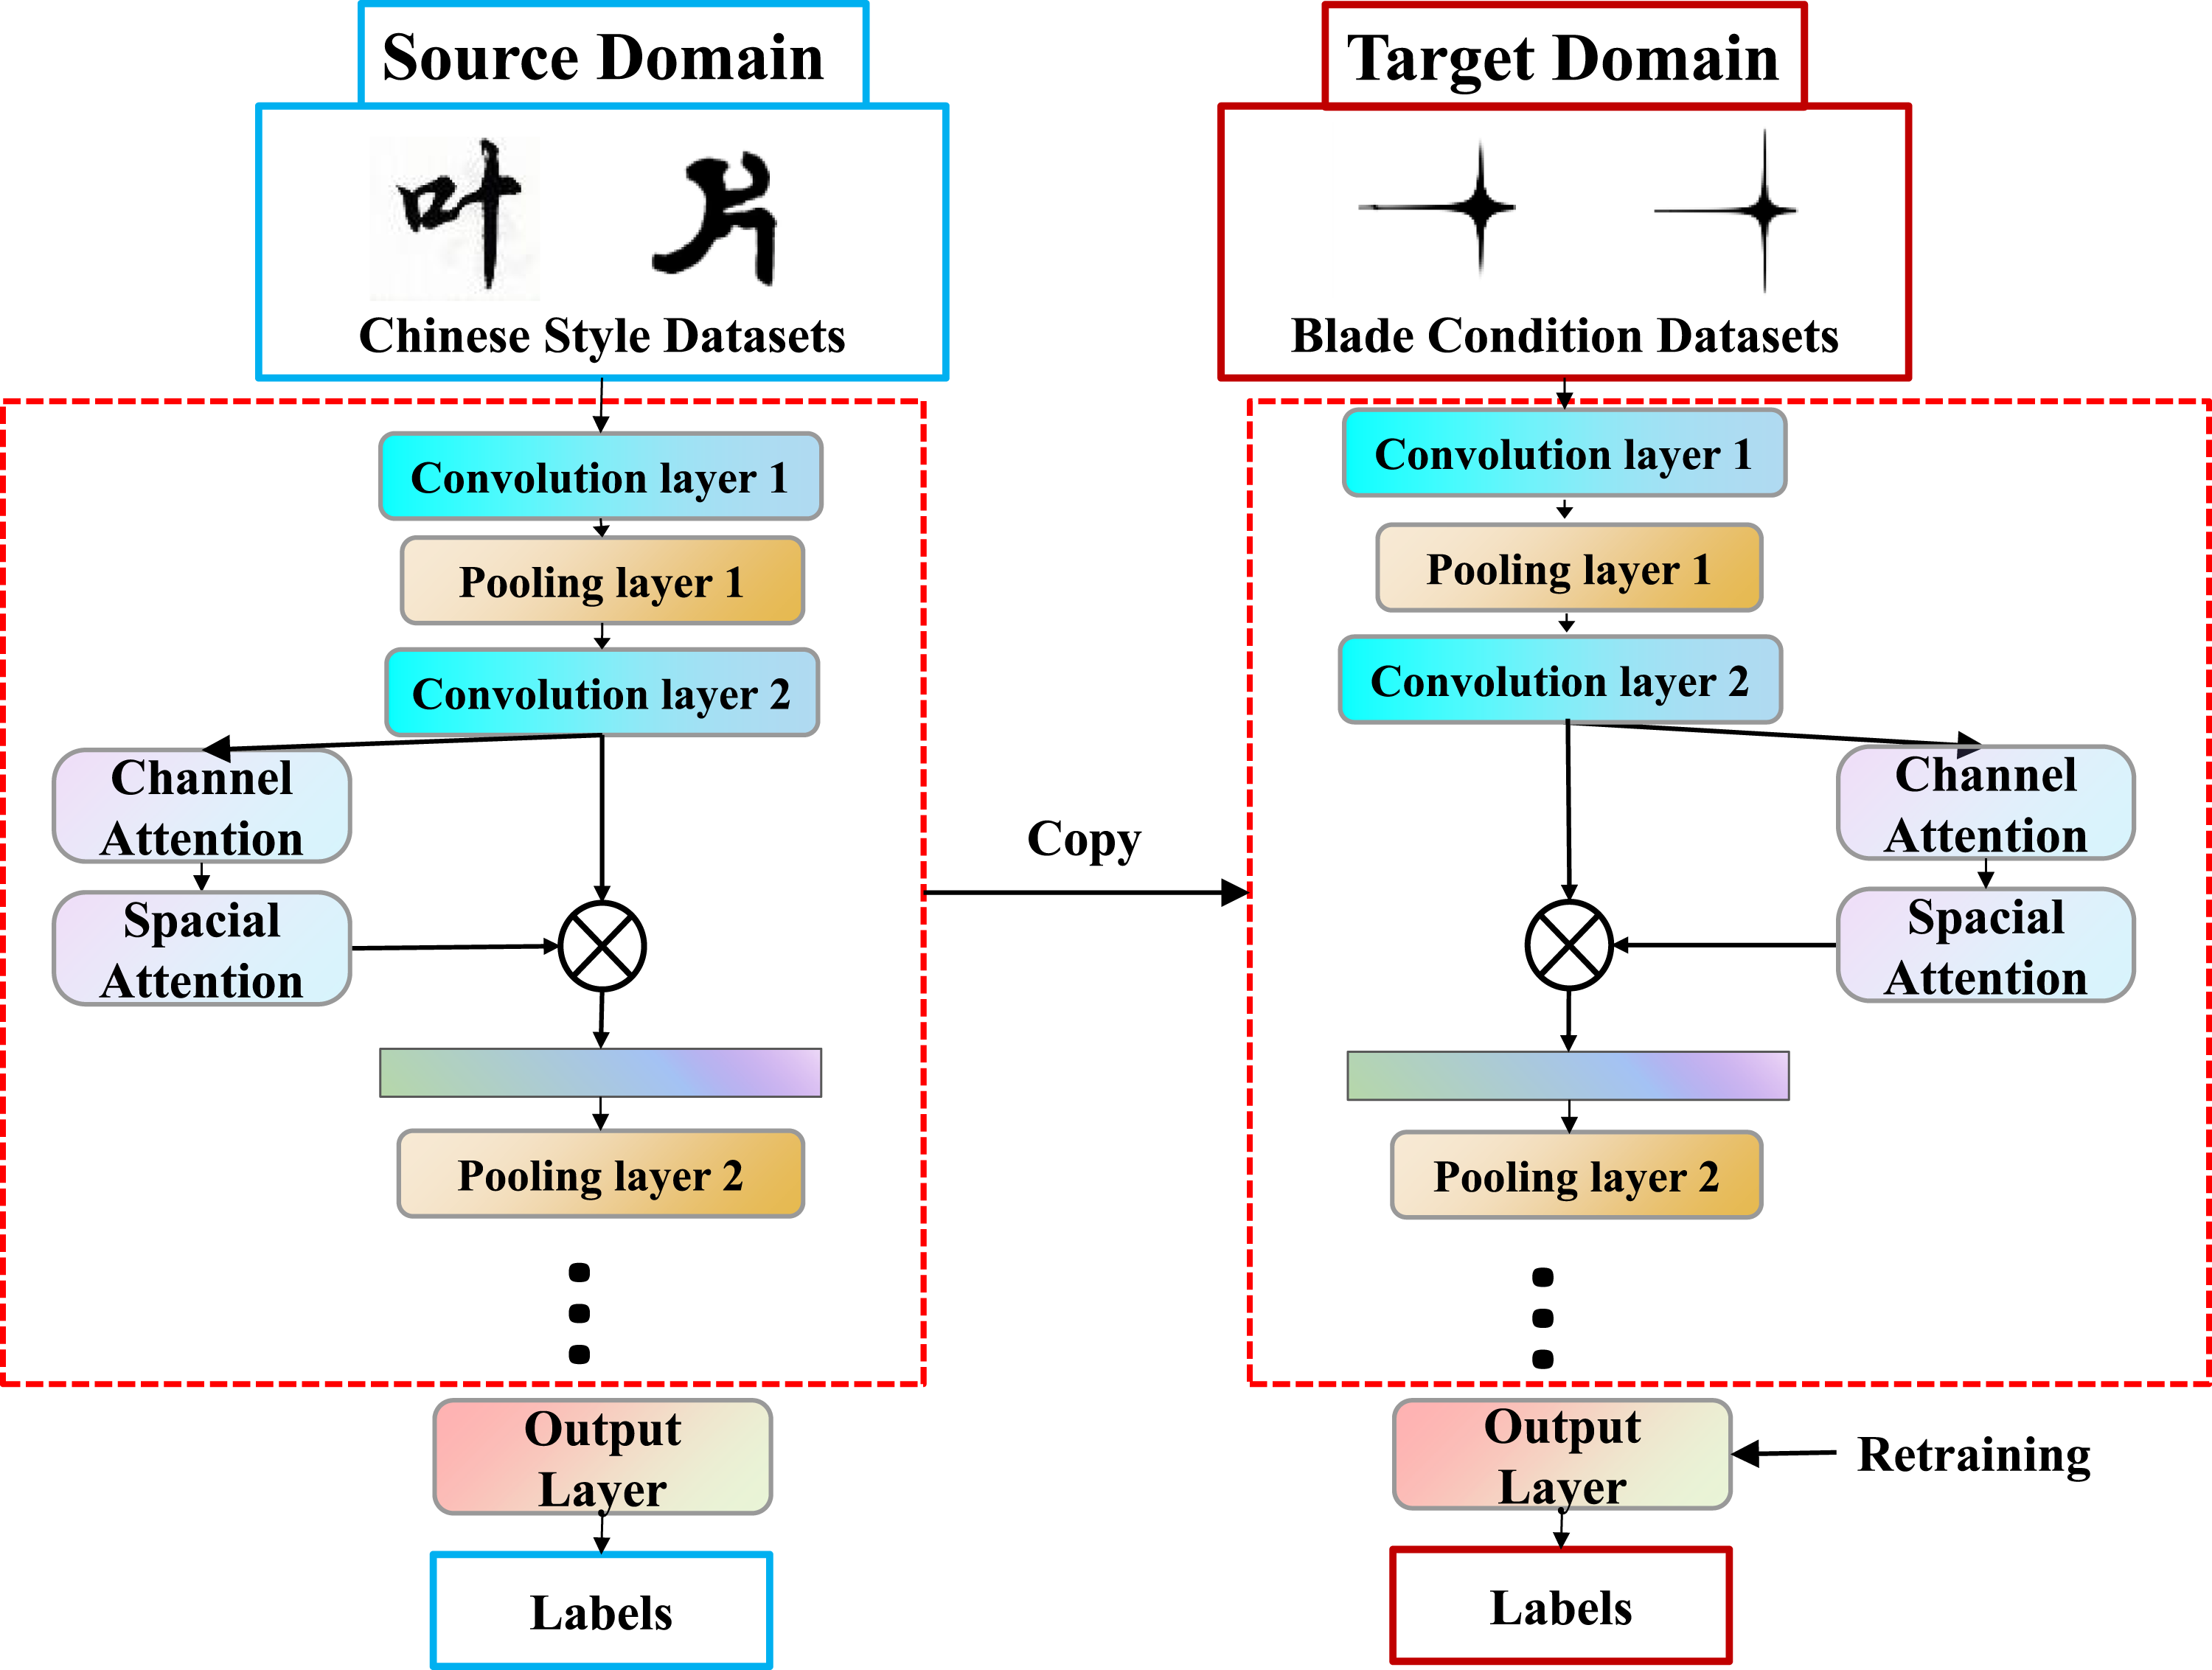
By utilizing fine-tuning with envelope diagram image data, the BladeNet-AM model was optimized, where the majority of its parameters were migrated. Specifically, the parameters of the final fully connected layer were trained to enhance its adaptability for the classification of blade vibration envelope diagrams. This approach effectively addresses the challenges of applying the model to small datasets.
Framework of breathing crack detection
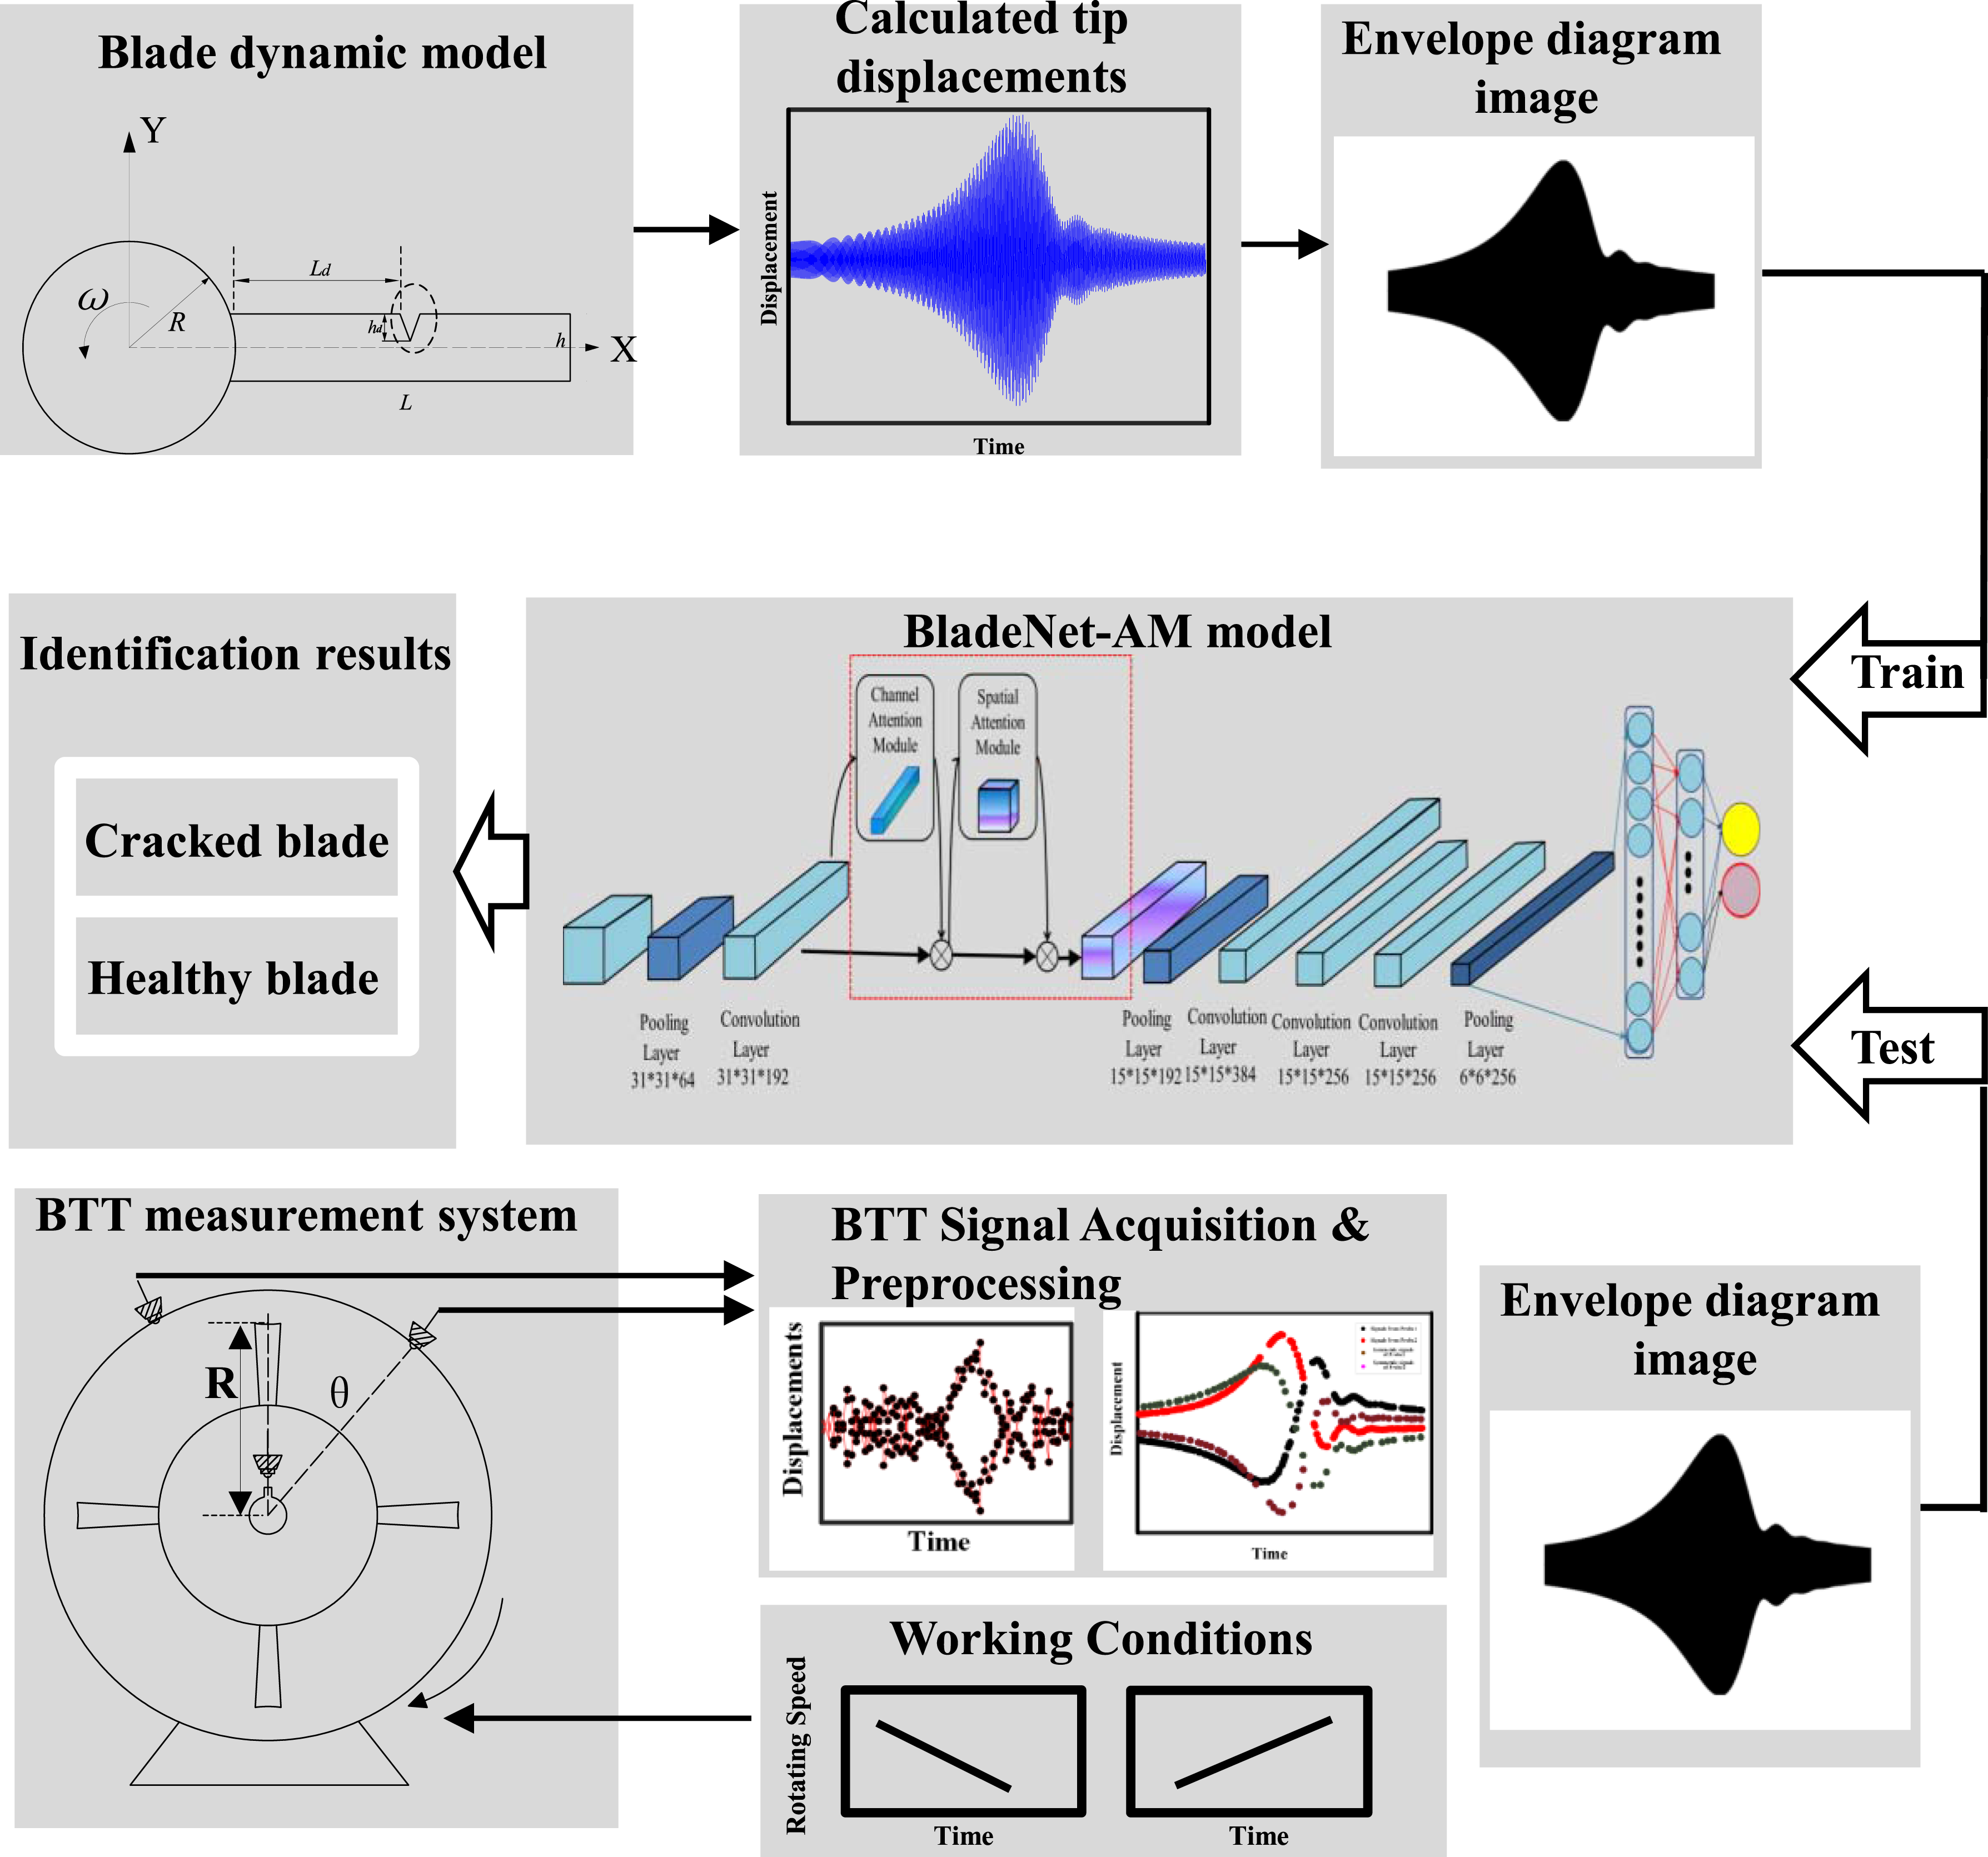
BTT measurements of cracked blade tip displacements serve as the output of a nonlinear dynamic model. Therefore, inferring blade conditions from these measurement results tends to be difficult owing to the absence of an analytical form. If the neural networks based models are solely trained based on BTT data without incorporating physical features of blade vibrations, it may hinder the model’s generalization ability to new data of turbine blades. Hence, this paper proposes a combined numerical-model-driven approach, utilizing the nonlinear dynamics of cracked blade displacement to improve the training of neural networks. This integration facilitates accurate crack damage identification in blades. The flowchart of BladeNet-AM based method is presented in Figure 16, and detailed as below. (1) The dynamic model of the blade is applied to calculate the vibration displacements at the blade tip under uniform acceleration or deceleration conditions for different types of blades. (2) Multiple sets of envelope diagram images are obtained by acquiring the outer envelope of blade tip vibration displacement signals near resonant regions. (3) BTT data measured in resonance regions undergo denoising and preprocessing, and are then transformed into envelope diagrams through the convex hull algorithm and curve-fitting methods. (4) Envelope diagram image data obtained from dynamic models are used to train with fine-tuning BladeNet-AM model. (5) Envelope diagrams constructed from the scattering of BTT measurement signals were used as input data of the trained BladeNet-AM model, so that the blade condition can be classified through the proposed network. Flowchart of BladeNet-AM based blade crack identification method.
Numerical simulations
This section presents a simulation dataset of blade tip vibration by setting parameters for various blades and operational conditions on the dynamic model introduced in Section 2.1. BTT signals are simulated in accordance with the sampling principle described in Section 3.1, extracting measurement values of blade tip vibration from the displacement data at intervals synchronized with the rotational period of the engine.
Numerical verification in this section was organized in the following progressive manner:
First, the robustness of the methodology that utilizes BTT signals to map the envelope diagram of the blade’s resonance region has been demonstrated. Furthermore, the interpretability of the proposed BladeNet-AM network in envelope diagram recognition is quantitatively assessed. Finally, the superiority of our diagnostic approach in crack identification is confirmed by comparing it with the traditional two parameter plot (2PP) method employed in BTT tests.
Construction of dataset
Parameters selection for datasets.
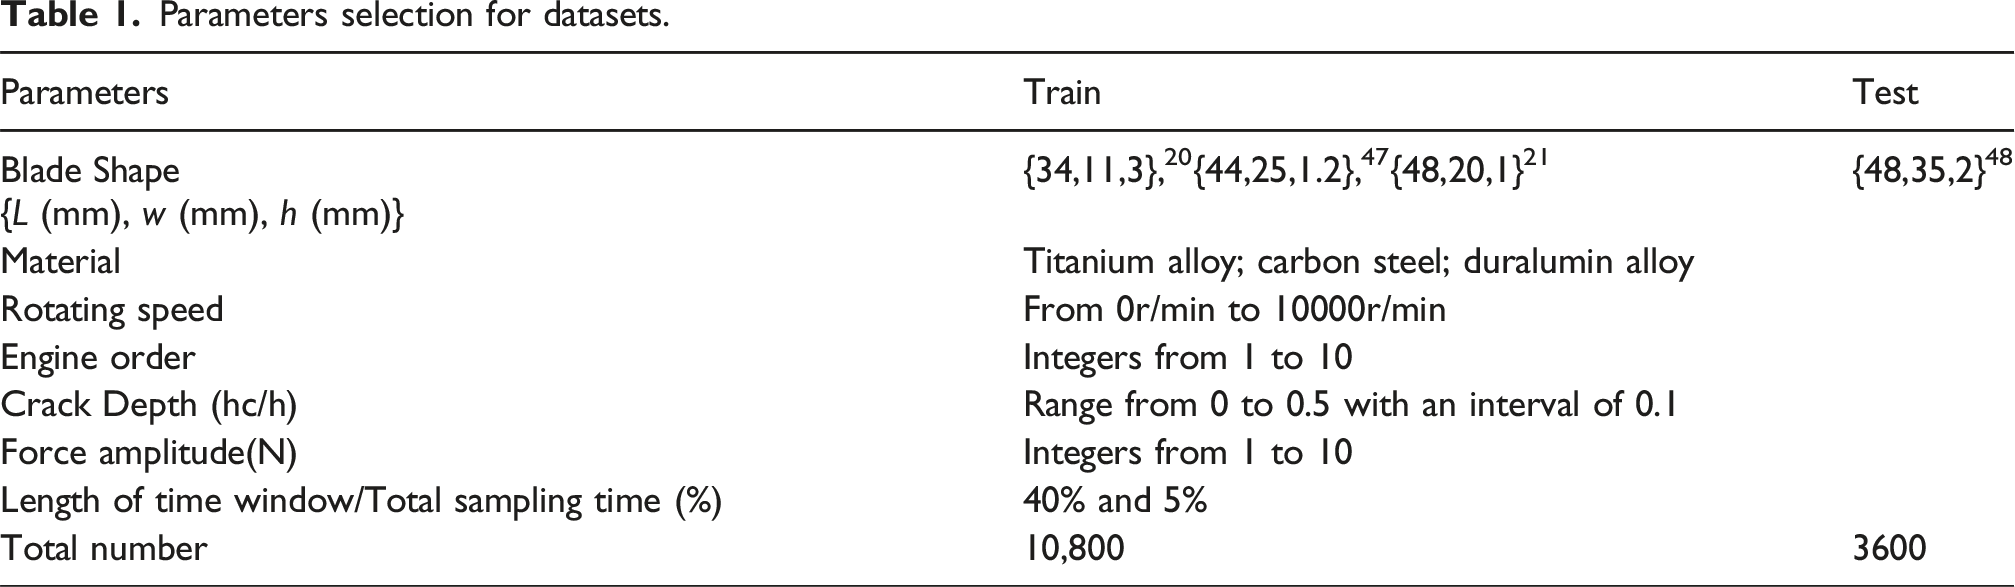
From the 14,400 envelope diagram samples, the envelope diagrams of three blade types are chosen as the training set, and those of the fourth blade type serve as the test set, as listed in Table 1. According to the method outlined in Section 3.4, the network is initially pre-trained using a Chinese style dataset. Subsequently, the parameters of the final fully connected layer are fine-tuned utilizing the targeted training set to derive the BladeNet-AM network specifically designed for crack detection. BladeNet-AM is implemented using Pytorch and an NVIDIA GeForce GTX 1050Ti. The proposed network is trained with a batch size of 8 and stochastic gradient descent (SGD) optimizer with a momentum of 0.05 and a learning rate of 0.0045.
Impacts of measurement uncertainty
In this subsection, simulation experiments are designed to illustrate the ability of the proposed method in reducing effects of measurement uncertainties in generation of envelope diagrams. Unlike the envelope diagram that is directly mapped from the computed blade tip displacement response signals, the diagrams generated through the use of dual-probe measured BTT signals inevitably exhibit differences in their shapes upon comparison. The impact of envelope diagrams generated utilizing dual-probe signals on crack identification will be analyzed.
The envelope diagrams generated from simulated blade tip displacements are used as ground truth. As shown in Figure 17, the number of sensors has a significant impact on the fidelity of the reconstructed envelope diagrams. Results reveal that single-sensor signals fail to reconstruct the full envelope region of vibration responses. Although increasing the number of sensors can further improve the accuracy of the reconstructed envelope diagram, a configuration with two sensors achieves a reasonable balance between measurement accuracy and cost-effectiveness in practical engineering applications. Comparison of envelope diagram generation with different numbers of probes: (a) dual probes, (b) single probe.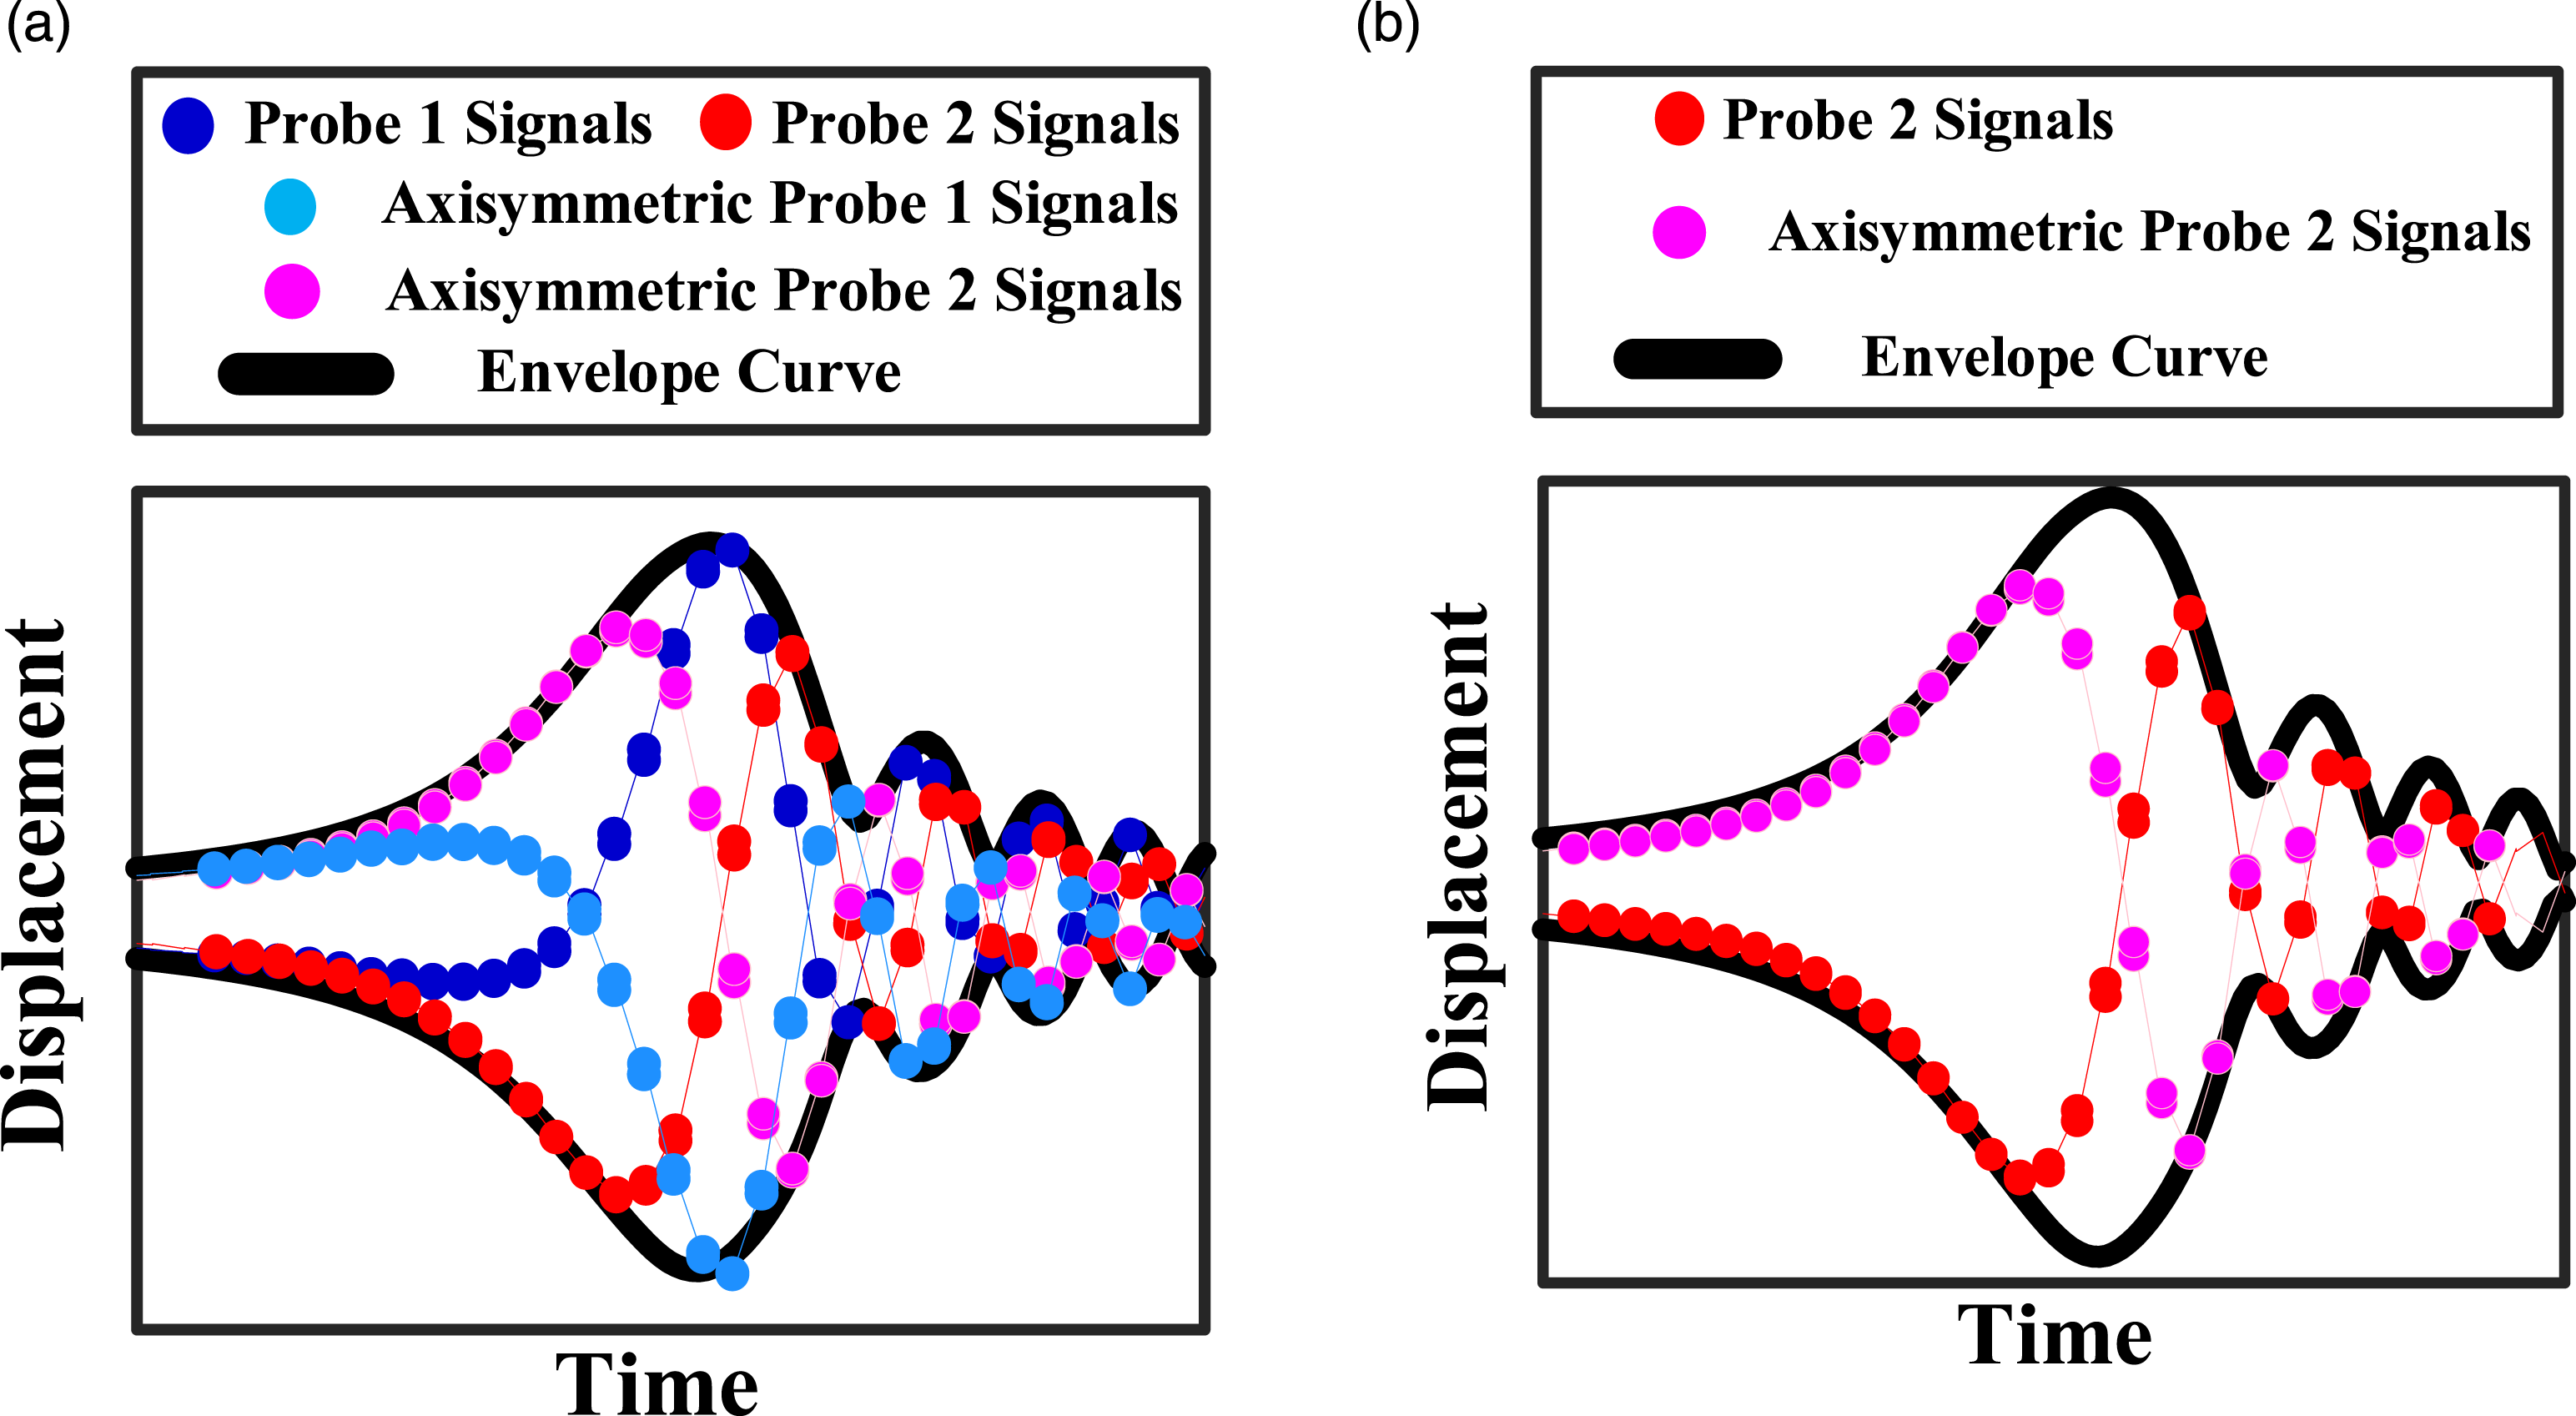
This paper defines SSIM (structural similarity)
49
to measure the similarity between the envelope diagram obtained by BTT signals and simulated displacements from blades in the same working state: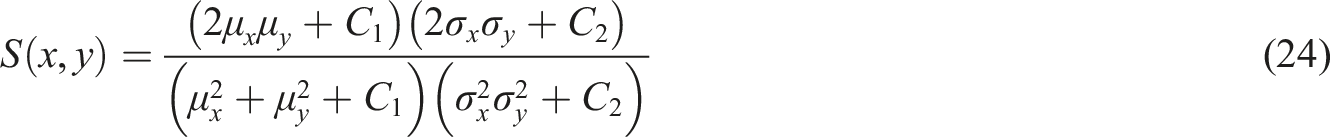
Firstly, the influence of probe layouts on the SSIM values between the envelope diagrams generated by BTT signals and the computed tip displacements is analyzed. Blade tip displacements used for simulation are calculated through 3600 test models listed in the test set of Table 1, while BTT data are sampled from the calculated displacements according to the BTT measurement principle. As shown in Figure 18, suppose one probe is fixed while the other is installed at every one-degree interval along the circumferential direction to collect BTT data and generate the corresponding envelope diagram of the resonance region. The mean value of 3600 sets of SSIM under each sensor installation angle was calculated and presented in Figure 18 in the form of a heat map. SSIM results of envelope diagrams obtained from scattered BTT signals and blade tip displacement signals under different probe placement selection.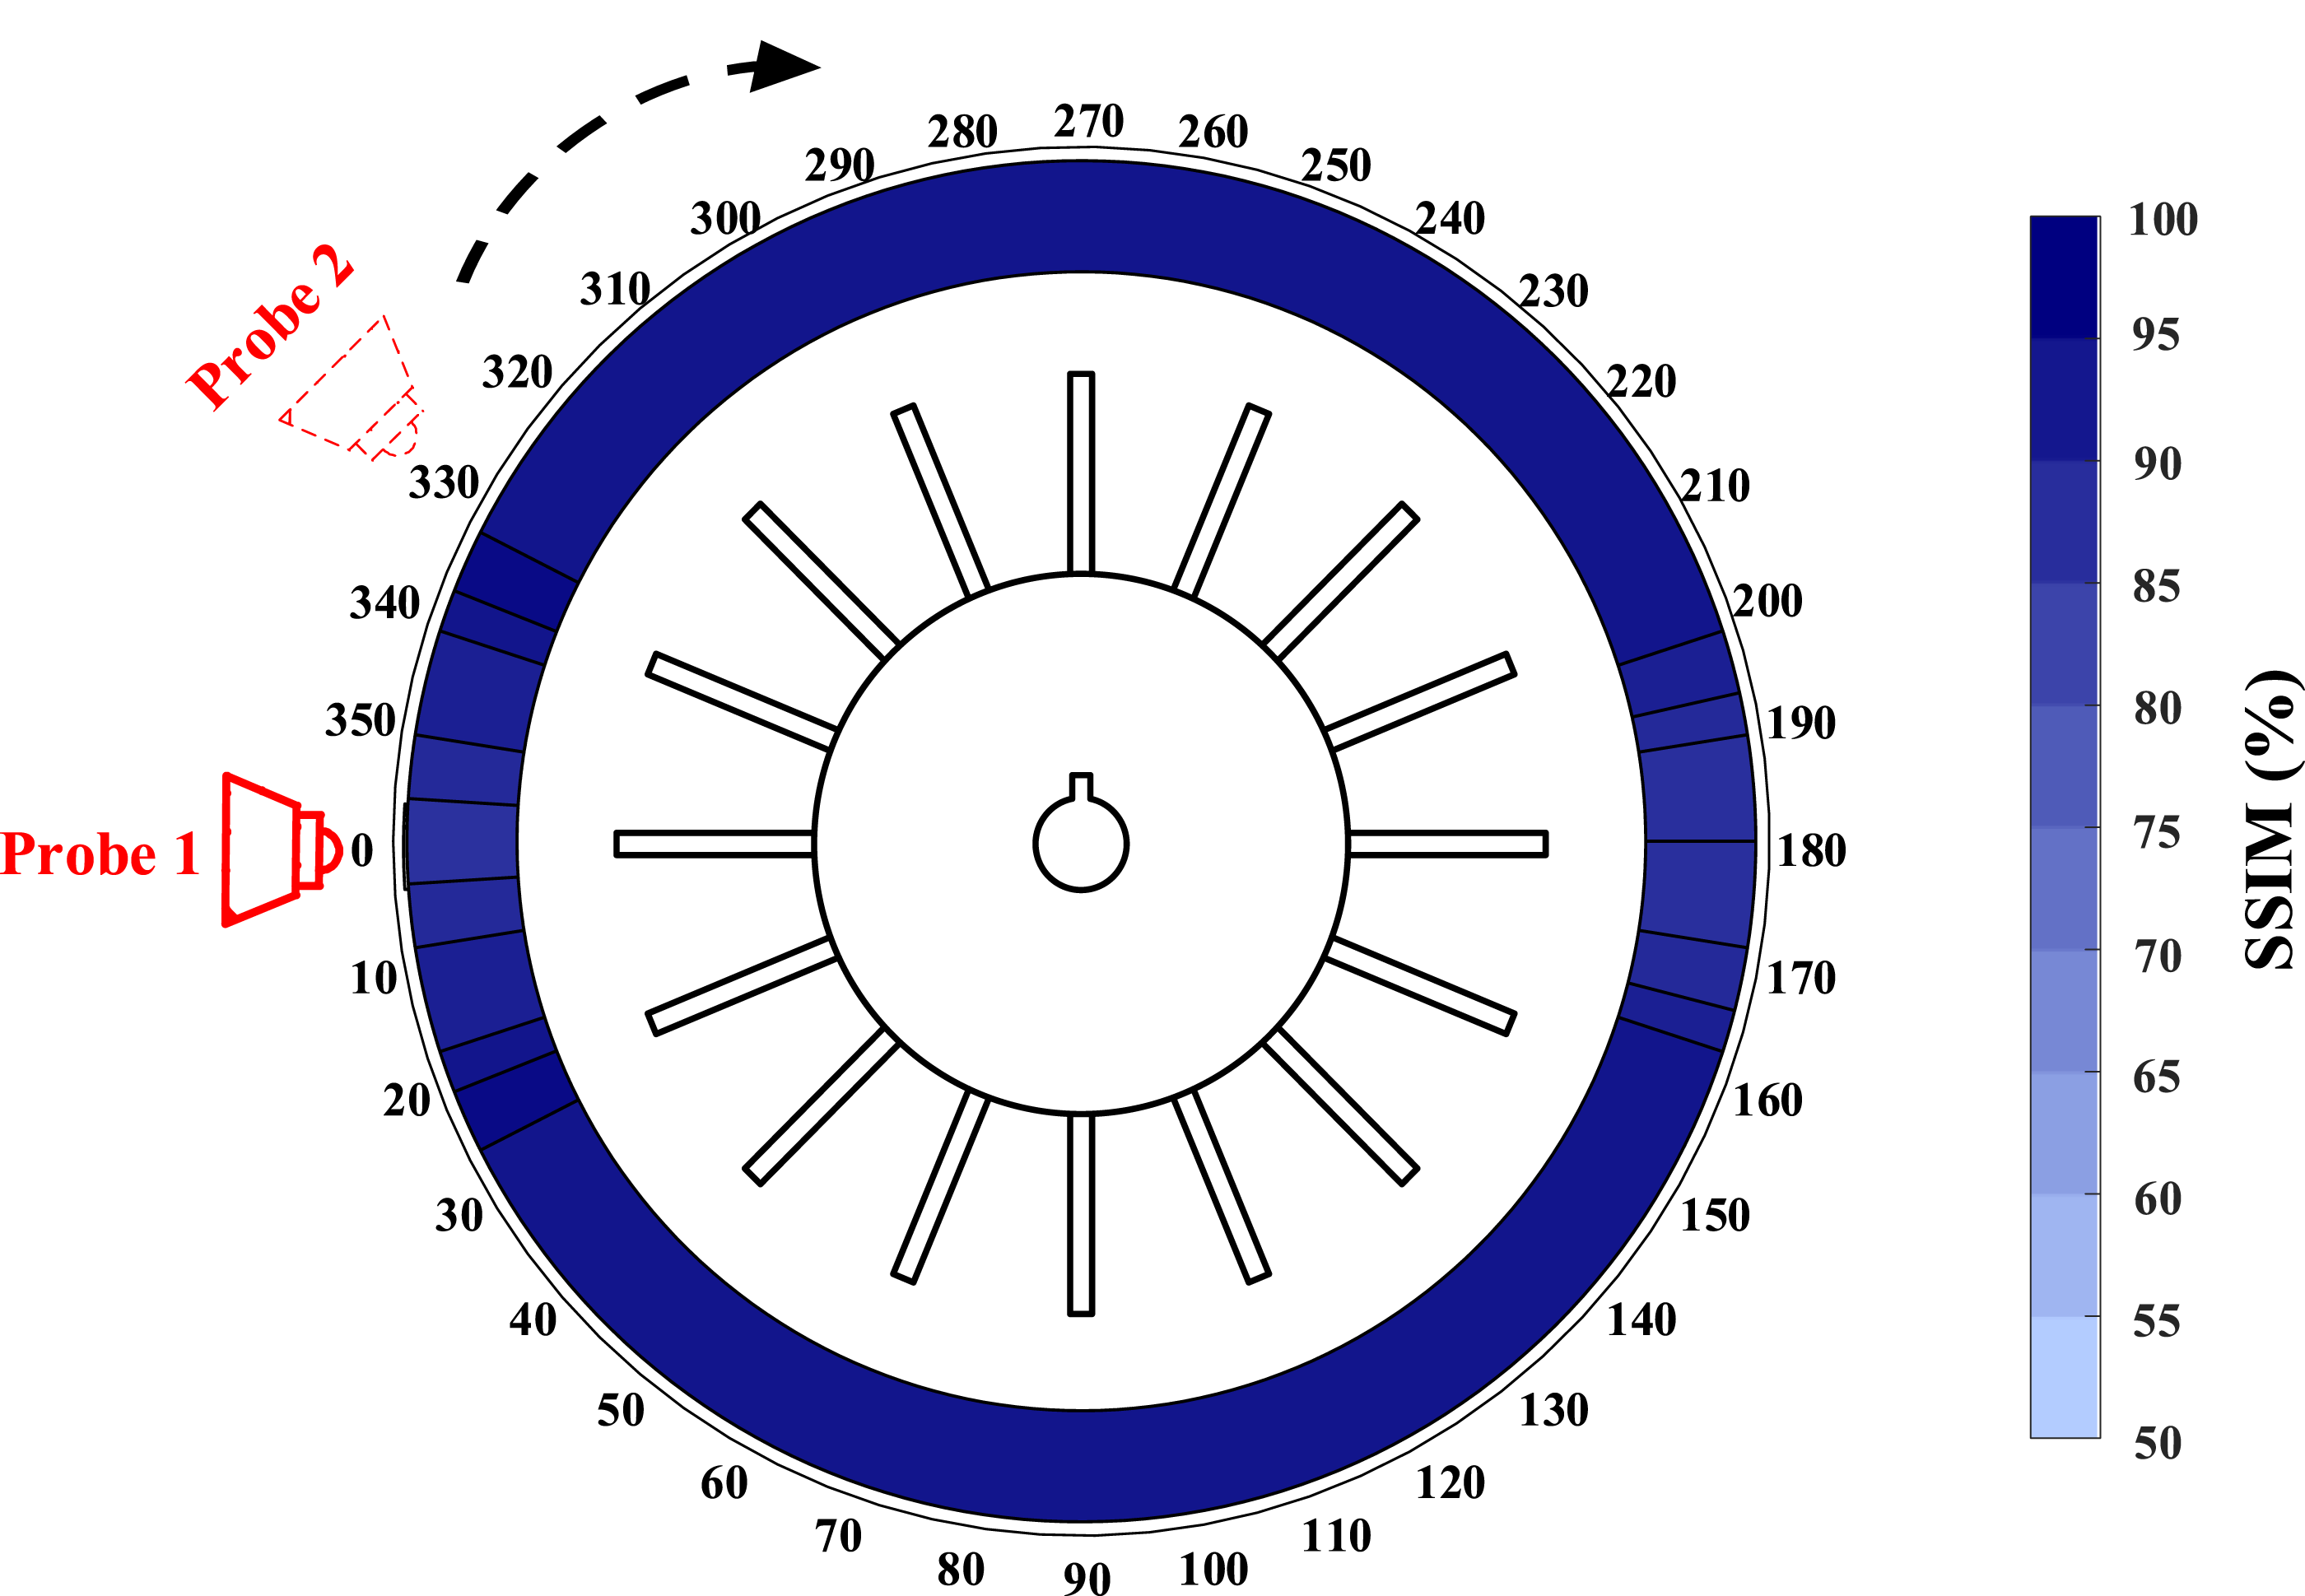
As shown in Figure 18, accurate envelope diagrams can be generated when the angular separation θ between the two probes is appropriately set to capture a broad spectrum of signals within the resonance region. Based on the analysis in Section 3.2, if the angle θ between the two probes is small (
SSIM results of envelope diagrams obtained from scattered BTT signals and blade tip displacement signals under different noise intensities.
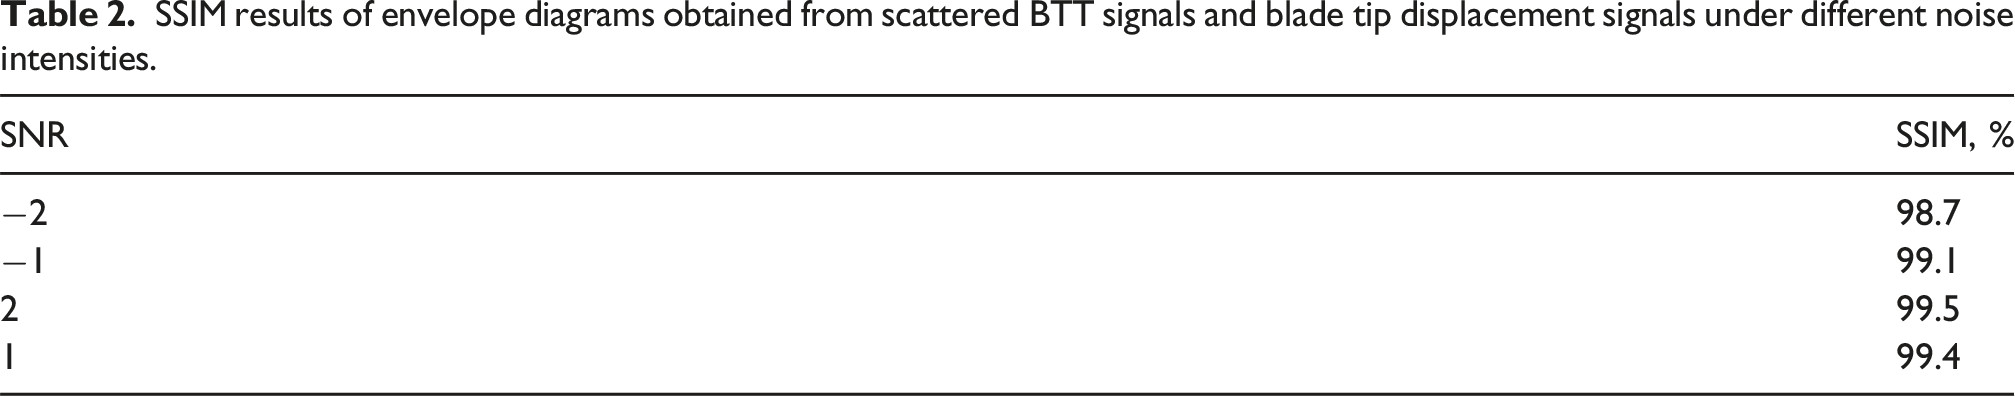
Figure 19 demonstrates BTT signals of an intact blade in the test set as an example. Engine order of the blade is set as EO = 2 and noise made SNR to -2 dB. The comparison between different BTT signals reveals that the processed noise contaminated BTT signals closely align with the actual signals, exhibiting minimal distortion to the shape of the resulting envelope diagram. As illustrated in Figure 19, the displacement curves within the resonance region exhibit pronounced fluctuation trends, enabling effective noise elimination through the application of standard filtering and noise reduction techniques. Ideal and noise-contaminated dual-probe BTT simulation signals sampled by the same blade.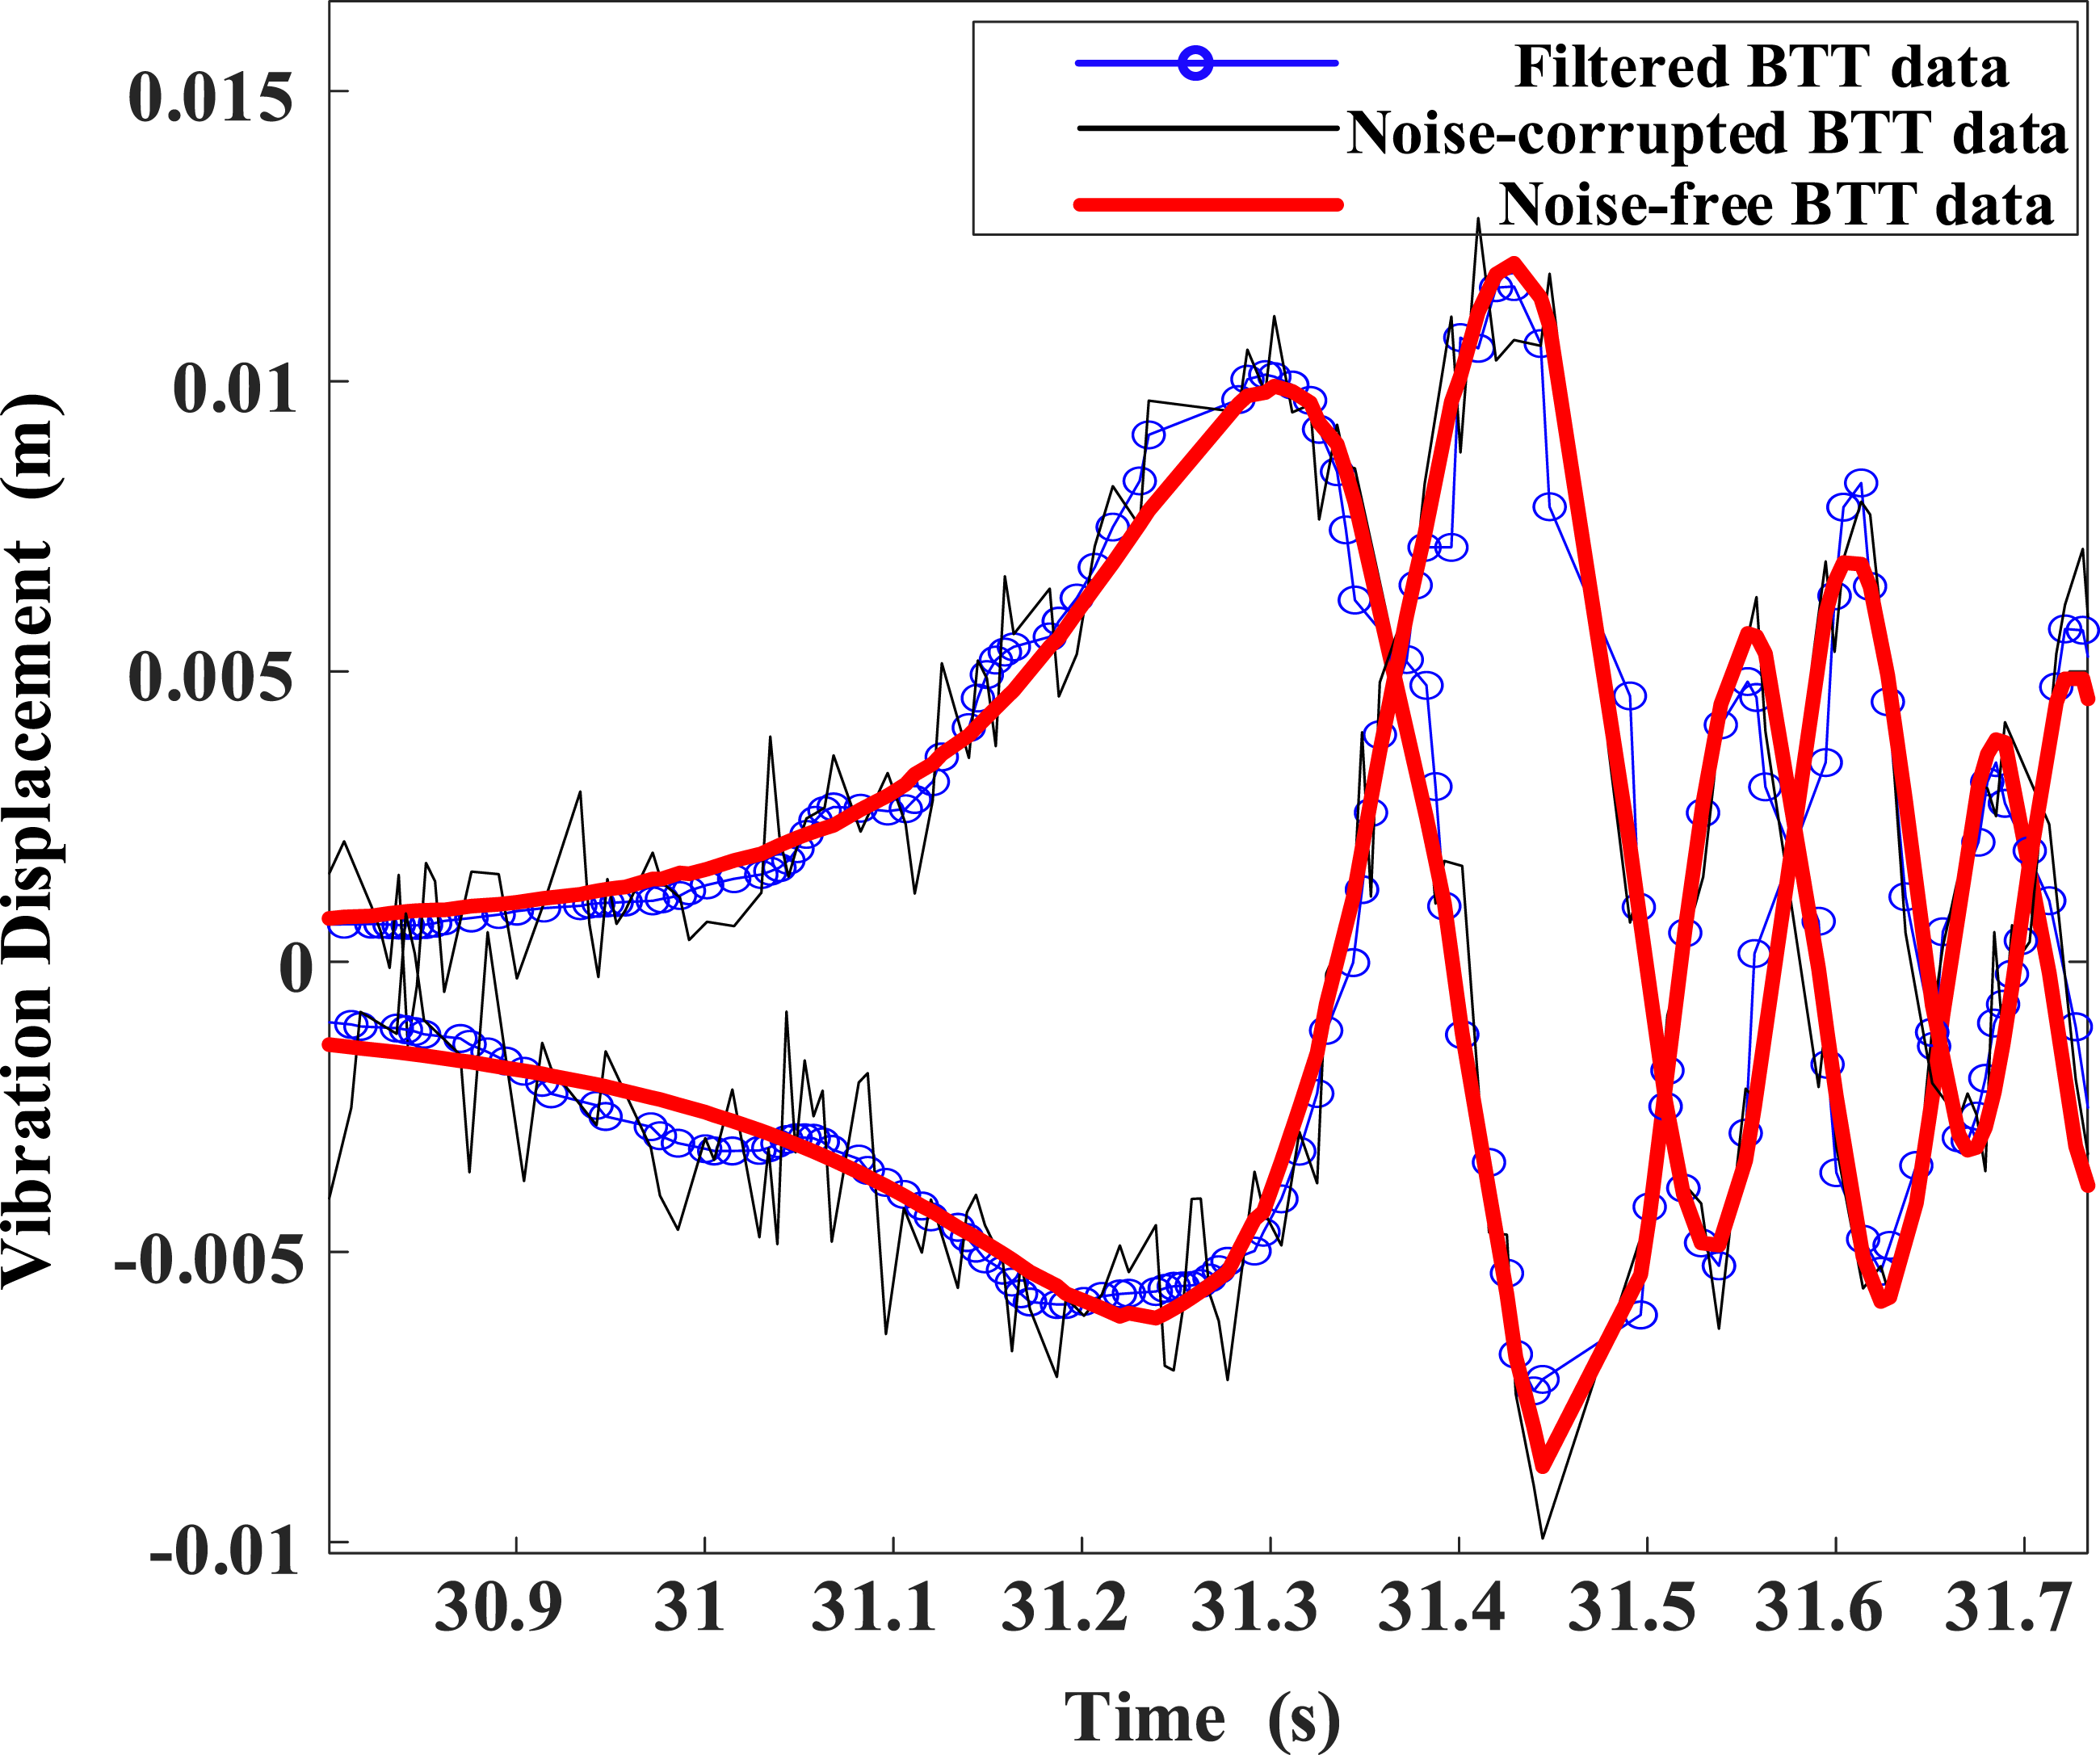
According to the numerical study, the proposed method exhibits low sensitivity to probe installation positions and robust resistance to measurement noise interference. Because accurate envelope diagram images are essential for precisely assessing the condition of the blades, the simulation results demonstrate that the proposed envelope diagram image mapping method using BTT measurement signals performs well in characterizing response signals within resonance regions.
Visual explanations from BladeNet-AM via dynamic model
Based on the principles of blade dynamics, the influence of crack damage on the geometry of the BTT envelope diagram has been analyzed in Section 2. As previously mentioned, the characteristics of the displacement response curves can be summarized as three main features: oscillatory behavior of the curves induced by damping changes, the presence of sub-harmonic resonance peaks resulting from sub-harmonic resonance, and variations in the shape of the peak region of the displacement response curves. Furthermore, we employ the Gradient-weighted Class Activation Mapping (Grad-CAM) method 51 to assess the contribution of distinct envelope diagram regions to the network’s determination of crack faults, enabling the visualization of the regions that are of particular interest to the network during the recognition process.
In this paper, Grad-CAM technique is employed to compute the location map of the last convolutional layer in a network, which visually expresses the assignment of importance value for the image classification process conducted by the network. After classification, the location map is derived from a weighted combination of feature activations from the network’s last convolutional layer. These weighted feature maps are summed up across all channels to produce a two-dimensional heatmap, and the map is scaled back to [0,1] by an ReLU function:

In this simulation, four CNN networks—the classic LeNet 52 and AlexNet, 53 along with our proposed BladeNet and its enhanced version, BladeNet-AM, are employed to independently classify 3600 samples within the test set. Location maps which generated by processing all the test images are saved.
Figure 20 shows the envelope diagram of the cracked blade overlaid by location maps obtained by three experimental testing networks. It can be seen from the highlighted regions of Figure 20 that the proposed network mainly determines the presence of blade breathing cracks based on shape differences among the three types of regions analyzed in Section 2. This observation further reinforces the interpretability of the network and its relevance to dynamic theory. Grad-CAM visualizations for the last convolutional layers of different networks and the binary image of the corresponding location map (a) LeNet (b) AlexNet (c) BladeNet-AM.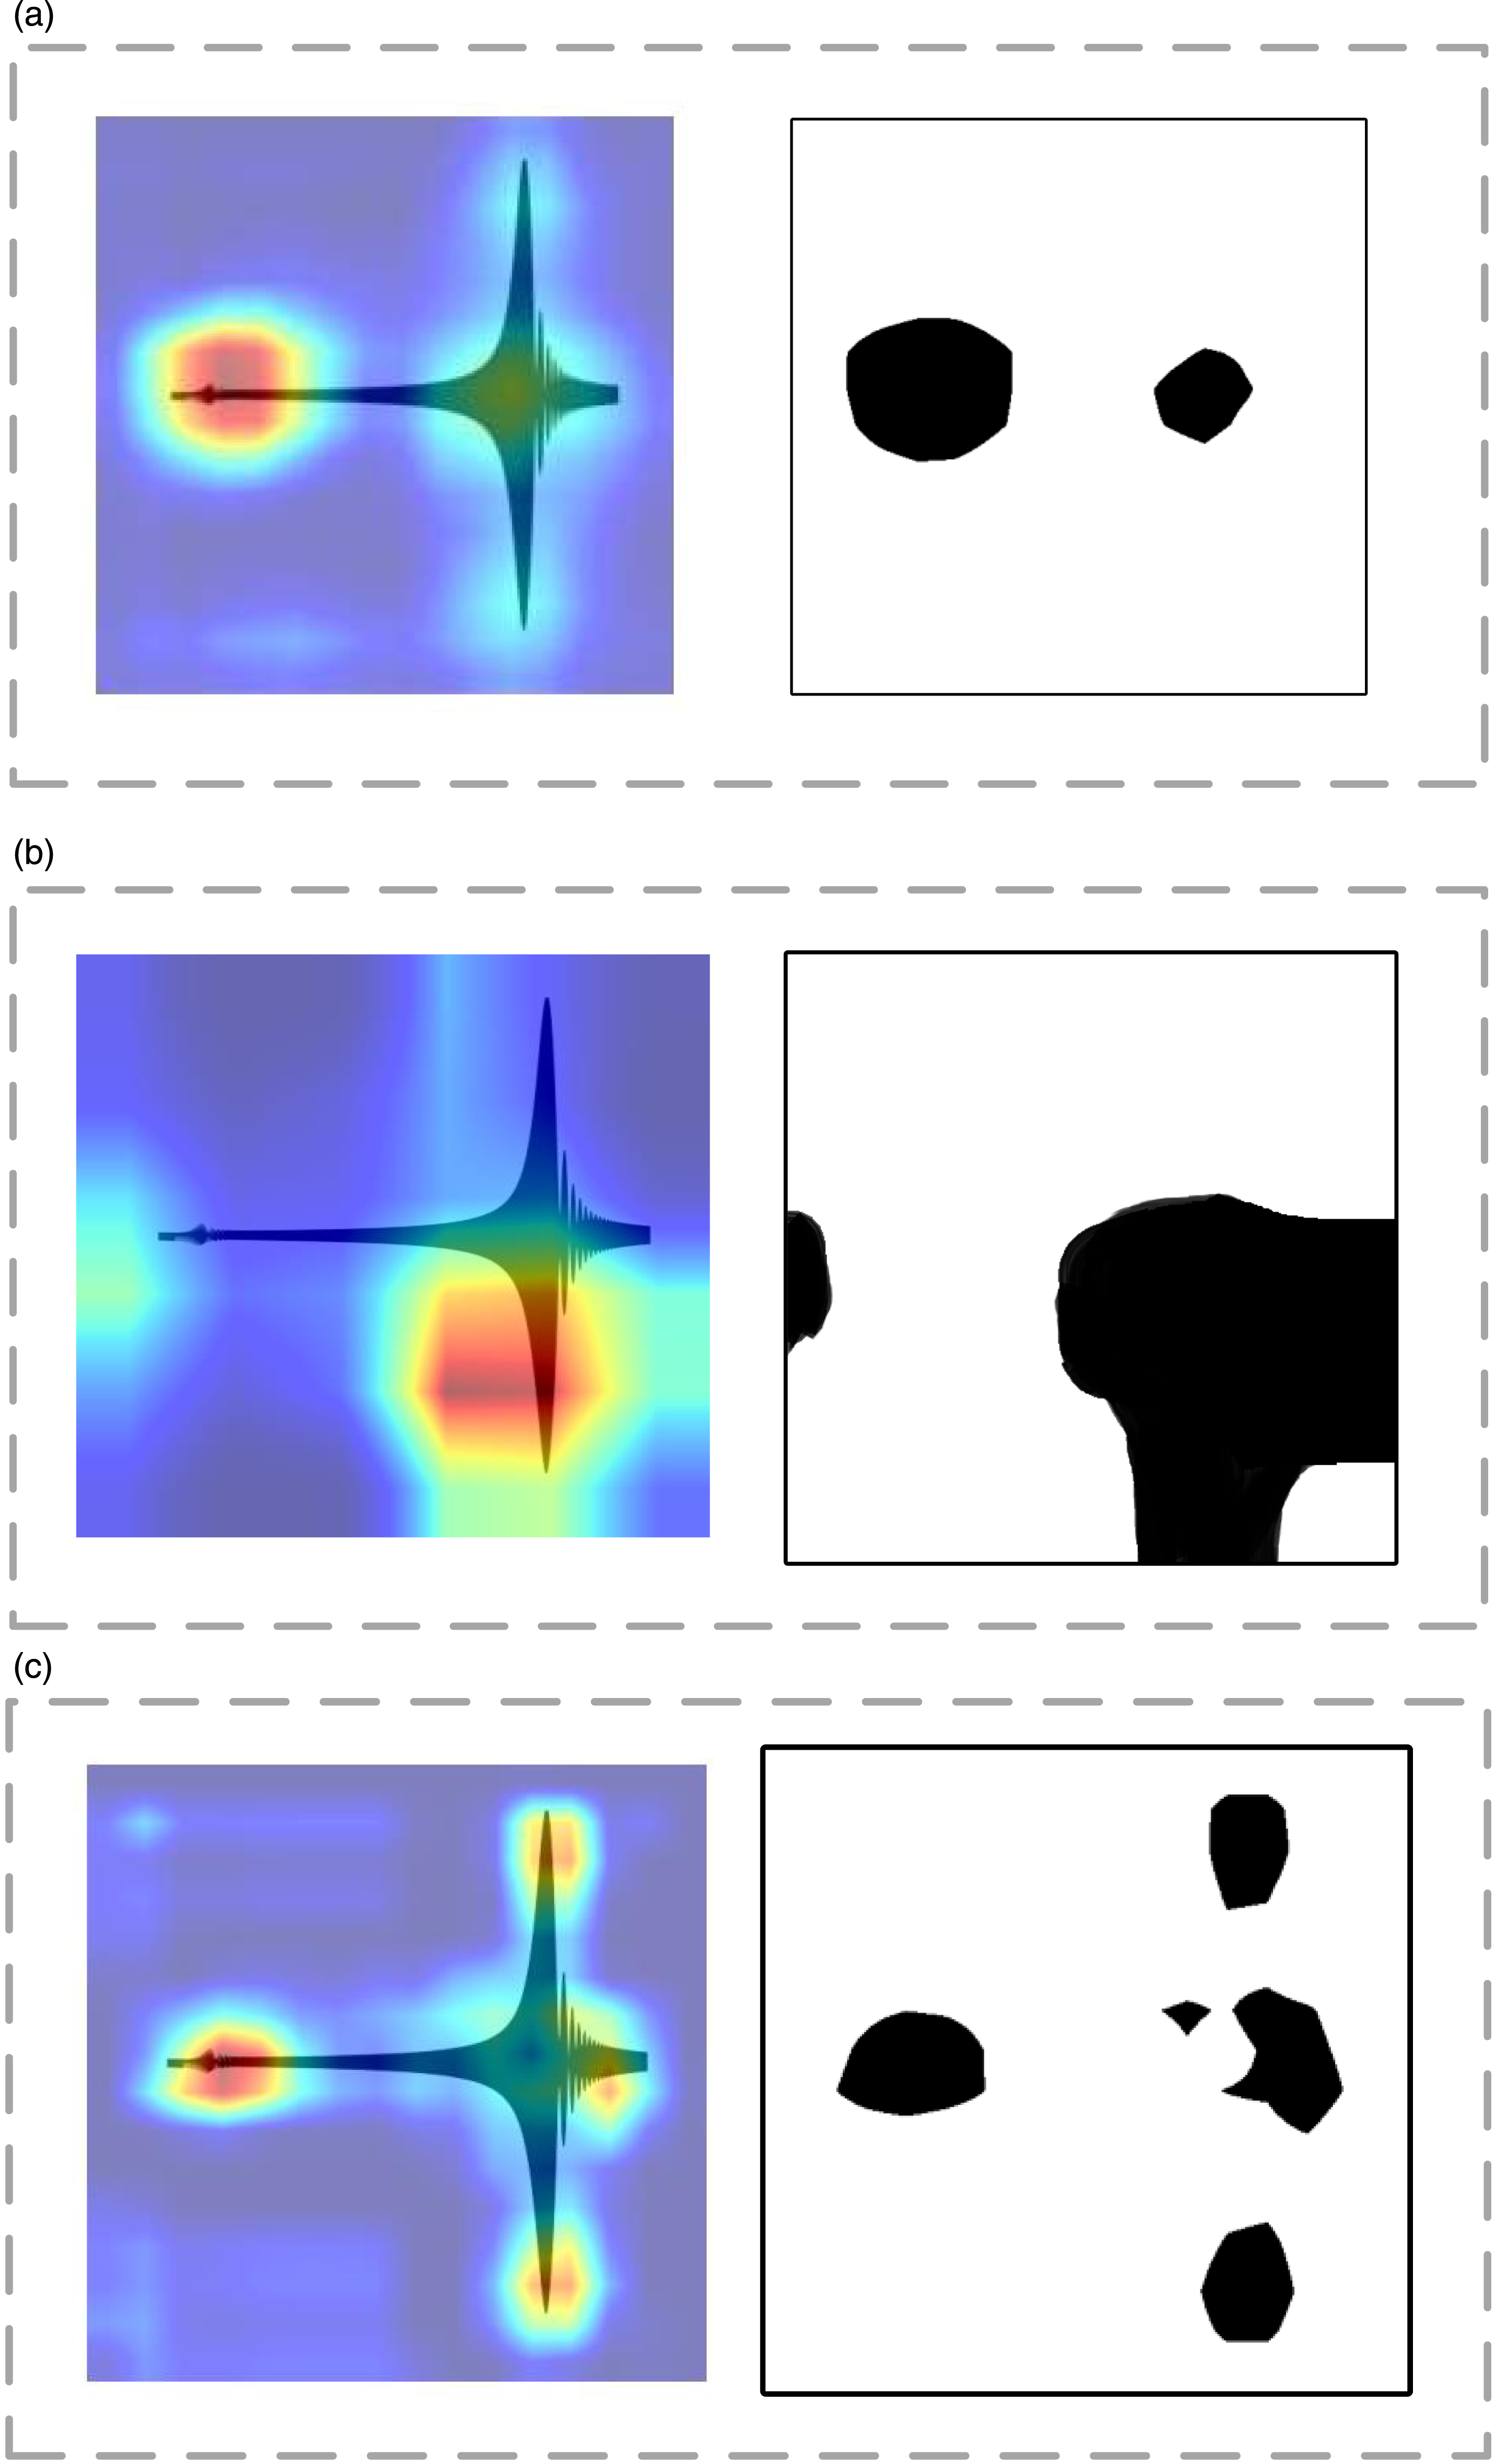
To quantitatively evaluate the Grad-CAM explanation results across various networks for crack classification, the location map of the input sample’s heatmap generated by the Grad-CAM method is converted into a binary image. Pixels are set to black if their values are greater than 0.5,
54
and to white if less than 0.5, as shown in Figure 20. Subsequently, the concept of Intersection over Union (IoU)
55
is introduced and defined as follows:
Based on the definition of IoU, a higher IoU value indicates that the network’s area of focus for image recognition is more concentrated on the main body of the envelope diagram. Conversely, a lower IoU value suggests that the network has placed its “interest” on the blank portions of the image during the process of envelope diagram recognition. Therefore, networks with more comprehensive are expected to have higher IoU values compared to those with limited interpretability theoretically.
Classification and IoU results of three different networks.
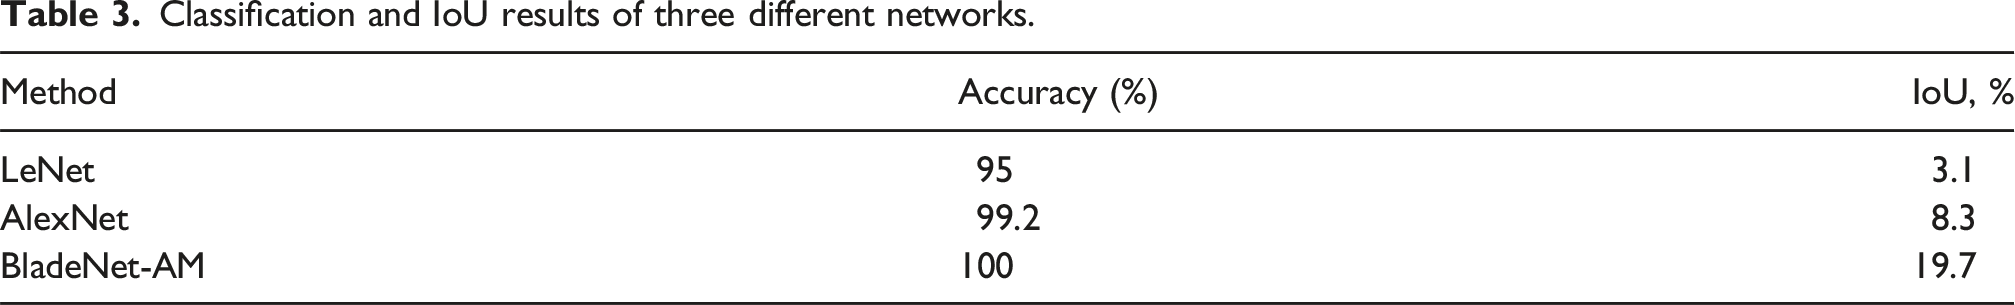
As observed from Table 3, the proposed network BladeNet-AM is superior to other networks in the performance of both classification accuracy and interpretability. Since the dynamic characteristics of the blade are primarily exhibited in the edge sections of the envelope diagram, the IoU value of even a highly interpretable network remains limited. However, the interpretability of the blade is clearly demonstrated through the heatmap depicted in Figure 20.
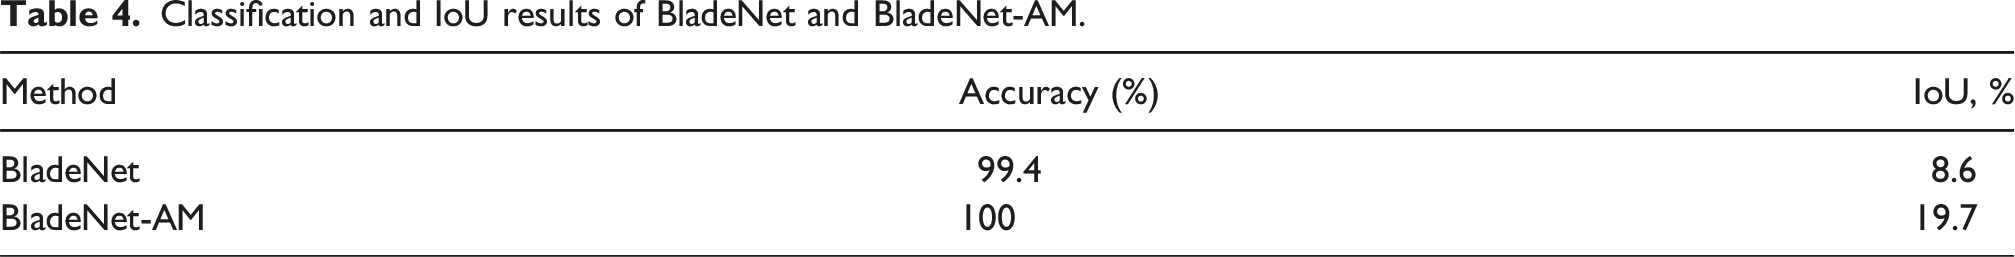
Finally, an ablation study was conducted on the AM in the proposed BladeNet-AM network to demonstrate its performance enhancement over the baseline BladeNet. Figure 21 highlights the regions in the envelope image (yellow regions) that contribute most to crack identification interpretability. The results reveal that integrating the AM module enables the network to focus on three critical features during image recognition: (1) the decay rate of oscillatory behavior, (2) sub-harmonic resonance peaks, and (3) the bending shape of the peak region, thereby improving diagnostic accuracy. Grad-CAM activation patterns and threshold-binarized envelope intersections: spatial correspondence in final convolutional layers across deep networks: (a) BladeNet (without attention mechanism); (b) BladeNet-AM.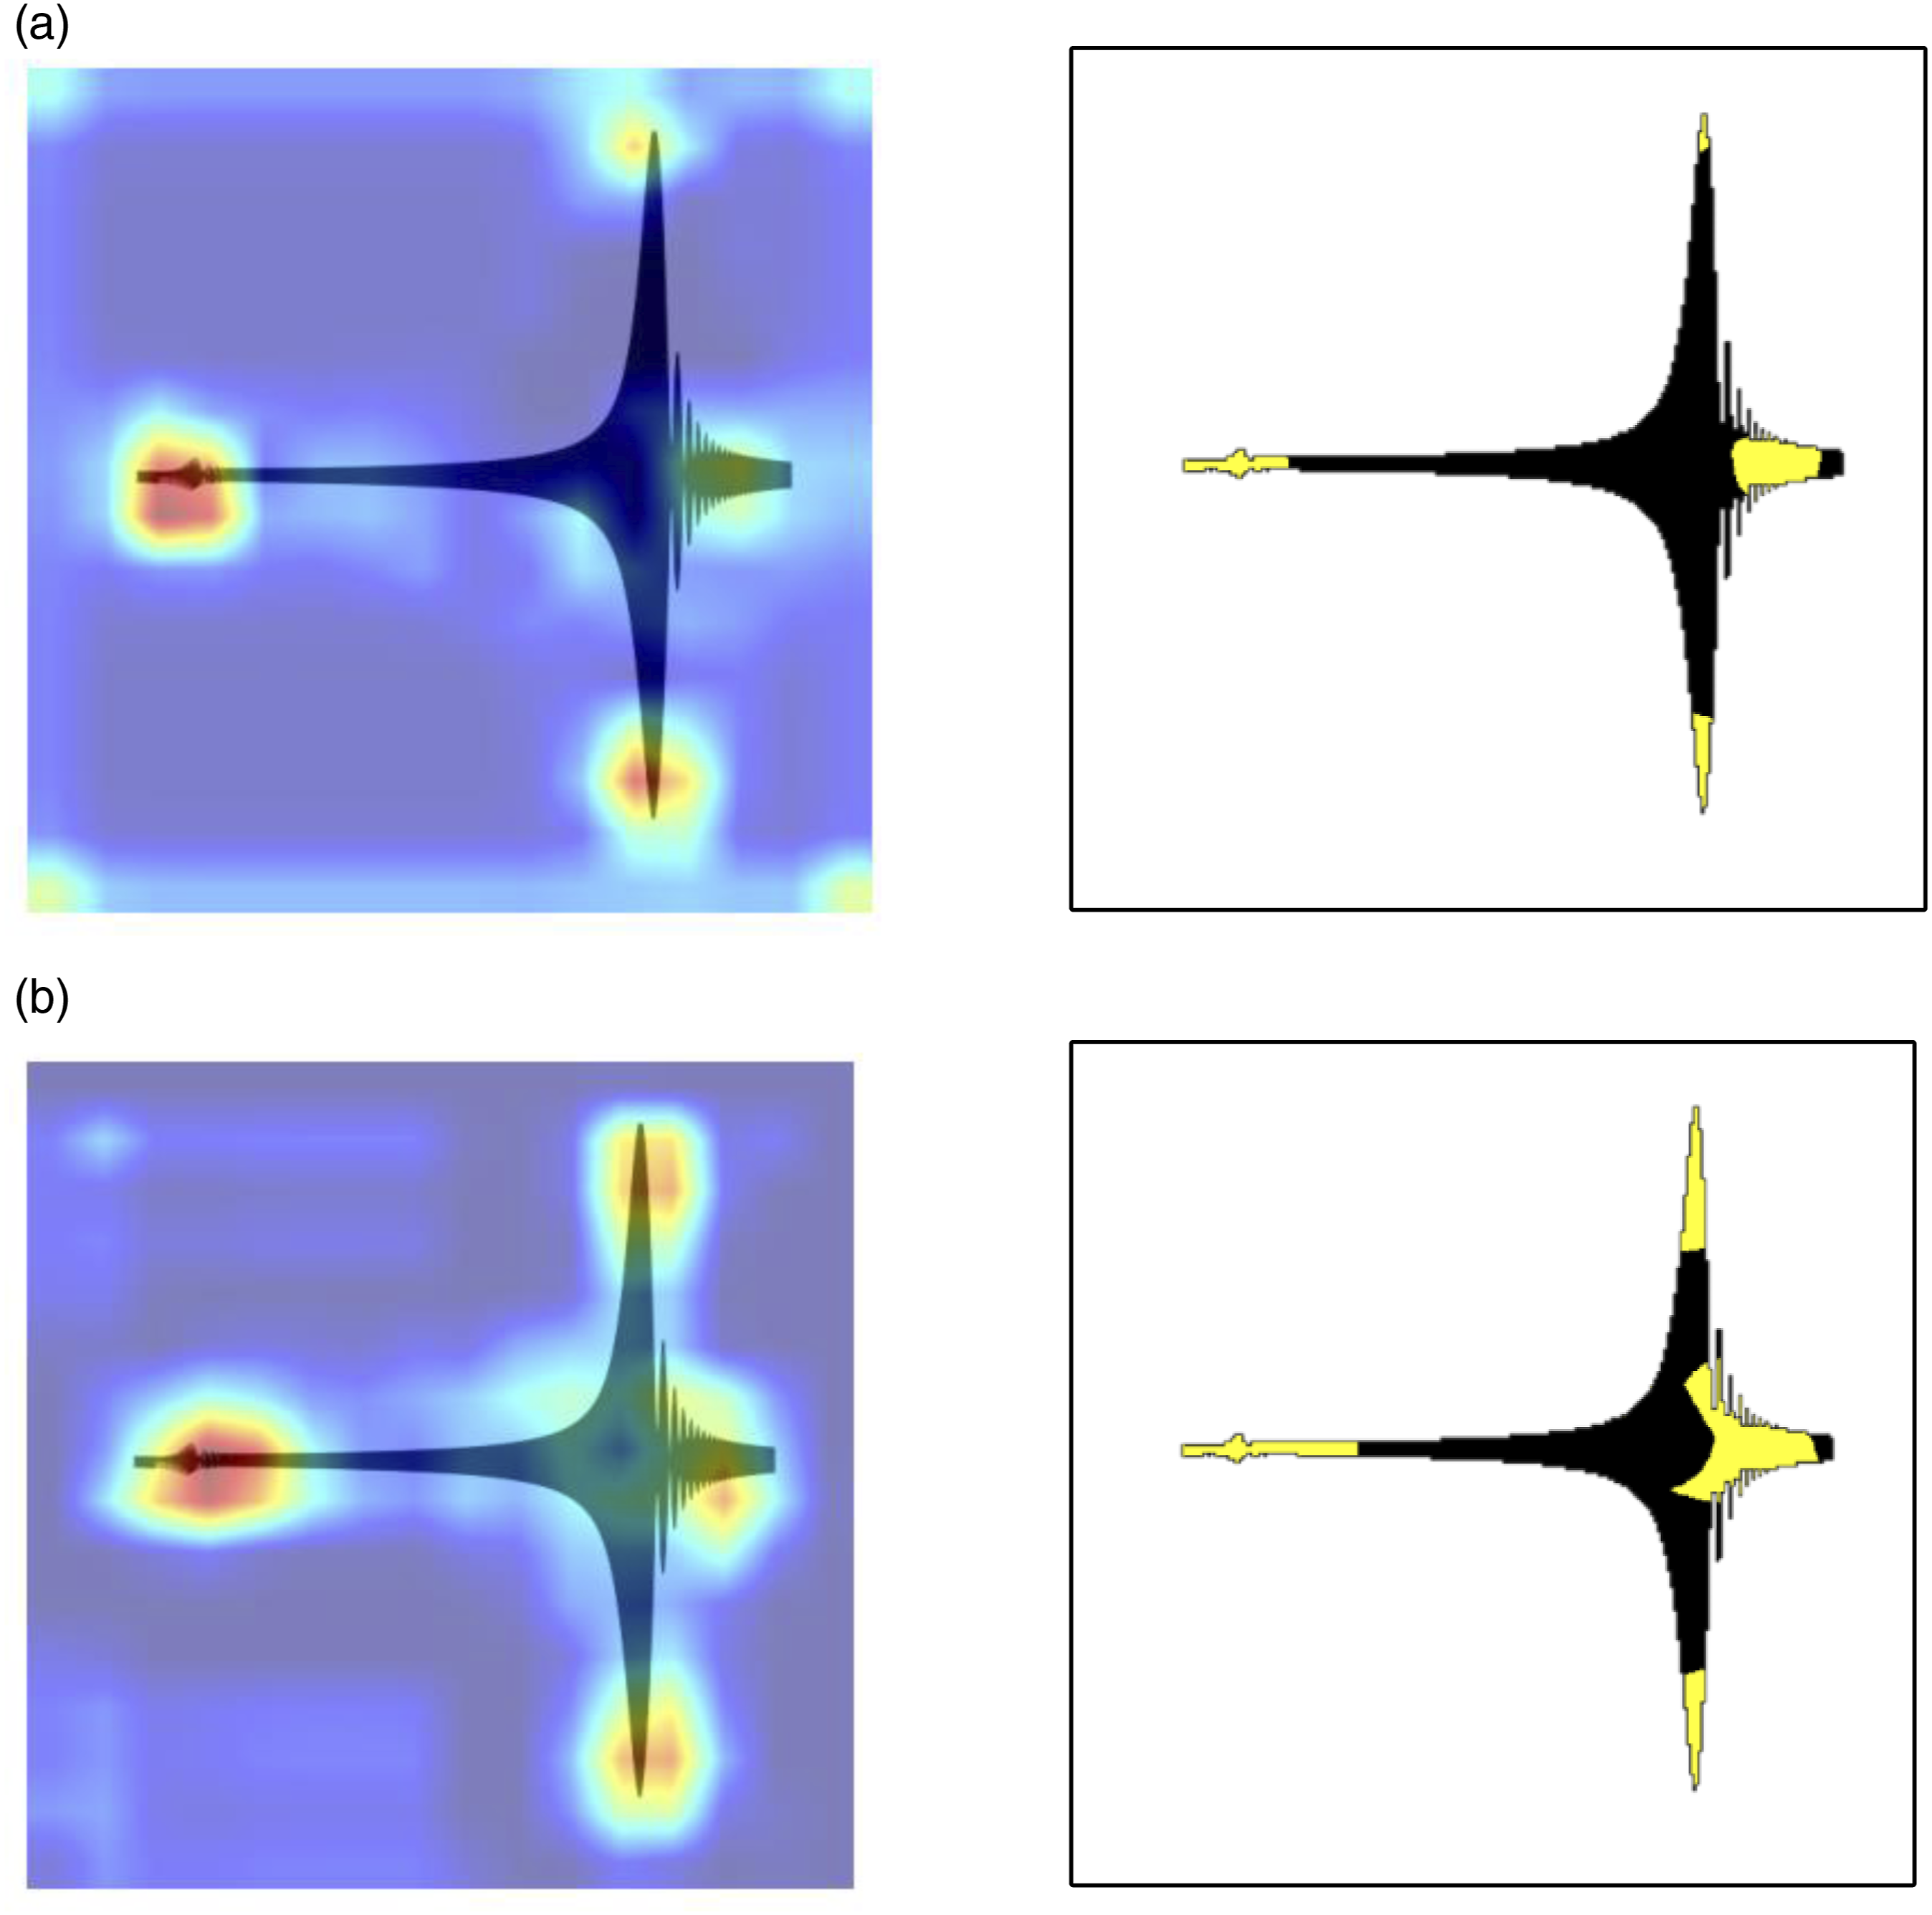
Classification and IoU results of BladeNet and BladeNet-AM.
Certainly, there exist numerous network architectures 56 that could potentially be suitable for crack classification and recognition in envelope diagrams. In this work, we have designed a preliminary CNN network structure that achieves accurate crack identification with a certain level of interpretability in the analysis results. To further improve recognition speed and optimize network storage in future researches, it is advisable to explore and experiment with a variety of advanced network frameworks.
Comparison between BladeNet-AM and frequency identification methods
To further demonstrate the superiority of the crack identification method proposed in this paper, the proposed BladeNet-AM based envelope diagram classification method and the traditional crack identification method based on natural frequency are compared in this subsection.
In BTT measurements, there are numerous methods to determine the natural frequencies of blades. However, classical methods such as the Circumferential Fourier Fitting Algorithm 57 and sparse representation theory-based methods18,19 require the use of more than three probes, and their accuracy significantly decreases under strong noise interference (e.g., SNR<0). Therefore, as demonstrated by the conclusions in Section 4.2, the method proposed in this paper exhibits significant advantages over the aforementioned two methods in identifying breathing cracks in blades.
The two parameter plot (2PP) method is a typical approach for blade frequency identification.
58
This method involves collecting dual-probe BTT signals within the resonance region during uniform acceleration or deceleration of the bladed disk, and subsequently fitting these signals to an elliptical curve to determine the engine order of the test blade. The blade’s natural frequency can be calculated from its rotational frequency in the resonance region:
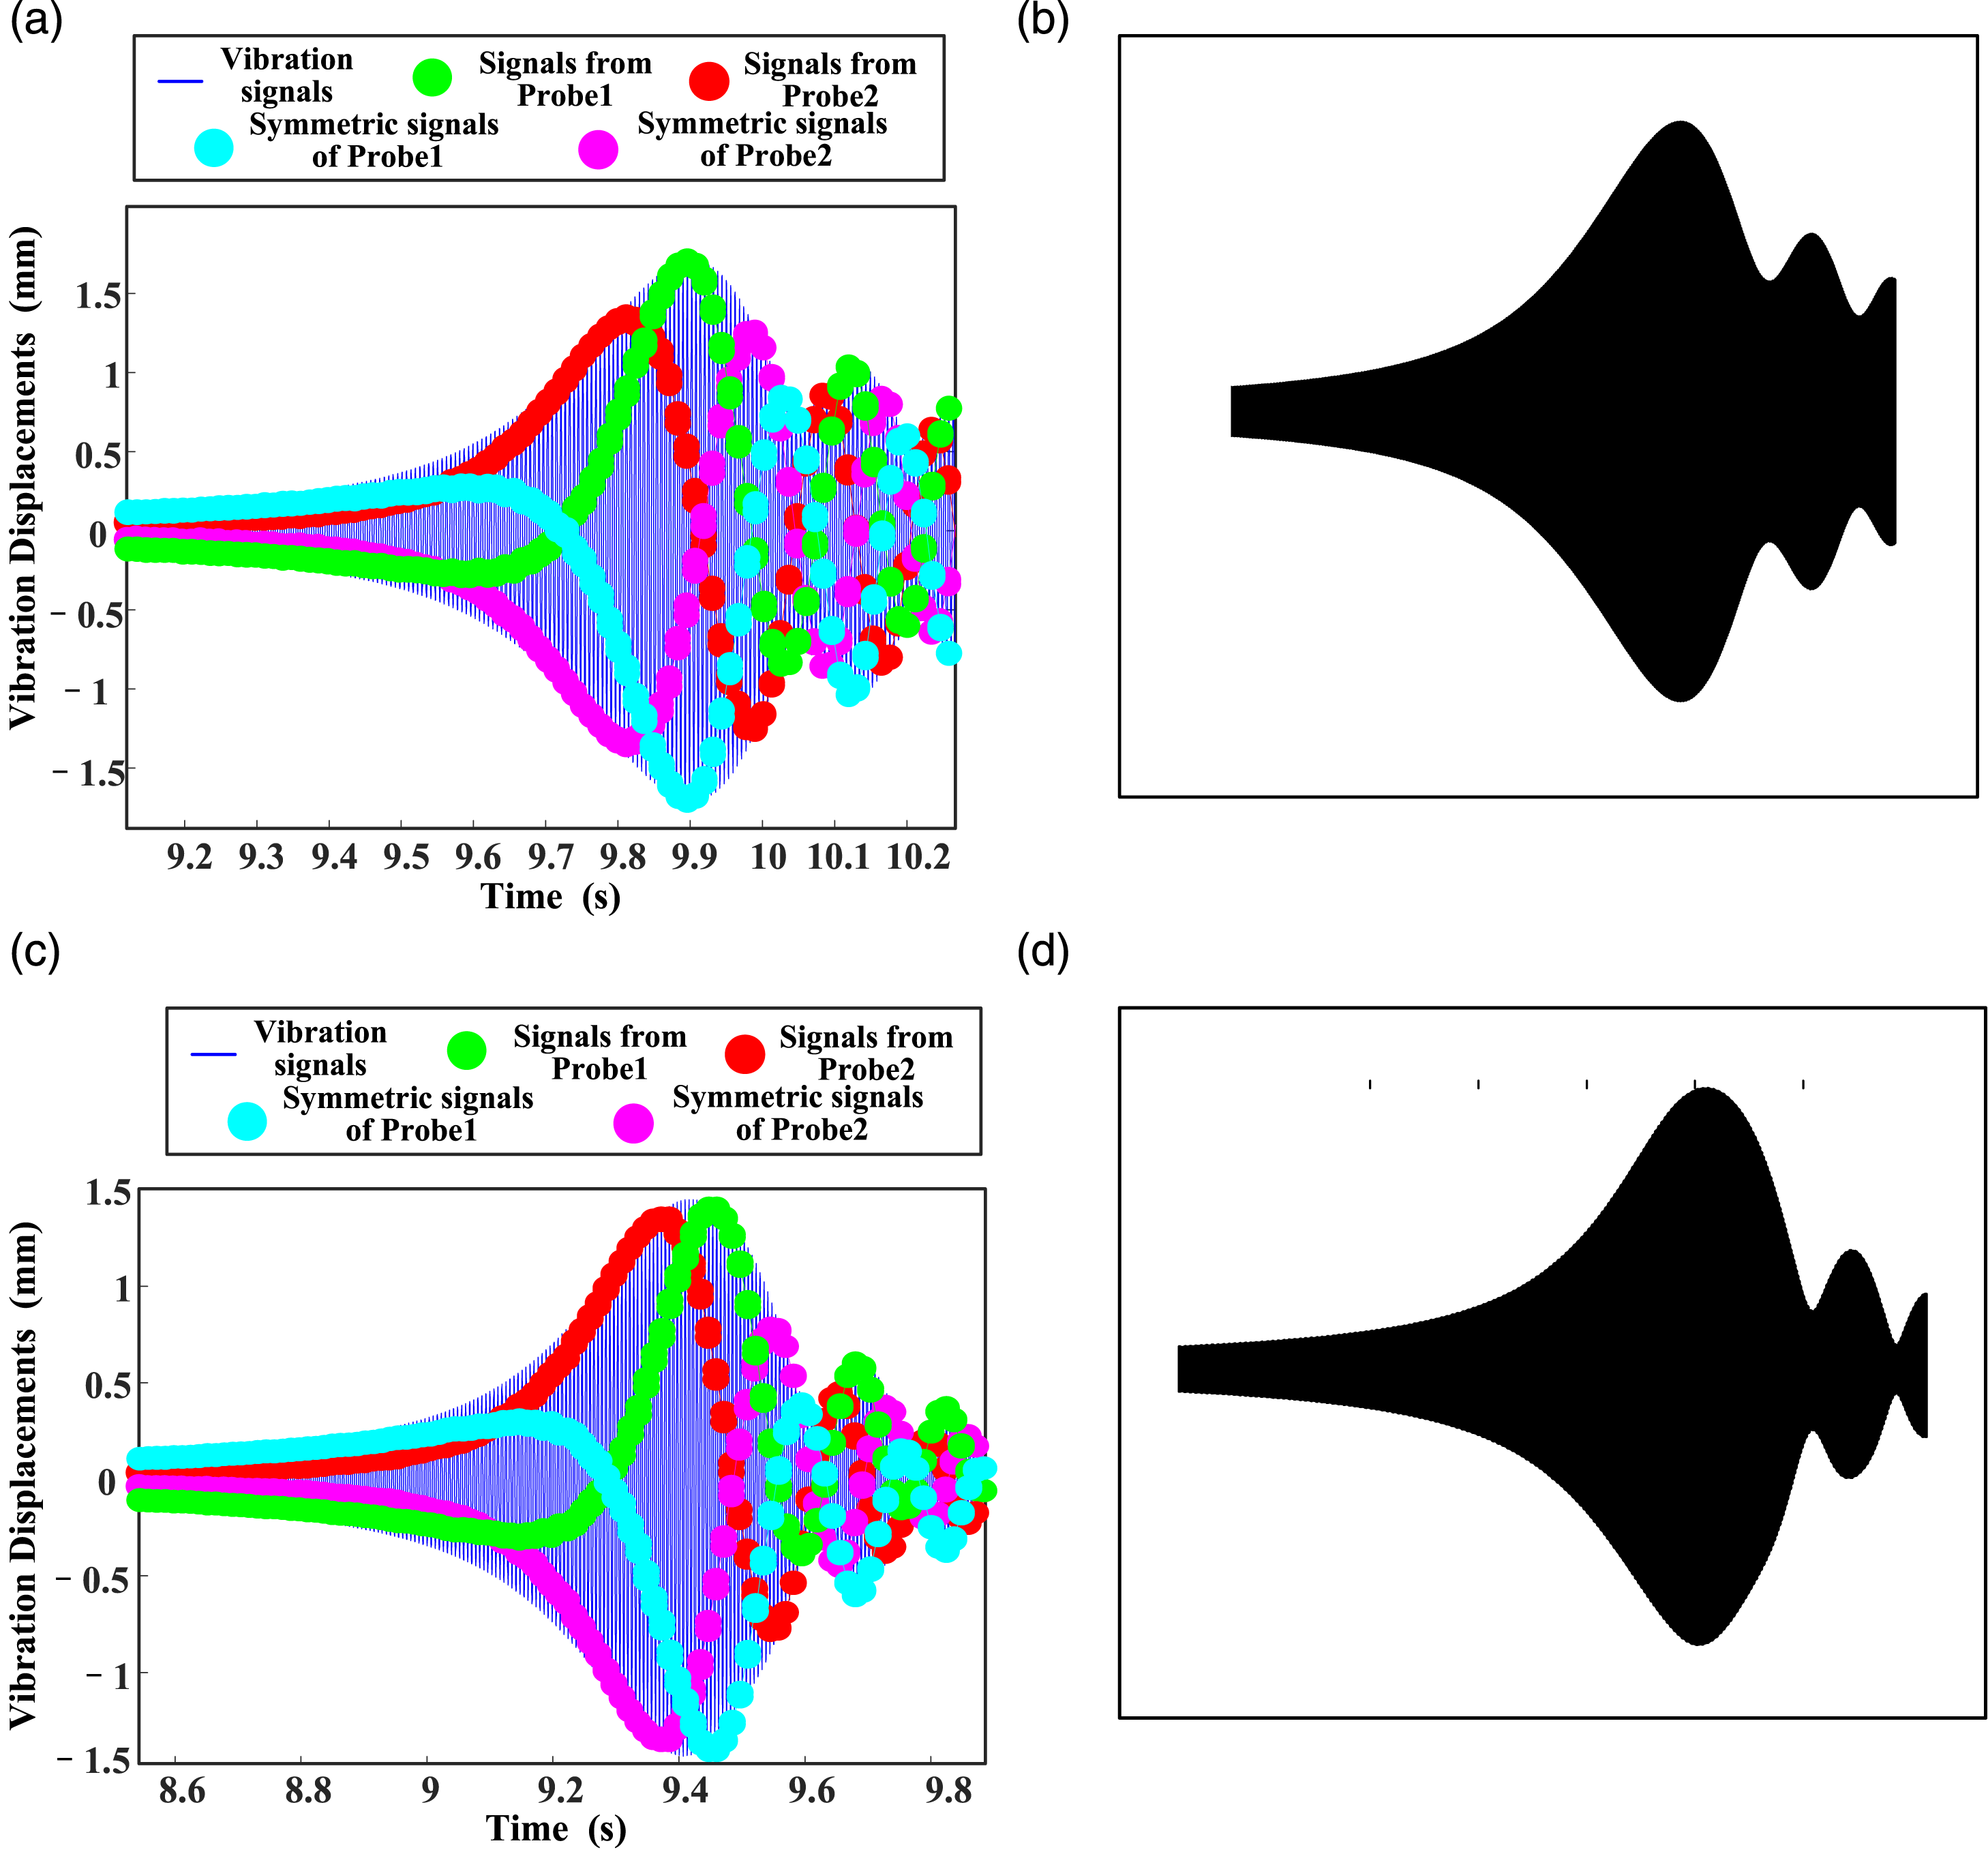
Since 2PP and the proposed method have different requirement of installation angles of two sensors, relative angles of measurement probes are selected as Δα1 = 0.02π and Δα2 = 0.4π respectively. Simulated BTT data for two methods are collected from all the test blade samples listed in Table 1. Resonance frequencies of all the samples are calculated by 2PP method. Meanwhile, envelope diagrams of samples are generated and classified by BladeNet-AM model. Taking intact and cracked carbon steel blade (crack depth ratio hc/h = 0.1) for example, Figure 22 shows that the decline of resonance frequency is 7.53 Hz, and Figure 23 shows that the outputs of the trained network identify crack fault of the blade. Two parameter plot (2PP) based frequency identification method (a) Signals from two sensors (Intact blade) (b) Ellipse from two BTT signals (EO = 3) (c) Signals from two sensors (Cracked Blade with crack depth ratio hc/h = 0.1) (d) Ellipse from two BTT signals (EO = 3). Crack identification via BladeNet-AM:(a) Dual-probe BTT scatter plot of intact blade; (b) Envelope diagram in resonance region of intact blade; (c) Dual-probe BTT scatter plot for cracked blade (hc/h = 0.1); (d) Envelope diagram in resonance region of cracked blade (hc/h = 0.1).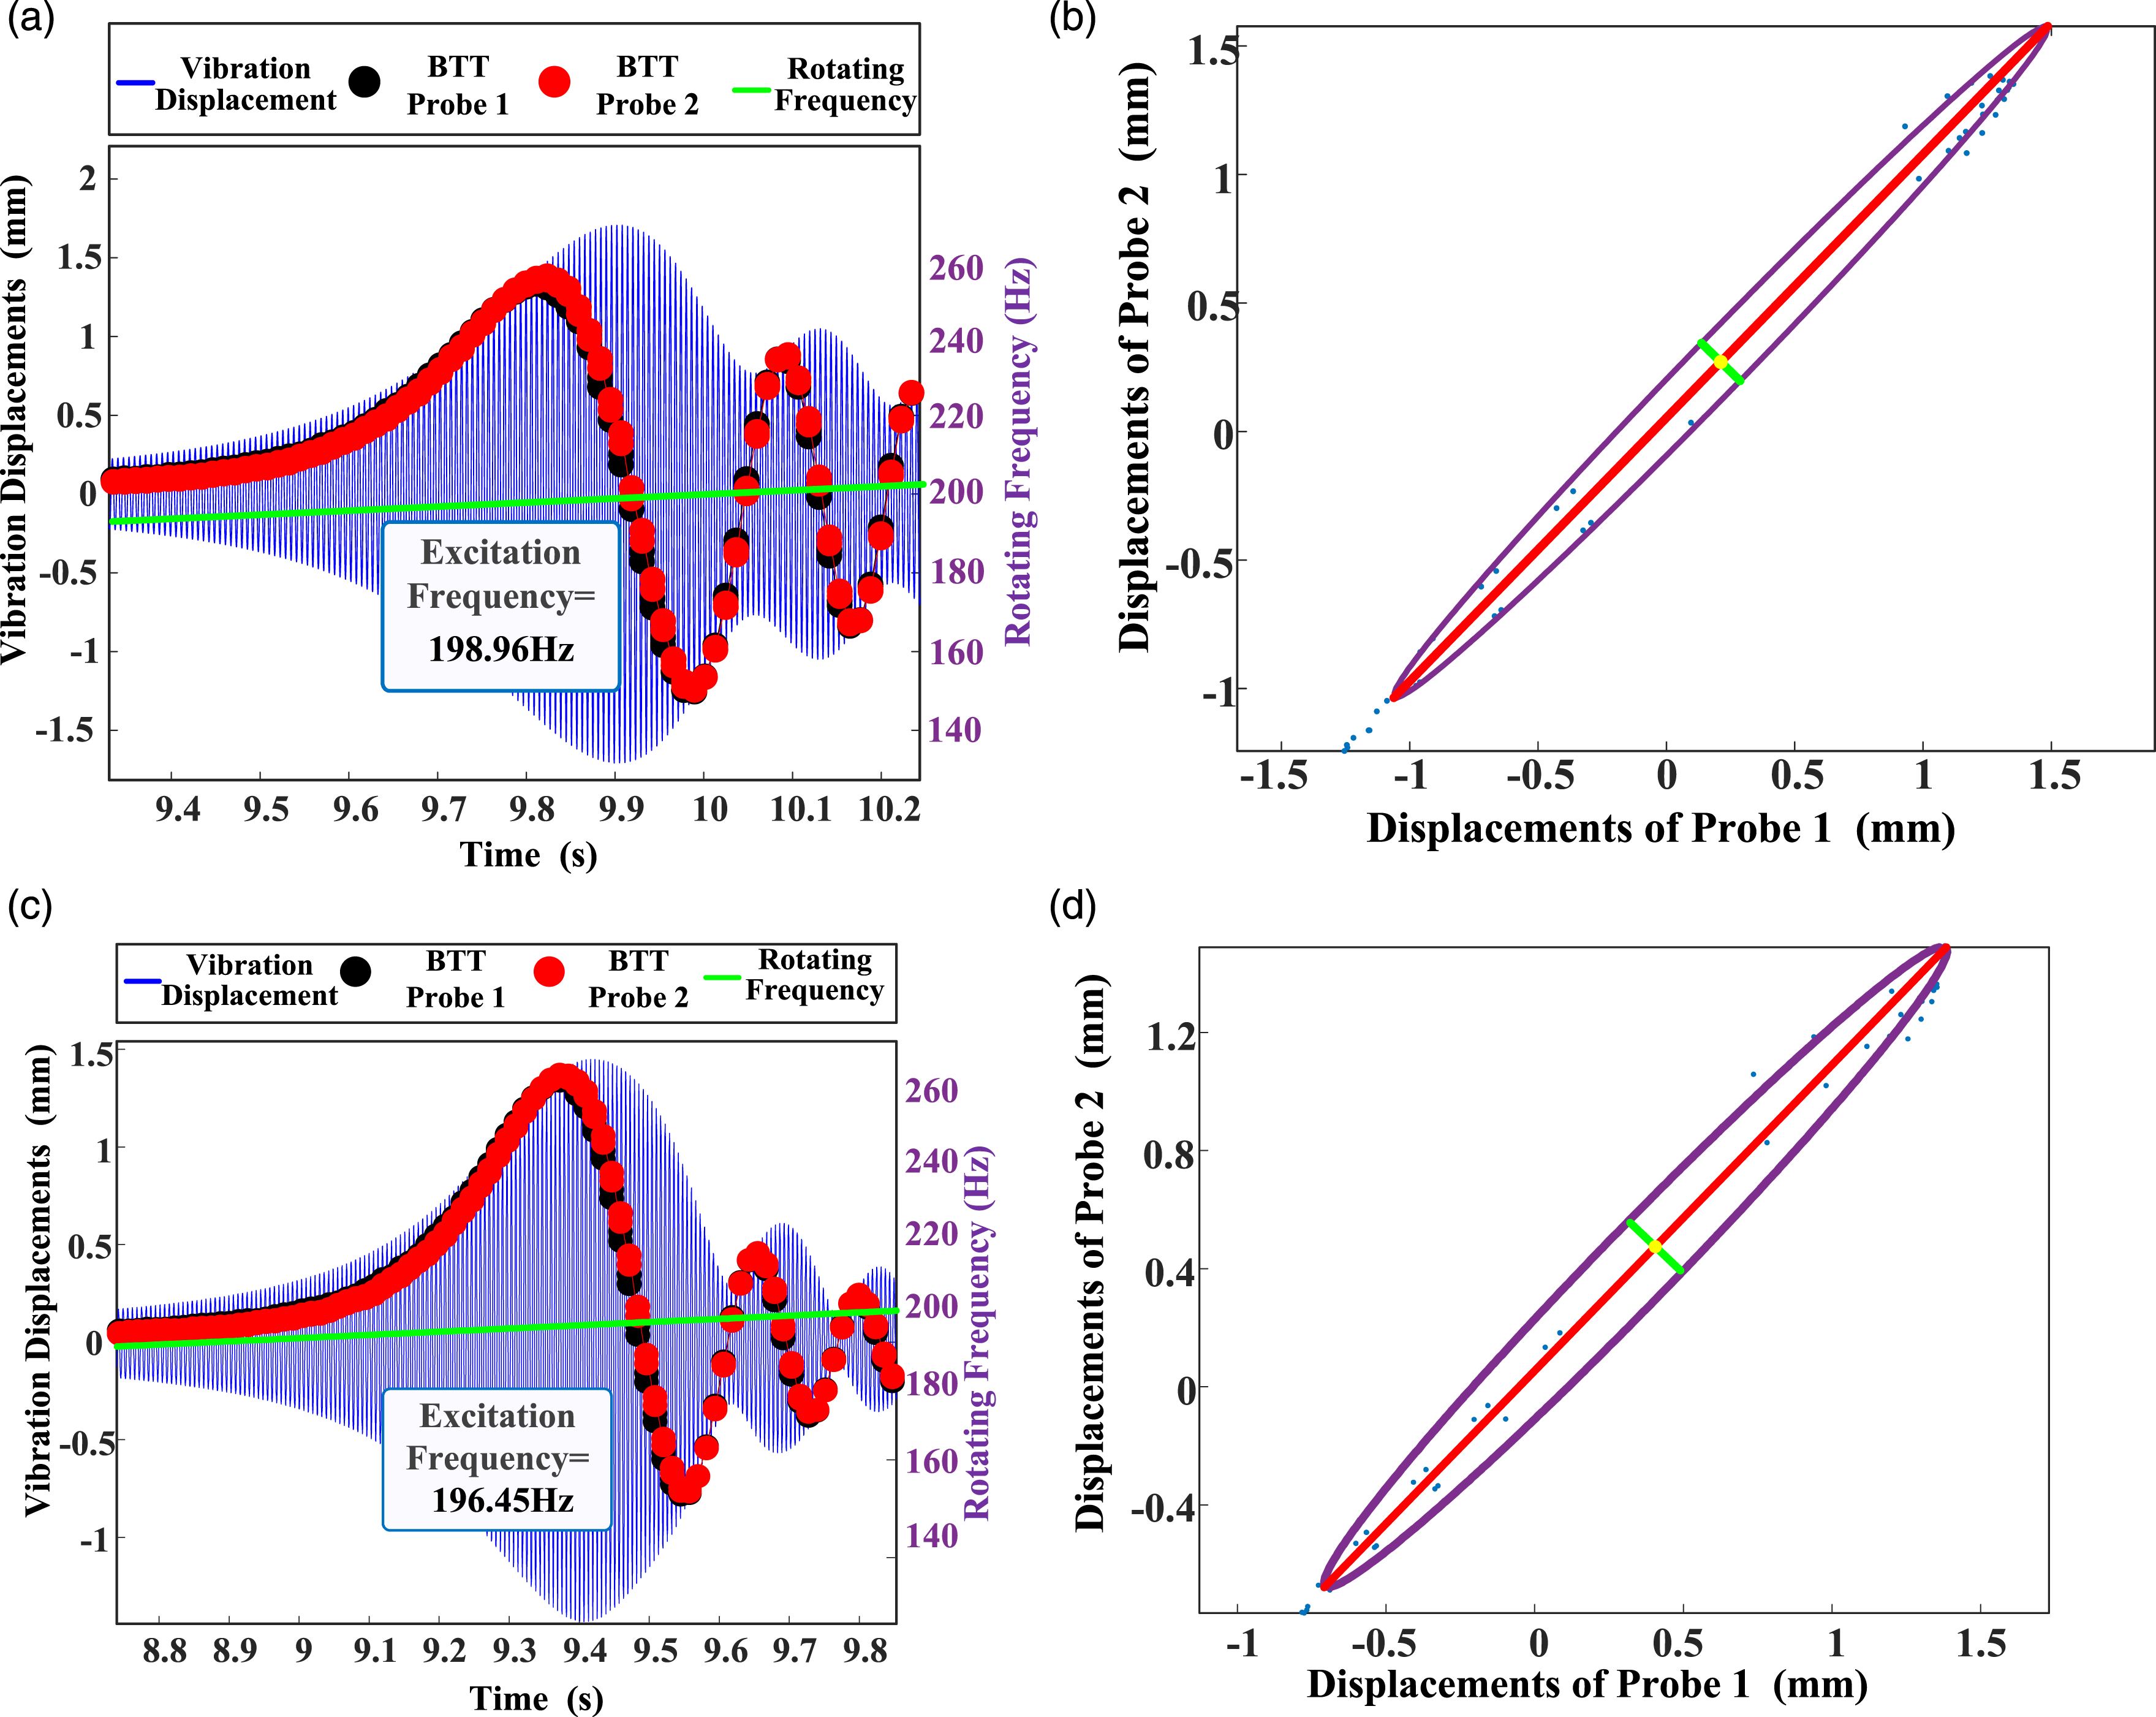
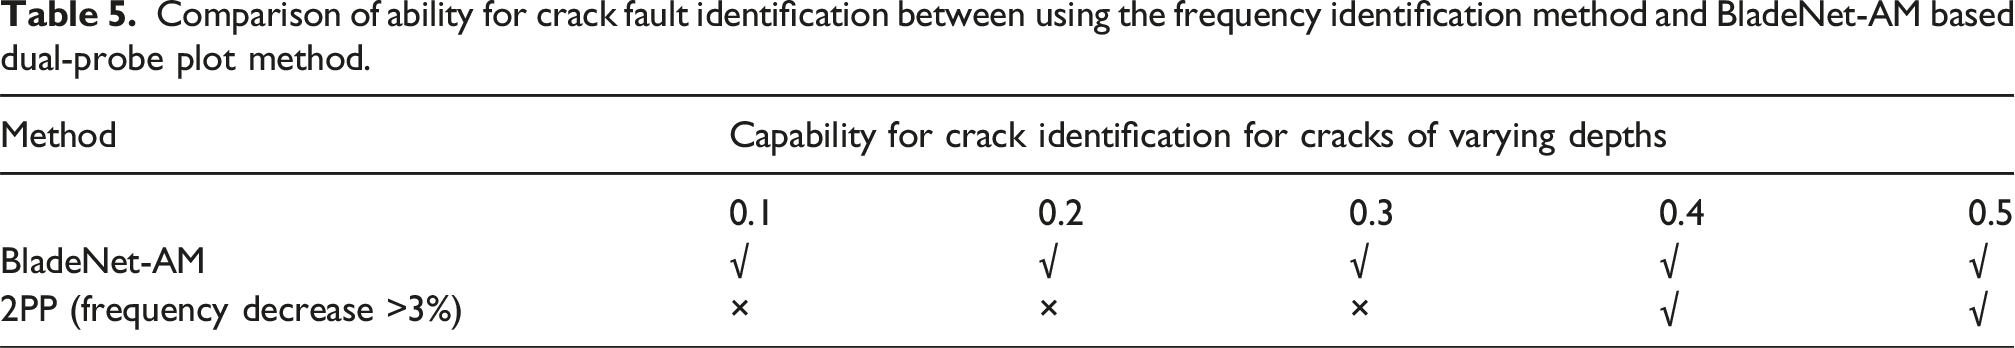
Theoretical analyses indicate that cracks reduce blade natural frequencies.1,9 However, considering the mistuning phenomenon among blades, differences in frequencies among blades are inevitable. If the difference in resonance frequencies calculated by the 2PP method is less than 3% compared to those of intact blades with the same parameters, the blades can hardly be deemed as having crack damage. 16 For tiny breathing cracks, natural frequency changes are indistinguishable, especially in engineering applications. Thus, relying solely on the decrease in natural frequency as the criterion for crack damage will lead to an unconvincing conclusion.
The BladeNet-AM model-based method, on the other hand, determines crack presence in blades by classifying the output of its trained network, which analyzes input envelope diagrams of crack samples. Compared with the discrimination method based on natural frequency, the envelope diagram image contains more extensive nonlinear information caused by cracks.
Comparison of ability for crack fault identification between using the frequency identification method and BladeNet-AM based dual-probe plot method.
Experimental verification
Experiment description
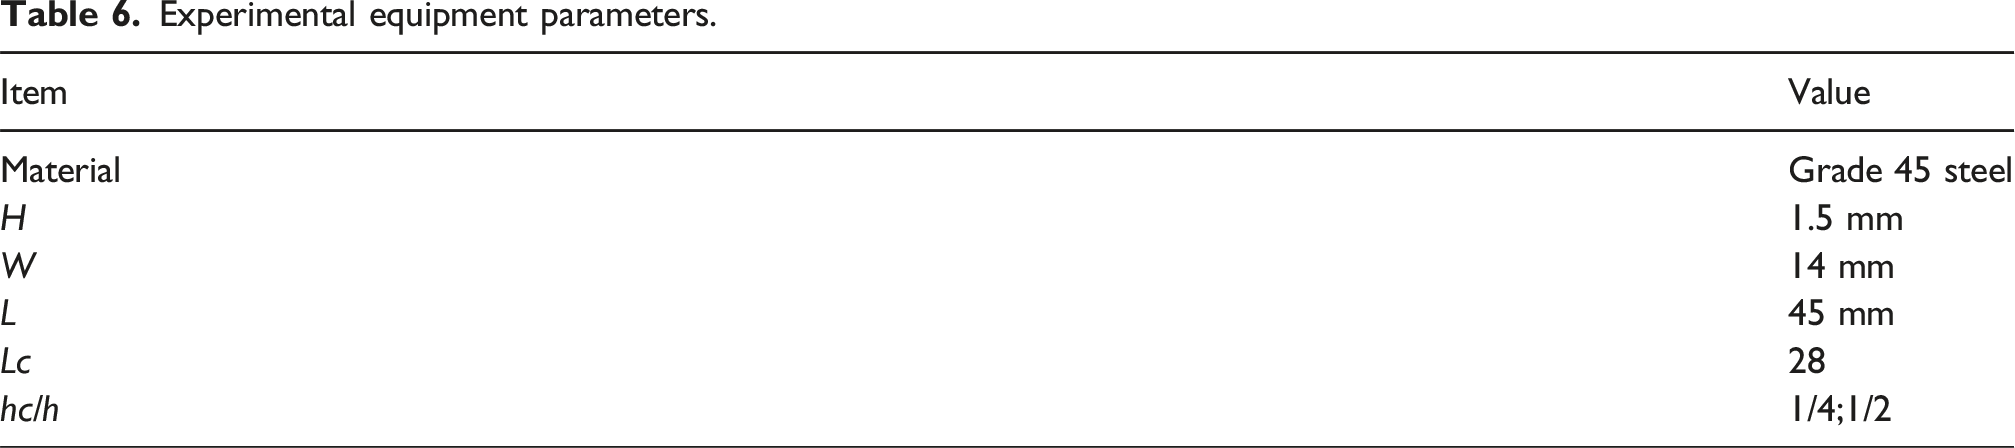
The installation of the test rig is shown in Figure 24(a), and the blade parameters selected for the experiment are described in Table 6. For the rotating blade, the breathing crack is simulated with the same method proposed in Section 2.3. The breathing crack is modeled by the equivalent contact interface surface 1 as shown in Figure 24(b). Two magnets are fixed on the casing to increase the exciting force during the rotation of the blade. Two blade tip timing probes with an interval angle of approximately 40° are arranged on the casing to measure vibration displacements of all the blades. Additionally, strain gauges are attached to the blade with breathing crack and an intact blade respectively to compare the vibration response of the blades during rotation. The strain was captured using DH5908 N, with a sampling frequency of 50,000 Hz. Experimental equipment (a) test rig (b) geometry of blade with breathing crack. Experimental equipment parameters.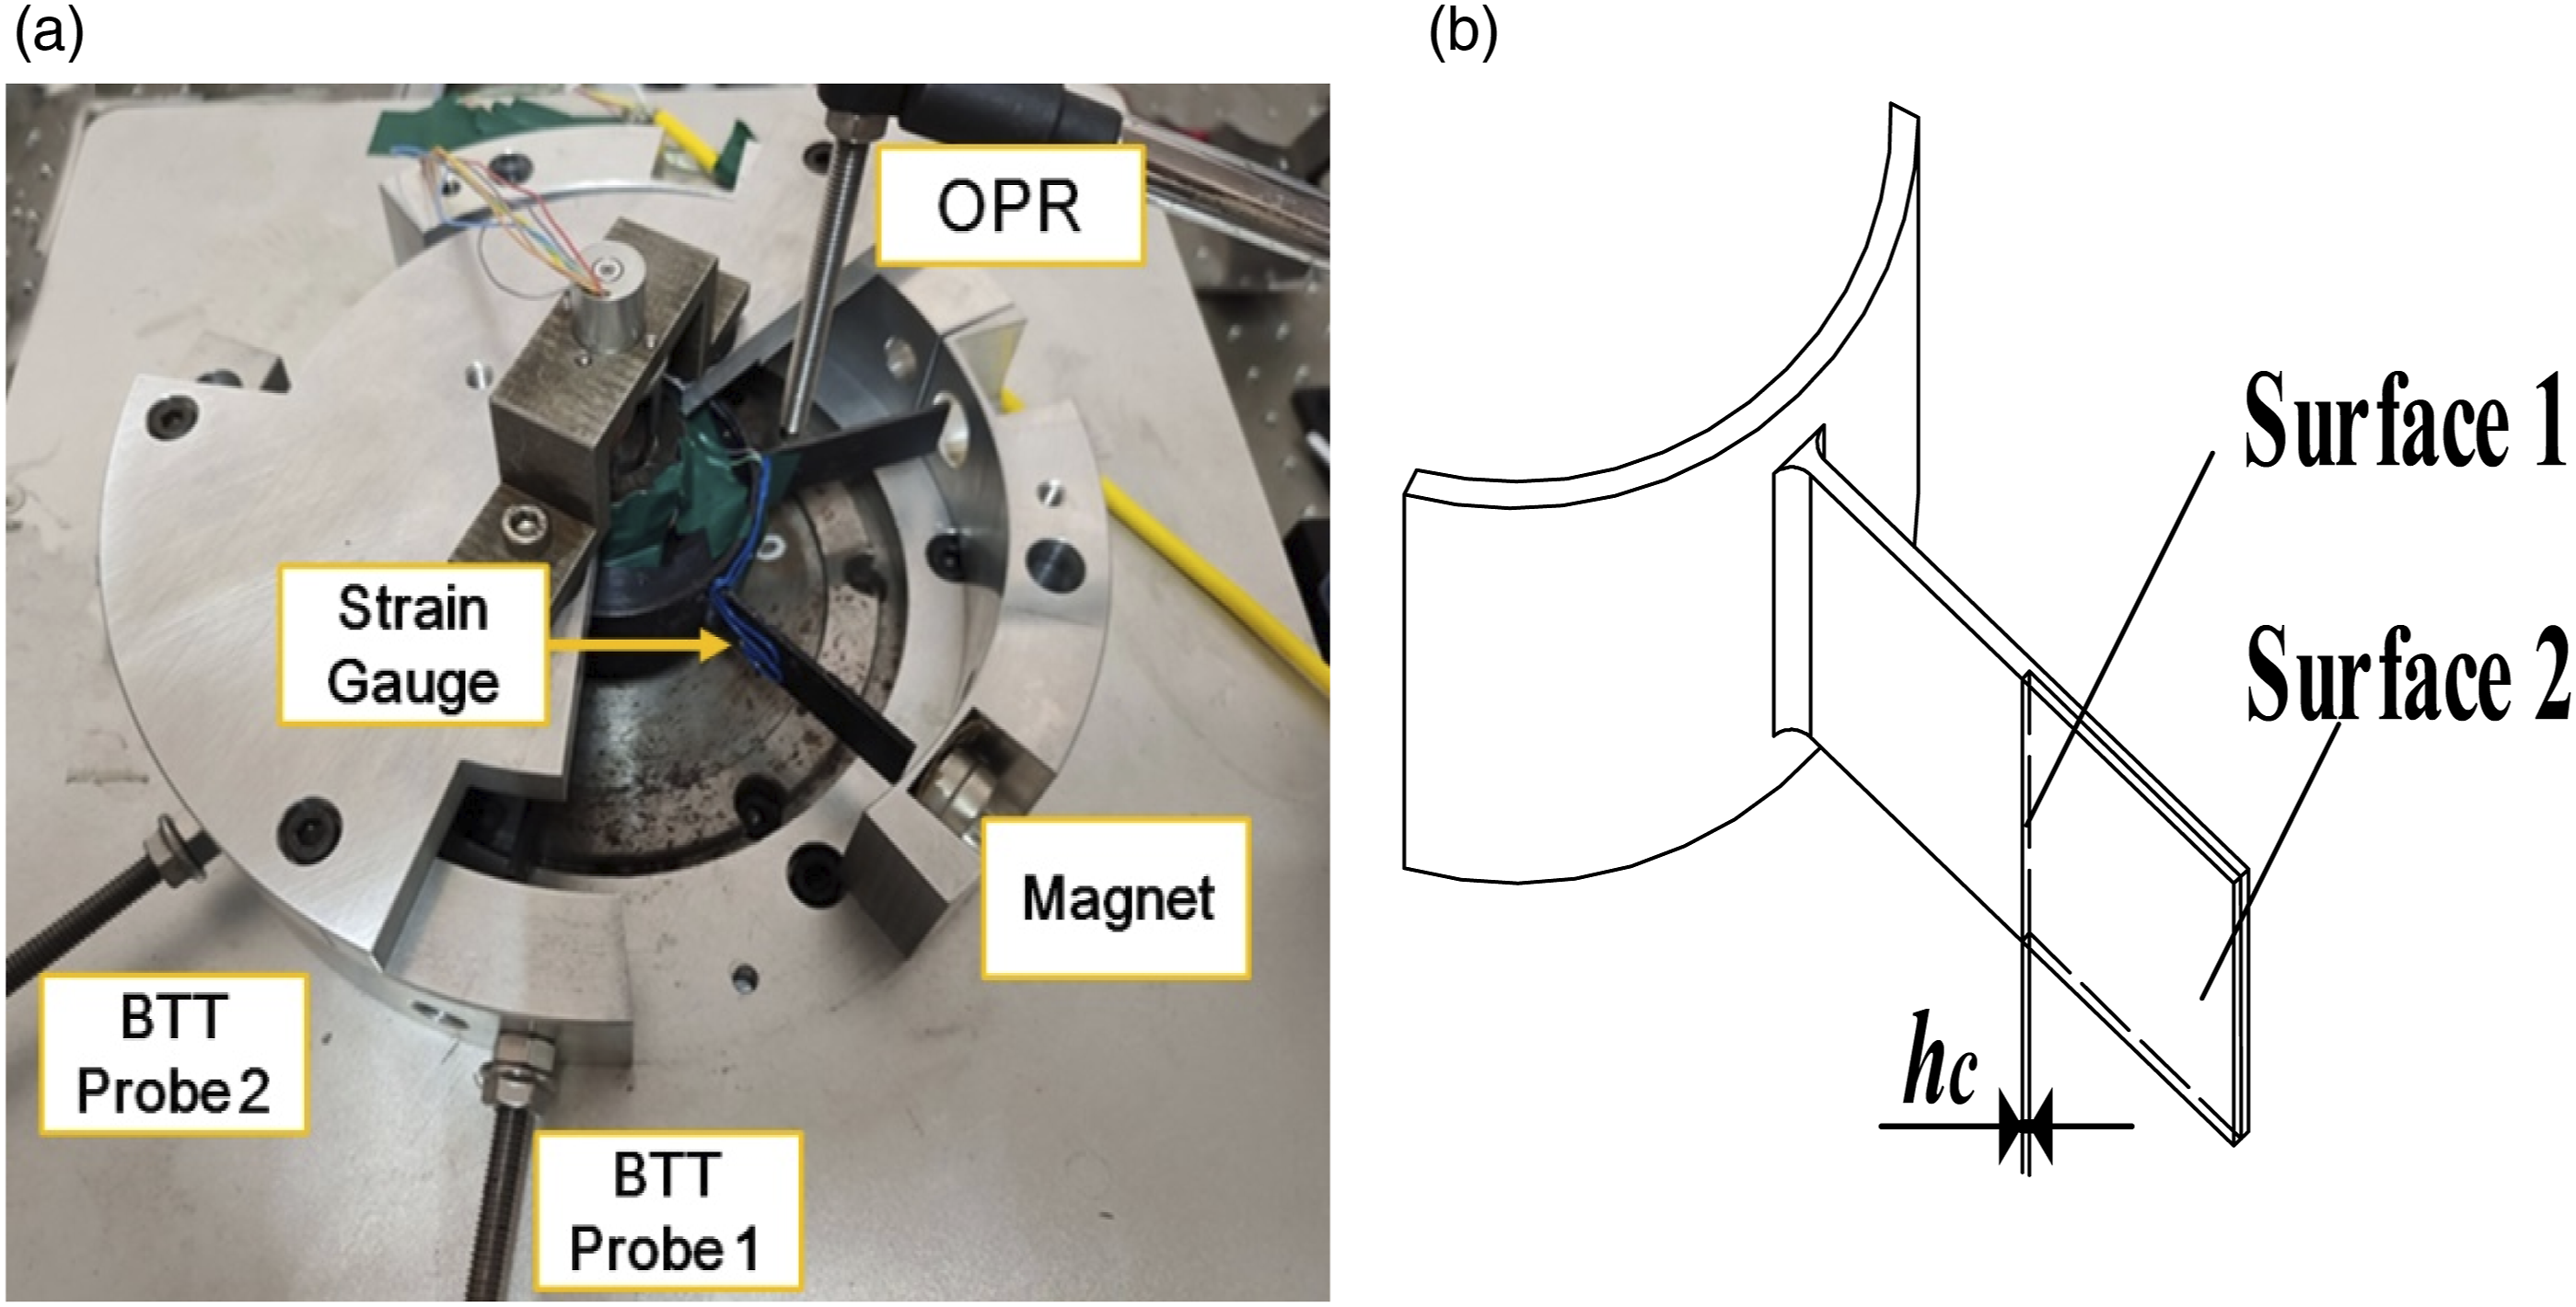
Two blade disks are manufactured: one blade features a crack with a depth ratio of 1/4, while the other blade has a crack with a depth ratio of 1/2. These disks are used to validate the proposed crack detection approach based on the envelope diagram. The blade tip vibration test was conducted independently for each blade disk during the rotation experiment. The experiment involved the use of a motor to rotate the blade disks in a uniform acceleration manner, accelerating from the stationary state to 3000 r/min.
Validation of crack detection method
First, ramp-up speed is applied to a blade disk with a crack depth ratio of 1/3 in the faulty blade. The resonance region of the blade was observed at around 2000 r/min. The BTT displacement signals and strain signals of the intact blade and the cracked blade were extracted in the resonance region simultaneously.
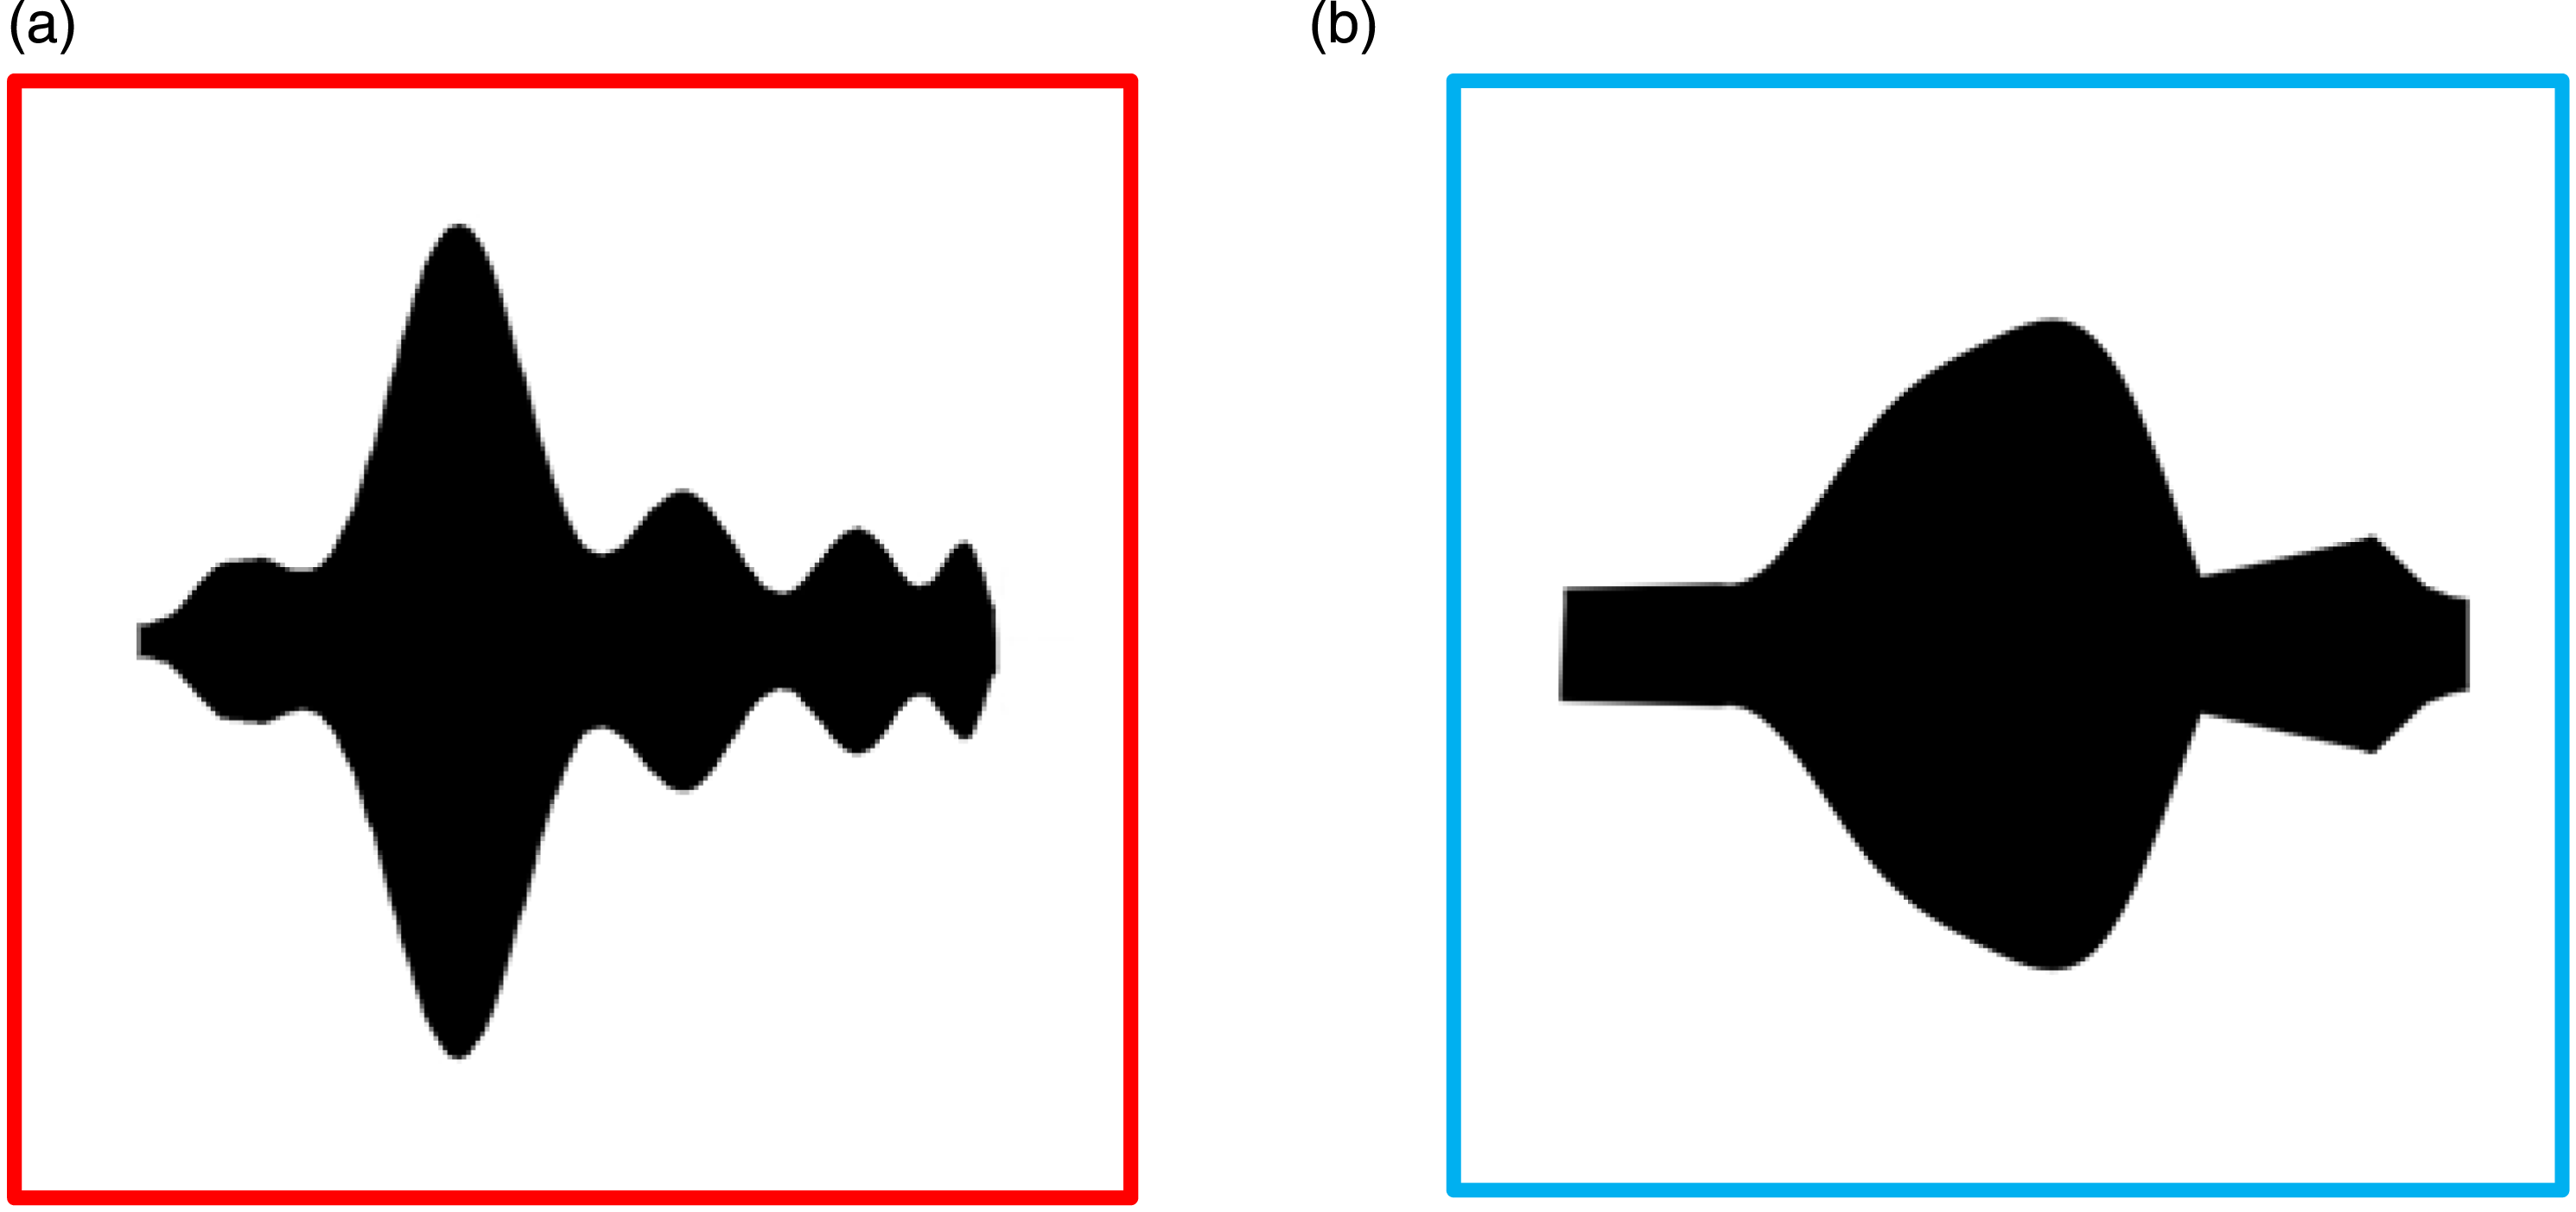
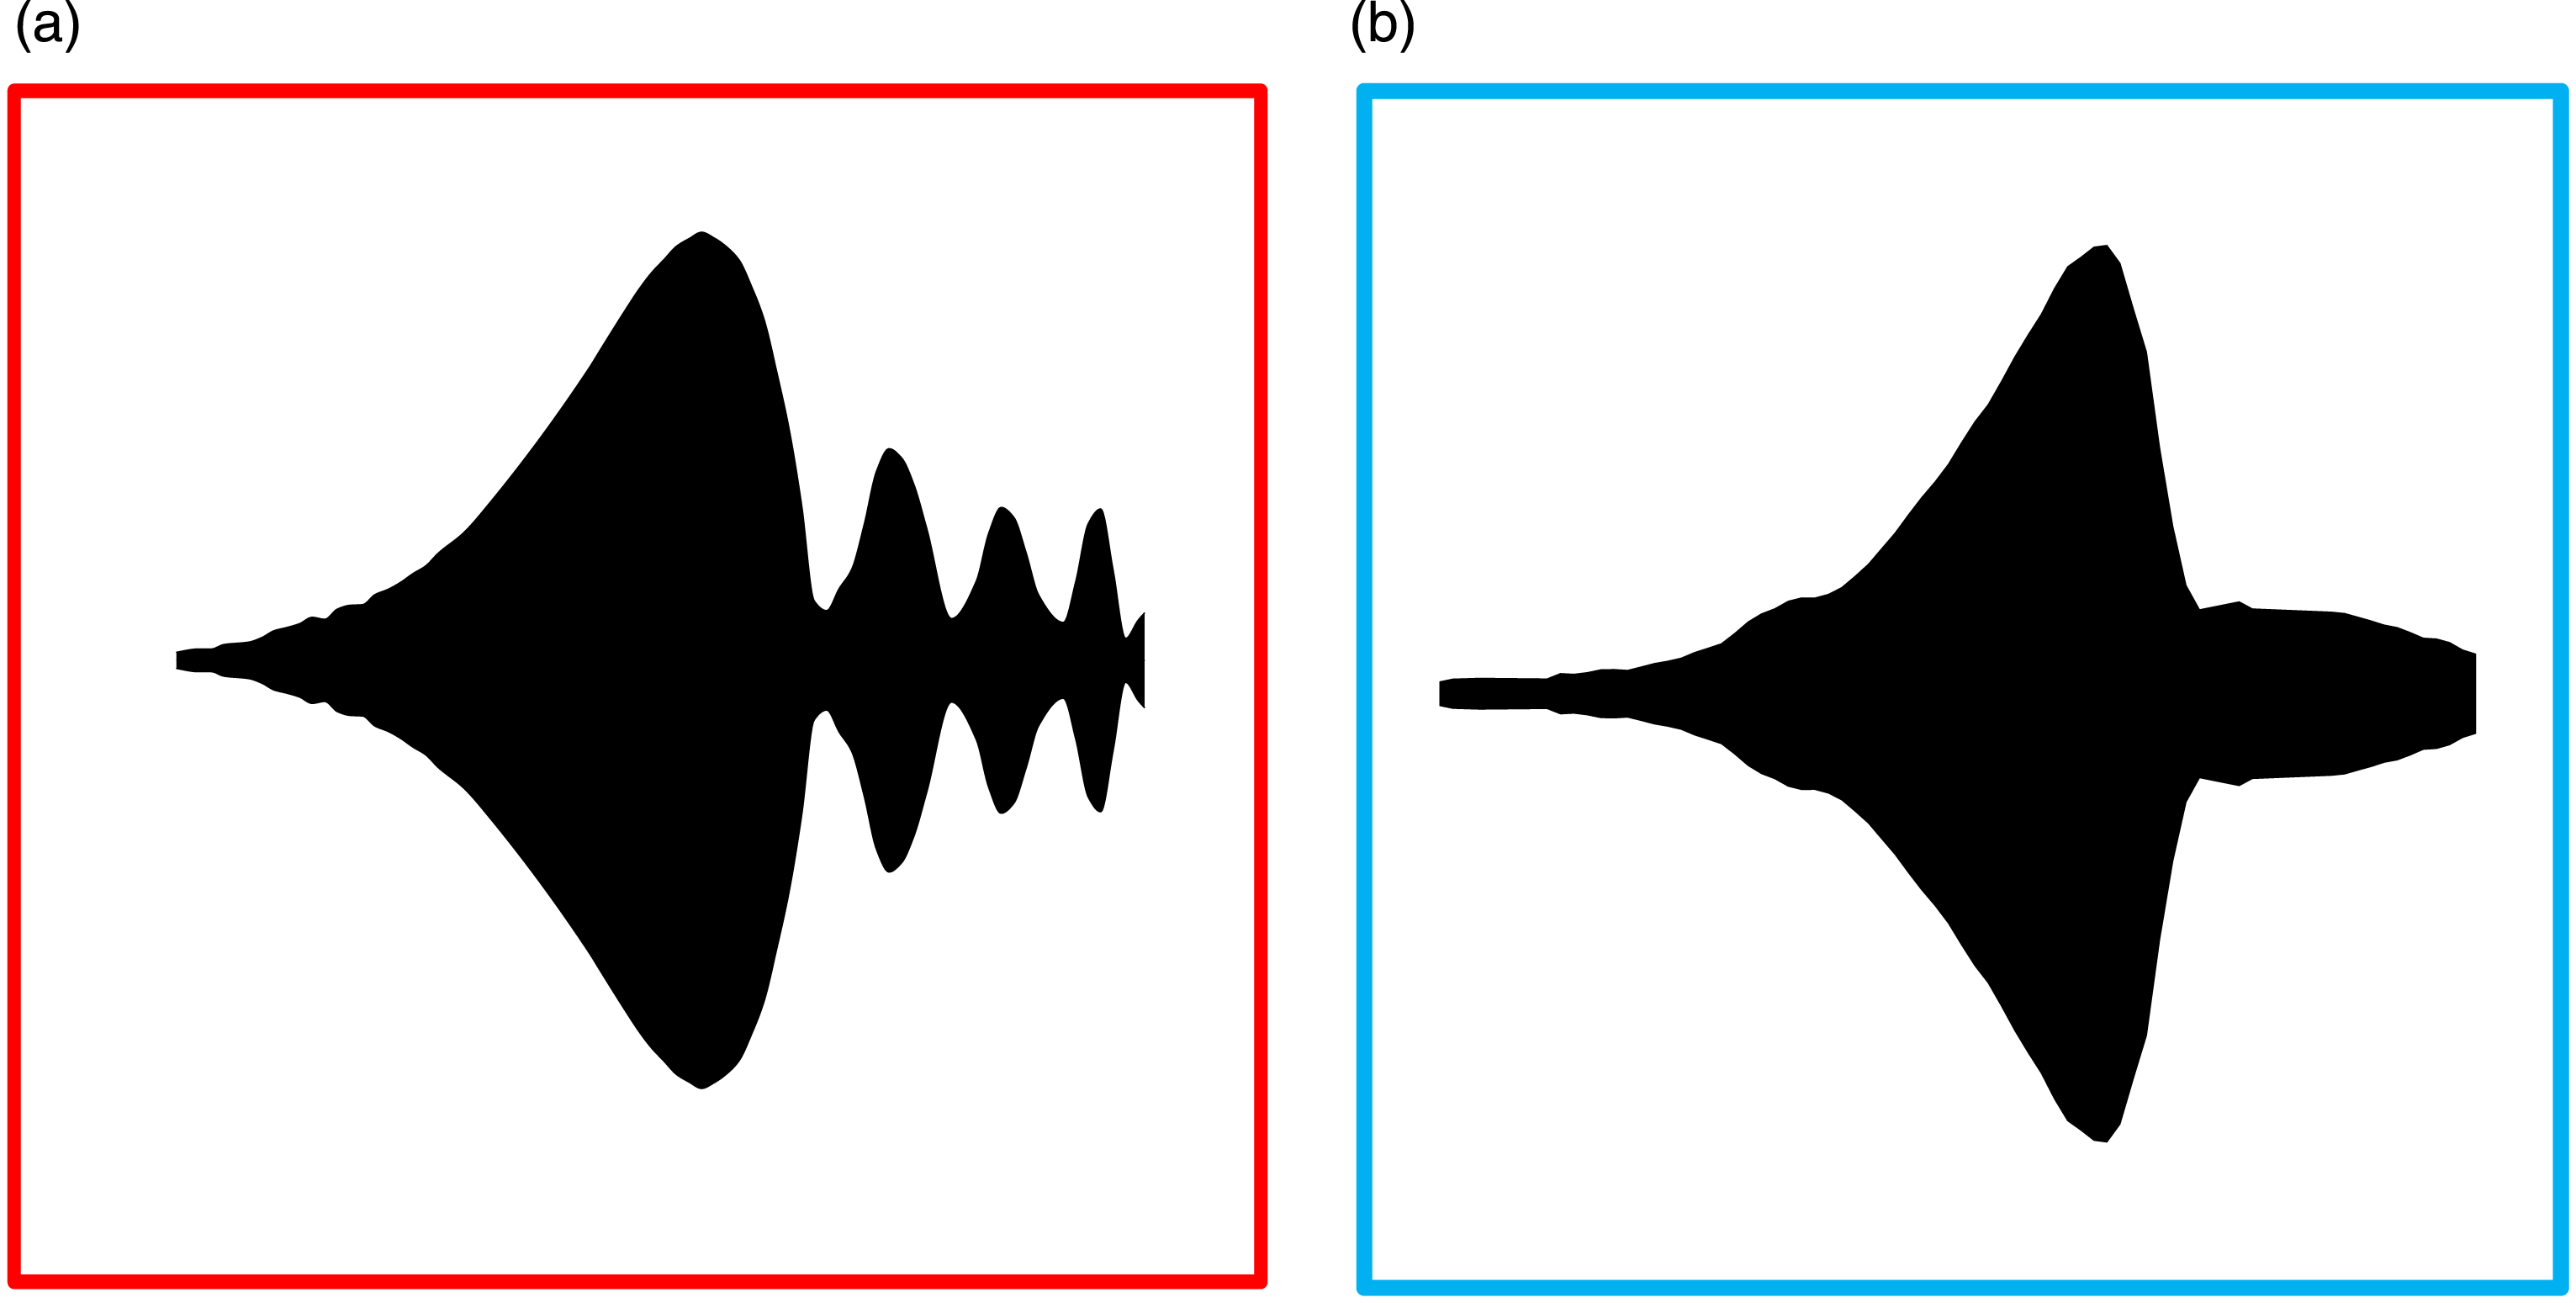
The blade tip displacements of the intact blade and the cracked blade sampled by BTT probes are plotted in Figure 25. For each blade, those tested displacement signals near the resonance region can be transformed into envelope diagrams by the proposed method as shown in Figure 26. The selection of time windows are denoted as boxed areas in Figure 25. The two sets of envelope diagrams were then input into the trained BladeNet-AM network, and the determination results for each diagram corresponded to the real condition of the testing blade. Thus, the proposed network in this paper is able to identify the blade condition corresponding to the envelope images. Blade vibration displacements measured by BTT in resonance regions (crack depth ration hc/h = 1/4). Envelope diagram of resonance regions for (a) Intact blade (b) Cracked blade (crack depth hc/h = 1/4).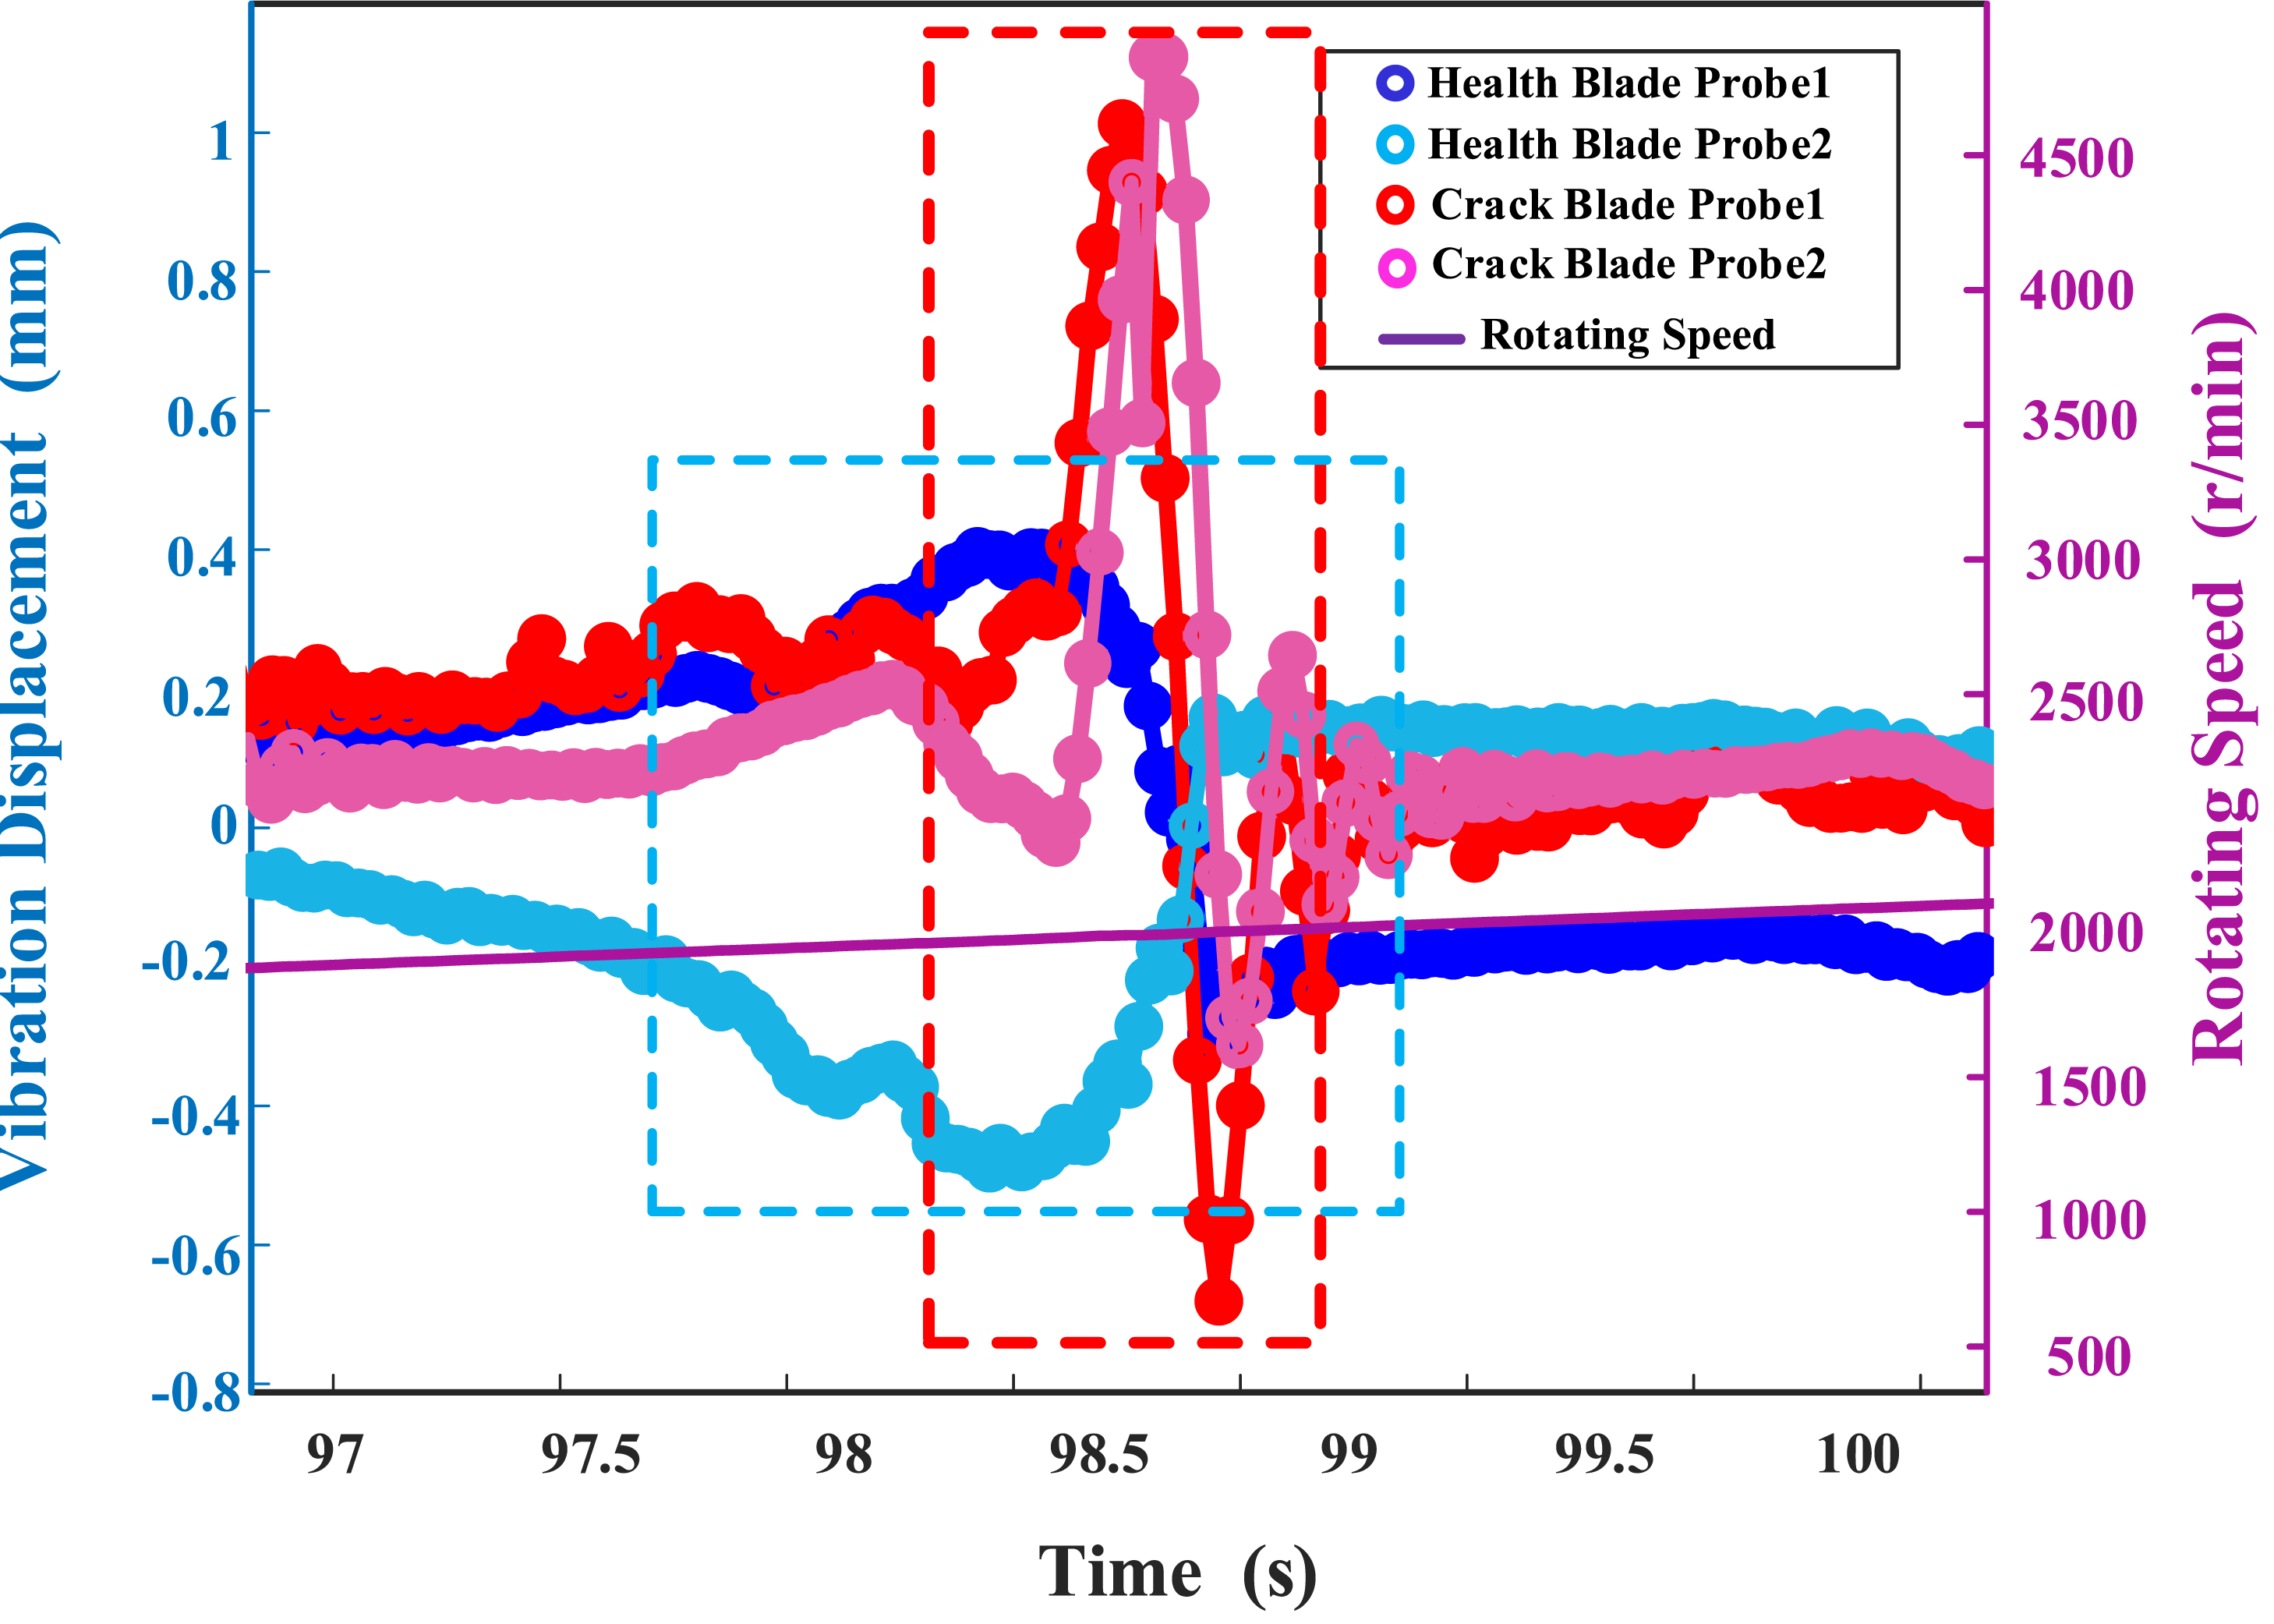
Concurrently, the strain vibration signals of the blade near the resonance region recorded by strain gauges are performed time–frequency analysis and converted into spectrograms. As illustrated in Figure 27, the resonance frequencies of intact blades and cracked blades can be obtained from the bright regions of the spectra. It should be noted that the dynamic system of blades with breathing cracks is nonlinear; hence, there does not exist a constant “natural frequency.” In order to align with the concept of “natural frequency” in traditional linear dynamics system theory, it is approximately assumed that the frequency corresponding to the maximum amplitude of the dynamic response represents the natural frequency. Time-frequency map of blade vibration strain signals: (a) Healthy blade; (b) Cracked blade (hc/h = 1/4).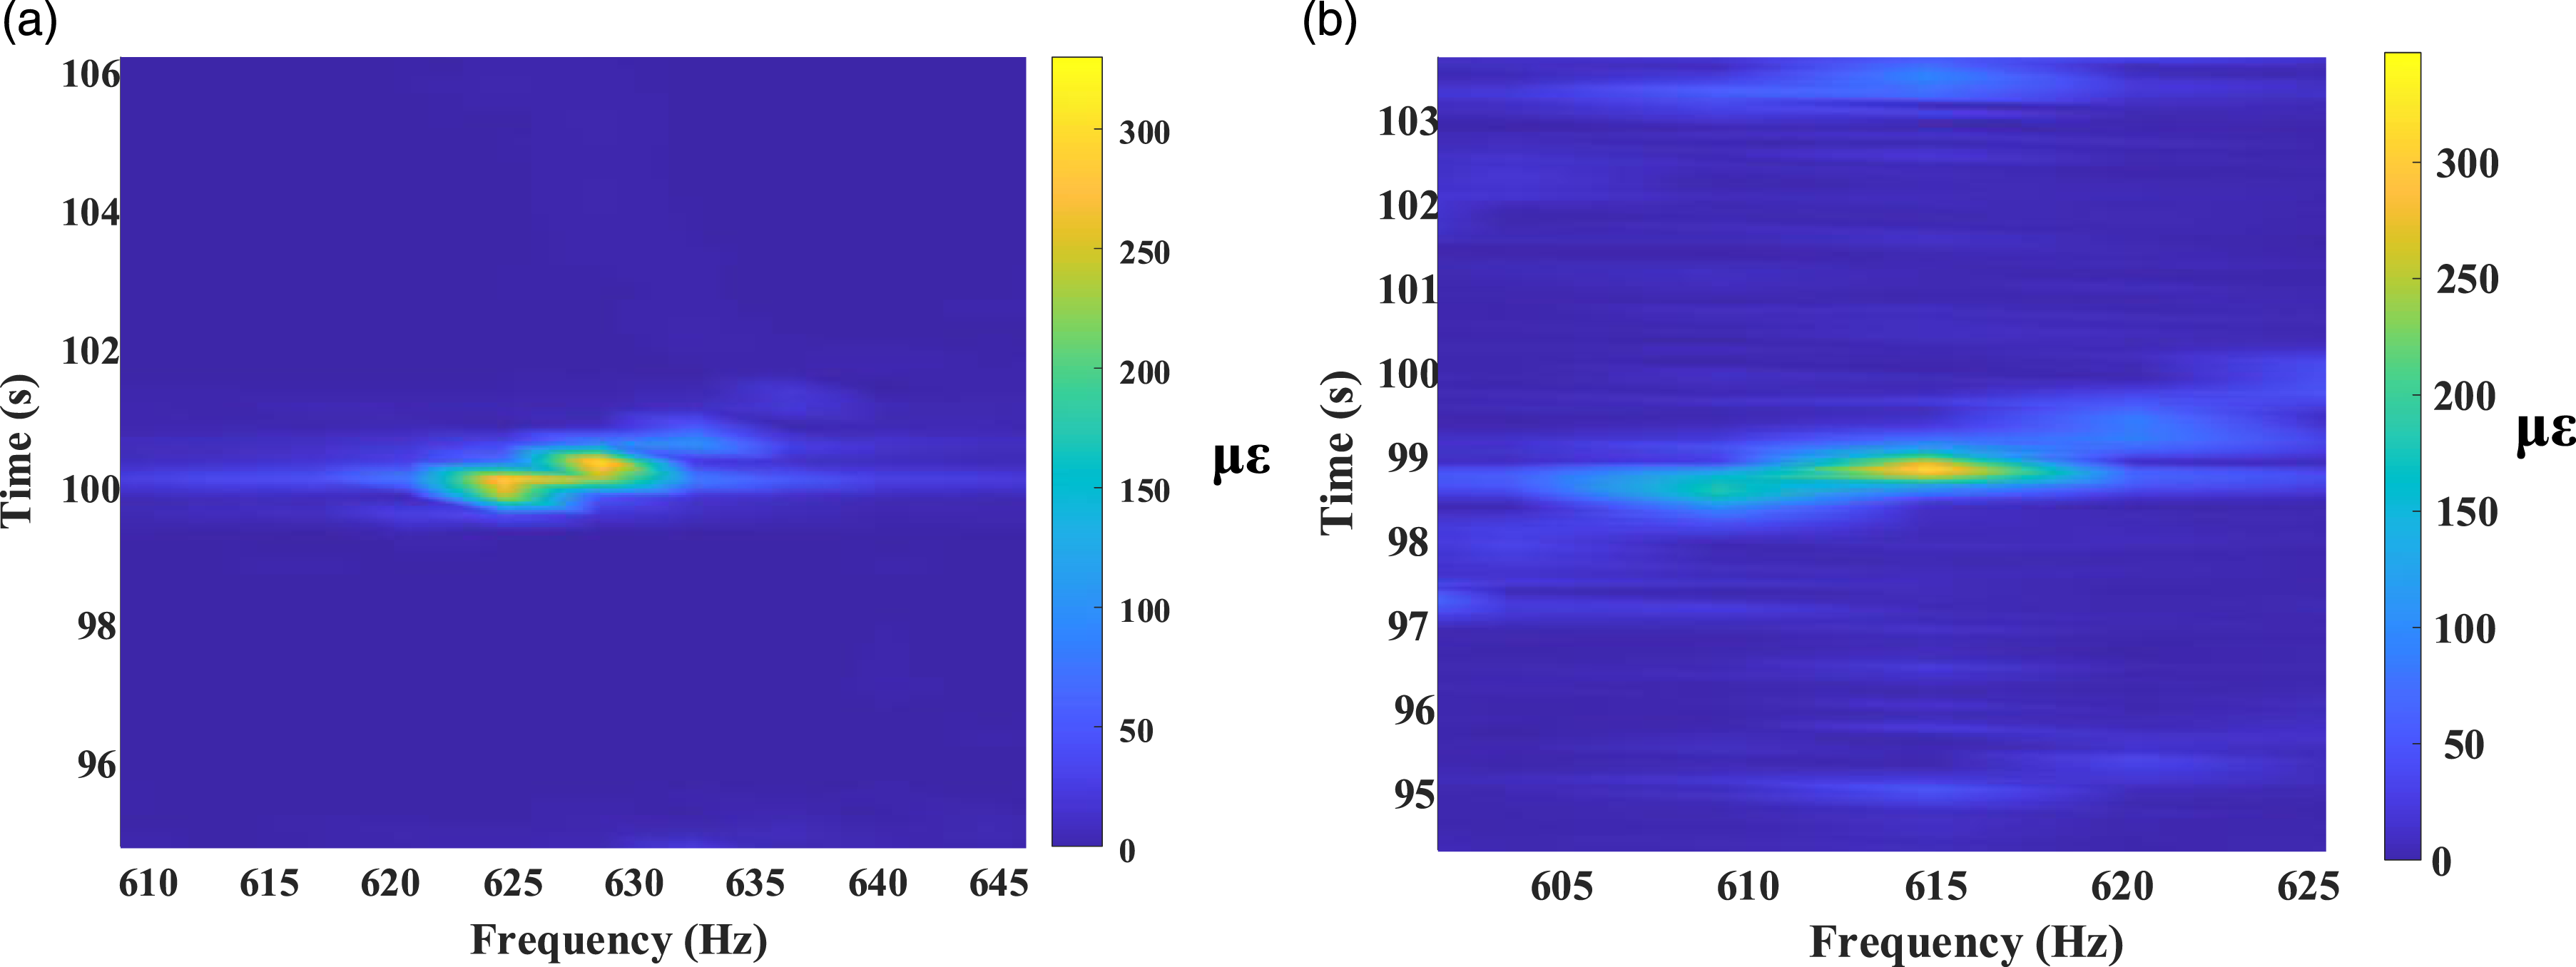
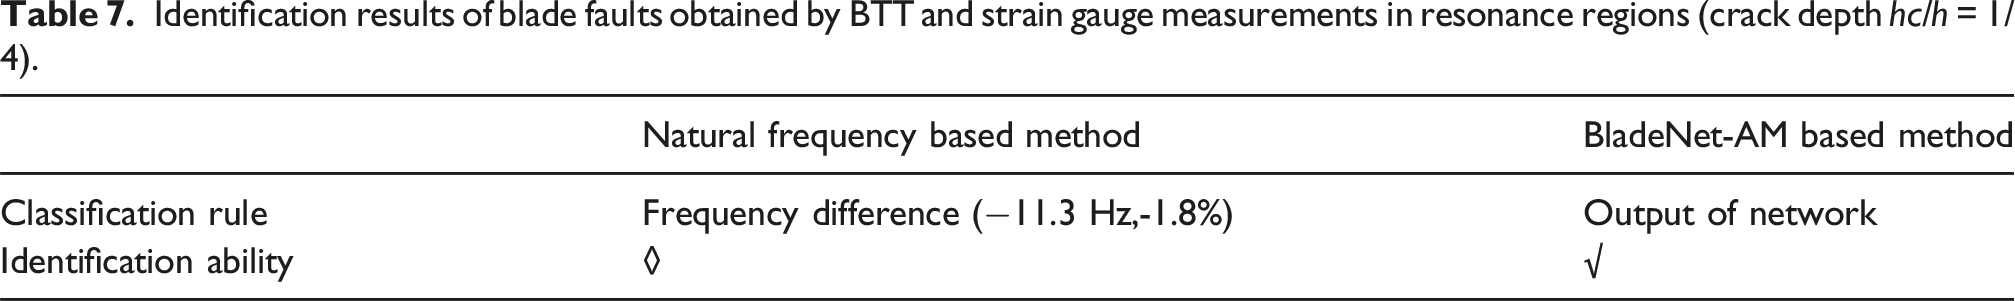
Identification results of blade faults obtained by BTT and strain gauge measurements in resonance regions (crack depth hc/h = 1/4).
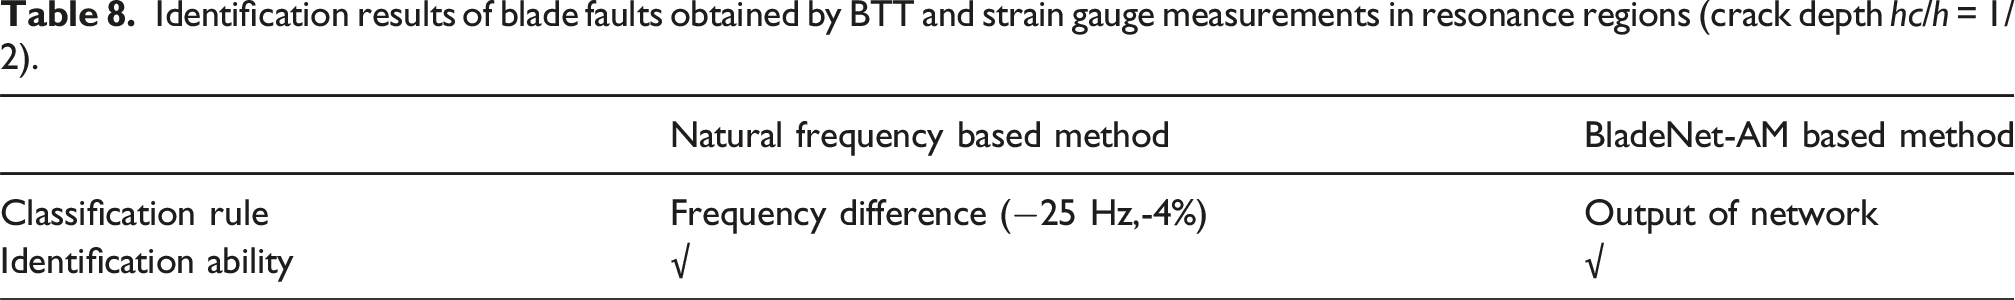
The blade disk with a cracked blade (hc/h = 1/2) was replaced and tested under the same operating conditions. The measured BTT signals of the blade is depicted in Figure 28, and Figure 29 shows the envelope diagram obtained based on the BTT signals. The strain gauge measurement results are presented in Figure 30, and the results of frequency differences and image classifications are recorded in Table 8. For the blades selected in the experiment, the true natural frequency of the cracked blade decreased by approximately 4% compared to the intact blade. Both the image recognition method and the frequency change determination method were able to identify the blade crack fault. Blade vibration displacements measured by BTT in resonance regions (crack depth hc/h = 1/2). Envelope diagram of resonance regions for (a) Intact blade (b) Cracked blade (crack depth hc/h = 1/2). Identification results of blade faults obtained by BTT and strain gauge measurements in resonance regions (crack depth hc/h = 1/2).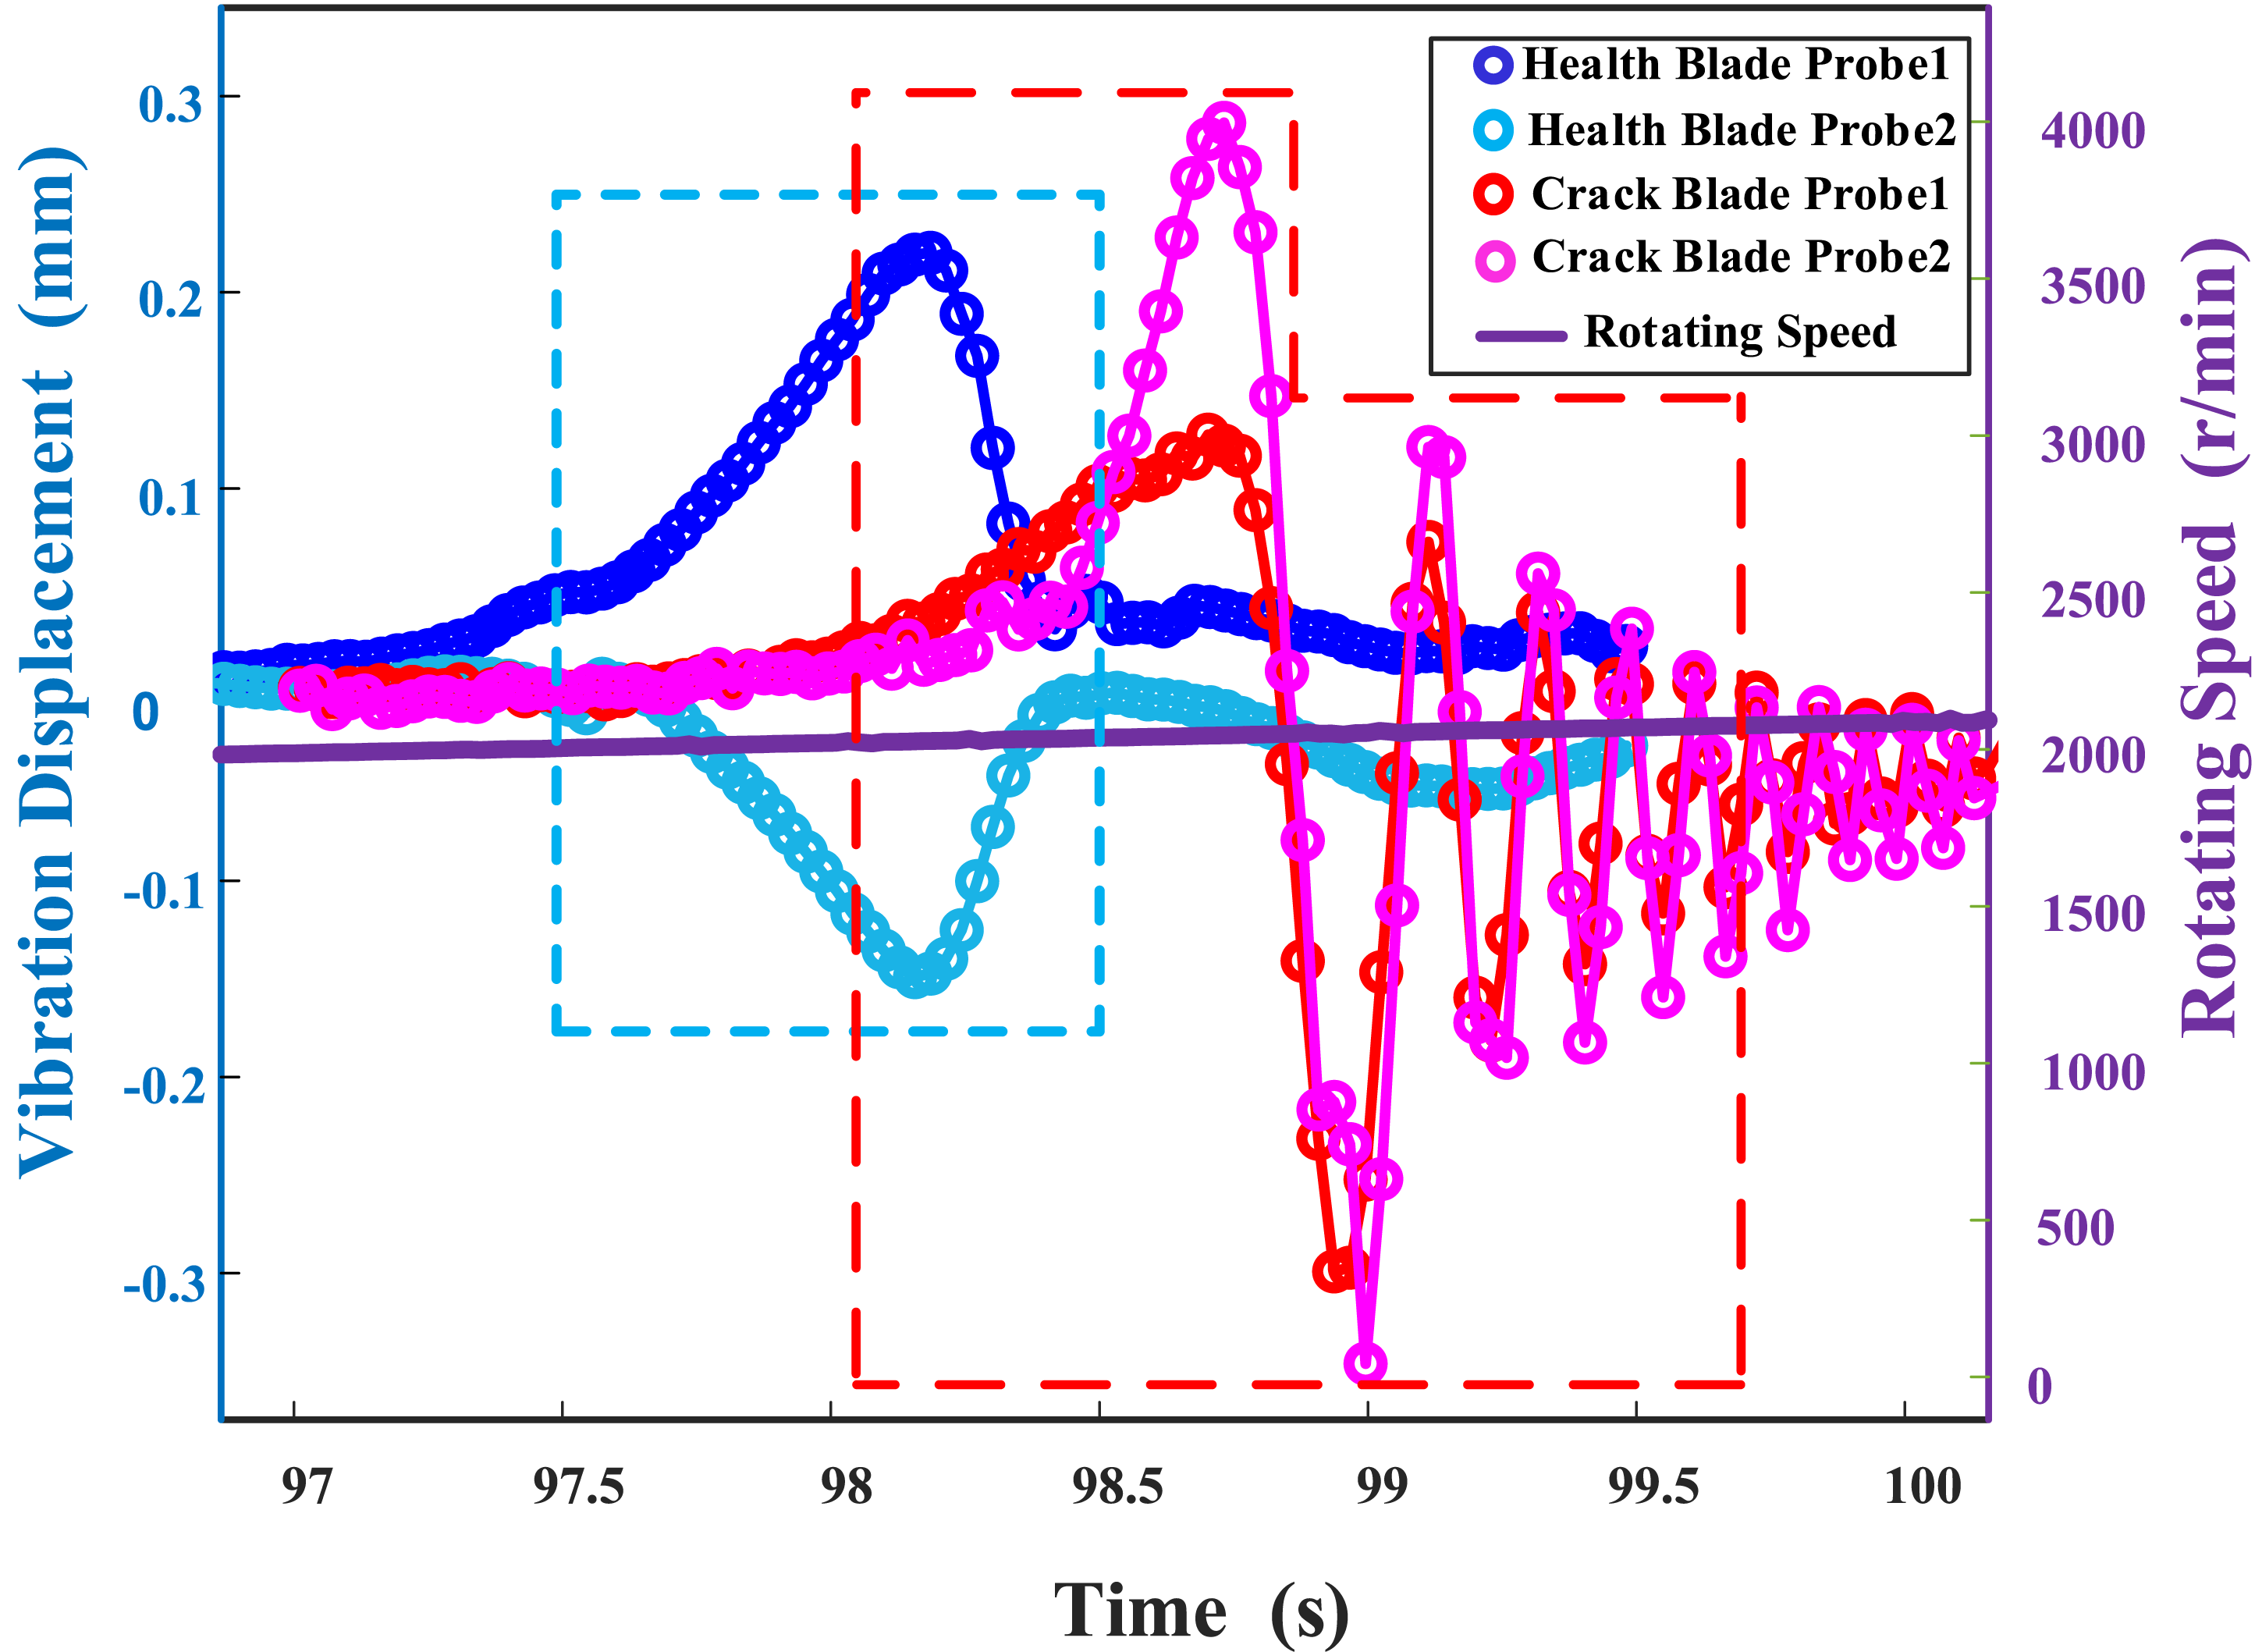
Comparing the results shown in Tables 7 and 8, it is evident that the decrease in the “natural frequency” of blades caused by breathing crack faults is not significant. Especially when the crack depth has not reached a sufficient level, it becomes challenging to accurately detect cracks solely through the analysis of the natural frequency. Considering the inherent measurement uncertainties in engineering equipment, the vibration frequencies measured by BTT are not as accurate as those recorded by strain gauges. Therefore, relying on a decrease in the obtained blade natural frequency to determine blade crack faults is less reliable.
In contrast, the methodology introduced in this paper involves creating an envelope image from the BTT signal, which incorporates the dynamic characteristic information of the blade’s response. By utilizing BladeNet-AM based method for classification the envelope diagram, this approach can accurately identify samples of blades with cracks. The proposed method offers higher accuracy and reliability compared to methods that rely solely on frequency information for fault determination (Figure 30). Time-frequency map of blade vibration strain signals: (a) Healthy blade; (b) Cracked blade (hc/h = 1/2).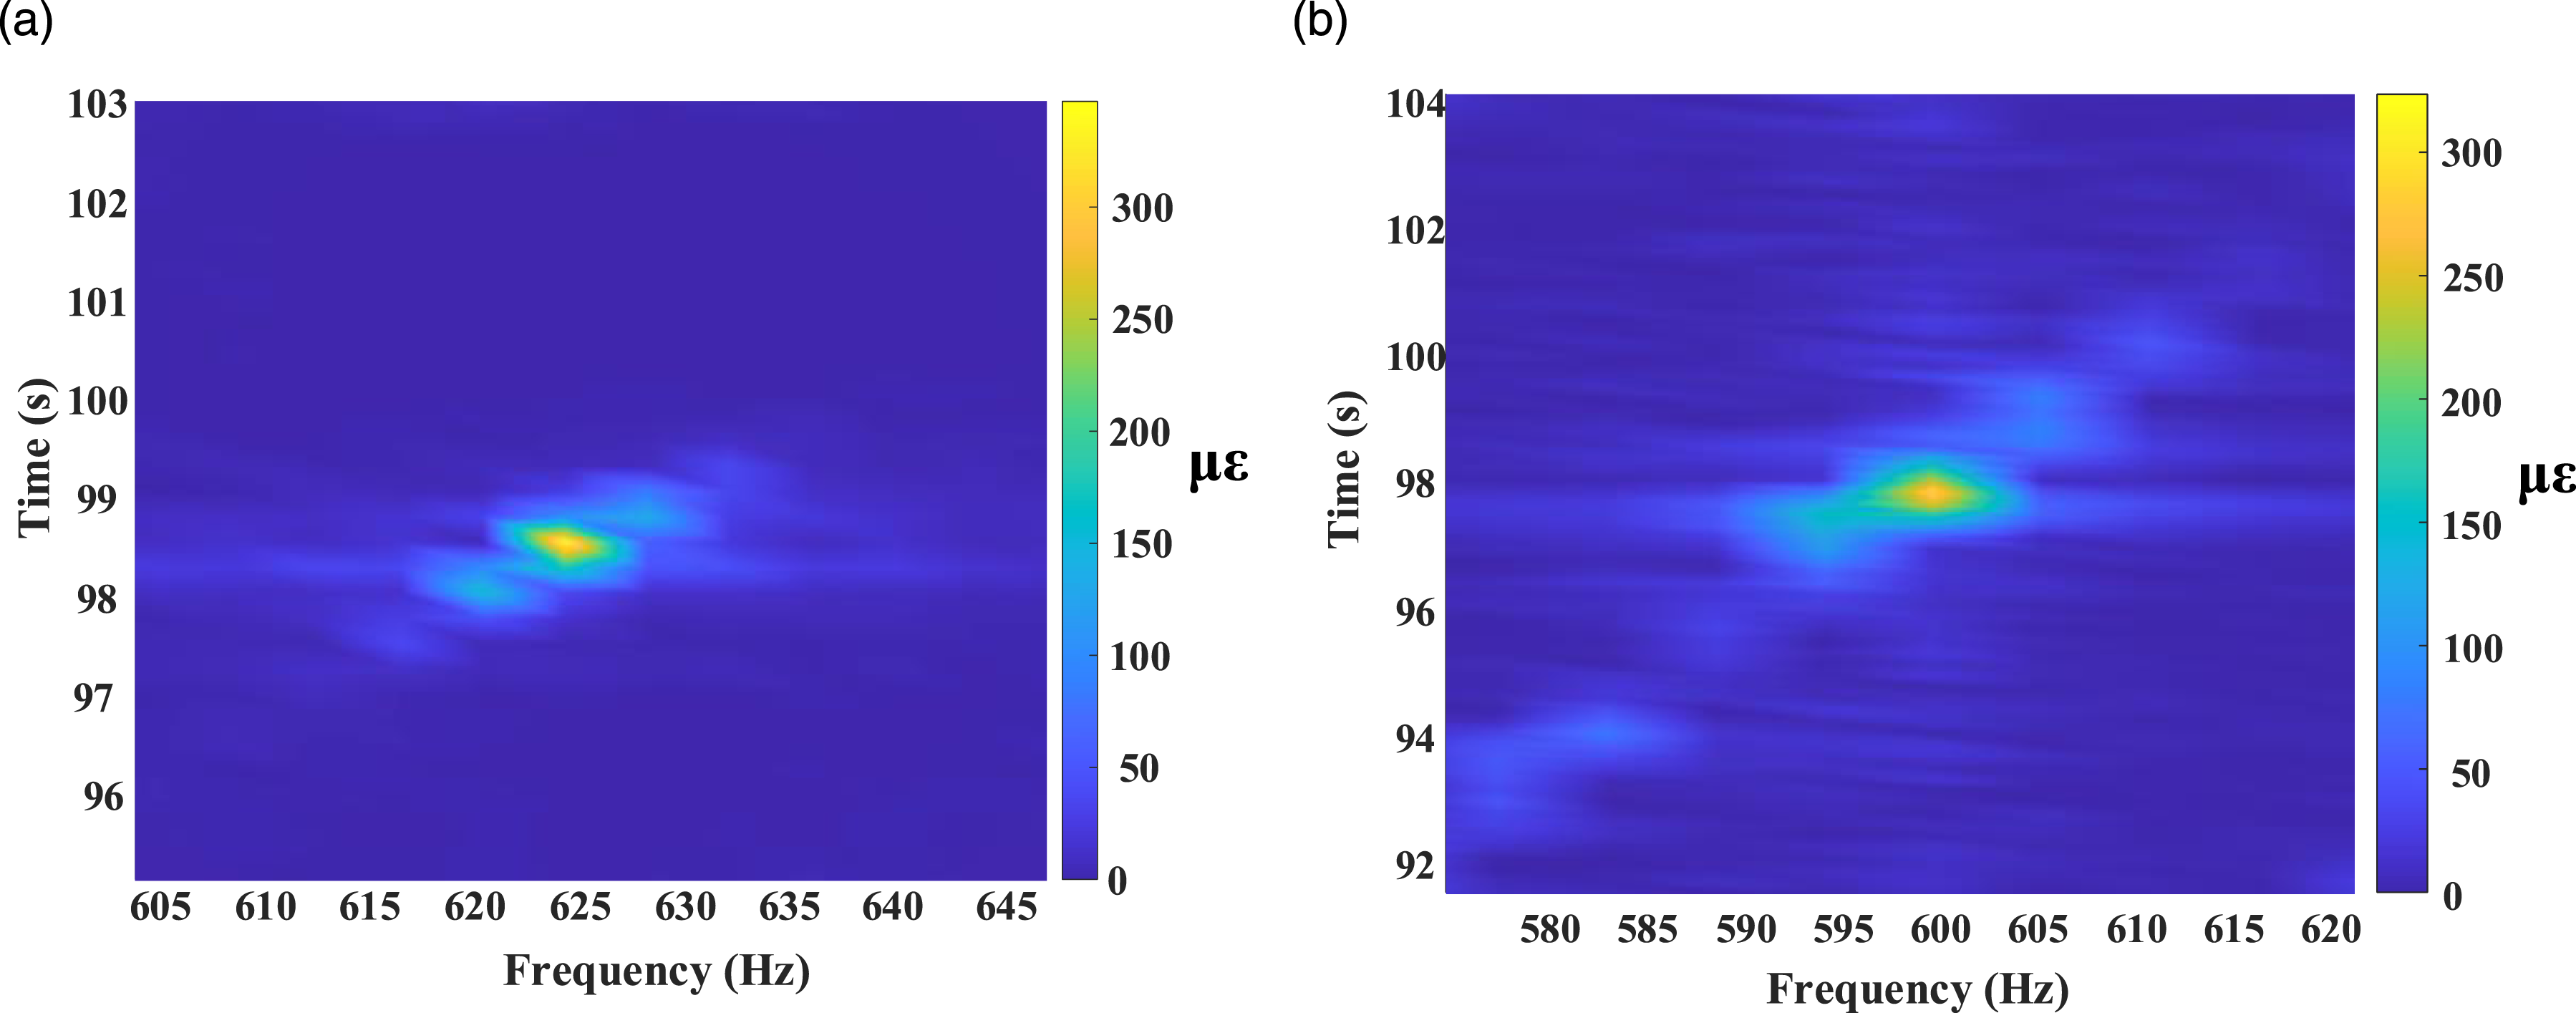
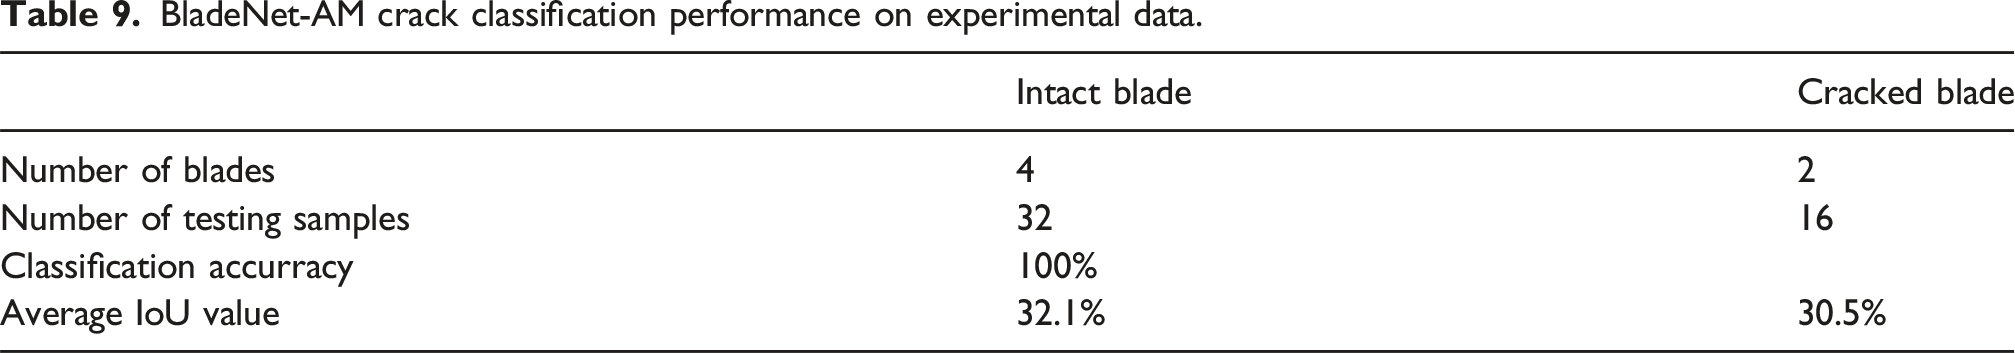
To further validate the accuracy of BladeNet-AM model in crack sample identification, a new disk specimen was specifically designed and manufactured, featuring two cracked blades with crack depth ratios of 1/3 and 1/2, respectively. Additional excitation magnets were installed to enhance blade vibration, while blade vibration displacement was systematically recorded during motor acceleration/deceleration between 1500 and 3500 r/min. This configuration enabled the collection of enriched envelope image diagram samples from multiple blades within the resonance zone. The operational procedure of the blade testing is illustrated in Figure 31. The pre-trained model based on simulation data demonstrated effective identification across all blade sample types, with comprehensive recognition results detailed in Table 8. Vibration displacements of a cracked blade measured by BTT in resonance regions.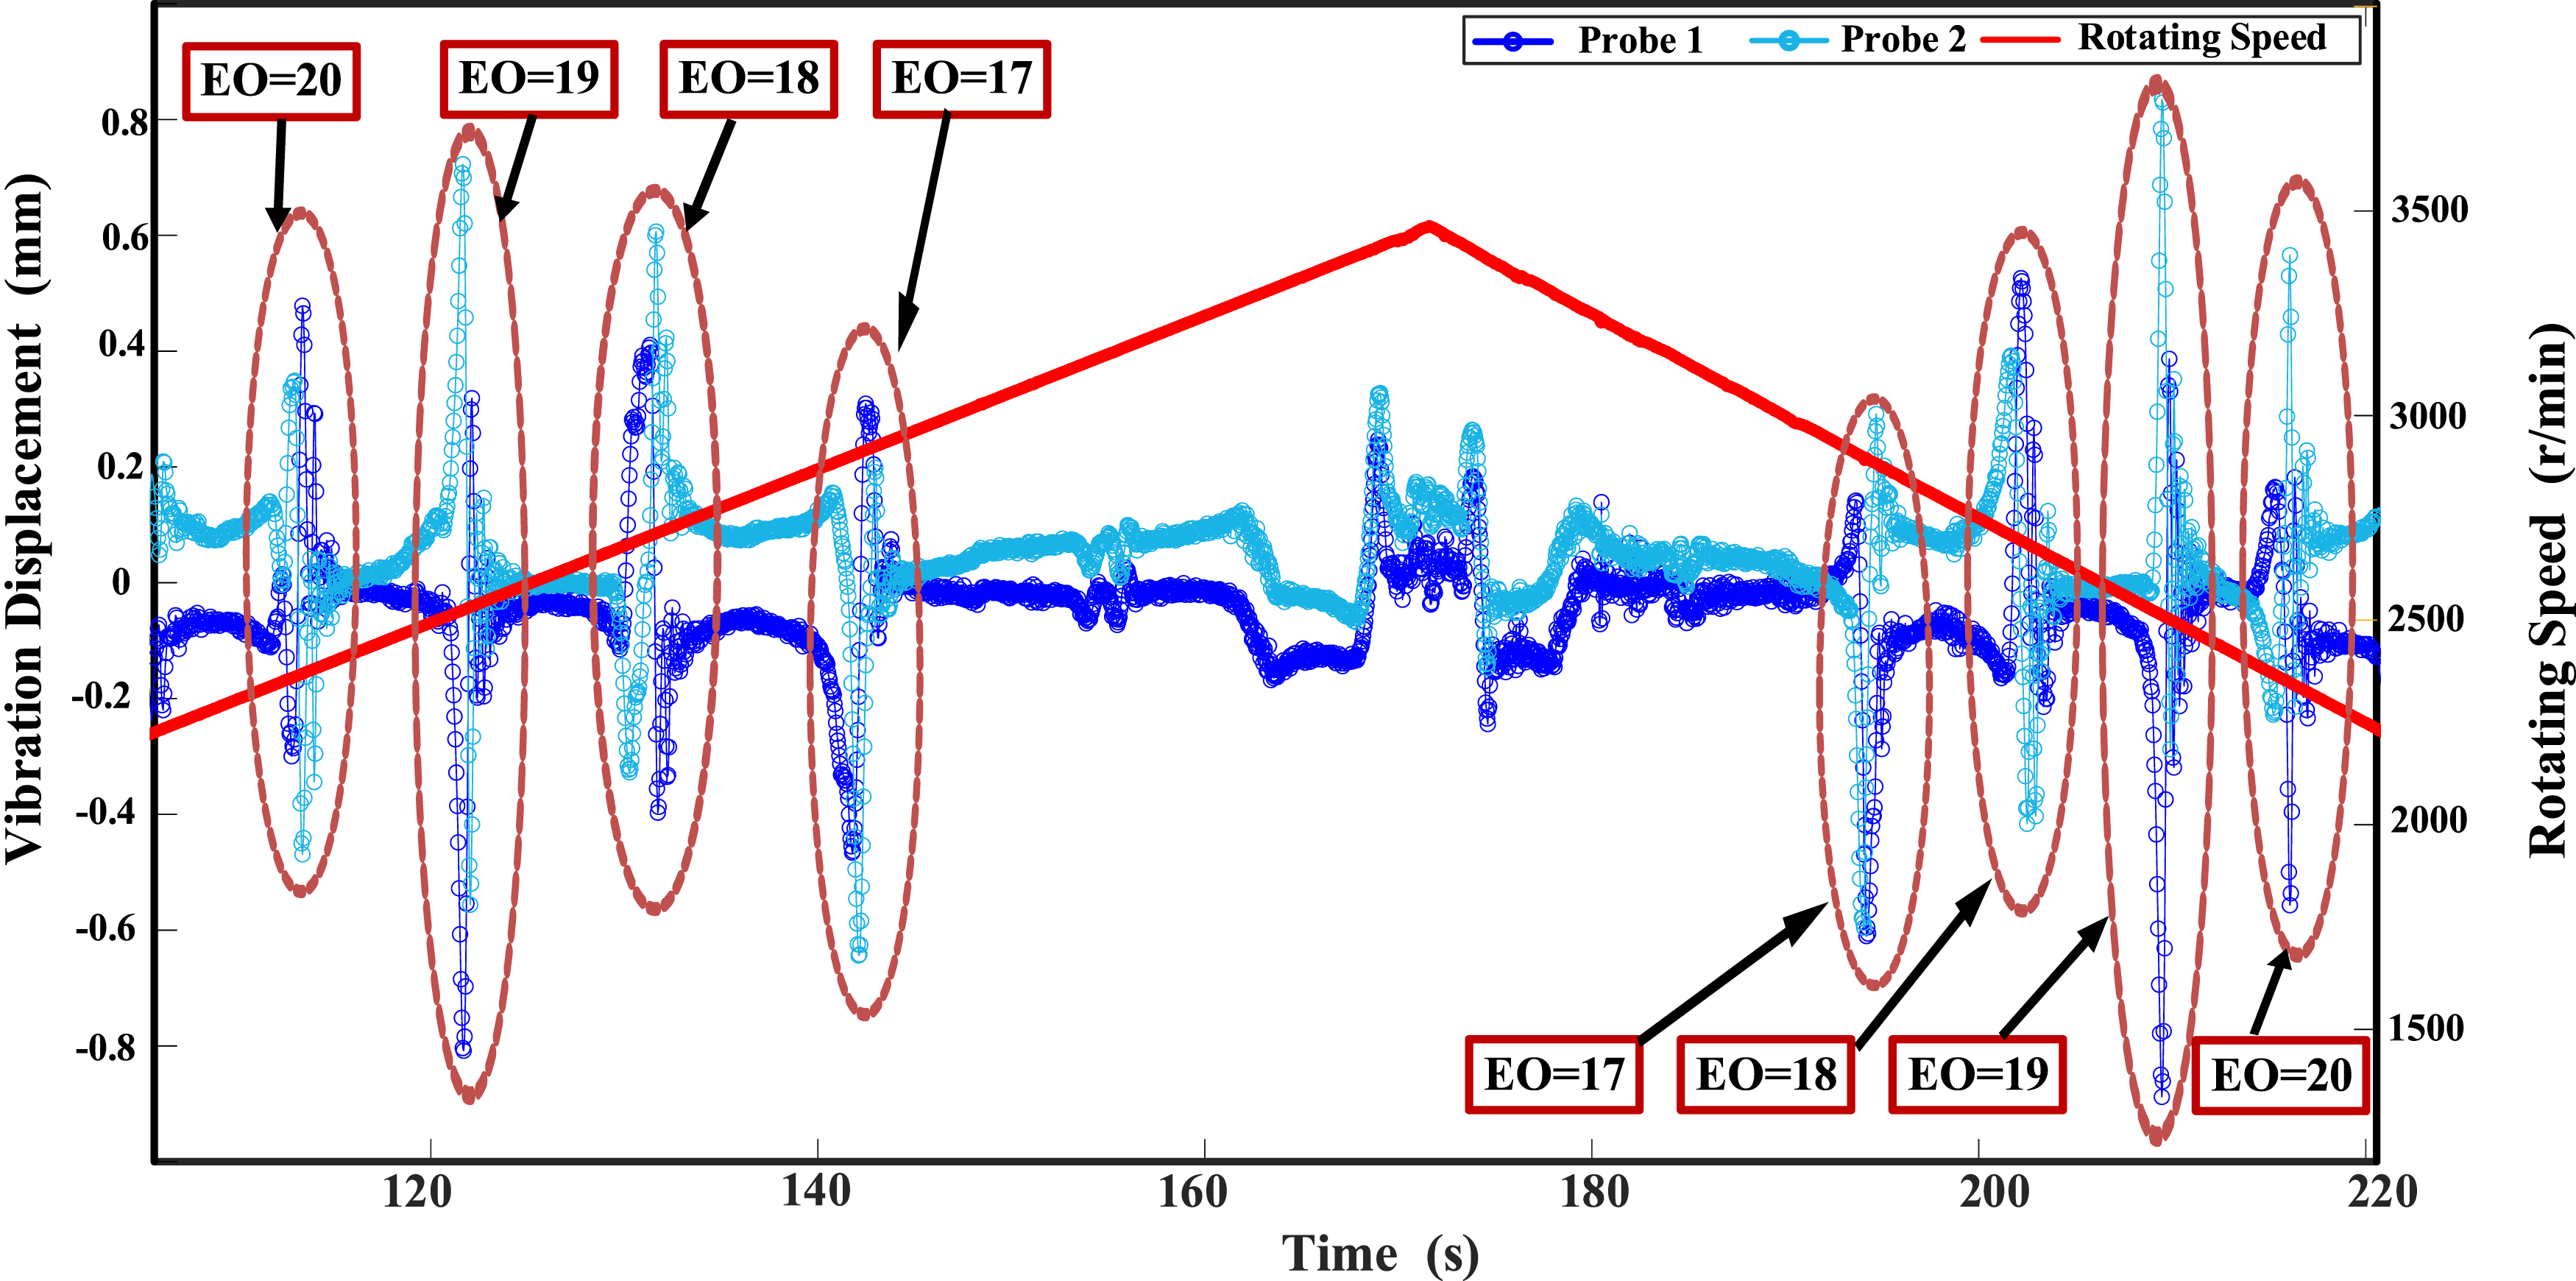
BladeNet-AM crack classification performance on experimental data.
In future investigations, to further validate the generalization capability of the proposed model in crack identification, additional BTT engineering test data from diverse rotor blade specimens will be systematically acquired and verified.
Conclusions
This study develops a breathing crack detection method by combining BTT measurements with computer vision-based feature extraction. This method transforms measurement data from two BTT sensors into envelope diagram images, which depict blade tip vibration displacements within the resonance region. The envelope images are then classified using the proposed BladeNet-AM network, enabling the diagnosis of blade breathing cracks. This methodology exhibits remarkable recognition accuracy, ensuring precise identification of all breathing cracks with a crack depth ratio of over 10%. Additionally, only two sensors are required, which is a relatively small number, and there are no district requirements for the angular separation between these two sensors. Furthermore, this methodology exhibits robust performance, as the presence of measurement uncertainties in BTT tests scarcely impacts the outcomes. Moreover, the proposed method enhances diagnostic reliability by integrating breathing crack dynamics with blade tip vibration responses while maintaining physical consistency with nonlinear vibration theory.
In the experimental phase, this paper proposes an innovative simulation method for breathing cracks in rotating blades. This method accurately captures the dynamic characteristics of breathing cracks during blade rotation. Furthermore, it successfully demonstrates the feasibility of the BladeNet-AM network-based approach in identifying breathing cracks.
In further research, three key issues will be further explored. First, the recognition capabilities of the network should be enhanced to achieve accurate diagnosis of microscale cracks in the initial stages of crack formation. Second, the generalization capability of the crack diagnosis method needs to be improved for universality in detecting various crack shapes across different types of blades. Third, unsupervised crack fault diagnosis methods that are applicable to the health assessment of rotating blades in a wider range of mechanical equipment should be developed.
Footnotes
Author contributions
Yongmin Yang: Writing – review and editing, Validation, Funding acquisition, Formal analysis. Minghao Pan: Writing – original draft, Methodology, Investigation, Formal analysis, Conceptualization. Fengjiao Guan: Writing – review and editing, Supervision, Resources, Project administration. Haifeng Hu: Formal analysis, Data curation. Zifang Bian: Investigation, Data curation. Wenkang Huang: Data curation. Bohao Xiao: Assist with the experiment. Ang Li: Assist with the experiment.
Funding
The authors disclosed receipt of the following financial support for the research, authorship, and/or publication of this article: This work was financially supported by the Key Laboratory Fund (WDZC20205250304). I sincerely thank Ms. Cai for her encouragement during this study.
Declaration of conflicting interests
The authors declared no potential conflicts of interest with respect to the research, authorship, and/or publication of this article.