
Abstract
This study investigates the development and acoustic performance of a layered composite structure composed of plastic microfibre pulp (PMFP) and plastic acoustic metamaterial (PAM), designed for low-frequency sound wave control. Addressing the dual challenge of reducing plastic waste and enhancing low-frequency sound absorption, the research explores the use of recycled plastic materials in innovative acoustic applications. PMFP was tested in various thicknesses, while PAM resonators were 3D-printed with adjustable neck lengths and diameters to achieve optimal sound absorption characteristics. The acoustic performance of the composite materials was evaluated in an impedance tube according to ISO 10534-2 for their sound-absorbing properties. Results showed that with increasing thickness of the PMFP sound, absorption peaks shifted to the lower frequencies, with 50 mm thick samples exhibiting a peak absorption coefficient of 0.74 at 500 Hz. When combined with PAM, the structure’s effectiveness increased significantly, with the best-performing configuration (PAM with a 4.5 mm neck diameter and 3.0 mm neck length) achieving a highest absorption coefficient of 0.93 at 1250 Hz. Moreover, introducing air gaps behind the composite material further enhanced low-frequency absorption, with a 50 mm air gap shifting the peak sound absorption to 315 Hz, reaching a coefficient of 0.87. The study concludes that the layered composite structure, with recycled plastic waste, provides an effective and environmentally sustainable solution for low-frequency sound absorption. This makes it suitable for use in various industrial and environmental noise control applications, offering an innovative approach to control noise in indoor areas while addressing plastic waste concerns.
Introduction
One of the most significant environmental problems is the amount of waste that packaging materials generate combined with lower reuse and recycling rates. According to Eurostat, in 2021 alone, the EU generated an estimated 188.7 kg of packaging waste per inhabitant. Of all, 19% of this amount is plastic waste, which is equivalent to 35.8 kg per inhabitant. From 2010 to 2021, plastic packaging waste reached a total of 16.1 million tonnes as the second most important packaging material (+29.9% compared with 2010). 1
Today’s extensive use of plastics, combined with poor management, mostly landfilling, is causing havoc on the environment. The only practical way to reduce the pollution these materials cause is to reduce disposal while increasing reuse, recovery, and recycling. 2
According to a review on sustainable plastic waste management by Babaremu et al., scientists are now encouraged to make novel discoveries that would further aid in controlling the circulation of plastics. Plastics are currently used in manufacturing technologies, concrete aggregates, structural walls and columns, and filament materials for 3D printing. 3 The use of recycled plastic in construction reduces environmental problems, protects the remaining natural resources, and reduces the self-load of buildings. In 2011 and 2013, D. Foti produced and demonstrated possible ways of using recycled PET bottle fibres as one-way or two-way reinforcement of concrete slabs and coatings, and other applications. In addition, recycled PET has important implications for reducing plastic waste, production costs, and structural degradation caused by steel corrosion.4,5 Plastic waste bottles can be used to make sustainable building materials and replace regular concrete blocks. The underlying logic for the observed strength performance in medium-strength reinforced concrete pavements is caused by plastic waste, which can also be used to enhance the performance of plastic aggregate. 6 The use of plastic waste also reduces energy consumption for building construction. Using plastic waste for insulation solutions can also increase energy performance while reducing maintenance costs. The implementation of plastic waste also helps to reduce transportation-related carbon emissions due to its low cost of transportation 7 .
The use of recycled plastic in building acoustics is also a relevant topic. Biskupičova et al. manufactured five composite materials consisting of plastic grains (EVA, PP, PS, and PVC) and bonded them using glue. Their main goal was to produce recycled material for sound absorption applications. In their paper, the thickness of the sample and the effects on the spectrum of sound absorption were investigated, as well as the variability in absorption across several samples with similar composition and thickness. The general potential for building acoustics of those developed materials was evaluated. 8
Macro- and microplastic wastes affect all habitats, but especially marine and ocean environments. Most of the plastic waste is landfilled or incinerated because it is made up of various polymers and/or has been contaminated with salt or other substances in the water. In latest works, Caniato et al. presented a completely new sustainable material in their article – eco-friendly polystyrene foam made from microplastic waste. The analysis of thermal and acoustic properties showed that the new material can easily compete with traditional heat and sound insulators such as rock wool and polyurethane foam. In addition, it is possible to adjust the sound absorption of the material, bringing it to the desired frequency range, by changing the amount of microplastic in the material. 9 In 2022, Caniato et al. continued research with microplastics, specifically with sustainable and eco-friendly foamy material made of microplastic waste with polyethylene terephthalate (PET) and polystyrene (PS). After samples with various compositions, the qualities of sound absorption were evaluated. Measurements showed that depending on the material variation ratio in the sample, the sound absorption peaked at 3000 Hz with around 0.90 sound absorption coefficient. Scientists came to the conclusion that depending on the kind and form of microplastics used, these materials can be tuned to desired sound absorption capabilities and can provide a variety of sound absorption frequency peaks. 10 In general, these studies showed that marine microplastic waste can be recycled to create new materials that can be used as acoustic absorption layers for industrial, naval, and civil purposes.
Acoustic metamaterials are a relatively new class of materials that have attracted significant interest from scientists because of their potential in acoustic applications. Such materials have special qualities and adaptable design that differentiate them from conventional materials. These materials are a novel type of acoustic absorber with a periodic structure and a thickness smaller than the wavelength of the incident acoustic wave. 11 Many researchers developed those materials from plastics, usually using plastic filaments and 3D printing technologies. This method allows producing unique but reproducible structures with known properties.12,13
Sound-absorbing materials can be divided into porous, resonant, and special sound-absorbing structures/constructions (metamaterials). Porous, sound-absorbing material corresponds to the maximum absorption category and is the most widely used. The resonant absorbing material consists of a sheet resonator, perforated plates, and microperforated plates. The length of the wave transmission path is determined by the thickness of the fibre material. However, it is not practical to improve the absorption efficiency of the walls of the room by increasing their thickness. For a given thickness, an increase in material density can improve absorption efficiency at low frequencies, but the improvement is significantly less than the increase in thickness. The influence of density is complex: it is influenced by fibre morphology, porosity, and air flow resistance.14,15 Various cavity shapes, including spheroids, trapezoids, ellipsoids, cylinders, and disks, have been examined to investigate the acoustic performance, where sound absorption is mostly reliant on intramolecular friction induced by sound waves within the material. Incorporating cavities into sound-absorbing composite material could be an effective strategy to improve broadband absorption performance. 16
The aim of the study is to develop sound-absorbing composite material from plastic microfibre pulp (PMFP) with plastic acoustic metamaterial (PAM) and investigate its acoustic properties in terms of the sound absorption coefficient. Traditional sound-absorbing materials, such as fibre and foam, fail to effectively absorb low-frequency sound waves, especially when their thickness is limited. Although several studies have accomplished low-frequency sound absorption in various ways, it is difficult to achieve broadband and low-frequency sound absorption, particularly below 500 Hz.17–20 Composite materials, despite being a relatively new category of modern engineering materials, have received a lot of attention due to the multiple benefits they provide.21–23 By adjusting the geometric parameters of composite structures, their interaction with the sound wave can be tailored to meet the requirements of a variety of applications. The effects of the geometric parameters of the embedded neck and the acoustic characteristics of the porous material on the sound absorption are examined to investigate the sound absorption tunability of the proposed structure. The study examines how the geometric dimensions of the implanted neck of the metamaterial and the acoustic properties of the porous material affect sound absorption, demonstrating the possibility to tune the absorption for low-frequency applications. The introduced composite structure would be used as sound-absorbing material with passive tuning abilities according to desired frequency of the sound wave frequency.
Materials and methods
The PMFP raw material was obtained from a local plastic recycling company. The material was dried for 24 h in 70 ± 3 Dried and blended PMFP.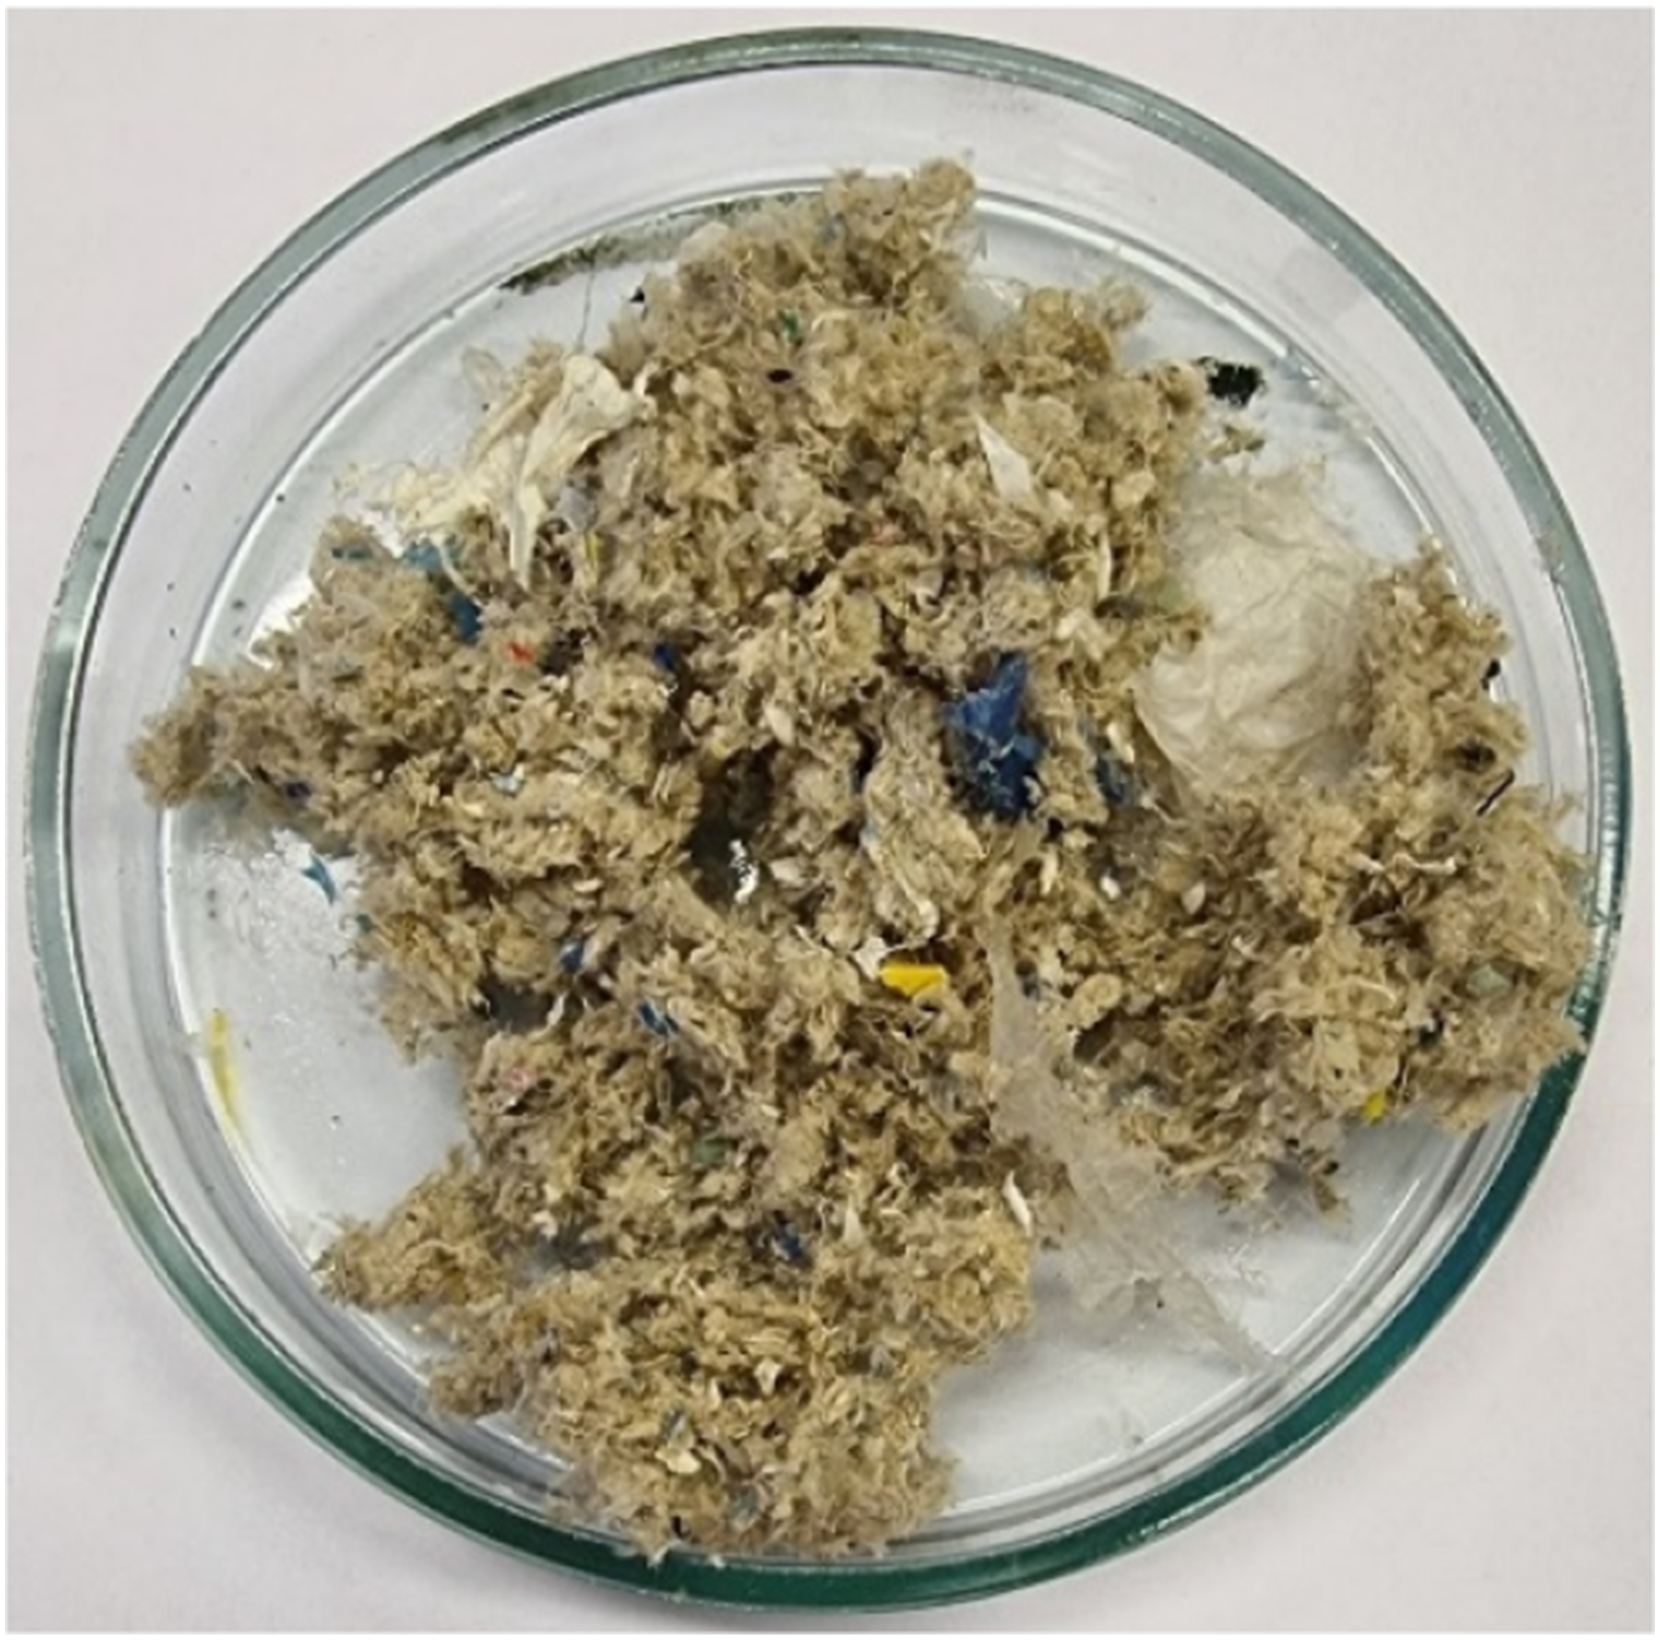
Preliminary experiments showed that a binder ratio lower than 40% does not provide enough rigidity of the material to perform sound absorption and airflow resistivity tests. Previous studies with other materials suggest that high values of binding materials result in decrease of sound absorption .25,26 Therefore, the maximum binder concentration is chosen to be 60 wt%. For material characterization of sound absorption, different sample thicknesses were chosen: 10 mm, 30 mm, and 50 mm. The samples were cut to 29.9 mm and prepared in batches of three for each selected configuration for measurements in the impedance tube.
To analyse the microstructure of the material, JEOL JSM-7600F (Tokyo, Japan) scanning electron microscopy with energy-dispersive X-ray spectroscopy (SEM/EDS) technique was used. The resolution of the microscope was 1.5 nm, with a magnification available from 25 to 1,000,000 times; the voltage for the determination of the microstructure was 10.0 kV and the surfaces were covered with gold.
PAM samples were manufactured from PET-G plastic filament using 3D printing fused deposition modelling technology. The working principle of our developed PAM is based on the Helmholtz resonator, which is made up of two air chamber cells with variable length (L) and diameter (d) necks, as shown in Figure 2. PAM cell scheme made from PET-G with passively variable neck length (L) and outlet/inlet diameter (d).
The samples are 28.3 mm in diameter and have to be placed inside a plastic cartridge to prevent air gaps from forming between the samples and the impedance tube during measurements. The necks of the sample are the primary passively adjustable component. For each neck length (L), which is 1.5, 3.0, 6.0, and 9.0 mm, the neck inlet/outlet diameter (d) is 1.5, 3.0, and 4.5 mm. We can change the resonant frequency at which PAM will absorb sound by altering the geometrical dimensions of the necks in the chambers.
Before starting sample manufacture, we calculated the resonant frequency (

Usually, for openings, pipes, inlets/outlets in acoustic systems length end correction should be applied. And, because inlet length is crucial for Helmholtz resonator calculations, end correction should be applied as:

The length end correction for pipe with two openings can be calculated according to Rayleigh as:

The layered composite structure made of plastic acoustic metamaterial (PAM) and plastic microfibre pulp (PMFP) for sound absorption applications was investigated (Figure 3). Example of structured sound-absorbing material made from PAM and PMFP.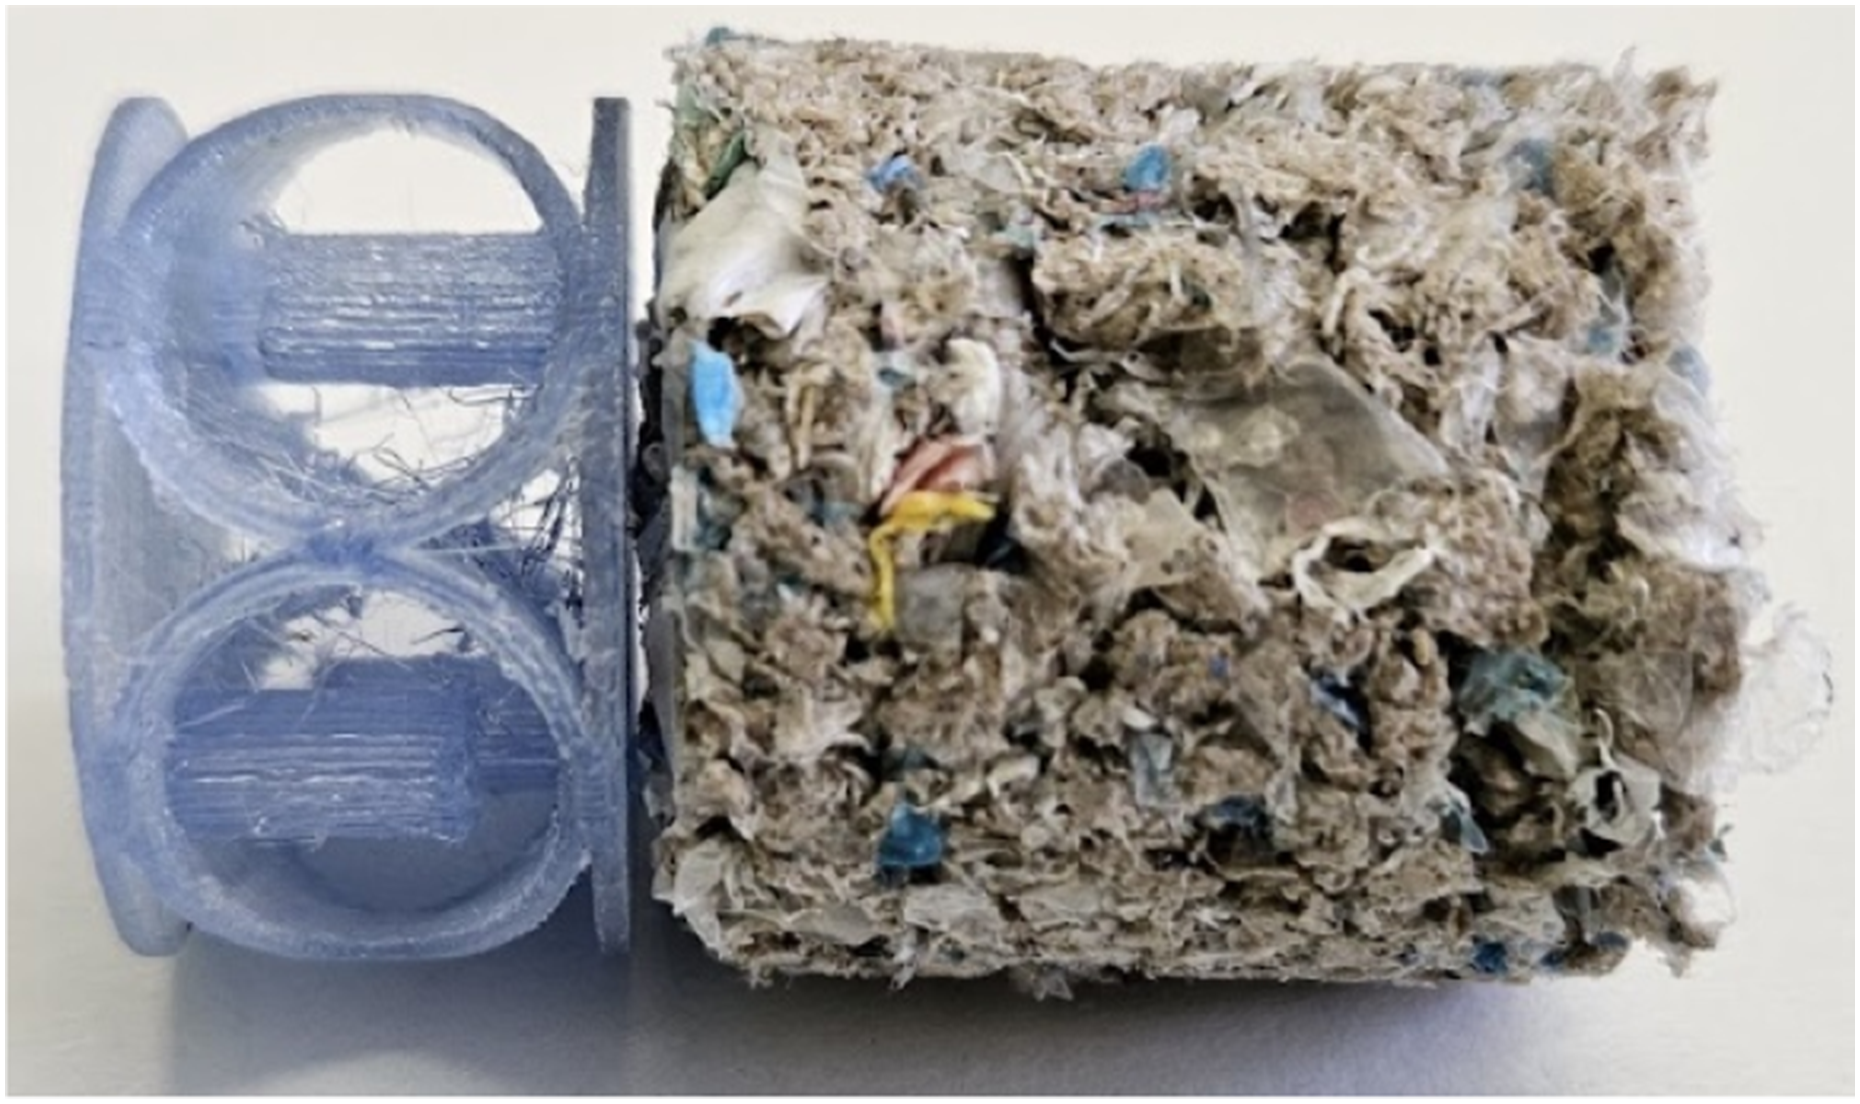
The air flow resistivity of the PMFP samples was also tested to obtain more information about the PMFP composite materials. The same samples were used for air flow resistivity experiments as those in an impedance tube. The method to determine the air flow resistivity of PMFP samples is described in the ISO 9053-1 standard. The measurements were made using a 3D-printed tube. A static airflow method used to determine static airflow resistivity. This method is based on the difference in air pressure created by the directed air flow between two open surfaces of the material. The length of the tube is 140 cm to ensure a nearly laminar airflow (Reynolds number 160–200 depending on ambient temperature). The diameter of the tube is 30 mm. Such a diameter of the tube allows us to use the same samples as for sound absorption measurements, which allows for a better understanding of the acoustic behaviour of the material. The specimen holder consists of evenly distributed open holes that cover 50% of the cross-sectional area. An air compressor is used to generate pressure and a differential manometer with a precision of 0.1 Pa is used to measure the difference in pressure. The airflow velocity is measured with an airflow velocity metre. The airflow velocity in the tube should be as low as possible to ensure that the airflow is not turbulent and does not affect the resulting pressure difference before and after the material. Turbulent airflow could not add even air pressure on the sample side wall, which could result in unreliable data. Airflow velocity is regulated during the test to be around 0.01–0.02 m/s.
To determine the static airflow resistance of the material, the air pressure difference ∆P:

First, the airflow resistance R is calculated:

Next, the specific airflow resistance R
s
is calculated, which is defined as the product of the airflow resistance and the cross-sectional area of the sample:

The static airflow resistivity σ of the material is calculated as the ratio of the specific airflow resistance R
s
to the thickness of the sample d:

The density of the object was determined by measuring its mass and volume and applying the following relationship:

The mass was measured using a precision digital scale with a resolution of 0.0001 g. The volume was determined by measuring the dimensions of the sample with an electronic vernier caliper. Since the samples were in cylinder shape, the volume was calculated as follows:

Limitations of the method include potential inaccuracies due to non-uniform shape or ruler precision. The uncertainties were calculated as the standard deviation between samples of the same composition.
The method for measuring the sound absorption coefficient with the impedance tube (Figure 4) is based on the fact that the complex sound reflection coefficient R can be determined by measuring the transfer function H12 between two positions at distances x1 and x2 of the test sample.
30
Setup of the impedance tube and its components for the measurement of sound absorption coefficient (1 – speaker as a sound source; 2 – sound amplifier; 3 – sound card; 4 – microphone no. 1; 5 – microphone no. 2; 6 – microphone no. 3; 7 – data processing software).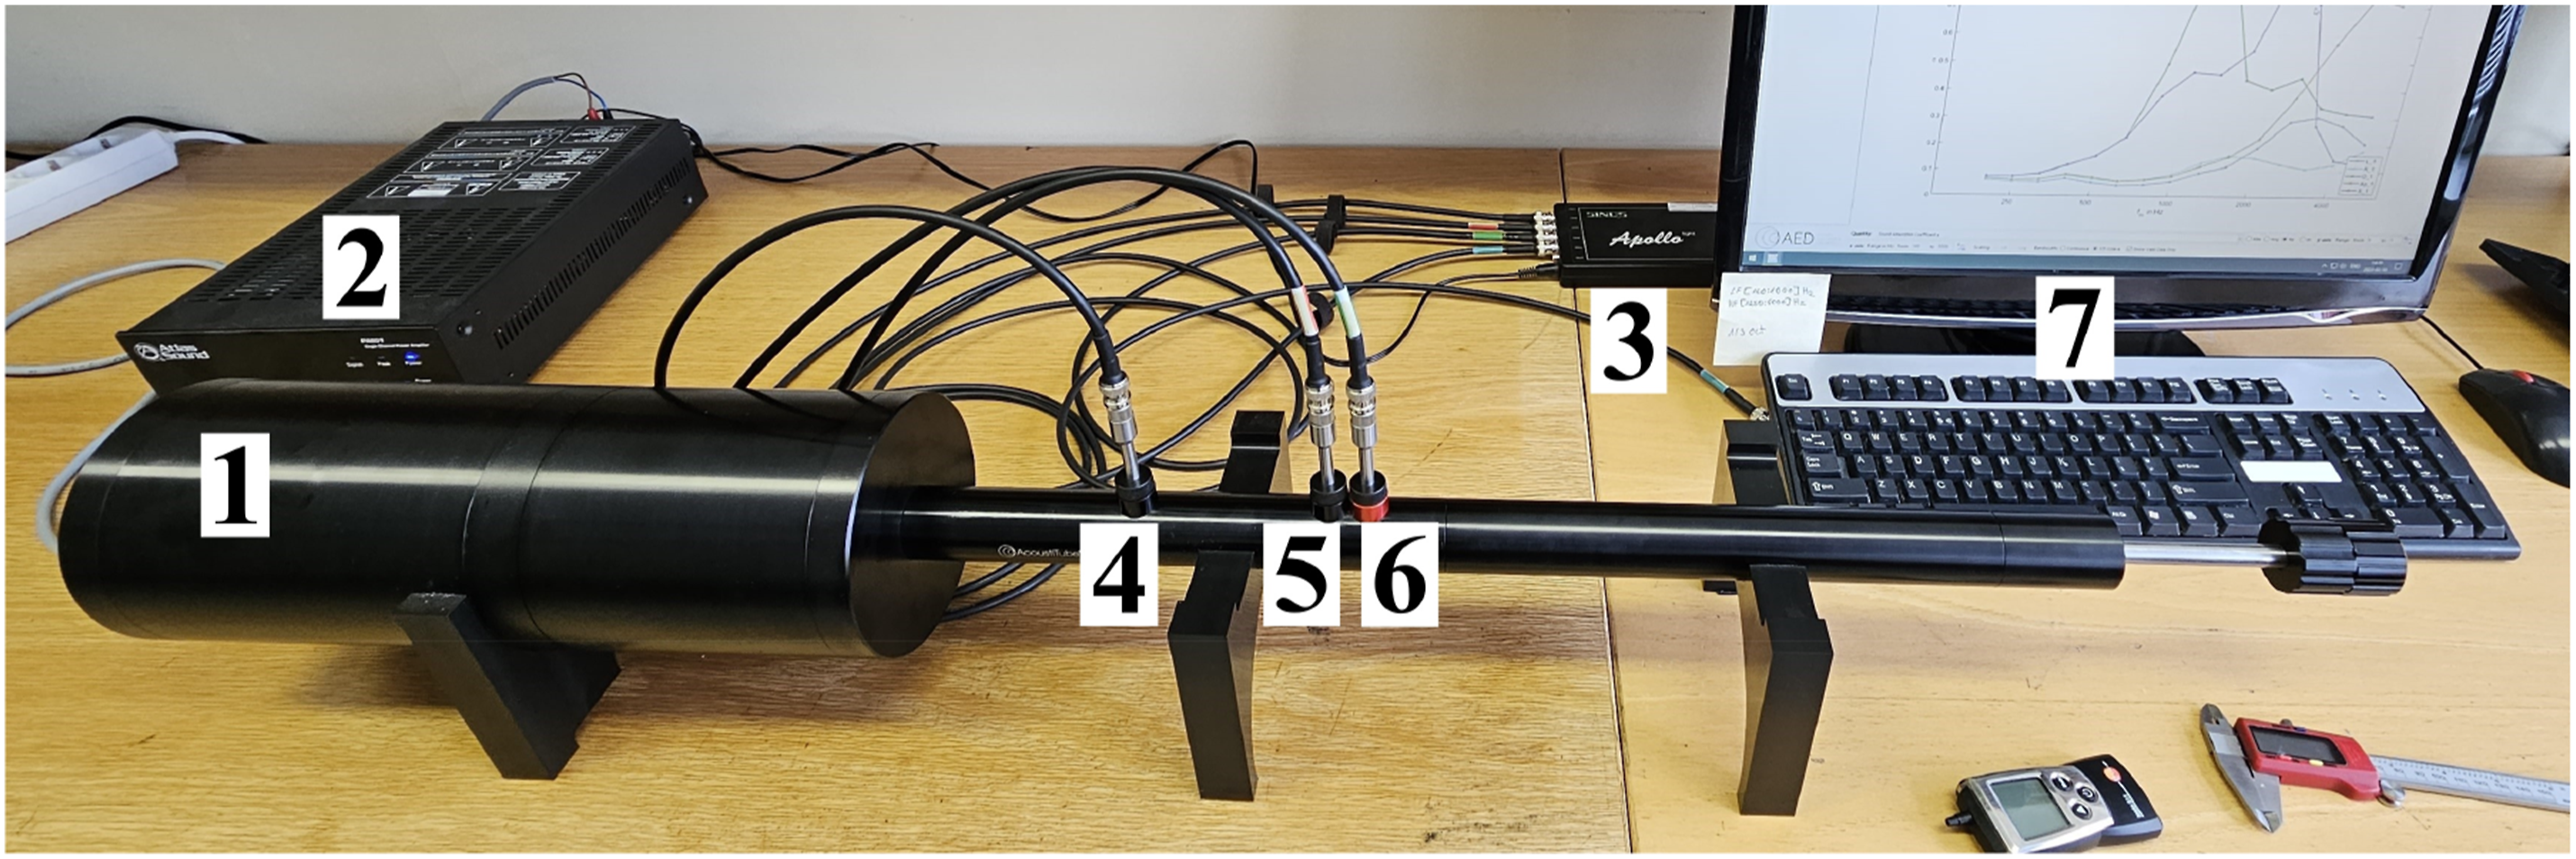
The sound pressure measurement determines the pressure at each frequency by equation (10):


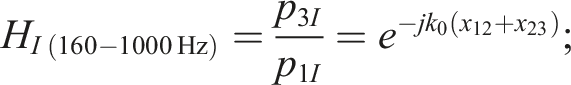

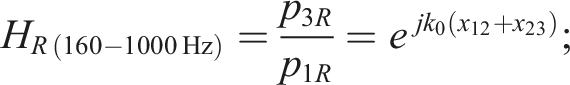

The sound reflection coefficient is calculated at two frequency ranges: for low R(160–1000 Hz) and high R(1–5 kHz) frequencies. The sound reflection coefficient (R) is calculated according to the following equation:

After getting a sound reflection coefficient, we can finally calculate the absorption coefficient for plane sound waves:

All sound absorption measurements were done with a 30 mm diameter impedance tube, and the results were processed using ‘AcoustiStudio’ software. Each sample and its combination were measured separately and then averaged. In total, 162 measurements were carried out in this study.
To summarize the results obtained and compare different layered structures, a single-value sound absorption coefficient was implemented in this study. The chosen values were the sound absorption average (SAA) according to ASTM C423 and the weighted sound absorption coefficient (α w ) according to ISO 11654.
Results
In this section, the main results of the study are presented. In the first subsection, the results of air flow resistivity measurements of PMFP are presented. In the second subsection, the results of the scanning microscopy are presented. Results of calculated PAM resonant frequencies are presented in the third subsection. In the fourth subsection – results of materials sound absorption characterization.
Results of air flow resistivity measurements
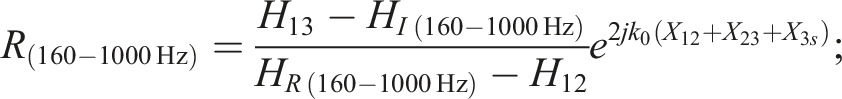
Static air flow resistivity of PMFP samples.
The static air flow resistivity decreased by 25.5% and the density decreased by 33.9% when comparing PMFP40 and PMFP80 samples. This reduction in airflow resistivity values could be related to the fact that less binding material was used, which could result in a larger number of open pores. To verify such hypotheses, scanning electron microscopy (SEM) images were taken and presented. The density of PVA is 1190 kg/m3, which is 30 times higher compared to PMFP. Reducing the PVA glue in the sample results in a higher decrease in the density of the sample compared to a decrease in static air flow resistivity.
Analysis of scanning electron microscopy images
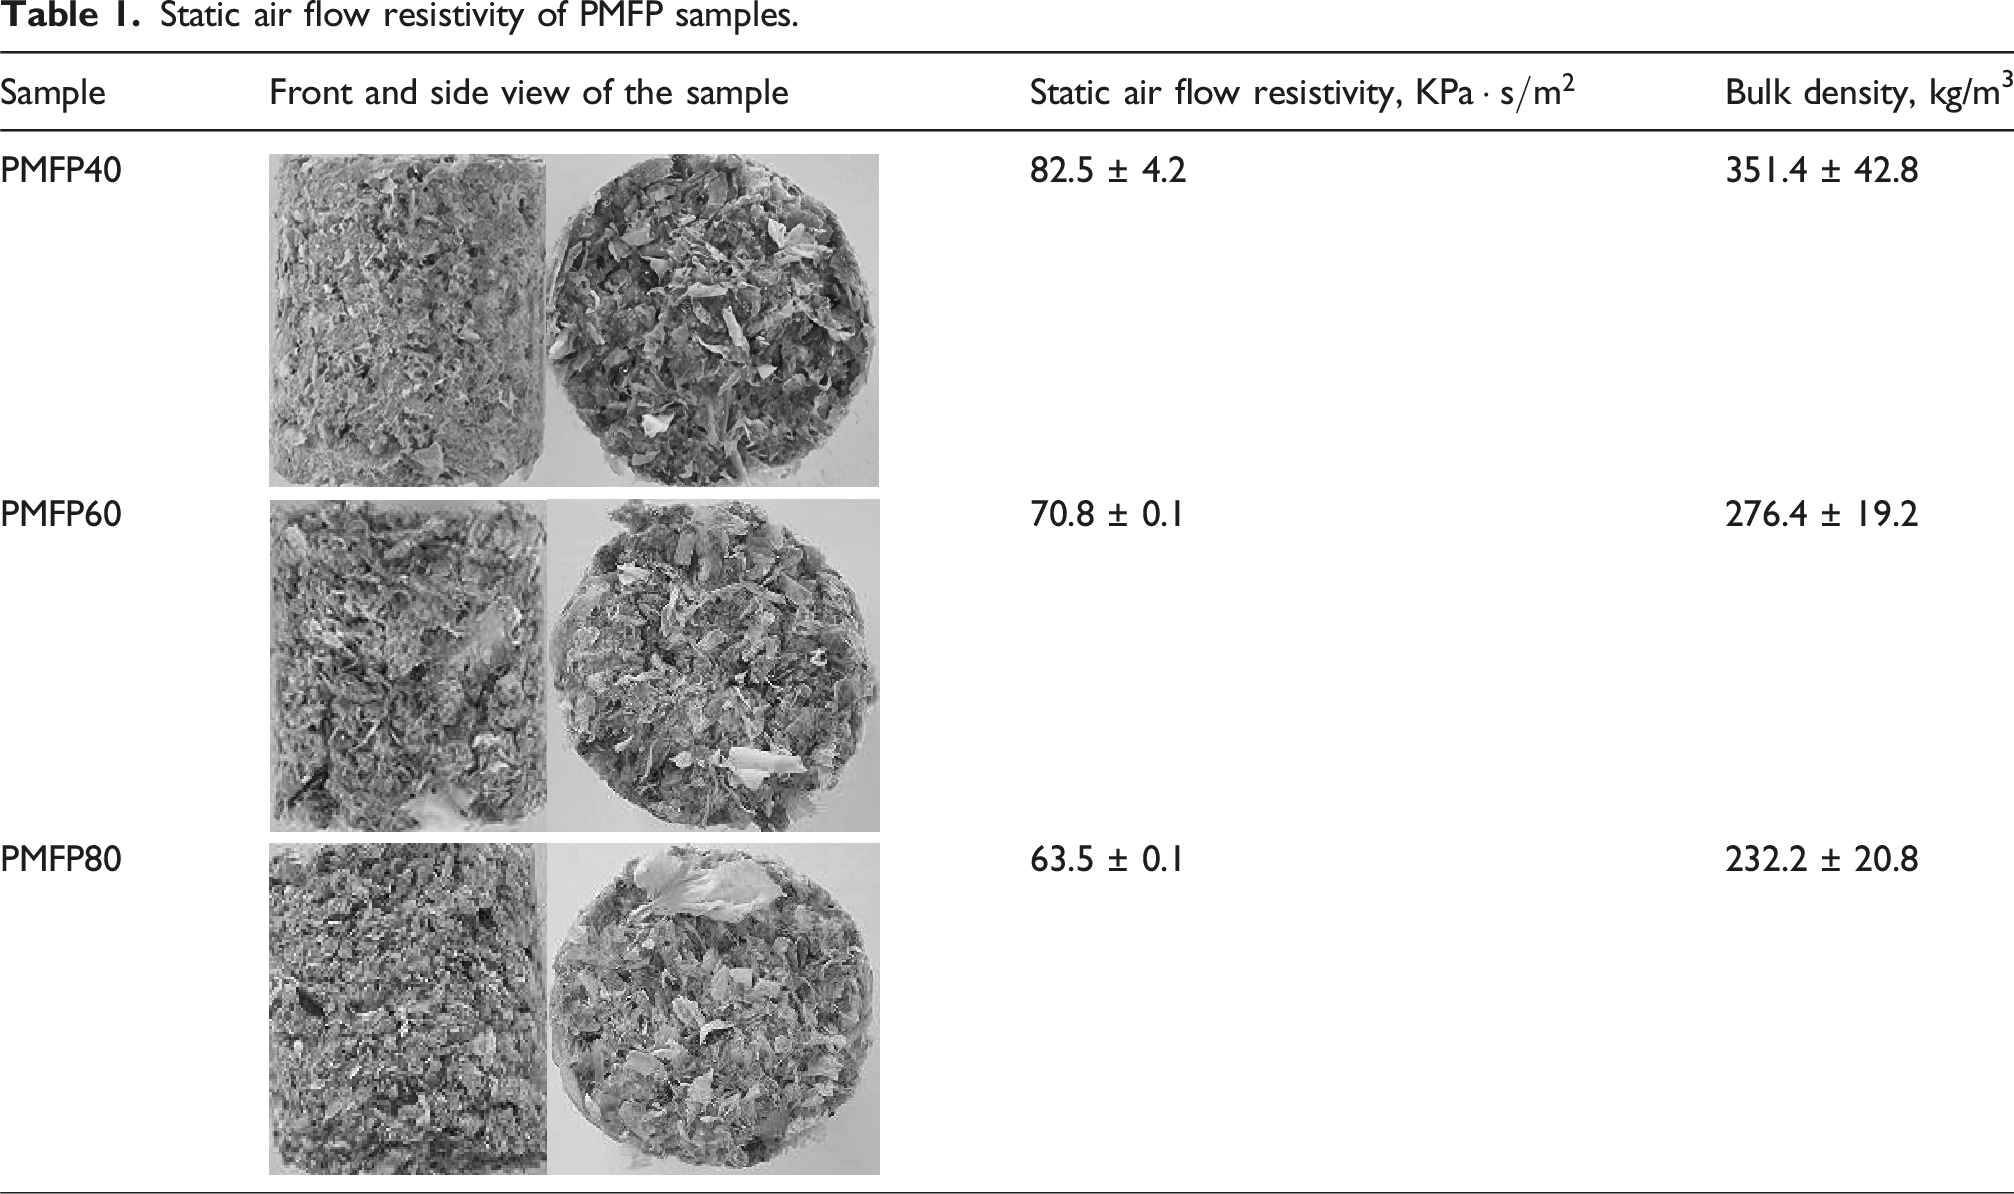
The PMFP SEM images are shown in Figure 5. The image identified the different fibres (Figure 5(a), (c), and (d)) and round platy particles (Figure 5(b)). These images clearly expose the gaps and poor connection between the different particles and fibres. The width of the fibres is 10–40 µm and length is 400–800 µm (Figure 5(a), (b), and (f)). The surface of the fibre particles was not very rough and contained some cracks (Figure 5(c) and (d)). There were also dust particles attached to the surface of the fibres (Figure 5(c)). There are also very fine fibre-like particles with a width of 1–2 µm and length is 10–20 µm (Figure 5(d)) and even smaller fibres with a width of 0.2–0.30 µm and length is 10–20 µm (Figure 5(e)). SEM image of plastic waste: (a, c, d) fibres, (b) round platy particles, (e) smaller fibres and (f) film residue.
Round plate particles are about 100–200 µm in diameter. The surface of the particles was rougher and contained many different very small pores (Figure 5(b)). Lastly, the image of plastic waste revealed a film (about 200–300 µm) residue (Figure 5(f)). The smooth surface of the fibres and film residues can reduce the bonding area between the raw materials (plastic waste) and the binder, which in turn can reduce the strength and durability of hardened samples. When comparing the images of fibres and round plate particles, it is seen that round plate particles had a much rougher surface with numerous random very small pores. Authors31–33 emphasize in their studies that the surface of fibres can influence the adhesion between the fibre and various binding materials. The research conducted by Haigh explains the effect of green and treated plastic fibres on bonding capacity when using a cement binder. It was found that fibre treatment alters their surface morphology, improving adhesion with the binder, which in turn increases the compressive, tensile, and flexural strength of the specimens. Cui et al., states that the surface of bamboo fibres treated with silane becomes rough, enhancing the bond with the binder. 34 Ali et al., observes that there are many voids between natural fibres (date palm surface fibres and pineapple leaf fibres) and different binding materials, which, in turn, increases thermal conductivity and sound absorption coefficient of final product. 35
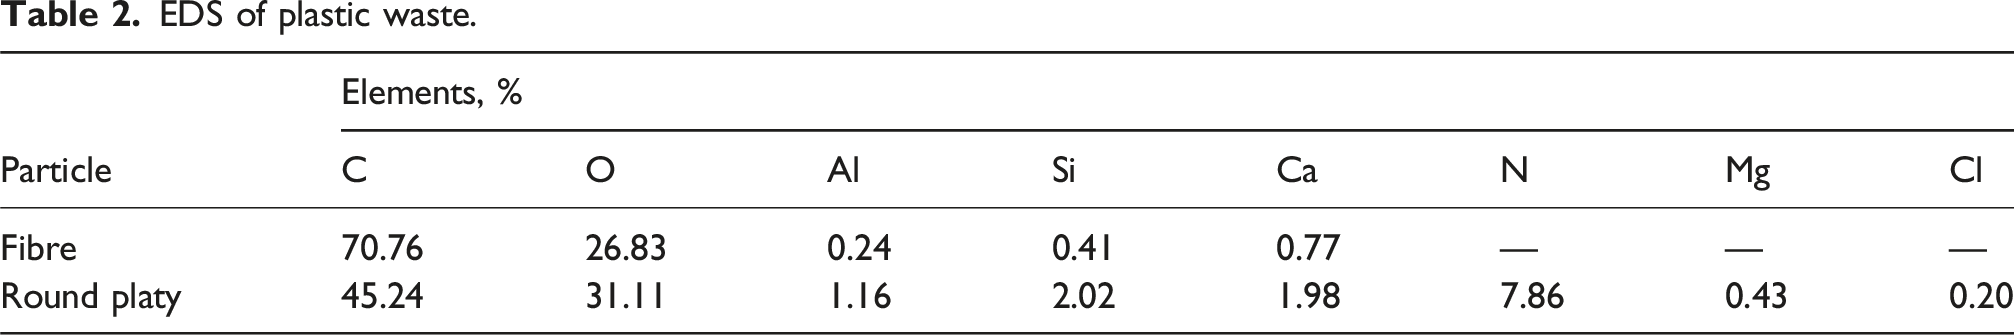
The EDS result of plastic fibres (Figure 6(a)) and round platy particles (Figure 6(b)) is shown in Table 2. It can be seen that there is a very high content of C (70.76%) and O (27.83%) and less Al, Si, and Ca elements (<1.5%) in the fibre (Figure 6(a)). Also, it can be seen that there are high contents of C (45.24%), O (31.11%), and N (7.86%) and less Al (1.16%), Si (2.02%), Ca (1.98%), Mg (0.43%), and Cl (0.20%) elements in the round platy particles (Figure 6(b)). Ca, Si, Al, and other elements are residues from the technological processing of plastic waste. SEM and EDS of plastic waste: (a) fibres and (b) round platy particles. EDS of plastic waste.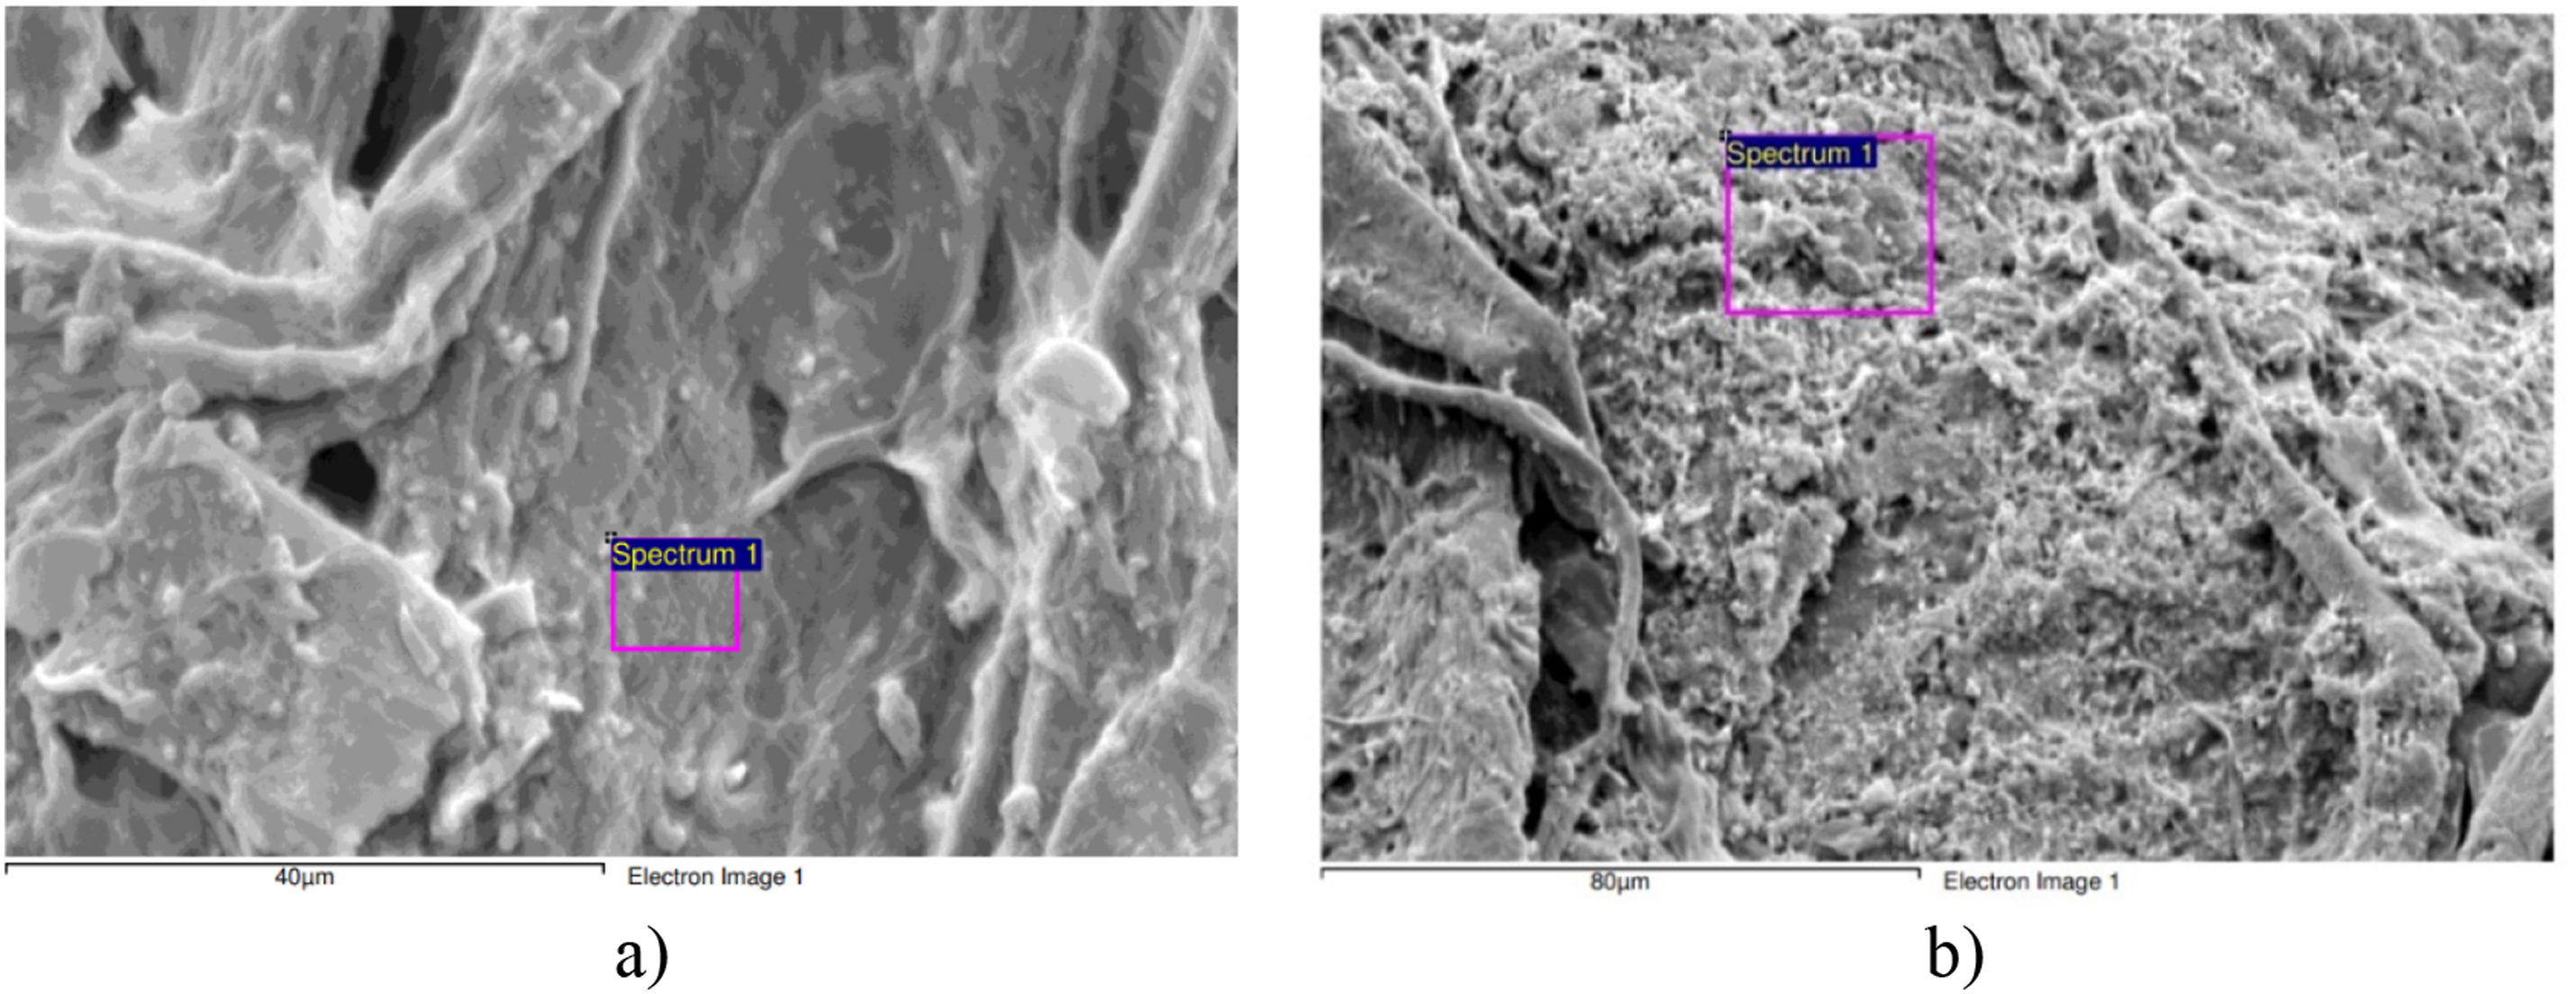
The SEM of the PMFP40, PMFP60, and PMFP80 composite materials is shown in Figure 7. PMFP40 samples show a compact matrix with a few voids in the surface near to the fibres, thus indicating that the binding material appears to influence and change the microstructure in this case. The binder material is well distributed throughout the matrix. The fibres are perfectly covered with dense binding material, which shows a good bond between the fibres and other particles (Figure 7(a)). The fibre became a very smooth surface because the microcracks are also filled with a binding material (Figure 7(b)). SEM image of composite samples: (a) and (b) PMFP40, (c) and (d) PMFP60, and (e) and (f) PMFP80.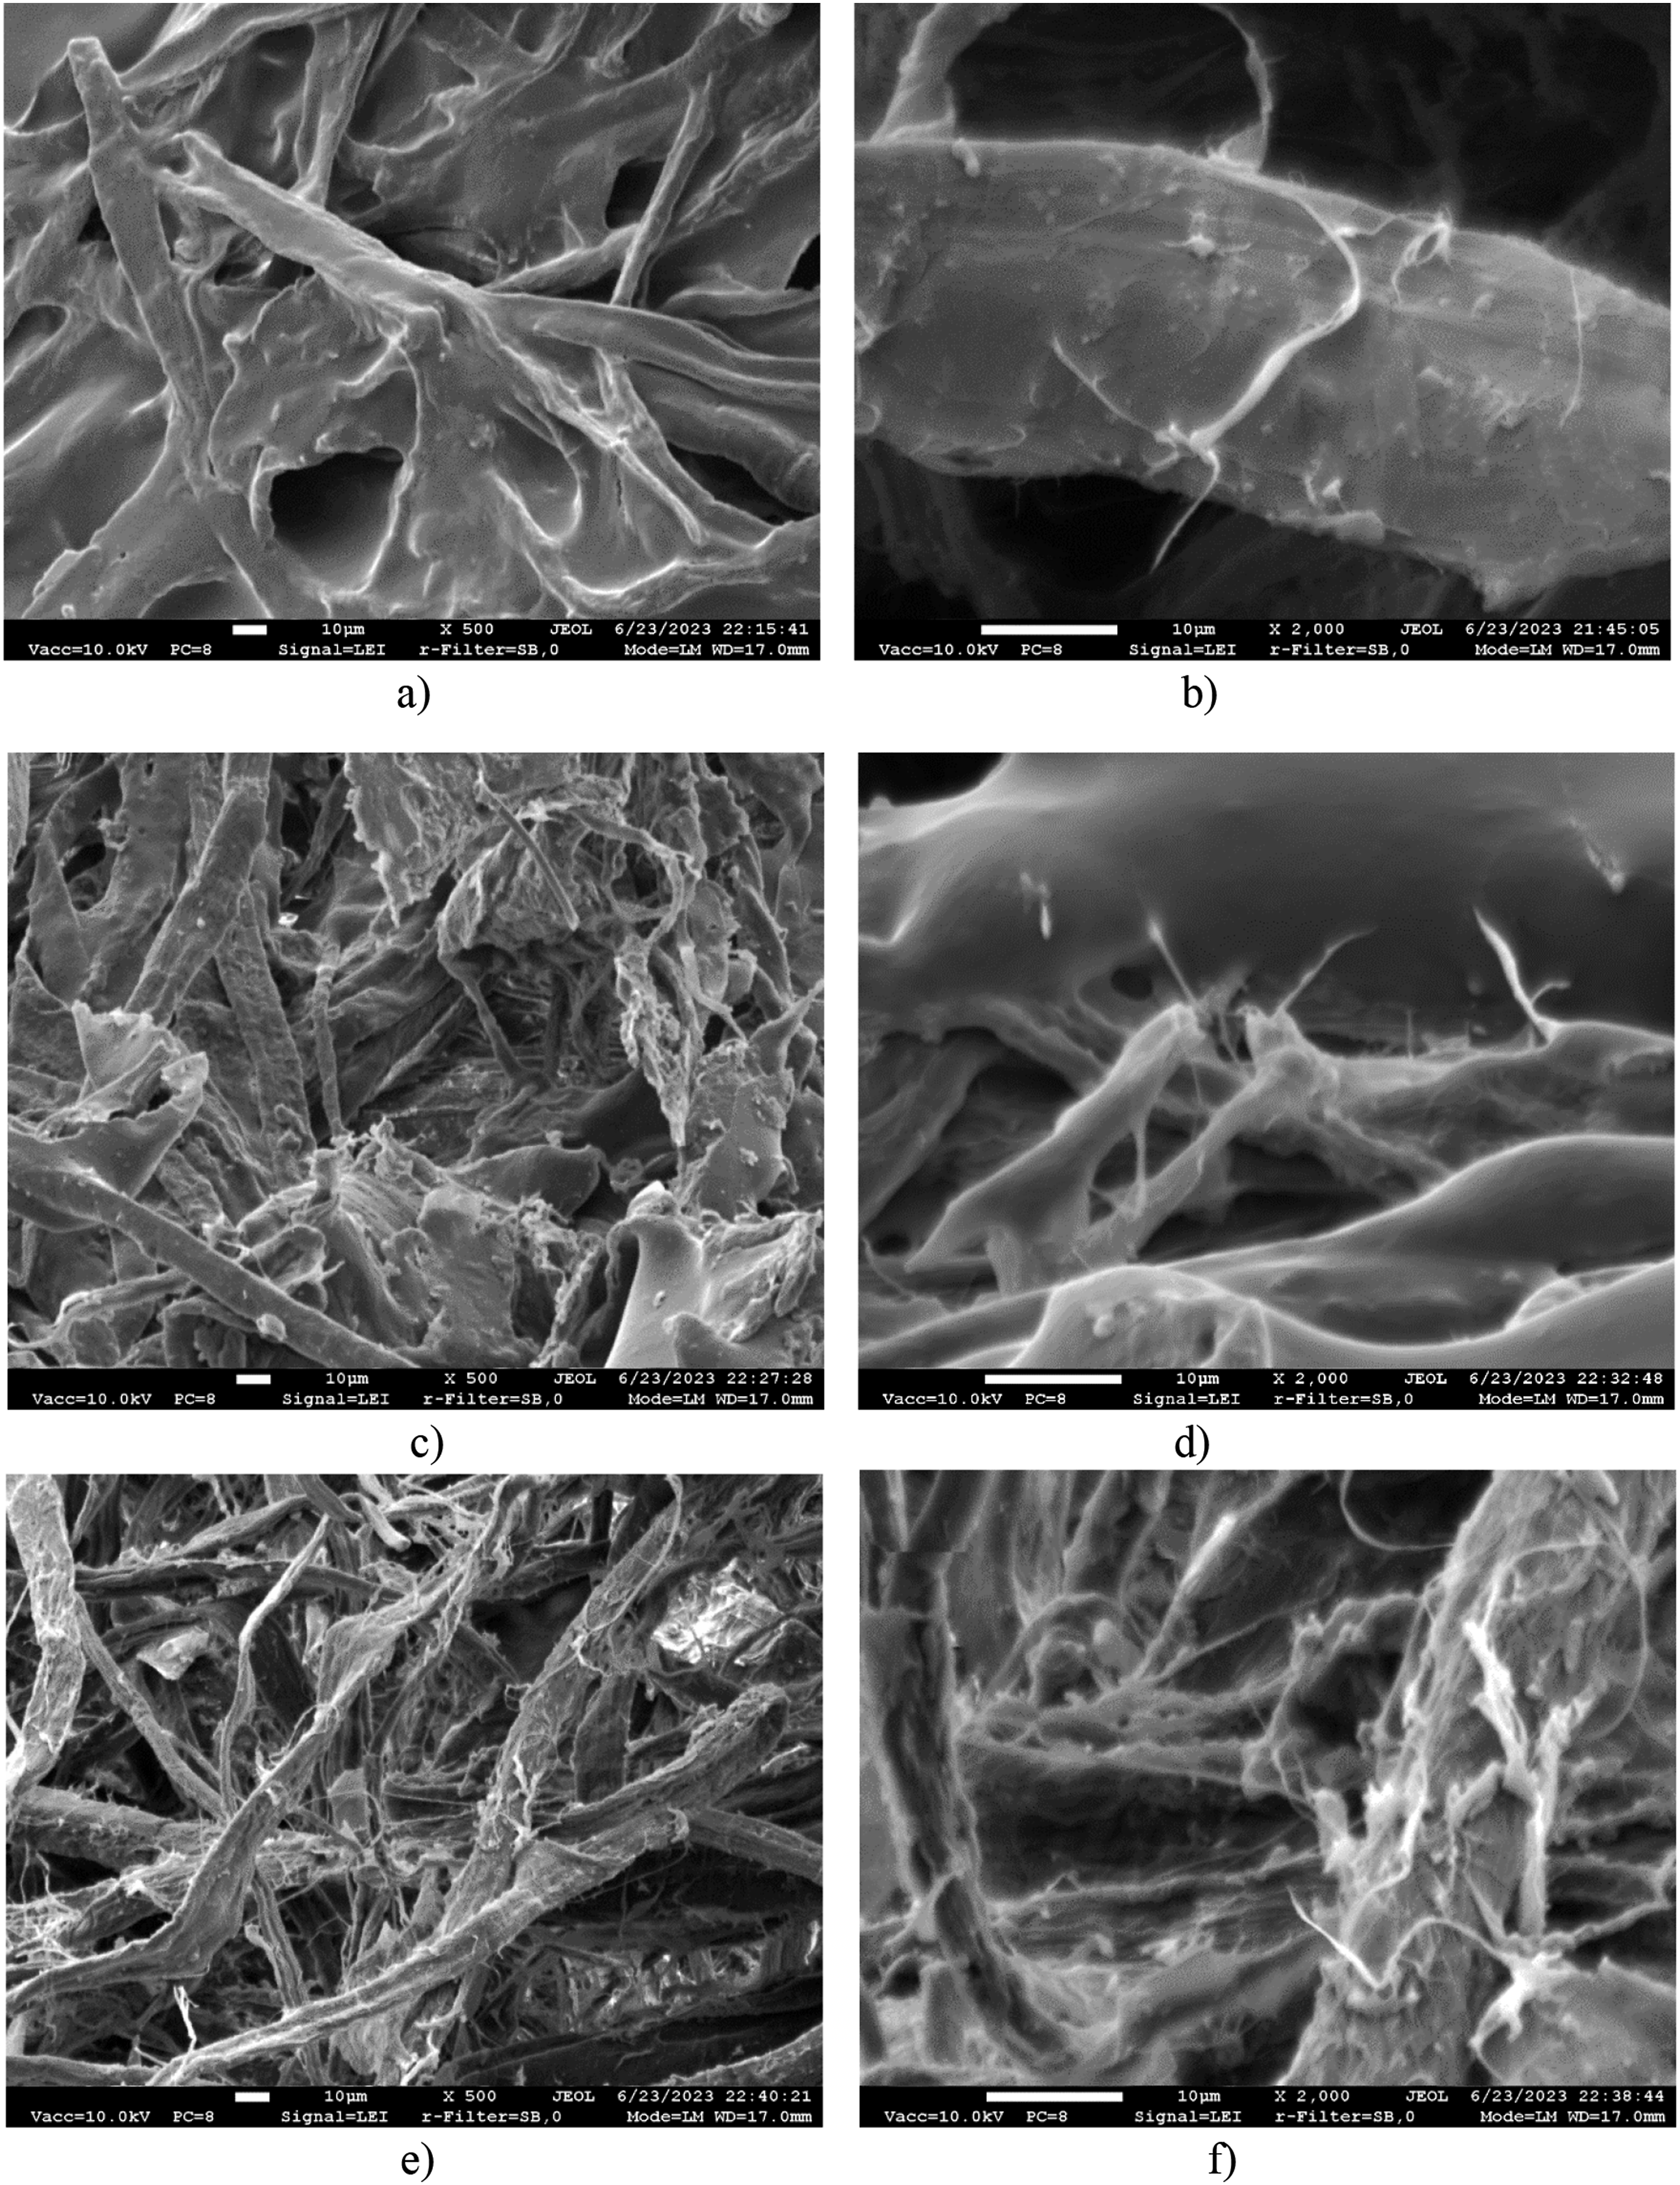
The structure of the PMFP60 sample is sufficiently homogeneous. The content of voids in the matrix increases compared to the structure of the PMFP40 sample. The image of the PMFP60 specimen shows that the fibres are covered with the PVA binder material. However, some of the fibres cross and overlap each other, which prevents the PVA from interlacing properly with the fibres (Figure 7(c)).
The structure of PMFP80 is loose and not homogeneous, and individual fibres can be seen without binding material (Figure 7(e)), compared to the PMFP40 and PMFP60 samples. The amount of voids is very high. However, this led to a smaller bulk density and higher acoustic properties of the composite materials (Table 1).
The bulk density and the number of voids in the composite materials are a function of the PVA content. The interconnection between the plastic fibres was improved as a result of the PVA, which improved the binding properties, leading to a decrease in the amount of voids; however, the acoustic properties decrease. An increase in the contact area between plastic fibres and PVA increases the bulk density, thus increasing static air flow resistivity (Table 1).
Calculation of PAM resonant frequencies
Calculated and measured resonant frequencies of PAM.
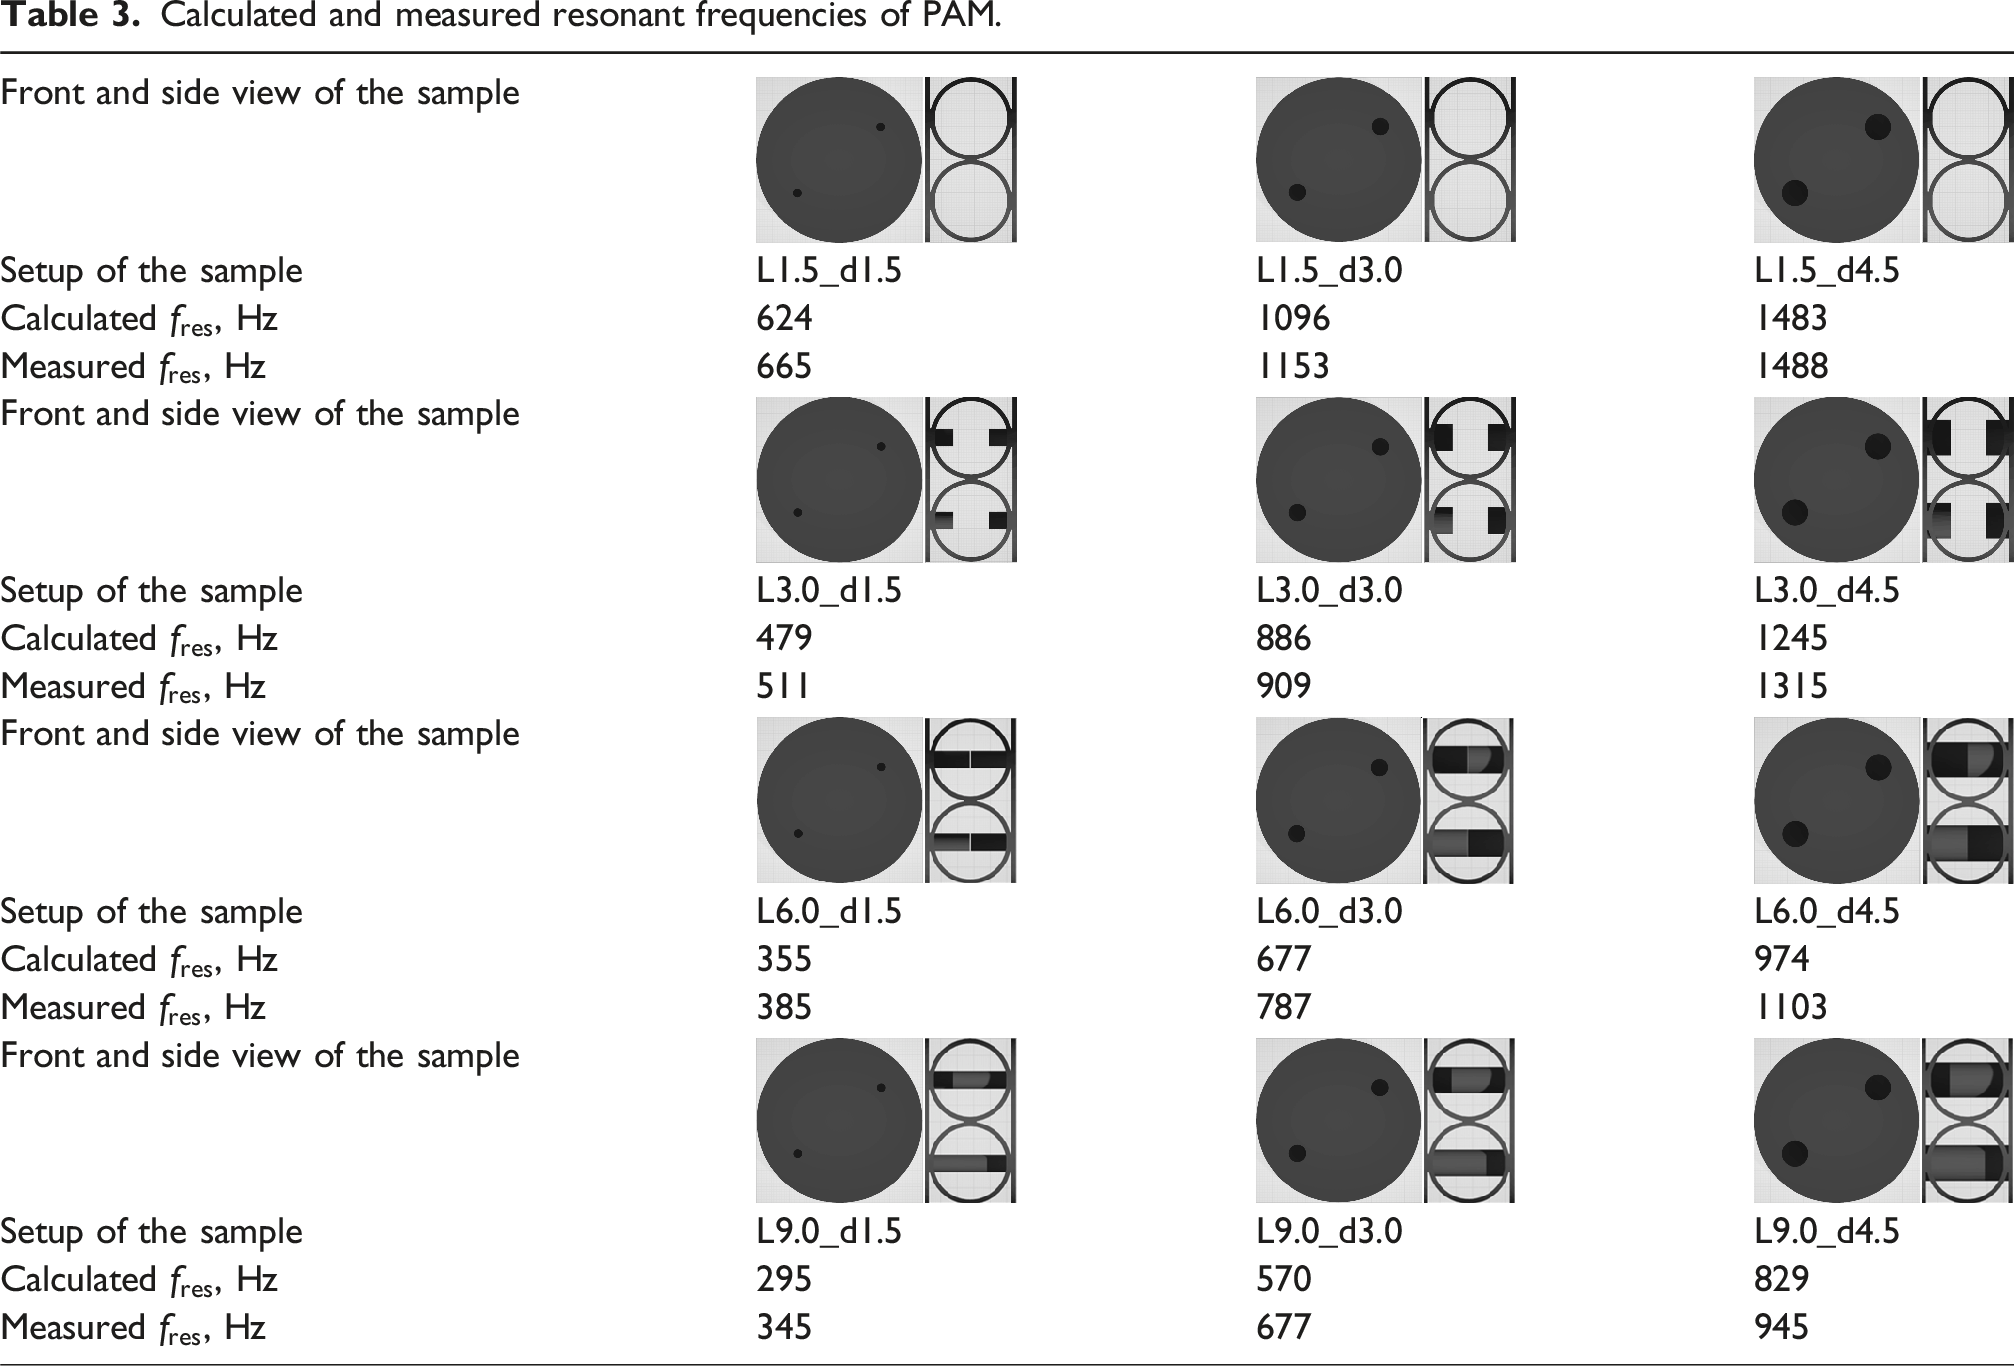
The calculated values helped us better understand the expected tendencies and frequencies at which the resonator would work as a sound absorber. Measured and calculated values show the same tendencies as for
The results of sound absorption characterization in the impedance tube
This subsection of the paper presents the results of the study, a summary, and partial conclusions. Sound absorption results of PMFP and PAM are presented both separately and as composed structural materials. The final weighted sound absorption coefficient (α w ) with material classification is presented at the end.
In Figure 8, PMFP sound absorption results are presented. The figure is divided into three sections according to the thickness of the material (a – 10 mm; b – 30 mm; c – 50 mm). It is shown that with increasing thickness of PMFP samples the peak of sound absorption shifts to a lower frequency range, and sound absorption values are slightly lower. Such a shift occurs due to the phenomenon known as quarter-wavelength rule, when the first peak sound absorption frequency varies from 1/8 to 1/4 wavelength.
36
For 10 mm samples, the sound absorption peak varies from 0.86 to 0.92 at 2500 Hz, for 30 mm it varies from 0.76 to 0.85 at 800 Hz, and for 50 mm it varies from 0.69 to 0.74 at 500 Hz. Lower average peak values of sound absorption are achieved when the PMFP content is lower (PMFP40). It was noted that peak sound absorption values not only shift to lower frequency range but also decrease as well. Such phenomena were shown by Delany et al., where it was stated that characteristic acoustic impedance increases with the thickness, especially at lower frequencies, which leads to lower sound absorption values.
37
PMFP sound absorption results when thickness of the material is (a) 10 mm; (b) 30 mm; (c) 50 mm.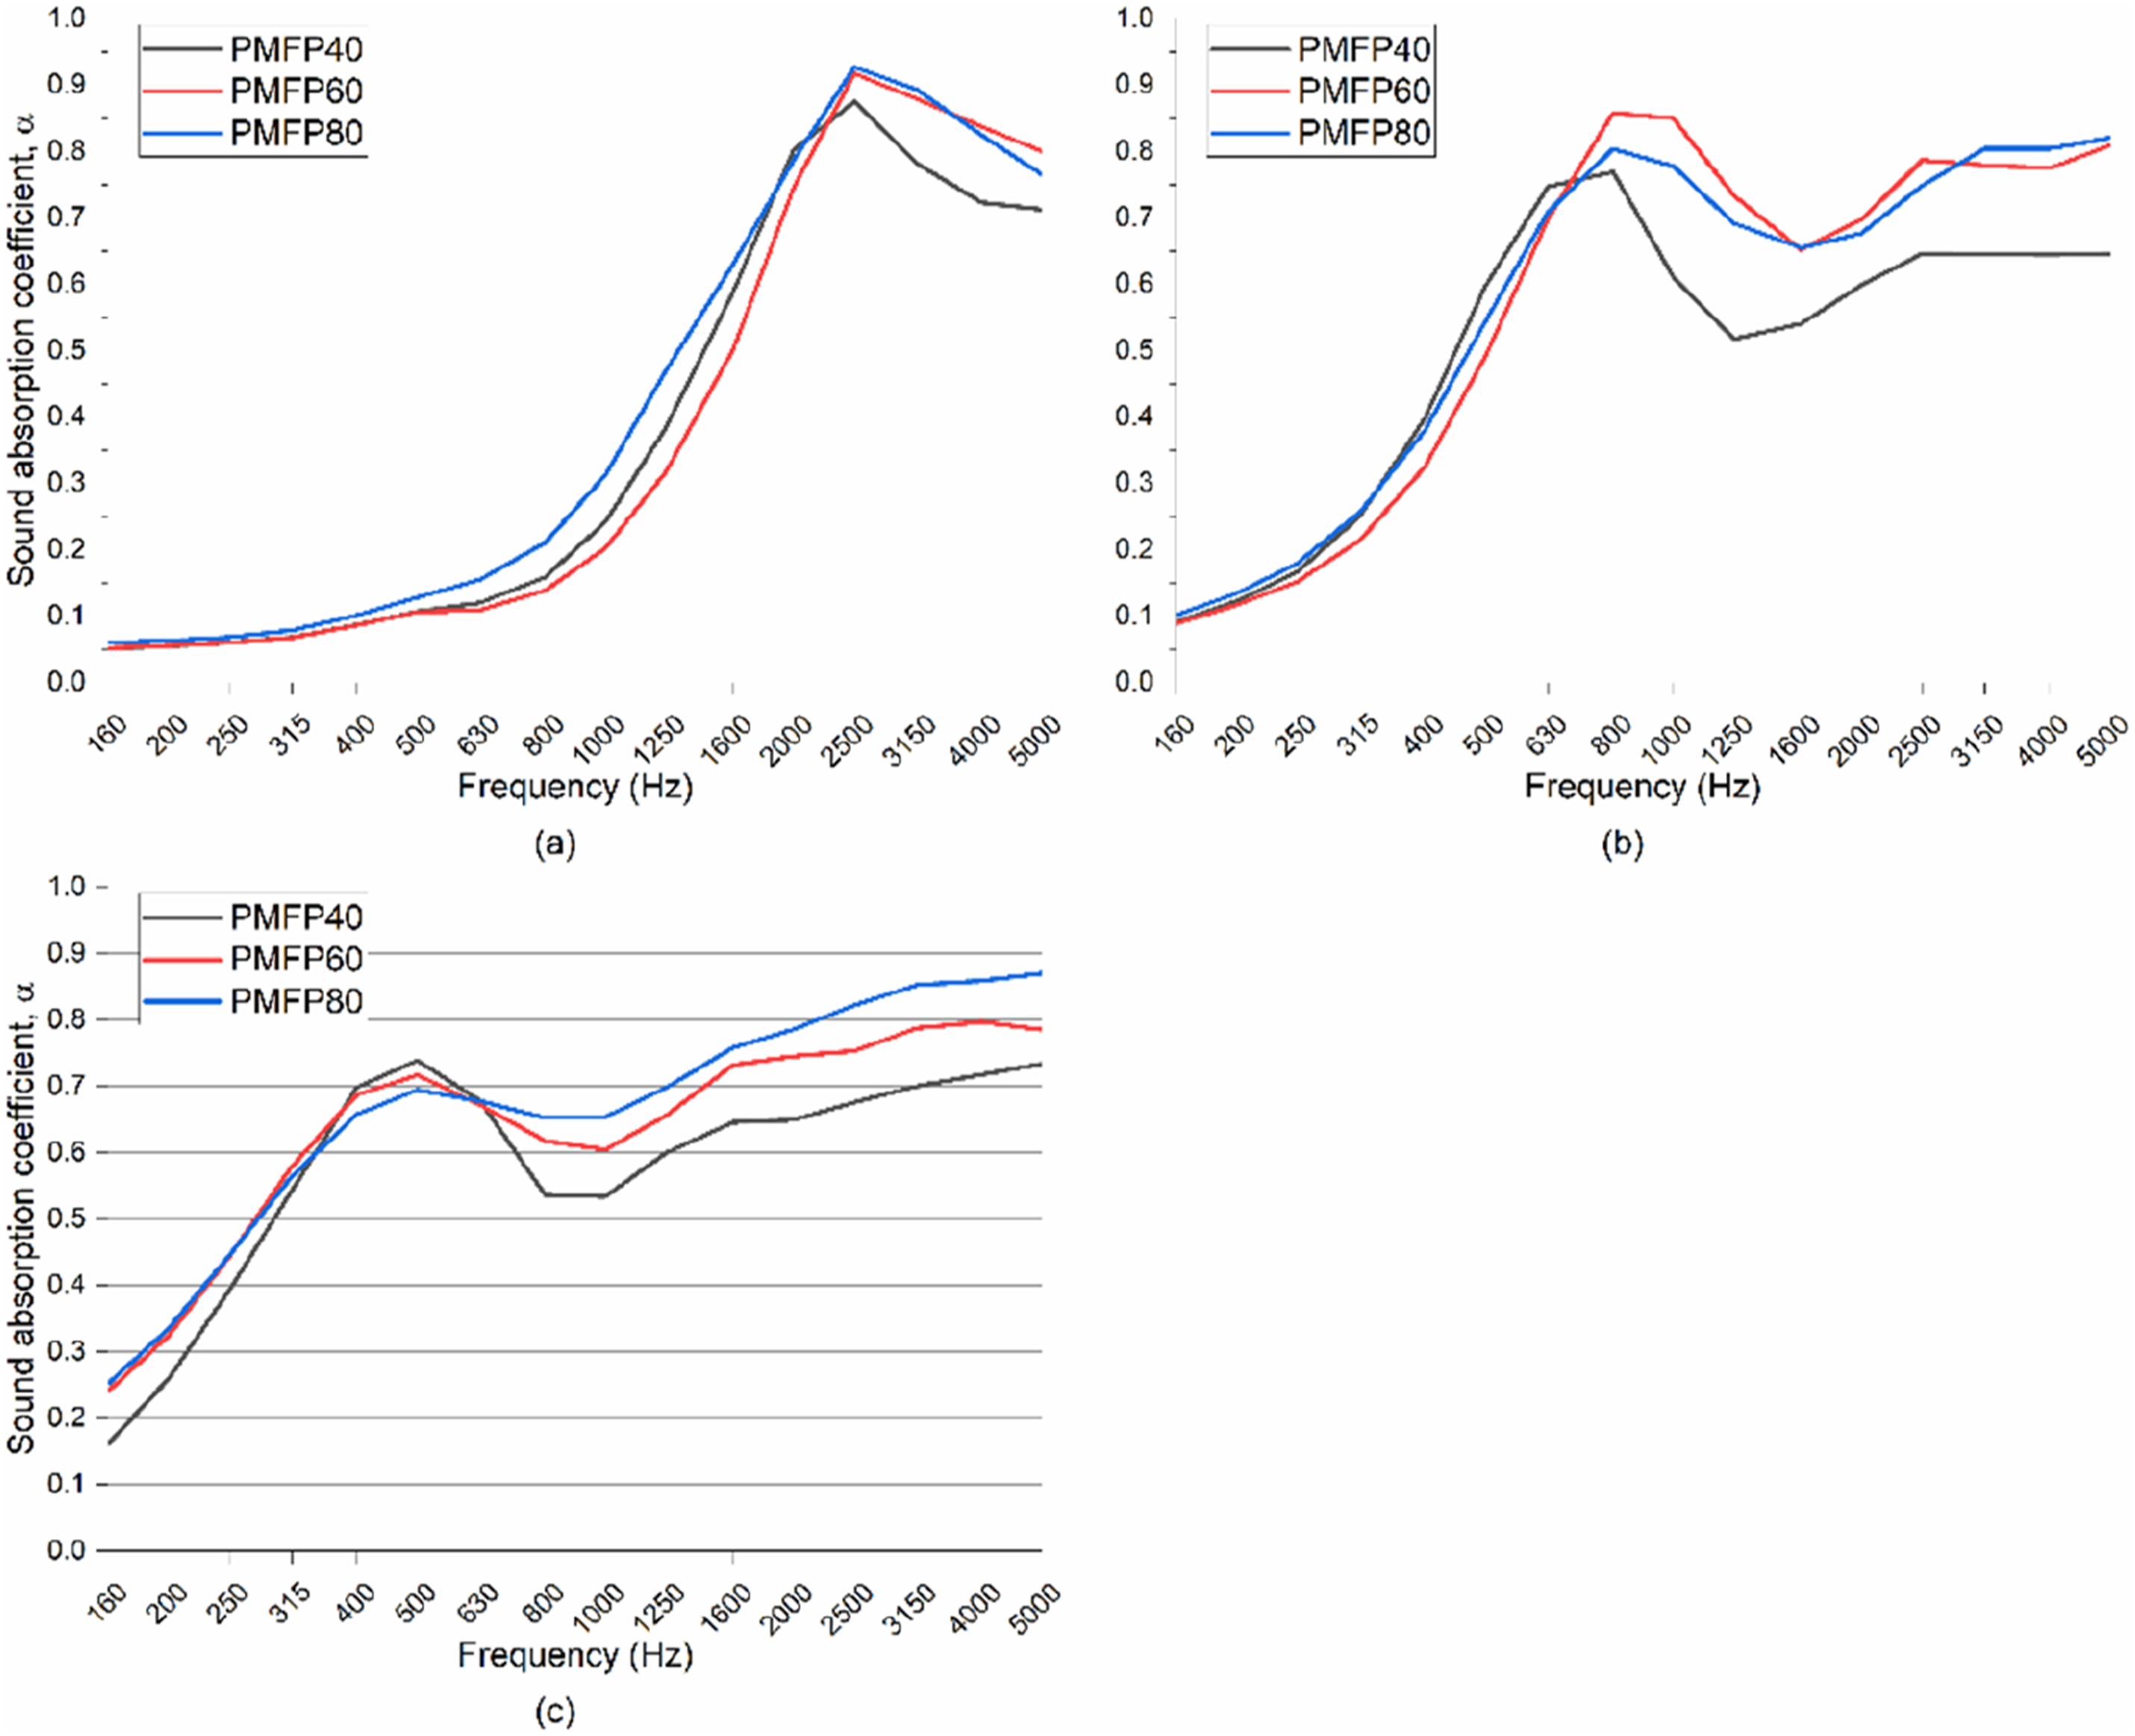
Further PMFP investigation was performed in combination with PAM samples. For further investigation, it was chosen to use PMFP60 samples due to the highest or nearly highest sound absorption values at the first peak of sound absorption.
In Figure 9, PAM different neck/cavity ratio sound absorption results, measured with rigid back, are presented in 1/3 octave band. Figure divided into three sections according to the diameter of the neck inlet / outlet (a – 1.5 mm; b – 3.0 mm; c – 4.5 mm). The PAM resonators, made from PET-G plastic filament, achieved the highest sound absorption with a wider neck inlet/outlet, and lowest with narrower, 1.5 mm, diameter inlet/outlet. The L1.5_d4.5 PAM resonator peaked at 1630 Hz with a sound absorption value and the L3.0_d4.5 PAM resonator with a value of 0.93 at 1250 Hz frequency, which are the highest values for this material. These results indicate that recycled plastic could be used as building acoustic material or structure. PAMs with 1.5 mm neck inlet/outlet diameter (a) sound absorption coefficient peak value is at lower frequencies (from 160 to 500 Hz). The longer the neck, the lower the resonant frequencies and the values that are achieved. The resonance frequency sound absorption values varied from 0.38 to 0.72 depending on the length of the neck. PAMs with 3.0 mm neck inlet/outlet diameter (b) sound absorption coefficient peaked value lays in middle frequencies (from 500 to 1600 Hz). Again, the longer the neck, the lower the resonant frequencies and the values that are achieved. Although here it is not that obvious, which could be a result of a changing volume of the cavity because of an intruding neck. The resonance frequency values ranged from 0.73 to 0.86 depending on the length of the neck. PAMs with 4.5 mm neck inlet/outlet diameter (c) sound absorption coefficient peaked value are slightly shifted to higher frequencies in comparison to 3.0 mm necks, but still are in middle frequencies (from 500 Hz to 1600 Hz). The same tendencies as before: the longer the neck, the lower the resonant frequencies and the sound absorption values that are achieved, but more subtle, because of changing volume of the cavity as a result of an intruding neck. The resonant frequency values ranged from 0.81 to 0.93 depending on the length of the neck. PAM sound absorption results, where neck diameter is (a) 1.5 mm; (b) 3.0 mm; (c) 4.5 mm.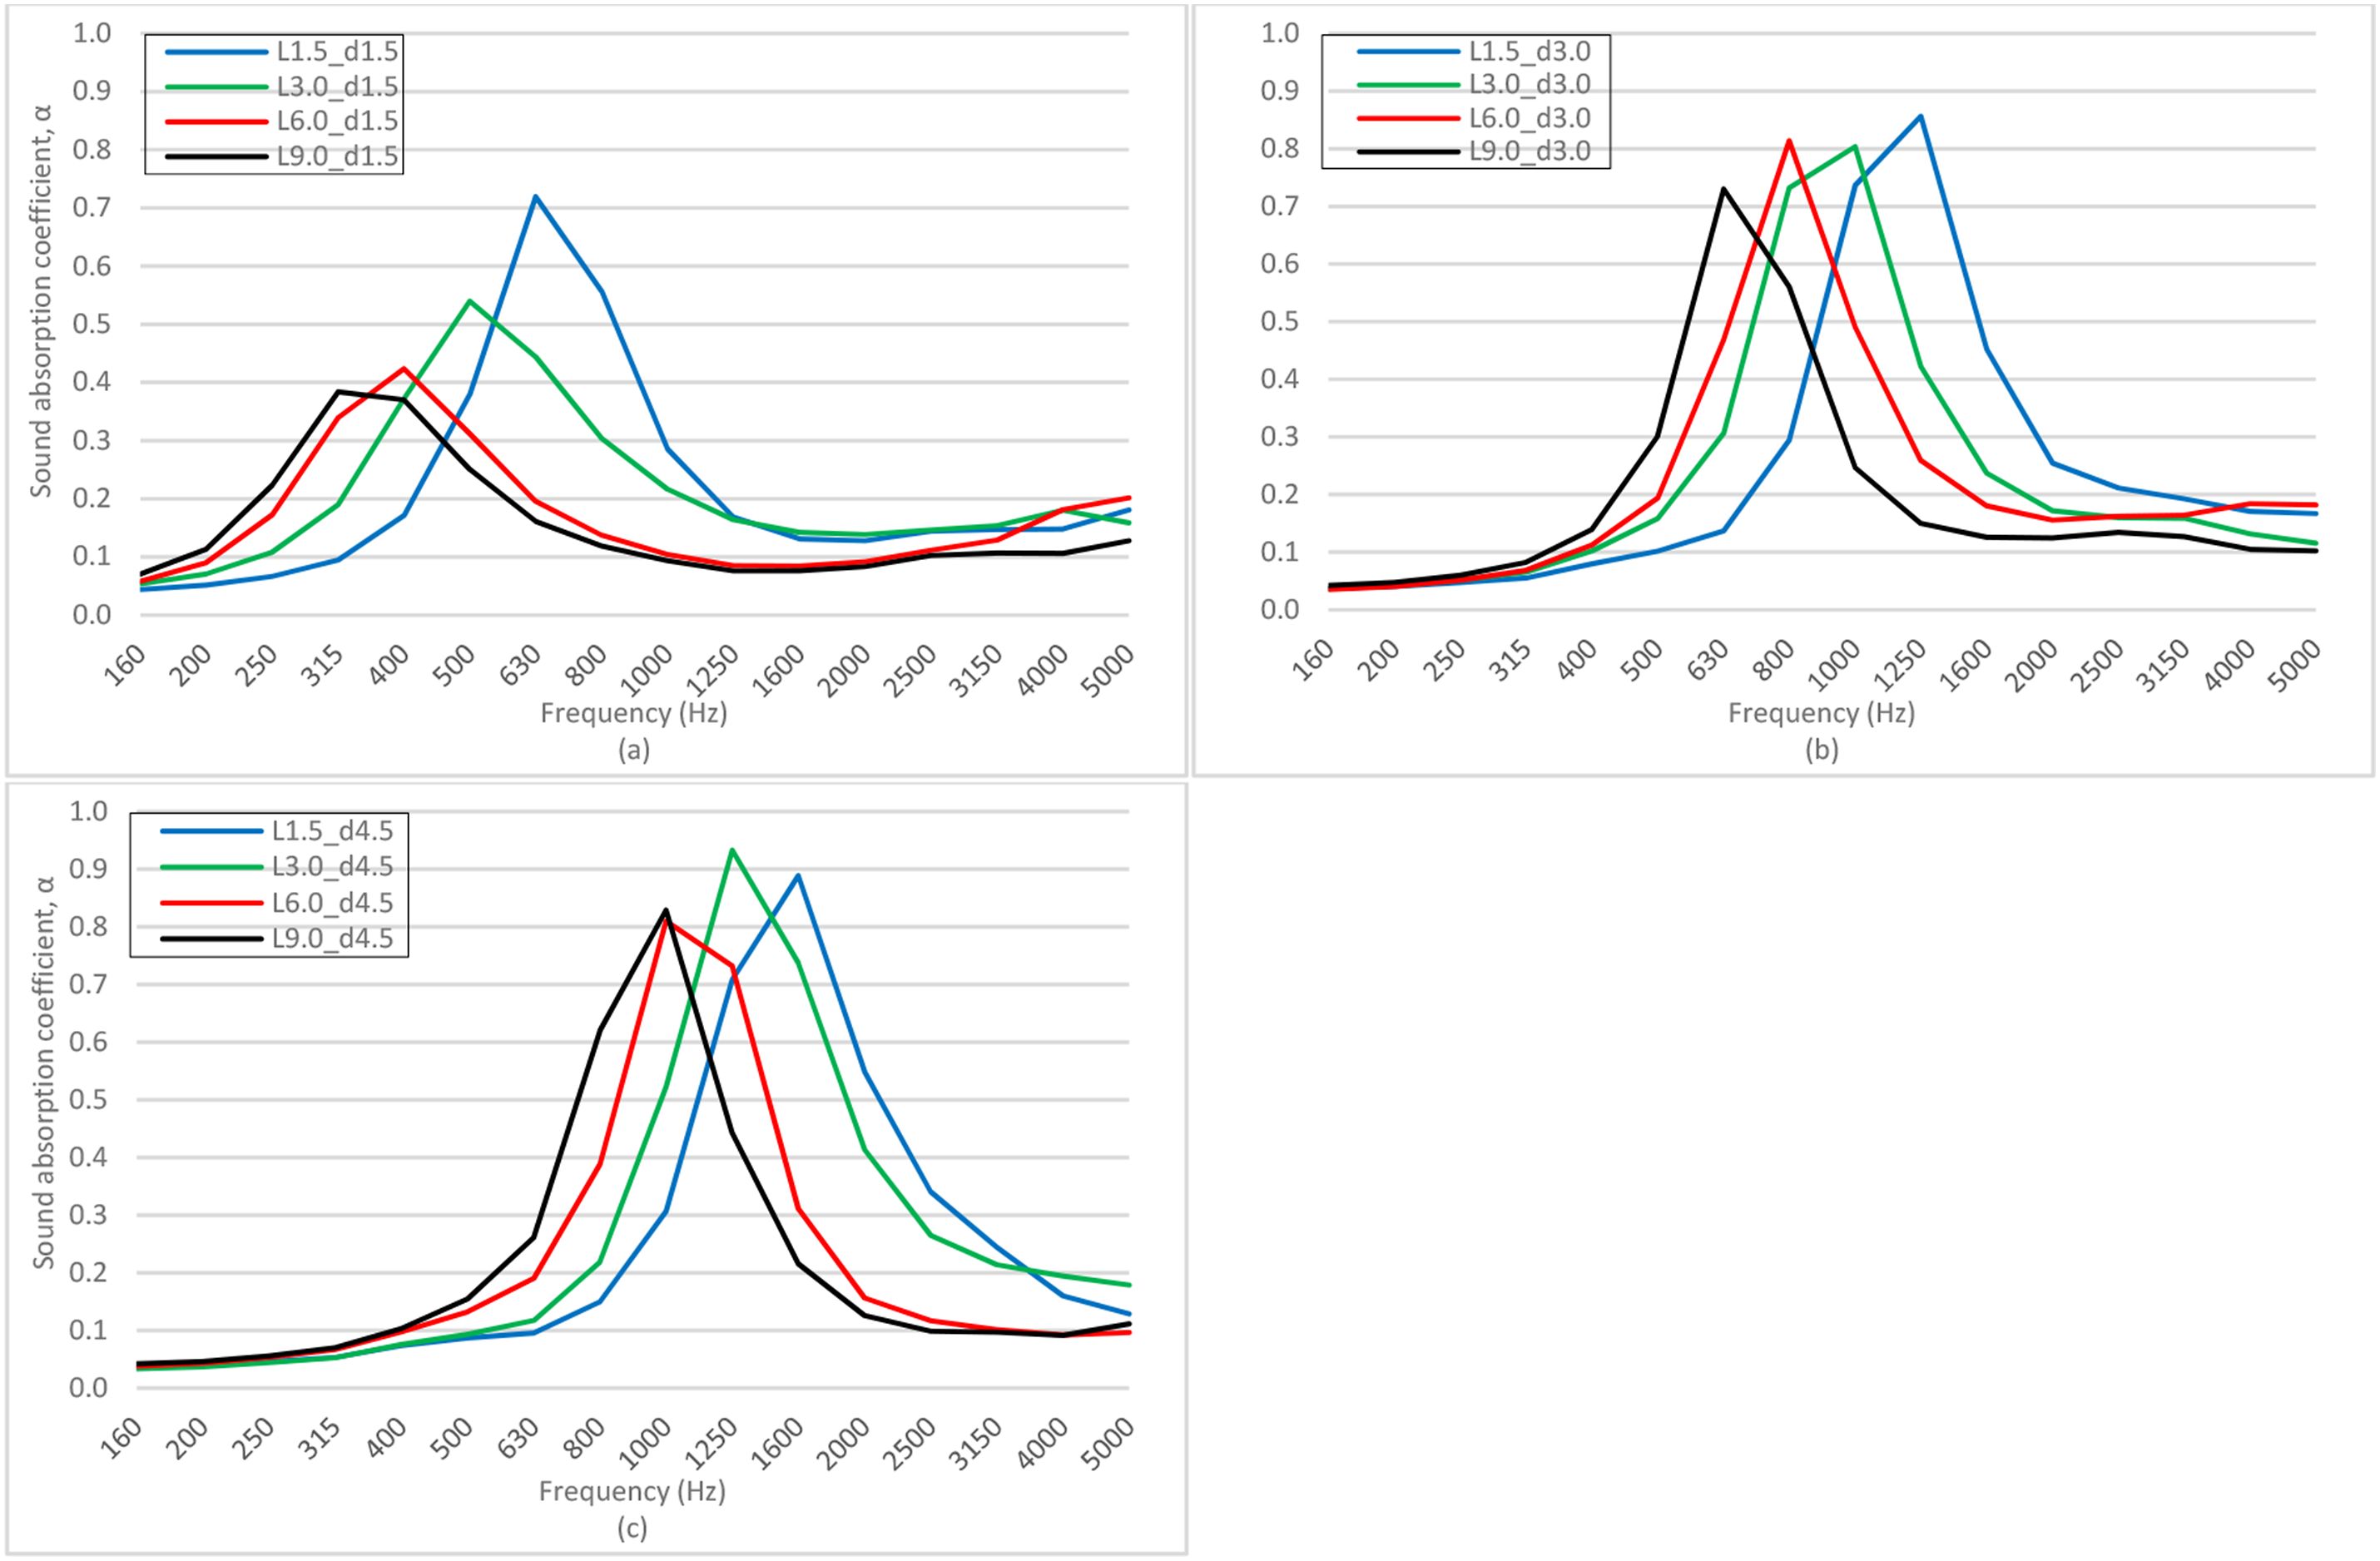
For further investigation, three PAM designs were chosen for composite layered sound-absorbing material (Figure 3). PAMs were chosen according to their resonant frequencies and values at 500 Hz (L3.0_d1.5), 630 Hz (L9.0_d3.0), and 1000 Hz (L9.0_d4.5).
In Figure 10, the sound absorption results of PAM L3.0_d1.5 with PMFP60 of different thickness ((a) 10 mm; (b) 30 mm; (c) 50 mm) are presented. The air gap behind the chosen layered PMFP and PAM composite material was introduced to simulate the sound-absorbing structures where the air gap behind is often used. Pushing the structure away from the rigid wall allows one to shift sound absorption peak value to lower frequency range. Such a phenomenon was explained by Allard and Atalla.
38
It was stated that when the material is supported by an air gap, the velocity reaches maximum at the 1/4 wavelength, thus increasing the values of the sound absorption coefficient in the lower frequency range. When there is no air gap (0 mm), in all cases, the sound absorption peak is shifted to higher frequencies (in comparison to the same structure when there is an air gap) and only the layered structure materials are absorbing sound waves. For PAM L3.0_d1.5 combined with PMFP60 of 10 mm thickness when there is no air gap, sound absorption peaked at 630 Hz with 0.80 value, with PMFP60 of 30 mm peaked at 400 Hz with 0.79 value, and with PMFP60 of 50 mm peaked at 315 Hz with 0.69 value. From this, we can conclude that the thicker the structure, the lower the frequency, although sound absorption values tend to get lower. From (a) and (b) graphs, we can see that adding 50 mm of air gap behind the structure allows for sound absorption peak in even lower frequencies for PAM L3.0_d1.5 combined with PMFP60 of 10 mm thickness in 315 Hz with value of 0.74 and with PMFP60 of 30 mm thickness in 250 Hz with value of 0.75. In graph (c), adding any air gap behind the structure shifts the sound absorption peak beyond the measurement equipment limit, which is lower than 160 Hz. Although, presumably, we are getting a second narratively flat high-sound absorption peak with values around 0.70 from 630 to 1600 Hz. PAM L3.0_d1.5 with: (a) 10 mm; (b) 30 mm; (c) 50 mm PMFP60 and air gap.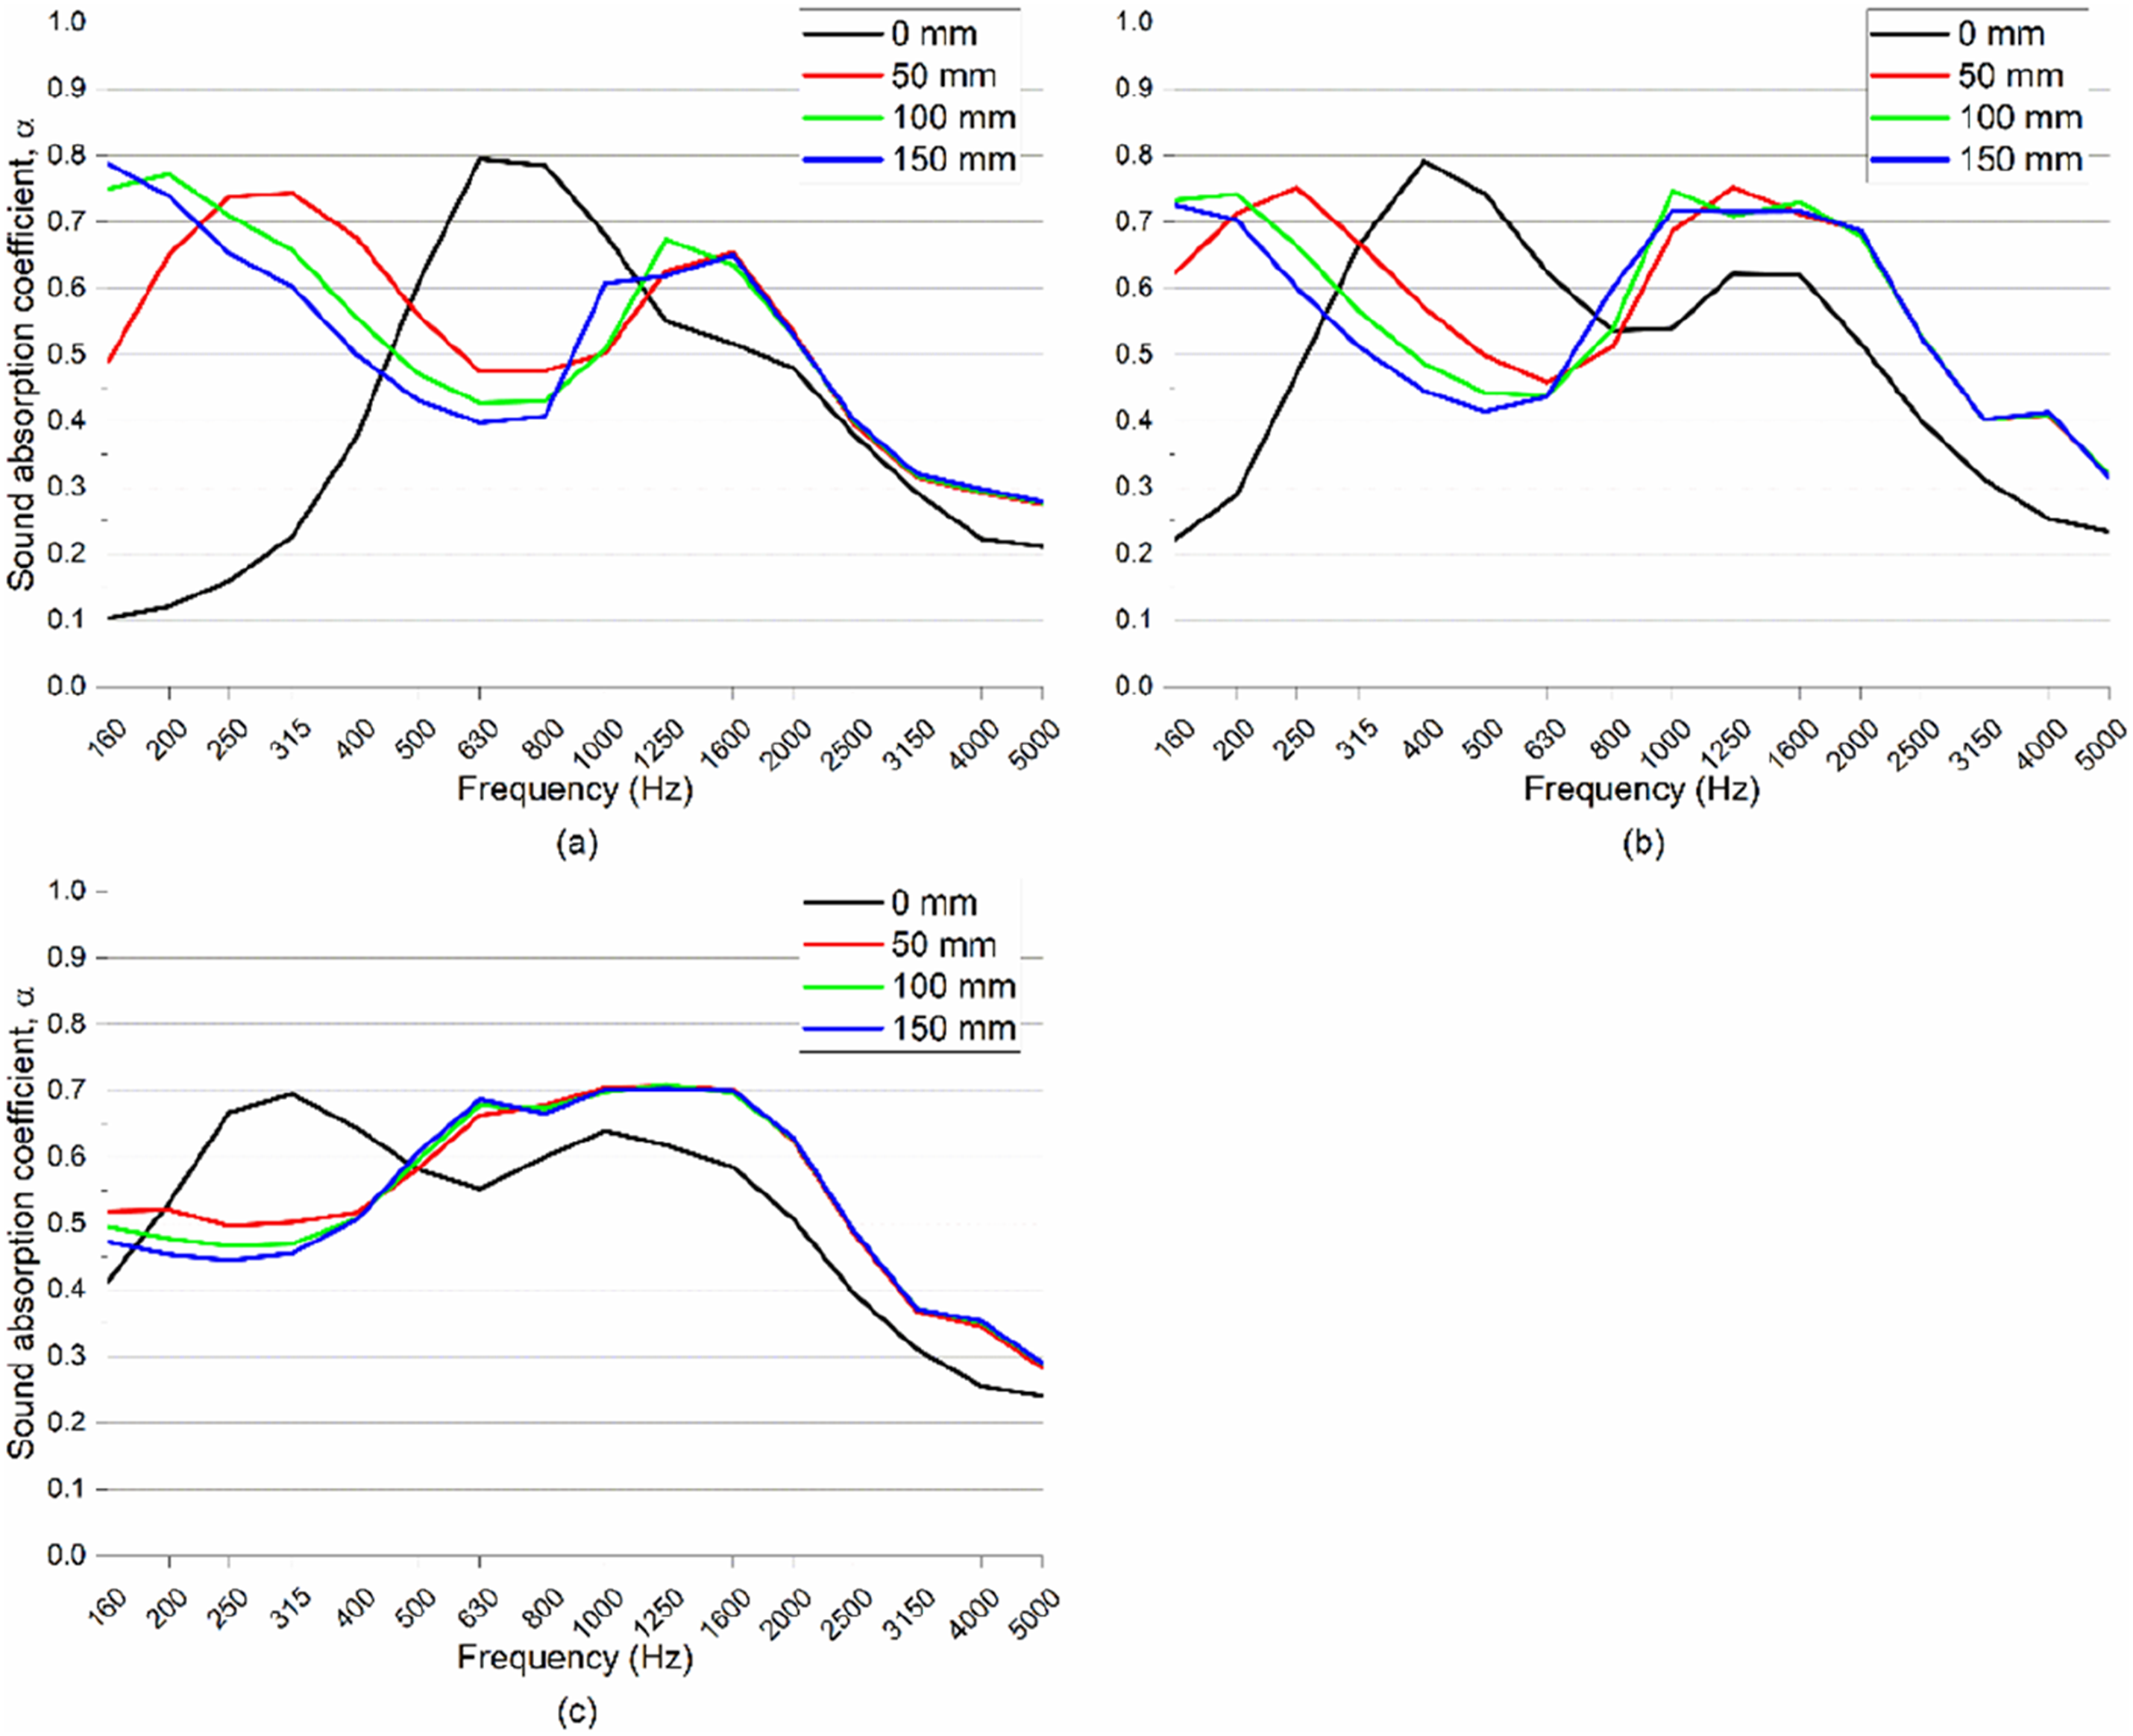
In Figure 11, the sound absorption results of PAM L9.0_d3.0 with PMFP60 of different thicknesses ((a) 10 mm; (b) 30 mm; (c) 50 mm) are presented. The air gap behind the chosen layered PMFP and PAM composite material was introduced to simulate the sound-absorbing structures where the air gap behind is often used. Increasing the air gap between the structure and the rigid backing allows us to shift the sound absorption peak value to a lower frequency range. When there is no air gap (0 mm), in all cases, the sound absorption peak is shifted to higher frequencies (in comparison to the same structure when there is an air gap) and only layered structure materials absorb sound waves. For PAM L9.0_d3.0 combined with PMFP60 of 10 mm thickness when there is no air gap, sound absorption peaked at 800 Hz with 0.82 value, with PMFP60 of 30 mm peaked at 400 Hz with 0.78 value, and PMFP60 of 50 mm peaked at 315 Hz with 0.71 value. From this, we can conclude that the thicker the structure, the lower the frequency, although sound absorption values tend to get lower. From (a) and (b) graphs, we can see that adding 50 mm of air gap behind the structure allows for sound absorption peak in even lower frequencies for PAM L9.0_d3.0 combined with PMFP60 of 10 mm thickness in 315 Hz with value of 0.85 and with PMFP60 of 30 mm thickness in 200 Hz with value of 0.76. In graph (c), adding any air gap behind the structure shifts the sound absorption peak beyond the measurement equipment limit, which is lower than 160 Hz. However, presumably, we are getting a second narratively flat high-sound absorption peak with values around 0.60 from 800 Hz to 2000 Hz. PAM L9.0_d3.0 with: (a) 10 mm; (b) 30 mm; (c) 50 mm PMFP60 and air gap.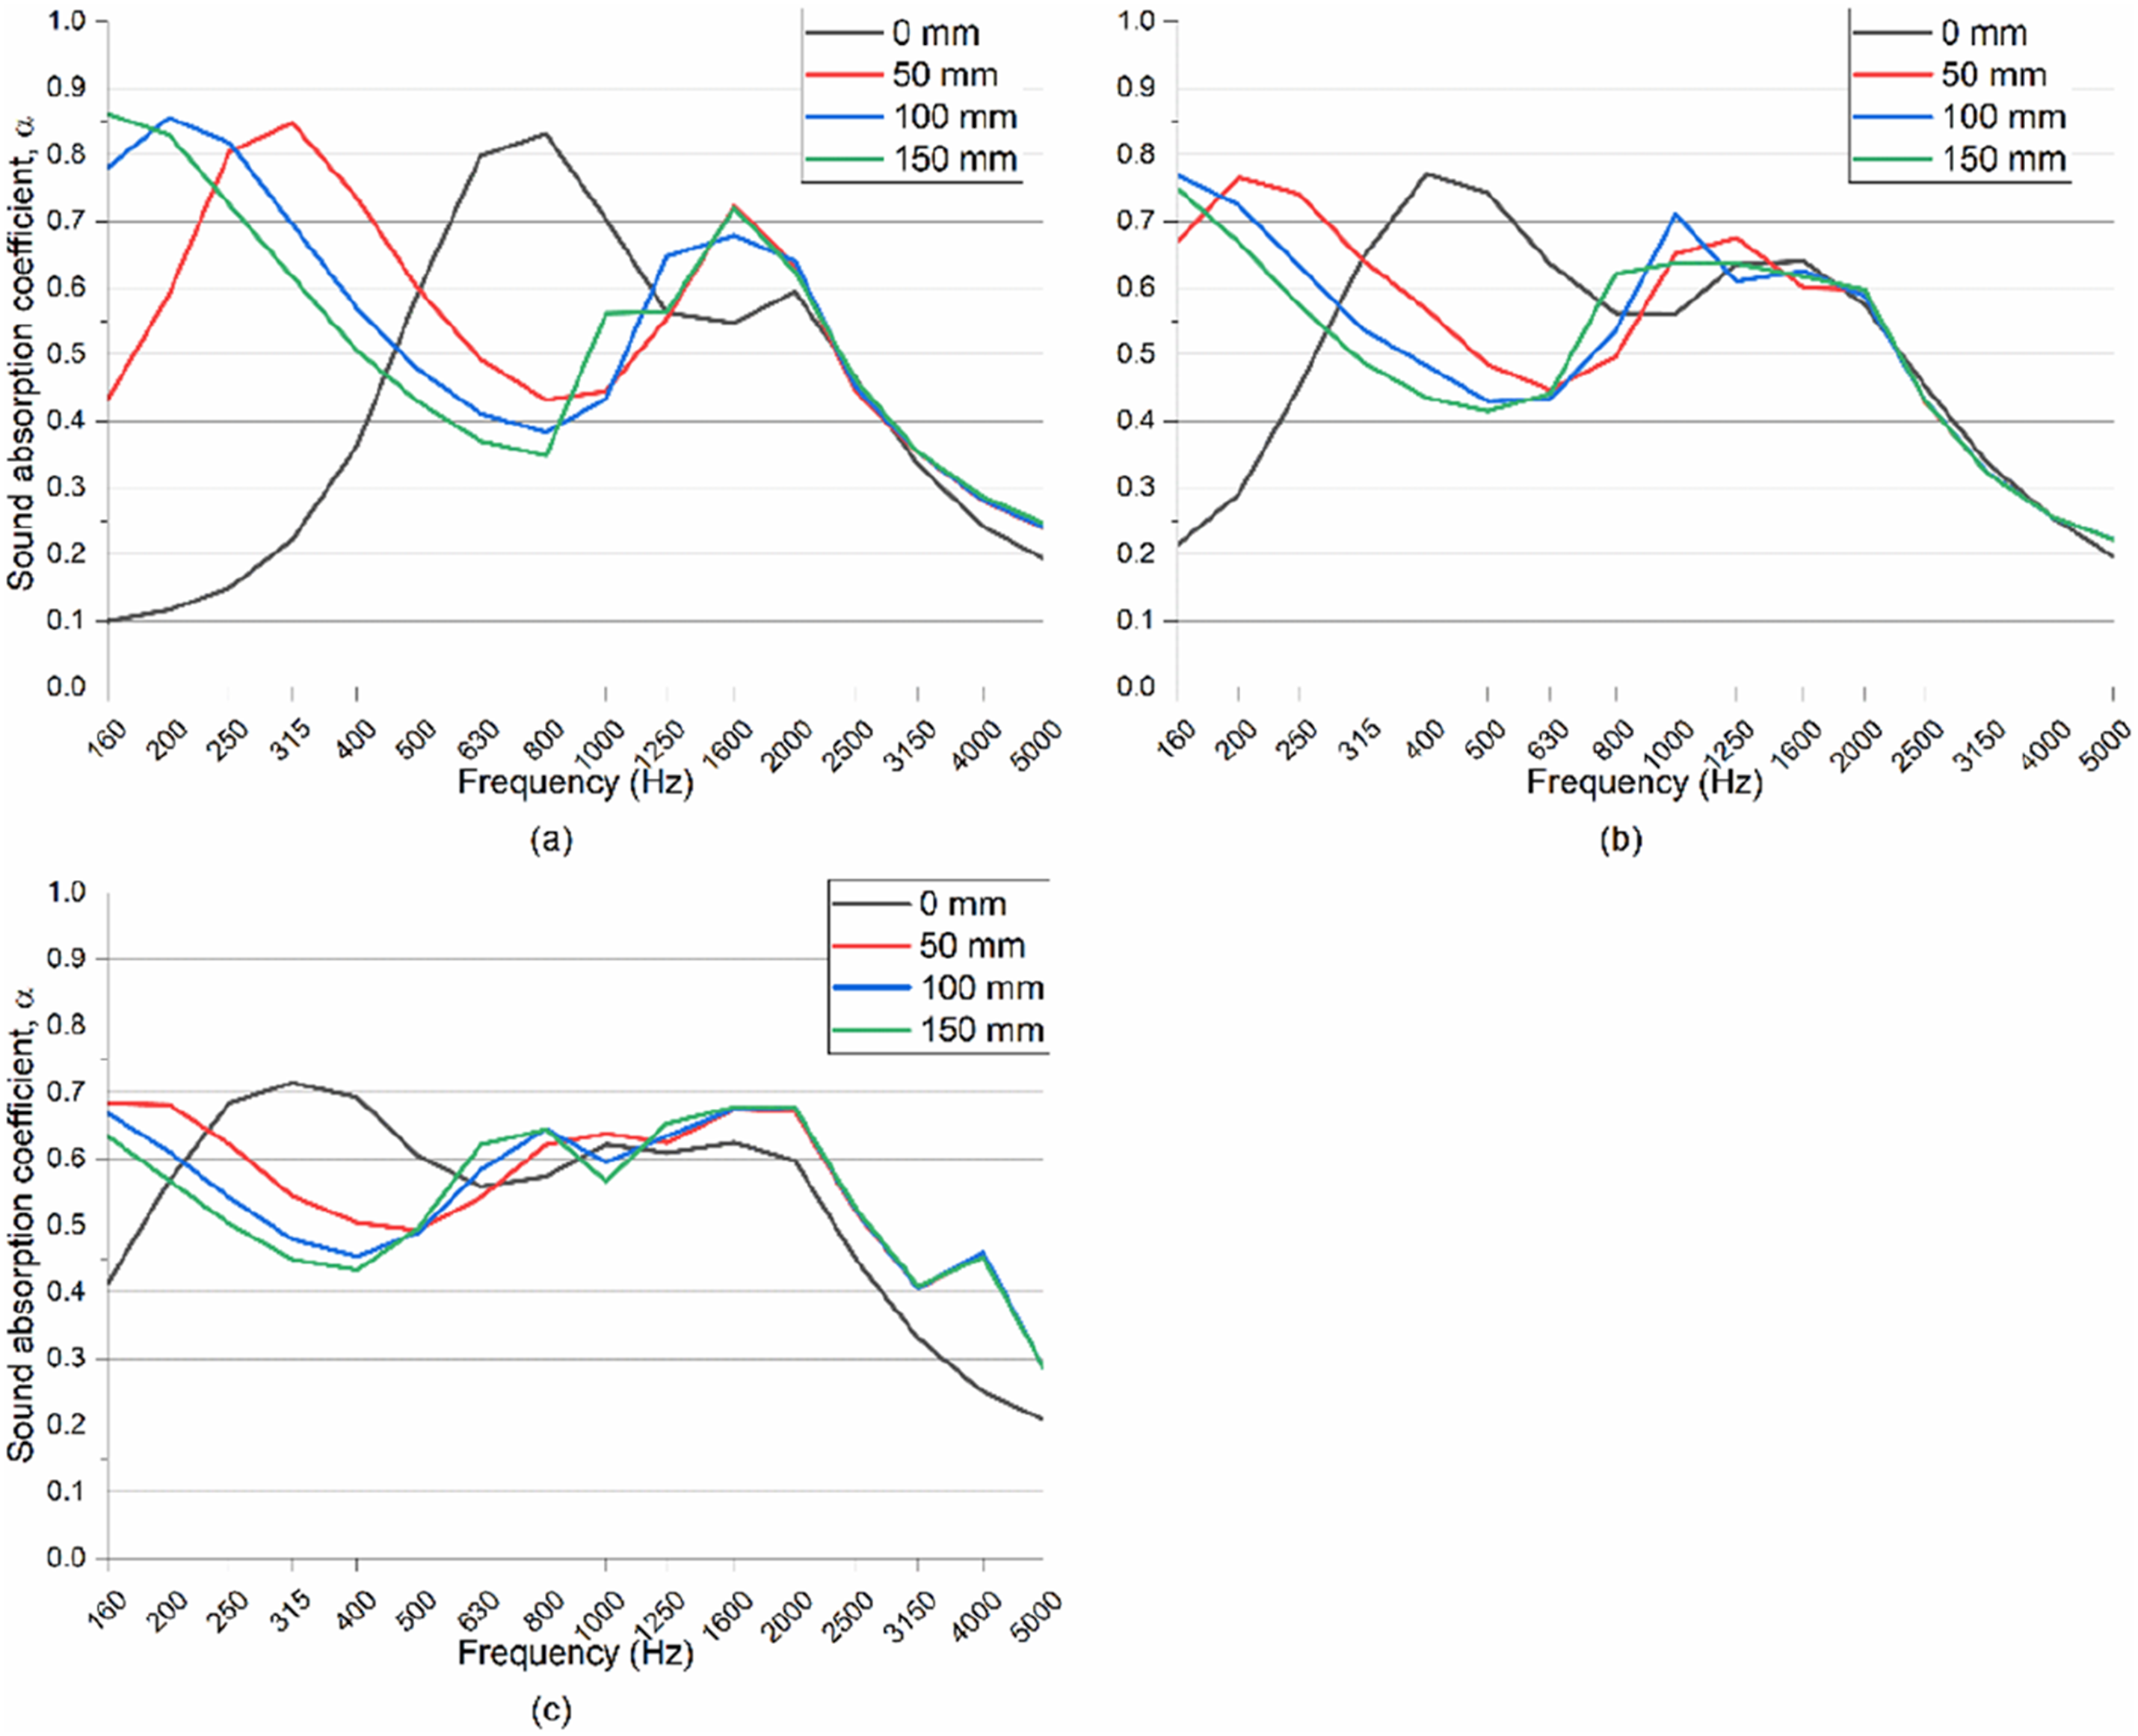
In Figure 12, the sound absorption results of PAM L9.0_d4.5 with PMFP60 of different thickness ((a) 10 mm; (b) 30 mm; (c) 50 mm) are presented. The air gap behind the chosen layered PMFP and PAM composite material was introduced to simulate the sound-absorbing structures where the air gap behind is often used. Pushing the structure away from the rigid wall allows one to shift sound absorption peak value to lower frequency range. When there is no air gap (0 mm), in all cases, the sound absorption peak is shifted to higher frequencies (in comparison to the same structure when there is an air gap) and only the layered structure materials are absorbing sound waves. For PAM L9.0_d4.5 combined with PMFP60 of 10 mm thickness when there is no air gap sound absorption peaked at 800 Hz with 0.90 value, PMFP60 of 30 mm peaked at 400 Hz with 0.88 value, and PMFP60 of 50 mm peaked at 315 Hz with 0.79 value. From this, we can conclude that the thicker the structure, the lower the frequency, although sound absorption values tend to get lower. From (a) and (b) graphs, we can see that adding 50 mm of air gap behind the structure allows for sound absorption peak in even lower frequencies for PAM L9.0_d4.5 combined with PMFP60 of 10 mm thickness in 315 Hz with value of 0.87 and with PMFP60 of 30 mm thickness in 200 Hz with value of 0.82. In graph (c), adding any air gap behind the structure shifts the sound absorption peak beyond the measurement equipment limit, which is lower than 160 Hz. However, presumably, we are getting a second narratively flat high-sound absorption peak with values around 0.60 from 800 Hz to 2000 Hz. PAM L9.0_d4.5 with: (a) 10 mm; (b) 30 mm; (c) 50 mm PMFP60 and air gap.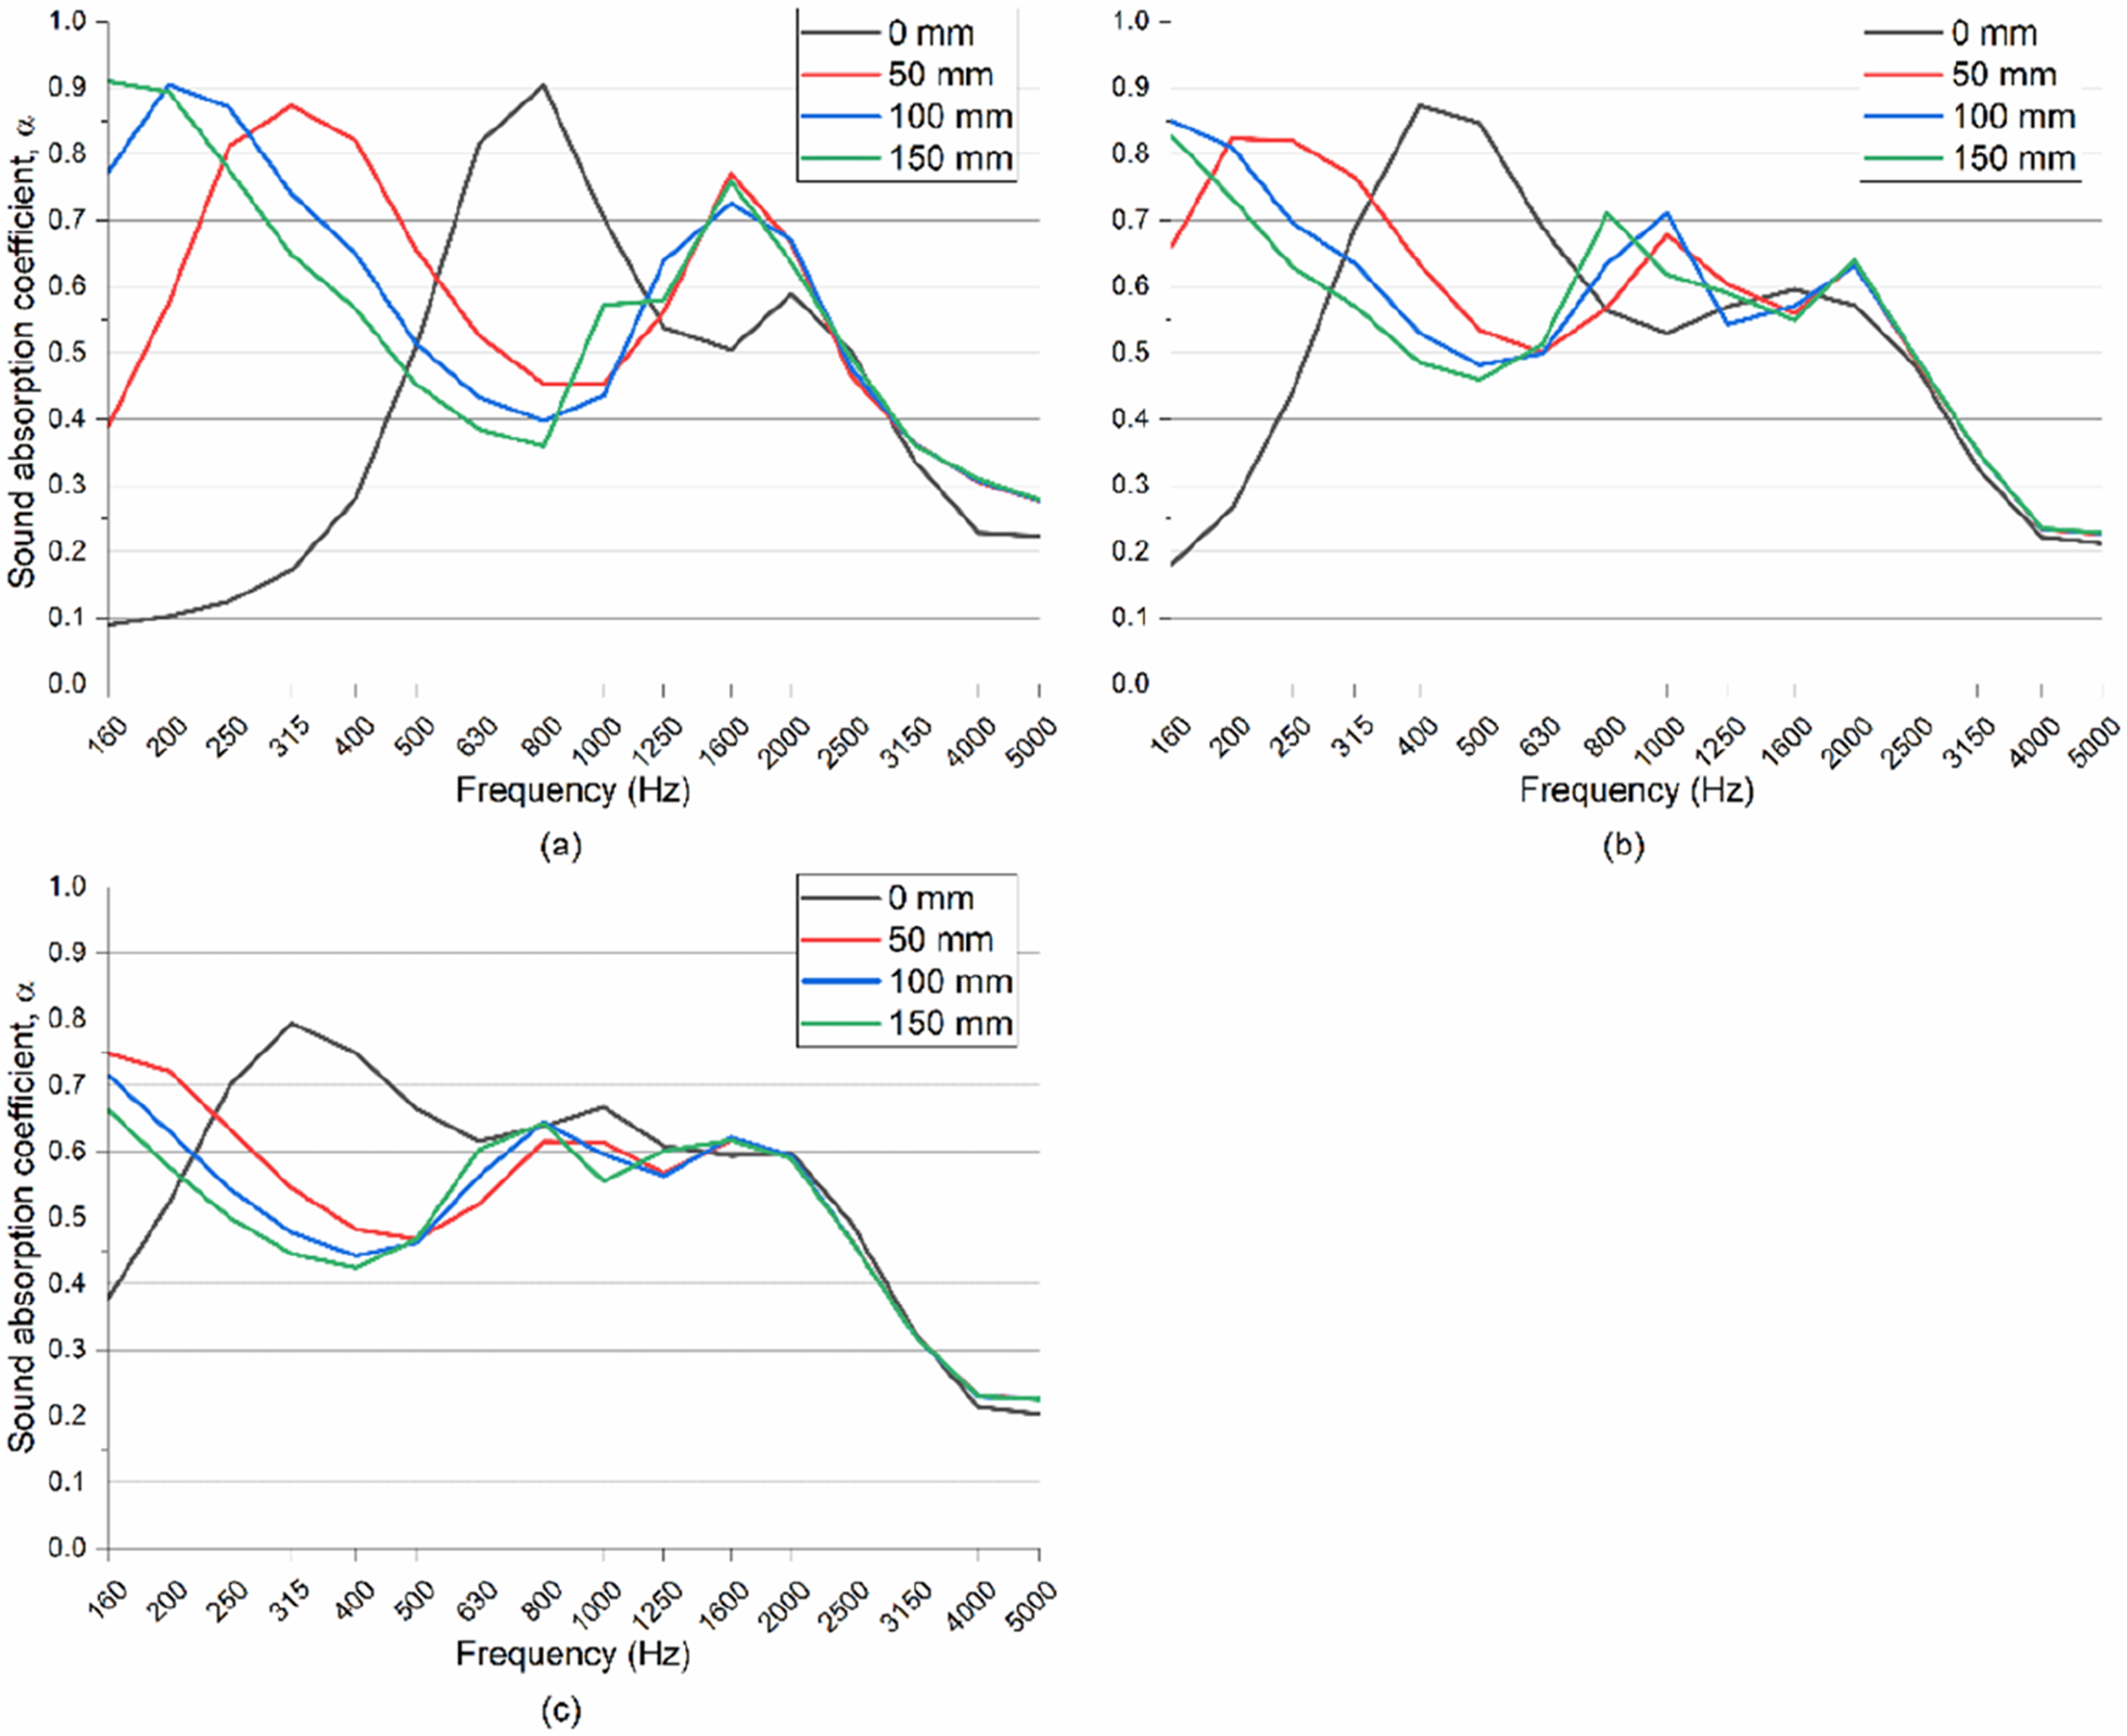
Sound absorption average (SAA) according to ASTM C423 and weighted sound absorption coefficient (α w ) according to ISO 11654.
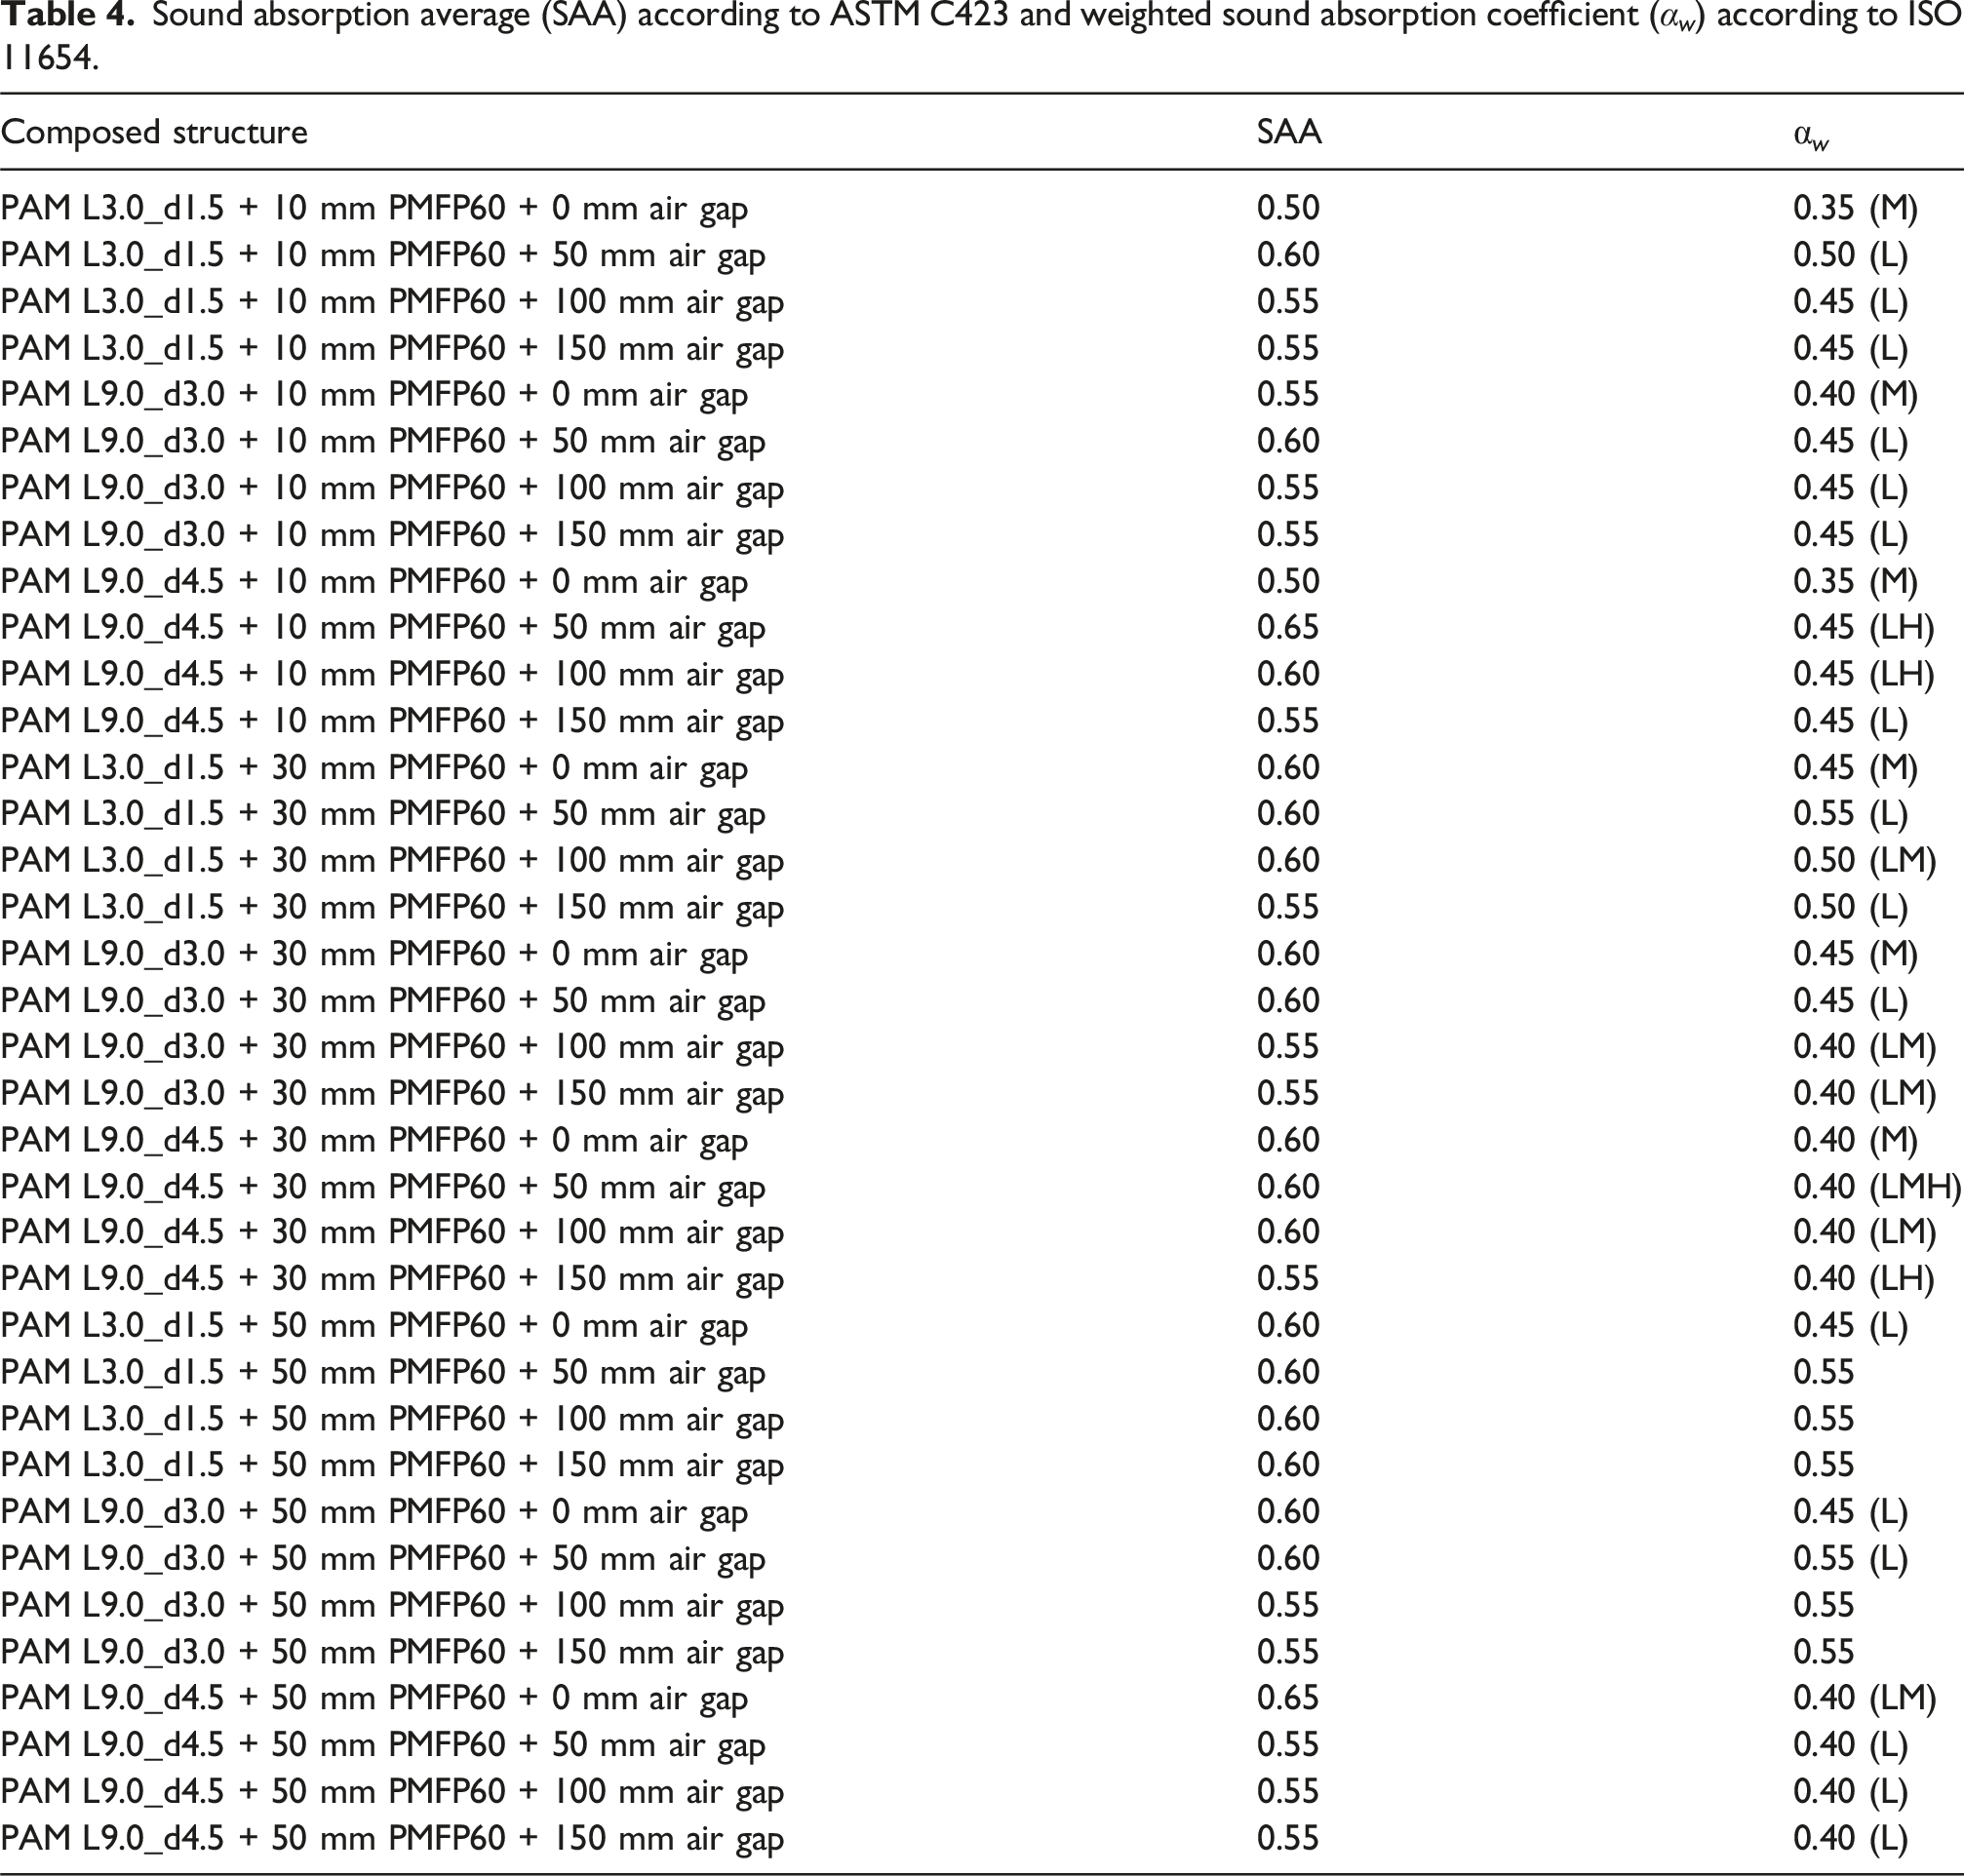
Both standard single-value ratings showed that the lowest sound absorption was of sample PAM L3.0_d1.5 + 10 mm PMFP60 + 0 mm air gap. The SAA value was 0.50 and α w value 0.35 (M). For the SAA single-value rating, PAM L9.0_d4.5 + 10 mm PMFP60 + 50 mm air gap achieved the highest value of 0.65 and α w single-value of 0.55 was achieved by few combinations of structure. Although for low-frequency absorption applications, PAM L3.0_d1.5 + 30 mm PMFP60 + 50 mm air gap and PAM L9.0_d3.0 + 50 mm PMFP60 + 50 mm air gap should be chosen. These single-value ratings confirm that the developed layered structures have a good sound absorption rating at lower frequencies.
Such findings show very promising results for applications of low-frequency sound absorption. Other authors who investigated sound absorption in the lower frequency range could not achieve similar results with Helmholtz-based plastic metamaterials. For example, a Helmholtz resonator-based metamaterial absorption coefficient is nearly 0.15 in the lower frequency range (100–450 Hz), and as the sound frequency increases and approaches the Helmholtz resonator’s resonant frequency, the absorption coefficient rises. 39 Therefore, similar investigations of porous materials with Helmholtz-based resonators as combined structure for low-frequency applications were conducted. Although these materials show good broadband sound absorption performance, their highest sound absorption is achieved at frequencies above 250 Hz, which is higher than the structure proposed in this paper.17,18,20
Conclusions and discussion
In this study, we performed acoustic tests of the PAM and PMFP samples and its composites. The overall results show the potential of such composites to be used for sound absorption applications, especially in the lower frequency range, if the air gap is presented behind the layered material. These composite materials could be used on the walls or ceiling of the room as a sound absorber for low- and mid-frequency noise control. Depending on the situation, the correct combination of PAM and PMFP together with a suitable air gap should lower room reverberation time and reduce overall noise, improving speech transmission index (STI).
This study investigated the impact of varying the thickness of PMFP60 combined with PAM layers and the presence of an air gap on sound absorption performance. Increasing the thickness of the PMFP60 layer in the composite results in a shift of the sound absorption peak to lower frequencies. However, this is accompanied by a slight reduction in the peak absorption values. The introduction of an air gap behind the composite material further shifts the sound absorption peak to even lower frequencies. It was found that 50 mm air gap showed sound absorption peak between 0.7 and 0.9 at relatively low frequencies from 200 to 315 Hz.
The limitations of the study include the sample size and the measured frequency range in the impedance tube. Some sound absorption peaks were not detected due to the sample size and the diameter of the tube. When an air gap is introduced, the absorption peaks shift beyond the measurement limits (below 160 Hz) for the thickest configurations. The results indicate that high-sound absorption peak values likely could found below 160 Hz, especially when a wider air gap is introduced in the acoustic system.
Future studies will focus on large-scale samples. It is planned to determine the diffuse field sound absorption of PAM and PMFP. Other binding materials such as sodium silicate, clay, or polyurethane resin will be used to make PMFP composite materials. These new composites will be tested to gain knowledge about the influence of the binding material on sound absorption properties and other physical parameters of the materials. This knowledge would allow us to propose a full-scale prototype structure for building acoustic applications. Additionally, PAM location in the structure should be investigated, as it may be beneficial to use it behind the PMFP or directly on the surface of the rigid backed without air gap. Also, bigger cavity of PAM should in theory improve low-frequency sound absorption value, as bigger chamber allows more air and longer sound waves to be processed.
Footnotes
Declaration of conflicting interests
The author(s) declared no potential conflicts of interest with respect to the research, authorship, and/or publication of this article.
Funding
The author(s) disclosed receipt of the following financial support for the research, authorship, and/or publication of this article: Research was conducted as part of the execution of Project ‘Mission-driven Implementation of Science and Innovation Programmes’ (No. 02-002-P-0001), funded by the Economic Revitalization and Resilience Enhancement Plan ‘New Generation Lithuania’.