
Abstract
Middle and low frequency band sound waves have strong penetration and diffraction abilities during the propagation process, making it difficult to attenuate. The control of middle and low frequency broadband sound waves has become a challenging topic. Therefore, it is necessary to develop new materials or structures with middle and low frequency sound absorption, insulation, and noise reduction functions. The special properties of acoustic metamaterial provide new ideas for the development of sound absorption and insulation. In order to effectively control the noise in the lower frequency band, a new spatial spiral acoustic metamaterial was designed. First, the mechanism of band gap characteristics of a new spatial spiral acoustic metamaterial is analyzed. Then, a new spatial spiral acoustic metamaterial is completed through the finite element software COMSOL Multiphysics and the calculation and analysis of sound absorption and insulation performance in the 100–2500 Hz frequency band are completed. With the help of 3D printing, the preparation of metamaterial is completed, and the comparative experimental study of sound absorption and insulation performance of spiral acoustic metamaterial is carried out to verify the accuracy of the calculation method.
Introduction
For middle and low frequency sound waves, traditional sound absorbing materials require a larger thickness to effectively absorb medium and low frequency sound waves. Traditional sound insulation materials follow the mass law, but when the thickness and quality of the plate increase, the sound insulation effect cannot be produced in the low frequency band. 1
The biggest advantage of acoustic metamaterial is that it is able to achieve intelligent control of sound waves. Band gap is an important property of acoustic metamaterials, that is, sound waves in a specific frequency band cannot propagate in it, and the application of this property has great prospects. With the continuous enrichment of metamaterial related theories, metamaterial configurations have been promoted, especially in the fields of aerospace, ships and vehicles, engineering construction, and national defense and military, showing broad prospects.
At present, the main acoustic metamaterials are thin film type, thin plate type, Helmholtz type, coiling space type, and so on. But the thin film and plate type sound absorption metamaterials have limitations such as narrow absorption band gap and large structure. 2 The thin-film and thin-plate sound insulation metamaterials have the disadvantages of short life, easy deformation, and unstable sound insulation performance. 1 Helmholtz resonator is a kind of acoustic passive damper widely used in engineering practice.3–5 Zhao et al.6–8 discussed the acoustic damping performance of single-layer and double-layer perforated plates in the presence of temperature gradient. However, the numerical simulation and experiments in this paper are carried out under constant temperature and the change of sound absorption and insulation performance with temperature gradient is not involved. And Helmholtz type sound absorption and insulation metamaterials have limitations such as narrow band gap, large volume, and complex structure, which are not conducive to engineering practice.
To solve the above problems, the researchers introduced the labyrinth, spiral, and other structures into metamaterials and designed the coiled spatial metamaterials. The coiled spatial metamaterials have good sound absorption and insulation properties. On the one hand, the air is subjected to friction resistance when passing through the channel, which can effectively reduce the speed of sound, resulting in attenuation of sound energy. On the other hand, when the sound waves propagate along the winding path in the structure, the propagation path is much larger than the structure size and the phase speed is effectively reduced while the propagation time is extended. In this way, the shortcomings of the Helmholtz resonant type and the thin film type sound absorbing and insulating superstructural materials can be overcome.
In 2012, Liang et al. 9 first designed a curly spatial structure with non-local resonance. In 2014, Cai 10 and Li 11 et al. designed a sound-absorbing metasurface by crimping space, but its sound-absorbing band gap was narrow. Using Mie resonance properties, Chen et al. 12 designed a subwavelength highly reflective ultra-sparse surface with spiral channels, which realized double negative equivalent parameters and verified that it had good sound insulation performance. But it did not achieve sound absorption effect. Maurya et al. 13 proposed a 3D labyrinth spatial coiled acoustic metamaterial, which showed double negative characteristics and good sound insulation performance, but its sound absorption performance was not studied. In the above studies, no metamaterial can have both sound absorption and insulation performance and overcome the limitation of band gap narrowness. Finding a material that can both absorb and insulate sound is quite difficult. Therefore, it is necessary to develop a new structure sound absorbing and insulating material with good effect on low frequency noise control and wide range of engineering applications.
In this paper, a new spiral sound absorption and insulation metamaterial is designed, and the sound absorption and insulation effect is verified by 3D printing sample preparation, and both sound absorption and sound insulation performance within 100–2500 Hz.
Metamaterial design and simulation
Spiral metamaterial structure design
The geometric parameters and material properties of acoustic metamaterials are closely related to their sound absorption and insulation properties. The research focus on further reduce the band gap frequency, broaden the frequency band and reduce the structural size.
The transmission characteristics of sound wave in medium are mainly determined by the mass density and bulk modulus of the material, in which the equivalent density and elastic modulus are two important characteristic parameters of the medium. These two are usually positive in nature, but it is possible to design materials with a negative equivalent mass density and a negative equivalent bulk modulus in which sound waves cannot propagate. Mie resonance is a kind of resonance phenomenon based on Mie scattering and resonance scattering theory. Strong resonance will produce a complex pattern of rapidly changing periodic wave in Mie cross region. The equivalent negative density corresponds to the dipole resonance and the equivalent negative modulus corresponds to the monopole resonance. And the Mie resonance unit in the air can display monopole, dipole, quadrupole, and other resonance characteristics at different frequencies and achieve negative equivalent parameters in different frequency ranges. To generate acoustic Mie resonance, the velocity of sound waves in the material should be much smaller than the velocity in the air. Space folding enables the structure to obtain an effective sound velocity lower than that of air.
Coiled space metamaterial is an excellent sound absorption and insulation material. Therefore, this paper introduced orthogonal slender rectangles into acoustic metamaterials and took the square lattice metamaterials containing the cross rectangles as the initial configuration. Then the two-dimensional spiral configuration was rotated to build spatial spiral acoustic metamaterials with sound absorption and insulation effect. 14
The design idea of the spatial spiral acoustic metamaterial proposed in this paper is shown in Figure 1. The square lattice metamaterial with orthogonal rectangular distribution is taken as the basic prototype. The blue part in the figure represents the air medium and the white part is the epoxy resin. In this way, spatial spiral metamaterials are constructed. The solid material parameters are E = 2 GPa, v = 0.38, ρ = 1210 kg/m3. In order to facilitate comparative analysis, the metamaterials with only orthogonal rectangular and spiral configurations are called cross type metamaterials and coiled metamaterials, respectively. The metamaterials with both orthogonal rectangular and spiral configurations are called spatial spiral acoustic metamaterials. Schematic diagram of the structure of three metamaterial cells and the energy band characteristic curve of the structure.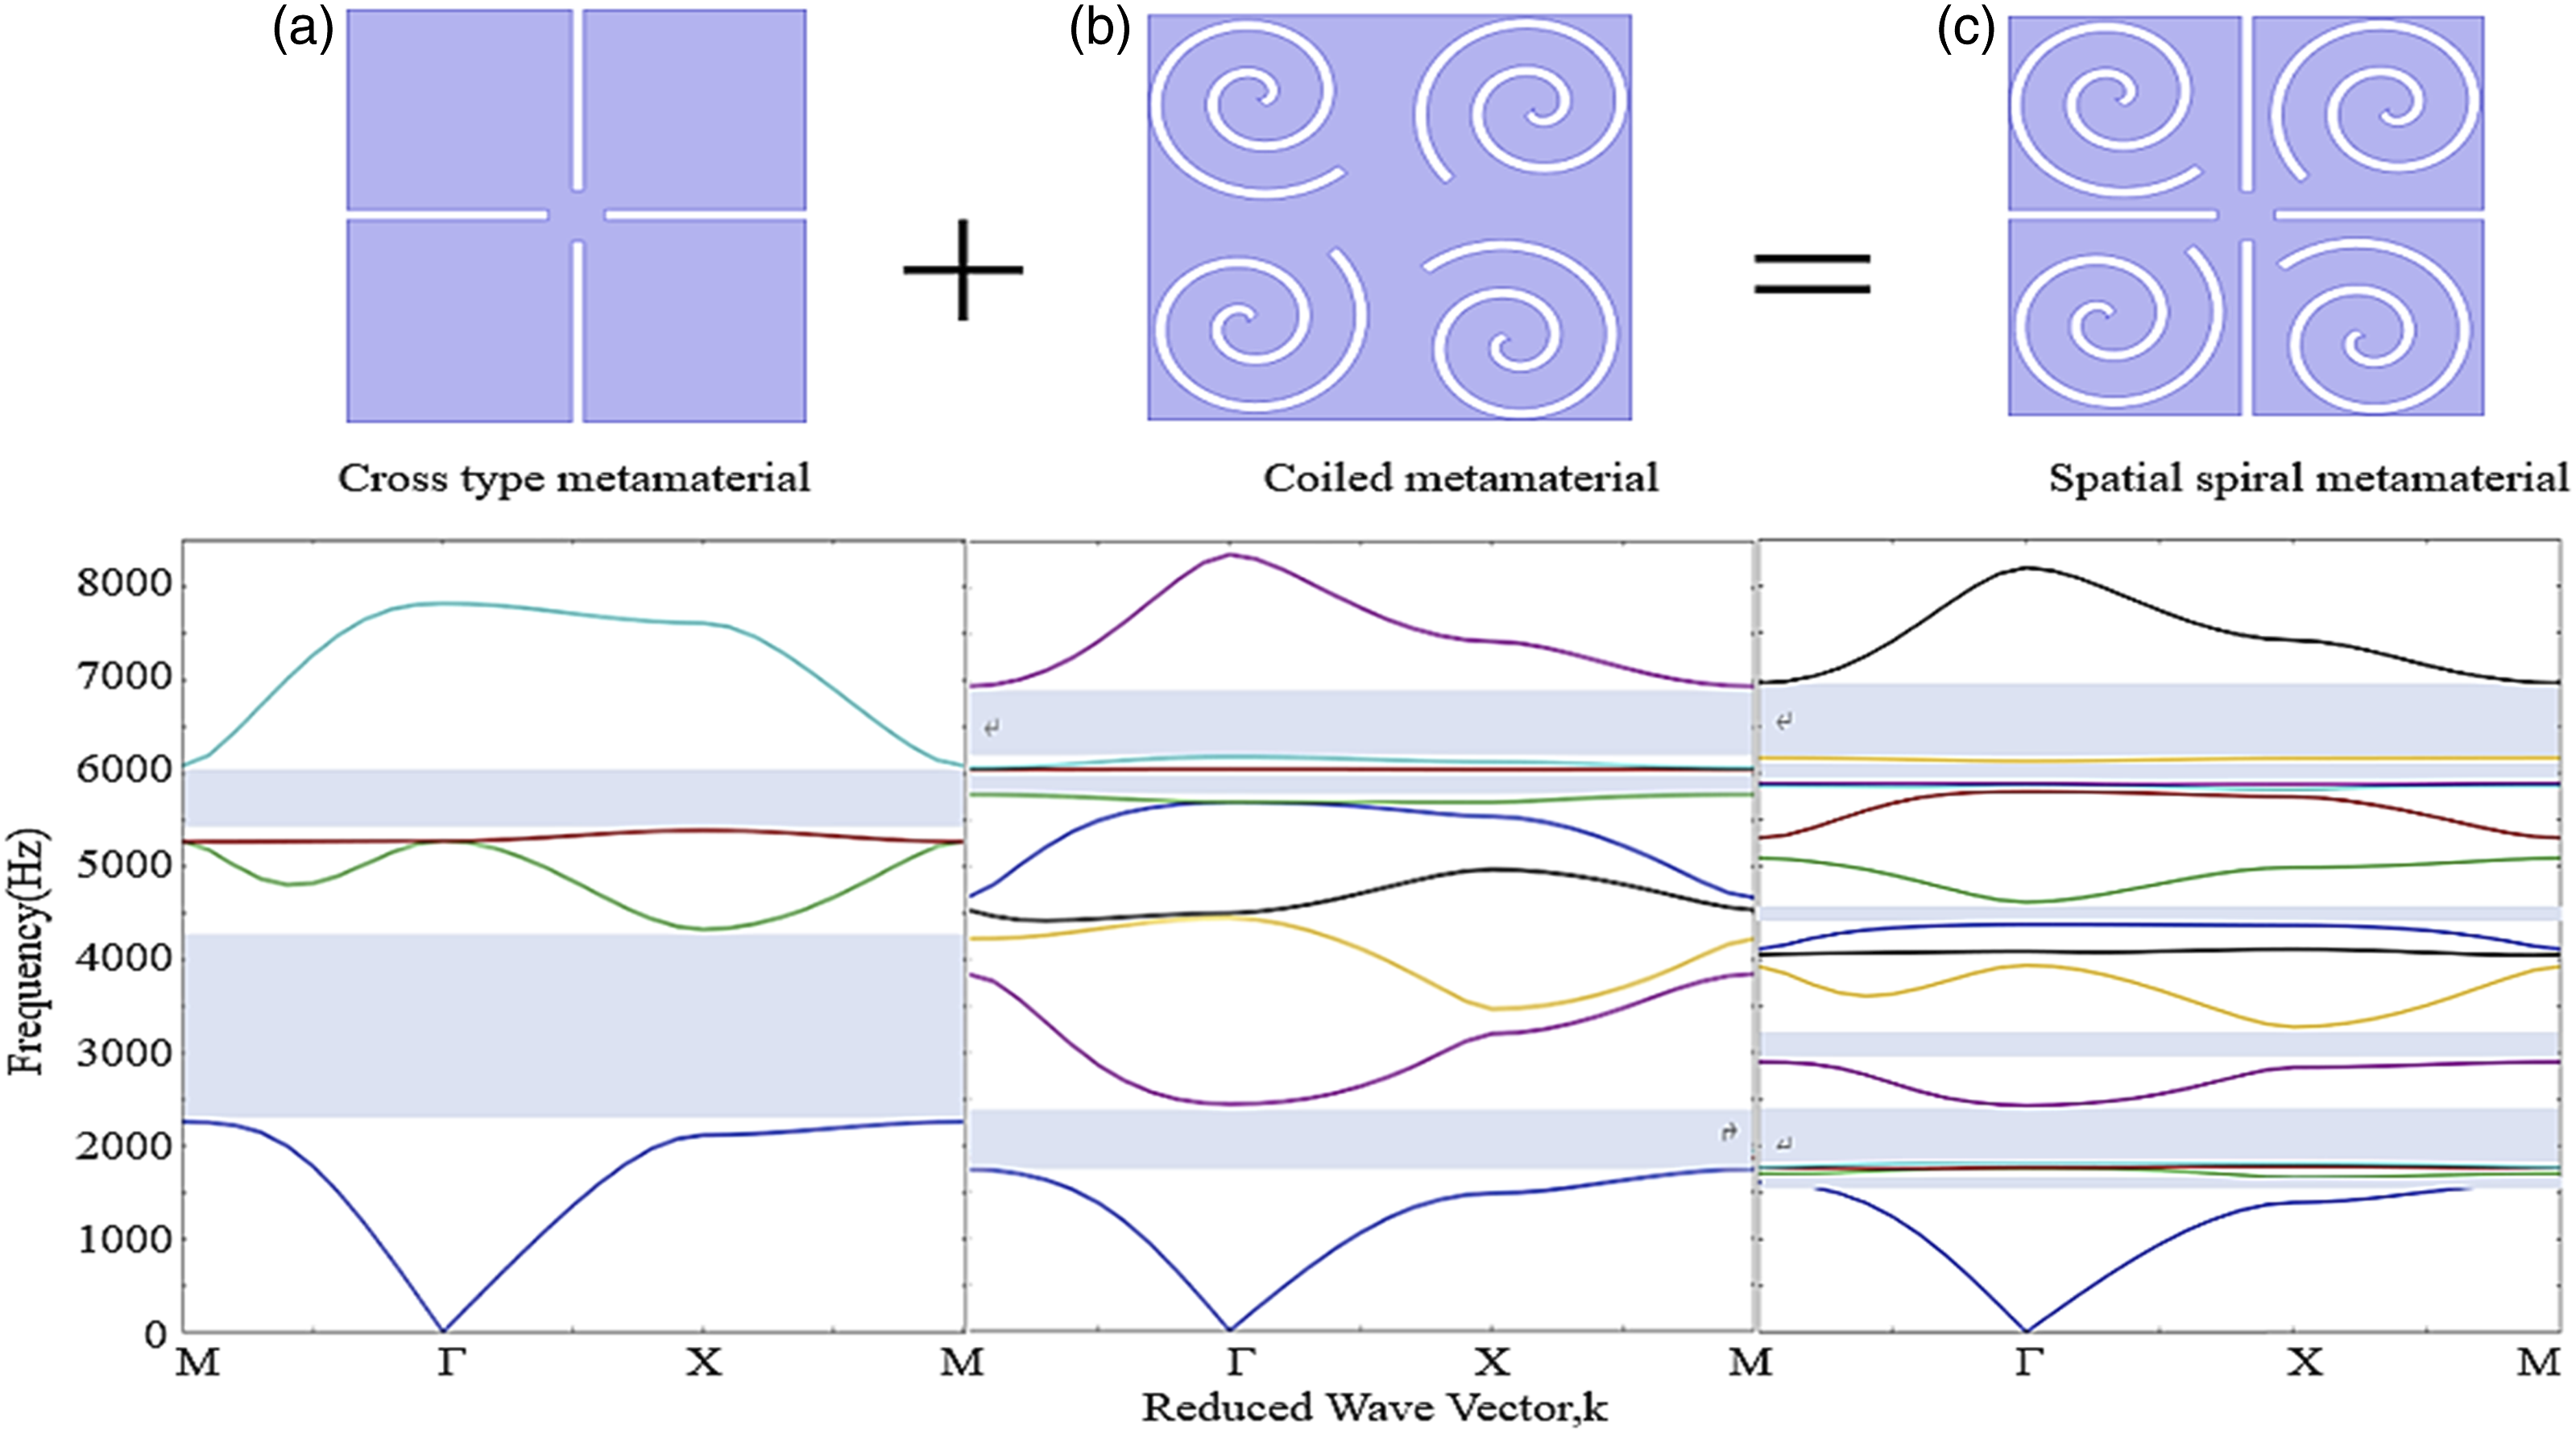
The parameterized equation of Archimedes spiral is


By observing the band maps of the three types of metamaterials, it can be found that compared with the cross type metamaterials, the band structure of the coiled metamaterials drops and a new narrow band gap is generated. The band structure of spatial spiral metamaterials drops on the basis of coiled metamaterials. In the frequency range of 8500 Hz, the cross type metamaterial has only two band gaps. And the band gap within 2500 Hz is narrow. Compared with the cross type, the band gap of the spiral metamaterial is widened within 2500 Hz and moves to low frequencies. The first band gap width of coiled metamaterial is roughly equal to the second band gap width of spatial spiral metamaterial. But the lower cut-off frequency of the second band gap shifts to low frequencies and two new band gaps are generated.
Compared with cross type metamaterials and coiled metamaterials, the spatial spiral metamaterials have lower band gaps and can open more energy bands to generate new band gaps, which is a configuration design with better dispersion characteristics.
Band gap generation mechanism
In this section, we will understand the band gap generation principle of spiral metamaterials by analyzing the wave transport characteristics and resonance patterns in the sound pressure cloud image. Figure 2 shows the first Brillouin region of acoustic metamaterials. Figure 3 shows the dispersion relationship of scanning along different paths. The first Brillouin region of acoustic metamaterials. The dispersion relationship of scanning along different paths.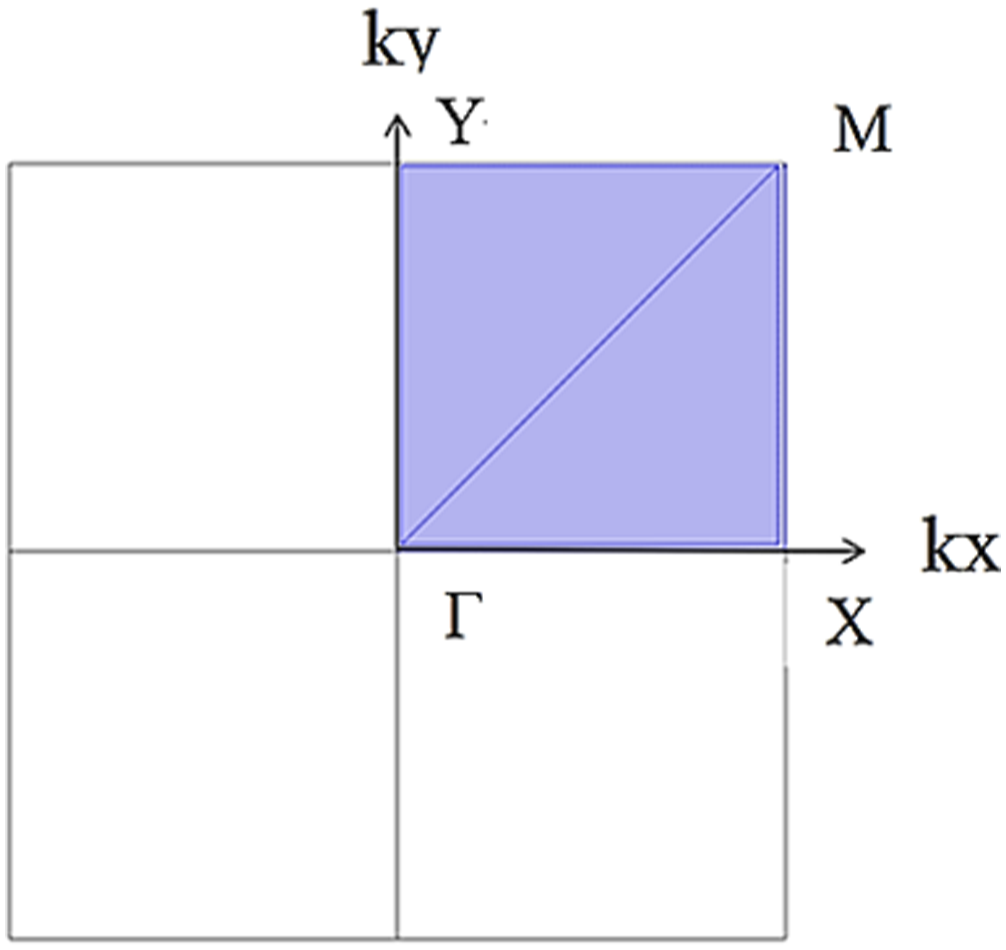
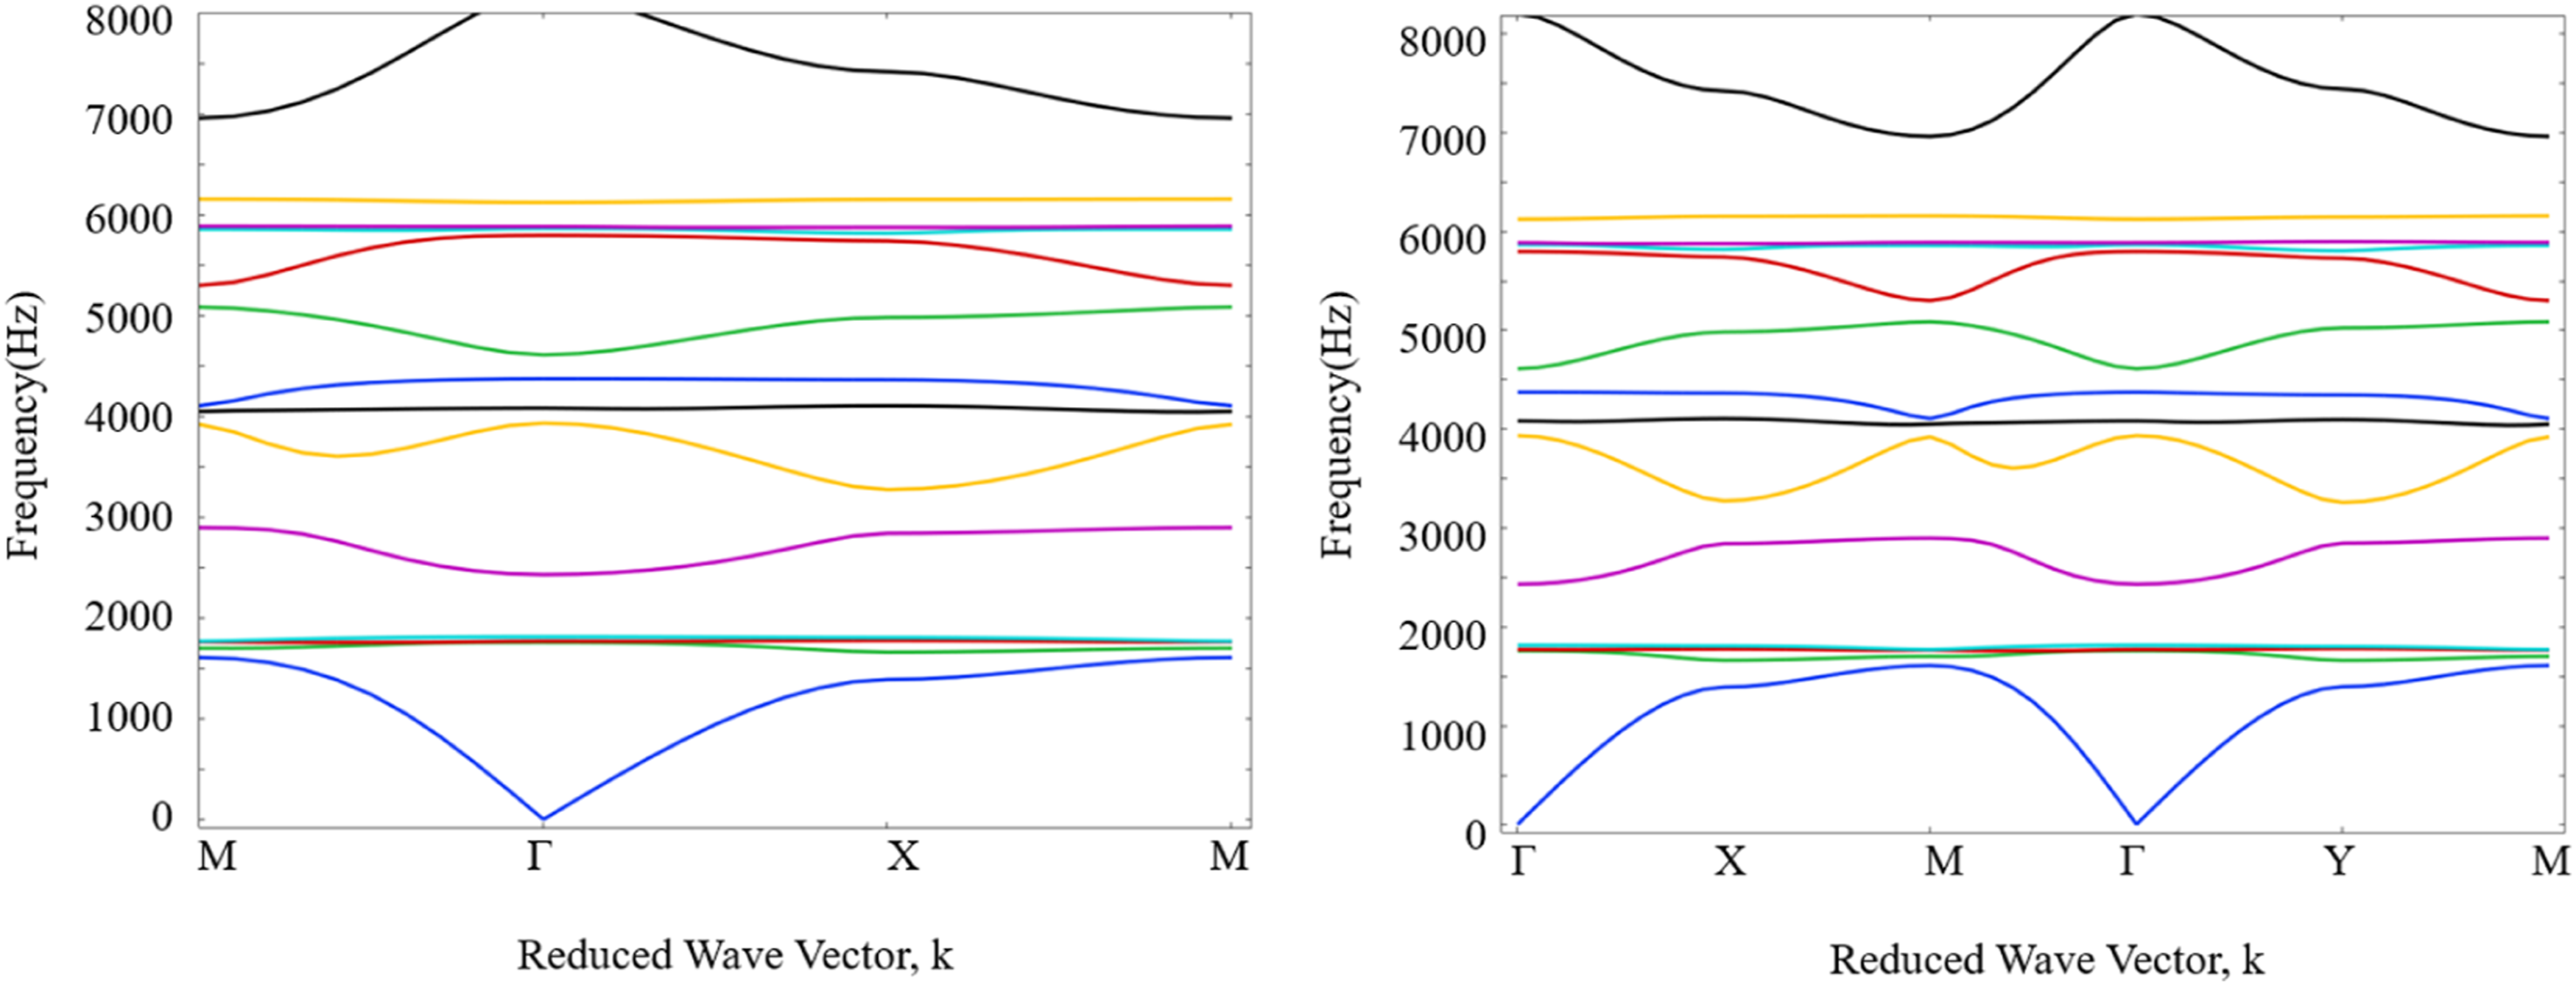
Firstly, wave vectors are scanned along the simplest Brillouin region and the entire boundary of the first Brillouin region, respectively. The scanning path is expanded from MΓXM to ΓXMΓYM. Then the scanning results are compared to show that the wave vector used is sufficient to predict the boundary frequency of the band gap. Figure 4 shows the band gap diagram of the spiral metamaterial and the acoustic transmission loss curve along the direction of ΓX. The five band gaps are marked by BG-1, BG-2, BG-3, BG-4, and BG-5, respectively, in the figure. Figure 5 shows the resonance modes of the blind band represented by the displacement x component. Dispersion relation of spiral metamaterial and wave transport characteristic curve in the direction of ΓX. The resonance modes of the blind band represented by displacement x component.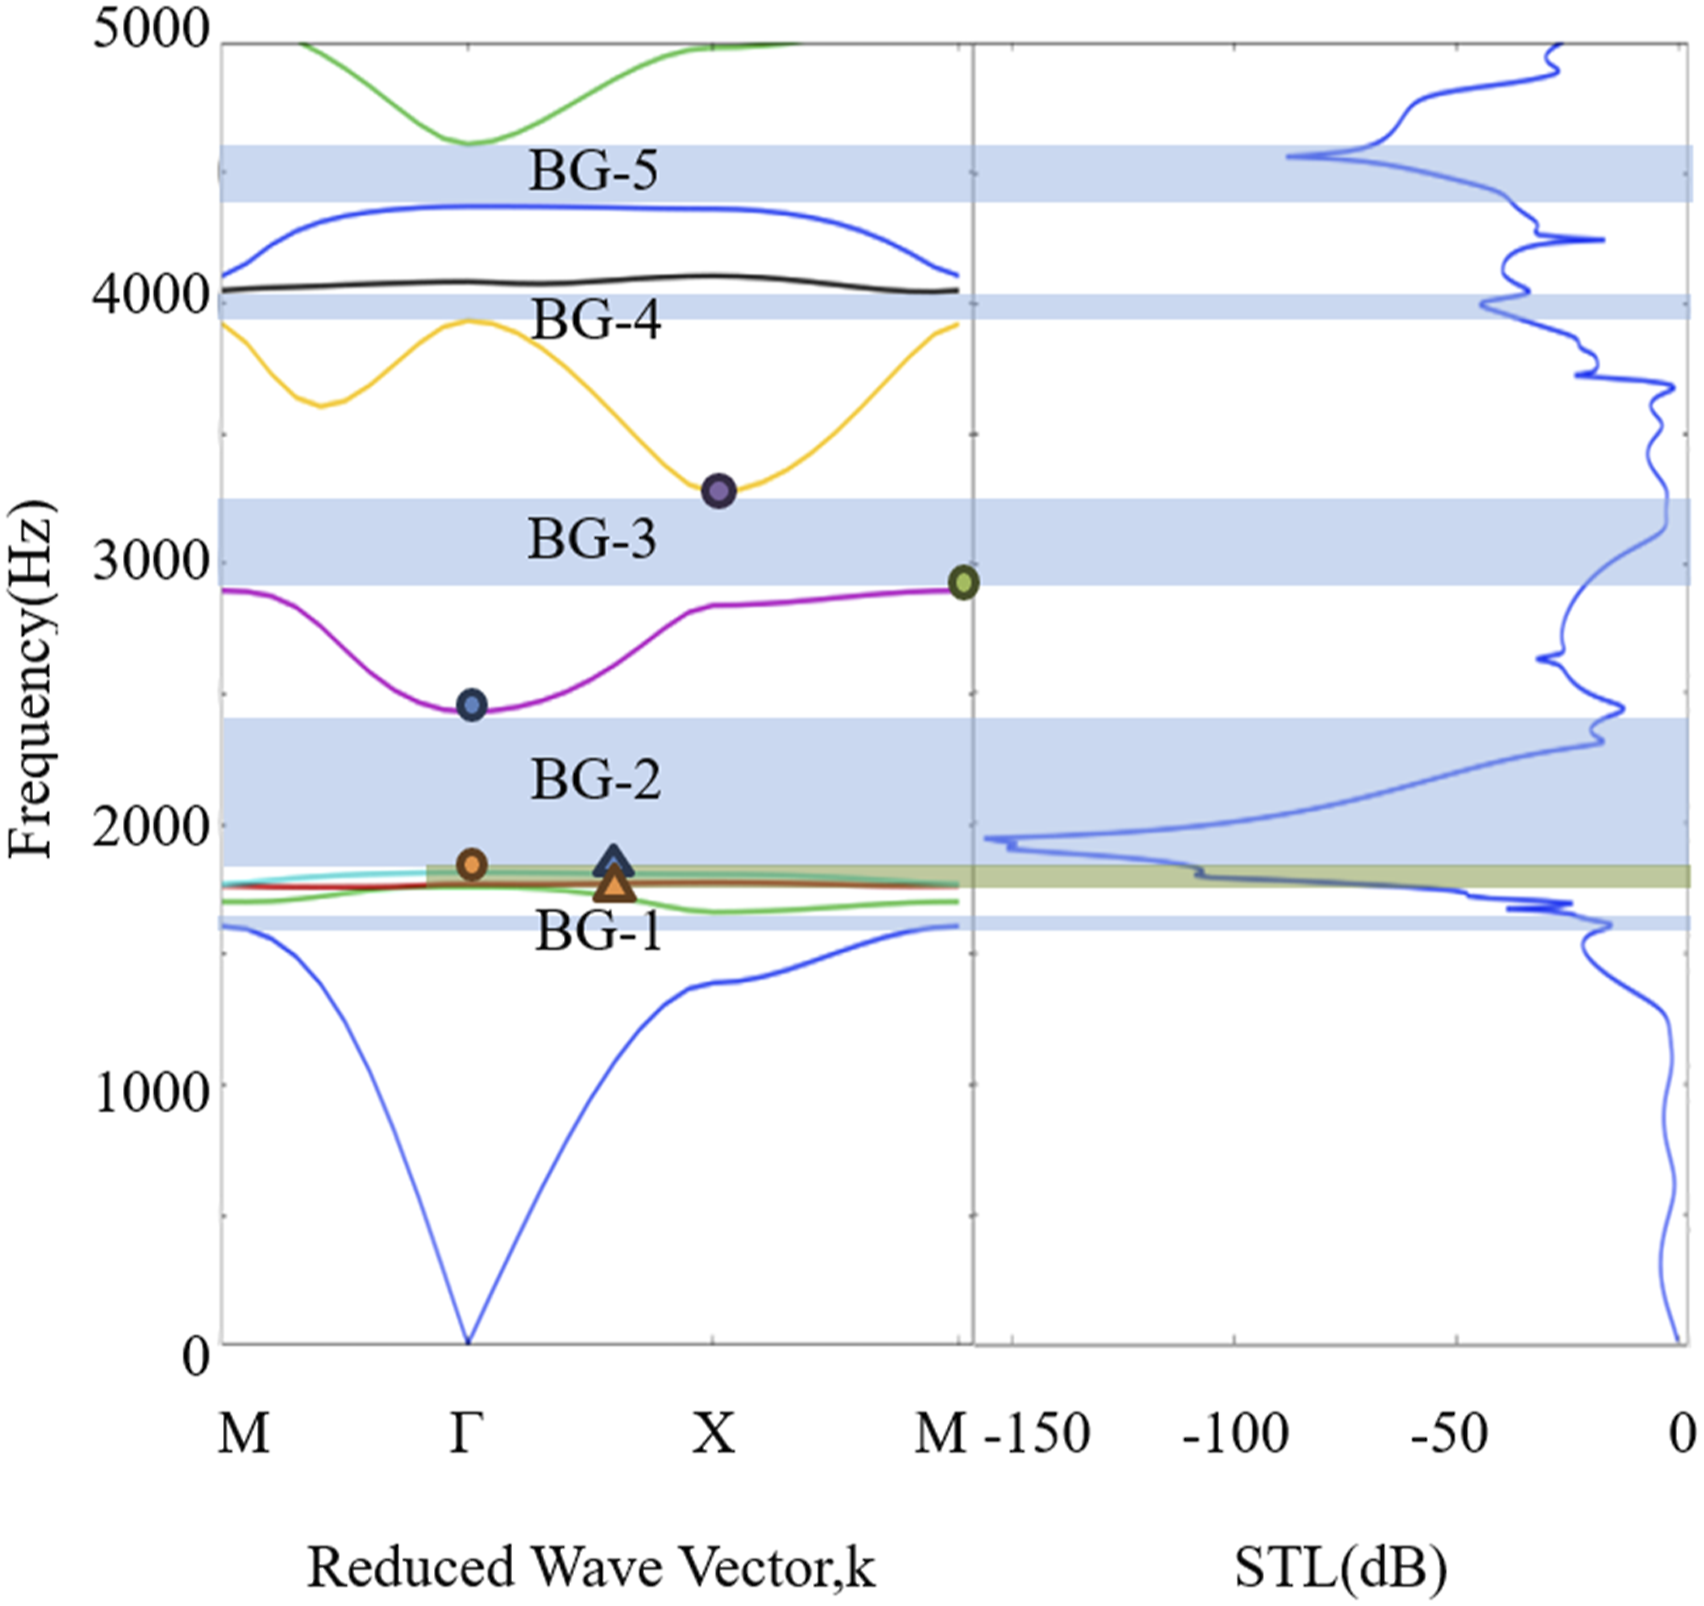
In Figure 4, it can be seen that there is a significant sound transmission loss in the band gap region (blue region), and no sound transmission loss in the passband region. Second, sound transmission losses also occur in green-shaded areas with no directional band gap, which is a phenomenon known as blind band. It is known that the resonance modes of the blind band all exhibit an antisymmetric sound pressure field distribution. It can be seen in Figure 5 that the sound pressure field presents an antisymmetric resonance mode in the x direction, which proves that it is a blind band. When the incident wave propagates in the x direction, these resonance modes cannot be excited
14
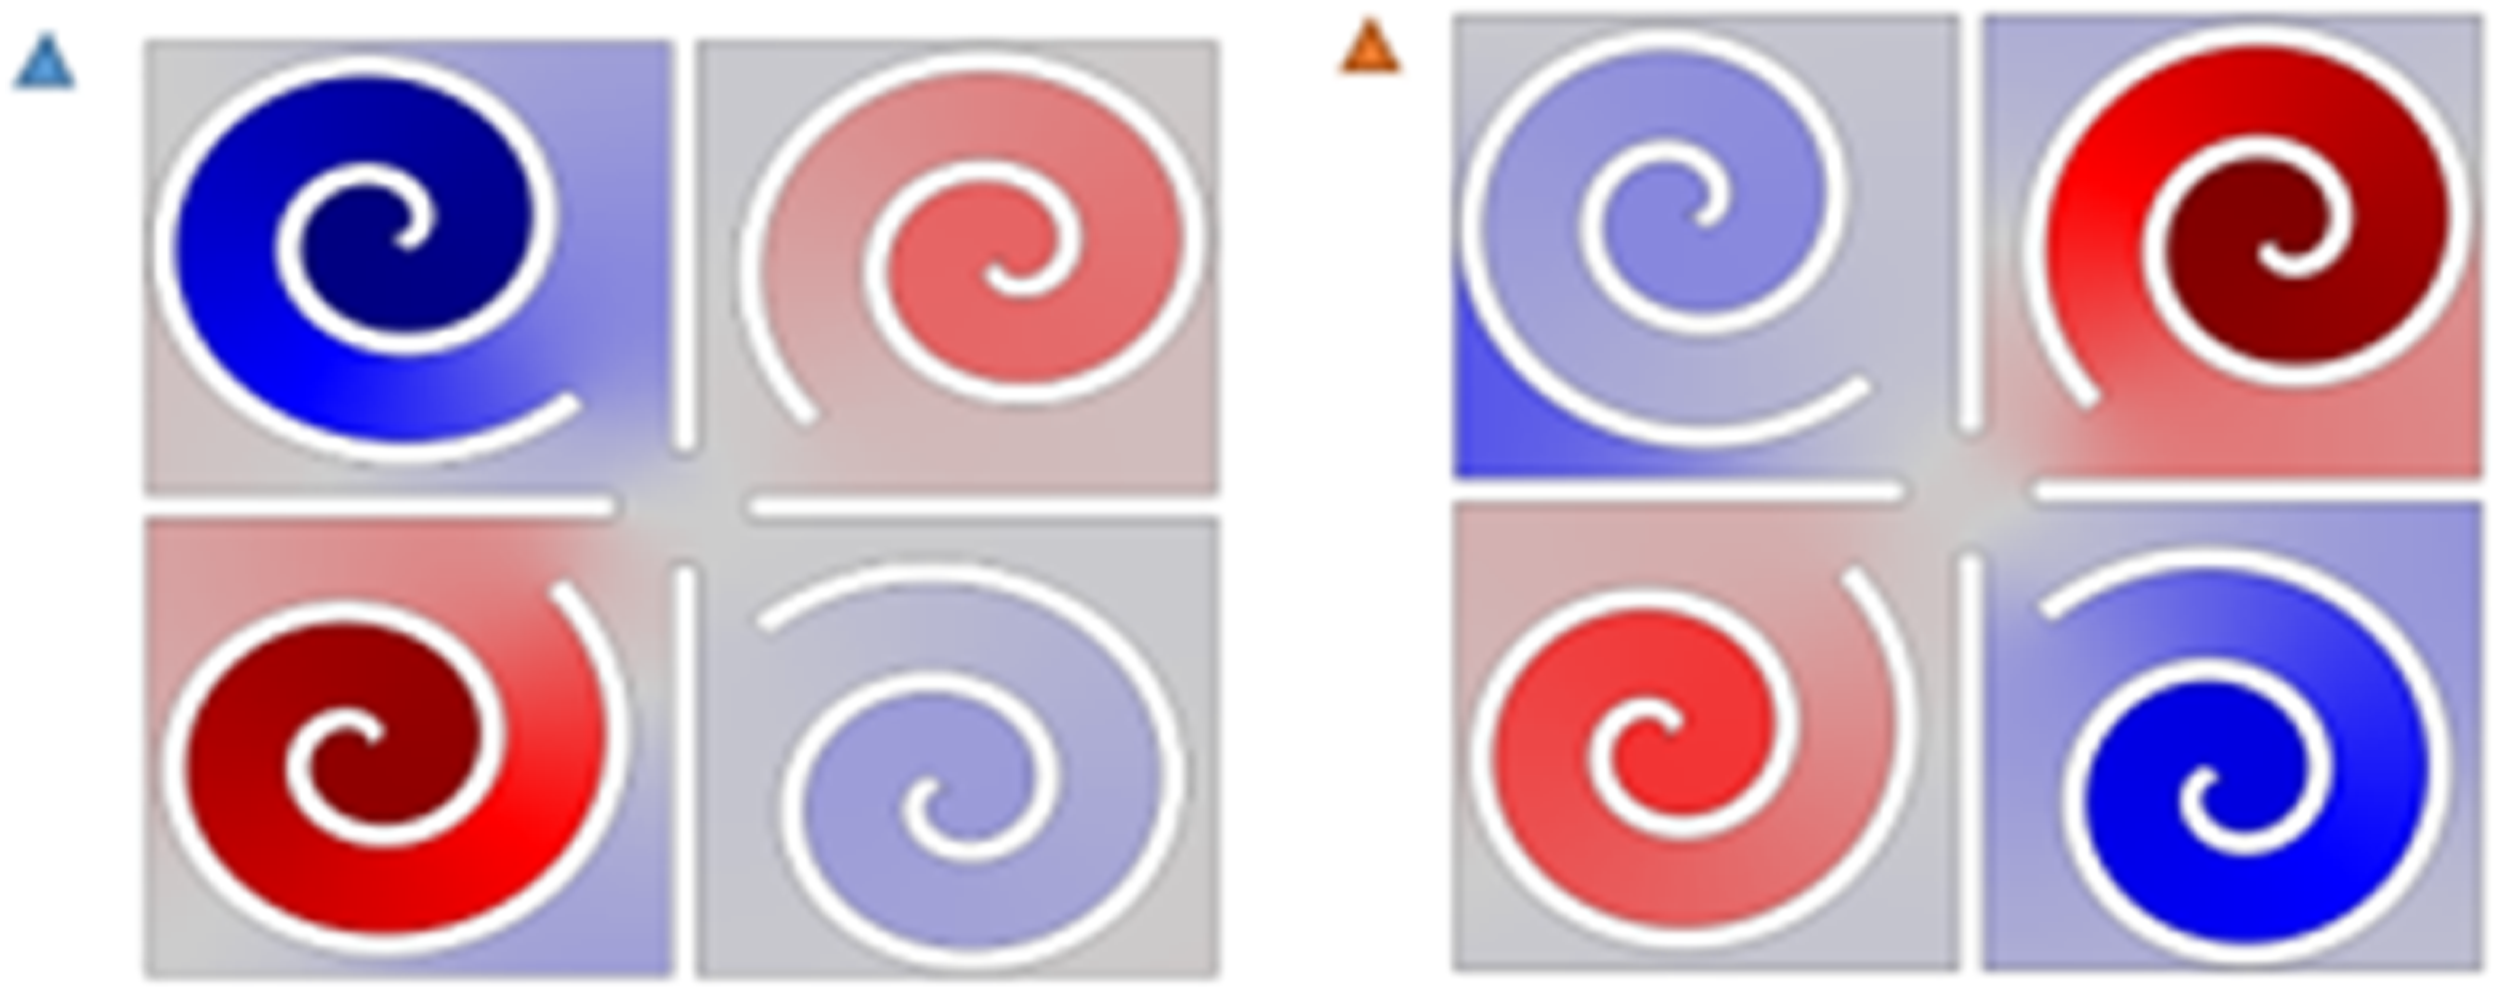
and appear as blind bands in the dispersion curve. Figure 6 shows the resonance modes at the edges of the two bandgap bands represented by the displacement x component. Sideband resonance modes represented by displacement x component.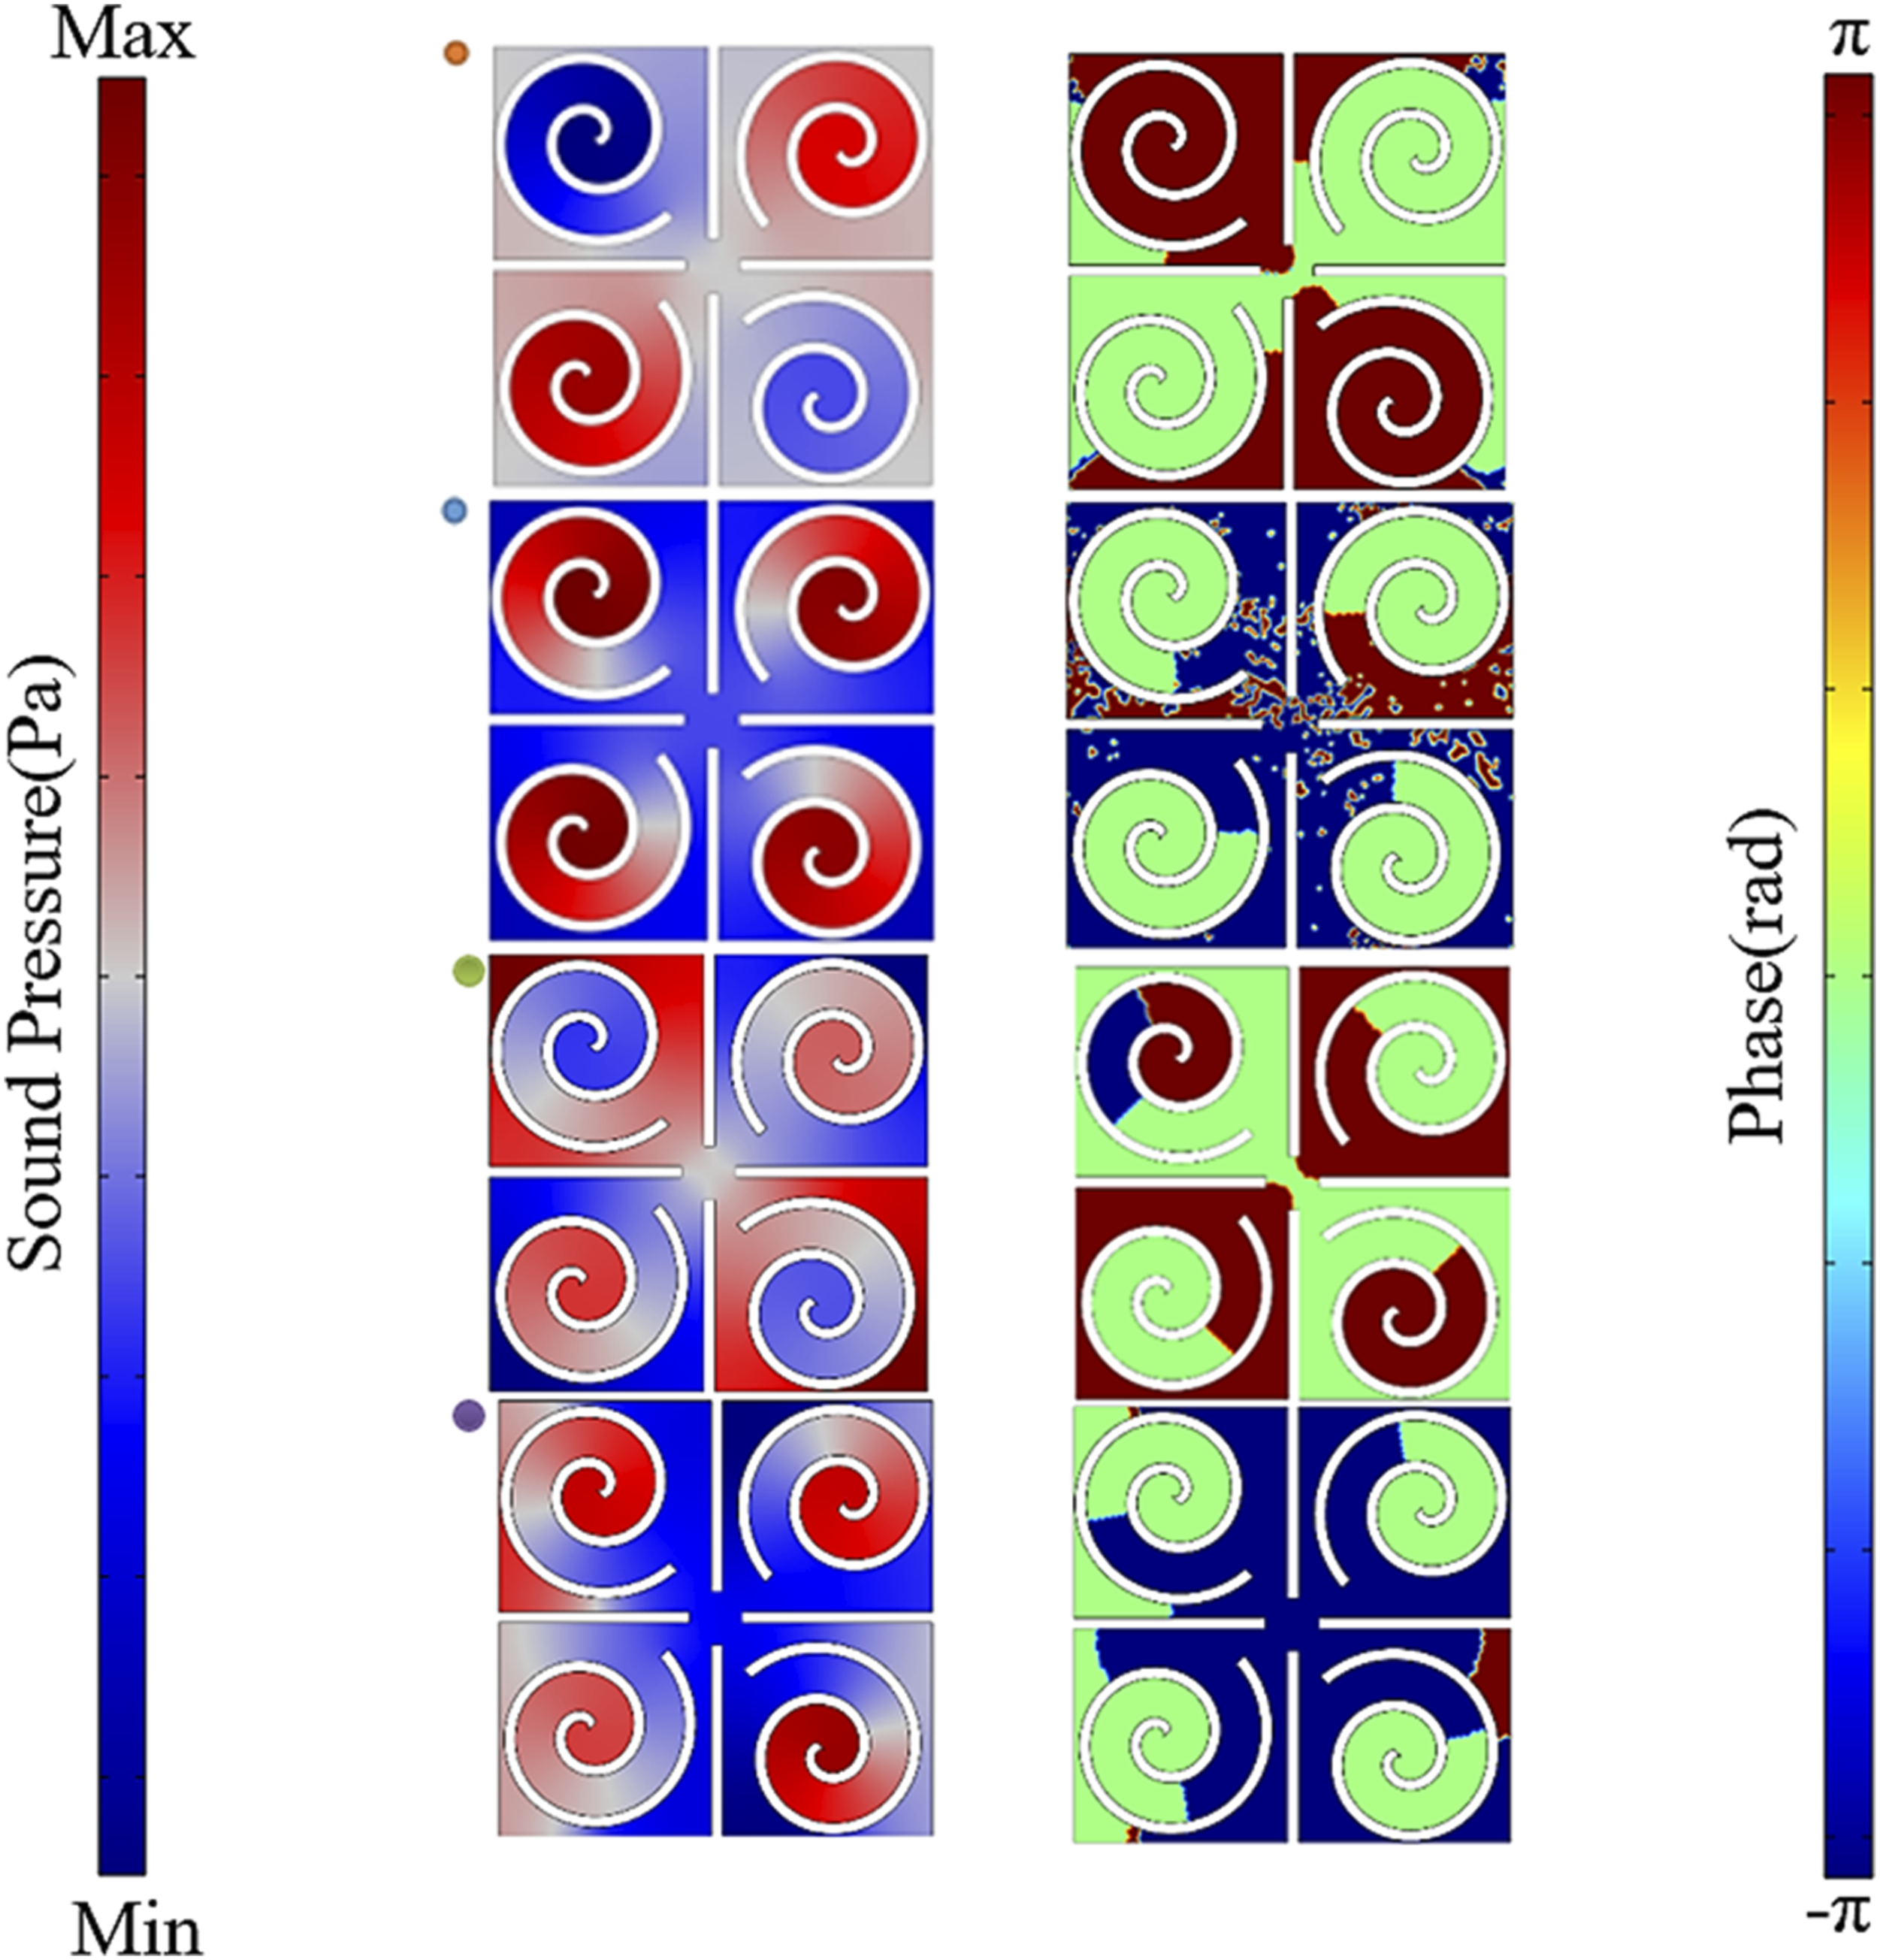
The phase and amplitude of the sound field of a monopole sound source are the same at every point on the surface of the sphere and the directivity is uniform in all directions. A dipole sound source is composed of two monopole sound sources that are very close together (far less than the wavelength) with the same frequency and amplitude and a phase difference of 180°. The quadrupole sound source is composed of two dipole sound sources with the same intensity but opposite phase that are very close together. 15 That is, the two dipole sound sources are very close together and placed relative to each other.
For the band edge resonance mode of BG-2 of the spiral metamaterial, the cut-off frequency sound pressure diagram at the band gap marked with orange dots in Figure 6 shows that the sound energy is concentrated in the spiral channel of each 1/4 unit. The phase diagram marked with orange dots in Figure 6 indicates that the phase in the 1/4 cell is basically the same and the phase difference of each 1/2 cell is π. That is, the direction of the sound wave is opposite. The sound pressure diagram and phase diagram show that there is approximately unipolar resonance every 1/4 unit, dipole resonance every 1/2 unit and quadrupole resonance in the whole cell. Since unipolar resonance produces negative bulk modulus and dipole resonance produces equivalent negative density, negative refractive index is generated. The cut-off frequency sound pressure diagram and phase diagram on the band gap marked with blue dots indicate that each 1/4 element is an approximate dipole resonance.
For the band-edge resonance mode of BG-3 of the spiral metamaterial, the band-gap cutoff frequency sound pressure diagram marked with green dots in Figure 6 shows that the sound energy is concentrated in the spiral channel of each 1/4 cell and is located at three corners except the center of the cell. The phase diagram marked with green dots in Figure 6 indicates that the phase difference between the inside and outside of the spiral in the 1/4 unit is π. That is, the direction of the sound wave is opposite. The sound pressure diagram and the phase diagram show that the approximate dipole resonance of every 1/4 unit in the single cell and the octupole resonance of the entire single cell produce double equivalent negative parameters. The cut-off frequency sound pressure diagram and phase diagram on the band gap marked with purple dots indicate that each 1/4 unit is an approximate dipole resonance and the sound energy is concentrated in the spiral channel of each 1/4 unit with a phase difference of π.
In general, the whole unit has a variety of resonance distribution and the sound pressure field is approximately antisymmetric distribution, which is a mixed Mie mode. The structure is double equivalent negative parameter material in some frequencies, referred to as double negative material. At the same time, complex resonance modes are generated in the interaction regions of different resonances and the distribution of sound pressure radiation becomes complicated.
Discussion and analysis of metamaterial parameters
This configuration has changed the effects of changing the number of turns n, changing the turn spacing m and changing the inner diameter r on the band gap are discussed. Then the spiral metamaterial parameters with the best band gap characteristics are determined.
Change the number of turns n
The lattice constant a = 40.47 mm, the width of the rectangular perforated plate w = 1 mm, the inner diameter of the spiral structure r = 0.08 mm and the spiral turn spacing m = 2.5 mm are tentatively determined. The influence of turns n on the band gap is discussed. Figure 7 shows the band structure diagram with a change in the number of turns n. Dispersion curve with a change in the number of turns n (n = 1.6,n = 1.8, n = 2).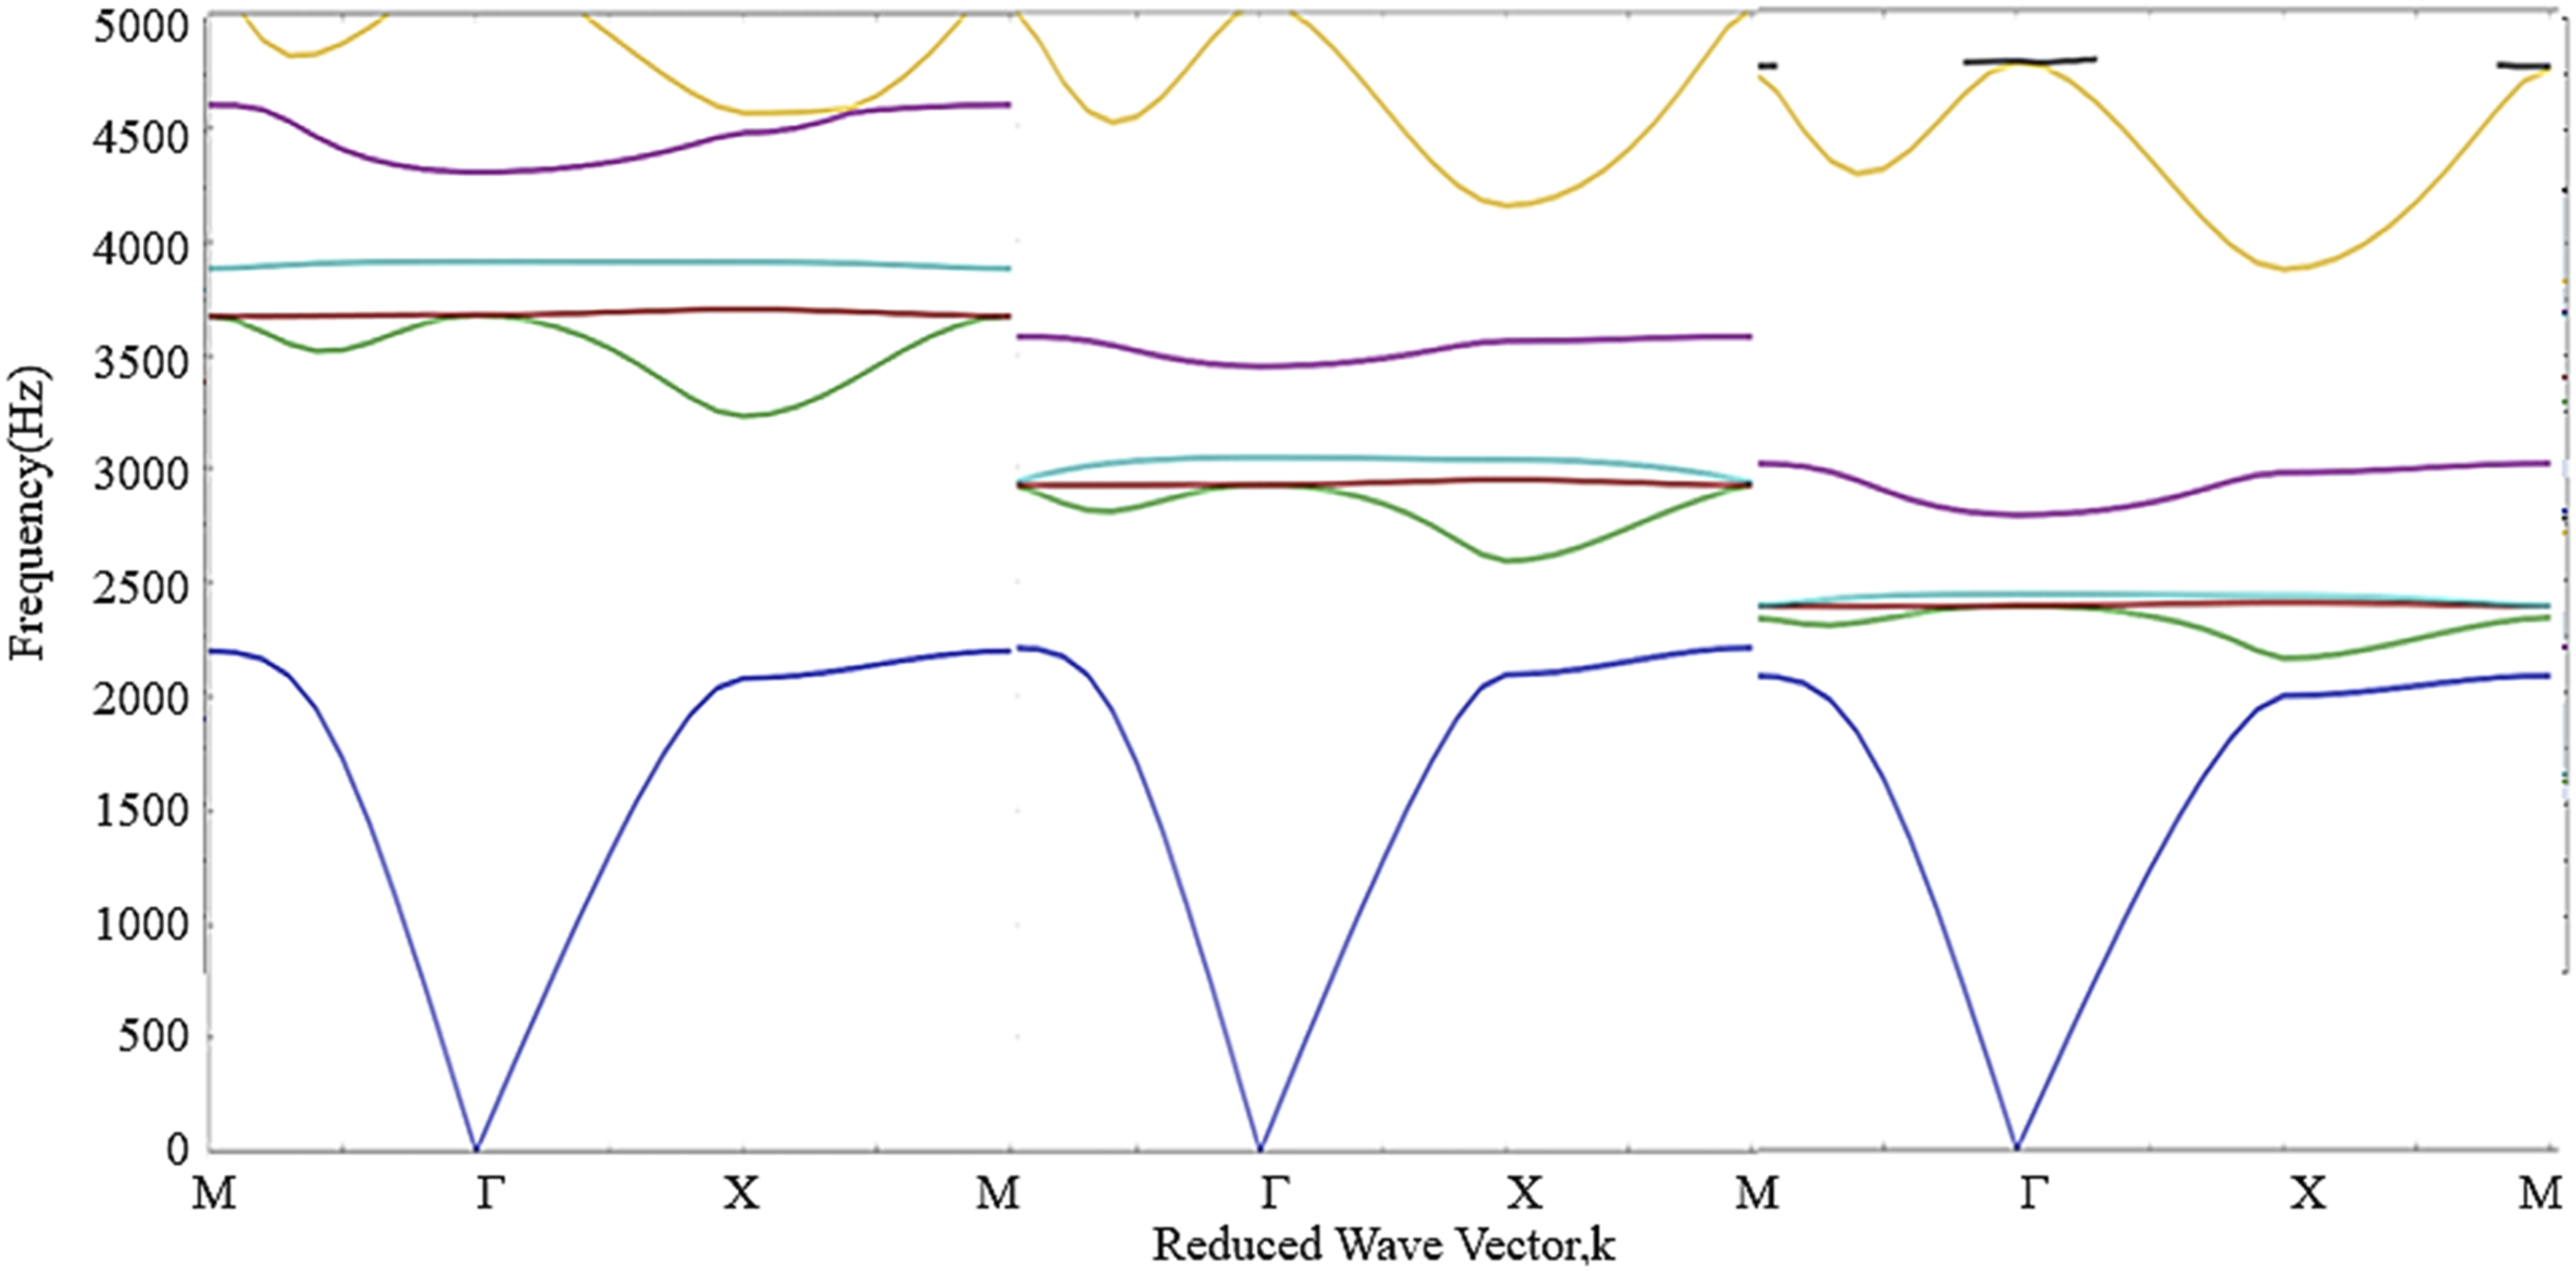
According to the band structure diagram, it can be seen that in the range of 0–5000 Hz, with the number of spiral turns increases, the band gap moves to low frequencies and the width of the first band gap becomes narrower and narrower. The frequency range is in line with the goal of controlling noise in middle and low frequency band. And the number of turns n = 2 is determined as the best parameter.
Change turn spacing m
The provisional lattice constant a = 40.47 mm, the width of the rectangular perforated plate w = 1 mm, the inner diameter of the spiral r = 0.08 mm and the number of turns n = 2 were determined. The effect of turn spacing m on the band gap was analyzed. Due to the limitation of lattice constant, the turn spacing m can be increased to a maximum of 3.8 mm. Figure 8 shows the band structure diagram of changing the turn spacing m. Dispersion relation curve with change of turn spacing m(m = 2.5 mm, m = 3 mm, m = 3.8 mm).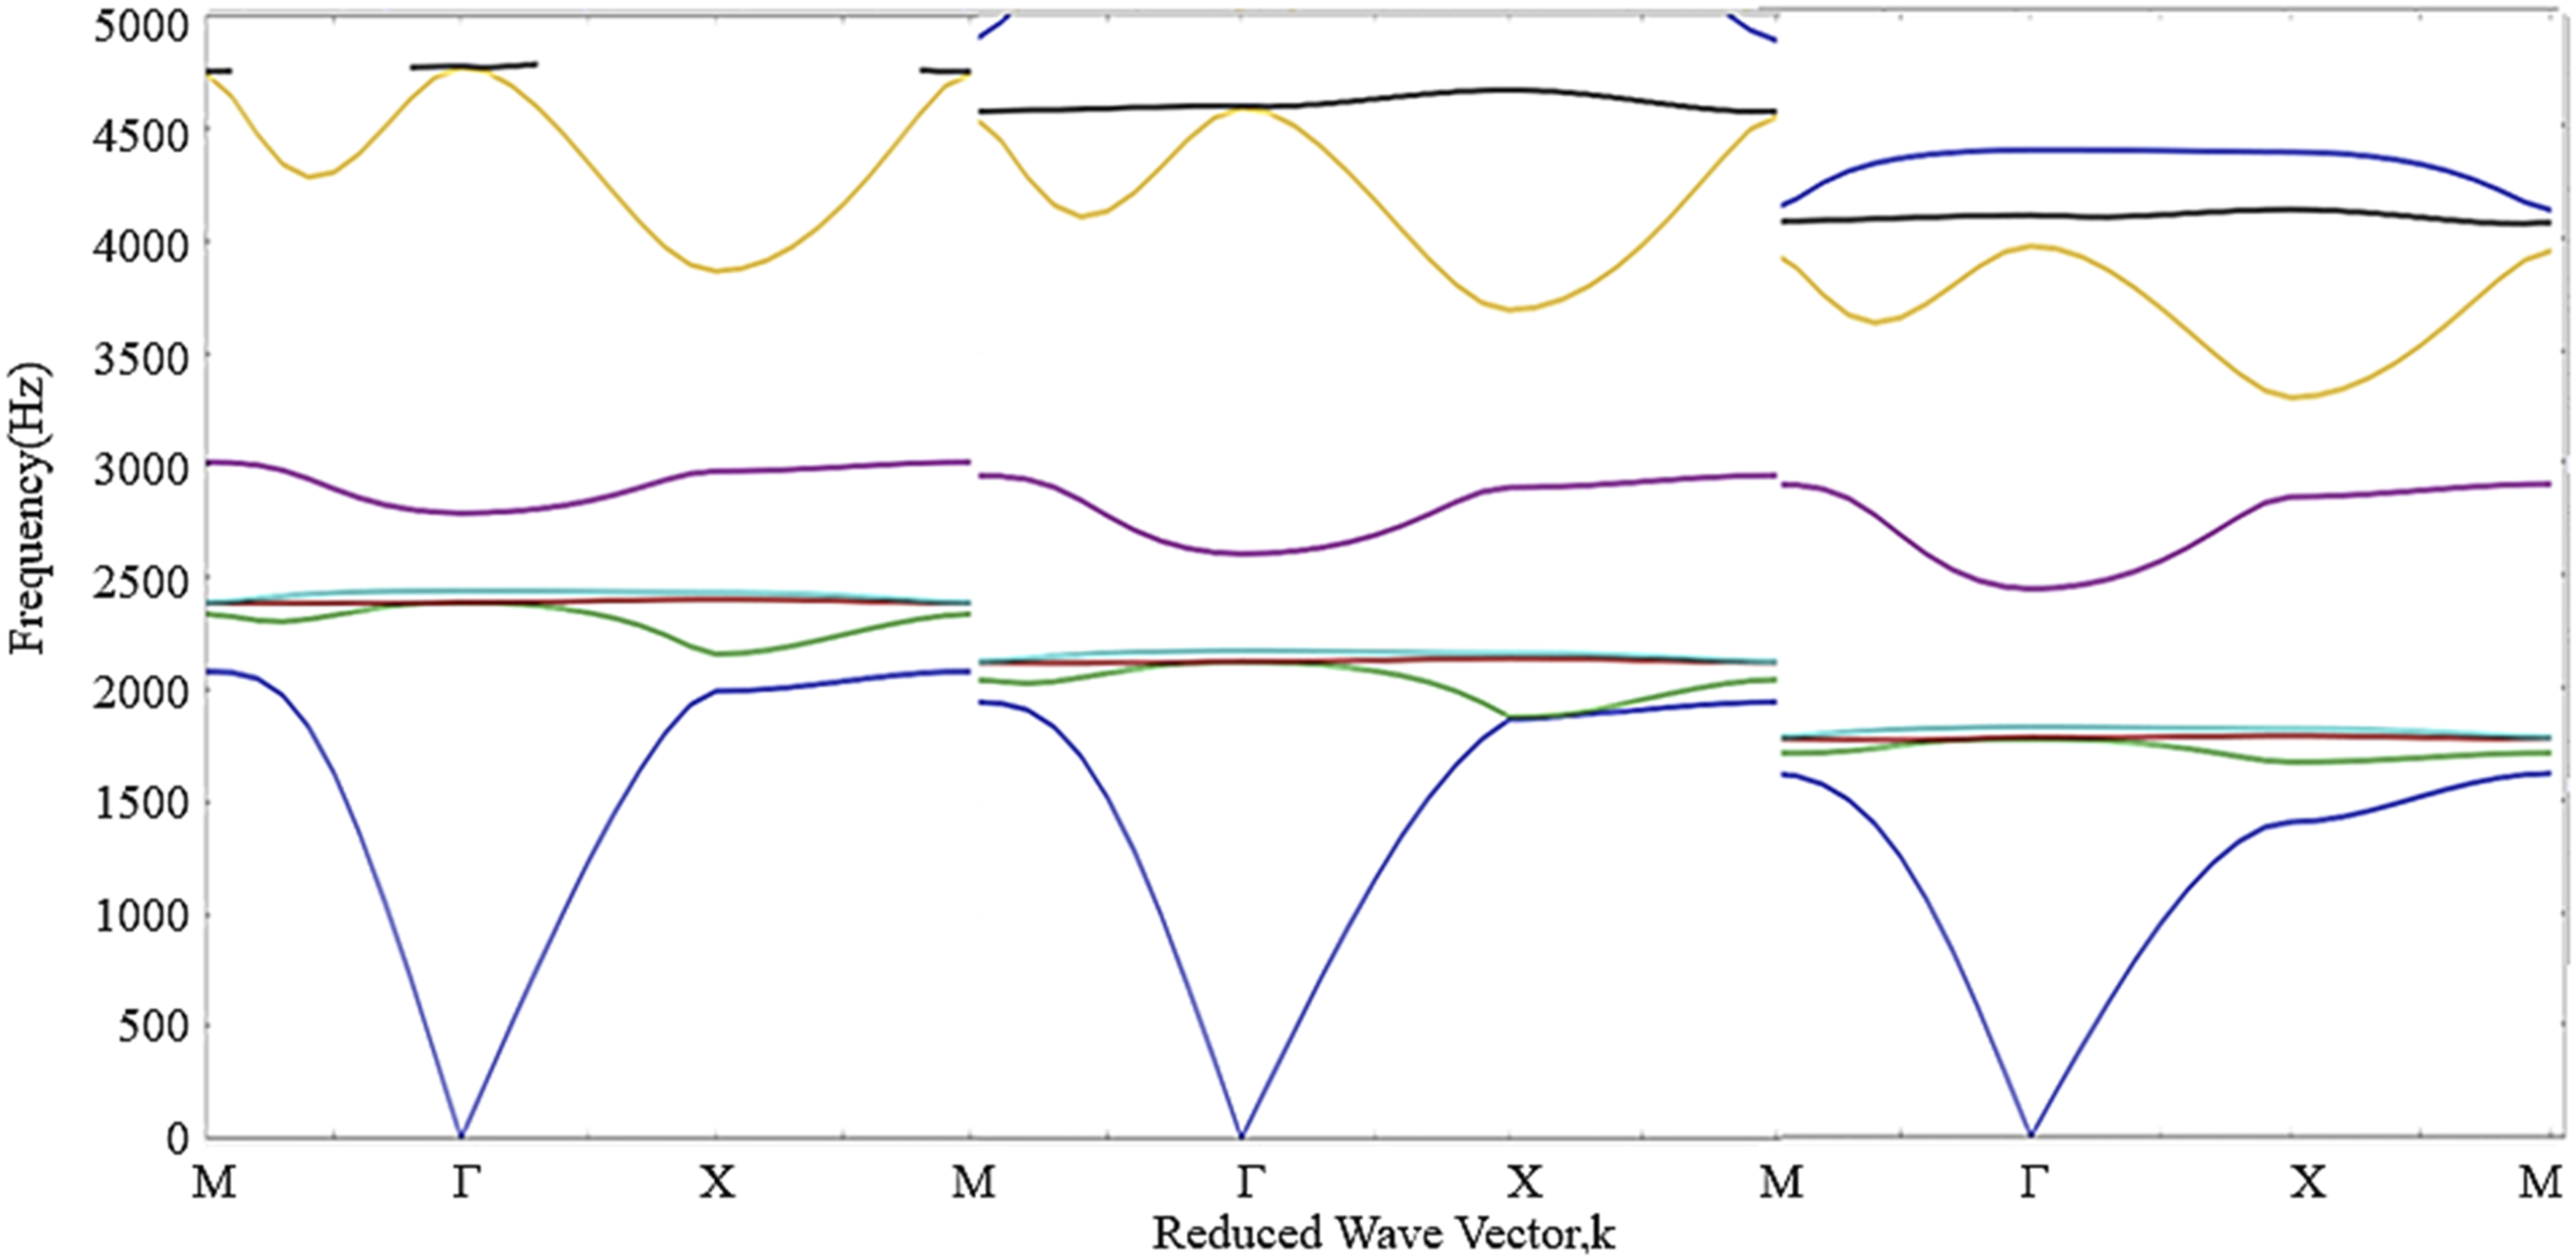
It can be seen from the band structure diagram that the first band gap merges and the band gap shifts to low frequency with the increase of turn spacing m. When the number of turns is set to n = 2 and the turn spacing is set to m = 2.5 mm, the bandgap width is 522 Hz. When the number of turns is set to n = 2 and the turn spacing is set to m = 3.8 mm, the band gap is from 1820 Hz to 2437 Hz and the band gap width is 617 Hz. In contrast, the combination of turns n = 2 and turn spacing m = 3.8 mm has a wider band gap, which is in line with the policy of controlling middle and low frequency broadband noise. Therefore, the number of spiral turns to determine the spiral configuration is n = 2 and the turn spacing is m = 3.8 mm.
Change the inner diameter of the spiral r
When the lattice constant a = 40.47 mm, the width of the rectangular and spiral solid w = 1 mm, the turn spacing m = 3.8 mm and the number of turns n = 2 mm, the band gap effect is the best. Based on these parameters, the influence of spiral inner diameter r on the band gap is analyzed. Figure 9 shows the band structure diagram of the spiral with the inner diameter r changed. Band structure curve of spiral with inner diameter r changed(r = 0.07 mm, r = 0.09 mm, r = 0.1 mm, r = 0.15 mm).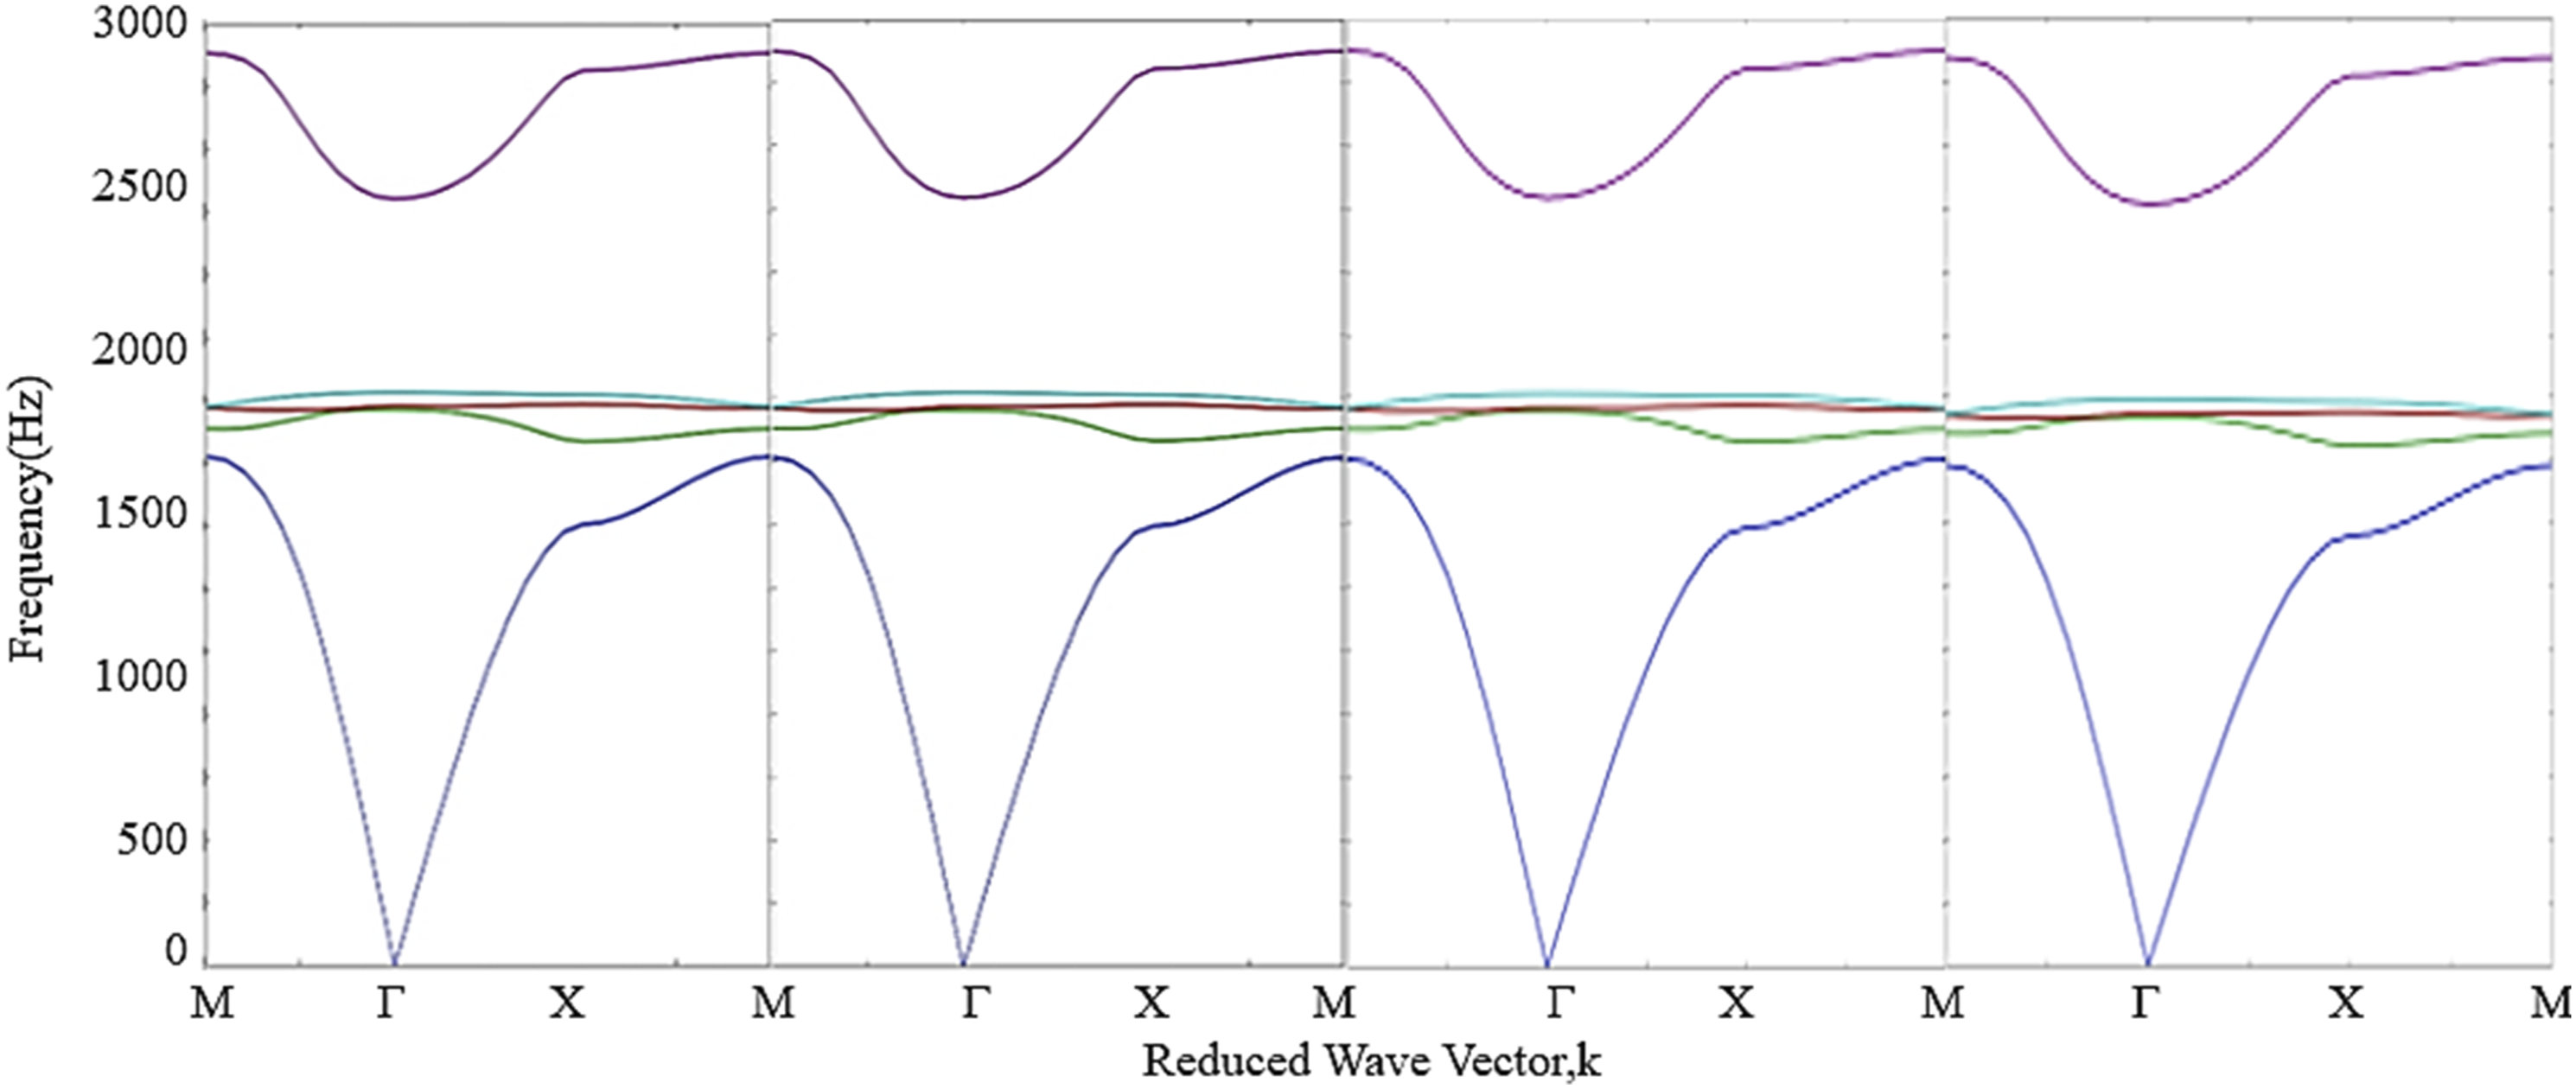
Band gap frequencies and band gaps under different spiral inner diameters.
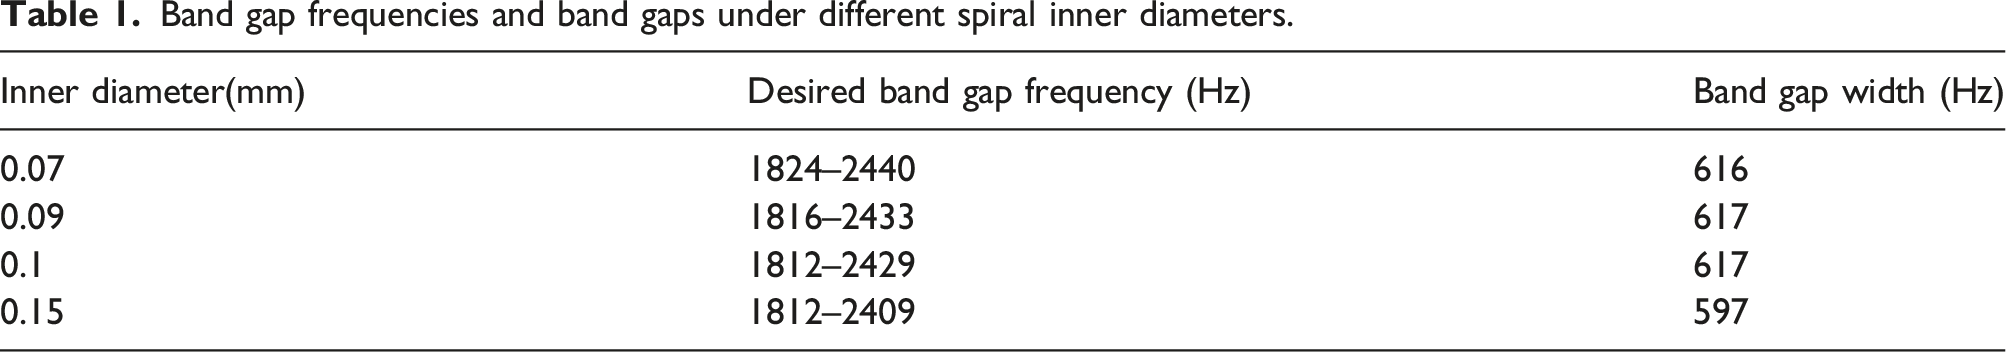
Combined with the band structure diagram and Table 1, it can be seen that with the spiral inner diameter r increases, the band gap structure gradually drops. When the inner diameter r is 0.1 mm, the corresponding band gap frequency range is 1812–2429 Hz and the bandgap width is 617 Hz. Considering the requirements of middle and low frequency and band gap, it is determined that the performance is optimal when r = 0.1 mm.
In summary, the optimal geometric parameters of spiral acoustic metamaterials are as follows: number of turns n = 2, spiral diameter r = 0.1 mm, turn spacing m = 3.8 mm. There are two band gaps in the 0–2500 Hz frequency band and the first band gap frequency range is 1606–1660 Hz, which is narrow. The frequency range of the second strip gap is 1812–2429 Hz and the bandgap width is 617 Hz. The second band gap is wider, so the second band gap is chosen as the main research object.
Numerical simulation of sound absorption and insulation properties of metamaterials
Numerical simulation of sound absorption performance
When the sound wave encounters the material, part of the sound energy is reflected, part of the sound energy enters the material and is absorbed, and part of the sound energy continues to propagate through the material. The sound absorption coefficient is usually used to measure the sound absorption capacity of a material. The calculation formula of sound absorption coefficient is as follows

Generally, materials with a sound absorption coefficient greater than 0.2 are called sound absorption materials. The sound absorption capacity of the material is proportional to the sound absorption coefficient. 16
The sound absorption performance of space spiral metamaterials was simulated by COMSOL Multiphysics. A rectangular waveguide with a width of 40.57 mm and a length of 82 mm is set at the left end of the metamaterial. A background pressure field of 1 Pa is set on the left side of the waveguide and plane wave excitation is applied. A perfectly matched layer (PML) is set to the left of the background pressure field to eliminate the reflected waves.
14
Since the impedance of the solid material is much greater than that of the air at 331.5 m/s, the solid wall can be regarded as an acoustic hard boundary condition. The physical field setup is shown in Figure 10, with blue shadows representing perfectly matched layers that are used to absorb reflected sound waves. We calculated the sound absorption coefficients of 1–3 single cells, respectively, through simulation, as shown in Figure 11: Schematic diagram of physical field setting for three unicellular sound absorption simulations. Calculation of sound absorption coefficient of 1–3 cells.
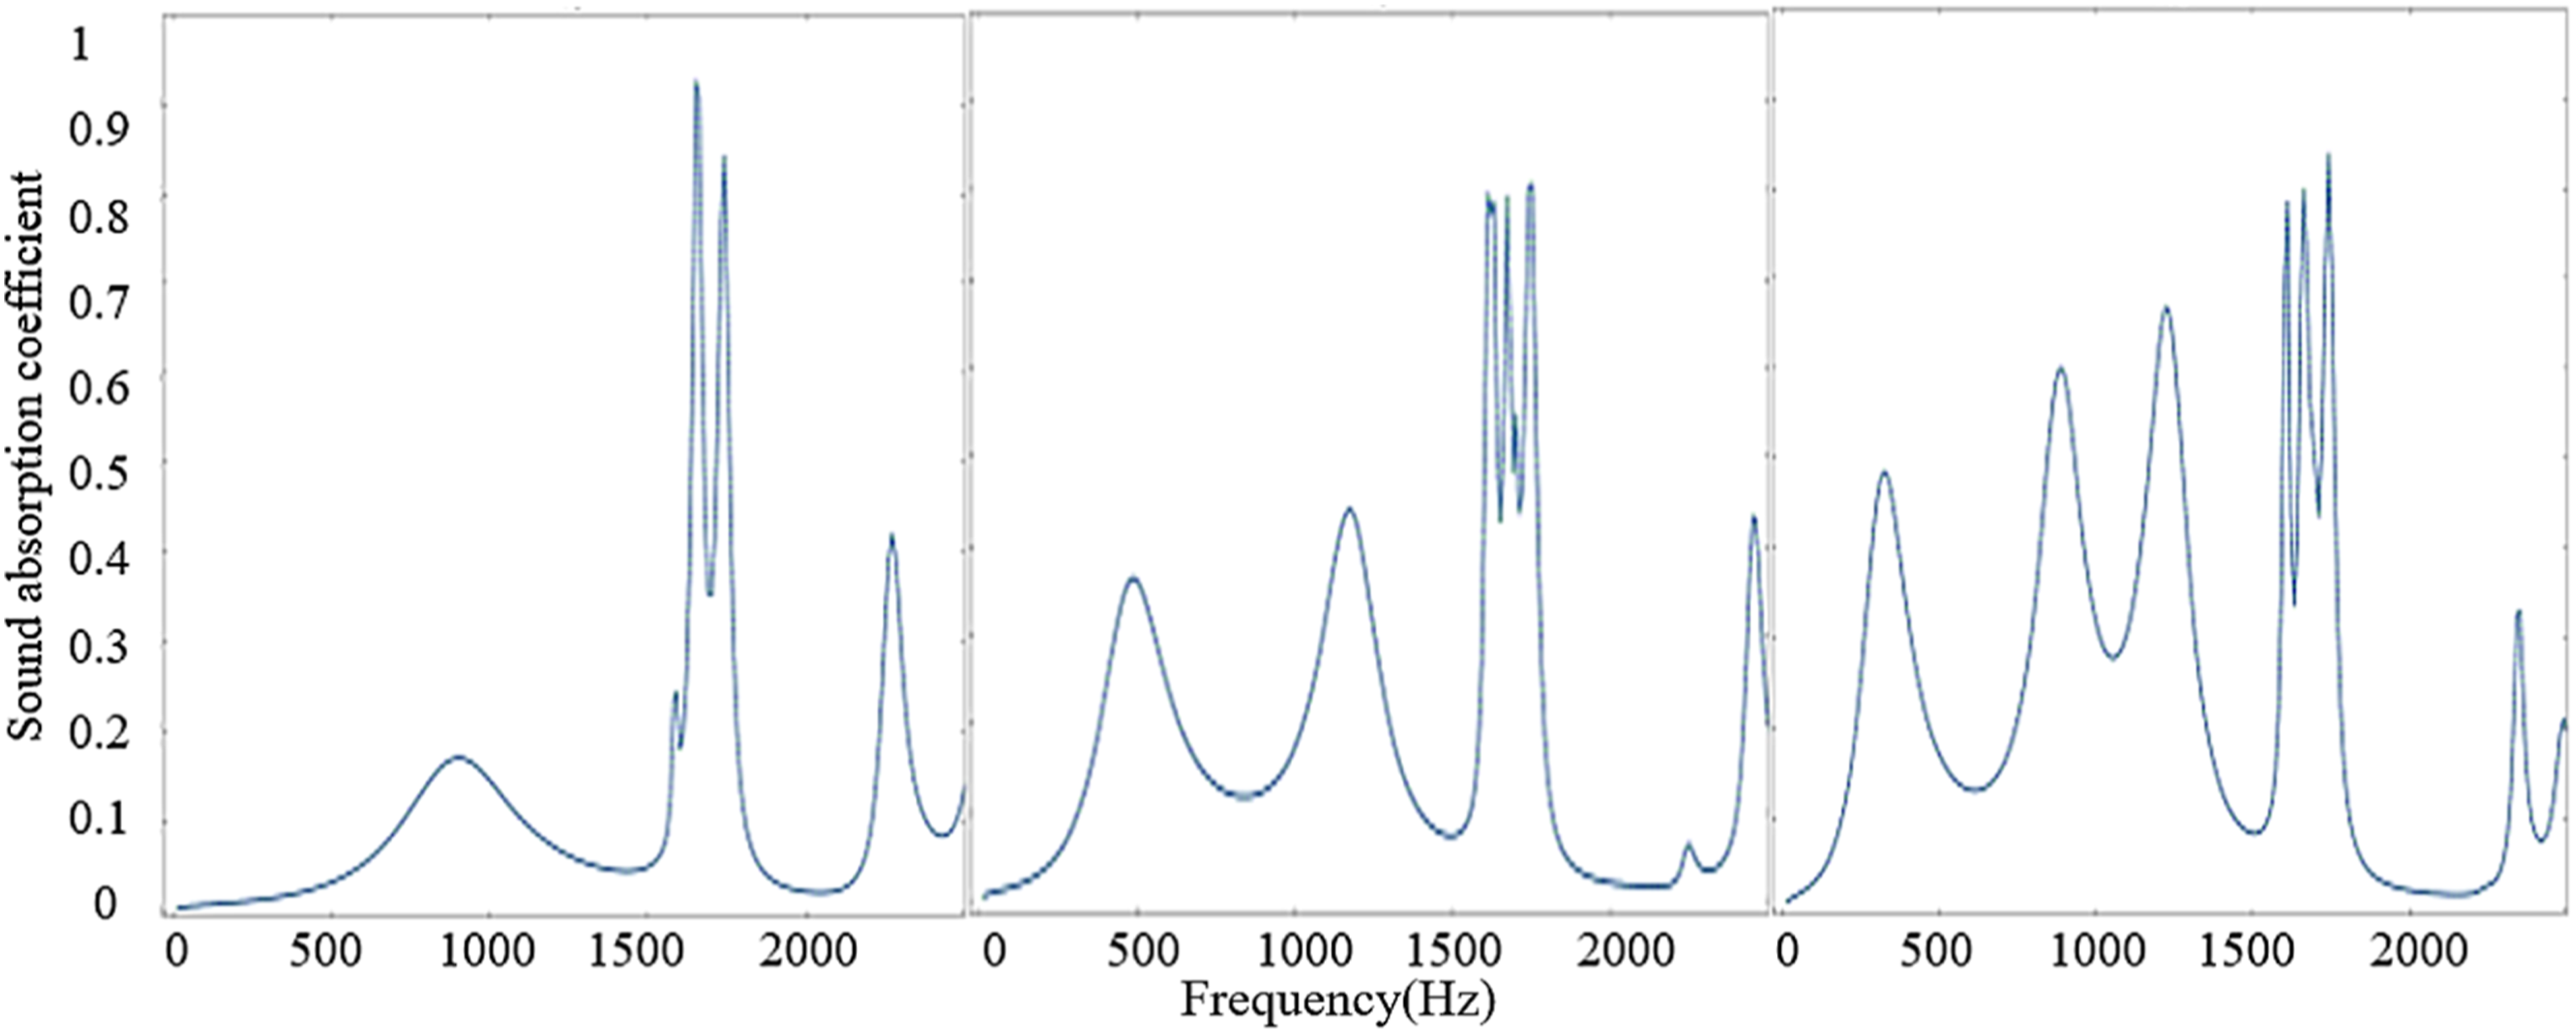
When calculating the sound absorption coefficient of a single cell, the sound absorption coefficient of the material in the range of 0–1600 Hz is below 0.2 and the sound absorption effect is not good in this frequency band. Above 1600 Hz, there is a narrow band of sound absorption and the sound absorption coefficient is more than 0.5 in 1650–1800 Hz. So the sound absorption effect is good in this frequency band. When the sound absorption coefficient of the two cells is simulated, two sound absorption bands of the material in the range of 0–1600 Hz are above 0.4, which are in the range of 400–600 Hz and 1000–1200 Hz, respectively. But both are narrow-band sound absorption. When the sound absorption coefficient of the three cells is simulated, the sound absorption coefficient of the material within 0–1600 Hz is above 0.4. The first wave peak appears at 400 Hz and the sound absorption coefficient reaches 0.5. There are six sound absorption peaks and the sound absorption coefficient reaches 0.8 in the range of 600–1800 Hz. The material has good middle and low frequency broadband sound absorption effect when three cells are arranged. So it is a good sound absorption material, which will play a good role in submarine middle and low frequency broadband noise absorption.
According to the analysis of the sound absorption-frequency curve, with the increase of sound absorption units, the number of wave peaks also shows an increasing trend within 0–1500 Hz and the frequency of the first wave peak gradually moves to the low frequency. And the peak value of the sound absorption coefficient also increases gradually, but all of them are narrowband sound absorption. The sound absorption frequency range needs to be expanded. The simulation results show that with the increase of the number of sound absorption units, the sound absorption effect of the material is better. Spiral metamaterials have good sound absorption effect.
Numerical simulation of sound insulation performance
The use of certain materials or structures in the path of sound transmission to block its transmission is called sound insulation. When the sound is incident on the surface of the material, there is less sound energy transmitted through the material into the other side, the stronger the sound insulation ability of the material is. The sound insulation of the material is the decibel number of the incident sound energy minus the decibel number of the transmitted sound energy.
Because some channels are narrow, the sound will cause heat loss and viscosity loss during propagation. Therefore, it is necessary to consider the influence of thermal viscosity loss on the propagation of sound waves in the simulation calculation.
The continuity equation of the thermal viscoacoustic model is formulated as follows
The formula for the momentum equation is as follows
The equation of conservation of energy is as follows

The above equations constitute the solution equation of the thermal viscosity audio domain and the sound pressure p is obtained after considering the thermal viscosity loss.
The formula for calculating sound insulation is as follows
With the increase of the number of structural units, the characteristics of acoustic transmission loss become better. It is known that the cell lattice constant a is 40.47 mm. Due to the length limitation of the standing wave tube, a maximum of three cell arrangement sample materials can be studied. The schematic diagram of the physical field setup is an example of an arrangement of three single cells, as shown in Figure 12. In order to verify the above conclusions, we calculated the sound transmission loss (STL) of 1–3 cells, respectively, through numerical simulation, as shown in Figure 13. When the acoustic wave is incident from the left side, the thermal viscosity loss will be generated in the solid material's narrow channel due to frictional resistance. Therefore, the configuration area is placed under the thermal viscoacoustic module for calculation and the other areas are still calculated under the pressure acoustic module. In COMSOL Multiphysics, parameters required in the thermal viscosity solution equation will be defined according to material characteristics and sound velocity, such as heat capacity C
P
at constant pressure, thermal expansion coefficient α
0
at constant pressure, isothermal compression coefficient β
T
and so on. Thus, the sound pressure p after considering the thermal viscosity loss is calculated, which is the sound pressure amplitude p
t
at the outlet. Then STL can be calculated by the Formula (9). The effect of thermal viscosity loss on sound insulation performance can be well simulated by using the multi-physics coupling method. The acoustic transmission loss (STL) with the introduction of viscosity and thermal viscosity loss is shown in Figure 14: Schematic diagram of physical field setting for three cells acoustic insulation simulation. STL curves of 1–3 cells(standard). STL curves of 1–3 cells(considering thermal viscosity loss).
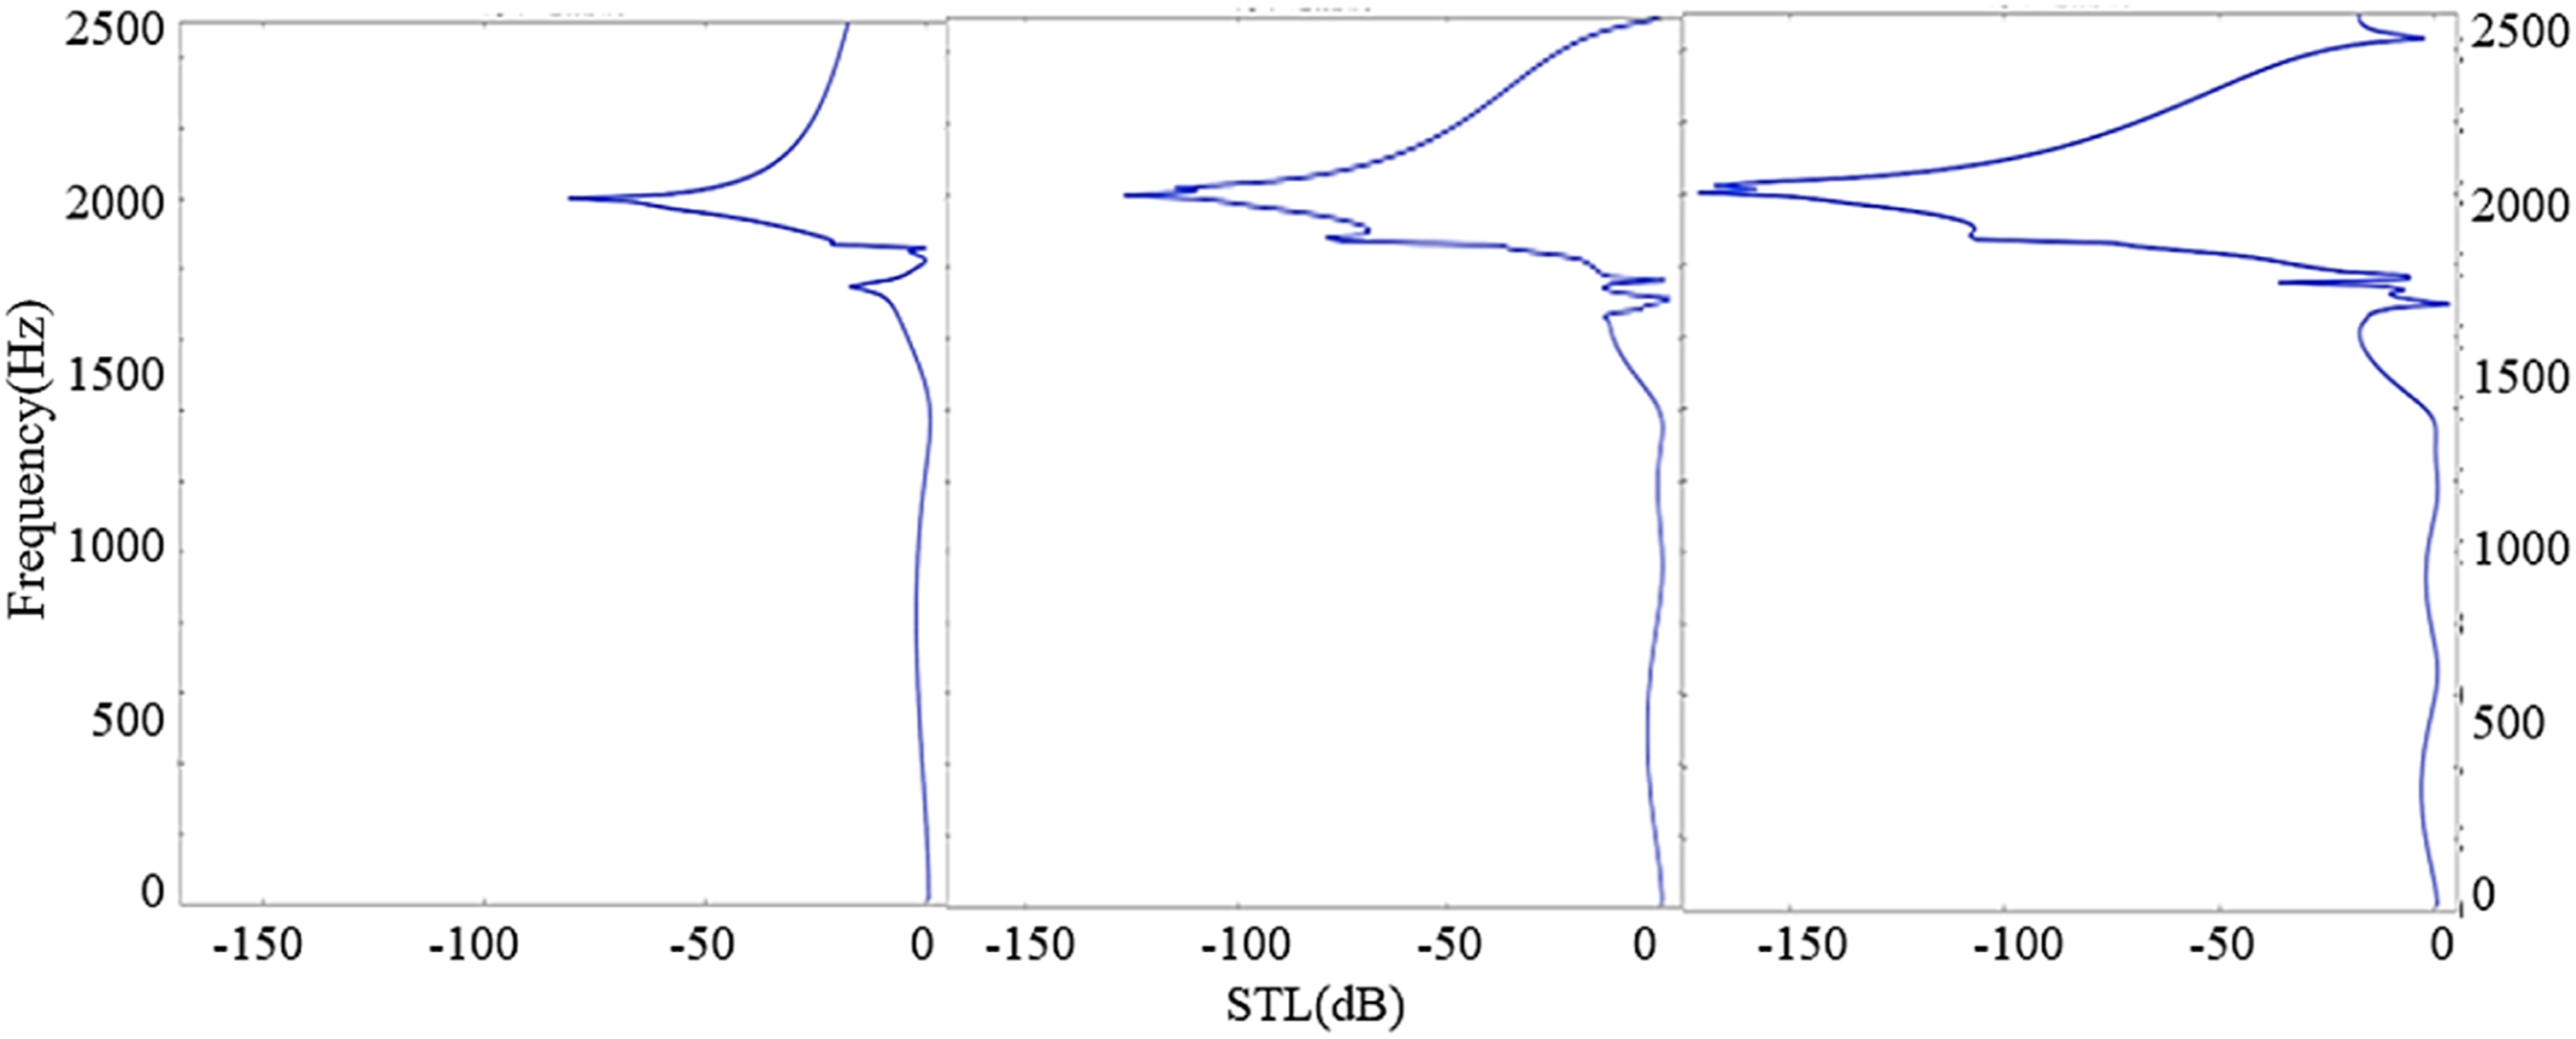
According to the sound transmission loss curve, it can be seen that only in the pressure acoustic-frequency domain calculation, the STL curve of the three single cells reaches a peak value of 167 dB at 2000 Hz. After adding the thermoviscous acoustic-frequency domain calculation, the STL curve of the three single cells reaches a peak value of 158 dB at 1938 Hz. The simulation results show that when viscosity and thermal viscosity loss are introduced into the simulation, the peak value of acoustic transmission loss will decrease overally.
According to the STL curve, it can be seen that in the frequency range measured by the standing wave tube, with the increase of the number of structural units, the acoustic transmission loss characteristics will be better and the wave attenuation will be more intense. Therefore, in order to obtain better sound insulation effect, three single cells are arranged in the direction of wave propagation to achieve strong wave attenuation.
Experimental analysis of sound absorption and insulation properties of metamaterials
In order to verify the consistency between the sound absorption and insulation capability of the proposed spiral acoustic metamaterial and the numerical calculation results of COMSOL Multiphysics, the spiral metamaterial was prepared by 3D printing. And the sound absorption experiment and sound insulation measurement experiment were carried out. Figure 15 shows the printed 3D model. Schematic diagram of spiral acoustic metamaterial sample prepared by 3D printing.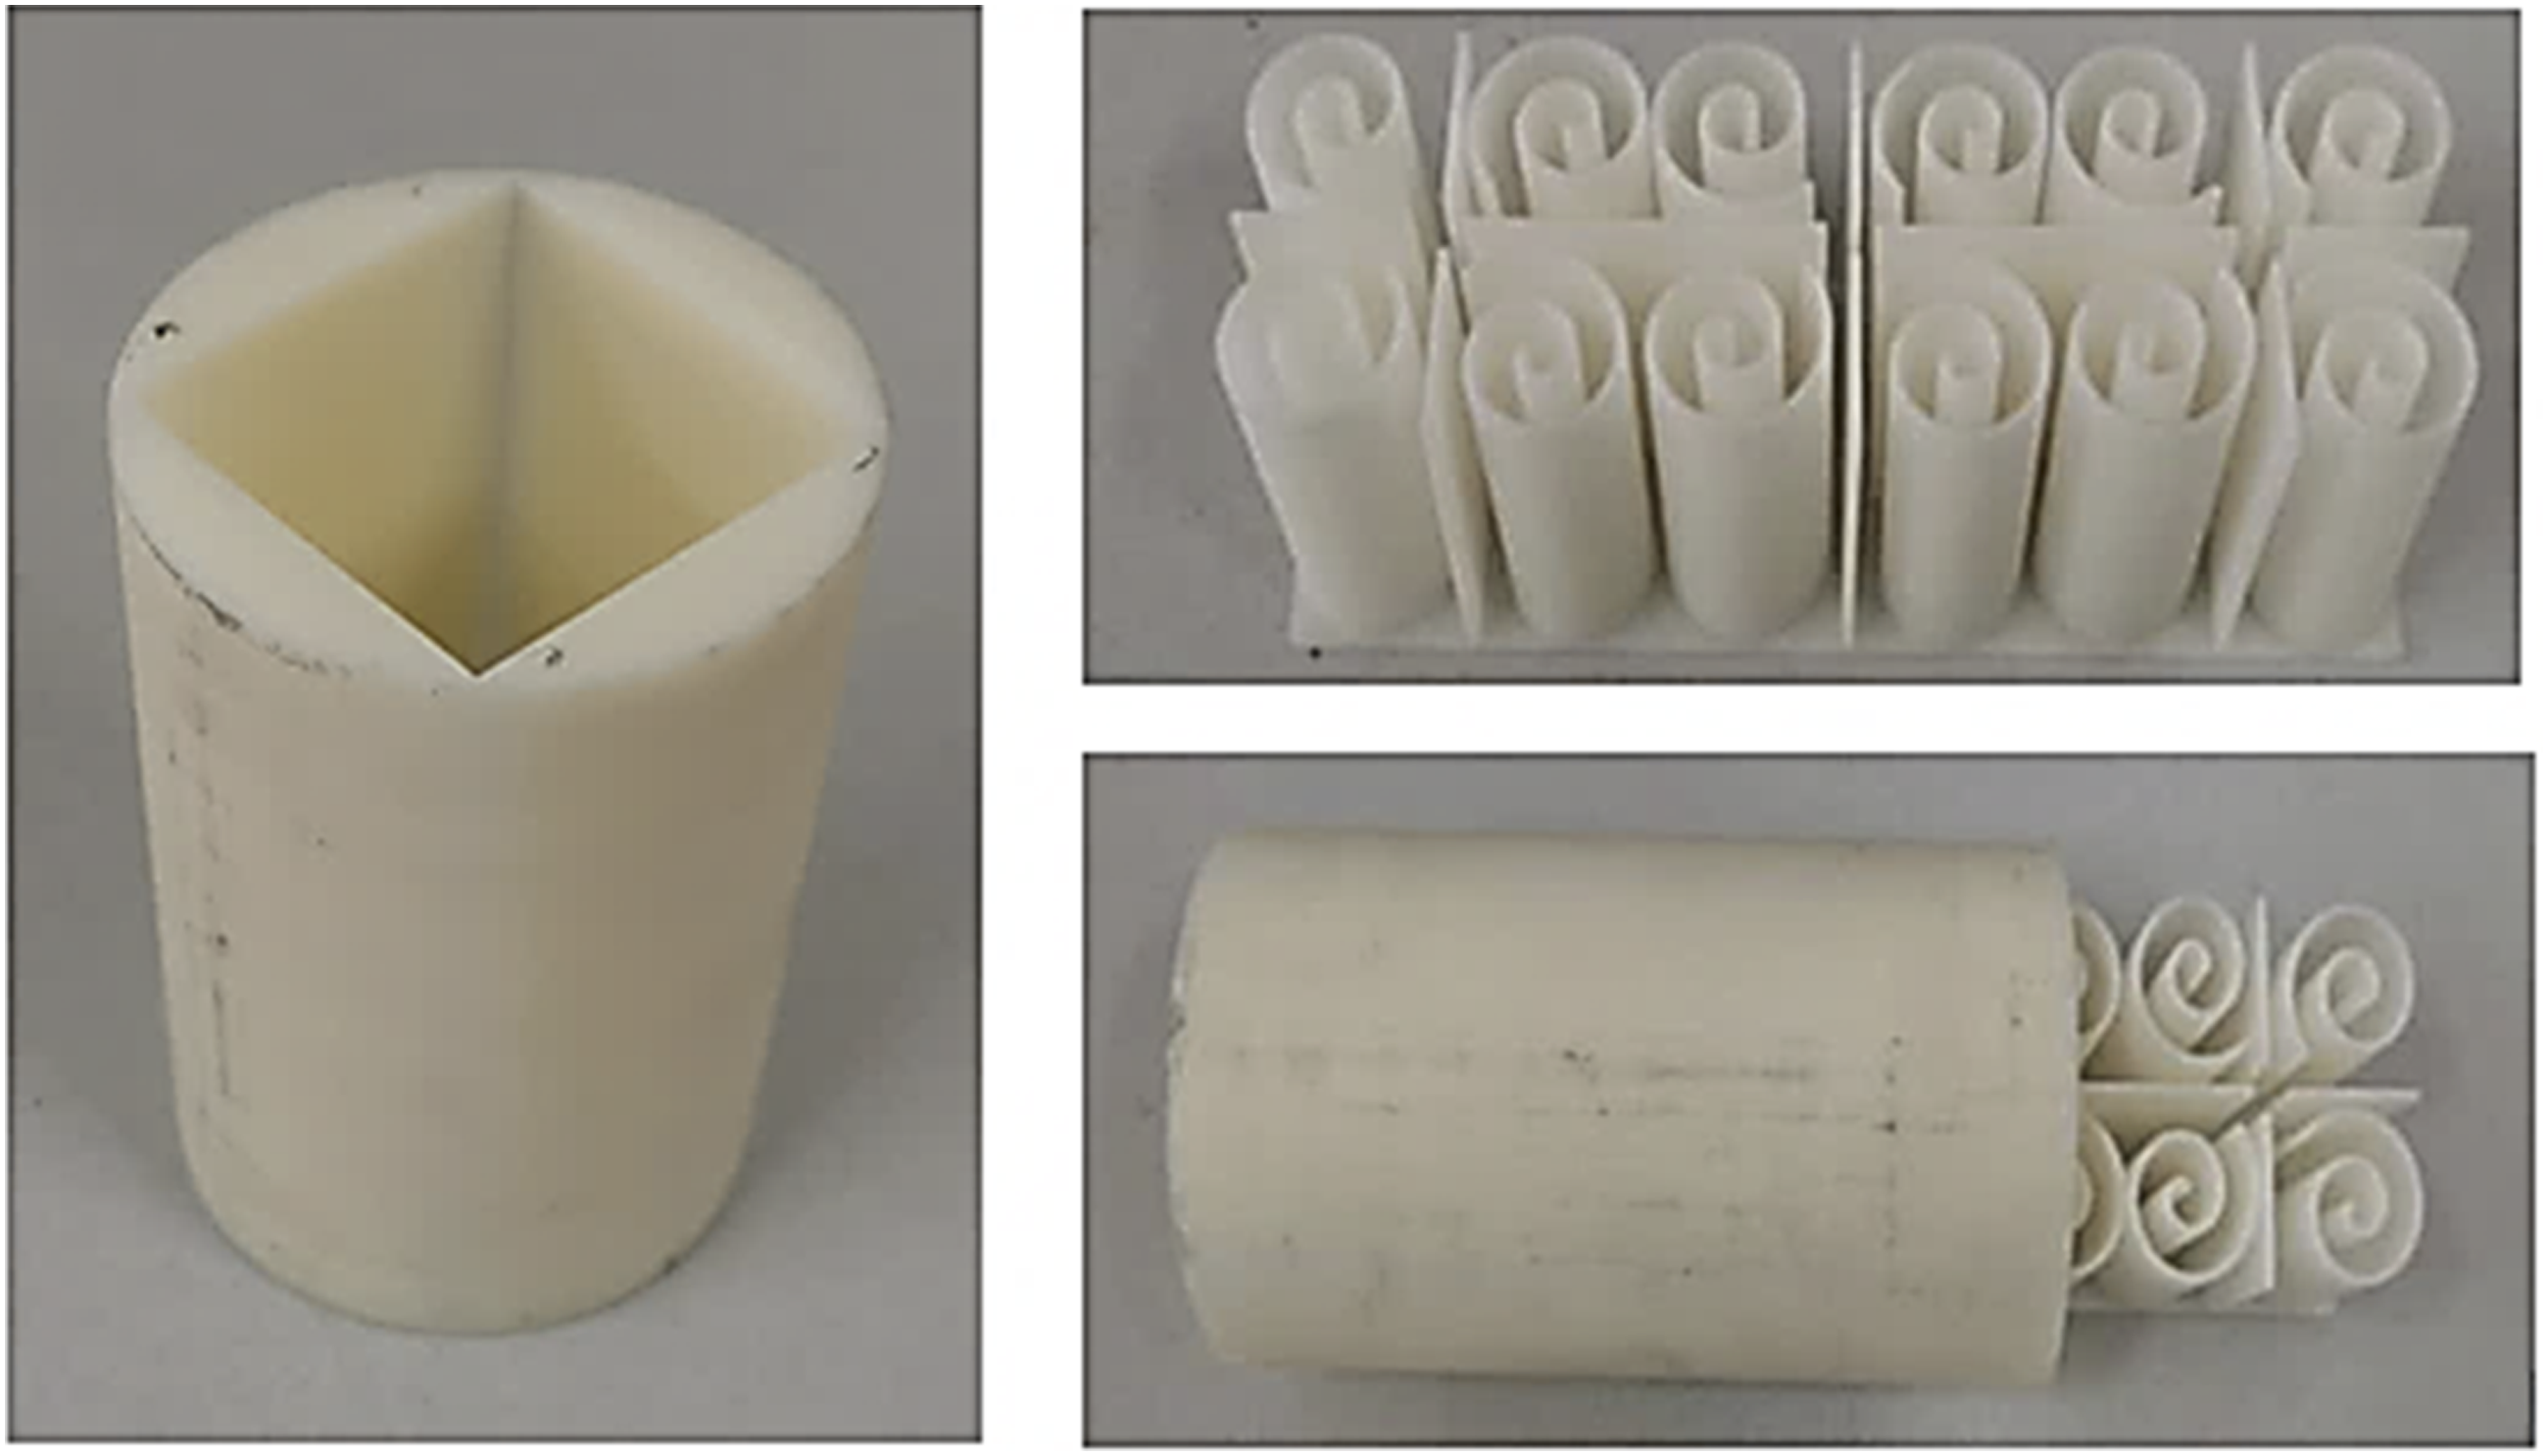
Experimental sound absorption performance verification
The overall setup of the experiment is shown in Figure 16, which includes computer, power amplifier (BSWA, PA300), 60 mm impedance tube system (BSWA, SW9115, test frequency range 100–2500 Hz) and data collector (BSWA, MC3242 A). The comparison of sound absorption coefficient between simulation and experimental results is shown in Figure 17: Sound absorption experimental device. Comparison of sound absorption coefficients between numerical and experimental results.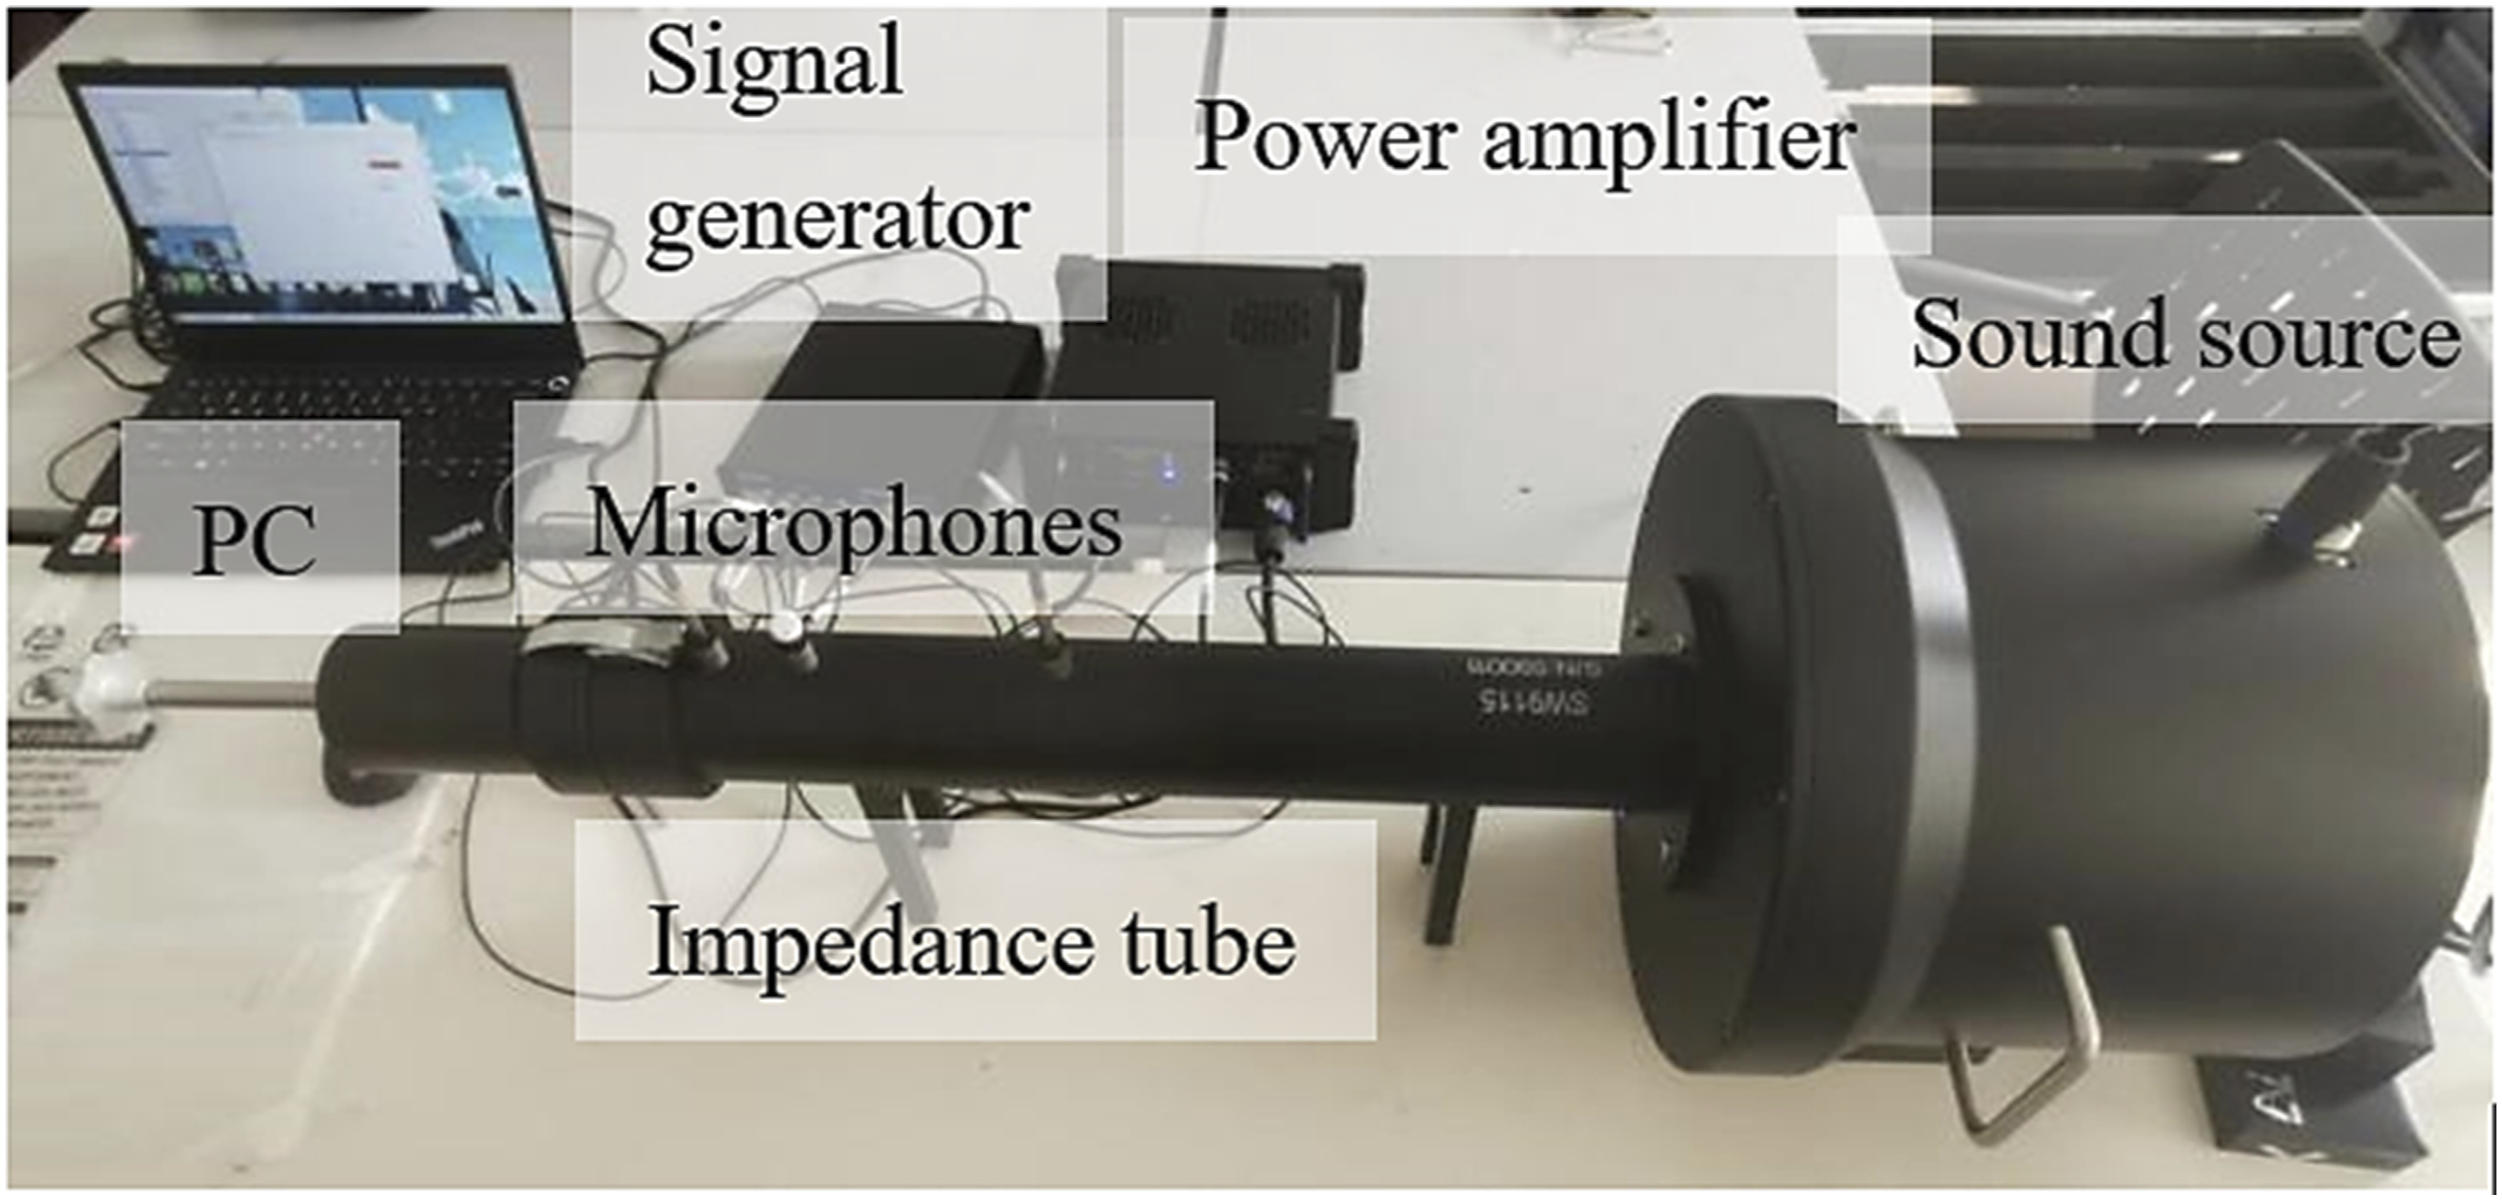
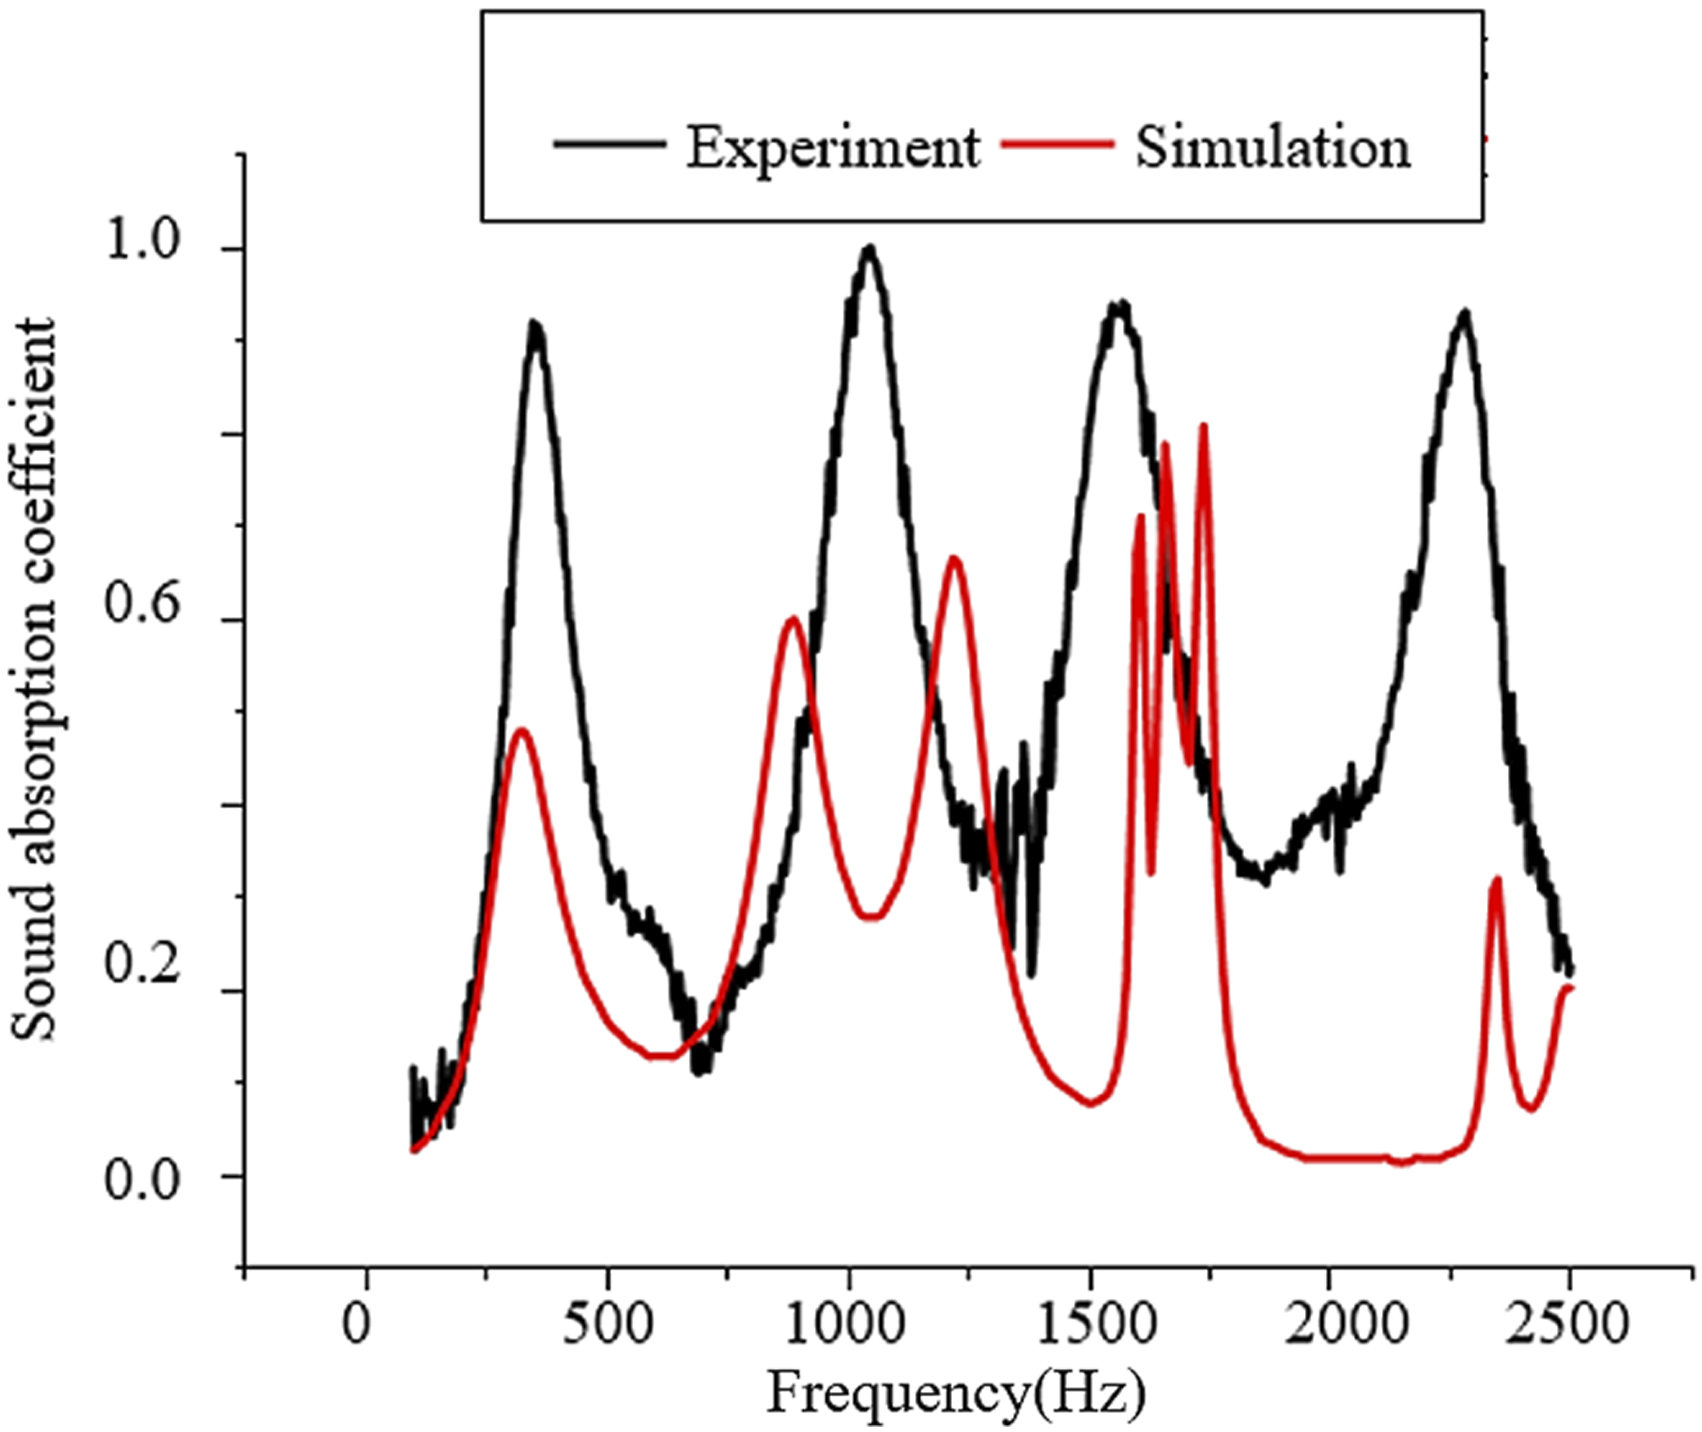
Through the comparison of numerical simulation and experimental results, it can be seen that from 700 Hz to 1500 Hz, the peak frequency of sound absorption coefficient between simulation and experiment will shift with the increase of frequency. Because the 3D printed material is not absolutely smooth and friction occurs during the transmission of sound waves, which may enhance the sound absorption effect. This allows multiple formants to be connected, presenting a smooth absorption coefficient curve. The amplitude difference between simulation and experiment results is certain in the range of 100–2500 Hz. Since the narrowest air passage is only 1.5 mm, a large number of sound waves are reflected without entering the material.
Experimental sound insulation performance verification
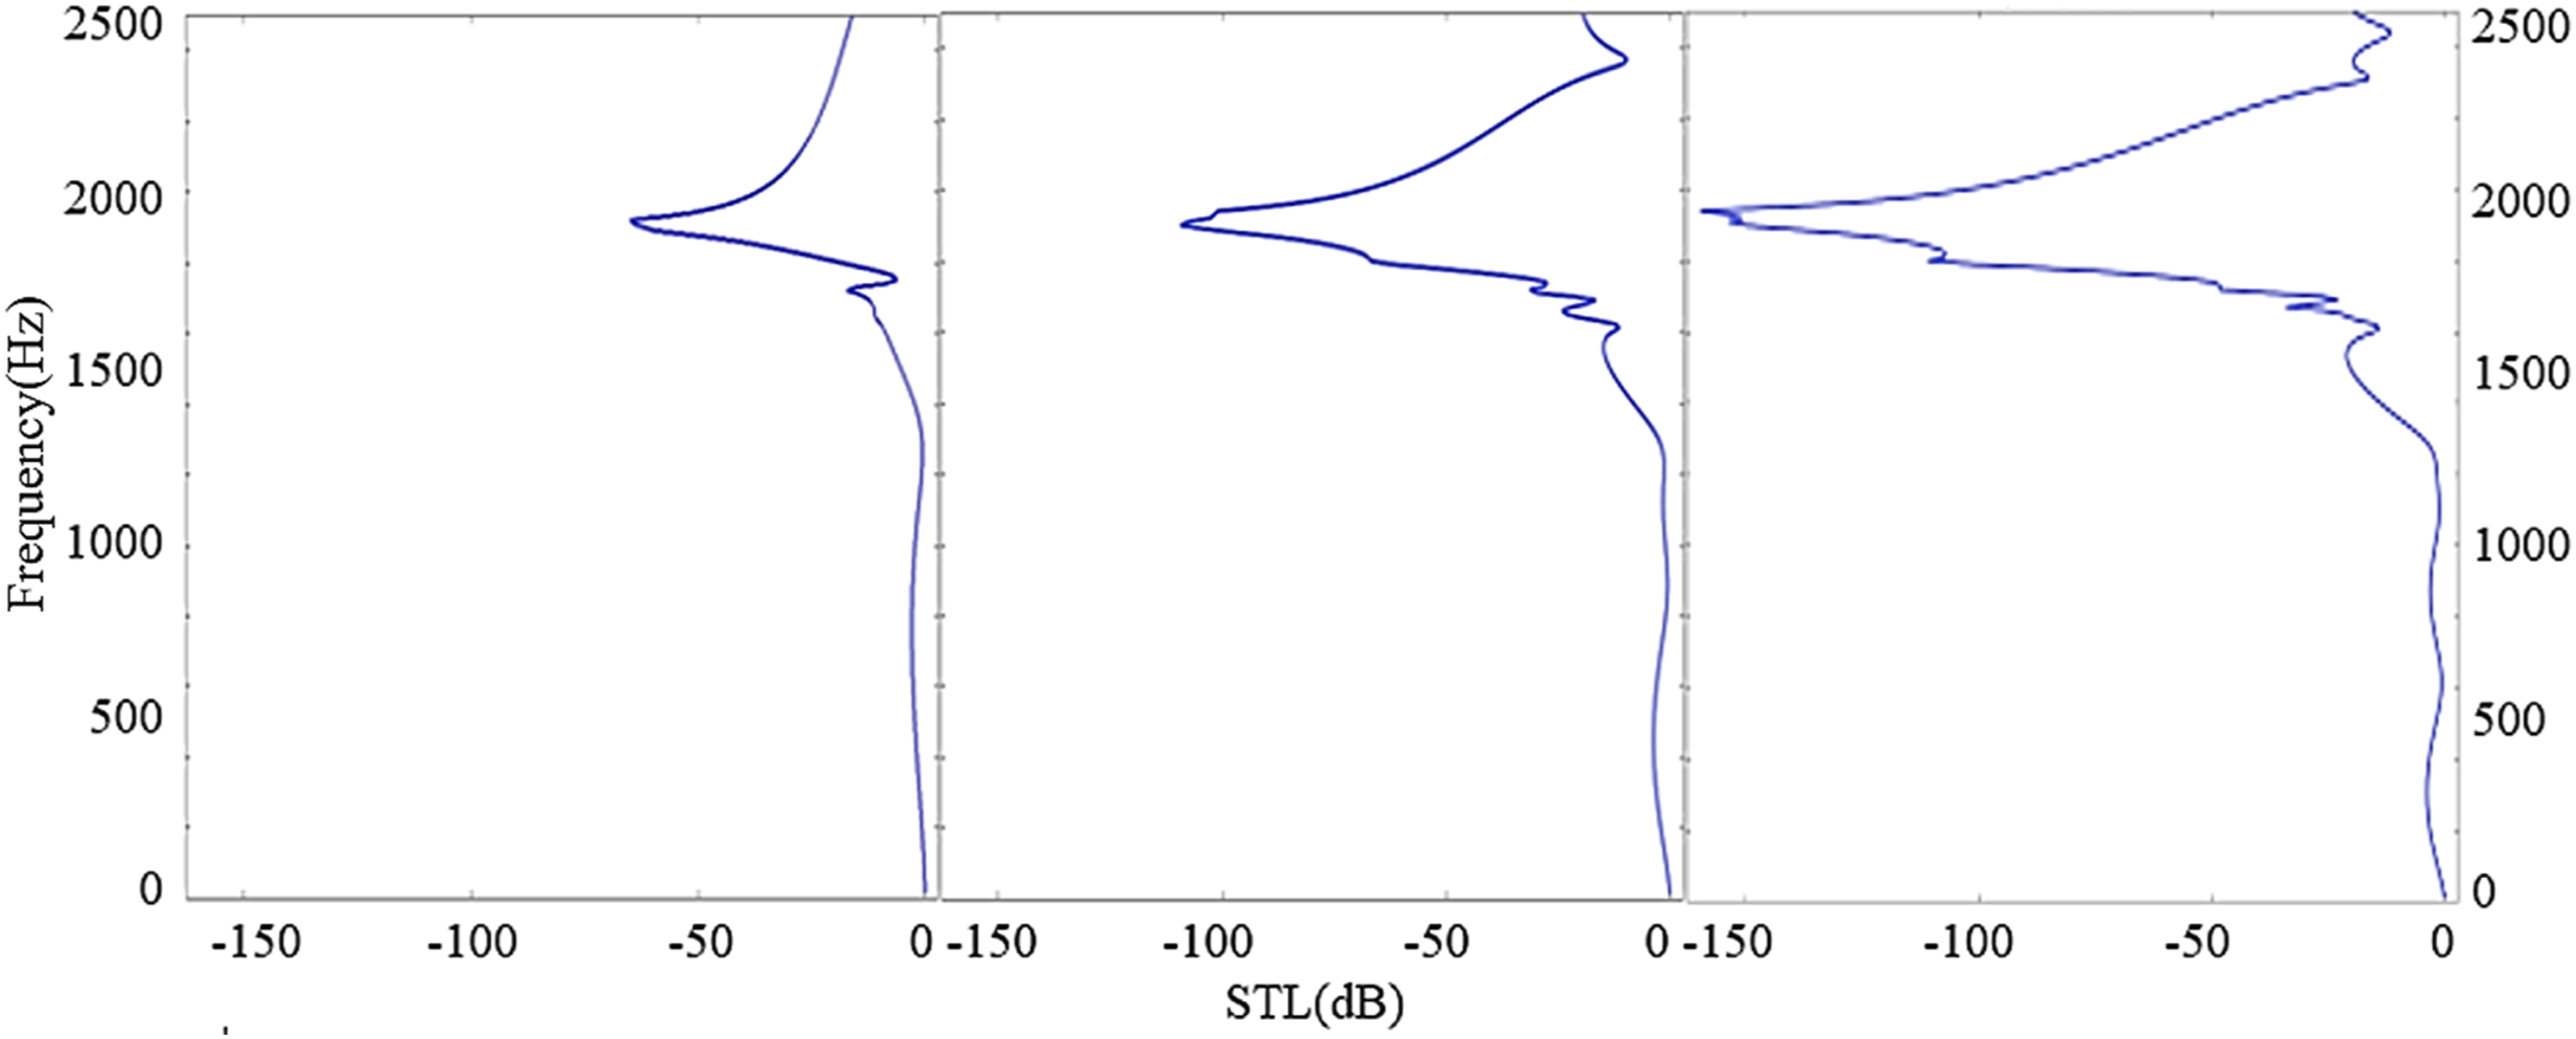
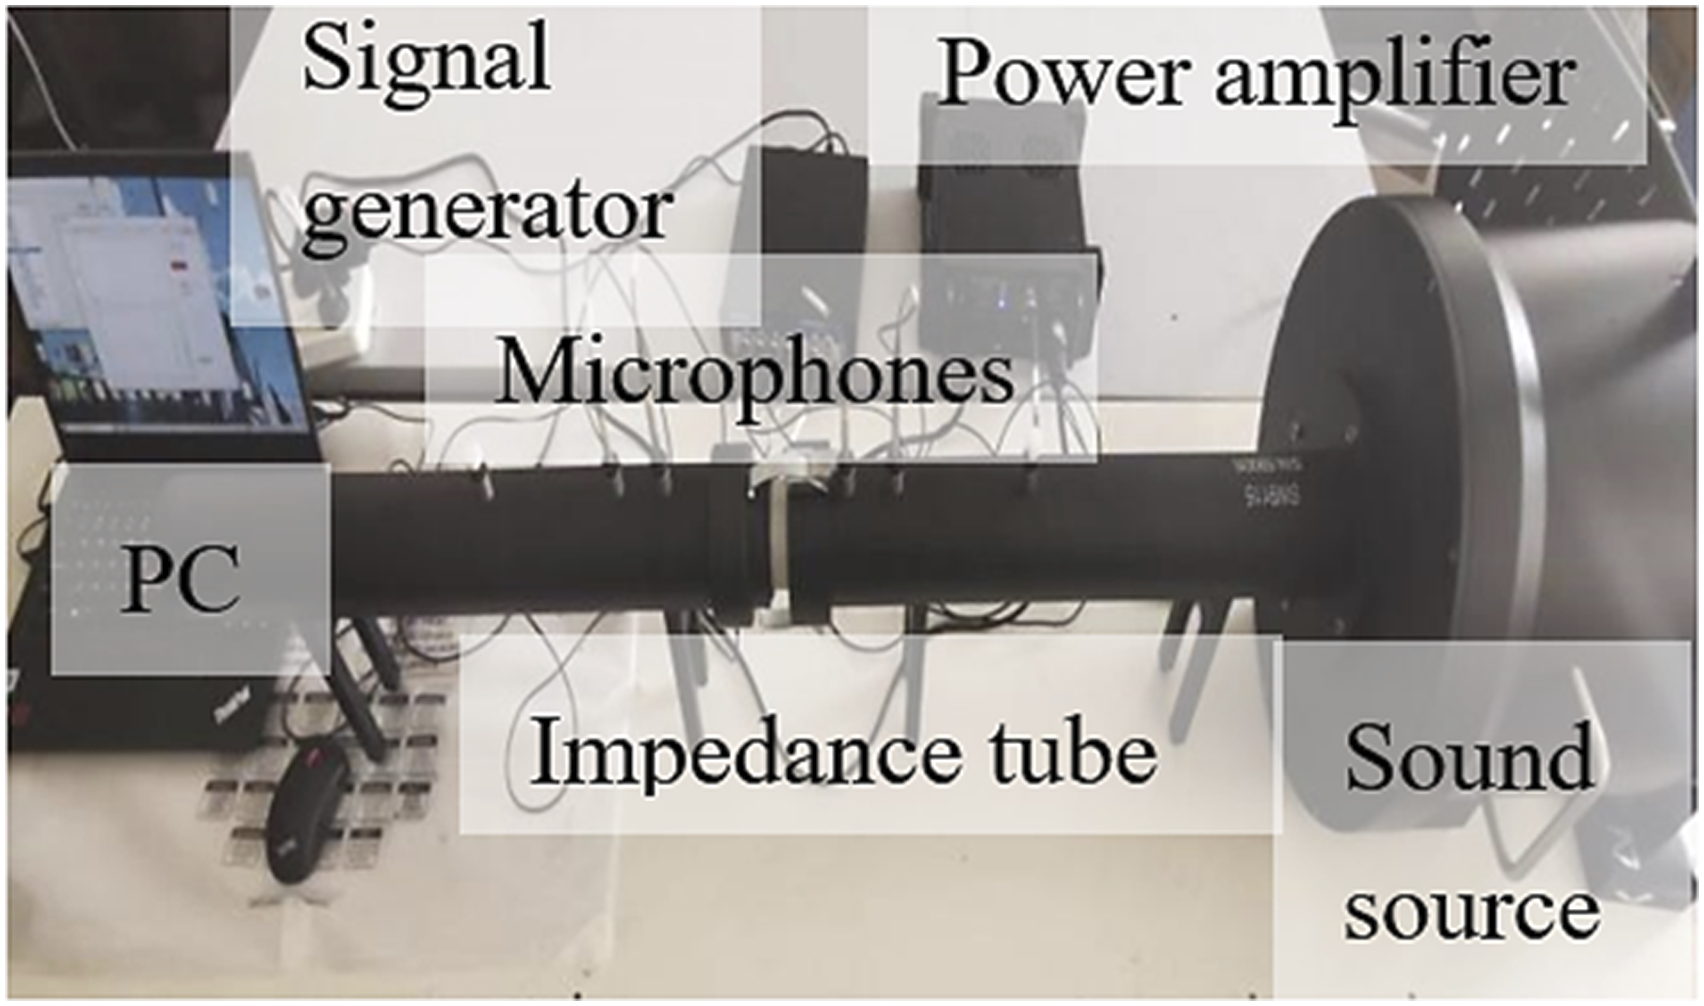
The overall setup of the experiment is shown in Figures 18 and 19. The sample is placed in a standing wave tube during the test, where a signal generator feeds the sound signal through a power amplifier into a built-in speaker. Four microphones (BSWA, MPA416) at both ends of the specimen are used to detect sound pressure signals. Finally, the sound pressure signal is input into the computer through the digital signal collector for signal processing and the f-STL curve of the test sample is obtained. Figures 20–23 shows the STL comparison between simulation and experimental results. Sound insulation experimental device. Specimen exposed 40 mm acoustic insulation experimental device. STL comparison between simulation and experimental results (standard). STL comparison between simulation and experimental results (naked). STL comparison between simulation and experimental results (thermal viscosity standard). STL comparison between simulation and experimental results (thermal adhesive exposure).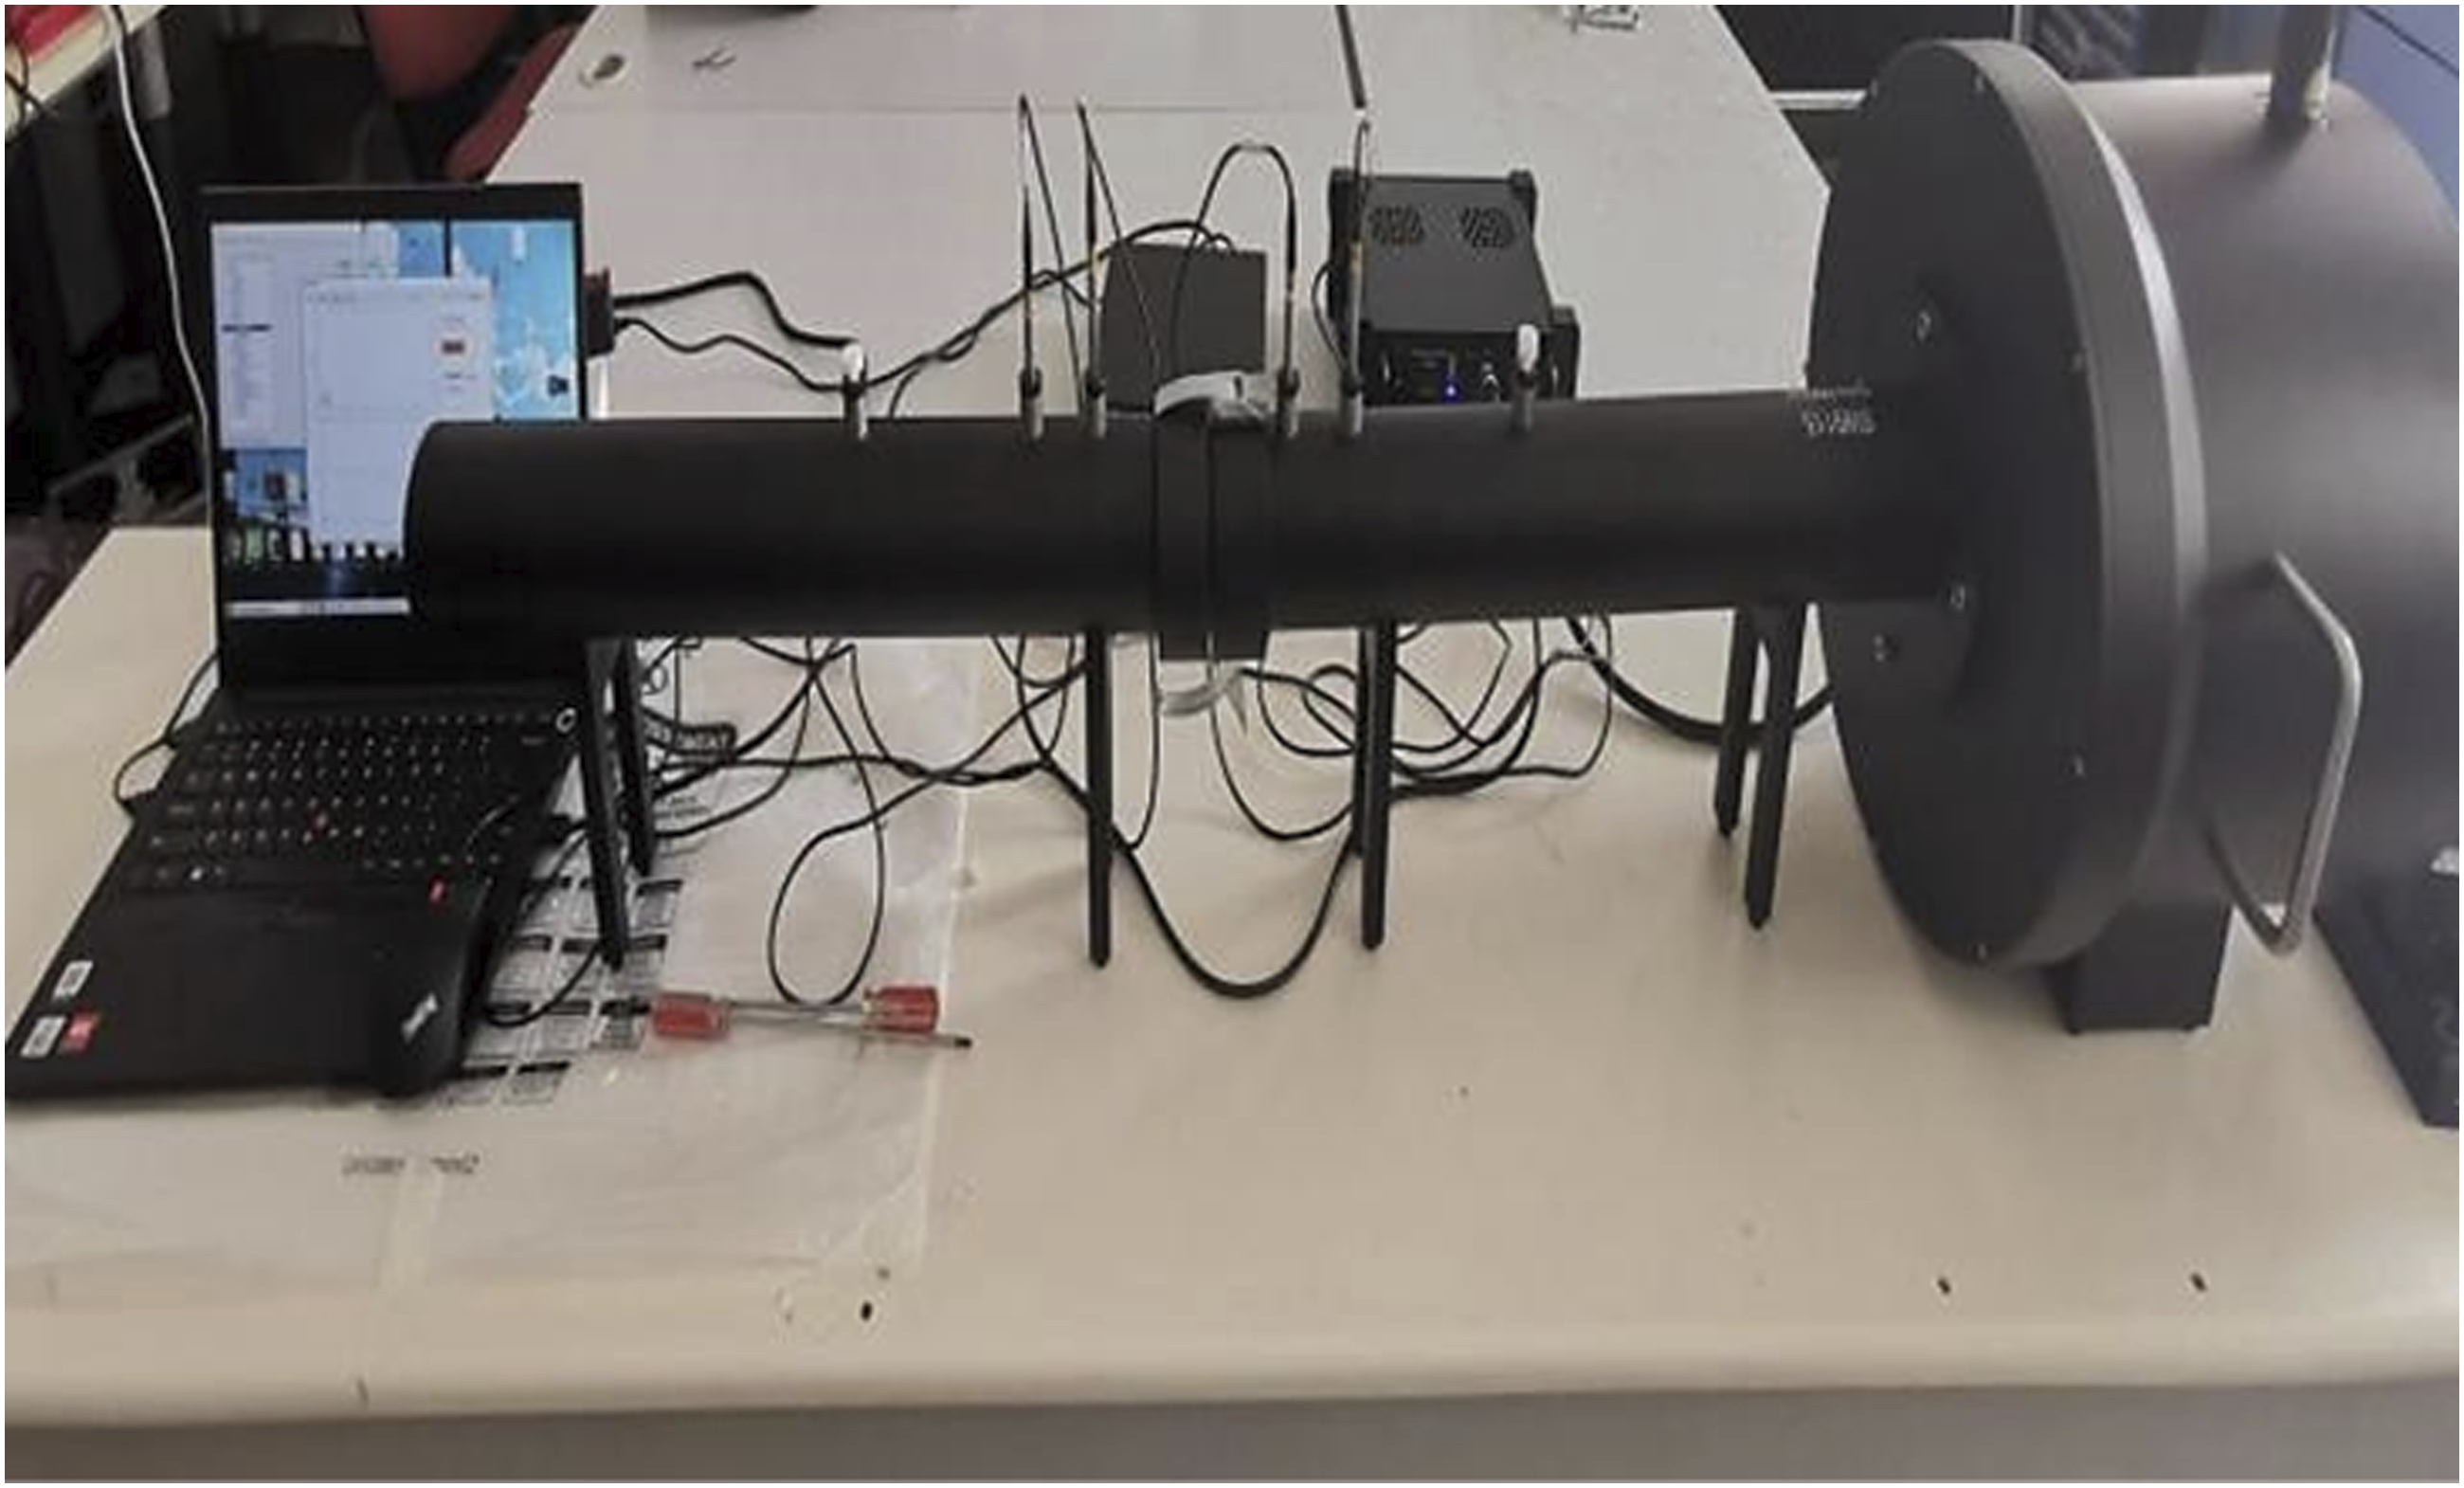
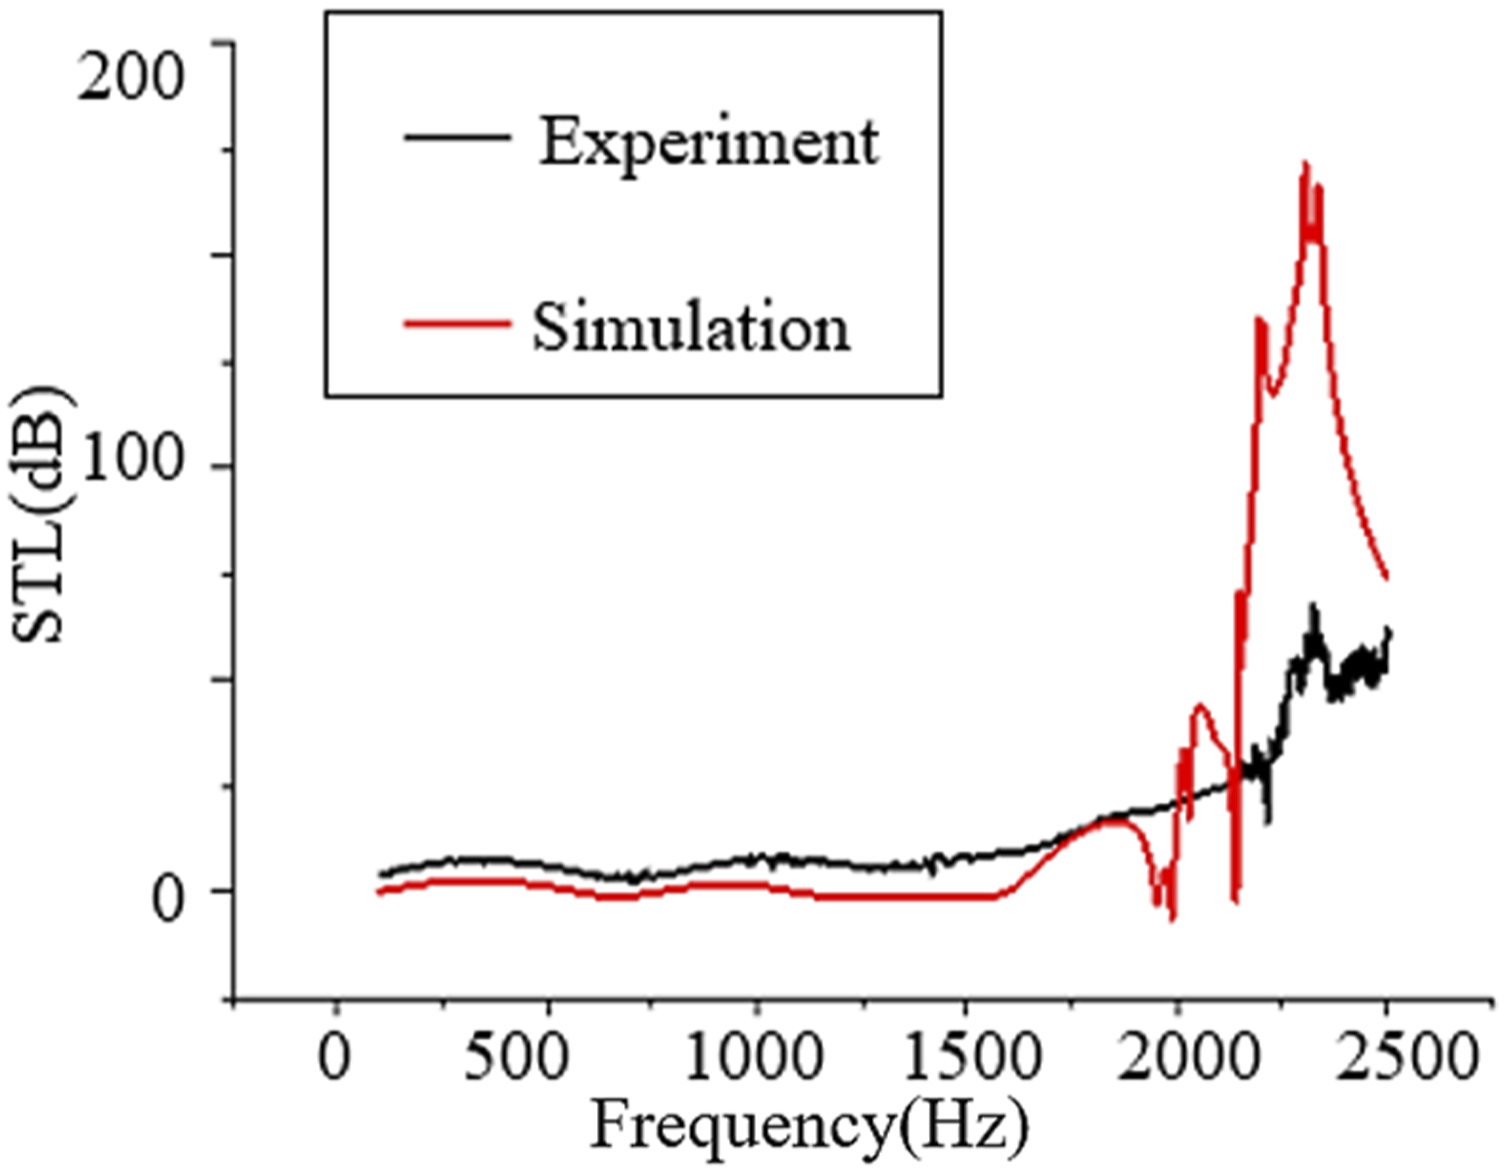
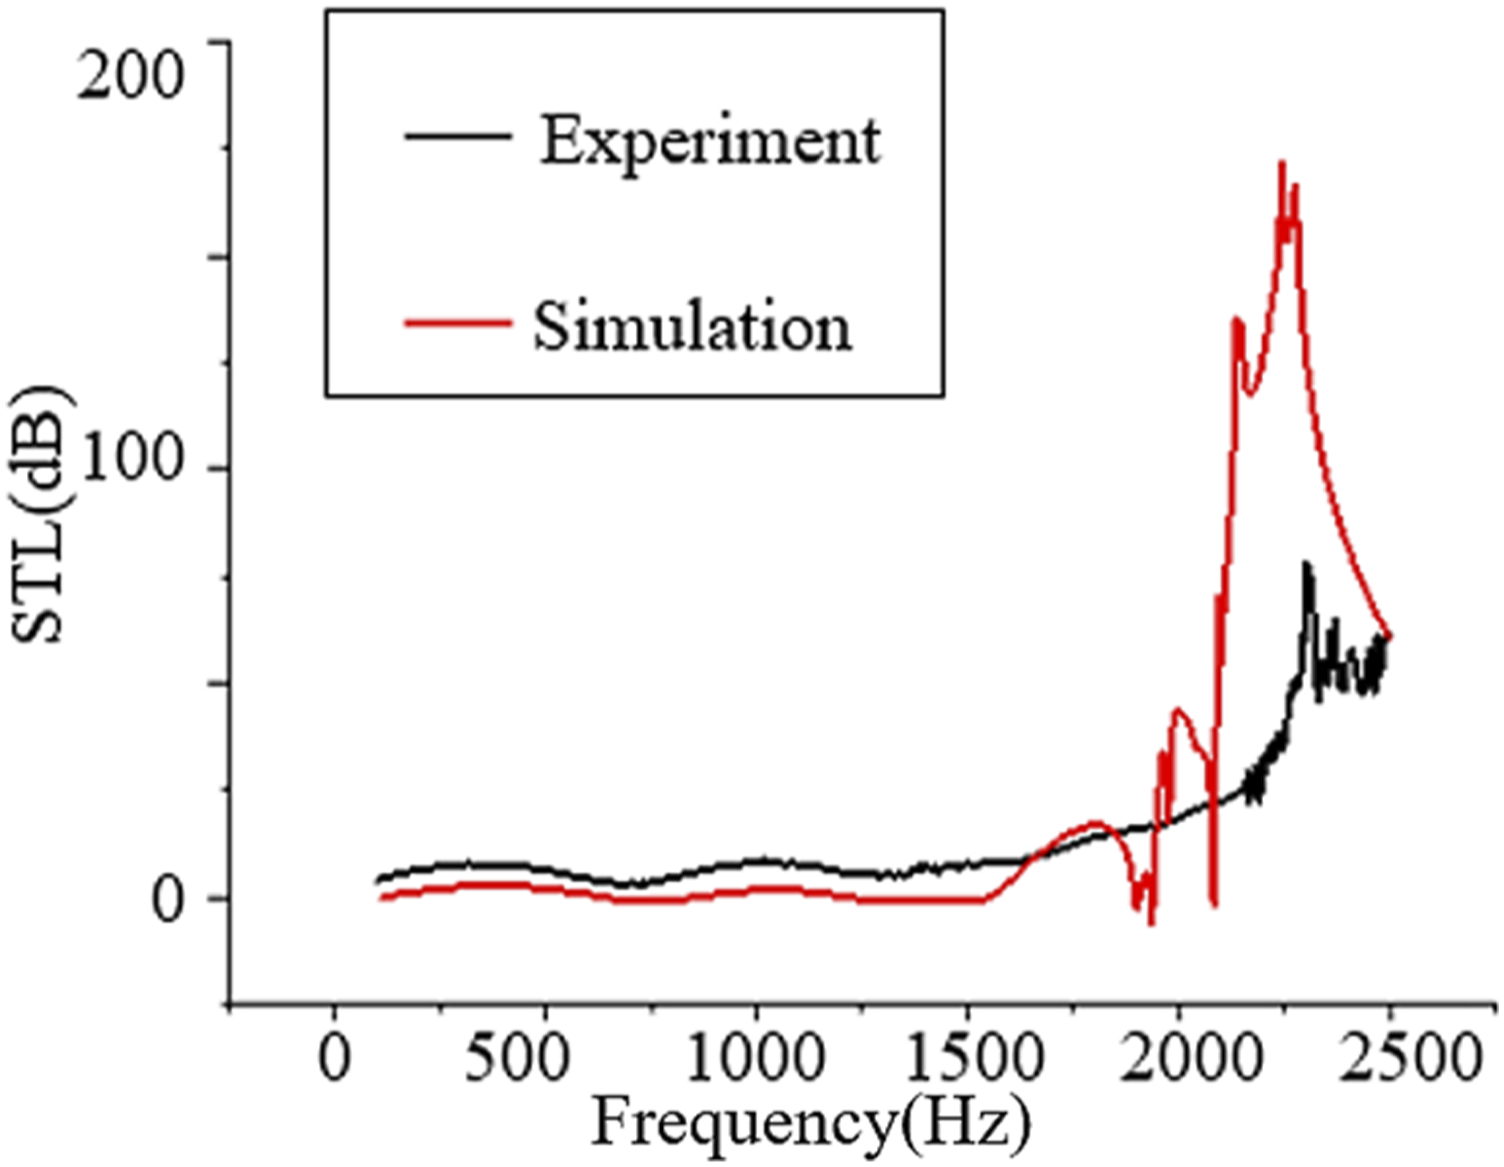
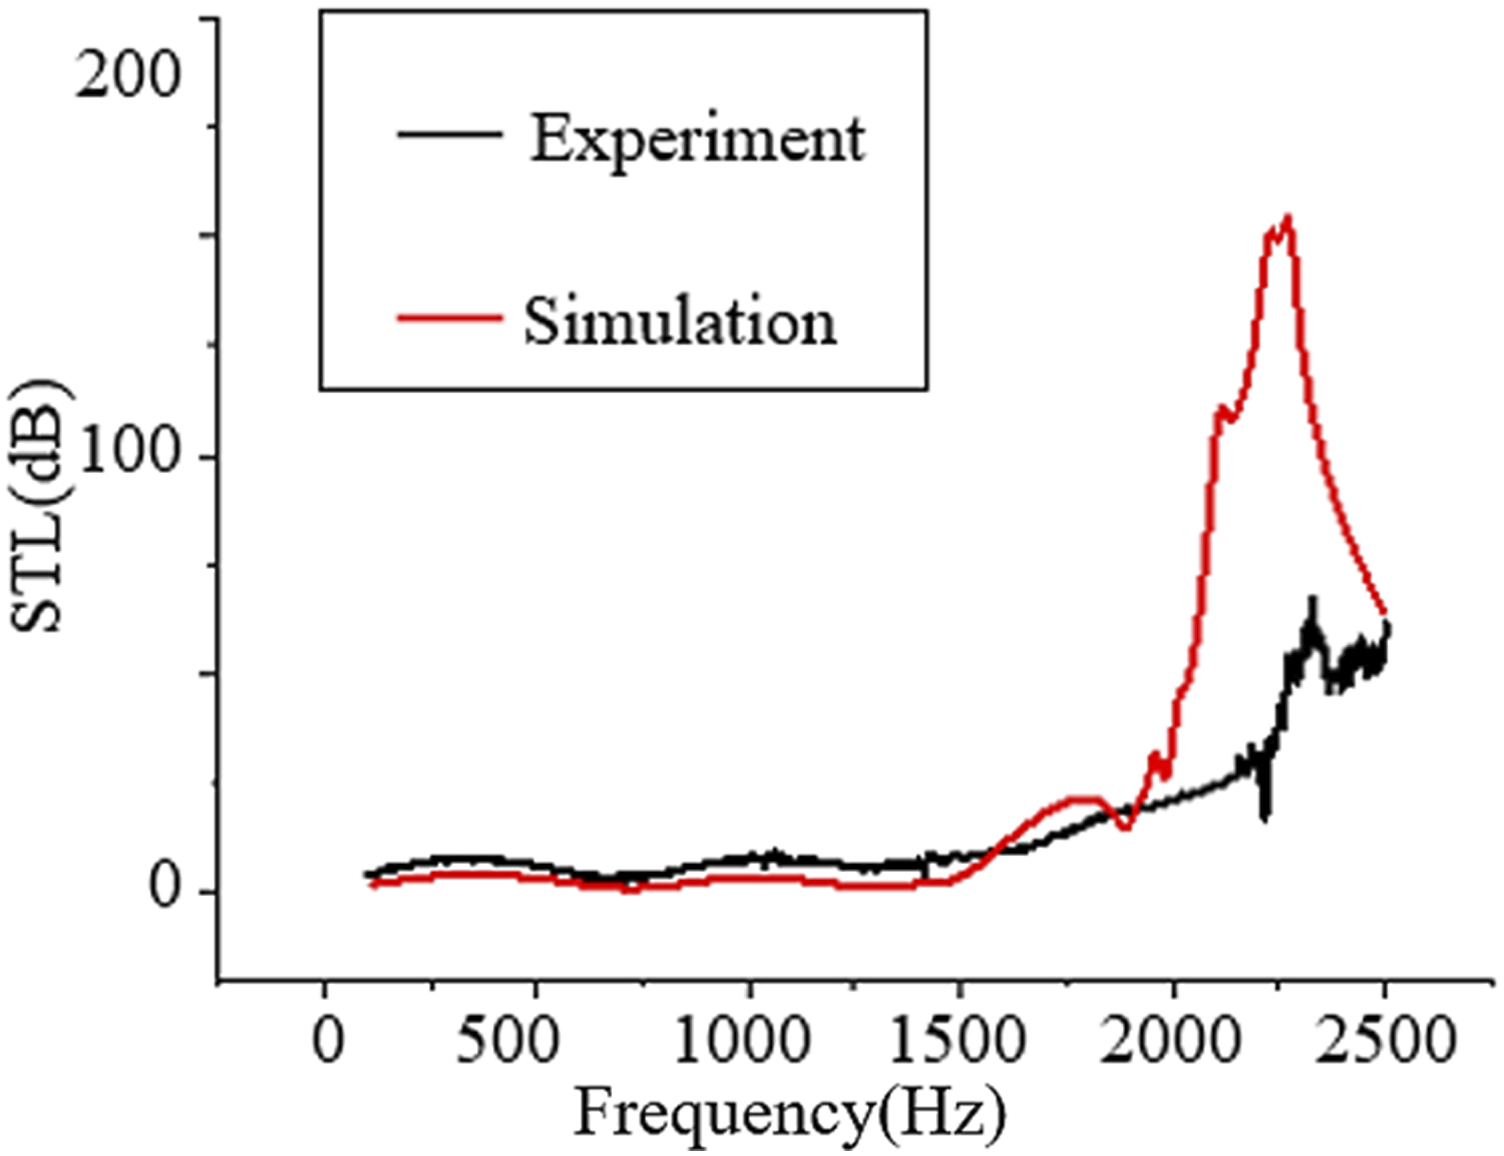
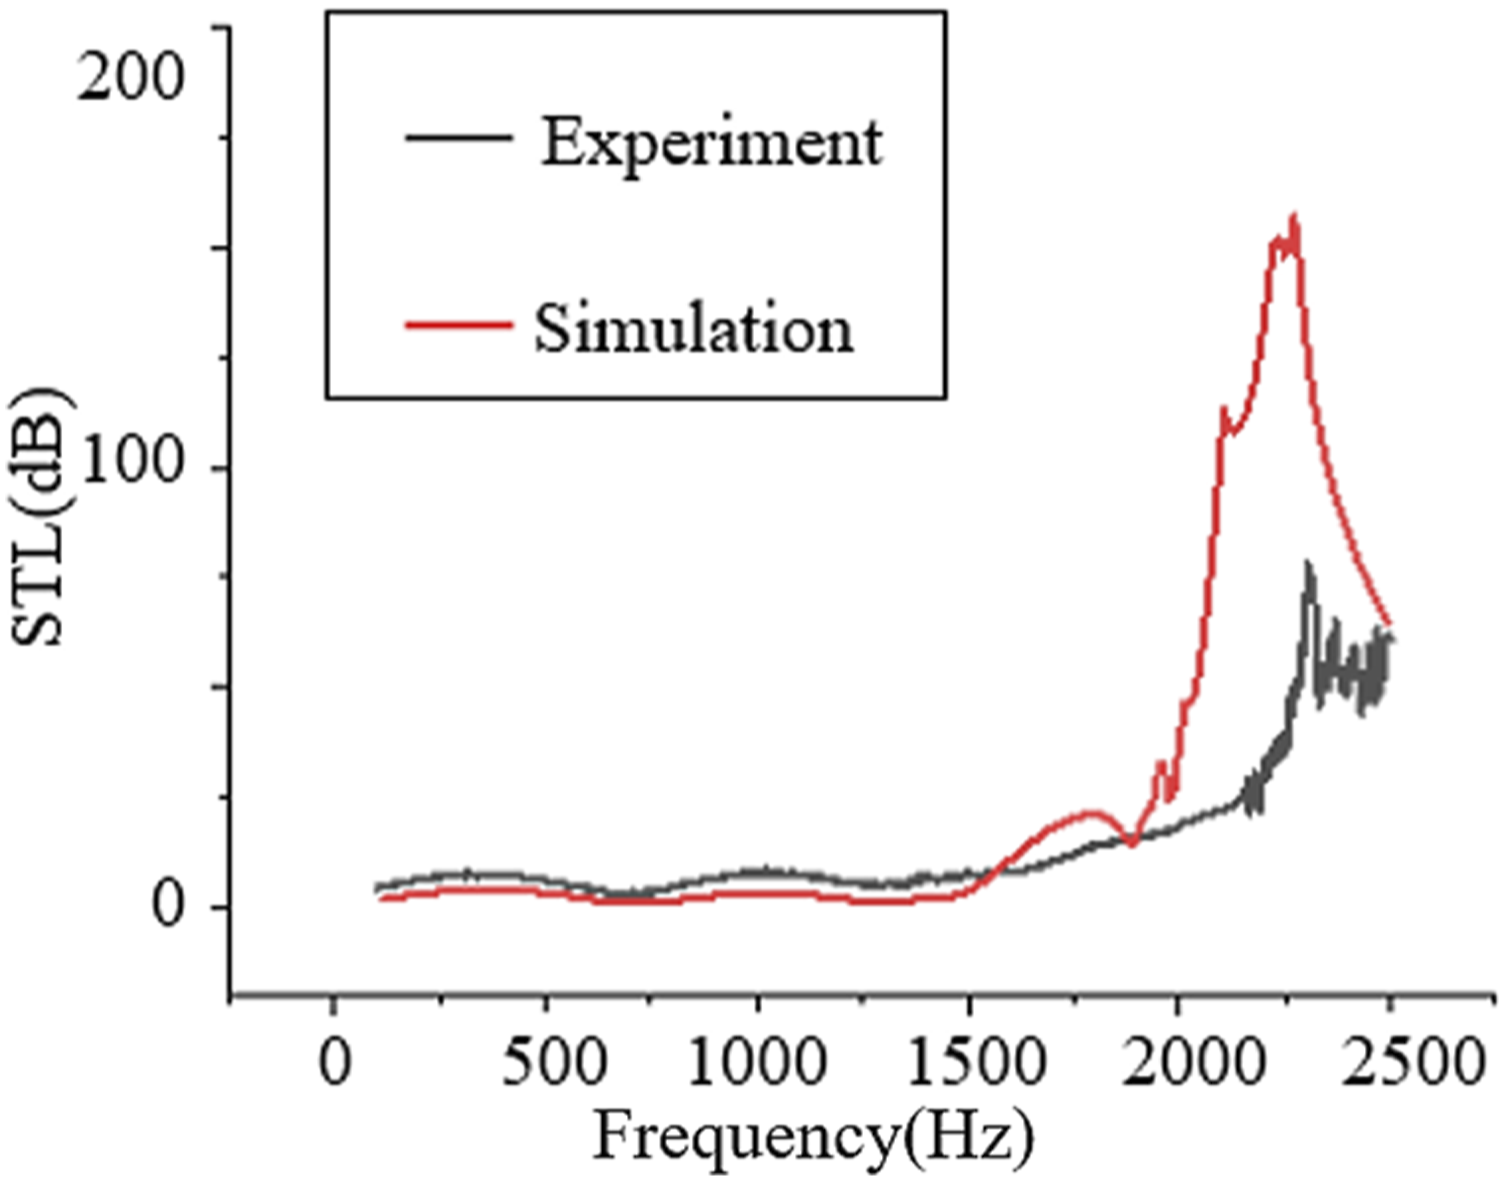
As can be seen from Figure 20, when the sound source excitation of 1 Pa is applied, the sound insulation quantity is −70.03 dB at 2318 Hz in standard experiment. And the sound insulation effect is above 40 dB at the frequency band of 2200–2480 Hz, which is excellent. As can be seen from Figure 21, the sound insulation quantity is −81.48 dB at 2304 Hz during the naked experiment. And the sound insulation effect is above 40 dB at the frequency band of 2300–2480 Hz, indicating that the exposed cavity will increase the peak value of sound insulation quantity. This is because the test data is more accurate when the minimum distance between the microphone and the material surface is half of the pipe diameter during the standing wave tube experiment. But it has no significant effect on the band gap frequency range. Figures 22 and 23 show the comparison between simulation results and experiments when the influence of thermal viscosity is considered.
Two sets of experiments prove that the band gap obtained by spiral acoustic metamaterials is real. There are differences in the amplitude of sound transmission loss between the experimental and numerical results. But it can be seen that the frequency band of sound transmission loss in the numerical and experimental sound insulation performance tests is basically consistent with the band gap range predicted by the numerical analysis. The main source of amplitude error between 100 and 1500 Hz is the omission of material damping in the numerical simulation. This reduces the vibration energy, resulting in a smaller peak in the experimental result curve.
Calculation of tensile strength
The finite element software Patran is used to simulate the strength of the sample material.
The material parameters are E = 2.6 GPa, v = 0.4, ρ = 1310 kg/m3. The tensile strength of the material is 52.3 MPa. Since the stress of the base plate is much greater than the stress of the spiral column, the strength of the single spiral column is calculated by removing the base plate. The spiral column applies a fixed constraint at one end and a tension at the other end. Figure 24 shows the stress and displacement diagram. The stress and displacement diagram.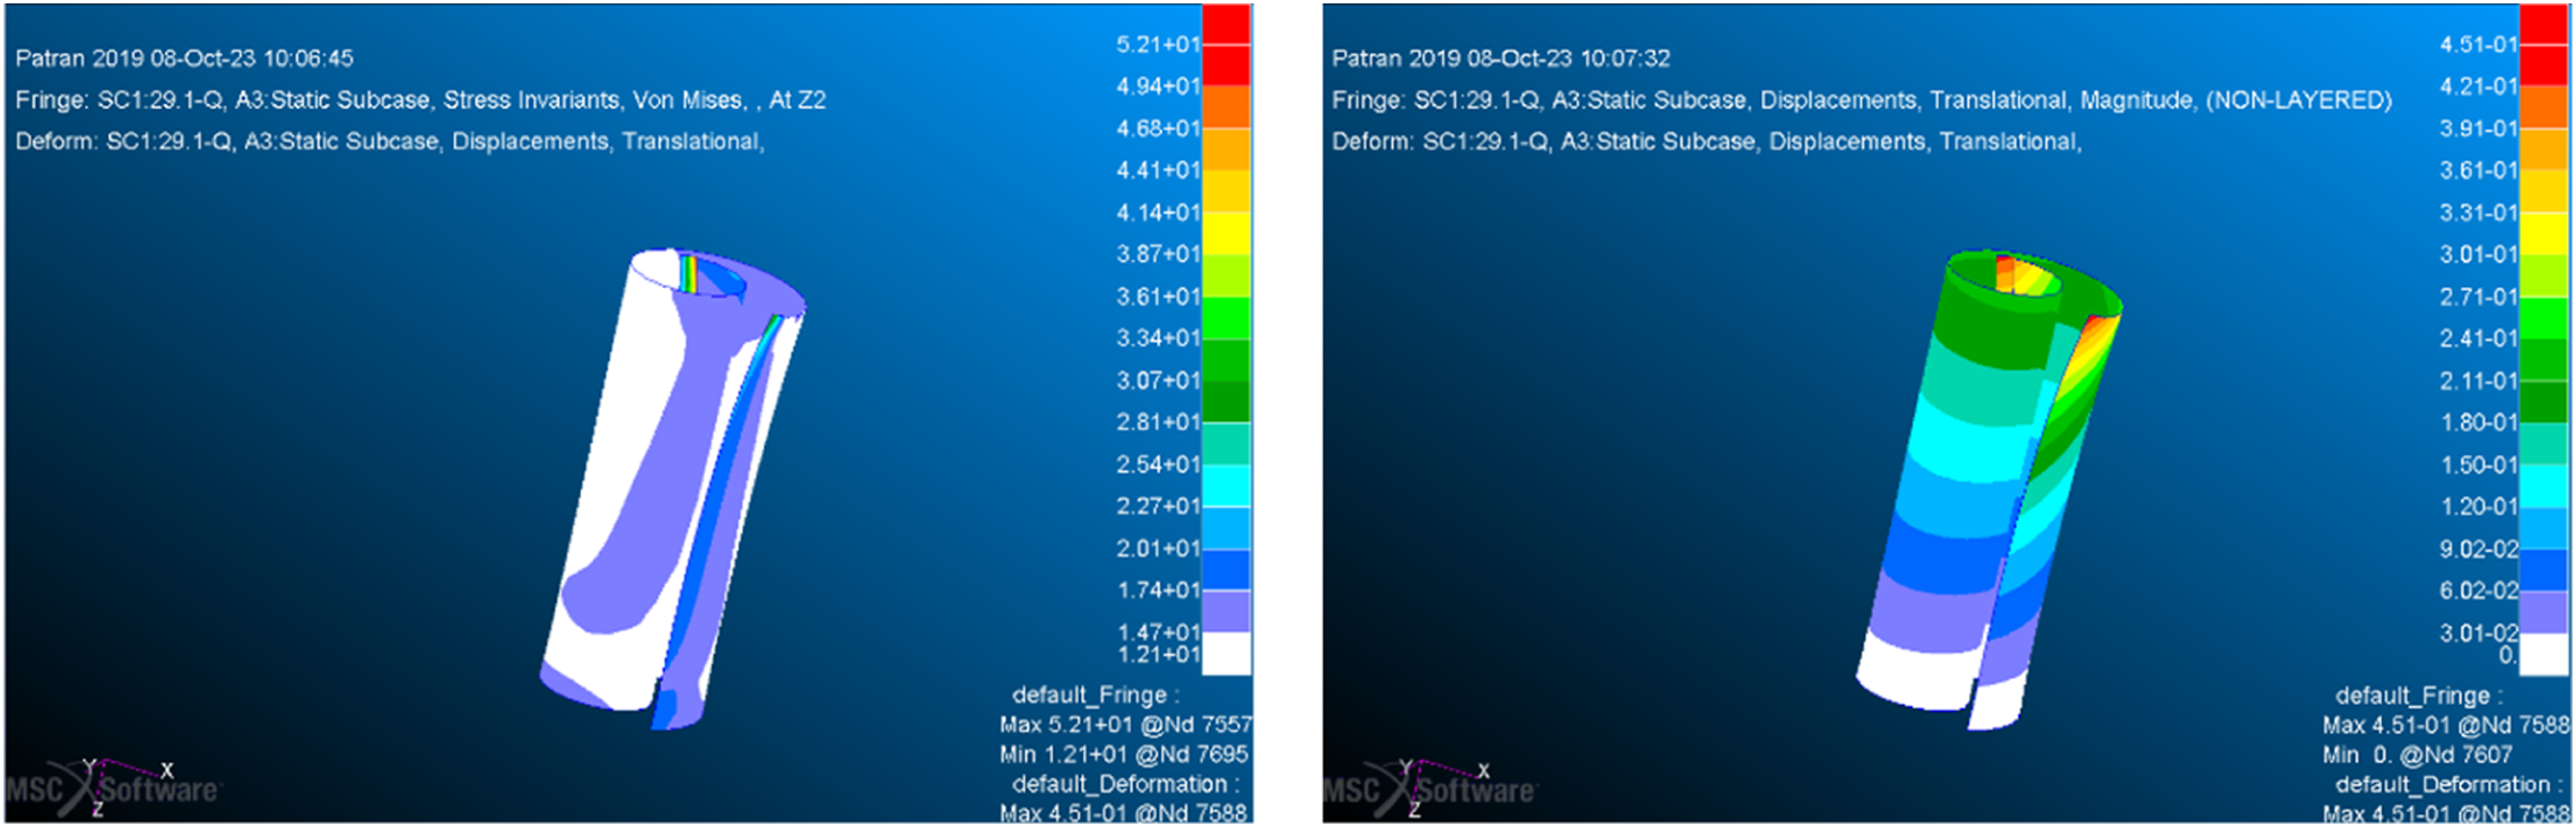
It can be seen from the diagram that the maximum stress is 52.1 MPa when the tension is 29.1 N, which is approximately the tensile strength of the material. The maximum displacement at this time is 0.451 mm.
Conclusion
In this paper, a spiral metamaterial with sound absorption and sound insulation is designed to reduce noise by utilizing the excellent performance of acoustic metamaterial in acoustic modulation. The broadband sound absorption and insulation capability of spiral metamaterial was systematically studied. After finite element simulation and experiment, the sound insulation effect of this configuration was above 40 dB at 2200–2480 Hz and the best sound insulation effect was 73 dB. There are multiple sound absorption peaks in the range of 100–2500 Hz frequency band. The experiment and simulation have a high matching degree and the sound absorption coefficient in multiple frequency bands exceeds 0.5. The spiral sound absorption and insulation metamaterial has good sound absorption and insulation effect, which can provide ideas for the control field of middle and low frequency sound waves.
Supplemental Material
Supplemental Material - Study on acoustic performance of new spiral sound absorbing and insulating metamaterial
Supplemental Material for Study on acoustic performance of new spiral sound absorbing and insulating metamaterial by Song Liu, Pan-pan Liu, Ren-jie Zhao, Jian-hua Lu, Kang Yang, Huayu Zhou and Yi-fan Du in Journal of Low Frequency Noise, Vibration and Active Control
Footnotes
Acknowledgments
The authors would like to thank Associate Professor Wenjiong Chen for the experimental guidance that was of great benefit to this work.
Declaration of conflicting interests
The author(s) declared no potential conflicts of interest with respect to the research, authorship, and/or publication of this article.
Funding
The author(s) disclosed receipt of the following financial support for the research, authorship, and/or publication of this article: This work was supported by Project of the National Natural Science Foundation of China: Research on the Separation and Identification of Multi target Noise Sources in Complex Sound Fields Based on Phase Conjugation Method (No. 51609037); Basic Research Business Fee Project of Dalian University of Technology: Research on Location and Imaging of Ship Radiated Noise Sources in Complex Marine Environment (No.: DUT22GF206);National research projects: Study on the Characteristics of Sonar Self Noise Field in Multipath Propagation of Mechanical Sound Sources.
Supplemental Material
Supplemental material for this article is available online.
References
Supplementary Material
Please find the following supplemental material available below.
For Open Access articles published under a Creative Commons License, all supplemental material carries the same license as the article it is associated with.
For non-Open Access articles published, all supplemental material carries a non-exclusive license, and permission requests for re-use of supplemental material or any part of supplemental material shall be sent directly to the copyright owner as specified in the copyright notice associated with the article.