
Abstract
The prominent vibration characteristics of amorphous alloy transformer (AMT) make it possible to apply the vibration method for real-time fault monitoring of AMT. Therefore, in order to solve the AMT vibration monitoring problem and enhance the diagnostic efficiency, this study proposes an AMT fault diagnosis model based on particle swarm optimization (PSO) to optimize the parameters of wavelet packet transform (WPT) and support vector machine (SVM).The optimal vibration signal acquisition point is determined by finite element analysis to ensure high signal quality. The PSO algorithm is used to optimize the number of WPT decomposition layers, wavelet basis functions, SVM kernel parameters g and penalty parameters c to enhance the accuracy of feature extraction and classification. Additionally, principal component analysis (PCA) reduces the dimensionality of the redundant frequency band energy after WPT feature extraction, minimizing data redundancy. Overall, the full-process optimization significantly improves AMT fault diagnosis efficiency compared with single-aspect optimization.
Keywords
Introduction
Transformer is an essential component in the process of power transmission. With the continuous advancement of technology, to accommodate the requirements of green development, the power grid has been vigorously promoting new types of transformers based on amorphous alloy transformers in recent years. Amorphous alloy transformers possess advantages such as low no-load loss and high operational efficiency. In comparison with silicon steel transformers, their no-load loss is one fourth of that of silicon steel transformers, and their no-load current is one fifth of that of silicon steel transformers. This leads to amorphous alloy transformers gradually substituting the original silicon steel transformers distributed at the power receiving end of users and approaching residential living areas. Hence, how to conduct real-time and rapid diagnoses of this new type of amorphous alloy transformers effectively holds significant importance for guaranteeing the power usage safety of the residents.
There are many existing transformer status detection methods, such as short-circuit impedance method,1,2 dielectric response method,3,4 frequency response analysis method,5,6 oil chromatography analysis method,7,8 etc. The first three methods need to be run offline, and the latter has low recognition of mechanical structure faults. Therefore, some scholars have proposed to analyze the operating status of the transformer through vibration signals. The principle of this method is to collect the vibration signal of the overall mechanical structure of the transformer through sensors to realize real-time monitoring of the mechanical structure and the electrical status of the transformer. It indicates that this method can be widely used in various types of transformers with a fault monitoring accuracy of up to 90%9,10 and it has a good recognition of mechanical faults.
At present, fault identification based on transformer vibration signals mainly consists of three steps: signal decomposition, feature extraction, and pattern recognition. In terms of feature signal extraction, Xiang Li et al. 11 proposed a cross-modal feature alignment method and combined it with a deep adversarial neural network to realize fault diagnosis knowledge transfer. Kezhan et al 12 used sine cosine optimization algorithm to optimize VMD parameters and improved the recognition rate of transformer vibration signals. Xin Zhang et al 13 proposed a multi model fusion transformer diagnosis method based on TimesNet and Informer, which combines the local features of convolution and the global correlation of attention mechanism modules for feature aggregation, enabling the model to obtain more time series information. Haikun Shang 14 incorporated the approximate entropy (ApEn) of symplectic geometric mode decomposition (SGMD) into an optimized bidirectional long short-term memory (BILSTM) neural network to effectively extract the main features of partial discharge (PD), and compared it with FFT, EMD, and VMD, demonstrating the superiority of this method. For signal decomposition methods, parameter extraction often relies on empirical settings, which can reduce the signal’s representational ability and result in random decomposition effects.
Fault diagnosis is based on feature differences. 15 Based on feature extraction, classification algorithms are used to classify and predict data. Wei Zhang et al 16 proposed a Swin Transformer-based lithium-ion battery SOC prediction method, which uses the Swin Transformer network to process the learned features to achieve accurate prediction of the SOC of lithium-ion batteries. Huimin Zhao et al17,18 proposed an image recognition model based on Shuffle Net-CA-SSD to improve the early defect detection capability of turbine blades. On the other hand, they developed the SGNSGA-DFBLS method using multi-objective evolutionary algorithms to enhance prediction performance and improve the quality of search and resolution through adaptive mutation. Wenlong Liao et al 19 developed a GCN-based transformer fault diagnosis method that uses an adjacency matrix for sample similarity, graph convolutional layers for feature extraction, and optimized training to enhance diagnostic accuracy. In the past, fault diagnosis of transformers often only optimized one aspect of feature extraction or classification prediction, while ignoring that transformer fault diagnosis is a systematic problem.20–23
In summary, this article proposes an AMT fault diagnosis model based on PSO algorithm to optimize the entire WPT-SVM process. In the signal preprocessing stage, electromagnetic structural field coupling is adopted, and the maximum total deformation of AMT at 200 Hz is used as the basis for selecting measurement points to overcome the dependence of vibration method on feature signal selection. In the feature extraction stage, energy entropy is used as the fitness function, and PSO algorithm is used to optimize the wavelet parameters [N, Wname], thereby achieving adaptive selection of wavelet parameters for each signal. For the redundant frequency band energy after feature extraction, PCA is used to reduce the dimensionality and minimize the problem of inaccurate classification caused by complex data. Finally, in the classification prediction stage, with the highest accuracy as the optimization goal, SVM penalty parameters and kernel parameters are optimized to improve the diagnostic efficiency of the model.
AMT vibration signal acquisition and preprocessing analysis
AMT vibration test platform
The multi-channel amorphous alloy transformer vibration test platform is shown in Figure 1. The SCBH15-200/10 amorphous alloy transformer is used for vibration signal analysis and data collection. Voltage is applied to the winding of the amorphous alloy transformer through a three-phase voltage regulator, and the multimeter displays accurate readings. The piezoelectric acceleration sensor collects signals from the surface of the transformer clamp and transmits the vibration signals to the PC through the data acquisition card. AMT vibration signal testing platform.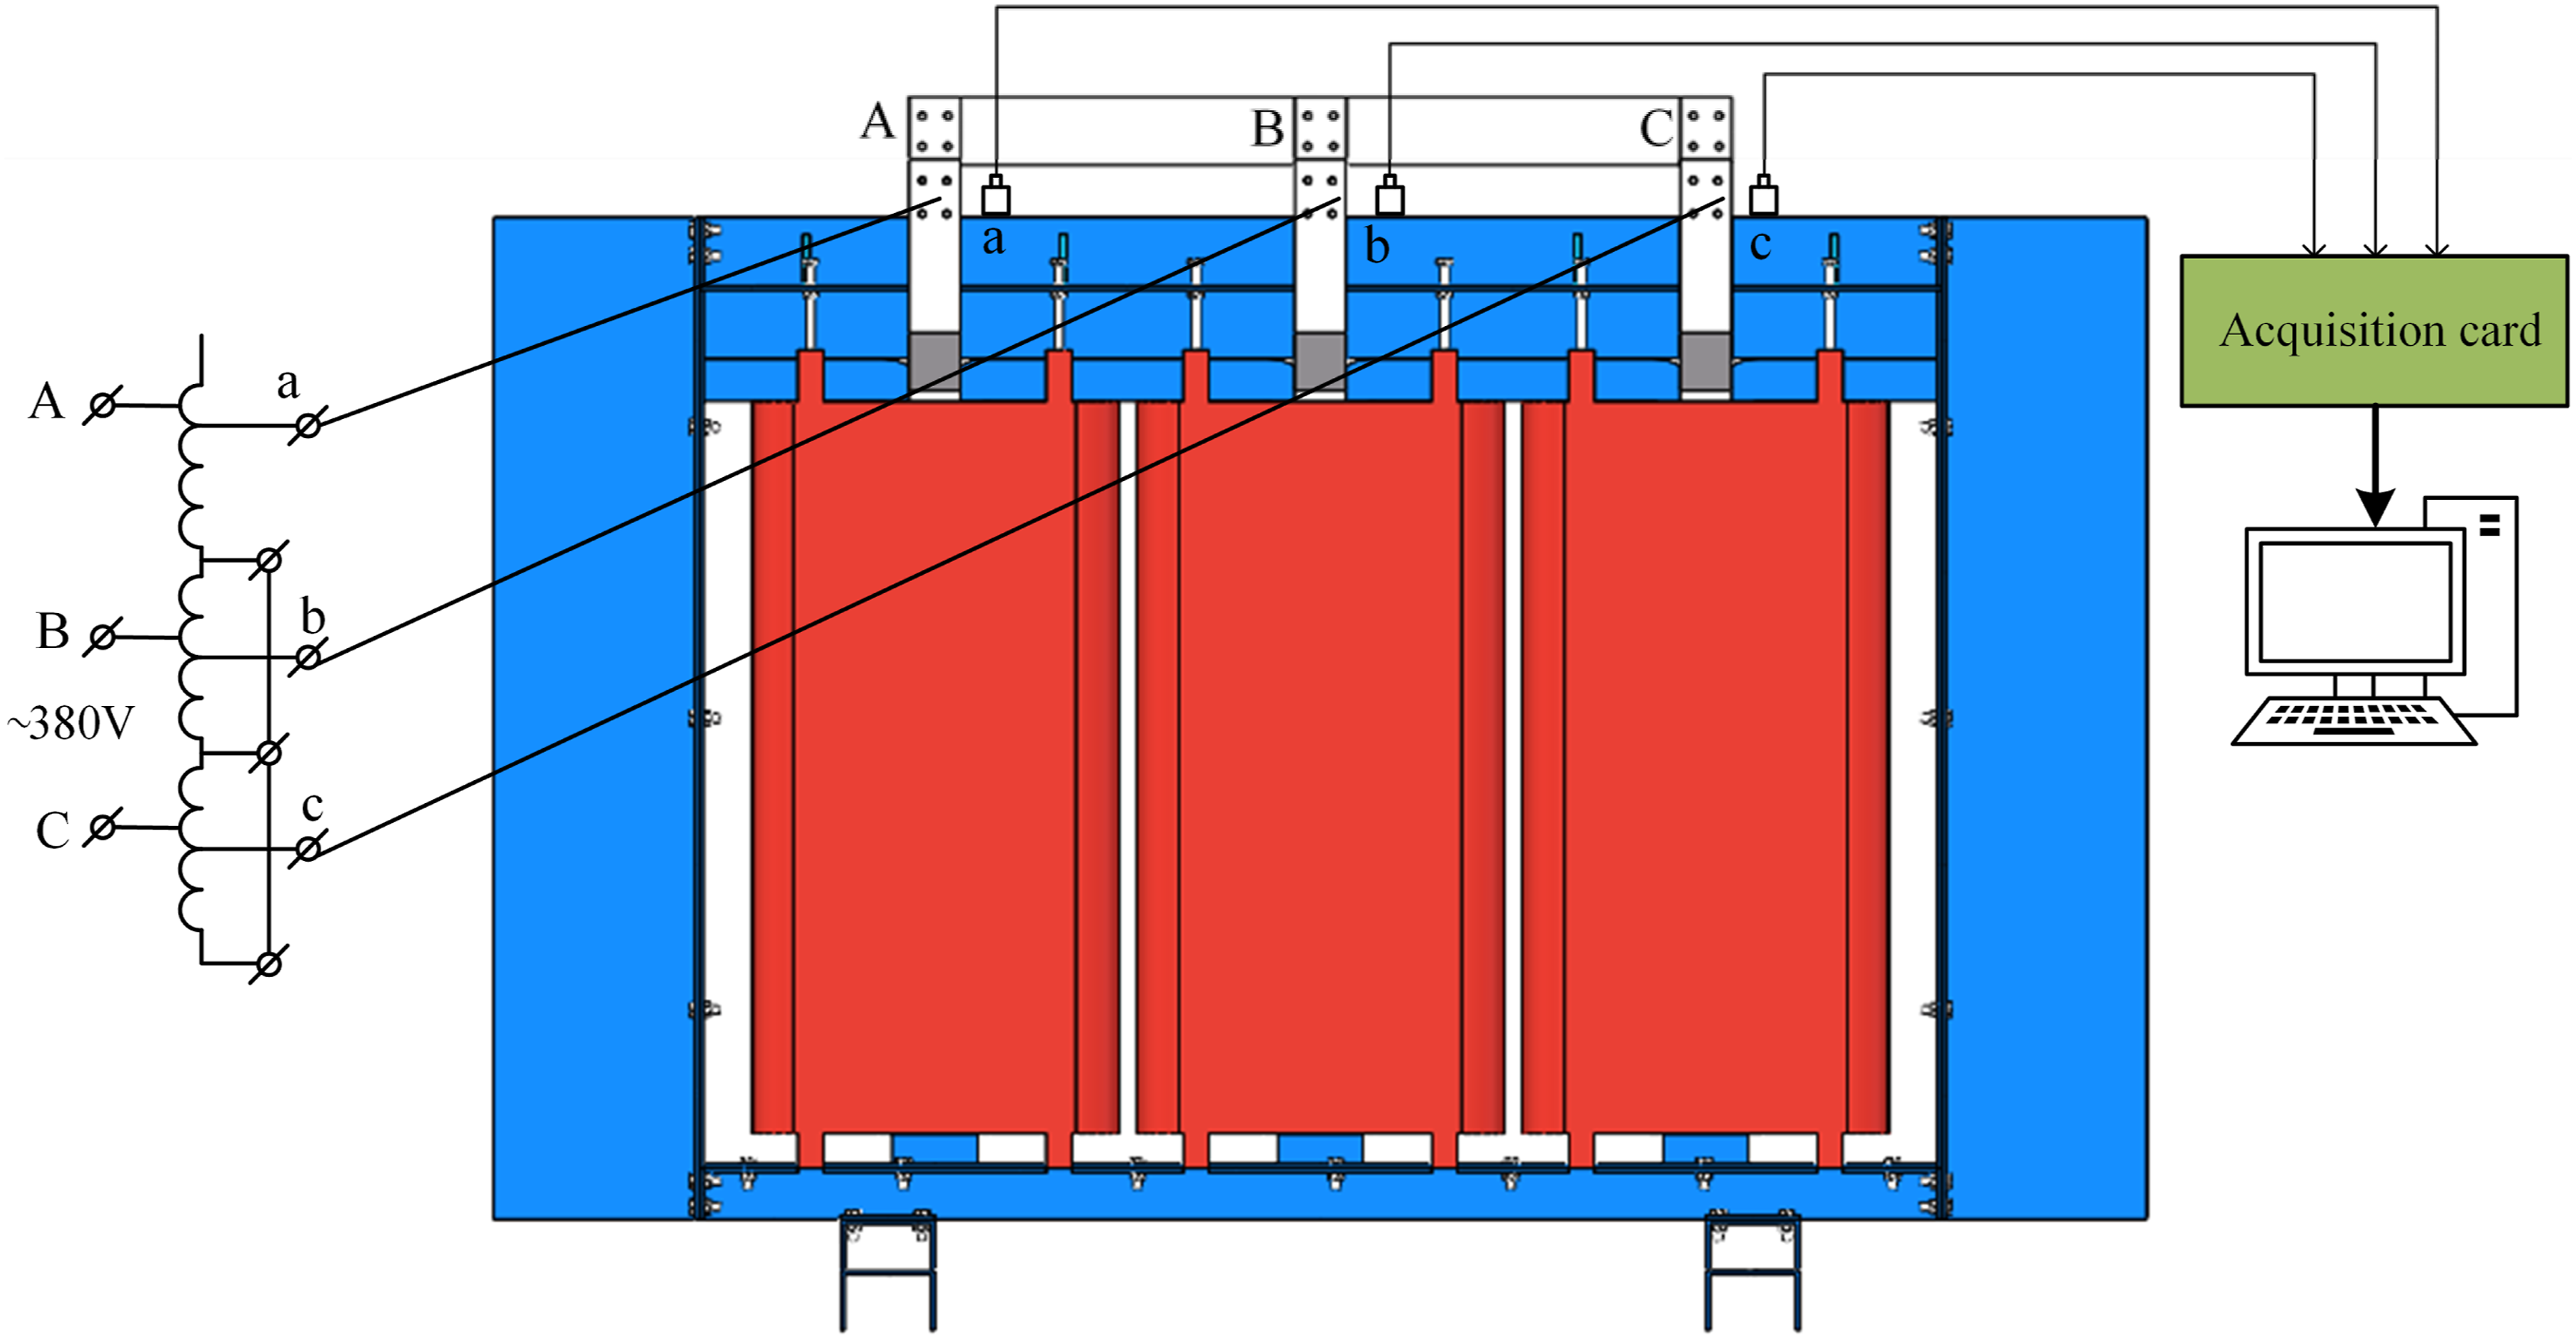
Main instruments and equipment for the experiment.
This experiment uses an amorphous alloy vibration test platform to simulate the vibration signals of the transformer under three kinds of fault conditions, no-load, short circuit, and core loosening. The sampling frequency is set to 64 kHz and the number of samples is 6400. The low-voltage side is loaded with 100% rated voltage for no-load testing, and the high-voltage side is loaded with 100% short-circuit current for short-circuit testing. In the real online monitoring scenario, the looseness of the core is set by adjusting the transformer clamps and fastening bolts to change the clamping force of the cores, and the loosening signal of the cores is measured during the no-load testing.
Selection of AMT measuring points
When selecting measurement points for transformer vibration signals, it is often difficult to find the position that best represents its vibration state.
Therefore, based on the conclusion that the maximum amplitude of the AMT core occurs at 200 Hz,
24
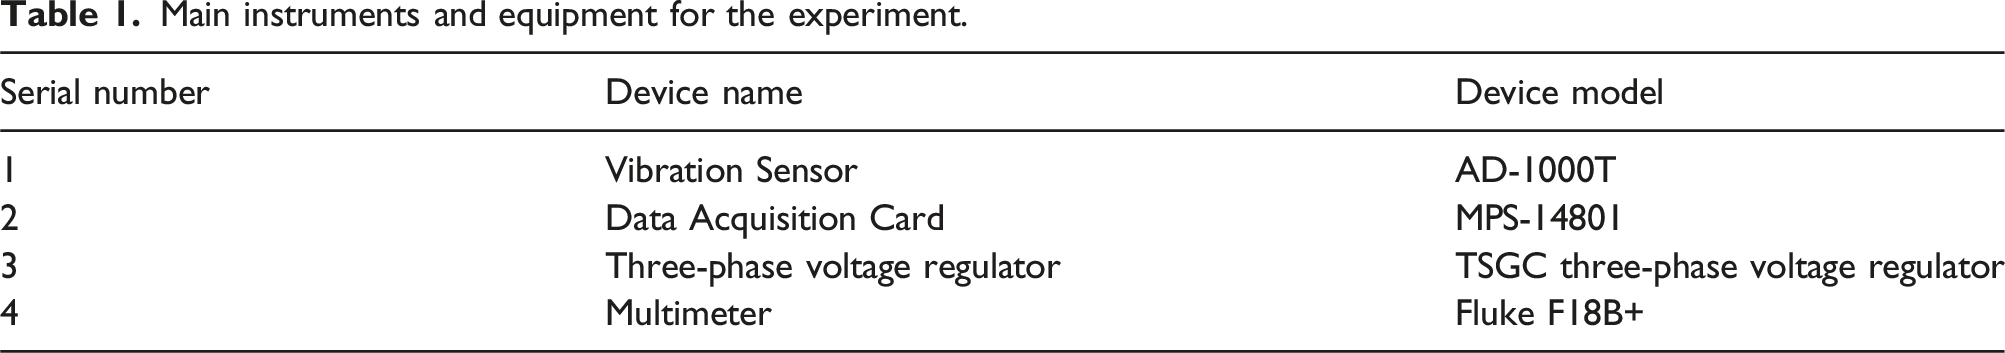
this paper adopts the finite element analysis method of electromagnetic structural field coupling. Firstly, as shown in Figure 2, the volume force distribution of the amorphous alloy transformer core is obtained in the electromagnetic field analysis (when unloaded, the core serves as the main vibration source, and its volume force is approximately equal to the magnetostrictive force). Next, the volumetric force is used as the load and transmitted to the harmonic response analysis to obtain the total deformation distribution of the amorphous alloy transformer under electromagnetic vibration at 200 Hz, as shown in Figure 3(a). Finally, using the total deformation distribution at 200 Hz as the basis for selecting measurement points, the experimental measurement points shown in Figure 3(b) were chosen. Volume force of amorphous alloy core. The selection basis of measuring points.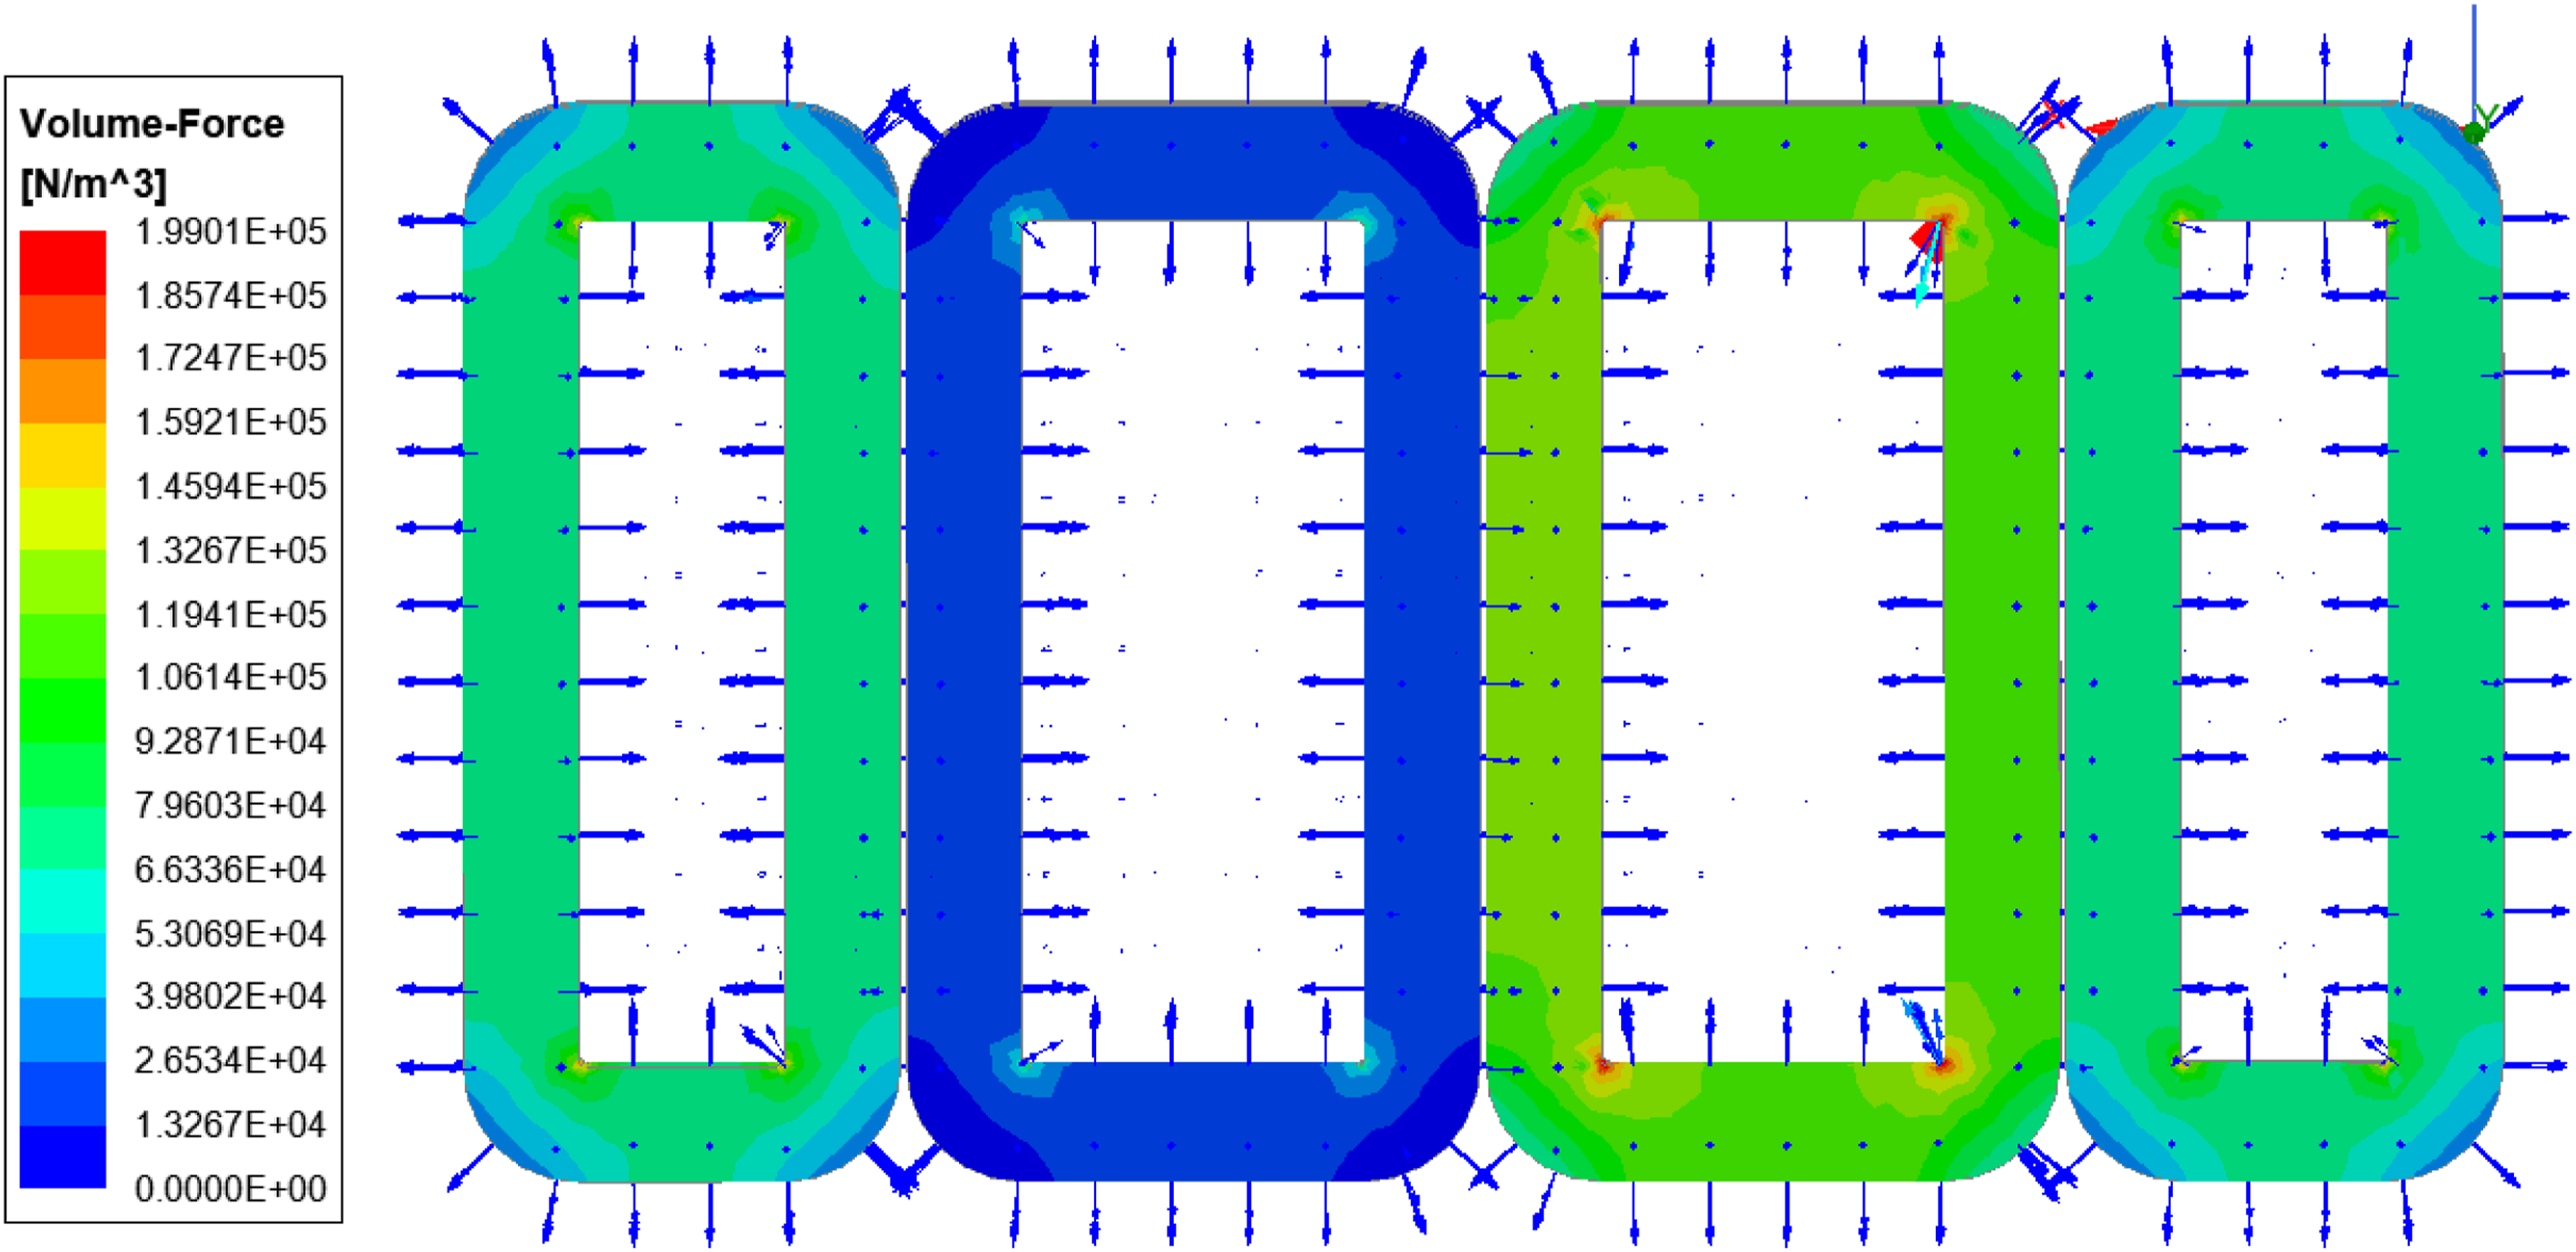
From the total deformation distribution diagram in Figure 3(a). The vibration of AMT is transmitted from the core to the surface of the transformer fixture through the transformer connection structure from inside to outside. Therefore, according to the total deformation distribution of the transformer, the 7 suitable measuring points shown in Figure 3(b) were finally selected to collect the vibration signal of the AMT.
Characteristic analysis of AMT fault signal
The main vibration signals of the transformer during operation come from the cores and windings.25,26 The core vibration is caused by the magnetostrictive effect of the core material in the alternating magnetic field; the winding vibration is caused by the alternating Ampere force generated by the winding current in the leakage magnetic field. According to the magnetostrictive characteristics of ferromagnetic materials in the alternating magnetic field and the force characteristics of the winding current in the leakage magnetic field, it can be deduced that the fundamental frequency amplitudes of the transformer core and winding vibration are linearly related to the square of the power supply voltage and current amplitude, respectively, and the fundamental frequency of the transformer vibration signal is twice the power supply frequency. 27
The magnetostrictive properties of the AMT core are much greater than those of ordinary silicon steel cores, 28 so the core amplitude is much larger than that of ordinary transformers, which leads to a larger vibration amplitude of the entire transformer.
After the sensors were arranged on the surface of the AMT, Spectrum signals of three kinds of conditions are shown in Figure 4. Spectrum signals of three kinds of conditions.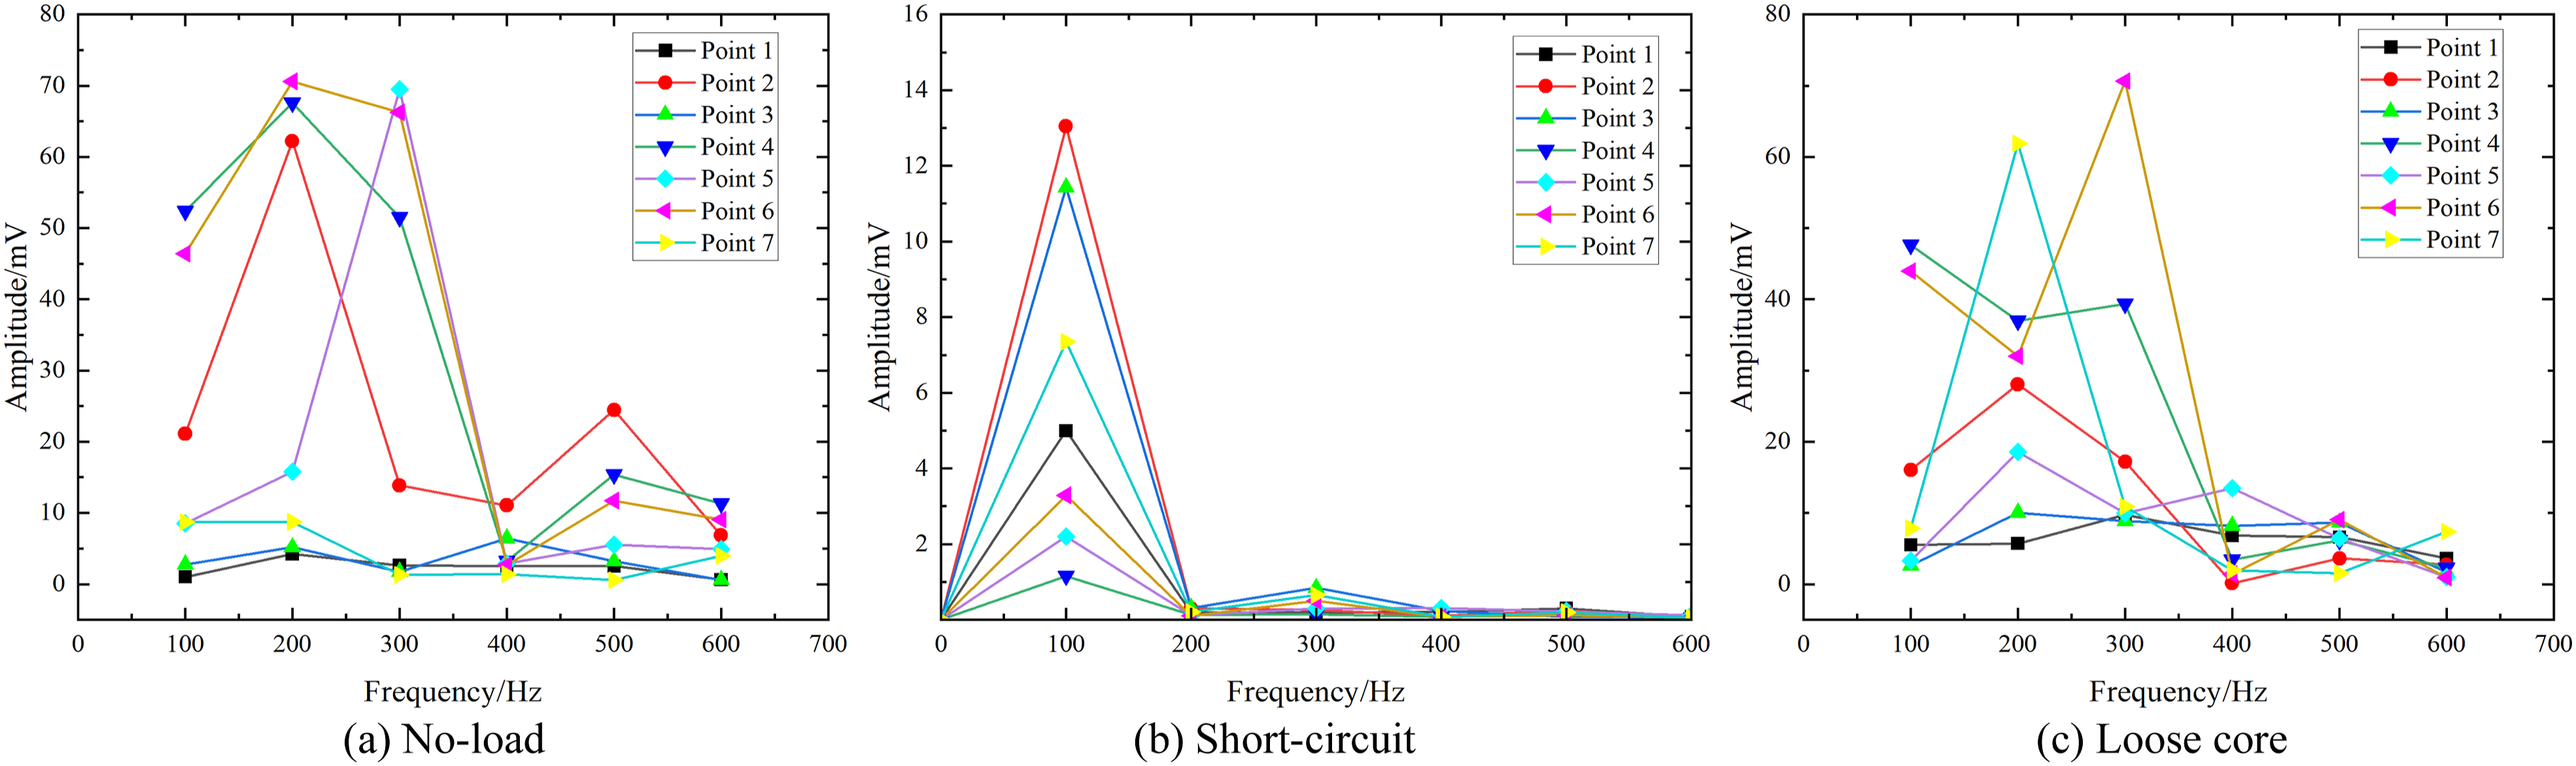
By observing the fault signal, it can be discovered that the vibration signal of AMT is mostly concentrated within the range of 0 to 1000 Hz. As indicated in Figure 4(a) and Figure 4(c), the signal frequencies of no-load and loose-core conditions are mainly concentrated between 100 Hz and 300 Hz. It can be seen from Figure 4(b) that the frequency of the short-circuit signal is mainly concentrated at 100 Hz. However, since the signal frequency collected by this platform is 64 kHz, there exists the issue of an excessively high sampling frequency. If the sampling frequency is too large, after WPT feature extraction, the energy will be concentrated in one frequency band, making it impossible to extract effective features. Hence, the resampling frequency selected in this paper is 1600 Hz. According to the Nyquist sampling theorem, the analog signal is within the range of 0 to 800 Hz, which is consistent with results of the expectation.
Feature extraction and optimization of fault signals
Wavelet packet transform and feature extraction principle
WPT is a further extension of wavelet analysis. It divides the frequency band into multiple levels and divides each decomposed frequency band into half again, so as to achieve a more detailed analysis of the signal. A small time window is used for high-frequency signal analysis, and a large time window is used for low-frequency signal analysis. 29
The mathematical expression of wavelet packet decomposition is shown in formula (1)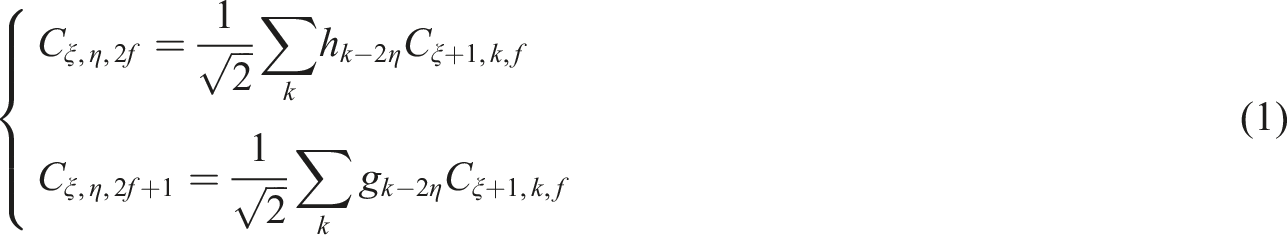
C ξ,η,2f and C ξ,η,2f+1 are the wavelet decomposition results of the next layer; C ξ+1,k,f is the decomposition result of the upper layer; ξ is the scale coefficient; η is the position coefficient; f is the sampling frequency; h and g are orthogonal conjugate low-pass and high-pass filters.
The energy occupied by each node of the reconstructed signal can be calculated using formula (2)
Use the energy of each frequency band to construct the corresponding feature vector V

PSO parameter optimization for WPT
In mechanical condition monitoring, energy entropy reflects the distribution of signal energy in frequency band or time window. The vibration signal of normal equipment is stable, energy is concentrated and entropy is low. However, faults such as bearing wear, gear fracture or loose iron core will lead to changes in signal characteristics, increase frequency components and amplitude fluctuations, make energy distribution more dispersed to increase energy entropy.
In view of taking the energy entropy of the signal as the objective function and considering that the signal is not strictly continuous and differentiable in the actual acquisition process, choosing PSO to optimize WPT wavelet coefficients has inherent advantages.
Compared with the traditional gradient descent method or Newton method, PSO does not rely on the gradient information of the objective function, which is very suitable for dealing with the nonlinear problem in the selection of WPT parameters. The optimization objective function is shown in formula (5)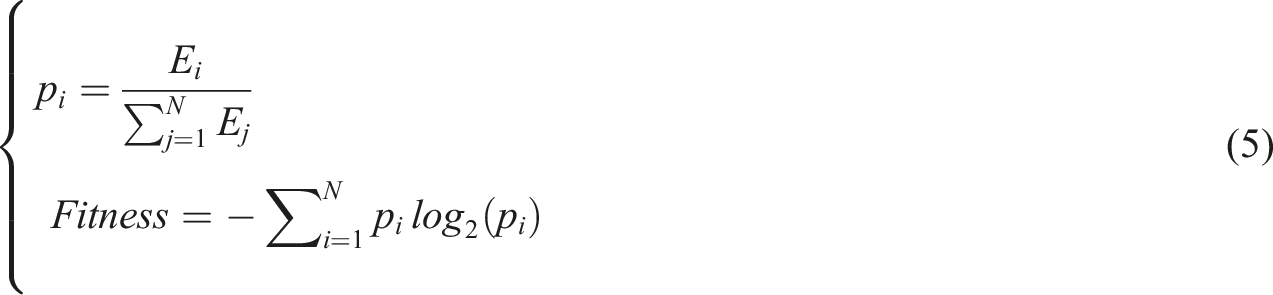
Based on the energy entropy theory in mechanical fault diagnosis mentioned above, the larger the energy entropy, the more obvious the fault characteristics. 30 This article proposes using the energy entropy of vibration signals as the objective function of PSO algorithm, aiming to improve the accuracy of fault signal feature extraction by optimizing the key parameters of wavelet packet decomposition [N, “Wname”], namely, the decomposition level and wavelet basis function. This method not only helps identify early faults in equipment, but also provides quantitative analysis basis for fault types, 31 thereby achieving effective monitoring of the health status of mechanical equipment.
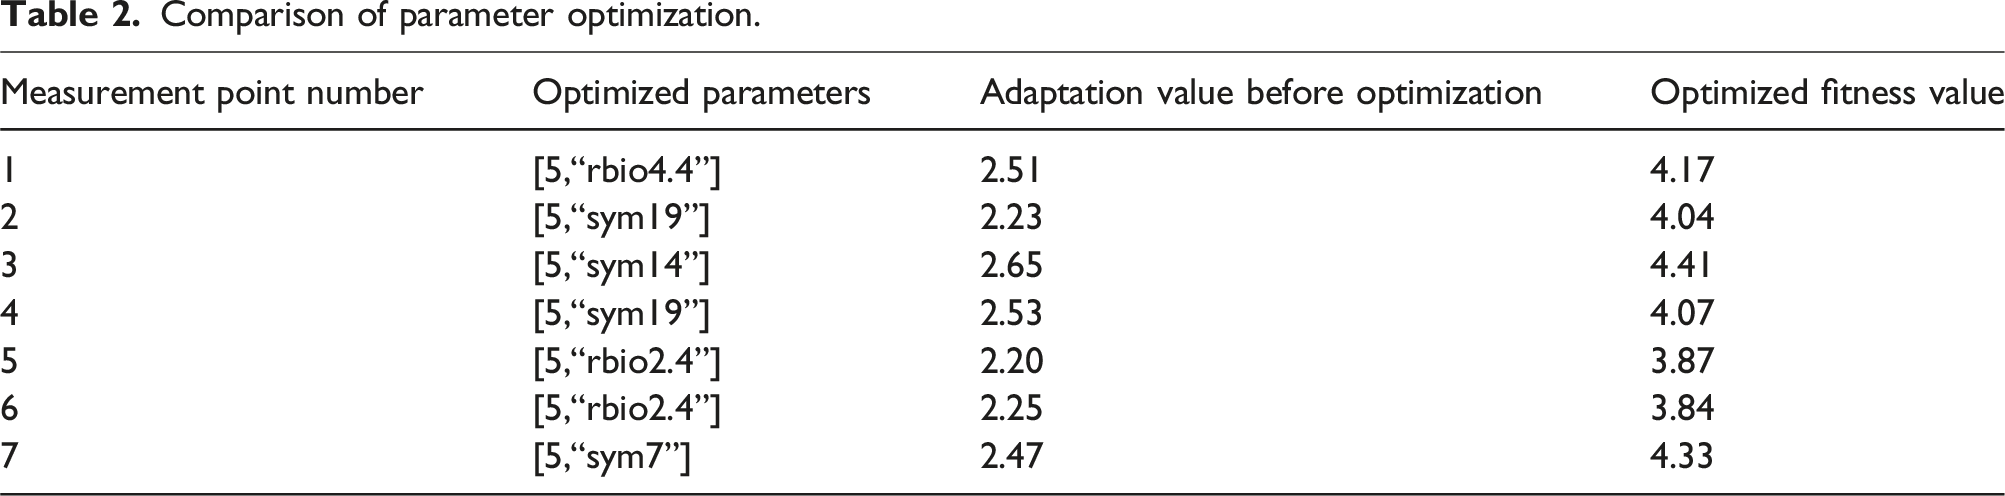
To show the optimization effect, taking the loose-core state as an example, the energy entropy value of the [3, “db2”] wavelet packet parameter selected by experience before improvement is compared with the fitness function value after PSO improvement, as shown in Figure 5. The larger the fitness function value, the more it can show the feature extraction effect after PSO optimization. Fitness value before and after improvement.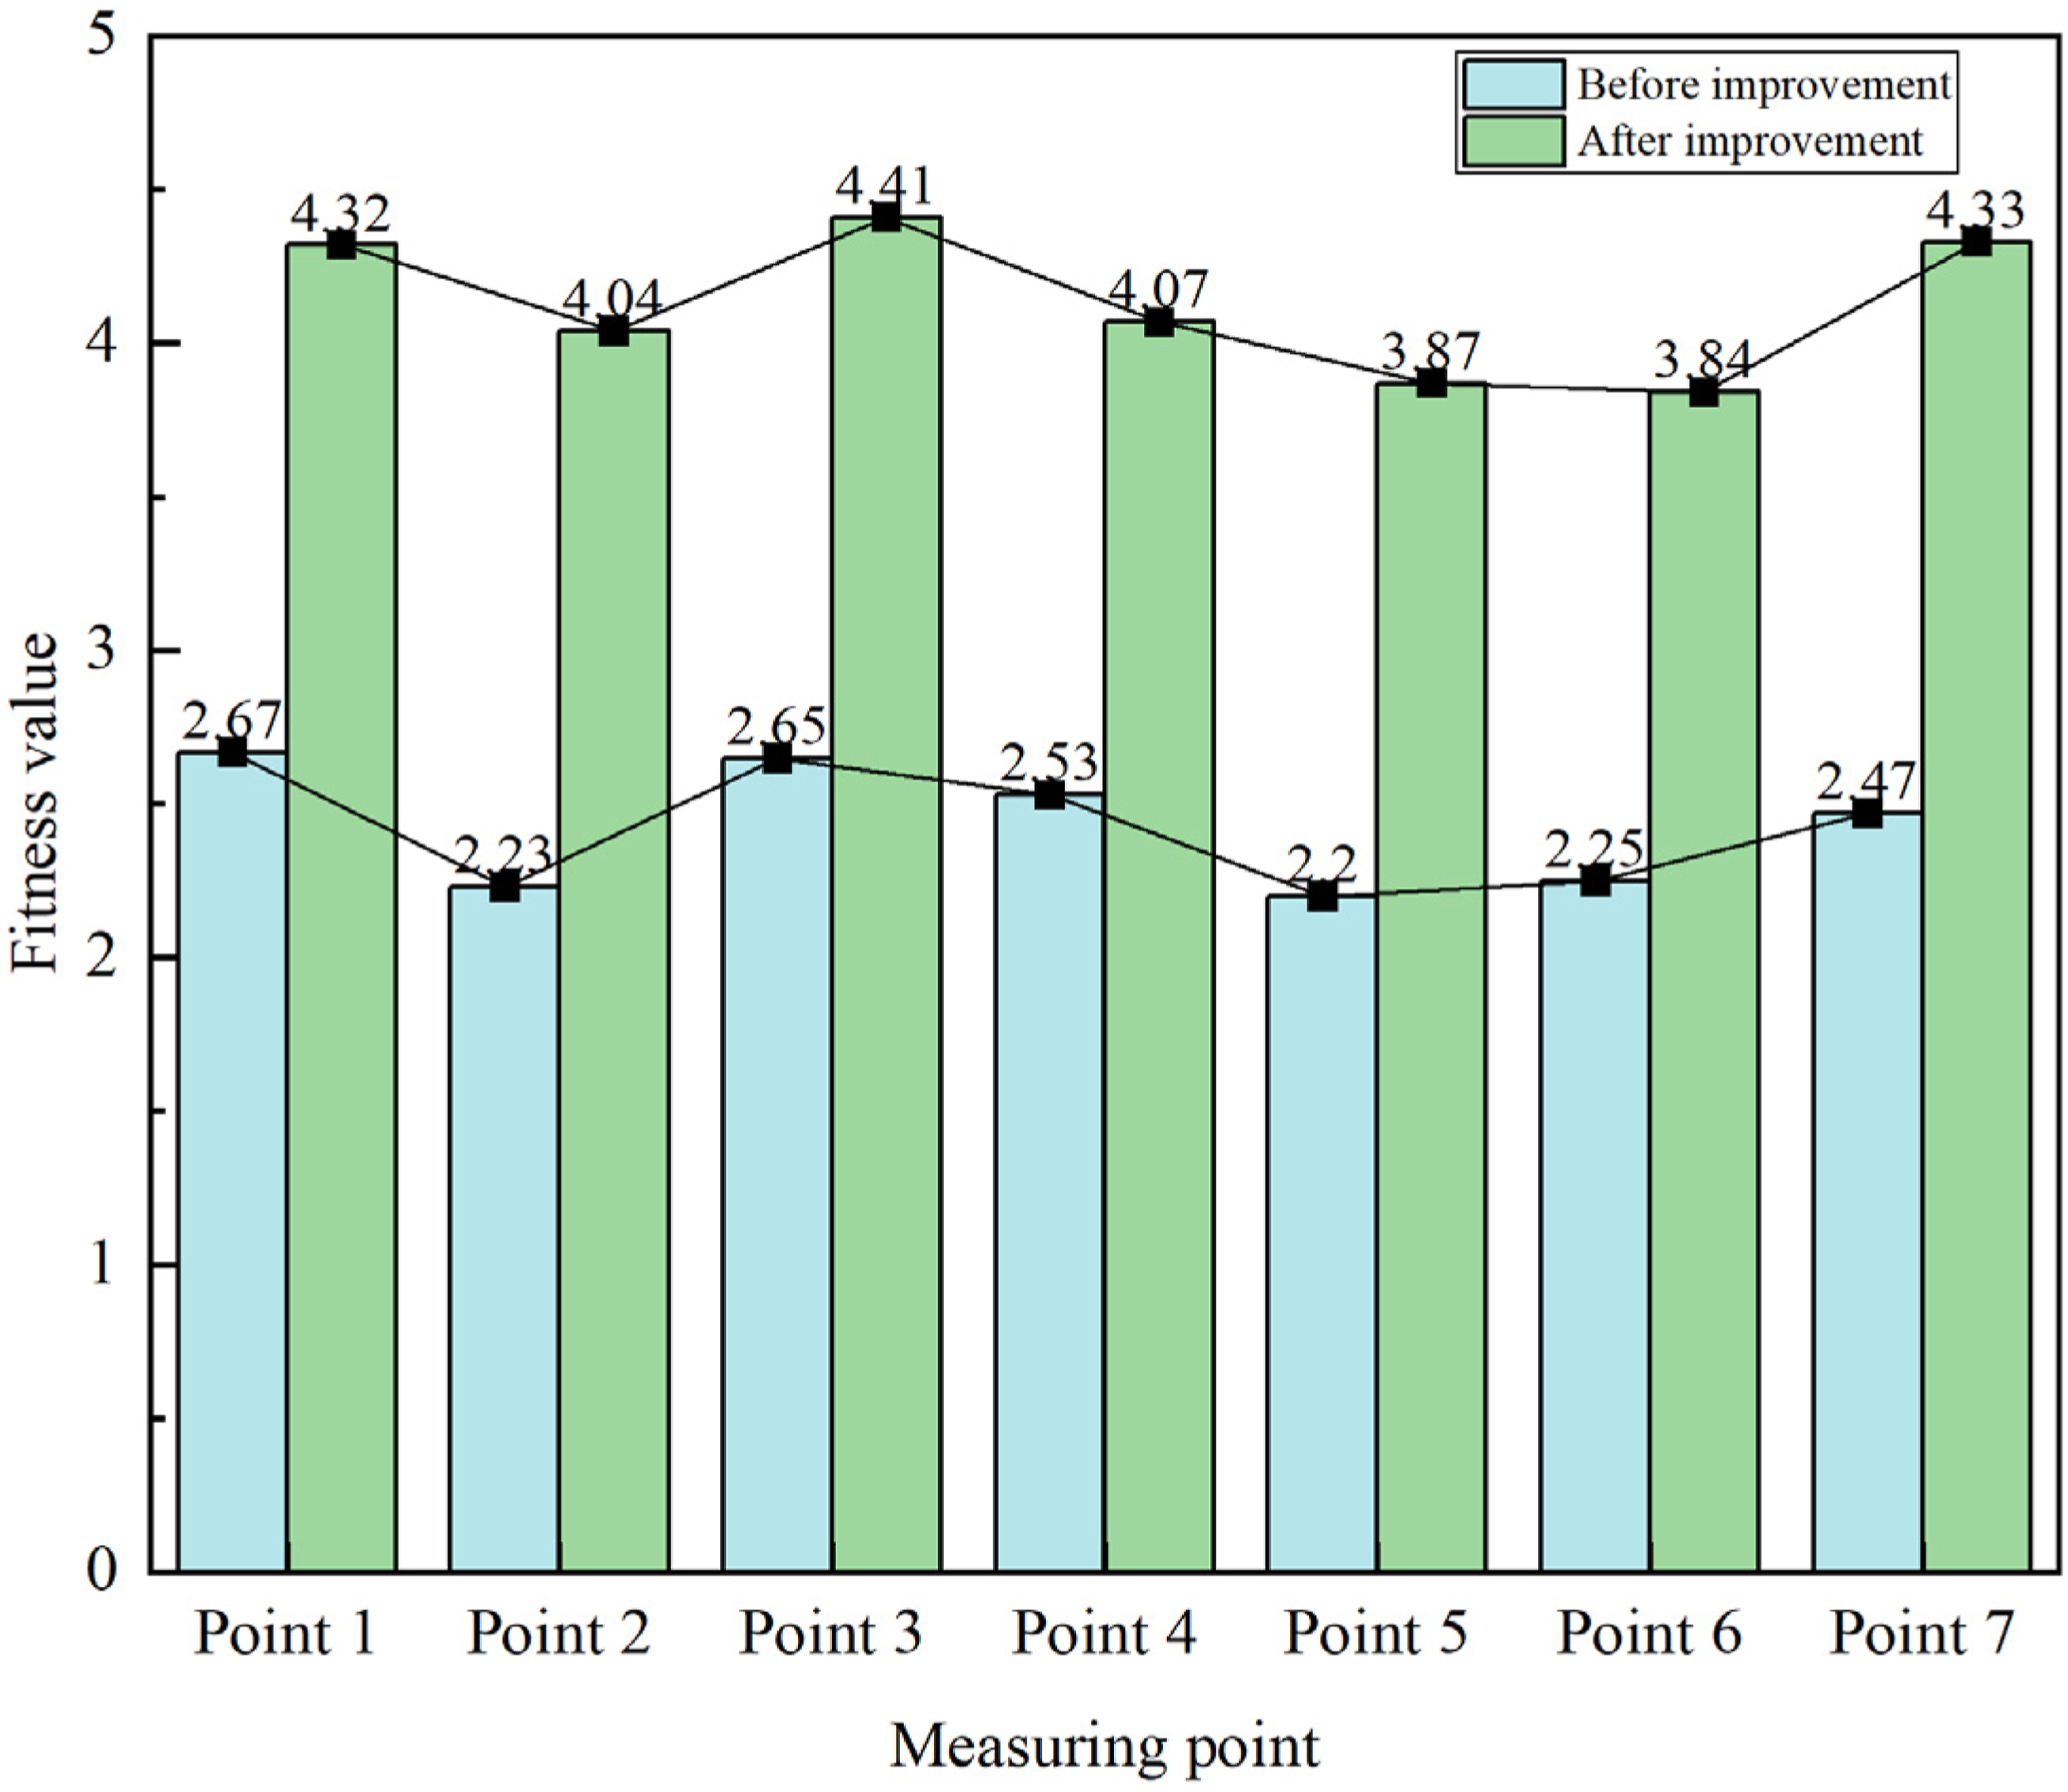
It can be seen from Figure 5 that, compared with before PSO optimization, the fitness values have been significantly improved and the fitness values have become larger, indicating that the optimization effect of PSO on WPT feature extraction is universal and a suitable optimal solution can be found. It also proves that PSO has a significant optimization effect on WPT feature extraction and can be used as one of the optimization methods for feature extraction, and it is feasible.
Comparison of parameter optimization.
Feature extraction of fault signals
After obtaining the PSO-optimized wavelet packet parameters, the vibration signals of the transformer under three kinds of fault conditions, such as no load, short circuit, and loose iron core, are decomposed and reconstructed using wavelet packet analysis.
Energy proportion of frequency bands.
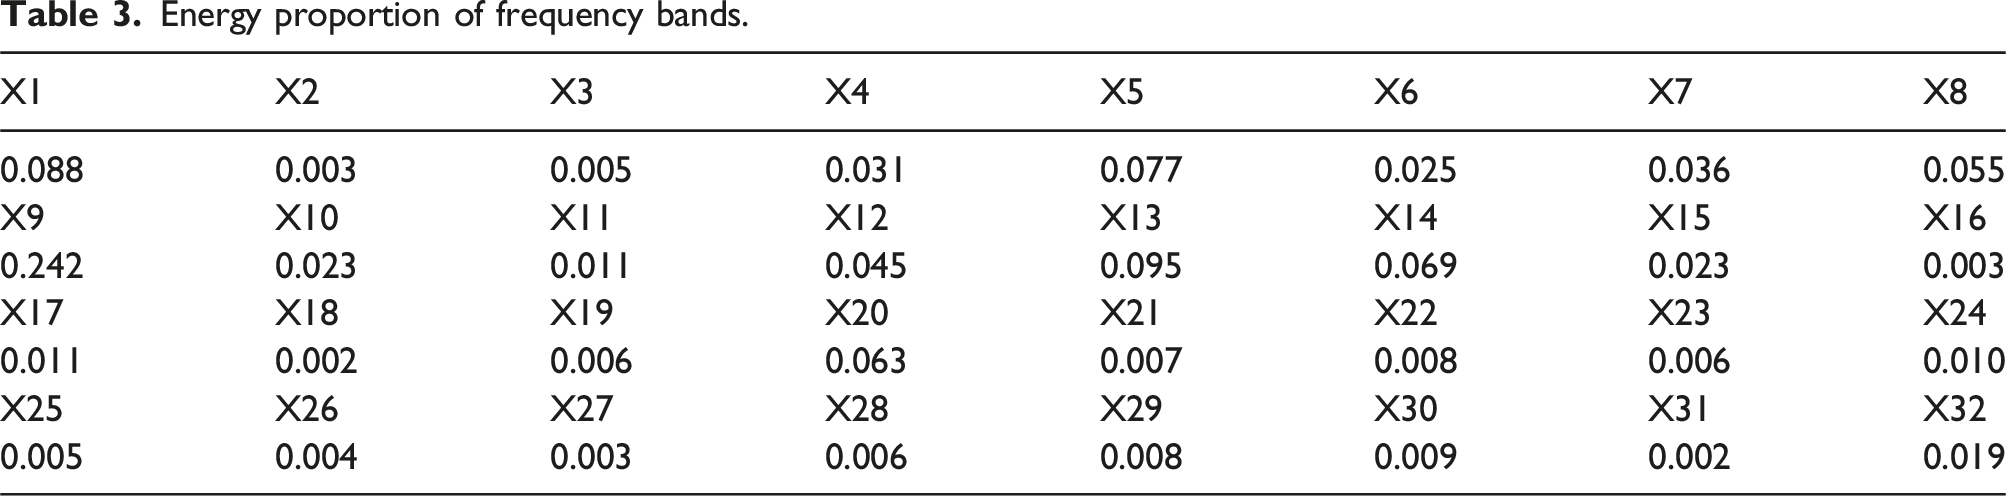
As shown in Table 3, due to the excessive number of wavelet packet decomposition layers after PSO optimization, the normalized feature frequency bands are too many and the energy features are too complex. This not only makes data statistics not only difficult, but also more importantly, and it makes subsequent classification more complex and inaccurate.
Feature dimensionality reduction processing based on principal component analysis
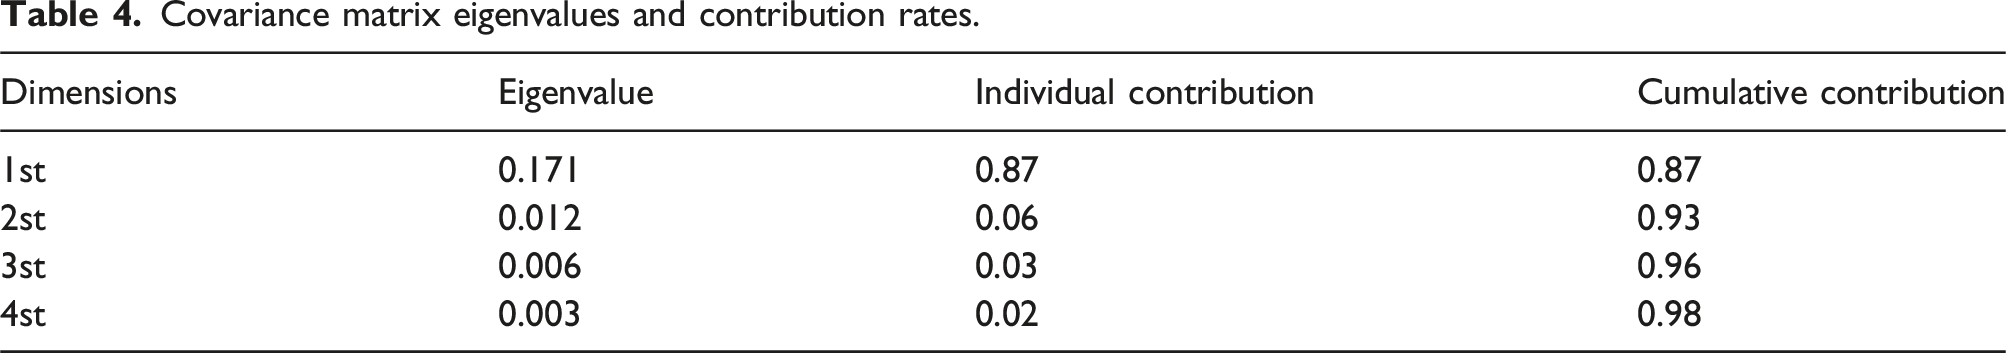
As shown in Table 2, PSO-optimized wavelet packet decomposition typically exceeds 3 layers, leading to at least 16 frequency band energy nodes. This significantly increases data redundancy. To maintain data consistency and simplify processing, PCA is used to reduce the dimensionality of the normalized frequency band energy. The steps are as follows Step 1, use the Z-score method to standardize the data and establish a standardized matrix Z.

Among them, x
ij
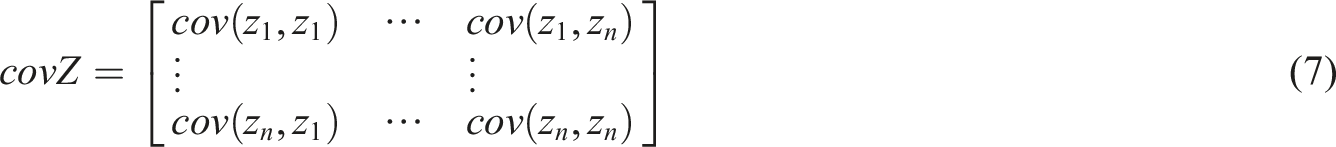
represents the element in row i and column j in the original data matrix, µ represents the mean of each feature, σ is the standard deviation of each feature. Step 2, calculate the covariance matrix covZ of Z. Step 3, calculate the characteristic roots of the matrix and arrange them according to their size, Step 4, calculate the contribution rate and cumulative contribution rate of each principal component


Covariance matrix eigenvalues and contribution rates.
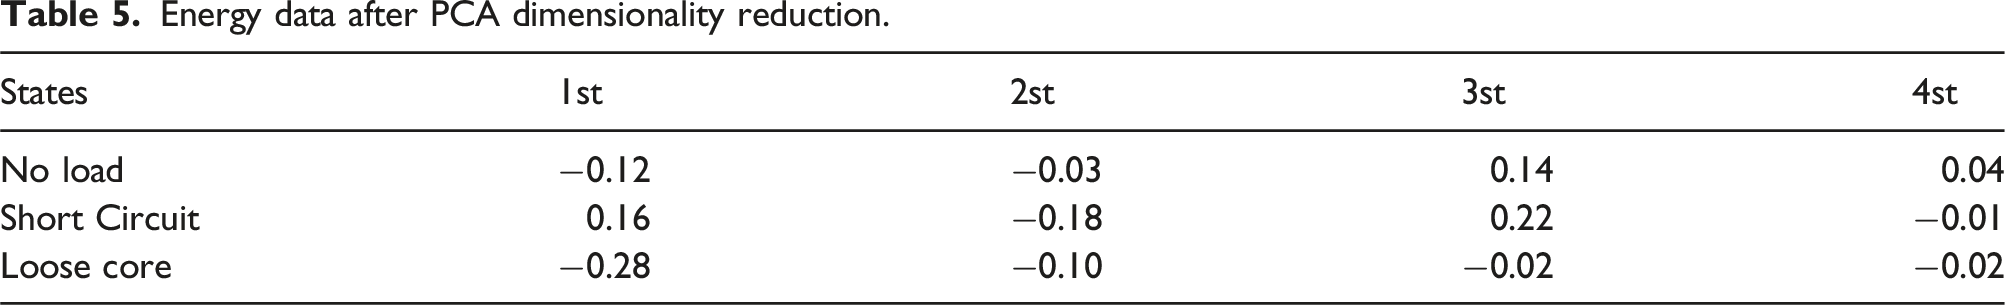
Energy data after PCA dimensionality reduction.
Classification and diagnosis of AMT vibration signals
Support vector machine theory
SVM classification is a machine learning method based on statistical learning theory and structural risk minimization. It can handle binary and multi-classification problems, and is applicable to both linearly separable and nonlinearly separable samples. Transformer fault diagnosis is a nonlinear multi-classification problem, and the nonlinear multi-classification transformation model of support vector machine is shown in formula (11) and formula (12)

The sample set is mapped from the input space to the high-dimensional feature space, and the Lagrangian function and decision function are constructed as follows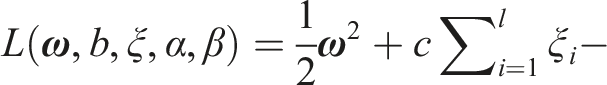


The Gaussian kernel function (radial basis function, RBF) has good generalization performance and only needs to determine one parameter. The selected RBF kernel function is shown in formula (15)
PSO optimizes SVM parameters
Since the transformer classification diagnosis problem is a nonlinear multi-classification problem, SVM with kernel function is usually used. When adjusting the parameters of the SVM, the c parameter controls the degree of penalty for the error term, and the gamma parameter determines the influence range of the support vector of the RBF kernel.
The performance of SVM largely depends on the selection of its parameters. Although traditional grid search and random search methods are simple, their efficiency is relatively low, especially in high-dimensional spaces. As an intelligent optimization algorithm, PSO can adaptively adjust and find better parameter combinations. And for the multi class nonlinear problem of transformer fault diagnosis, it does not rely on gradient effects and gradually approaches the optimal solution by adjusting the velocity and position of particles.
Therefore, the objective function for optimizing the SVM model in this paper is as follows
The PSO algorithm aims to minimize the objective function. Therefore, it necessitates taking the negative value to ensure accuracy.
According to the optimized objective function, the steps for PSO to optimize SVM are shown in Figure 6 PSO optimization strategy for SVM.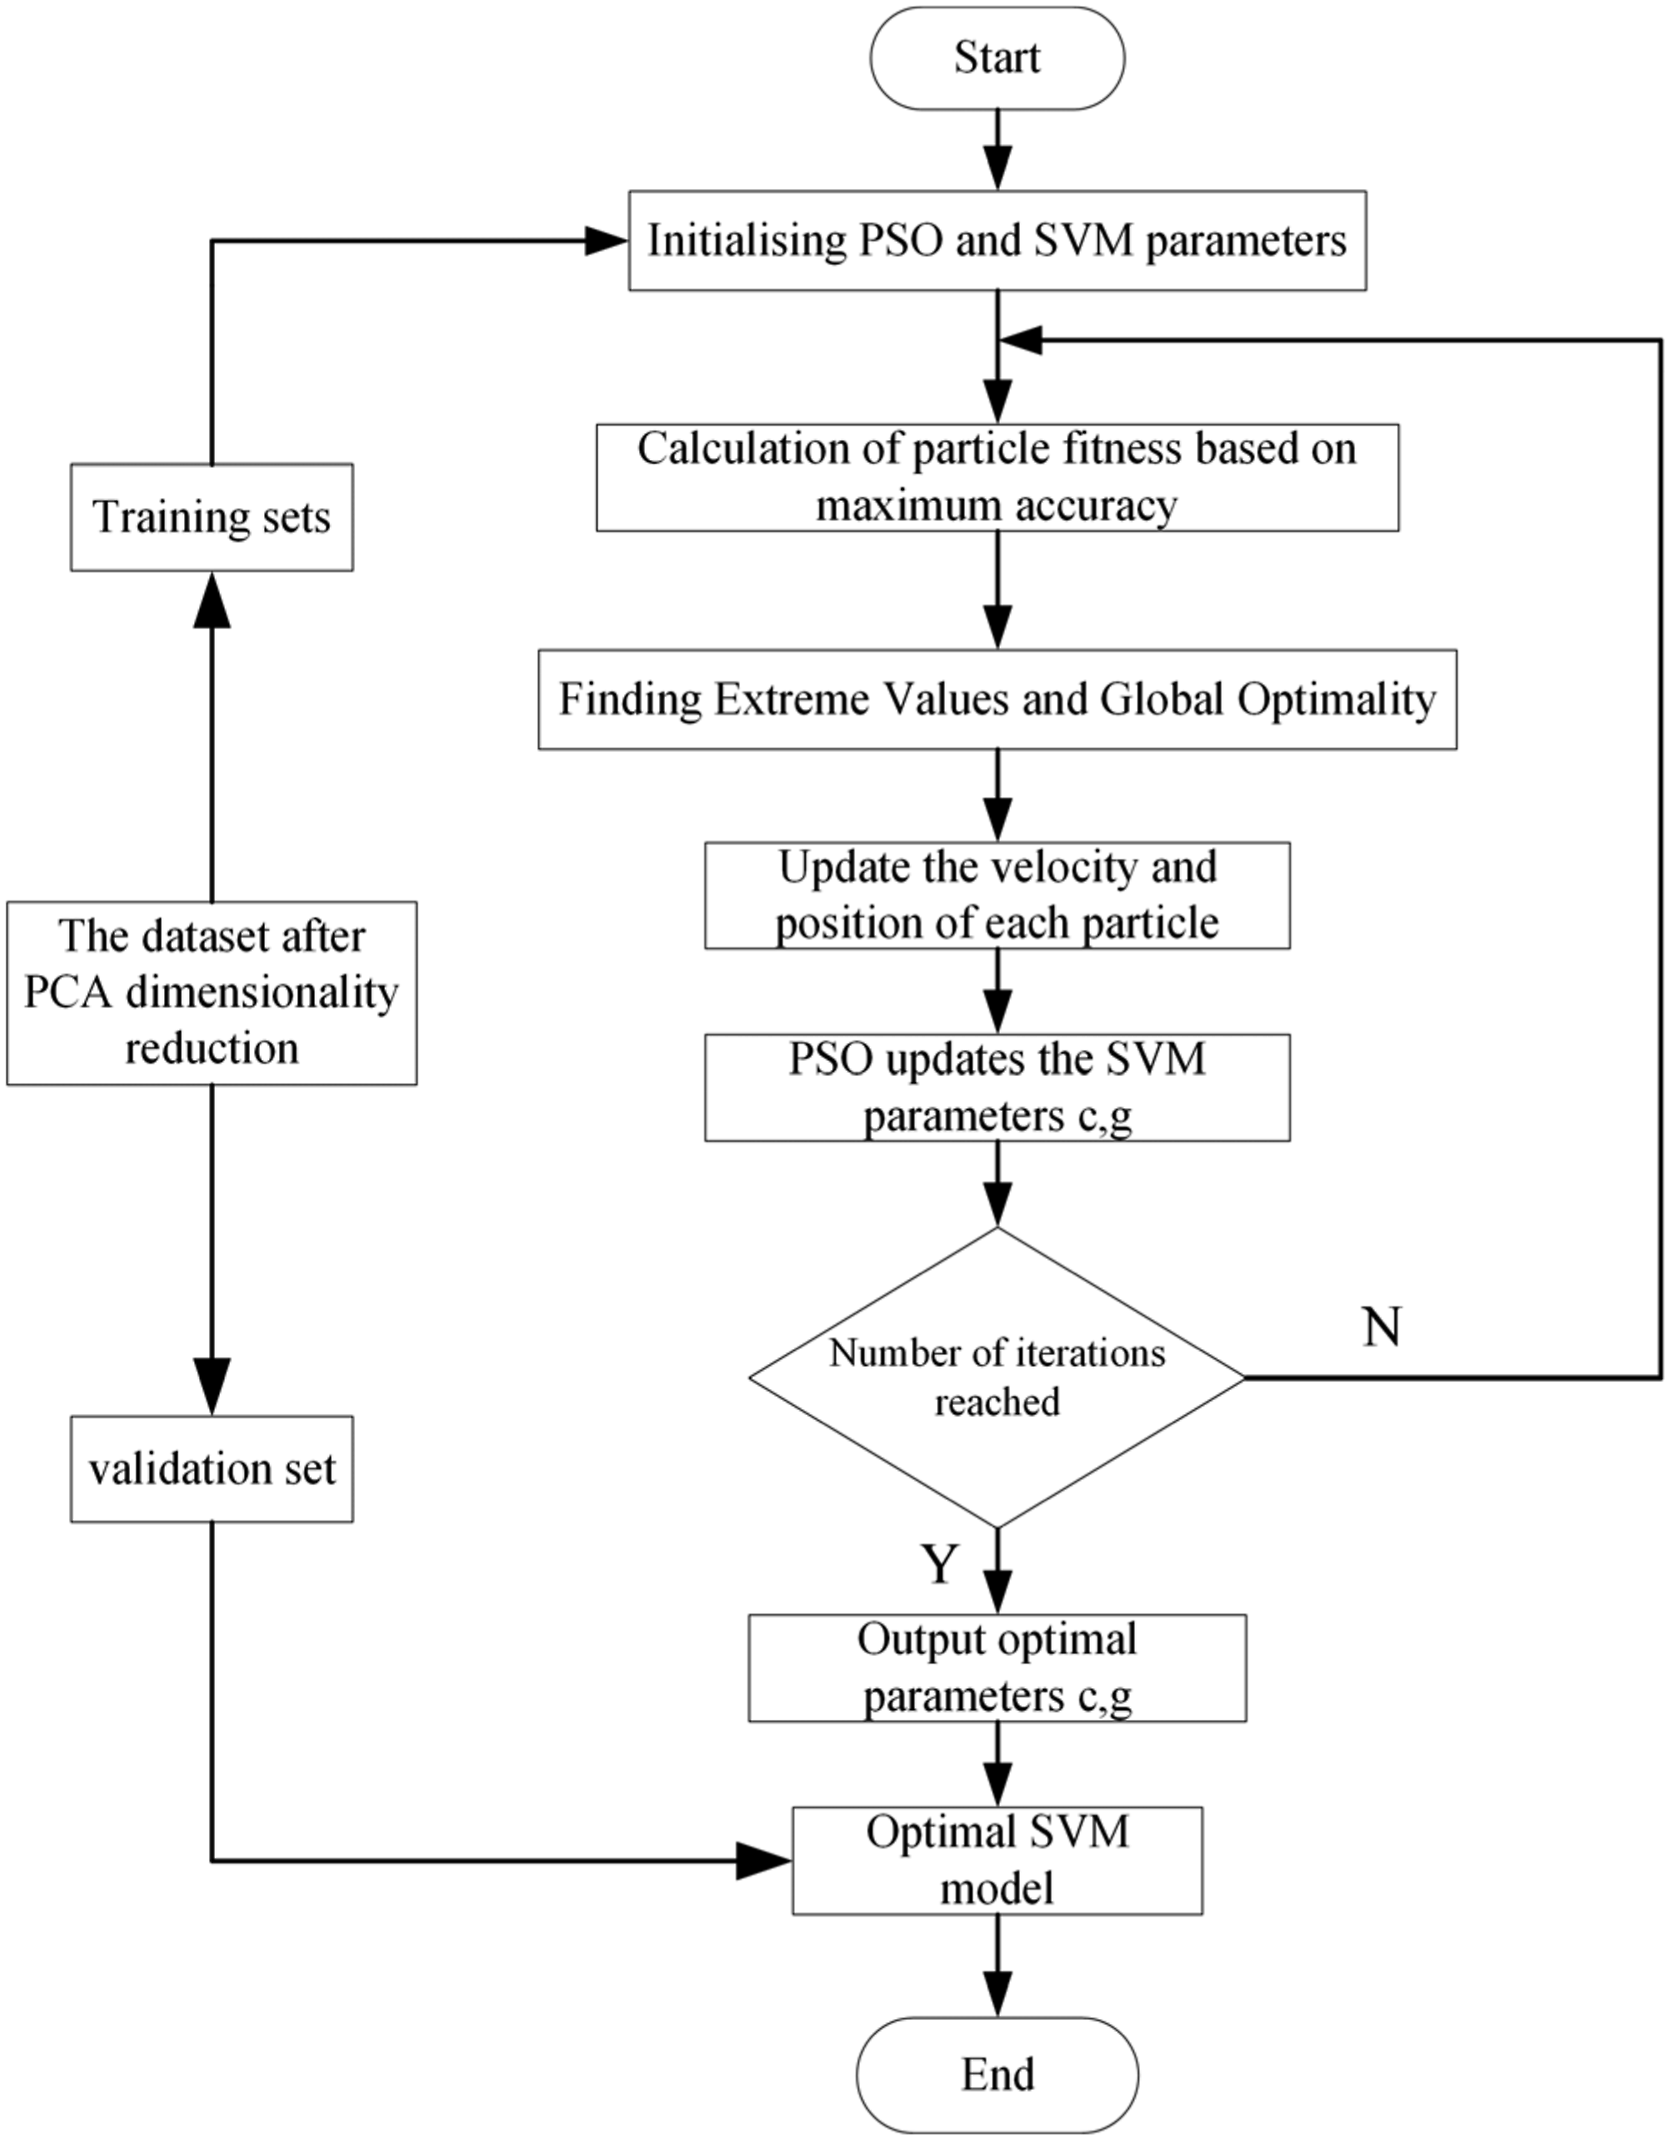
AMT fault diagnosis examples
According to the algorithm flow in Figure 6, the feature samples are divided into 192 training samples and 48 test samples. The training samples include 72 no-load states, 72 short-circuit states, and 48 loose states, covering three kinds of fault conditions. This paper takes PSO-SVM as an example to analyze the optimization effect of particle swarm algorithm on support vector machine parameters. The training sample set is used to select the best SVM parameters.
Firstly, initialize the PSO parameters, with a maximum initialization population of 50 and a maximum population evolution of 50. Randomly assign each particle position (SVM parameter) and define the penalty parameter c Optimization effect of PSO-WPT-PSO-SVM model.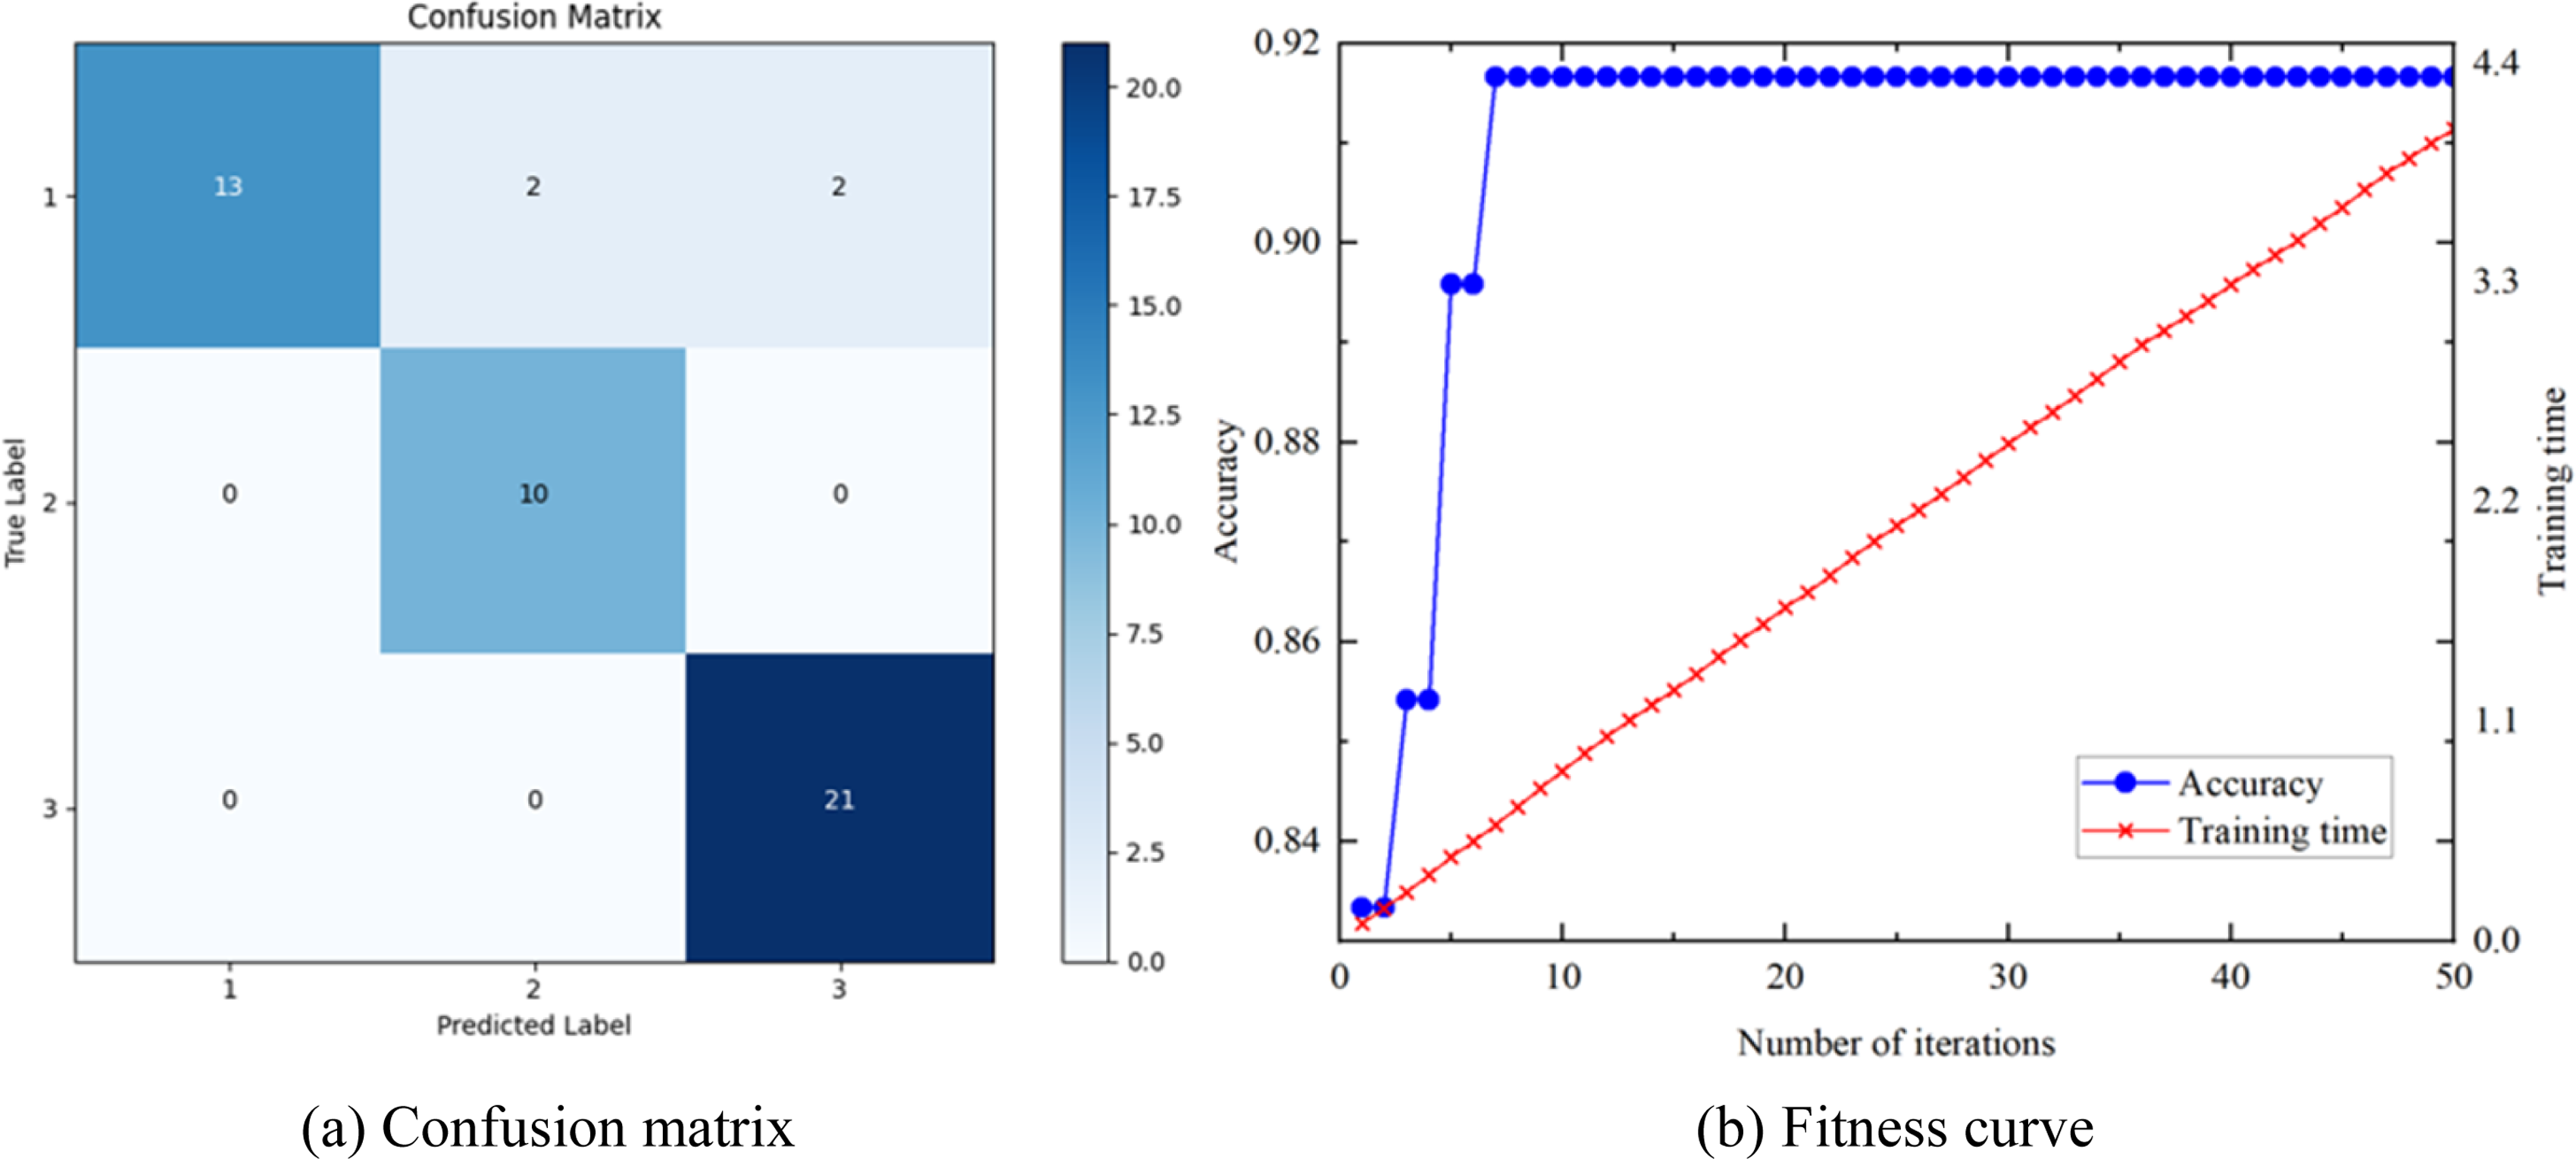
Ablation experiment
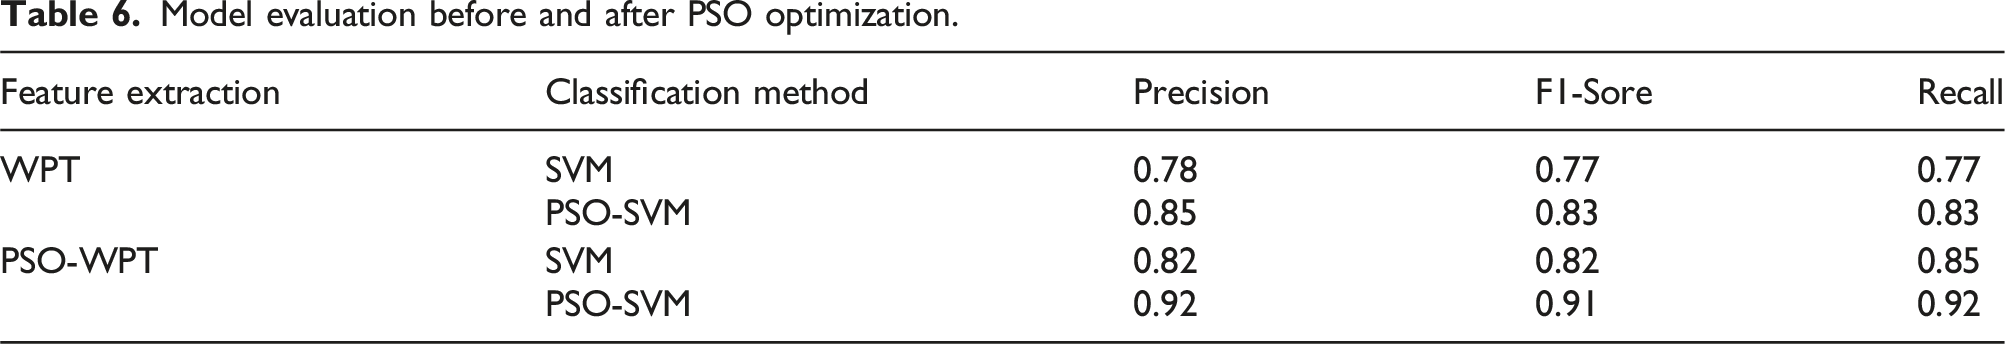
Model evaluation before and after PSO optimization.
Further comparing the impact of the main parameters on the prediction model, the confusion matrix shown in Figure 8 can be used to compare the actual measured values with the classification prediction results. Confusion matrices before and after parameter optimization.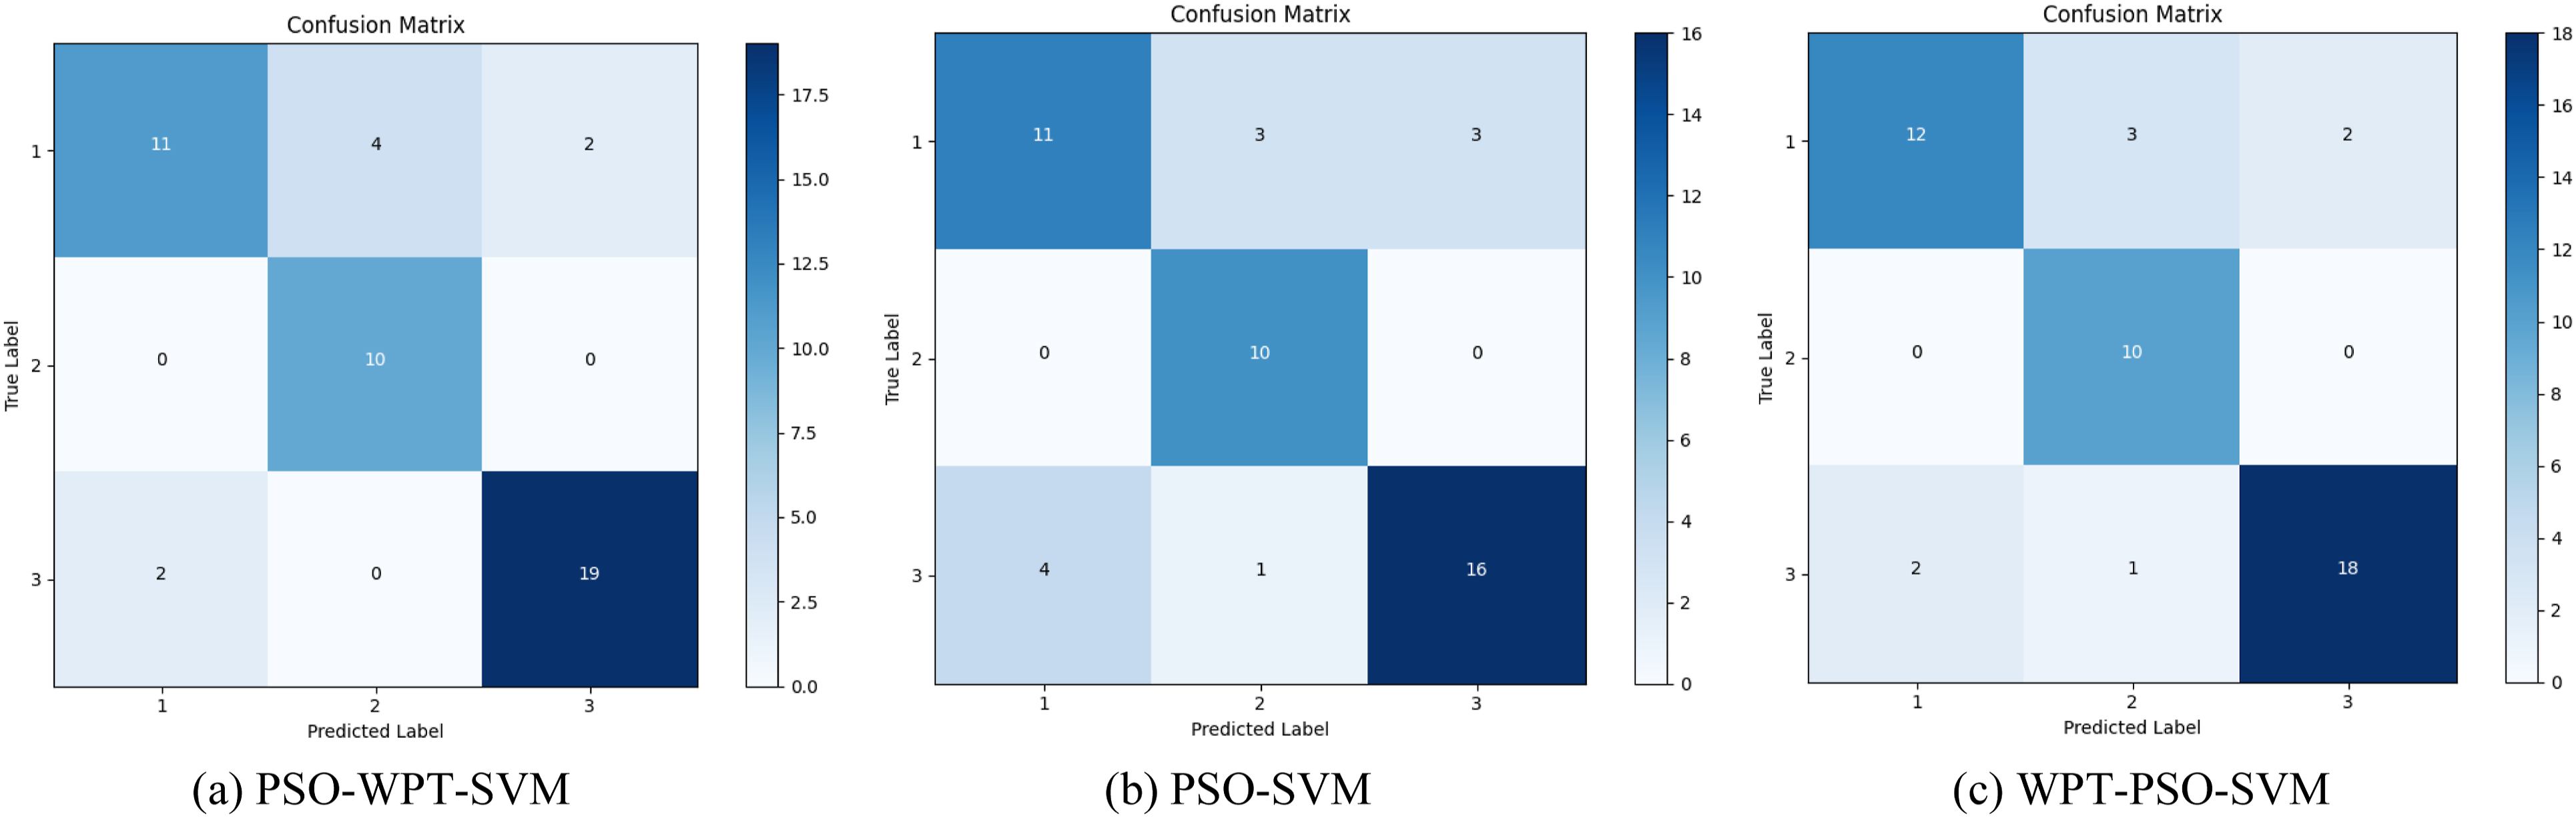
According to Table 6 and Figure 8, after PSO optimization, WPT and SVM are better able to extract effective features of vibration signals, improving recognition accuracy, F1-Sore, and Recall compared to before optimization. Whether optimizing the wavelet parameters [N, Wname] or the SVM parameters [c, g], each method has shown significant optimization effects. Therefore, combining both approaches results in an effect that surpasses their individual contributions, achieving a synergistic effect greater than the sum of its parts.
The above explanation shows that using particle swarm optimization algorithm to optimize the WPT-SVM transformer fault recognition model has high accuracy and good stability.It can accurately and reliably identify three types of fault conditions in transformers: no-load, short circuit, and loose core.
Conclusions
In this study, a PSO-optimized WPT-SVM model for fault diagnosis of AMT is proposed based on the vibration signal of AMT clamp. Based on this model, not only can significantly improve the diagnostic efficiency of AMT, but also provide a new optimization idea for the subsequent research of transformer fault diagnosis. The conclusions are as follows: (1) The PSO algorithm is employed to optimize the parameters [N, Wname] in wavelet packet decomposition, enhancing feature extraction efficiency and mitigating the uncertainty associated with manual parameter selection. Furthermore, PCA reduces data redundancy from the WPT feature extraction process, improve the efficiency of data processing. (2) The model combines PSO to enhance the WPT-SVM transformer fault diagnosis process, improve fault identification. With a precision of 0.92, an F1-Score of 0.91, and a recall of 0.92, these metrics are notably higher than pre-optimization levels. Consequently, this method possesses a significant reference value. (3) Transformer fault diagnosis is a systemic problem. Optimizing the entire fault diagnosis process, including signal acquisition, feature extraction, and classification prediction, rather than just the classification algorithm, can more effectively enhance the model’s diagnostic efficiency.
However, the adaptability of this model to different types of AMT is still lack of research, and how to establish a universal diagnosis model of AMT is still a problem to be solved. In the future, the research team will solve the above problems by expanding the scope of sample collection and summarizing the vibration characteristics of different types of AMT.
Footnotes
Declaration of Conflicting Interests
The author(s) declared no potential conflicts of interest with respect to the research, authorship, and/or publication of this article.
Funding
The author(s) disclosed receipt of the following financial support for the research, authorship, and/or publication of this article: This work is supported by National Natural Science Foundation of China(52167017);Natural Science Foundation of Jiang xi Province (20224BAB204054);Ganpo Talent Support Program(20232BCJ22006).