
Abstract
In this paper, modal properties of the seated human body were identified from measured transmissibilities to the head, chest, lumbar spine L3, pelvis, hips and thighs with single-axis translational vibration; how they were affected by vibration direction and magnitude was quantitatively compared for the first time. To this end, eight subjects were exposed to fore-aft, lateral and vertical single-axis vibrations with three magnitudes at 0.4, 0.8 and 1.2 m/s2 r.m.s., respectively. Three and five vibration modes were identified with fore-aft vibration and with vertical vibration in the sagittal plane, respectively, while three modes identified with lateral vibration were in the coronal plane. As the vibration magnitude increased from 0.4 to 1.2 m/s2 r.m.s., the modal frequencies of the modes at 1.2, 2.2, 2.9 and 6.2 Hz, which contained the pitch, lateral movements, fore-aft movements and vertical movements of the upper body, respectively, were reduced to 1.0, 1.8, 2.3 and 5.8 Hz significantly, and the damping ratios of the modes identified at 0.8, 5.2 and 10.9 Hz were changed. High similarity was observed between the modal shapes identified with different vibration magnitudes.
Introduction
Whole-body vibration (WBV) in vehicles affects the performance, comfort, and health of drivers and passengers. 1 Knowledge of the modal properties of the seated human body can provide useful guidance for seat and vehicle designs to improve ride comfort and prevent low back pain caused by continuous vibration exposure. However, existing modal properties of the seated human body were mostly derived from biodynamic models, lacking verification with experimental modal analysis (EMA).2–5
Biodynamic responses of the seated human body to WBV are commonly characterized by frequency response functions, such as apparent mass and body transmissibility.1,6–9 Resonances in the frequency functions were thought to be related to one or several vibration modes of the human body. When sitting without a backrest during fore-aft vibration, three resonances around 1.0 Hz, between 1.5 and 3.0 Hz and around 5.0 Hz1,10 were found in the fore-aft apparent mass. When exposed to lateral vibration, two resonances between 0.8 and 1.3 Hz and between 2.3 and 3.0 Hz were present in the lateral apparent mass.2,5 During vertical vibration, a principal resonance between 4.0 and 6.0 Hz was evident in the vertical apparent mass, and a second resonance between 8.0 and 12.0 Hz was observed with a small modulus and large inter-subject variability.11–14
An EMA study of the upper body sitting without a backrest was conducted by Kitazaki and Griffin, 15 in which eight vibration modes at frequencies below 10.0 Hz were identified from body transmissibilities in the sagittal plane during vertical vibration. Inconsistent conclusions were noticed between the reported modal shapes and those derived with biodynamic models by other studies. The measured modal shape around 1.0 Hz was suggested to be the pitch of the cervical and upper thoracic spine, 15 while it was considered to be the pitch of the upper body in some studies on biodynamic modelling.4,16–18 The measured modal shape around 2.2 Hz was reported to be the out-of-phase movements between the head and pelvis in the fore-aft direction, 15 but it was suggested to also contain the pitch of the pelvis and the bending of the spine according to modelling studies.5,8,19,20 For the vibration modes associated with the 5-Hz resonance in the vertical apparent mass, bending of the spine was identified by the measurement, 15 but was not observed in some models. 5 Furthermore, while the vibration responses of the thighs were suggested to be related to the resonance between 8.0 and 12.0 Hz in the vertical apparent mass, 3 the modal information of the thighs remained unknown as their responses were not measured in the study of Kitazaki and Griffin. 15 These discrepancies suggest that there is a gap in the knowledge of modal properties and resonance behaviours of the seated human body.
The resonances in the apparent mass and body transmissibilities and the corresponding resonance behaviours of the human body are considered to depend on the direction of vibration. However, few EMA studies of the human body have been conducted with lateral or fore-aft vibration. When measured with lateral vibration while sitting with a backrest, two vibration modes were reported at about 1.2 and 2.5 Hz, 21 featuring the sway motion of the upper body and the lateral motion of the whole body,5,21,22 respectively. The motion of these two modes was found to be in the coronal plane, but it is unclear whether they can be excited and identified with vertical excitation. Up to the present, there seems no EMA study of the human body sitting without a backrest conducted with fore-aft vibration. It is expected that the modal shapes identified with fore-aft vibration would be in the sagittal plane, but how they would be related to those modes identified with vertical vibration remains unclear. To the best knowledge of the authors, there is no study to compare quantitatively the vibration modes of the human body measured with vibration in different directions.
Increasing the magnitude of vibration has been found to soften the human body, decreasing the resonance frequency in the apparent mass and body transmissibilities (i.e. nonlinearity).10,13,14,23–26 Such effect of vibration magnitude has not been investigated in terms of modal properties of the human body. For the modal frequencies, it is rational to expect that as vibration magnitude increases, the modal frequencies of the modes associated with the resonance in the apparent mass may decrease. For the modal shapes, the effect of vibration magnitude remains less clear because the degree of nonlinearity associated with the body transmissibilities has been reported to vary between body parts.10,14,23,24 By conducting EMA with different vibration magnitudes, the effect of vibration magnitude on each mode can be identified in terms of modal frequency, shape and damping, which offers insights to understand the nonlinearity in the biodynamic responses of the human body.
This study was designed to measure the modal properties of the seated human body using single-axis vibration excitation in fore-aft, lateral and vertical directions, respectively. The main objectives were to identify the effect of direction and magnitude of vibration excitation on the modal properties of the human body. It was hypothesized that similar or identical modes may be identified with fore-aft and vertical vibration while modes identified with lateral vibration are different modes from those identified with fore-aft and vertical vibration. It was also hypothesized that with increasing vibration magnitude, the modal frequency of a mode would decrease but the modal shape would be similar.
To this end, modal tests were conducted on eight subjects sitting on a rigid seat without a backrest during fore-aft, lateral and vertical single-axis vibration. Tri-axial accelerations at the head, chest, lumbar spine (L3), pelvis, left and right hips, and left and right thighs were measured, and tri-axial transmissibilities from the seat base to these body locations were calculated. Modal parameters were then extracted from the body transmissibilities with the PolyMAX algorithm. The effect of vibration magnitude and direction on the modal properties was investigated.
Method
Subjects and stimuli
Eight male subjects (mean age of 27.6 years, mean height of 174.3 cm and mean body mass of 73.2 kg) participated in the experiment. Subjects were instructed to sit on a rigid seat with a normal upright sitting posture, and their hands rested on their thighs. The stimuli were broadband random signals with a constant acceleration spectrum between 0.5 and 30 Hz with magnitudes at 0.4, 0.8 and 1.2 m/s2 r.m.s., and a duration of 60 s. During the modal test, each subject was exposed to single-axis vibration at the three magnitudes in the fore-aft, lateral and vertical direction, respectively (i.e. nine sets of tests in total). The coordinates and orientations of the eight accelerometers on the skin surface relative to the coordinate system of the six-axis motion simulator (shown in Figure 1) were measured and later used to draw the modal shapes of the body. This study was approved by the Ethics Committee at Zhejiang University (Number: 202,355). The experimental set-up and measurement locations in the modal test.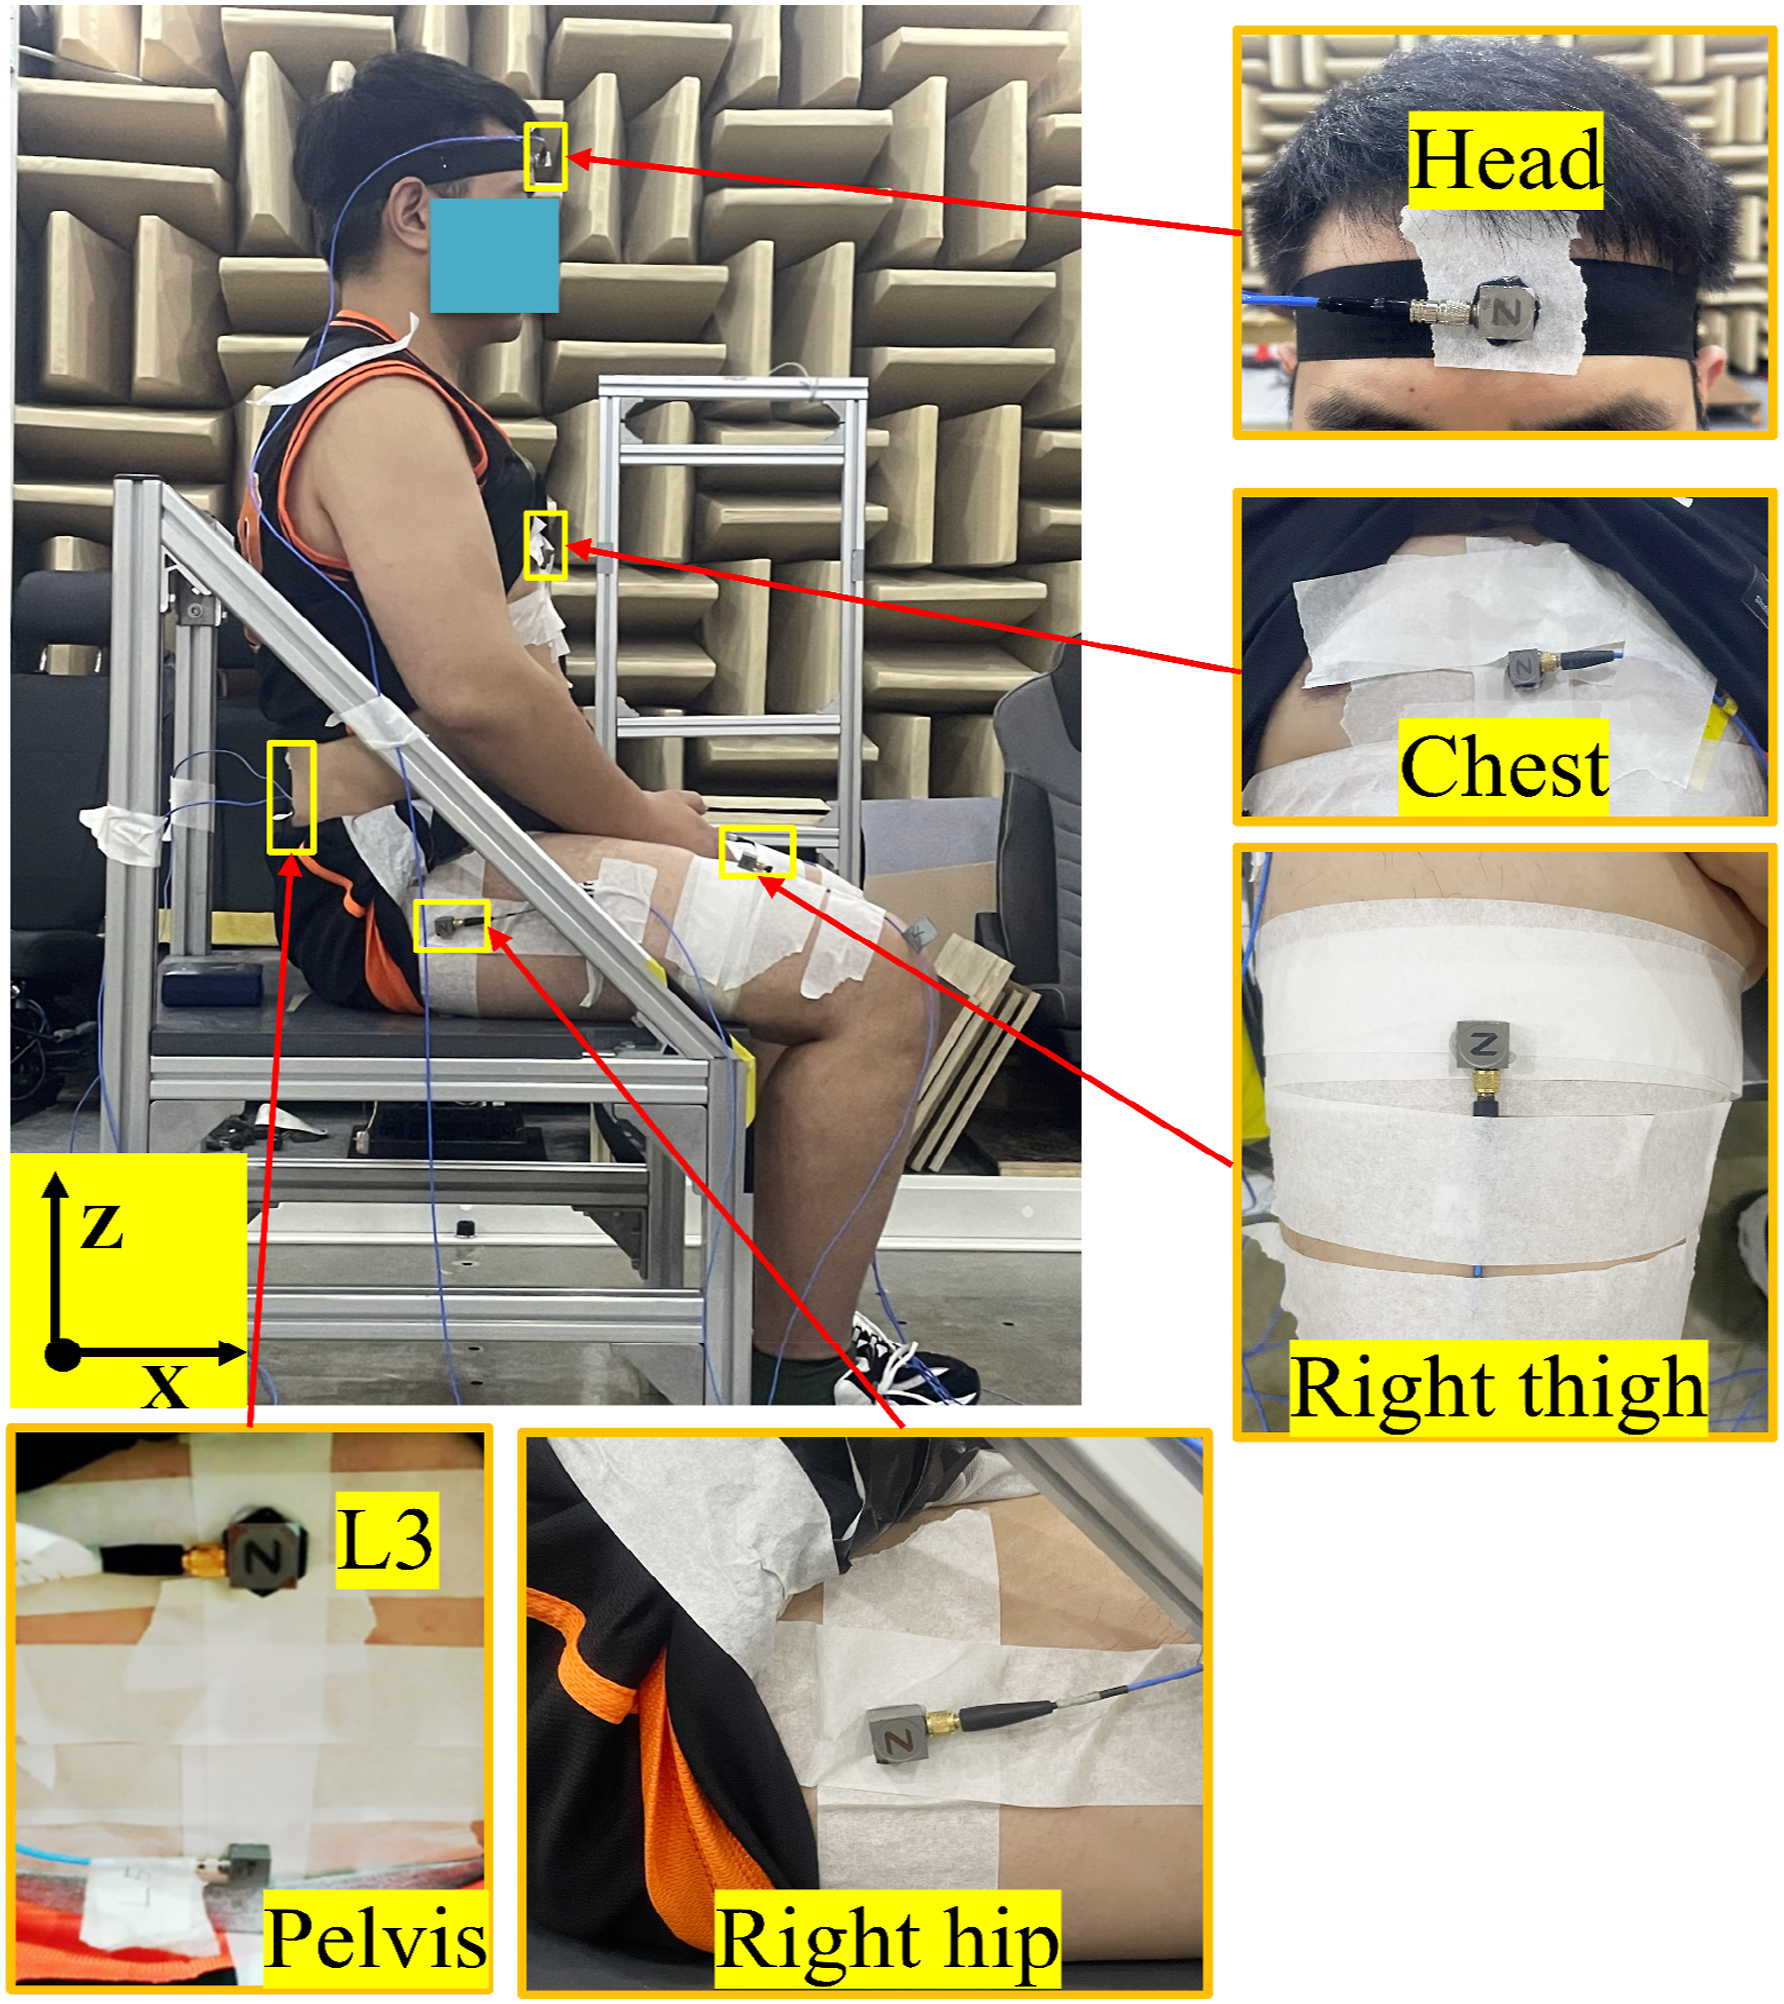
Apparatus
A rigid seat without a backrest was mounted on a six-axis motion simulator (Servotest, Zhejiang University). A tri-axial accelerometer (PCB) was mounted to the base of the rigid seat to measure the vibration input signals. Eight tri-axial accelerometers (PCB) were used to measure the accelerations at the forehead, chest (at the sternum), lumbar spine L3, pelvis, left and right hips, and left and right thighs of subjects, as shown in Figure 1. The locations of the accelerometers at the hips and thighs are symmetrical about the sagittal plane of the human body. Tape was attached to the skin and the accelerometers were glued to the top surface of the tape. A 40-channel LMS SCADAS SC305 W data acquisition system was used to record and store the acceleration signals with a sampling rate of 200 samples per second. Repeatability in the measured body transmissibilities was found to be reasonable in the preliminary tests.
Data analysis
The effect of inclination of the body surface on each accelerometer was removed using the measured angle θ. Assuming that

Body transmissibilities were calculated with a frequency resolution of 0.25 Hz. The PolyMAX algorithm was used to extract the vibration modes of the human body based on the measured transmissibilities, considering its suitability in the identification of vibration modes for dynamic systems with high damping and close modes. 27 More information on the theory of the algorithm and the procedure of the experimental modal analysis was introduced in Appendix A.
When the stable poles were selected and the modal parameters were estimated with the PolyMAX algorithm, the measured and synthesized body transmissibilities were compared to check the correctness of the estimated modal parameters. The synthesized transmissibilities
28


Wilcoxon signed-rank test and Friedman two-way analysis of variance were used to test the significance of the effect of vibration magnitude on the modulus and frequencies of the resonance in the transmissibility, as well as on the modal frequencies and damping ratios. They were calculated in MATLAB (MathWorks, 2023a) in the current study.
Results
Body transmissibilities with single-axis vibration
Transmissibility with fore-aft vibration
The in-line transmissibility during fore-aft vibration with three magnitudes (0.4, 0.8 and 1.2 m/s2 r.m.s, respectively) is shown in Figure 2. When exposed to the fore-aft vibration at the magnitude of 0.4 m/s2 r.m.s., the first and second resonance peaks were around 1.2 and 2.8 Hz, and could be found in the body transmissibilities to all the eight measurement locations. A third resonance peak around 4.8 Hz was present in the body transmissibilities to the L3, pelvis, hips and thighs but with a lower modulus. As the vibration magnitude increased from 0.4 to 1.2 m/s2 r.m.s., the effect of vibration magnitude on the transmissibilities varied between measurement locations and between resonances. For example, for the second resonance, among the measurement locations only the resonance frequencies in the transmissibilities to the hips and thighs were changed significantly by the increased vibration magnitude (Friedman, p < .022). The mean fore-aft in-line body transmissibilities from seat to the (a) head; (b) chest; (c) L3; (d) pelvis; (e) and (f) left and right hips, respectively; (g) and (h) left and right thighs, respectively, during fore-aft vibration excitation with three magnitudes.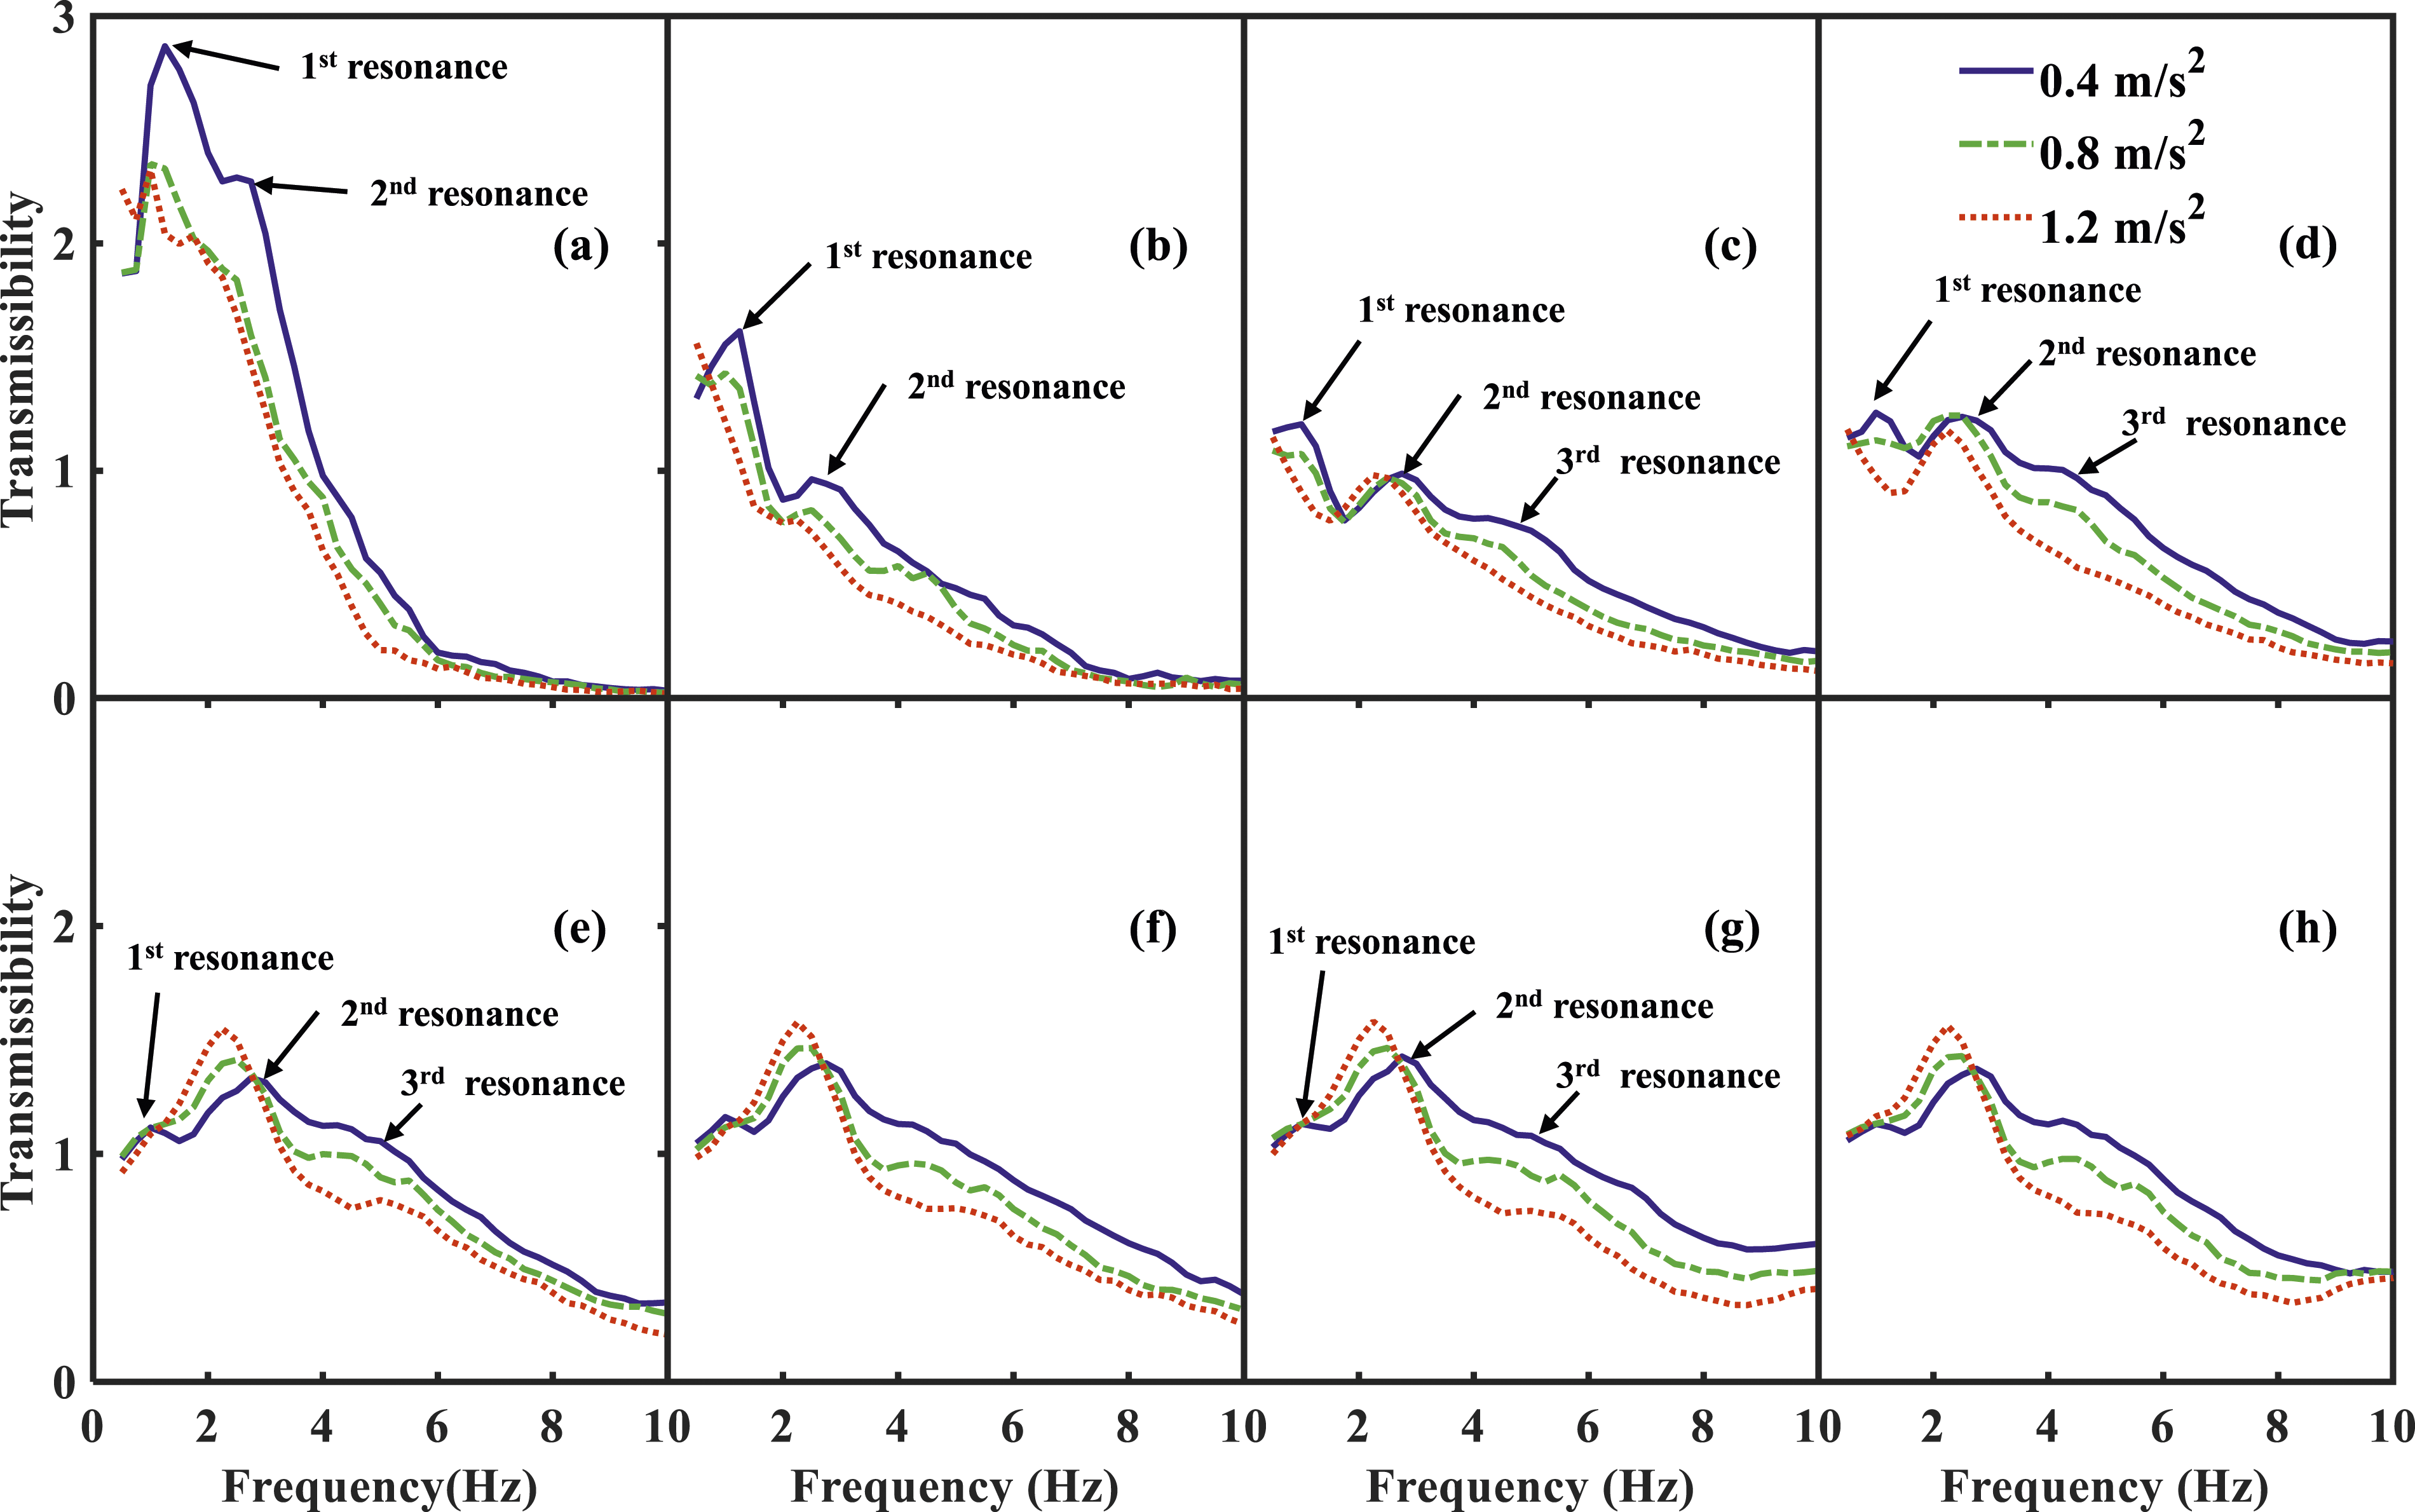
Transmissibility with lateral vibration
During lateral vibration at 0.4 m/s2 r.m.s., the first resonance was observed around 0.8 Hz in the lateral in-line transmissibility to the head, and the second peak was evident around 2.2 Hz at all the measurement locations (Figure 3). The third resonance with a broad peak was around 5.2 Hz and existed in the lateral transmissibilities to the L3, pelvis, hips and thighs. The frequencies of the first peak were not significantly changed by increased vibration magnitude (Friedman, p > 0.5). Decrease in the mean frequencies of the second resonance (from 2.2 to 1.5 Hz) was present in all the lateral transmissibilities, but the statistical difference was only found for the hips (Friedman, p < 0.018). For the third resonance around 5.2 Hz, significant decrease in the resonance frequencies was only observed in the transmissibilities to the L3 and pelvis (Friedman, p < 0.032). The mean lateral in-line body transmissibilities from seat to the (a) head; (b) chest; (c) L3; (d) pelvis; (e) and (f) left and right hips, respectively; (g) and (h) left and right thighs, respectively, during lateral vibration excitation with three magnitudes.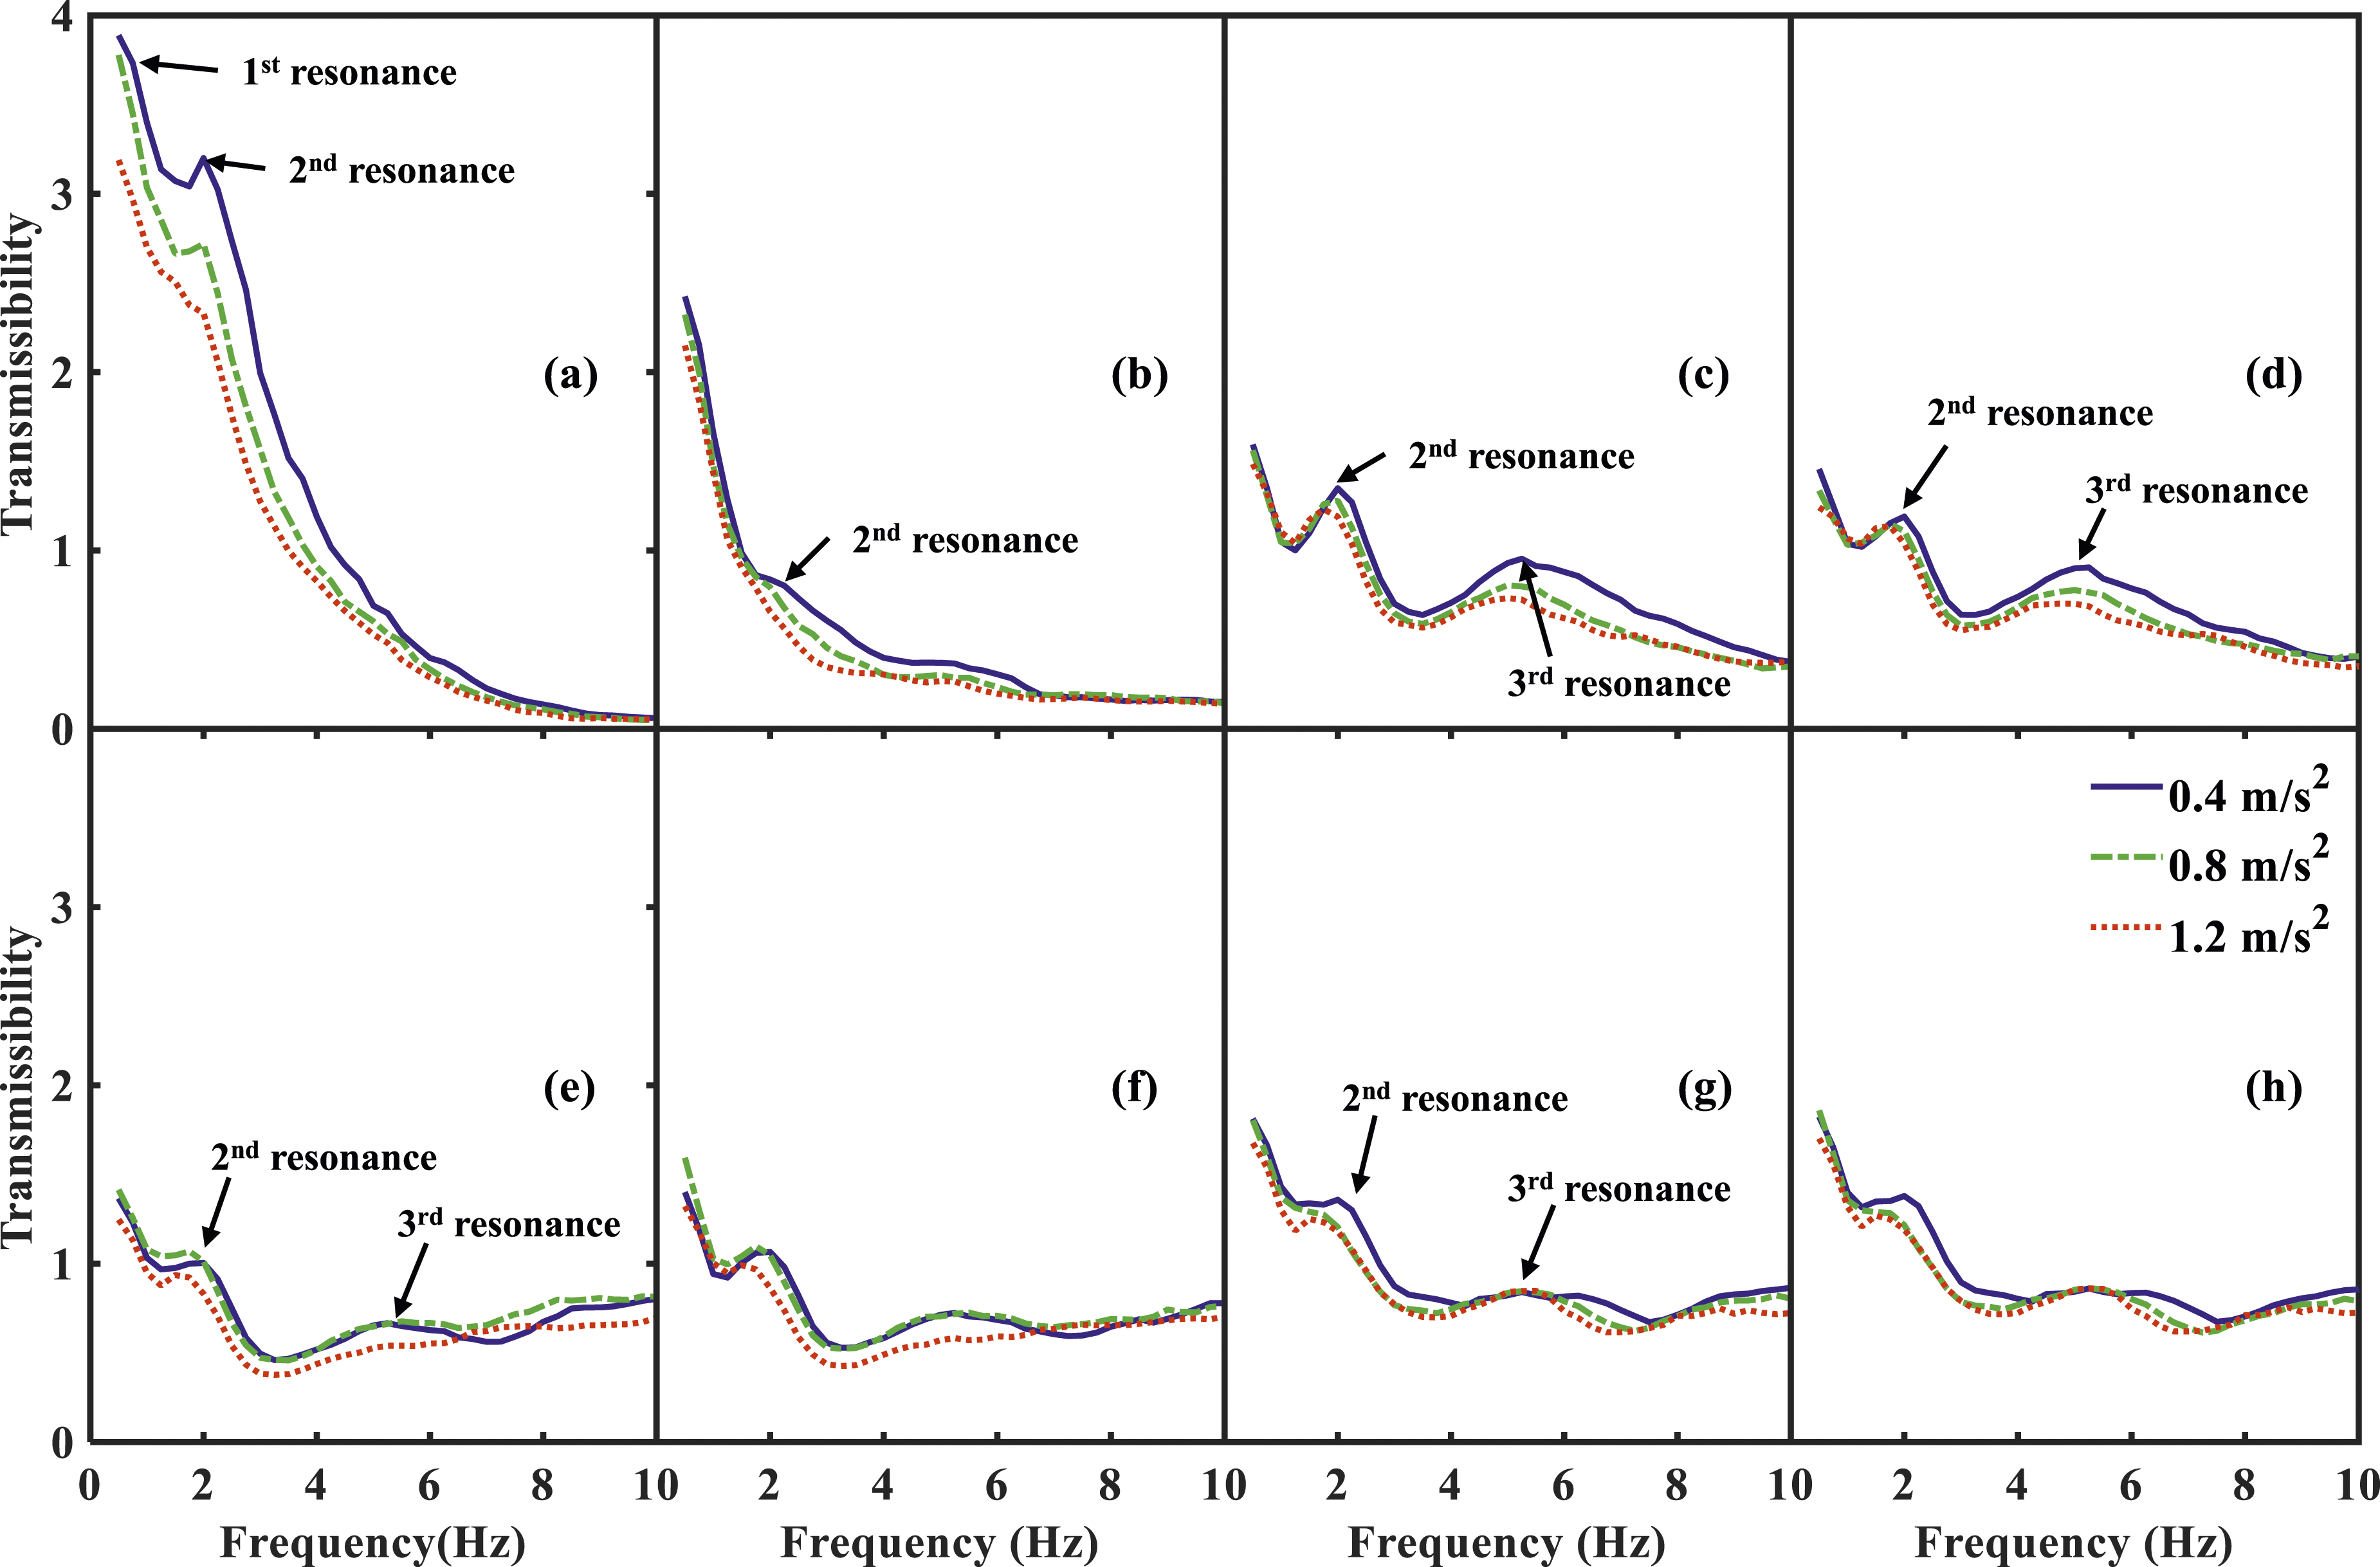
Transmissibility with vertical vibration
When exposed to vertical vibration, a resonance around 2.3 Hz was found in the in-line transmissibility to the head (Figure 4), without significant decrease as the vibration magnitude increased (Friedman, p > .396). A clear resonance around 5.8 Hz can be observed in the transmissibilities to the head, chest, lumbar spine L3 and pelvis in this study, and the corresponding resonance frequencies in the transmissibilities were significantly decreased by the increased vibration magnitude (Friedman, p < 0.042). The third resonance around 7.9 Hz was present in the transmissibilities to the thighs, while the fourth resonance with a mean frequency around 10.8 Hz was found to the locations below the chest. The frequencies of the third and fourth resonances in the vertical transmissibilities were not significantly reduced by the increased vibration magnitude (Friedman, p > .075). The mean vertical in-line body transmissibilities from seat to the (a) head; (b) chest; (c) L3; (d) pelvis; (e) and (f) left and right hips, respectively; (g) and (h) left and right thighs, respectively, during vertical vibration excitation with three magnitudes.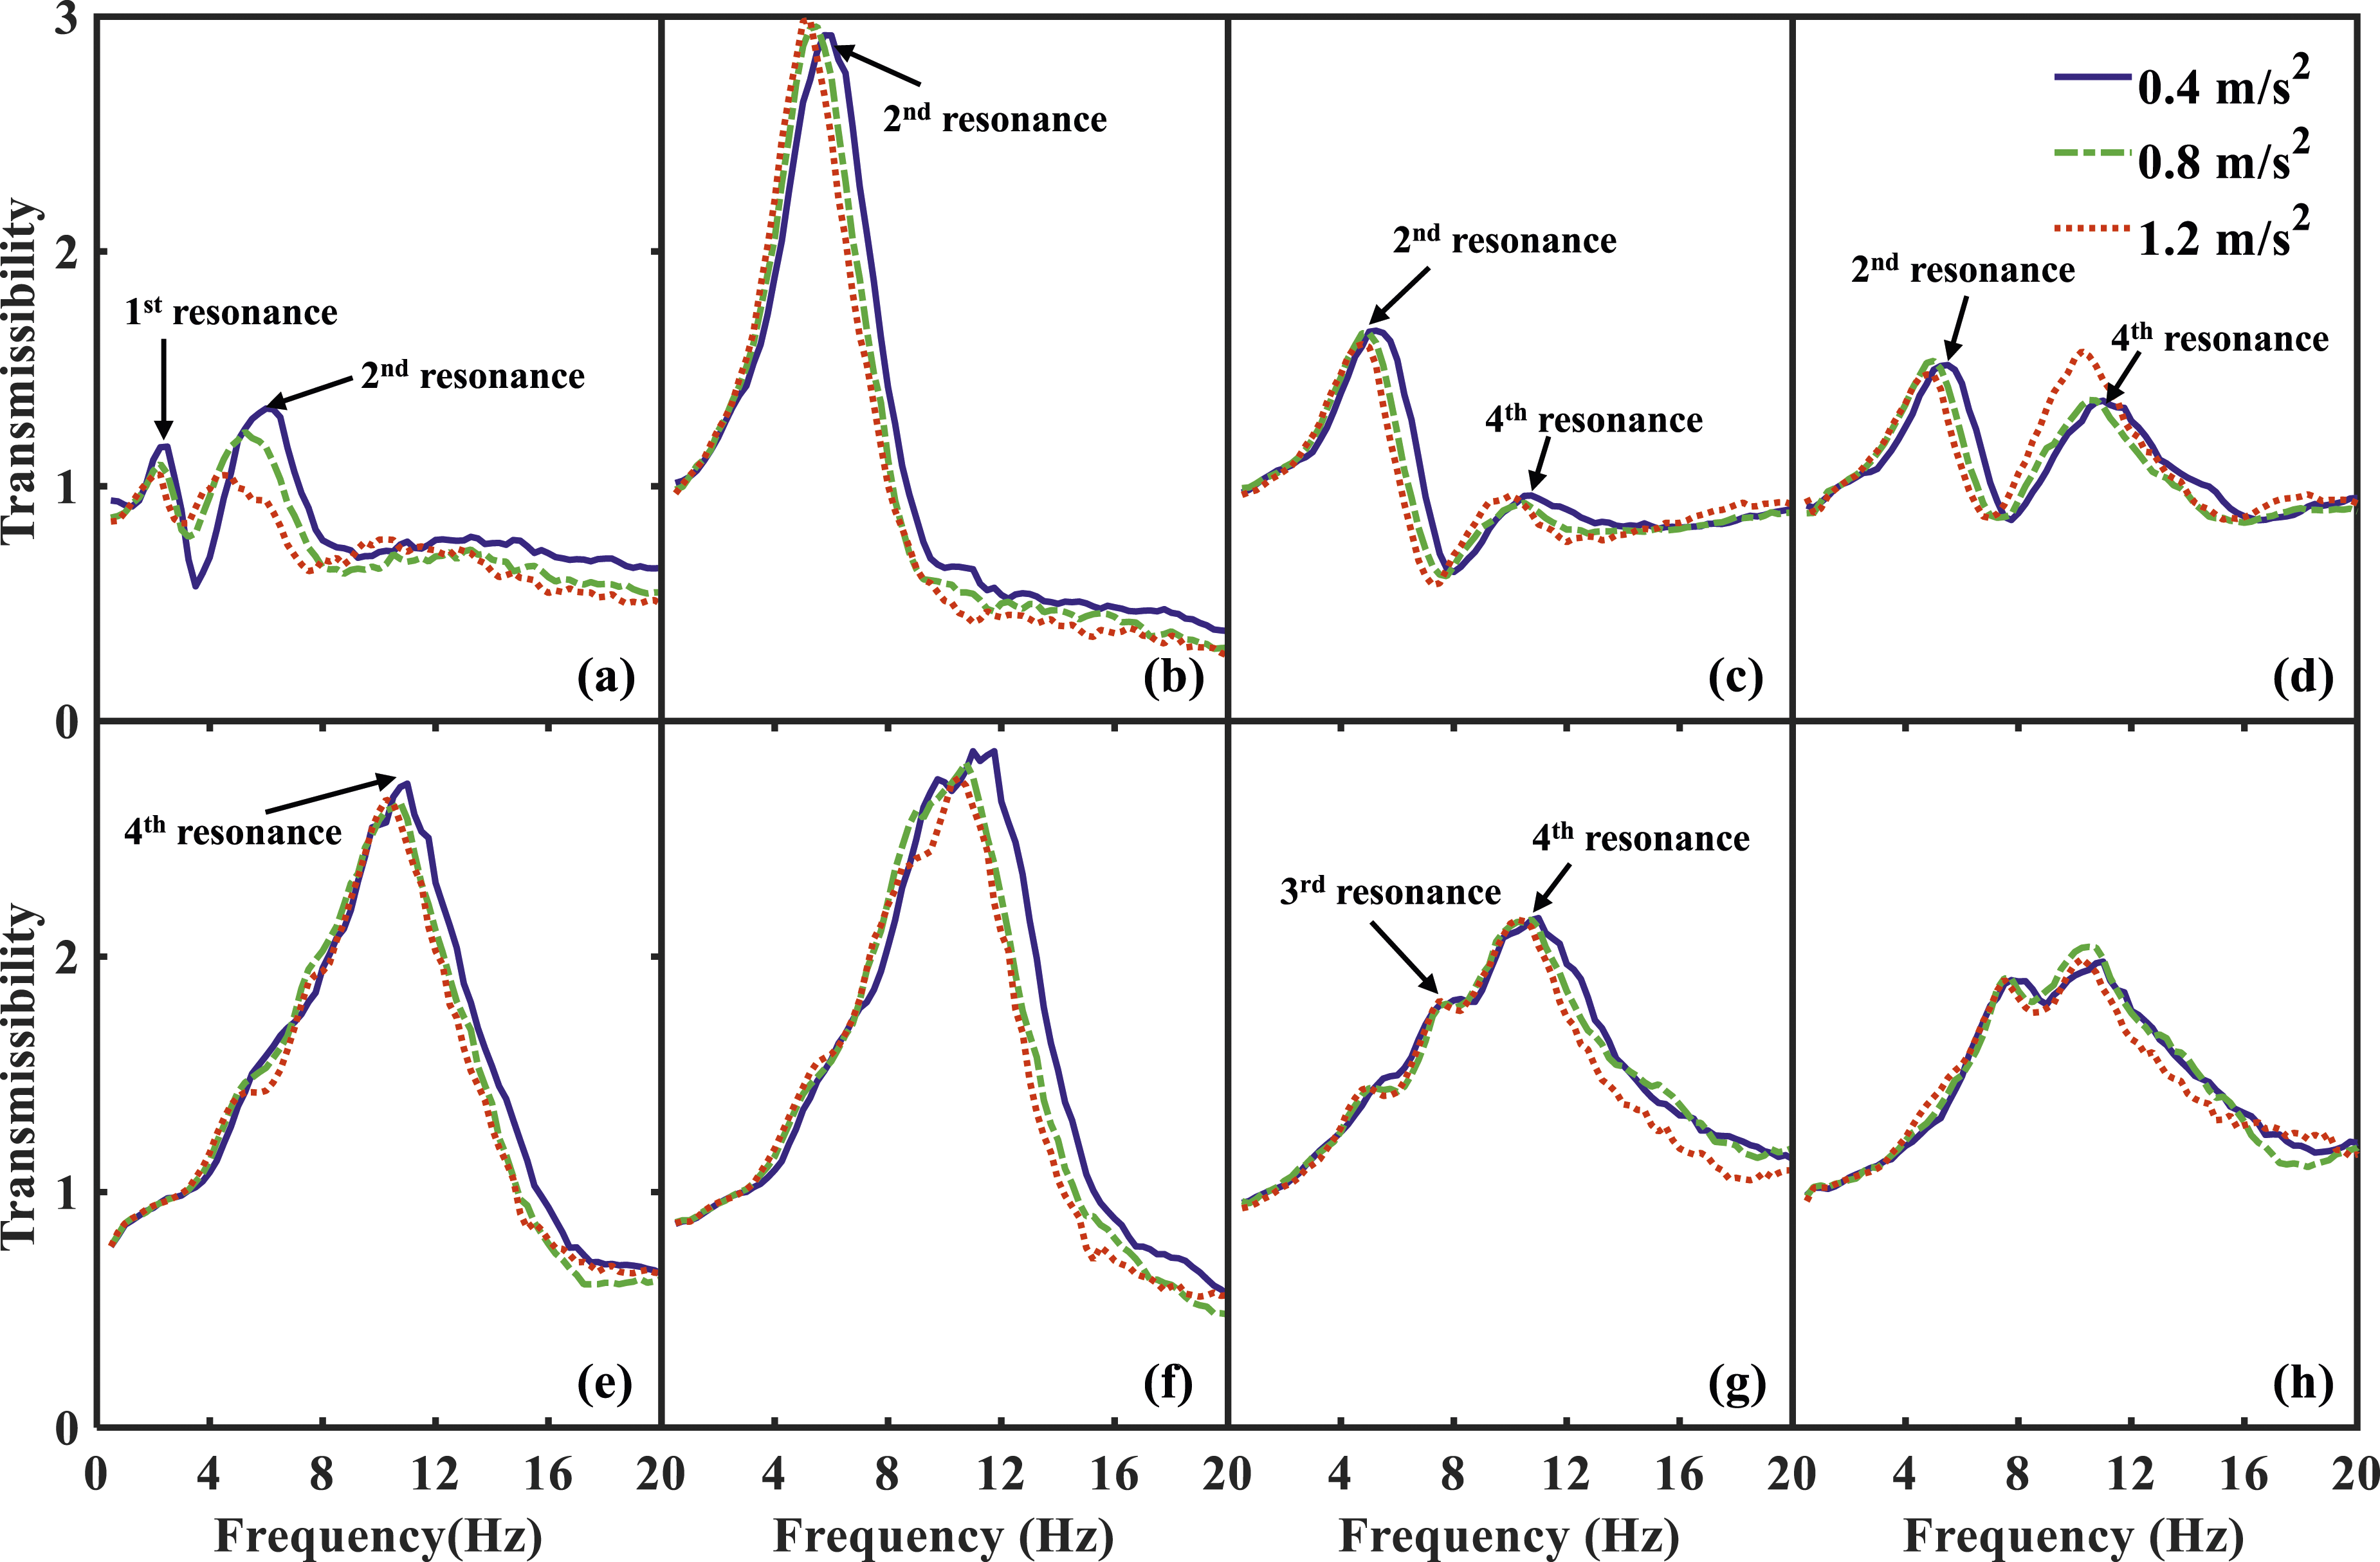
Modal parameters of the seated human body
With fore-aft vibration excitation
The in-line and cross-axis transmissibilities to the head, chest, L3, pelvis, left and right hips and left and right thighs were used to identify the modal parameters of the human body. The mean real modal vectors of the eight subjects at each mode, which were associated with the eight measurement locations on the body, were calculated and used to draw the mean modal shapes. The measured and synthesized fore-aft transmissibilities for one subject exposed to fore-aft vibration at 0.8 m/s2 r.m.s. are shown in Figure 5 as an example. For all the transmissibilities with all the three vibration magnitudes used in the current study, the correlation between measured and synthesized transmissibilities, calculated with equation (3), was greater than 0.87, indicating reasonable identification of the modal parameters. Comparison of the measured and synthesized fore-aft transmissibilities of one subject exposed to fore-aft vibration at 0.8 m/s2 r.m.s.: (a) to the head (b) to the chest; (c) to the L3; (d) to the pelvis; (e) to the left hips; (f) to the left thigh – measured transmissibility; ‐‐‐ synthesized transmissibility. Cor is the correlation calculated using equation (3).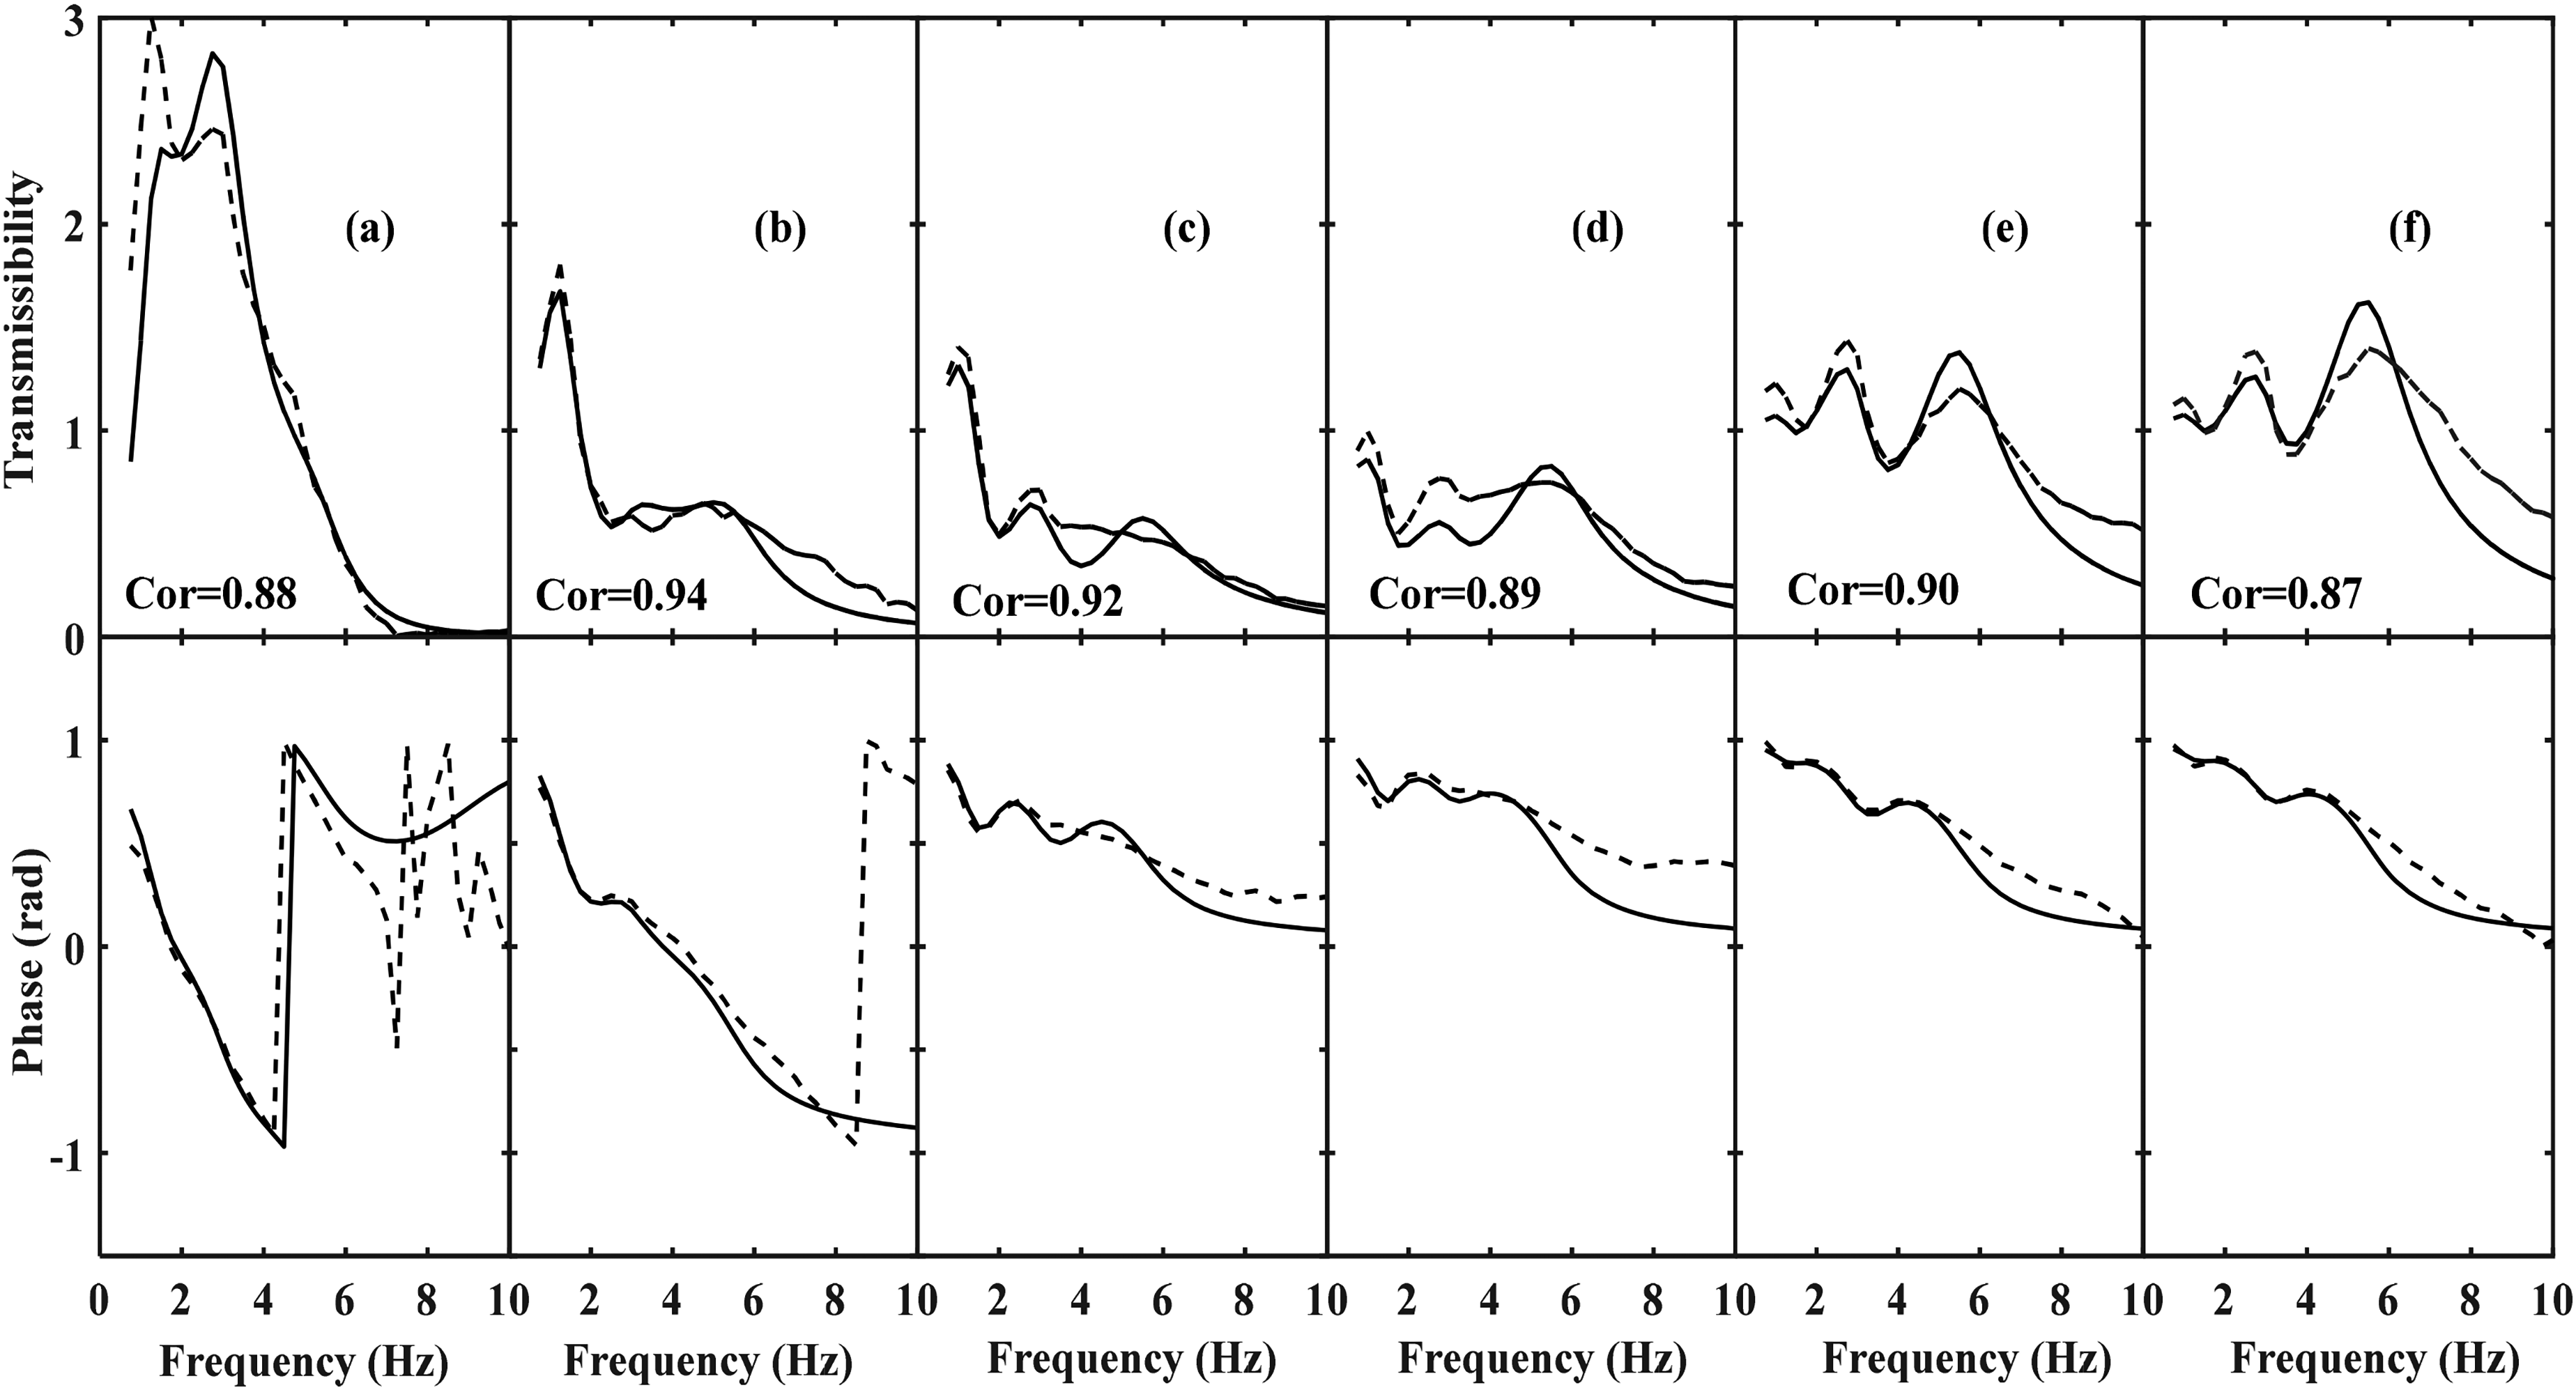
Three vibration modes with the mean modal frequencies at about 1.2, 2.9 and 4.7 Hz were identified with fore-aft vibration excitation at the magnitude of 0.4 m/s2 r.m.s., and the corresponding modal frequencies and shapes are shown in Figure 6. The first mode around 1.2 Hz appeared to be the pitch motion of the upper body. The second mode at about 2.9 Hz contained the out-of-phase movements between the upper thoracic spine and lower body (i.e. buttocks and thighs) in the fore-aft direction. The third mode around 4.7 Hz seemed to contain the upper body bending along with the pitch of the pelvis, as well as the vertical and fore-aft motion of the lower body due to axial and shear deformation of the soft tissue beneath the buttocks and thighs. The mean modal shapes identified with fore-aft vibration excitation at 0.4 m/s2 r.m.s: – deformed modal shape; ‐‐‐ initial body contour; The sagittal plane is from the right view, and the coronal plane is from the front view. ‘X1’ to ‘X3’ represent the first to third modes identified with fore-aft vibration.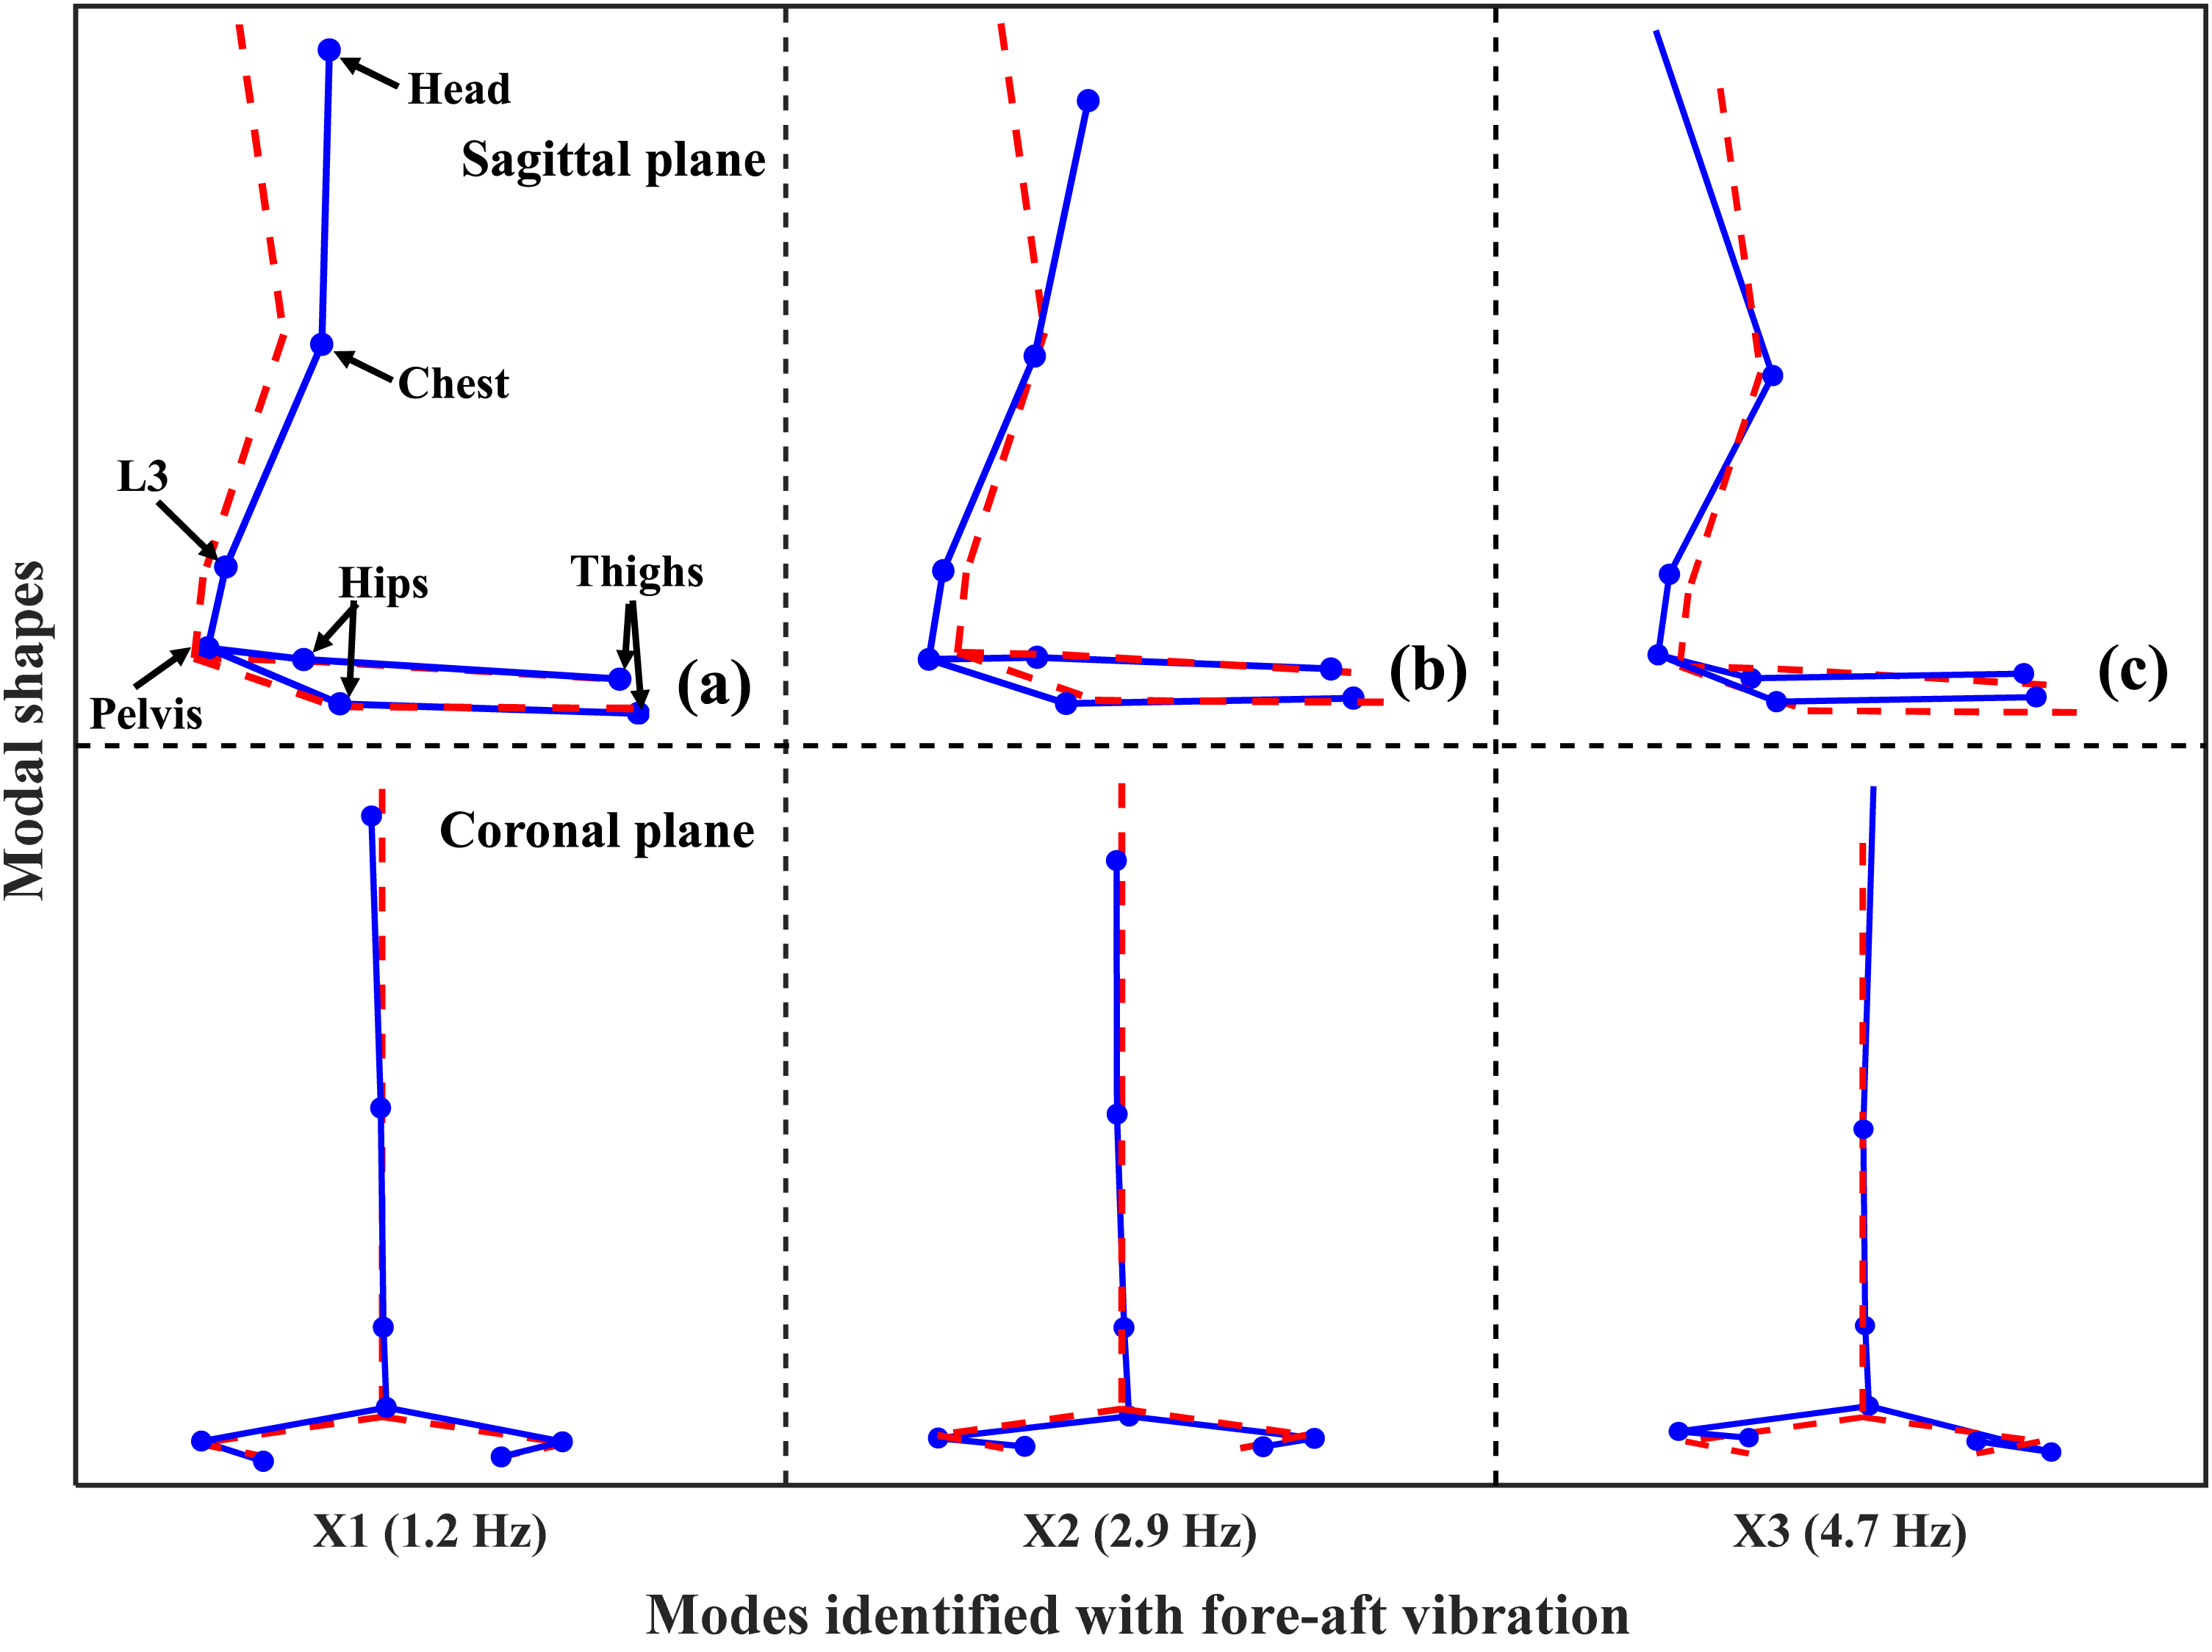
With lateral vibration excitation
Three vibration modes were identified during lateral vibration excitation at 0.4 m/s2 r.m.s., with body movements in the coronal plane (Figure 7). The first mode was at about 0.8 Hz featuring the sway motion of the entire upper body. The second mode at about 2.2 Hz characterized the lateral movement of the lower body with the out-of-phase movement of the head. The deformation of the spine at the third mode around 5.2 Hz was dominated by the second-order lateral bending. Furthermore, lateral movements could be observed at the hips and thighs, along with the out-of-phase in the vertical direction, respectively, which formed the roll of the hips and thighs around x-axis. The mean modal shapes identified with lateral vibration excitation at 0.4 m/s2 r.m.s.: – deformed modal shape; ‐‐‐ initial body contour; The sagittal plane is from the right view, and the coronal plane is from the front view. ‘Y1’ to ‘Y3’ represent the first to third modes identified with lateral vibration.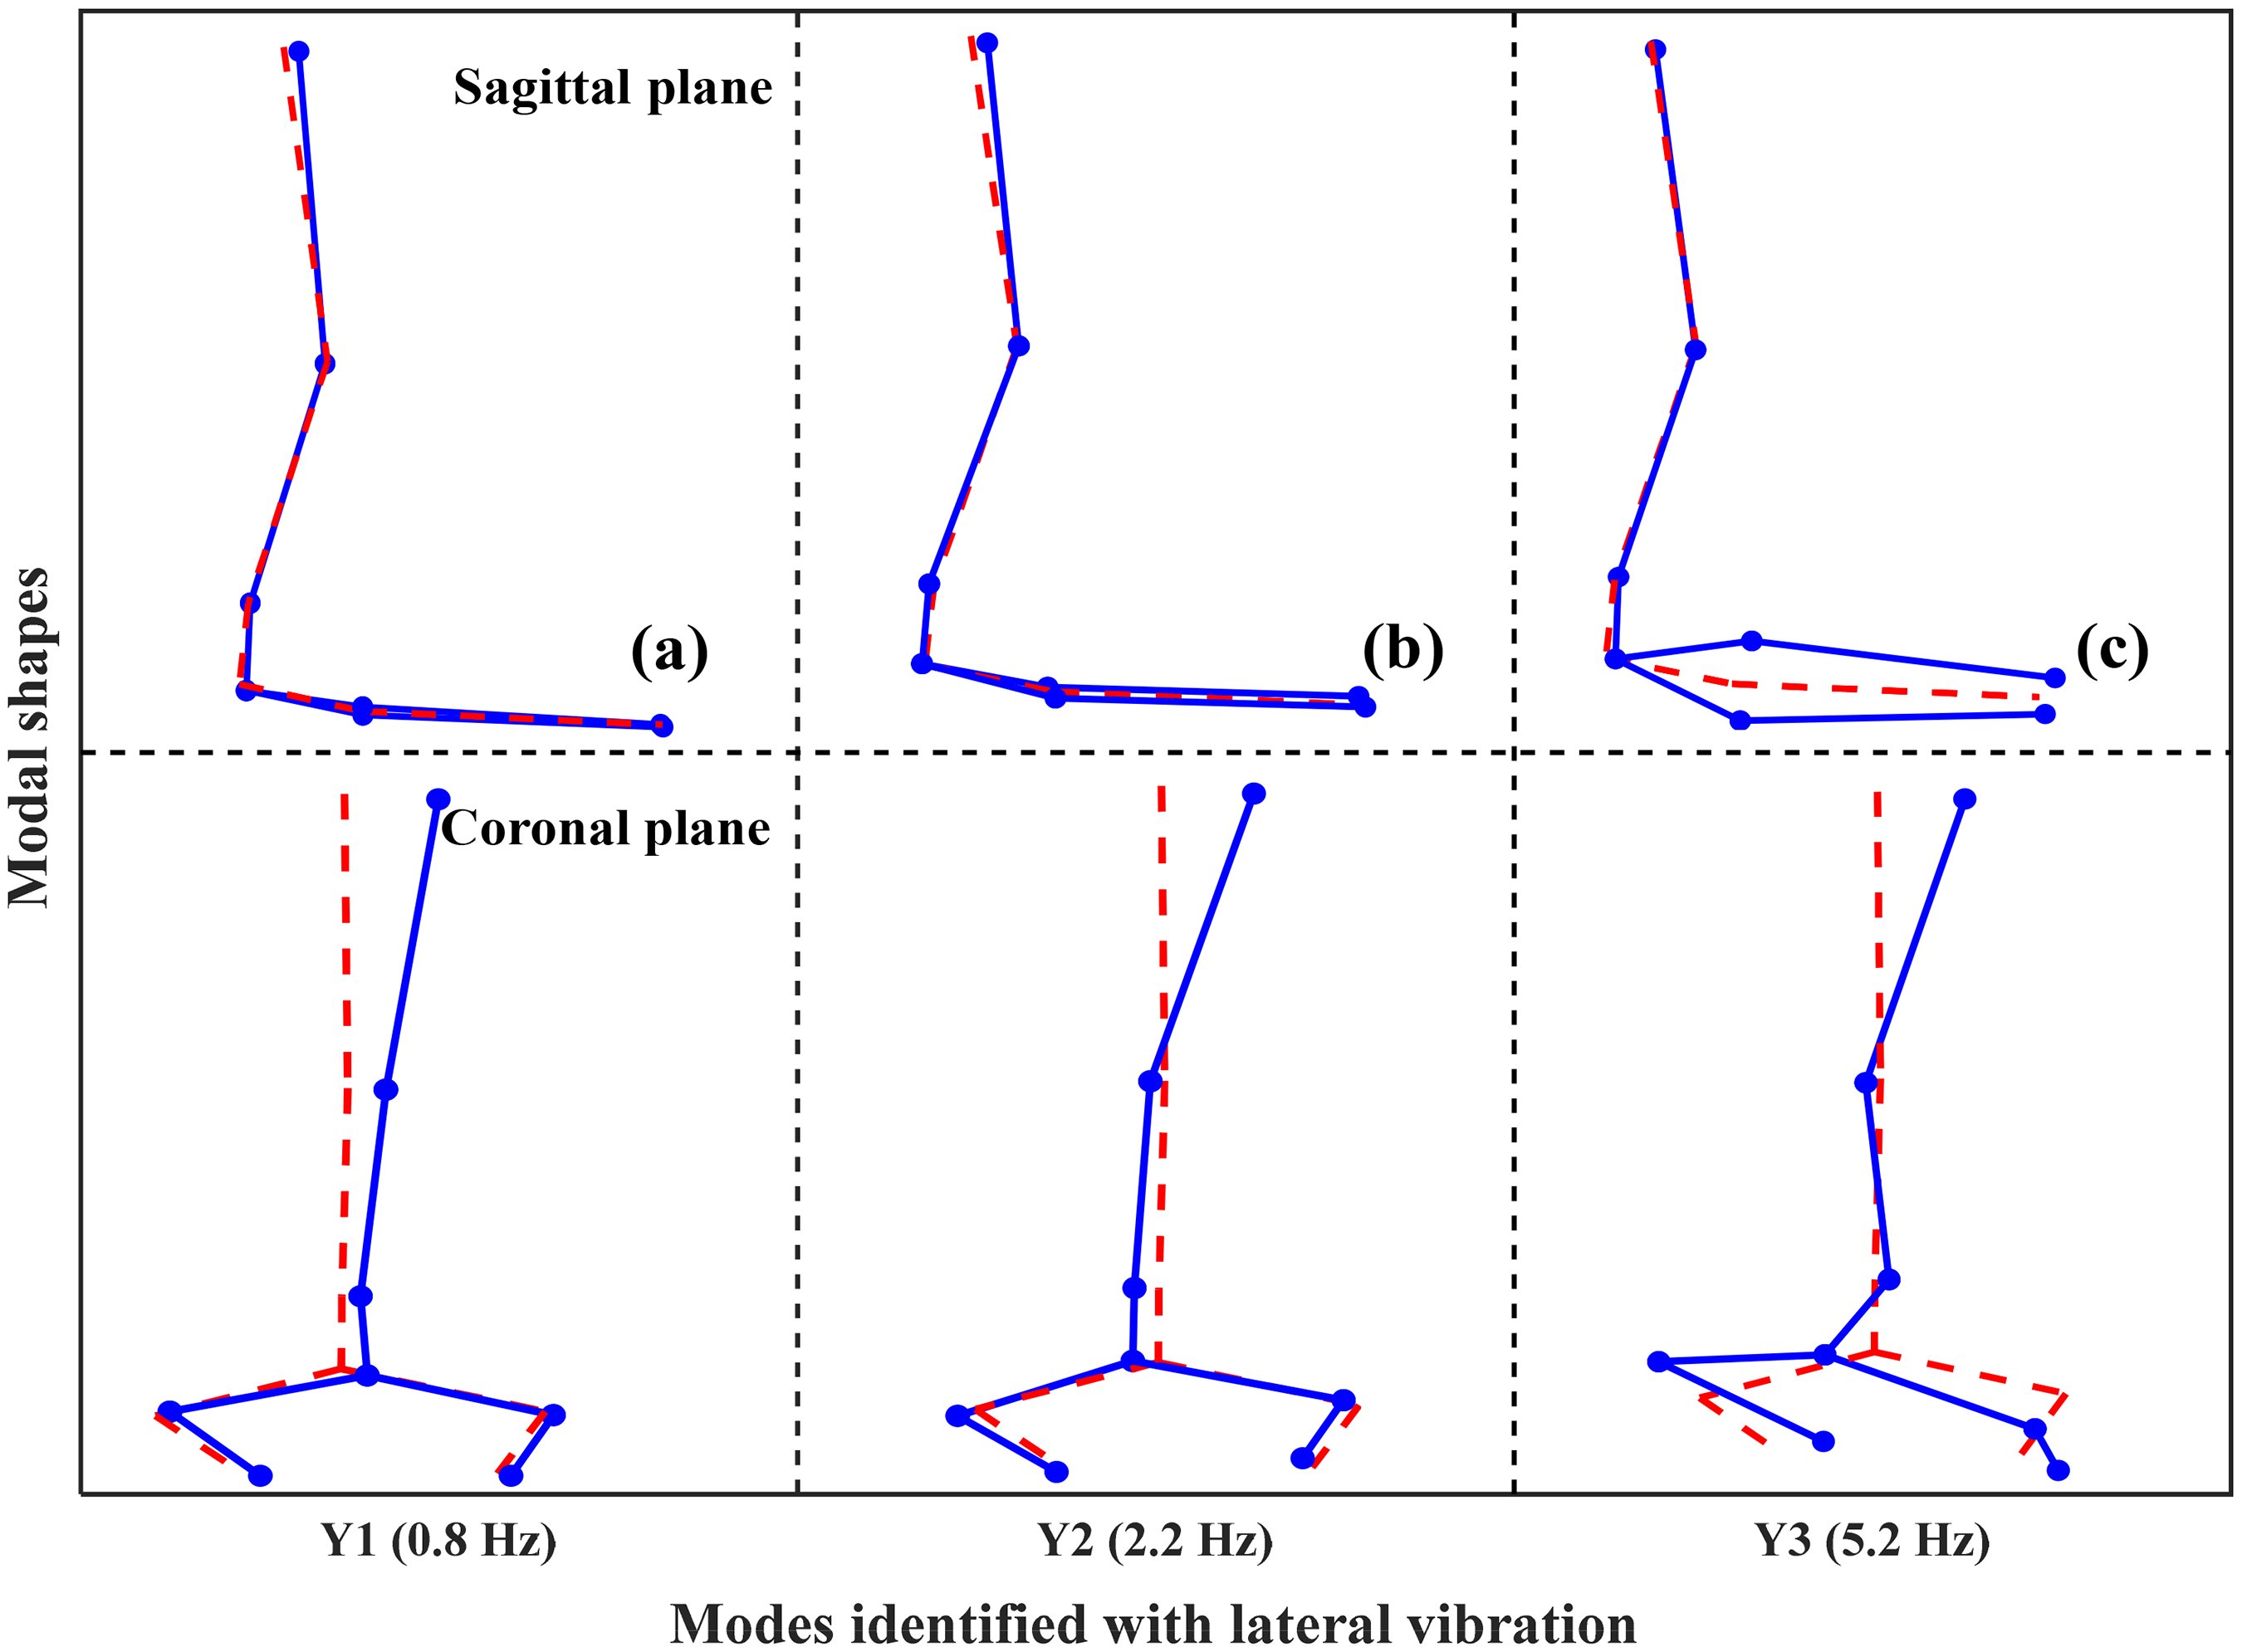
With vertical vibration excitation
Five modes were identified at about 2.7, 4.9, 6.2, 8.6 and 10.9 Hz during vertical vibration at 0.4 m/s2 r.m.s. (Figure 8). The first mode around 2.7 Hz featured the fore-aft vibration of the body but the head was moving out of phase with the other measurement locations. The second mode around 4.9 Hz was the bending of the spine with fore-aft and vertical movements of the lower body. The third mode around 6.2 Hz was dominated by the vertical vibration of the whole body in phase with pitch of the pelvis and upper thoracic spine, and fore-aft motion could also be seen in the lower body caused by the shear deformation of the soft tissue beneath the buttocks and thighs. The modal shapes of the fourth and fifth modes around 8.6 and 10.9 Hz both involved the vertical motion of the hips and thighs in phase with a pitch of the pelvis, while the fourth mode also contained bending of the lumbar spine. The mean modal shapes identified with vertical vibration excitation at 0.4 m/s2 r.m.s.: – deformed modal shape; ‐‐‐ initial body contour; The sagittal plane is from the right view, and the coronal plane is from the front view. ‘Z1’ to ‘Z5’ represent the first to fifth modes identified with vertical vibration.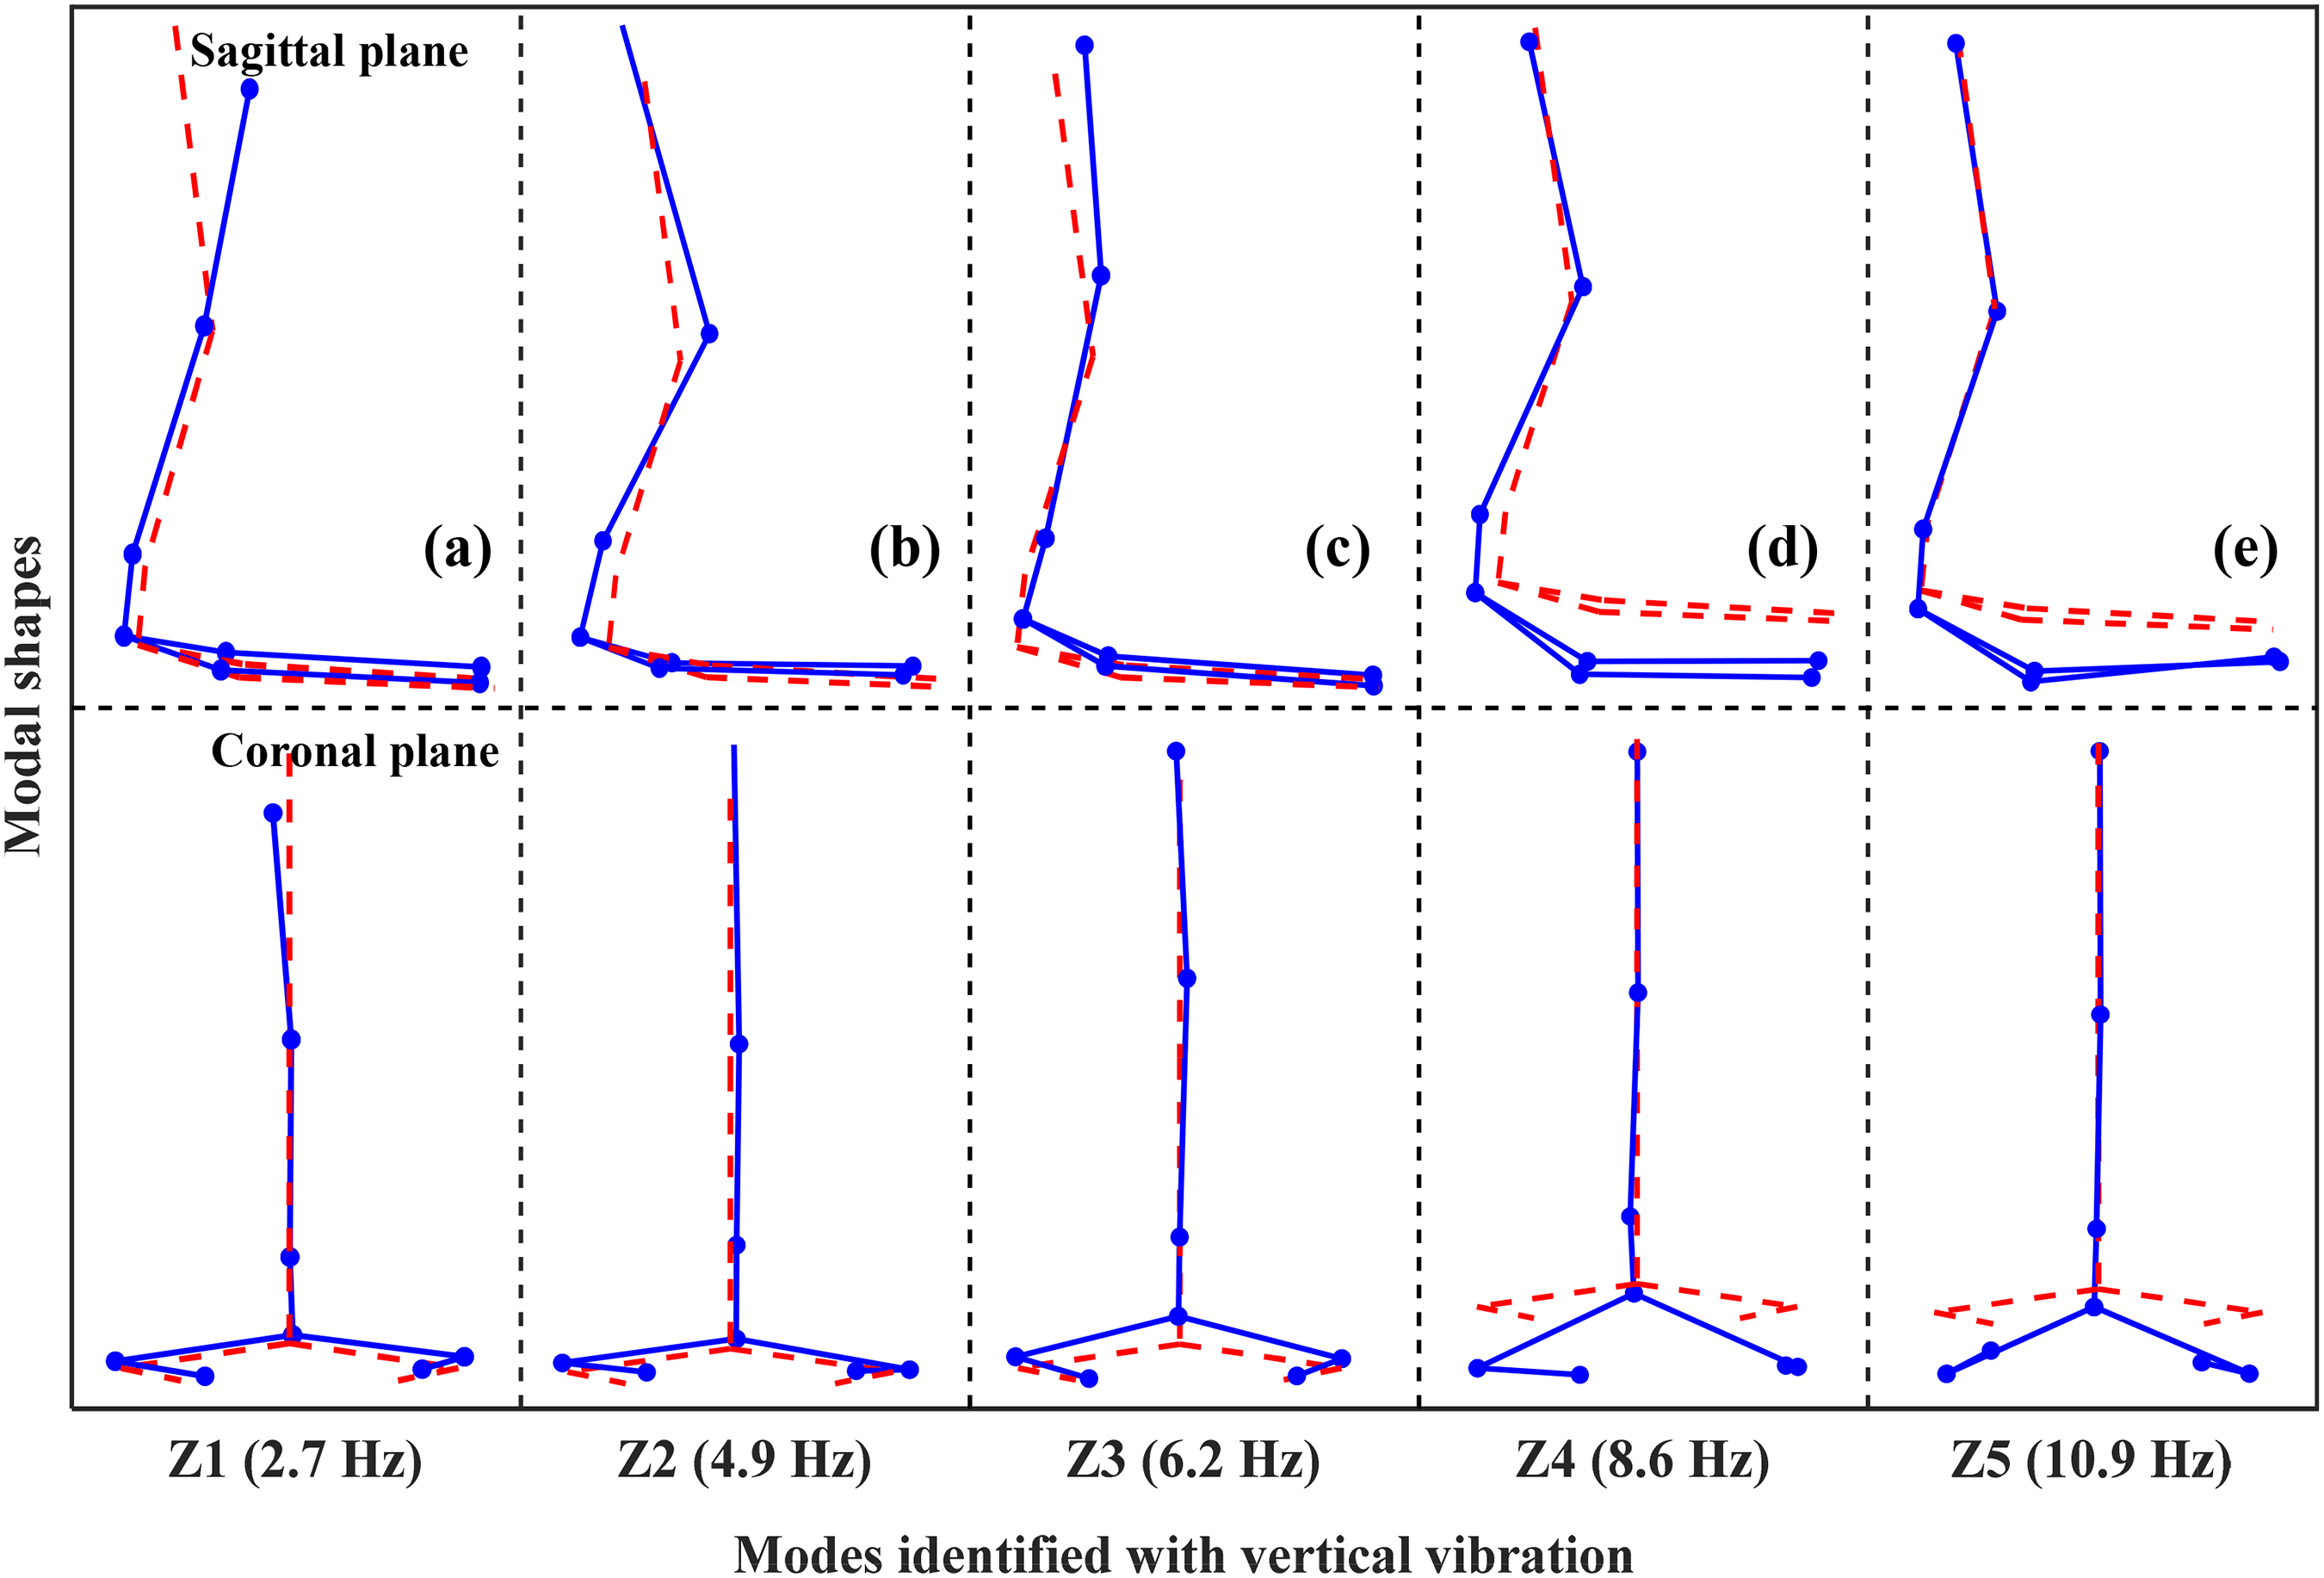
Effect of vibration magnitude on modal parameters
Effect of vibration magnitude on modal frequencies
The mean modal frequencies of the eight subjects measured with fore-aft, lateral and vertical single-axis vibrations at three magnitudes are shown in Figure 9. With the fore-aft vibration magnitude increasing from 0.4 to 1.2 m/s2 r.m.s., the modal frequencies of the first two modes decreased from 1.2 to 1.0 Hz (Friedman, p = 0.009) and from 2.9 to 2.3 Hz (Friedman, p = 0.001), respectively. The mean modal frequency of the third mode decreased from 4.7 to 4.0 Hz, however, without a significant difference (Friedman, p = 0.097). For the three modes with lateral vibration, only the modal frequency of the second mode decreased significantly from 2.2 to 1.8 Hz (Friedman, p = 0.02) with the increase of vibration magnitude. No significant change was noticed in the frequency of the first or the third mode with increasing vibration magnitude (Friedman, p > 0.05). When exposed to vertical vibration, the mean modal frequencies of the first and last three modes decreased with increased vibration magnitude, however, significant difference was only observed for the third mode (Friedman, p = 0.006). Effect of vibration magnitude on the modal frequencies of the human body: ‘X1’ to ‘X3’ were the first to third modes identified with fore-aft vibration, ‘Y1’ to ‘Y3’ with lateral vibration, ‘Z1’ to ‘Z5’ with vertical vibration. *: p < .05; **: p < .01; ***: p < .005; ****: p < .001; NA: p > .05.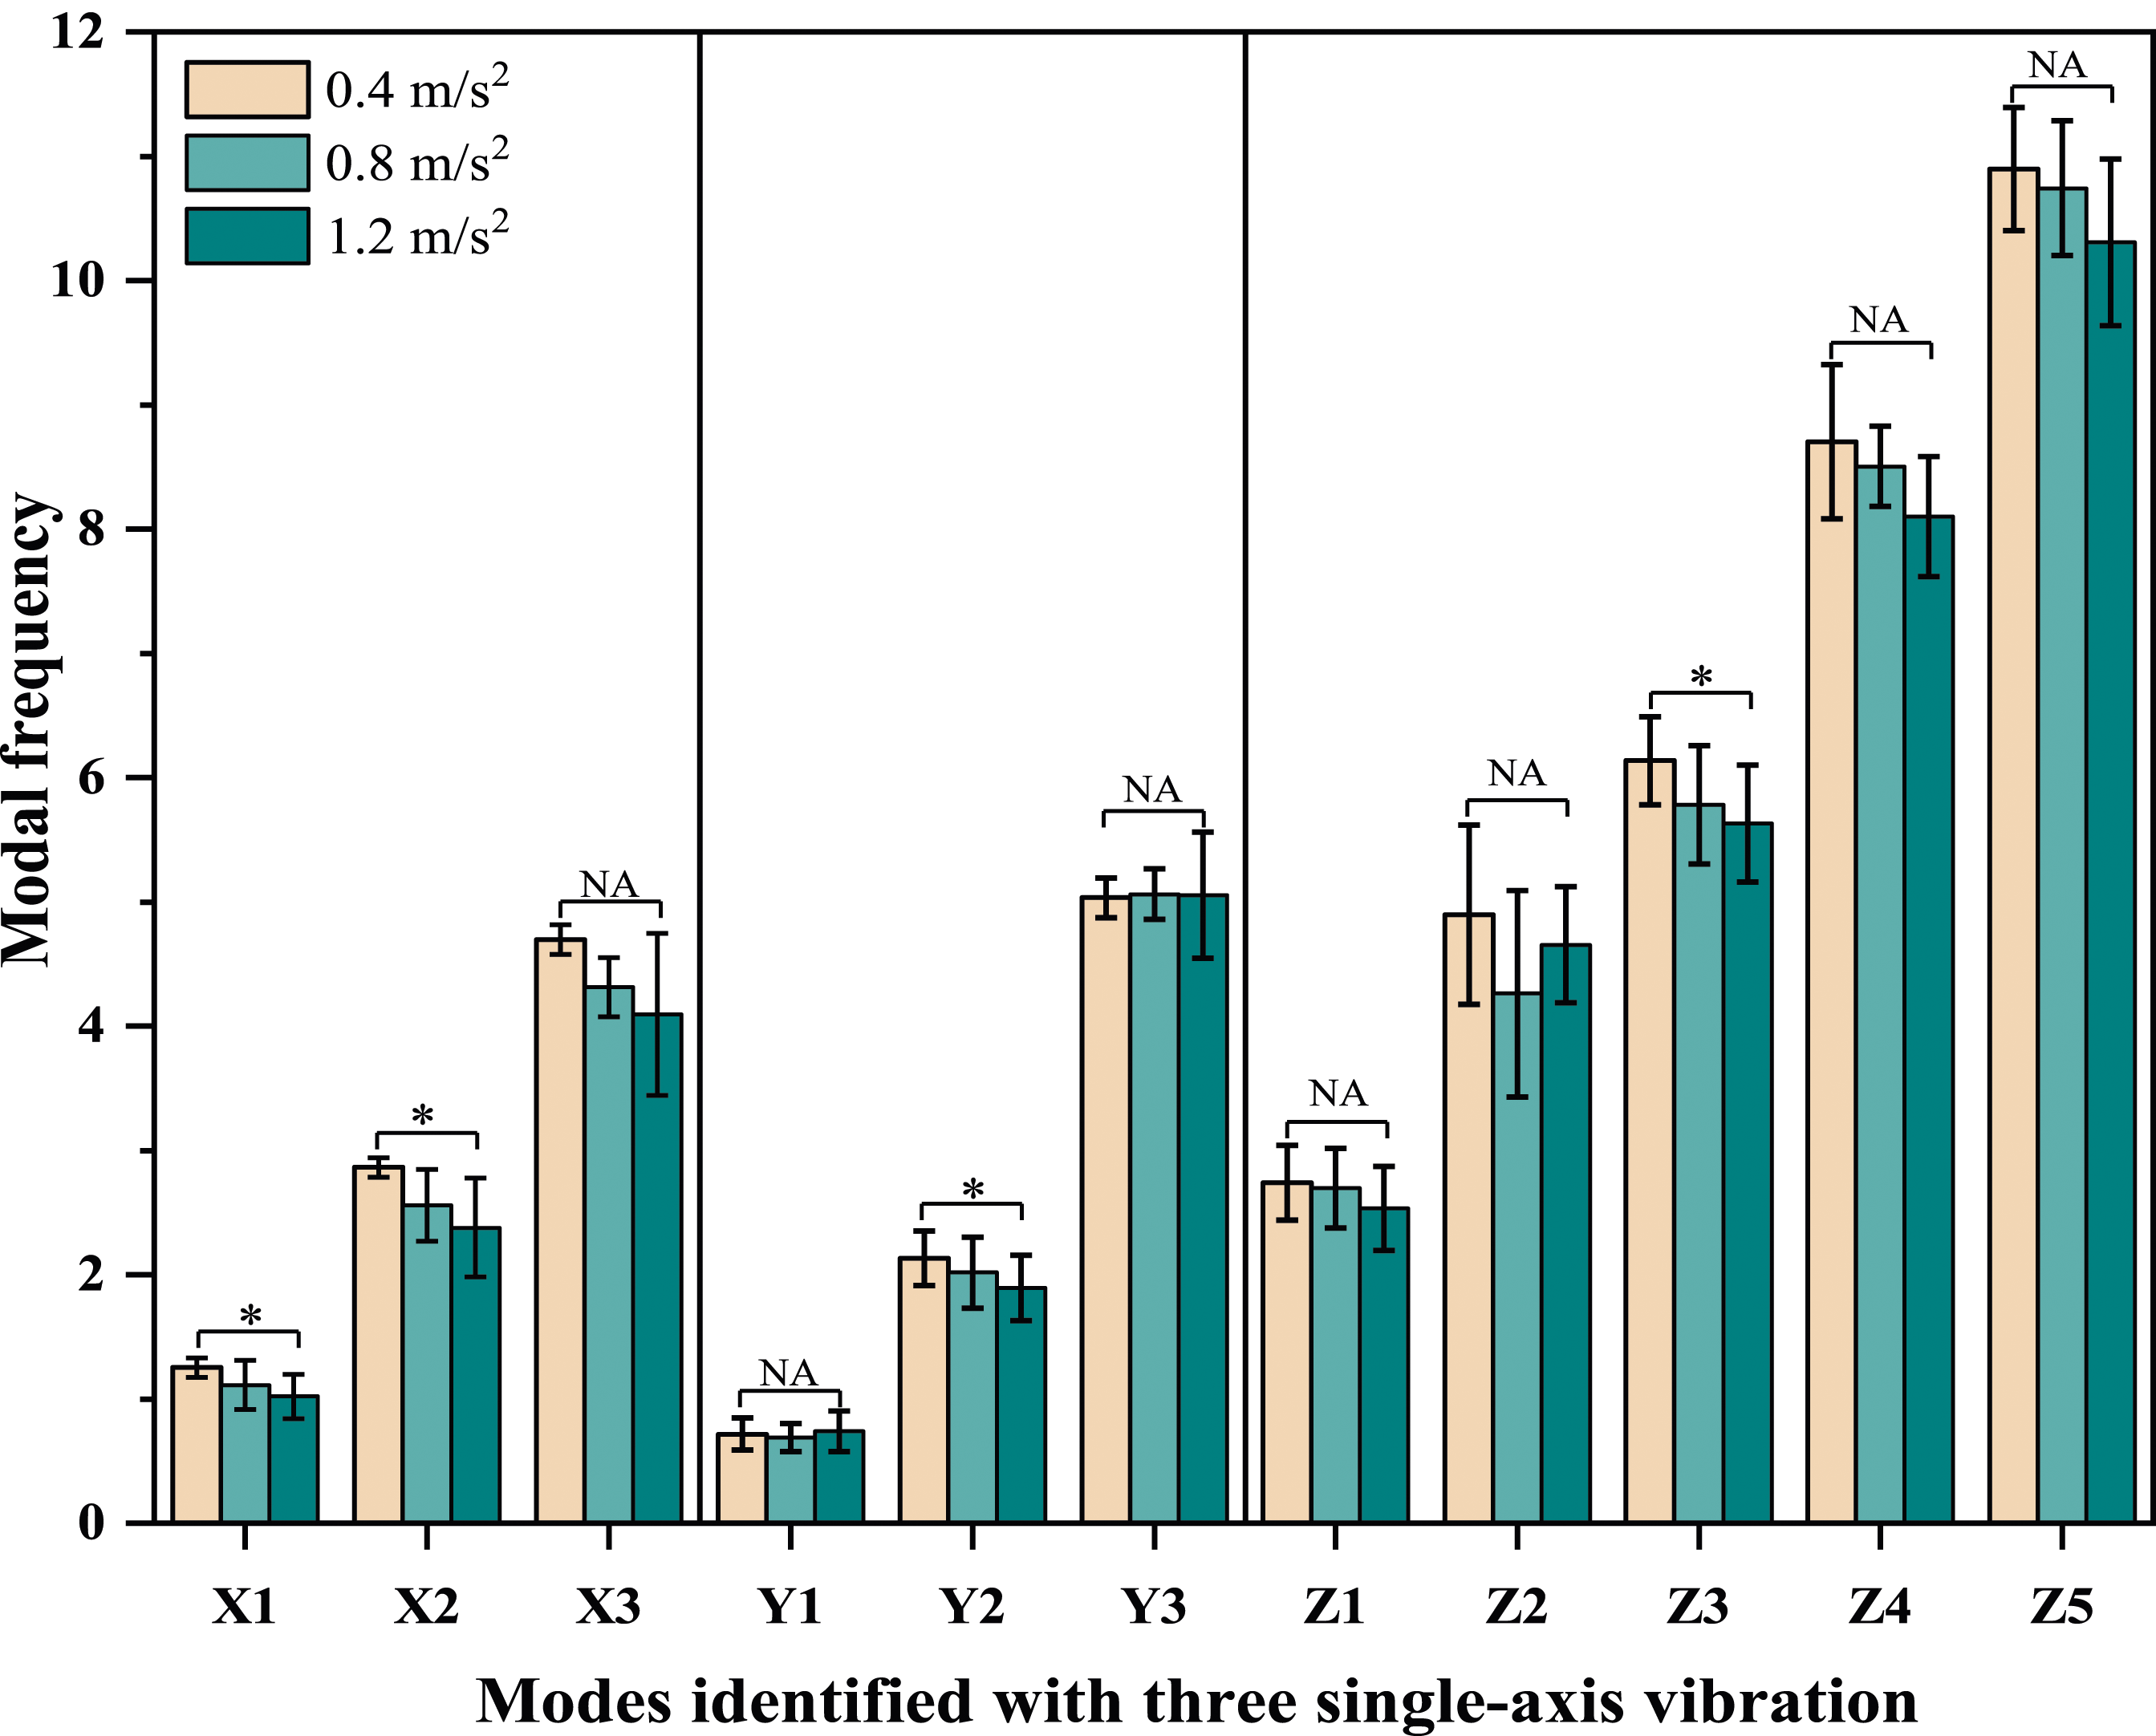
Effect of vibration magnitude on modal damping ratios
The modal damping ratios measured with three single-axis vibrations at the three magnitudes are shown in Figure 10. The damping ratios with higher order modes seemed to be lower than those with lower order at the same vibration magnitude. During fore-aft vibration, with increasing vibration magnitude, the change in the modal damping ratios was inconsistent at the first and third modes, while there was no significant difference in the modal damping ratio for any of the three modes (Friedman, p > 0.1). As the lateral vibration magnitude increased from 0.4 to 1.2 m/s2 r.m.s., the mean modal damping ratios of the first and third modes decreased from 0.39 to 0.36, and from 0.24 to 0.12, respectively, both with significant differences (Friedman, p < 0.031). The mean damping ratio of the second mode tended to increase from 0.26 to 0.31 but with no significant change with the three magnitudes (Friedman, p = 0.42). During vertical vibration, the effect of vibration magnitude on the modal damping ratio differed between modes, and only the modal damping ratio of the fifth mode was significantly increased from 0.11 to 0.14 with increased vibration magnitudes (Friedman, p = 0.04). The mean damping ratio at the first mode was reduced when the magnitude increased from 0.4 to 0.8 m/s2 r.m.s., while increased as the magnitude changed from 0.8 to 1.2 m/s2 r.m.s. (Wilcoxon, p < 0.026). Effect of vibration magnitude on the modal damping ratios of the human body: ‘X1’ to ‘X3’ were the first to third modes identified with fore-aft vibration, ‘Y1’ to ‘Y3’ with lateral vibration, ‘Z1’ to ‘Z5’ with vertical vibration. *: p < .05; **: p < .01; ***: p < .005; ****: p < .001; NA: p > .05.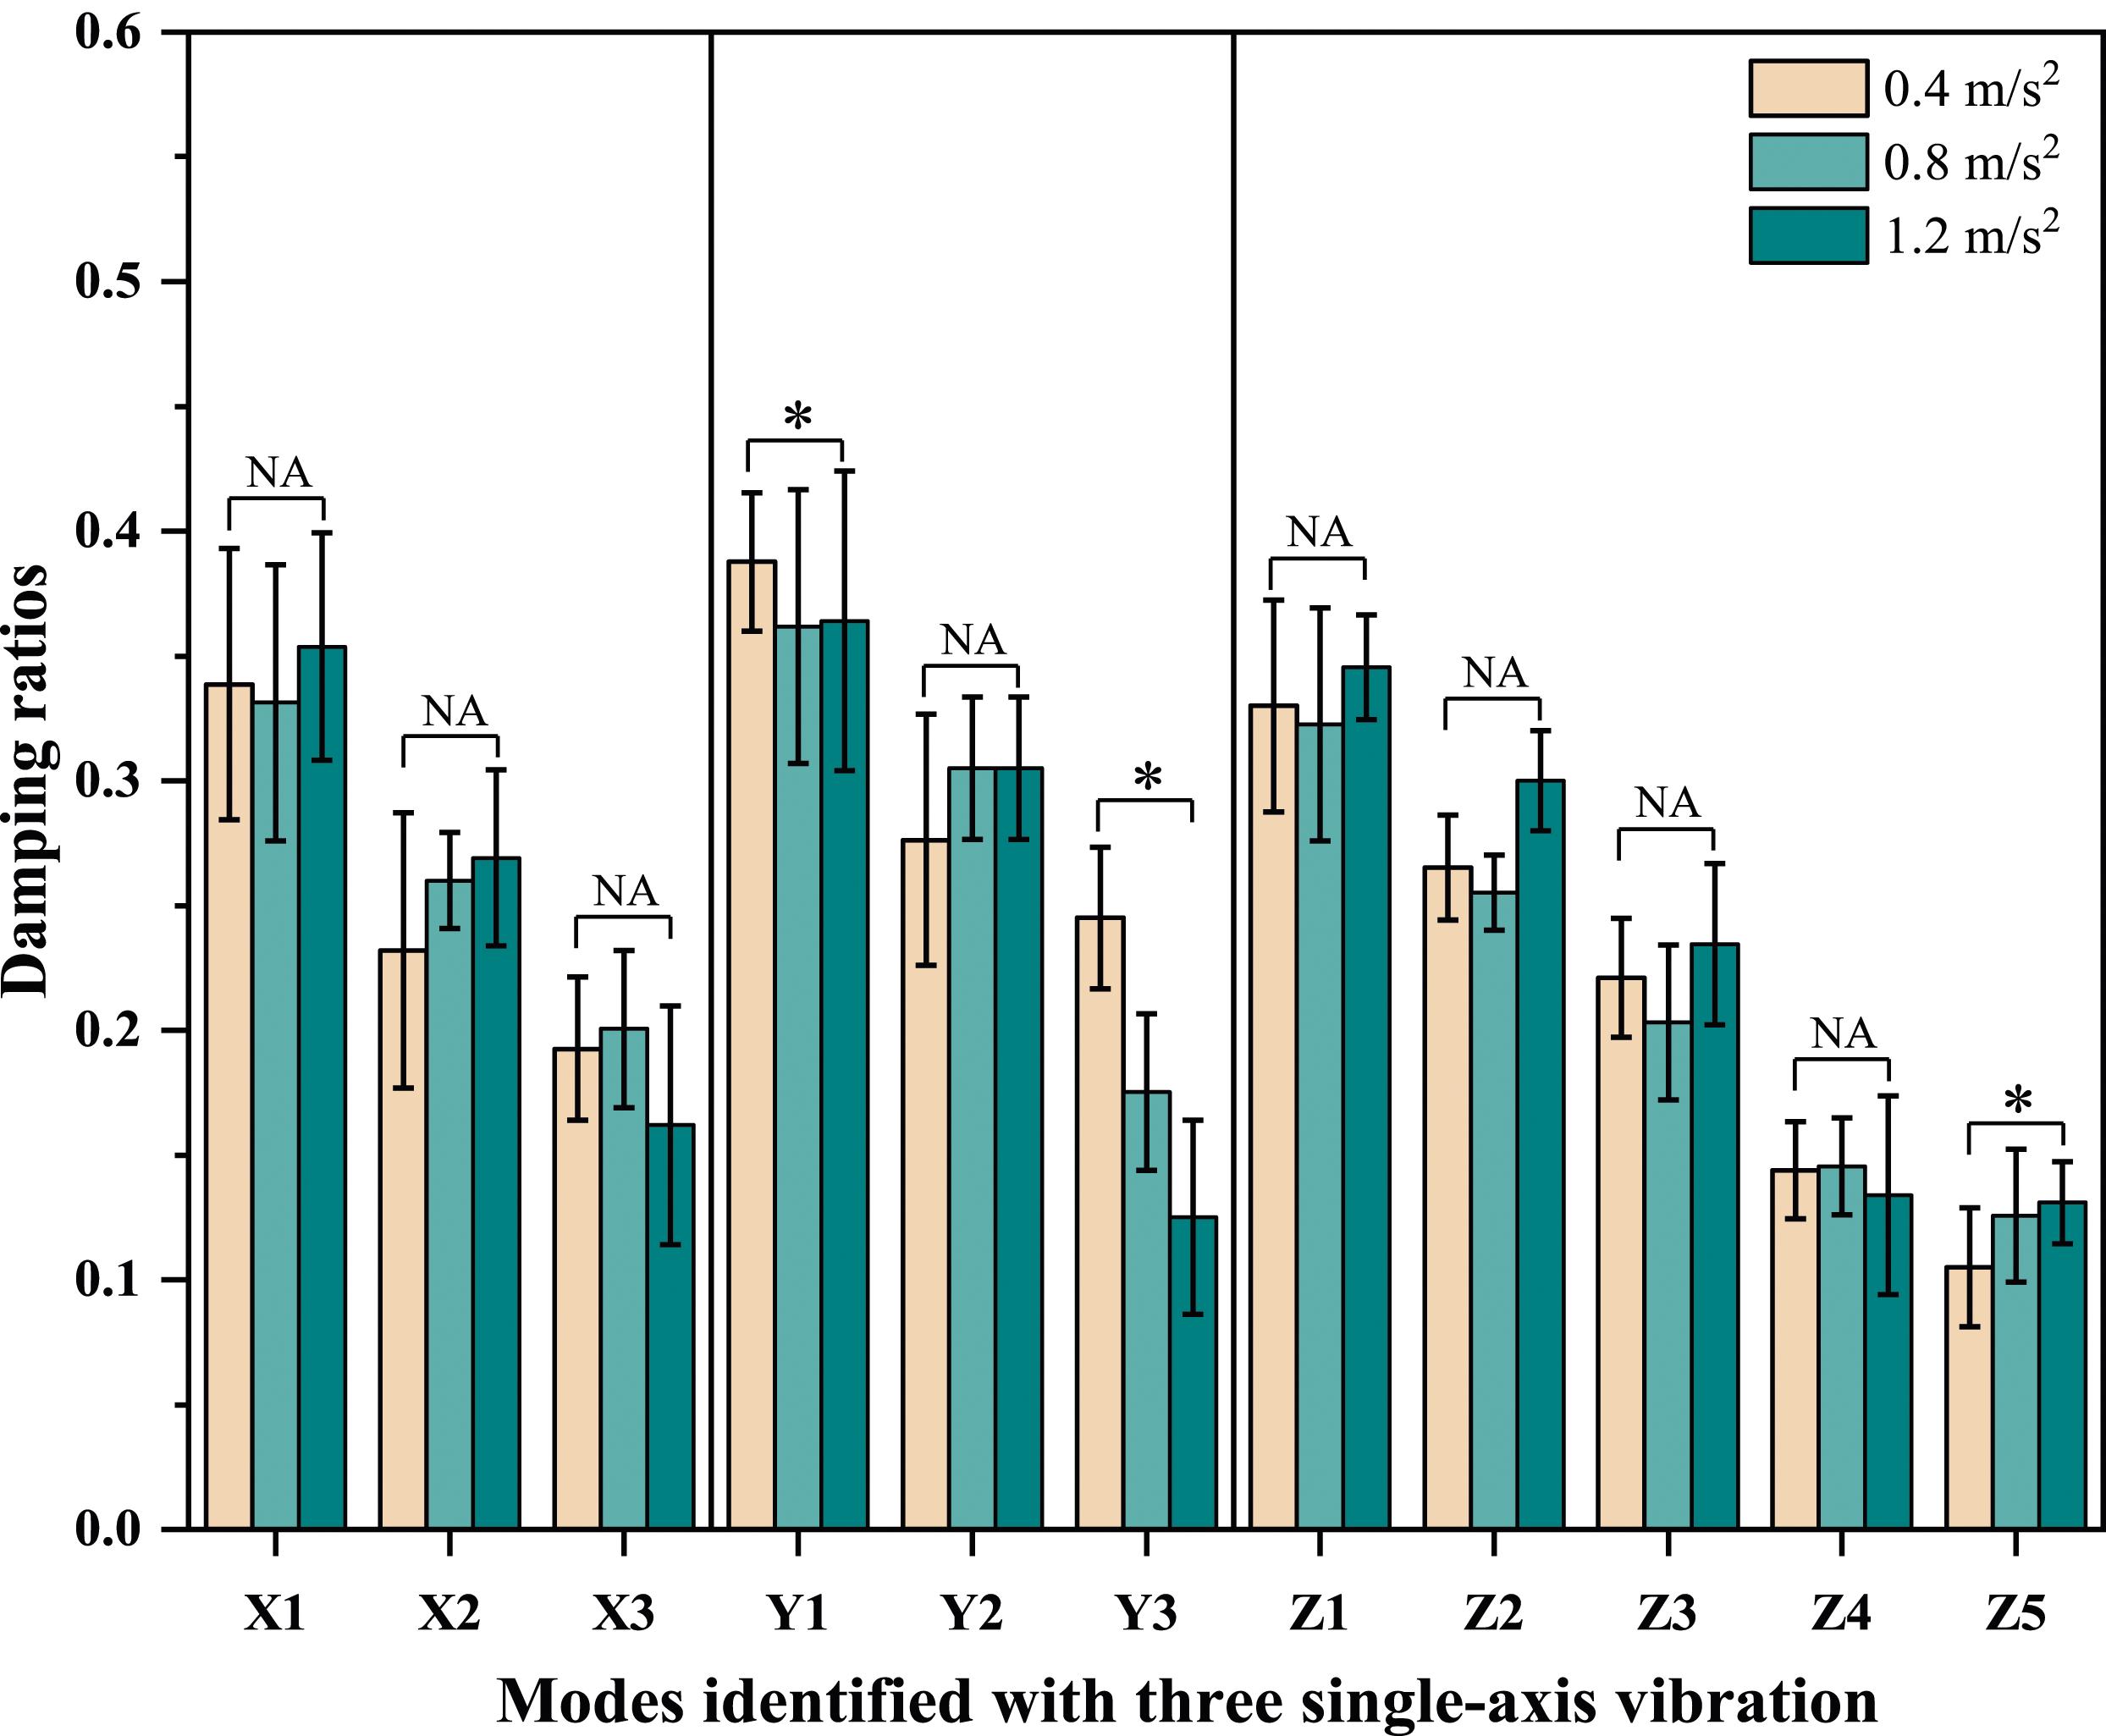
Effect of vibration magnitude on modal shapes
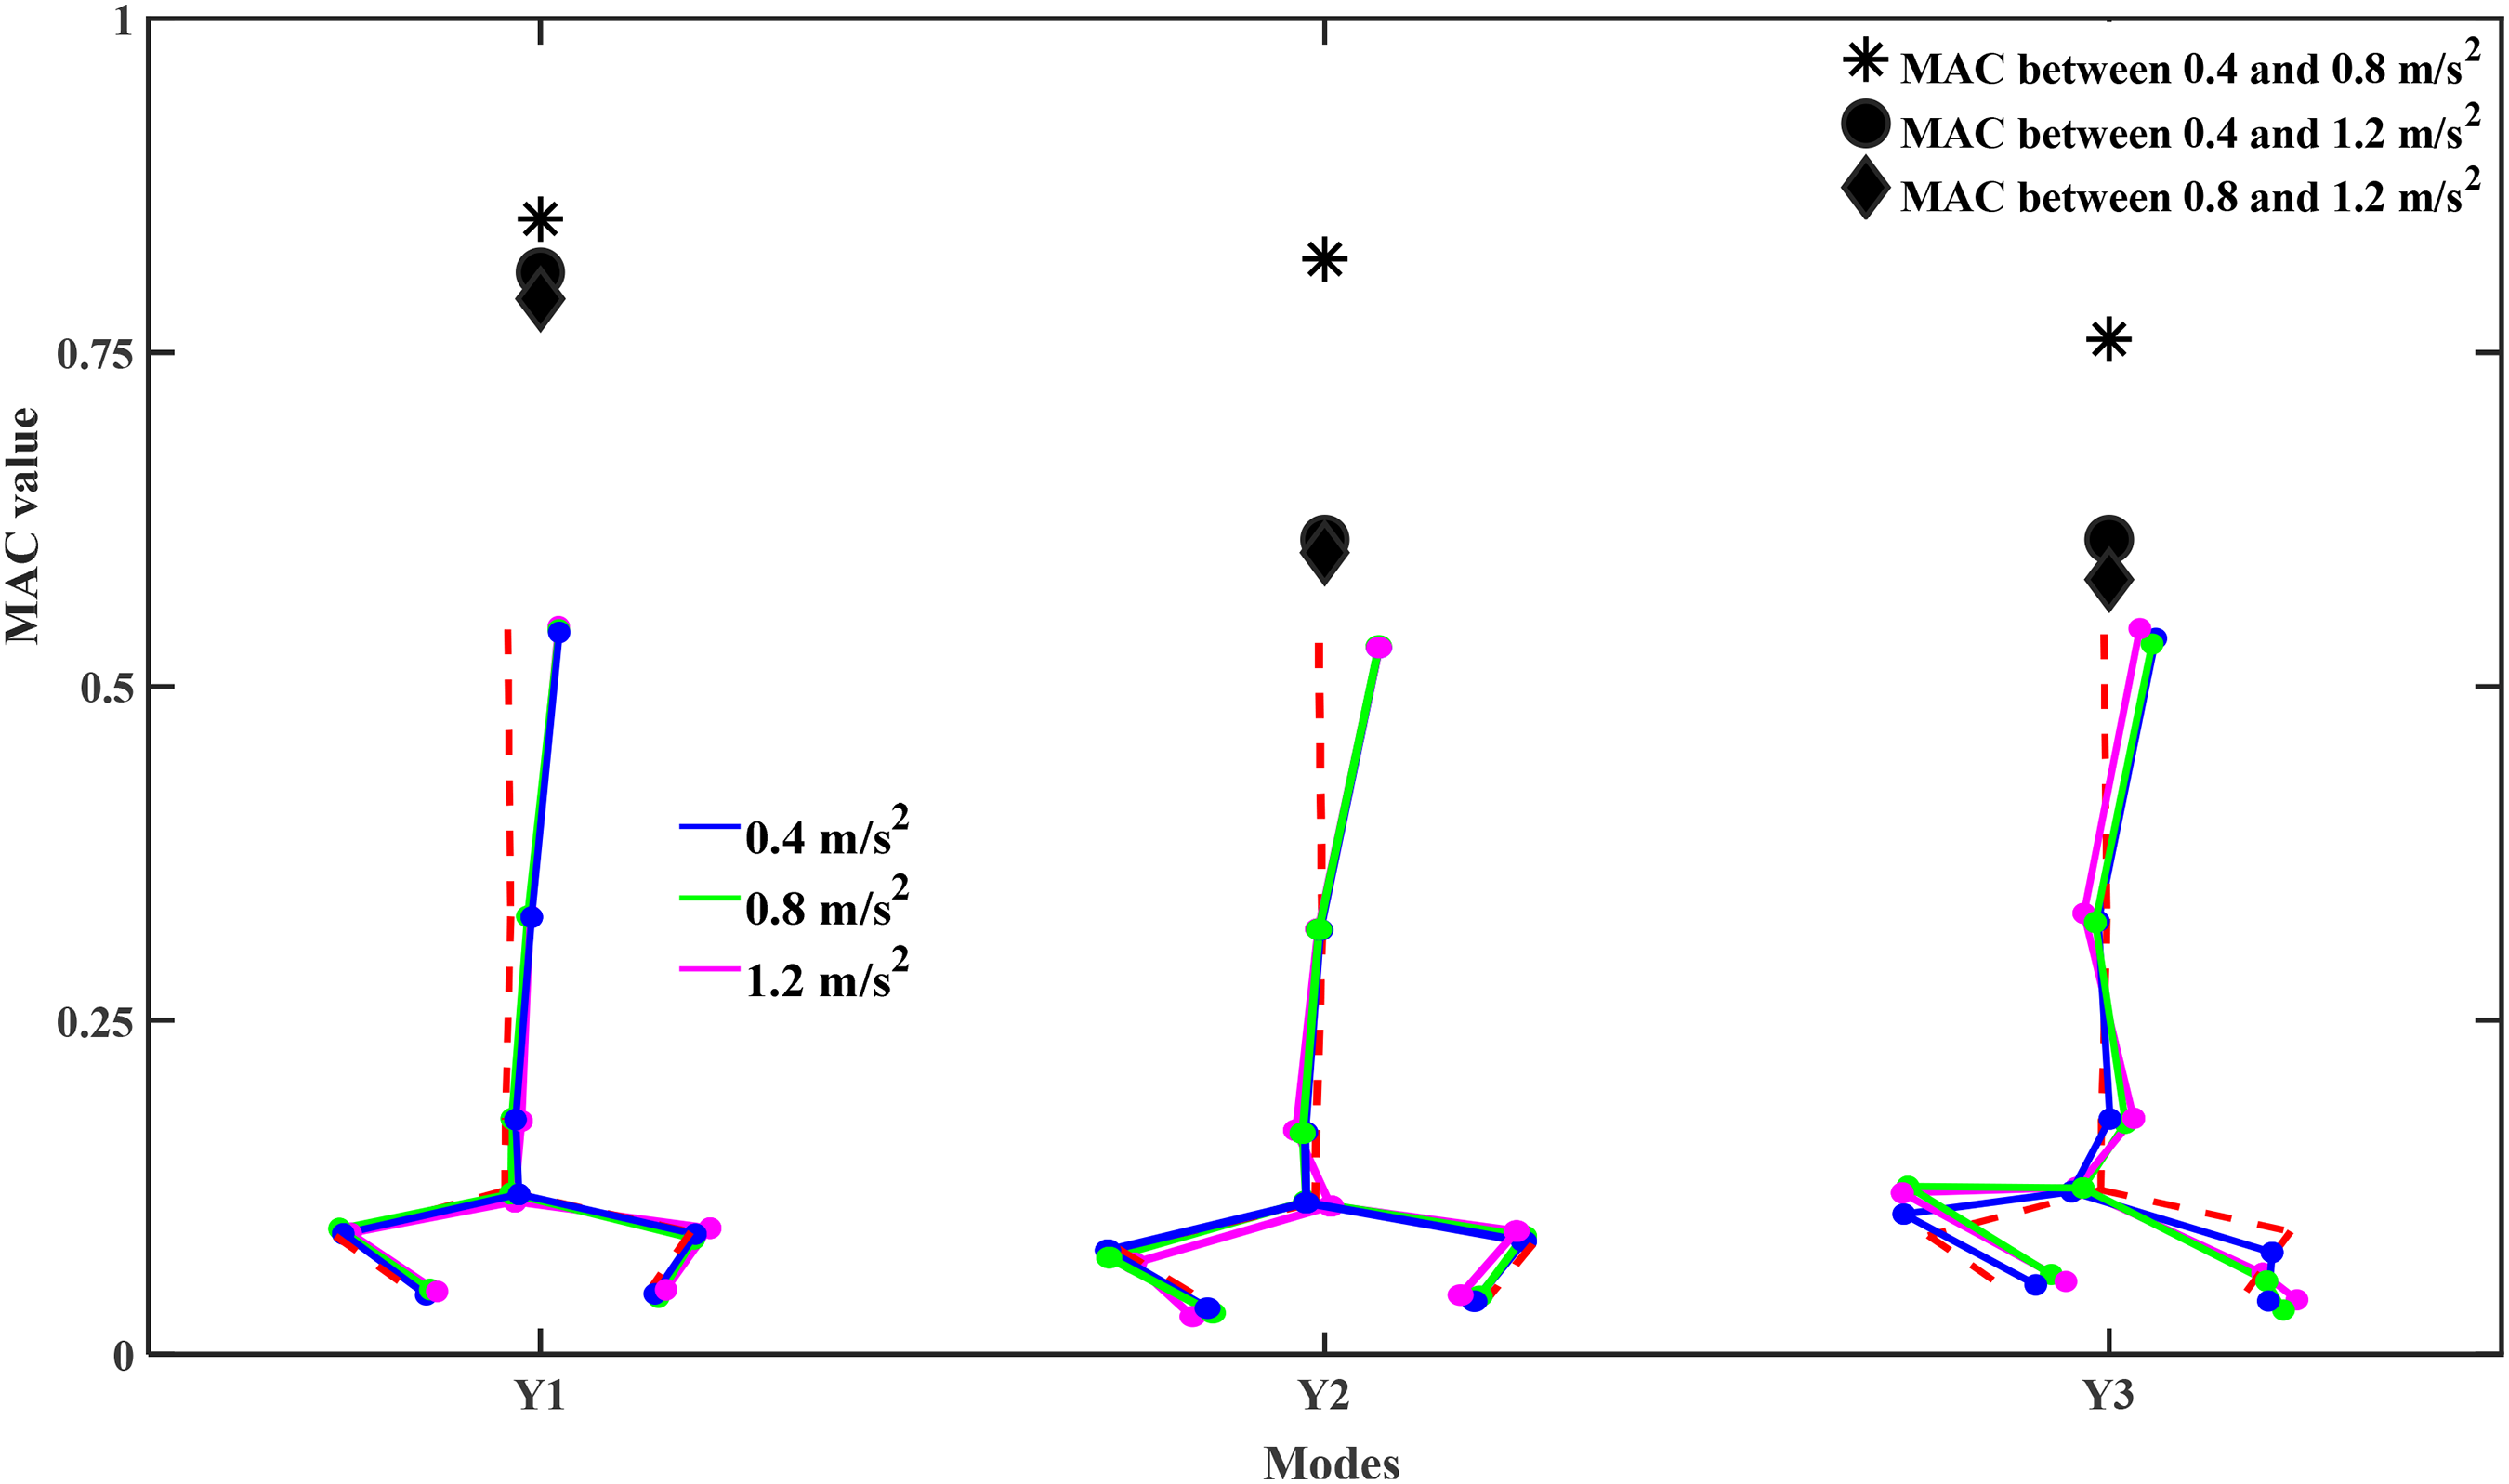
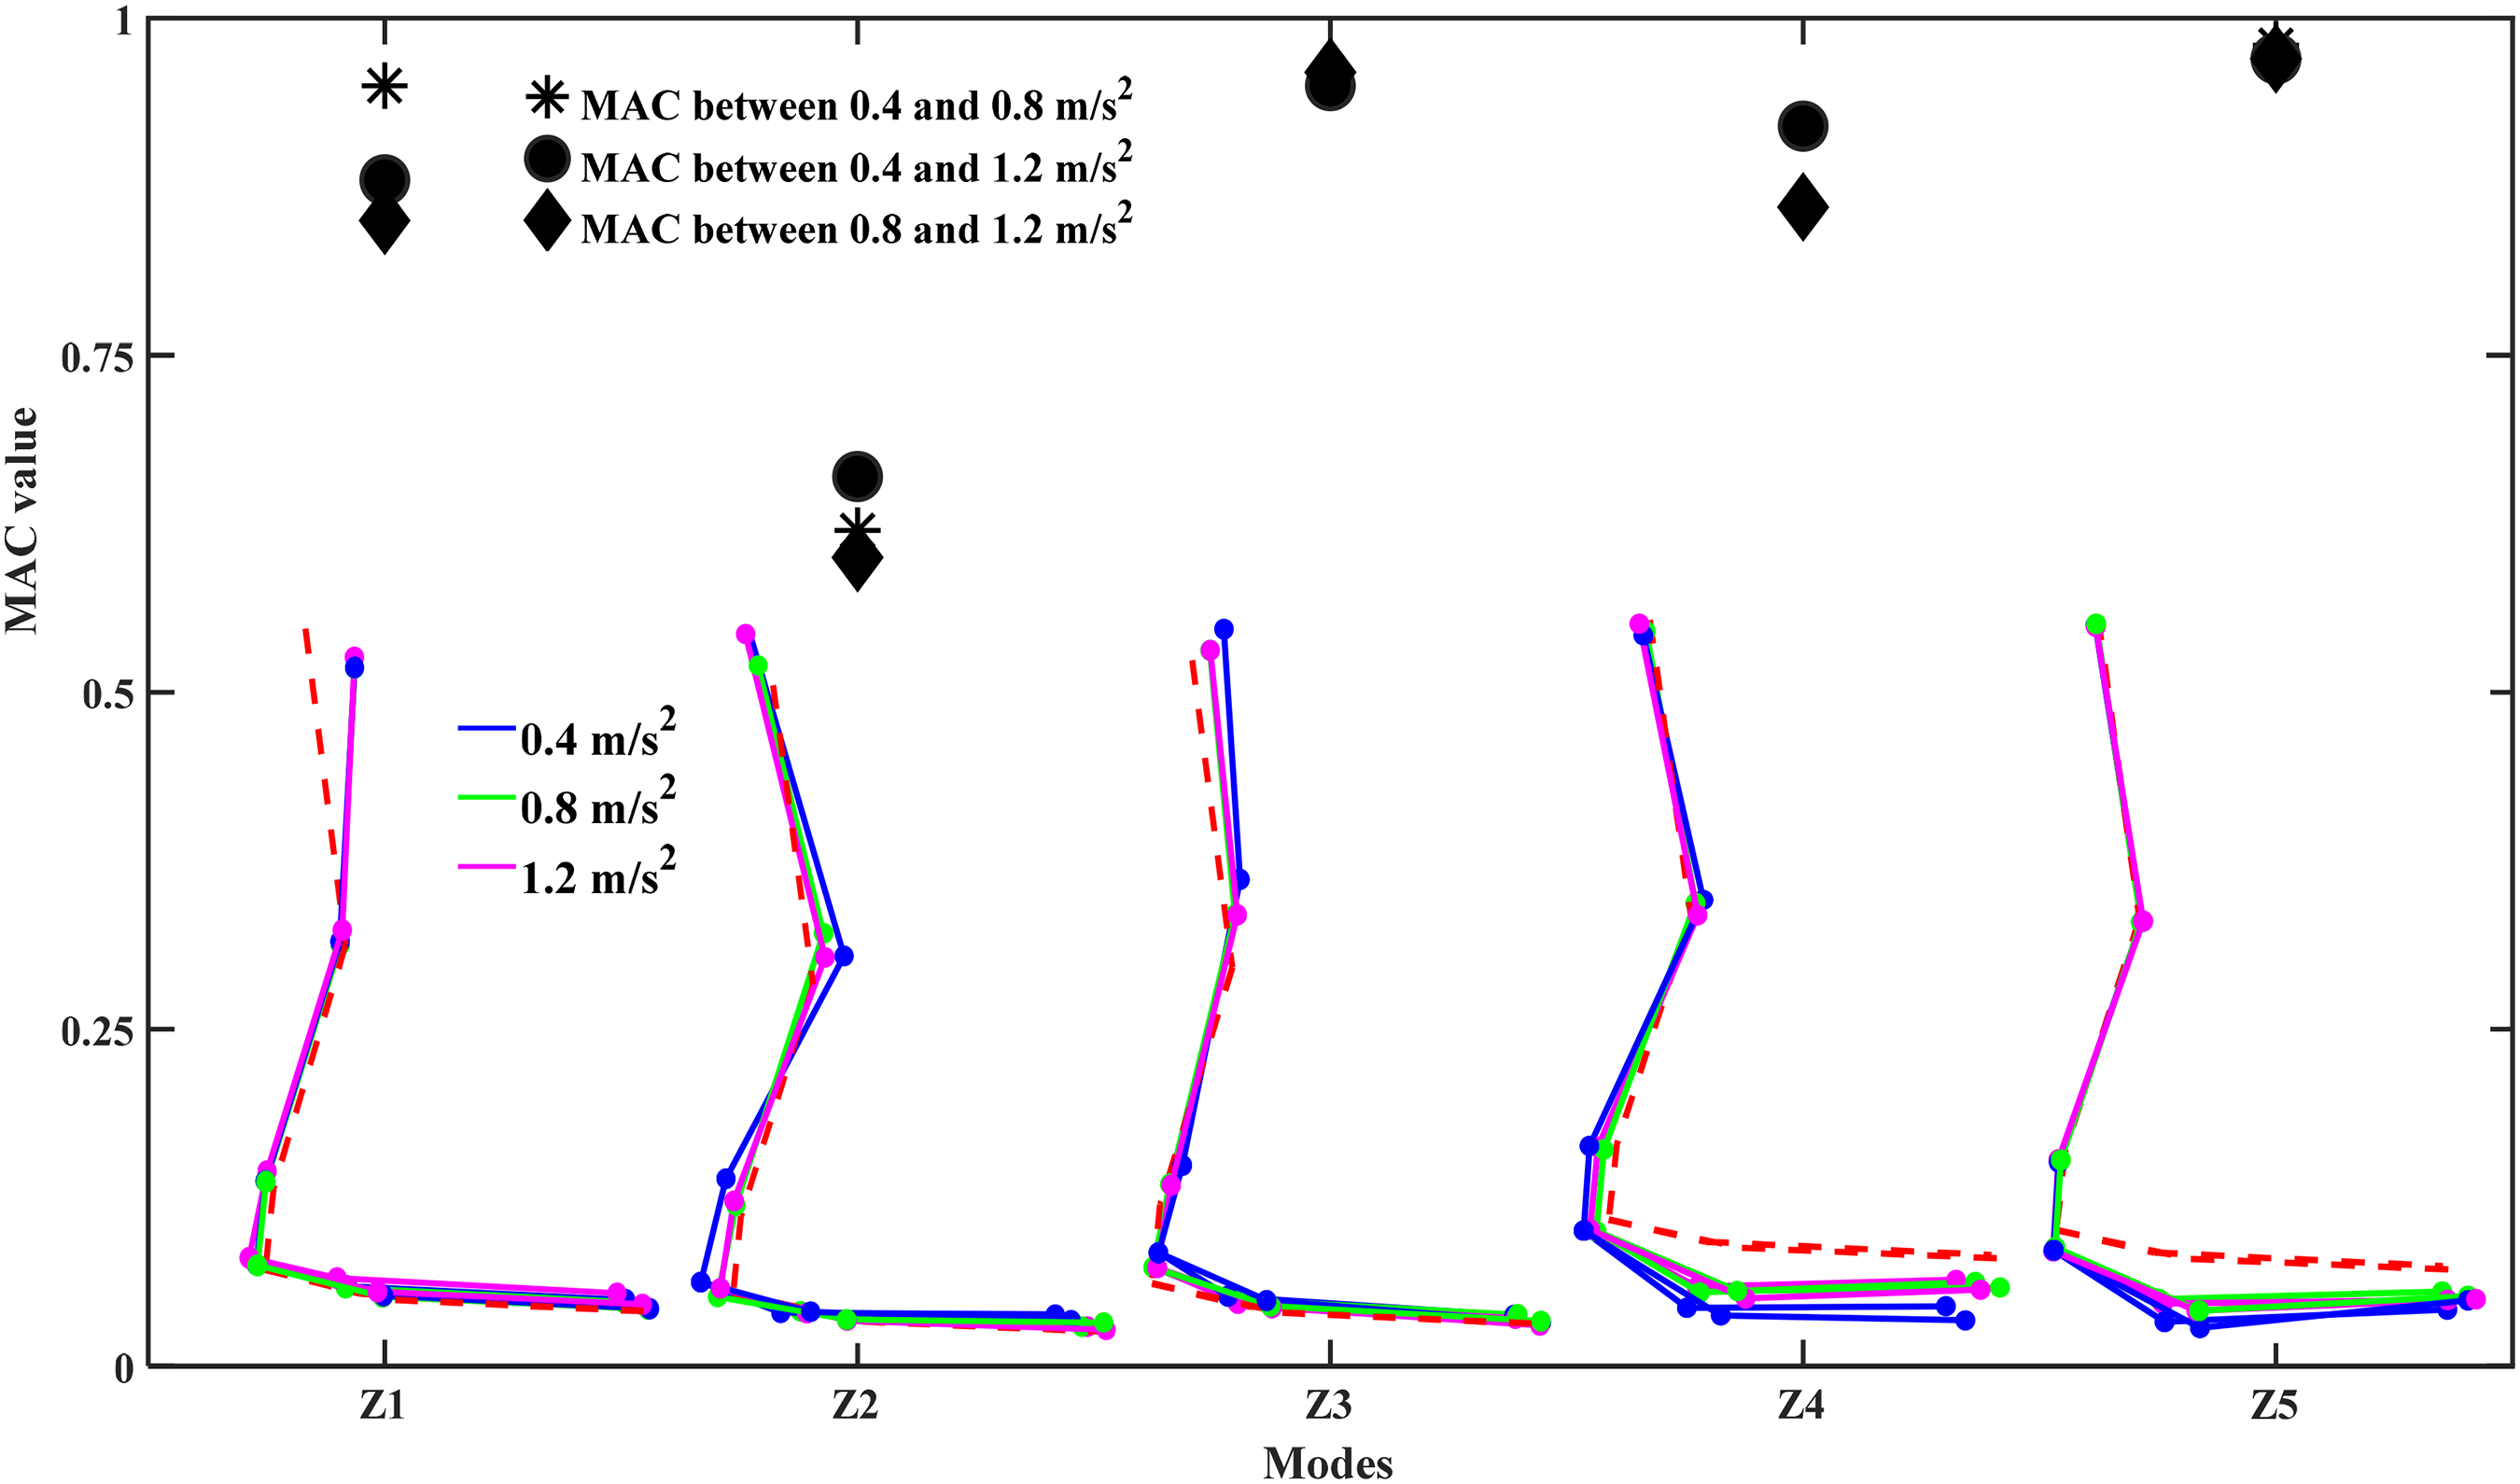
During fore-aft, lateral and vertical single-axis vibrations, the modal shapes with three magnitudes are shown in Figures 11–13, respectively. Modal assurance criterion (MAC) value was calculated to quantify the similarity between modal shapes identified with different vibration magnitudes at each mode. Independent of vibration directions, high similarity was observed in any two compared modal shapes, with MAC values greater than 0.61. The modal shapes containing bending or pitch motion in the upper body (such as the first two modes with fore-aft and lateral vibration) seemed to be more affected by the increased vibration magnitude. For the first and last three modes with vertical vibration, the modal shapes appeared insensitive to the increase of vibration magnitude, and MAC values between the compared modal shapes with different magnitudes were greater than 0.86. MAC values between the modal shapes identified with fore-aft vibration at three magnitudes of 0.4, 0.8 and 1.2 m/s2 r.m.s.: – deformed modal shape; ‐‐‐ initial body contour. ‘X1’ to ‘X3’ represents the first to third modes identified with fore-aft vibration. MAC values between the modal shapes identified with lateral vibration at three magnitudes of 0.4, 0.8 and 1.2 m/s2 r.m.s.: – deformed modal shape; ‐‐‐ initial body contour. ‘Y1’ to ‘Y3’ represents the first to third modes identified with lateral vibration. MAC values between the modal shapes identified with vertical vibration at three magnitudes of 0.4, 0.8 and 1.2 m/s2 r.m.s.: – deformed modal shape; ‐‐‐ initial body contour. ‘Z1’ to ‘Z5’ represents the first to five modes identified with vertical vibration.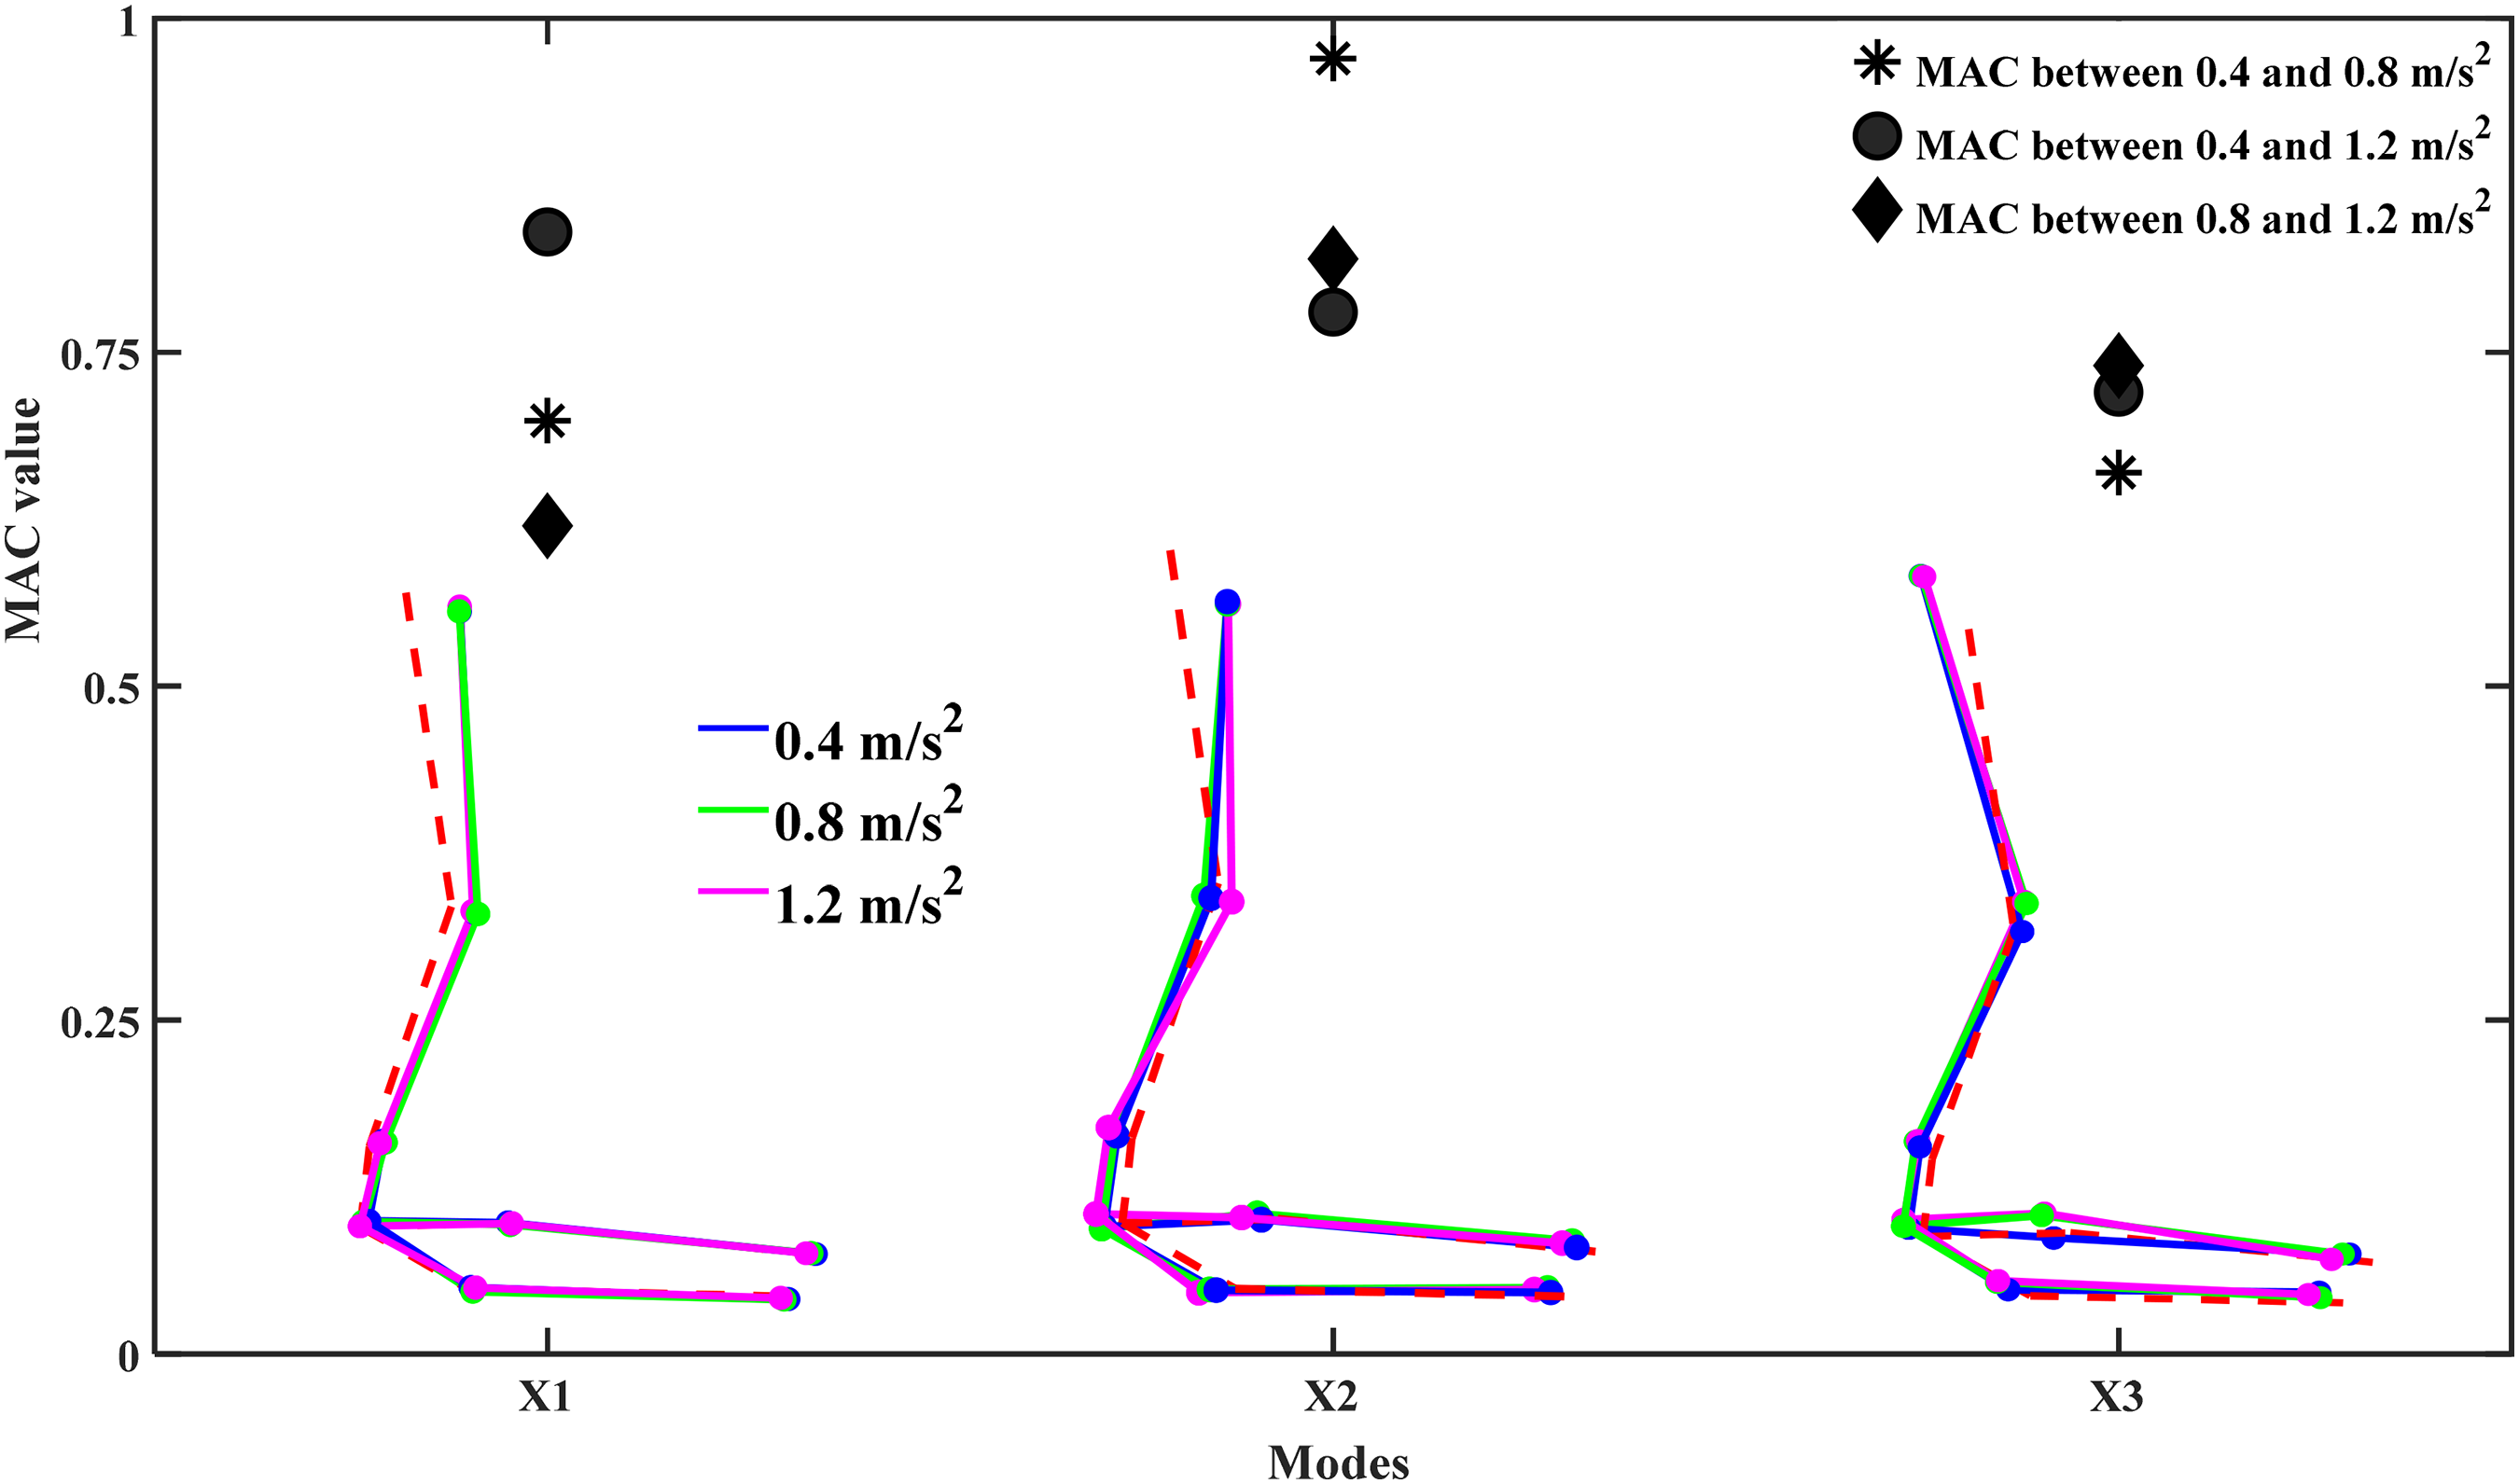
Discussion
Modal properties of the human body during single-axis vibration
Vibration modes of the human body during fore-aft vibration
During the fore-aft vibration at 0.4 m/s2 r.m.s., the three modes around 1.2, 2.9 and 4.7 Hz (Figure 6) seemed to be associated with the commonly reported three resonances in the fore-aft in-line apparent mass when sitting without a backrest.1,10 Pitch motion of the spine and pelvis dominated in the first mode at about 1.2 Hz, consistent with the modal shapes derived from some finite-element models of the human body.4,19 The pitch motion of the spine at this mode resulted in shear and axial deformation of the soft tissue beneath the buttocks, and hence the resonance around 1 Hz was both present in the in-line and vertical cross-axis apparent mass during fore-aft vibration. 10 At the second mode around 2.9 Hz, the human body acted as a beam with both ends free, having out-of-phase motion in the fore-aft direction between the lower body and the head. Only shear deformation of the soft tissue beneath the buttocks and thighs was present in this mode, consistent with the previous findings that a second resonance between 2 and 4 Hz was only observed in the in-line apparent mass but not in the vertical cross-axis apparent mass. 10 However, a resonance peak around 2.5 Hz was observed in the vertical cross-axis transmissibilities to L3 but not to the thoracic spine and head (e.g. T1, T5 and T12), 10 indicating that the bending motion may occur at the lumbar spine due to the out-of-phase motion of the lower body and head at this mode. Except for the bending motion of the upper body in the modal shape of the third mode around 4.7 Hz, the combined fore-aft and vertical motion of the entire body was also observed due to the shear and axial deformation of the soft tissues beneath the lower body. This explained why the resonance between 4 and 6 Hz was present both in the in-line and cross-axis apparent masses with fore-aft vibration.1,10,30
Vibration modes of the human body during lateral vibration
During lateral vibration excitation at 0.4 m/s2 r.m.s, three modes at about 0.8, 2.2 and 5.2 Hz in the coronal plane were identified from the eight seated subjects (Figure 7). The first mode at 0.8 Hz featured the lateral sway motion of the upper thoracic spine and head, consistent with the analytical modal shape from the studies of human modelling.5,22 The roll or lateral motion of the pelvis and thighs was not found in this modal shape, which may explain the findings that the resonance around 1 Hz was only present in the lateral apparent mass measured at the backrest but not at the seat pan. 5 Lateral movement of the lower body with the out-of-phase movement of the head dominated in the second mode around 2.2 Hz, consistent with the modal shape from multi-body dynamics model (MBD) models during lateral or roll vibration.5,22 This mode seemed to be associated with the resonance around 2.3 Hz in the lateral apparent mass.5,21 The modal shape of the third mode around 5.2 Hz involved the second-order lateral bending of the spine with lateral and roll motion of the pelvis and thighs, consistent with the findings from a 3-DOF model. 22 This mode seemed to be associated with the less-pronounced resonance between 4.0 and 5.7 Hz in the lateral apparent mass measured at the seat pan in a previous study. 7 However, the third resonance in the lateral apparent mass seemed to depend on the sitting posture and vibration magnitudes and was not always observed in the reported lateral apparent mass.21,30,31
Vibration modes of the human body during vertical vibration
When exposed to vertical vibration excitation at 0.4 m/s2 r.m.s., the first mode around 2.7 Hz was the out-of-phase motion between the upper thoracic spine and lower body in the fore-aft direction, similar to the shape of the second mode around 2.2 Hz identified by Kitazaki and Griffin. 15 This mode did not result in a prominent resonance in the vertical in-line apparent mass, but may be the contributor to the resonance at about 2.4 Hz in the fore-aft cross-axis transmissibilities to the T12, L3 and pelvis with vertical vibration sitting without a backrest. 14 The apparent mass measured at the seat pan seemed to be insufficient to fully capture the dynamic characteristics of the upper body of the human body when sitting without a backrest, suggesting that the body transmissibilities to the spine or pelvis were included in calibrating biodynamic models.
The second mode around 4.9 Hz included the fore-aft and vertical motion of the upper body along with the bending of the spine, and the third mode around 6.2 Hz consisted of vertical motion of the entire body along with the in-phase pitch of the pelvis and upper thoracic spine and head. Similar modal shapes have been identified in the existing modelling studies3,4,17–19,21 and are thought to be related to the primary resonance in the vertical apparent mass. How the relevant modes participated in the primary resonance in the vertical apparent mass has not been fully understood and is worth investigating. Zheng et al. measured the in-line and fore-aft cross-axis transmissibilities to the spine (i.e. T1, T5, T12 and L3) and pelvis with vertical excitation, 14 and a peak around 5 Hz was found both in the vertical in-line and fore-aft cross-axis transmissibilities to the T1 T5, L3 and pelvis. At about 5 Hz, the modulus in the fore-aft cross-axis transmissibility decreased as the measurement location became lower from T1 to T5 and then increased from T5 to L3. This indicated that bending of the spine (as seen in the second mode around 4.9 Hz in Figure 8) occurred at the primary resonance frequency during vertical vibration. In addition, a peak around 5 Hz was also present in the pitch cross-axis transmissibility to the pelvis during vertical vibration, 14 suggesting the rotation of the pelvis (as seen in the third mode around 6.2 Hz in Figure 8) was also included in the vibration motion at the primary resonance. Therefore, it can be concluded that at least the second and third modes around 4.9 and 6.2 Hz found in the current study are responsible for the primary resonance in the vertical apparent mass. Similar conclusion was also found in the modal test carried out by Kitazaki and Griffin, 15 where the principal resonance was considered to be caused by the modes at 4.0 and 4.9 Hz.
Three modes at about 8.1, 8.7 and 9.3 Hz featuring the pitch motion of the pelvis were identified by Kitazaki and Griffin 15 and thought to contribute to the second resonance between 8 and 12 Hz in the vertical apparent mass shown in previous studies, 15 but not consistent well with the findings from previous modelling studies.3,4,16,17,19 The modes contributing to the second resonance in the vertical apparent mass are considered to be related to the vibration responses of the viscera and thighs,11,13,17 which may contain the vertical motion of the thighs and the viscera, as well as the pitch of the legs and pelvis.4,19 Two modes around 8.6 and 10.9 Hz featuring the vertical motion of the lower body and the pitch of the pelvis and thighs were found in the current study, consistent with the modelling studies.3,4,17,19 The vertical motion of the buttocks and thighs observed in these two modes seemed to be caused by the axial deformation of the soft tissue beneath the lower body, and contribute to the second resonance in the vertical apparent mass.
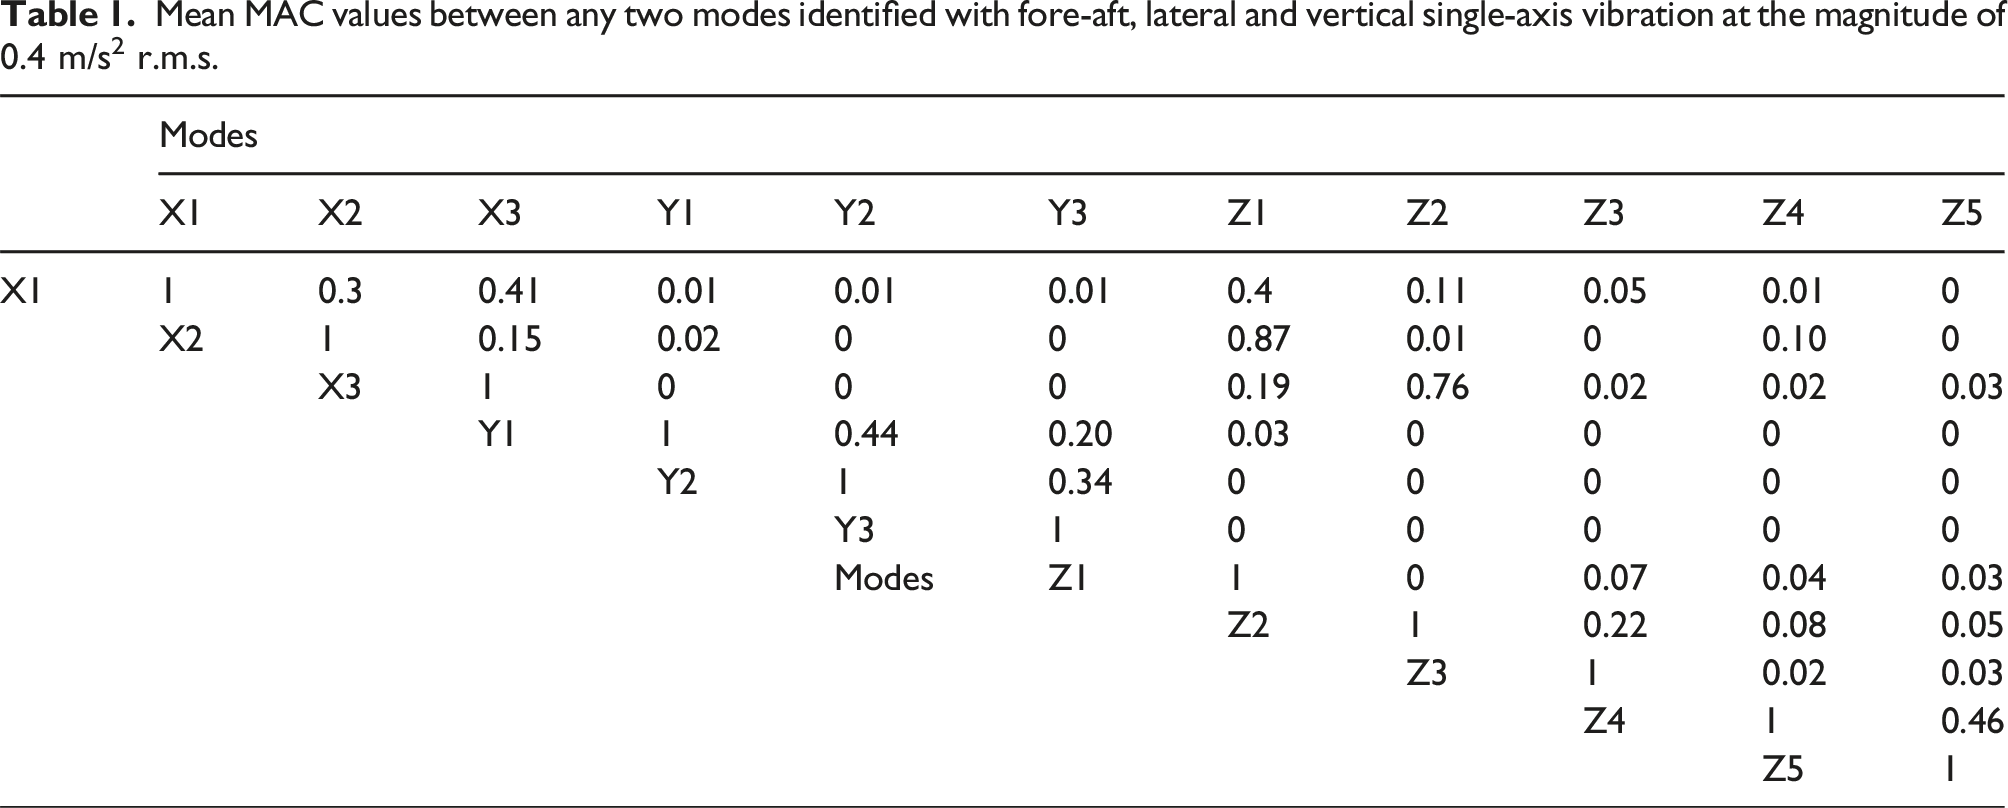
Comparison of the modes identified with vibrations in different directions
Mean MAC values between any two modes identified with fore-aft, lateral and vertical single-axis vibration at the magnitude of 0.4 m/s2 r.m.s.
Effect of vibration magnitude on modal properties
Effect of vibration magnitudes on the modal frequencies
Summary of the 11 modes of the seated human body and the significance of the effect of vibration magnitude on the modal frequencies and damping ratios during single-axis vibration (Friedman two-way analysis of variance). The shown modal frequencies and damping ratios were identified with vibration at 0.4 m/s2 r.m.s.
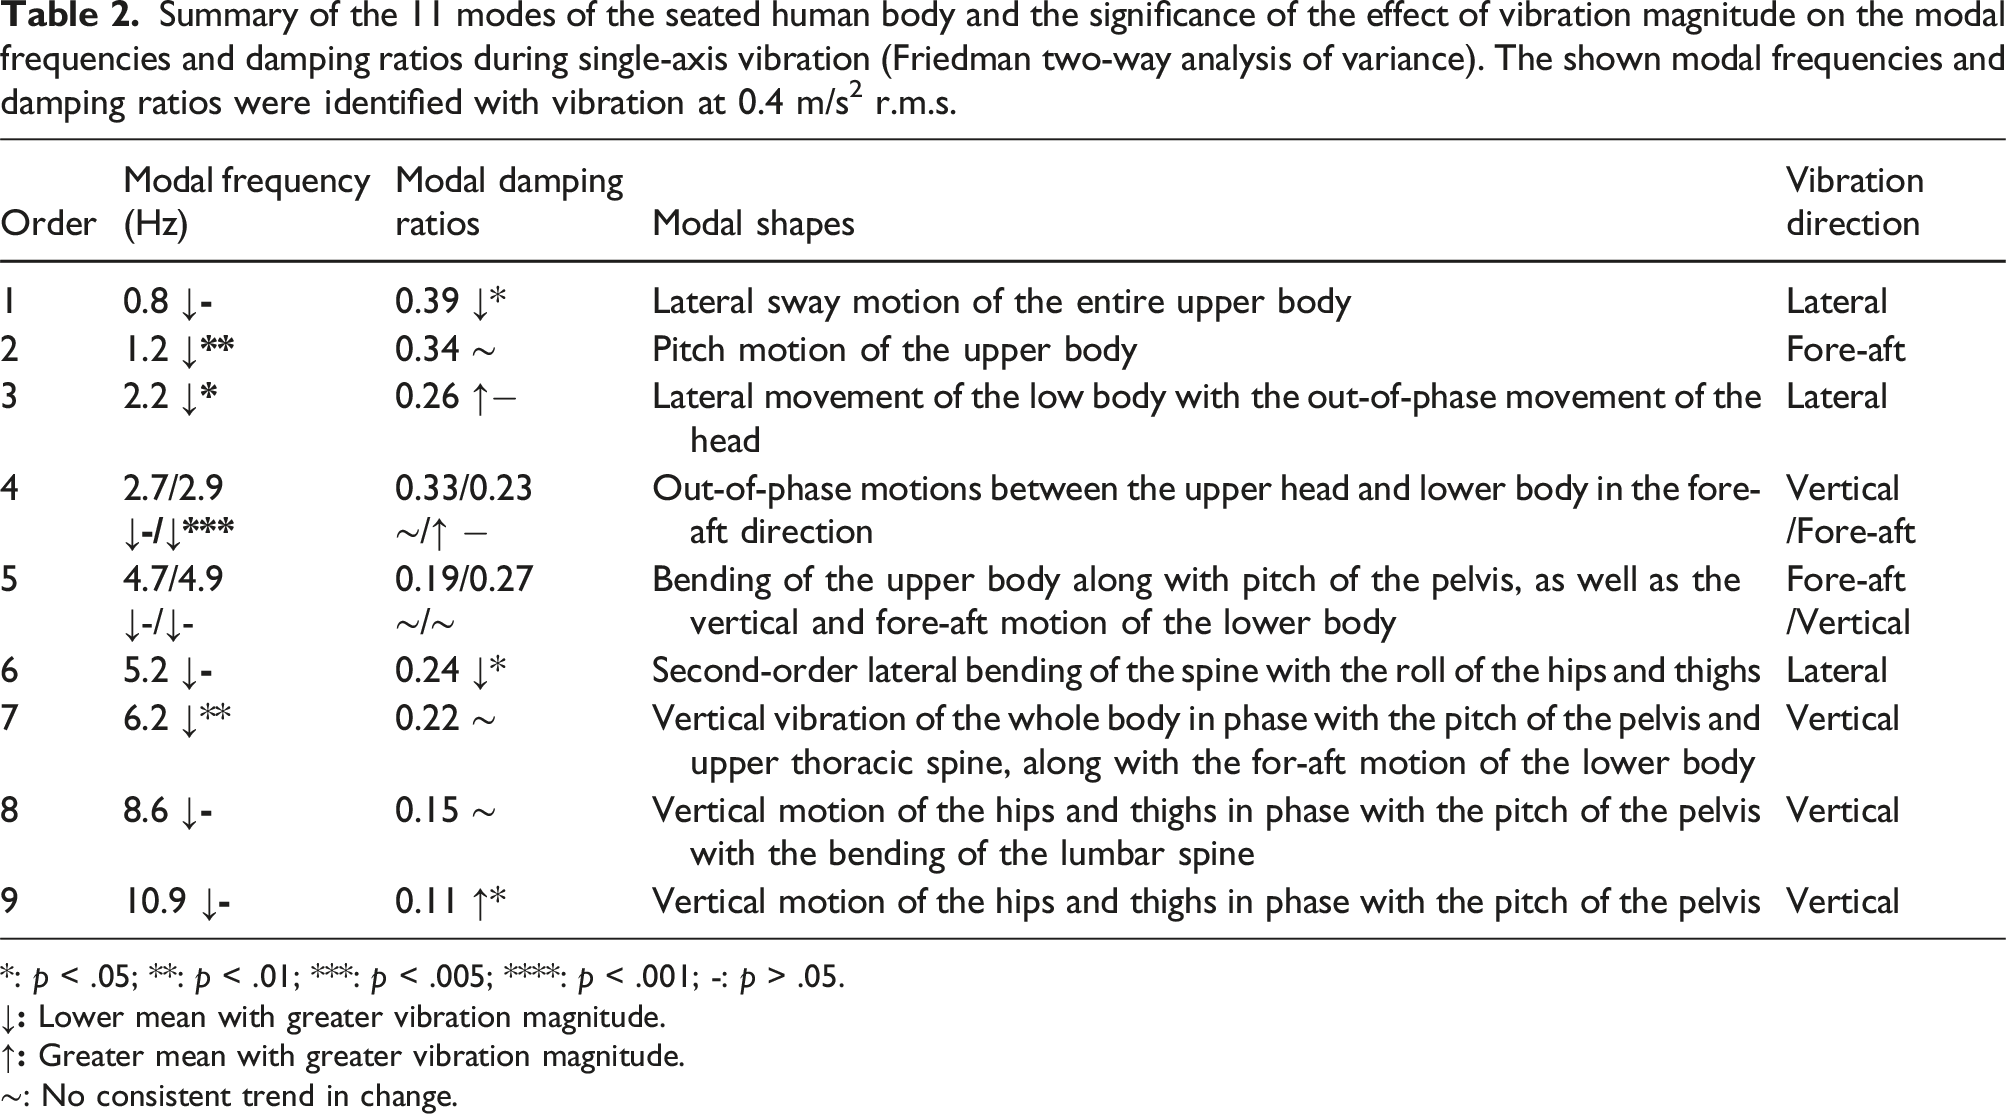
*: p < .05; **: p < .01; ***: p < .005; ****: p < .001; -: p > .05.
∼: No consistent trend in change.
The only exception was seen for the first mode at about 0.8 Hz identified with lateral vibration. This mode had the global sway of the upper body in the coronal plane (Figure 7) but did not exhibit significant changes in the modal frequency with different vibration magnitudes (Friedman, p > .05). Previous studies on the lateral apparent mass or roll apparent inertia of the seated human body also reported that the frequency of the first resonance at about 1.0 Hz was independent of vibration magnitude.2,22 One possible reason could be that voluntary muscle activities might be involved to stabilize the body during vibration at low frequencies, and variability in muscle activities between individuals may have masked the effect of vibration magnitude on the modal frequencies.
Effect of vibration magnitudes on the modal damping ratios
The effect of the vibration magnitude on the modal damping of the human body seemed less clear in the present study (Table 2). Among the 11 vibration modes, there were only three modes showing a significant reduction in the modal damping ratio with increasing vibration magnitude (Friedman, p < .05; Figure 10). For the other modes, there seemed no clear trend in how the modal damping was affected by increasing vibration magnitude. The lack of trend appeared to be similar to previous findings based on a two degree-of-freedom model calibrated using the apparent masses of 12 individuals with vibrations at 0.125, 0.25, 0.5, 0.75 and 1.0 m/s2 r.m.s., in which no significant change was identified in the damping coefficients of the model with different vibration magnitudes. 32 Similar findings were also found with an eight degree-of-freedom multi-body biodynamic model. 13 The model was developed to represent the localized vertical in-line and fore-aft cross-axis apparent masses of 14 individuals measured with vertical vibration at 0.25, 0.5 and 1.0 m/s2 r.m.s. Among the 12 damping parameters of the model, only the vertical damping representing the soft tissues beneath the ischial tuberosities decreased significantly with increasing vibration magnitude while there was no clear trend for the other damping parameters. 13
Effect of vibration magnitudes on the modal shapes
For each direction of vibration excitation, high similarity was observed in every two compared modal shapes, with MAC values greater than 0.61 (Figures 11–13). This implies that there is no new vibration mode of the human body identified with the vibration magnitudes used in the current study. This ensures that the modal shapes identified in the current study can be used generally in the validation of biodynamic models, even when the models may be developed for a different vibration magnitude with single-axis vibration.
It is noticed that the MAC values for the modes with fore-aft and lateral vibration at different magnitudes are lower than those for the modes with vertical vibration (Figures 11–13). This could be due to that fore-aft and lateral vibration excitation is orthogonal to the spine, and increasing the vibration magnitude may result in a greater increase in the voluntary or involuntary muscle activities compared to increasing the magnitude of vertical vibration.
Application of the modal parameters of the human body
When exposed to whole-body vibration, the vibration discomfort differed between body parts, 33 and the low back pain problems are thought to be related to the bending of the lumbar spine. 15 The modal information of the human body in the current research is useful for the engineers to distinguish the dominant modes of the occupant in a human-seat coupling system, and provide useful guidance to reduce the adverse effect of the vibrations on the ride comfort and health for the optimal design of the seats and vehicles.
In addition, although various human models with different structures and degrees of freedom have been developed,3,5,17,18,34–36 there are currently no guidelines and criteria for the simplification of the model structures and model calibration. The modal information provided in this study can be used to assist in simplification and verification of the biodynamic models capable of predicting ride discomfort and internal forces within the spine.
Conclusion
Vibration modes of eight subjects sitting on a rigid seat without a backrest were measured with single-axis vibration excitation in the fore-aft, lateral and vertical direction at 0.4, 0.8 and 1.2 m/s2 r.m.s. The effect of vibration direction and magnitude on the modal properties of the human body was investigated.
When exposed to vibration at 0.4 m/s2 r.m.s., a total of 11 vibration modes were identified: at about 1.2, 2.9 and 4.7 Hz with single-axis fore-aft vibration excitation, 0.8, 2.2 and 5.2 Hz with lateral vibration, and 2.7, 4.9, 6.2, 8.6 and 10.9 Hz with vertical vibration. The modal shapes of the second and third modes at 2.9 and 4.7 Hz with fore-aft vibration are similar to those of the first and second modes at 2.7 and 4.9 Hz with vertical vibration, respectively, with high MAC values.
Vibration magnitude was found to affect the modal frequency of a mode that contains global or low order deformation of the upper body and deformation of the soft tissues beneath the pelvis and thighs occurring in the same direction as the excitation, more significantly than the other modes. With the vibration magnitude increasing from 0.4 to 1.2 m/s2 r.m.s., high similarity was found in the modal shape for each of the modes, suggesting there is no additional vibration mode of the human body.
Footnotes
Declaration of conflicting interests
The author(s) declared no potential conflicts of interest with respect to the research, authorship, and/or publication of this article.
Funding
The author(s) disclosed receipt of the following financial support for the research, authorship, and/or publication of this article: This work was supported by the National Natural Science Foundation of China (51975515).
Appendix A
EMA seeks to identify the modal frequencies, modal damping ratios and modal shapes from the measured transfer functions of a specific structure. The frequency response function