
Abstract
In this article, a new roving inertial shaker method approach, using an inertial shaker, is presented to obtain a steel plate’s modal parameters with bolt connections on four sides. It aimed to emphasize the superiority of the proposed roving shaker approach over the classical, traditional hammer method on the plate-like structures. The frequency response functions (FRF), obtained from both methods, are investigated using the stabilization diagram, and the superiority of the roving shaker method is presented based on high stabilization and detecting more modes. The accelerometer’s position effect on experimental modal analysis (EMA) is investigated in the roving shaker method, which is performed using accelerometers in two different places, and obtained modal parameters are compared with experimental modal analysis validation methods. Accordingly, the results for the two separate locations are very close to each other. Finally, the experimental and numerical results are investigated according to the TEST/FEA correlation for the traditional roving hammer method and the roving shaker method. As a result, the roving shaker approach gives a better result according to the TEST/FEA correlation success than the roving hammer test. In conclusion, the high stabilization, high TEST/FEA correlation rate, and the number of modes show the roving shaker approach’s superiority.
Keywords
Introduction
One way of obtaining dynamic characteristics of the plate structures is the experimental modal analysis method. Experimental modal analysis (EMA) has become increasingly popular since the advent of the digital FFT (Fast Fourier Transform) spectrum analyzer in the early 1970s. It has gained an important place, especially in industrial applications. A fast and economical method, called EMA, has been applied to complex structures with developing sensor technology. Nowadays, it can be used with laser or high-resolution camera systems. The study, reported by Schwarz and Richardson, 1 reviews all the main issues associated with experimental modal analysis (or modal testing), such as obtaining FRF (Frequency Response Function) measurements with an FFT analyzer, modal excitation techniques, and modal parameter estimation (curve fitting) from a set of FRF. EMA has also studied many engineering fields (mechanical, civil, aerospace, etc.). EMA has been applied to many different engineering structures in studies.2–13
The system analysis, known as EMA to vibrating structures, provided a new research area in mechanical engineering like other disciplines. In the EMA, an experimental modal model consisting of natural frequencies, damping ratios, mode shapes, and modal participation factors is obtained using various measurement parameter estimation methods to acquire the systems' dynamic characteristics. The most effective of these different estimation methods, a new noniterative parameter estimation method based on frequency domain called PolyMax, is presented in the study. 14 Based on the least-squares approach, this method uses multiple input–multiple output frequency response functions as primary data. One of the method’s specific advantages is that it leads to stabilization diagrams that are easy to interpret, with a very stable definition of system poles and participation factors. The researchers compared PolyMax with classical methods regarding stability, estimated mode parameters accuracy, and frequency response function synthesis. As a result of these studies, it is emphasized that PolyMax is an effective method in determining general-purpose modal parameters in the test results containing high damping and noisy vibration data. Researchers frequently emphasize the PolyMax modal parameter estimation method’s superior performance by studying experimental modal analysis methods and users who use them industrially.10,13,15 Also, the studies conducted by Chen, Mendoza 16 present a comprehensive experimental and numerical study with the modal test performed in three different ways to give insight related to symmetric modes. Complex curvature mode shapes and modal coupling dynamics were studied for a three-bladed wind turbine assembly.
EMA is applied to the structures by two methods in terms of excitation types, hammer and shaker. It is decided which method will be more appropriate for EMA by considering the structures' size, rigidity, and nonlinear properties. The roving hammer method is a well-known method for plate-like systems, explained in detail in Section 2. Similar to the roving hammer method according to the implemented procedures, the roving shaker method presented within this study’s scope was initially reported in the studies presented by17–19 in the literature. However, the reported method using classical modal shakers was applied to large reinforced concrete structures in civil engineering. Although this study’s basis is identical to the related research, the roving shaker method is applied to thin plate-like structures using an inertial shaker.
In this article, a new approach called the roving inertial shaker method is applied to obtain a steel plate’s modal parameters with bolt connections on four sides. The traditional roving hammer method is applied experimentally to the same structure under the same conditions to compare with the new method proposed. The PolyMax stabilization diagram is used to obtain modal parameters from both methods in the LMS/TestLab. According to the results, the roving inertial shaker method is superior to the roving hammer method. When investigated the FRFs, the shaker test results are satisfactory in determining modes due to the visible peaks and the poles' high stability. The modal analysis validation methods are then conducted to the roving inertial shaker tests to investigate the accelerometer position’s effect on experimental modal analysis. Two shaker tests are applied to the structure to obtain FRF data sets according to the accelerometer location. These tests are called SMT-1 and SMT-2, which compare each other with the experimental modal analysis validation methods. TEST/FEA correlation studies are performed in LMS/VirtualLab software to investigate the test’s similarity and finite element model. Experimental modal analysis validation methods and FEA correlation studies demonstrate the roving inertial shaker method’s superiority.
Experimental modal analysis
Various structures are subjected to vibrations in our world. All machines, vehicles, and buildings start to vibrate when exposed to a dynamic load. As a natural consequence of this, it has become essential to investigate the vibrations of the structures. Thus, those structures' characteristics, such as performance and fatigue, can be evaluated using subjected vibration. The frequency analysis is performed using signal analysis techniques such as FFT to investigate the structures' vibrations. So, it is observed how the vibration level changes with frequency and reached the dominant vibration frequency that occurs on the system. However, these results contain excitation frequencies on the structure and give little or no data about its dynamical characteristics. Therefore, EMA, namely FRF measurements, offers a novel solution instead of frequency analysis. The natural structural responses between measuring points and excitation points are investigated with FRF to obtain modal parameters such as natural frequency, damping ratio, and mode shapes. It can be schematic from the structures' structural response with a series of FRF measurements. 20
It is necessary to understand the fundamentals of structural dynamics to perform a successful modal analysis. The relationship between frequency response functions and modal parameters is significant.1,8,21 The frequency response function is a complex function that describes the relationship between the force applied to the structure and the structure’s response. The poles of the FRF function give the natural frequencies of the system. Similarly, the modal damping ratios are obtained from pole points.
Moreover, the modal shapes can be calculated by obtaining enough FRFs on the structure. The formulation of frequency response functions is given in equation (1). In classical EMA, force sensors are used to measure the structure’s excitations, and accelerometers are used to measure the system’s responses

Here,

Here,
The modal matrix obtained from the EMA is given in equation (3). Here,
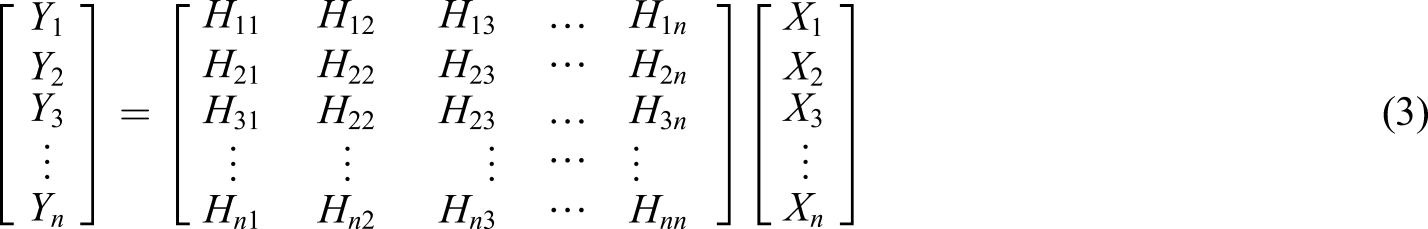
For the EMA that includes a single excitation and multiple response measurement (SIMO), a single row FRF set is obtained as measurement points. For the EMA that provides multiple excitations and a single response measurement (MISO—Multiple Input Single Output), a single column FRF set is obtained as many as the number of excitation points. Accordingly, the entire modal matrix is received in the EMA, including an equal number of multiple excitations and multiple response measurements (MIMO—Multiple Input Multiple Output). The measurement and excitation points determine the size of the modal matrix and the content of the FRFs.
According to the excitation equipment, EMA is divided into two main groups: hammer and shaker tests. The structures' physical and mechanical properties are essential in selecting test methods. 1 The classical hammer tests are divided into two groups such as fixed hammer and roving hammer test. The hammer tests can be performed in the form of SISO, SIMO, MISO, and MIMO. In the SISO test, a single FRF is obtained; thus, the mode shape cannot be obtained. However, other parameters such as natural frequency and damping ratio can be obtained, albeit low validity. All modal parameters are obtained in tests performed in different forms.
Similarly, the classical shaker tests are applied as SISO, SIMO, MISO, and MIMO. Nevertheless, here, there is a critical issue different from the hammer test. In conventional multi-excitation shaker tests, there are as many excitation points as the number of shakers. This situation leads to fewer FRFs in the modal matrix. To obtain more FRF, the equipment in which the response signals are measured must be increased, increasing the cost considerably. Therefore, the roving shaker method, similar to the roving hammer method, is proposed and implemented. All points determined on the structure can be excited in the roving shaker method, and the number of FRFs obtained is increased. Thus, the test performance can be improved to get modal parameters. Also, the number of equipment where response signals are measured will be reduced, and costs will be reduced in parallel.
The application method of the roving shaker method is technically the same as the roving hammer method. The roving shaker method is proposed to obtain the modal parameters of structures that cannot be excited by a hammer. As it is known, the roving hammer method shows high performance in modal tests of sheet-like structures. However, the performance of hammer tests decreases. The error rate in modal parameters increases when the thickness of the structures decreases, that is, the rigidity decreases and the nonlinearity increases. It is observed that the roving inertial shaker method can be used as a solution to these problems. Besides, errors such as double impact are common in hammer tests. This case extends the test times and may cause residual errors in the result. The disadvantages of the hammer tests can be eliminated with the roving shaker method.
Moreover, the traditional shaker tests are applied to the rigid regions of the structures. Generally, the classical modal shaker is not attached directly to sheet-like structures because of the excitation’s vibration energy loss. This situation is not the case in the roving shaker method, and it can be applied to sheet-like structures. The roving inertial shaker method and the roving hammer method are schematically described in Figure 1 as this study’s subject. MISO test methods, 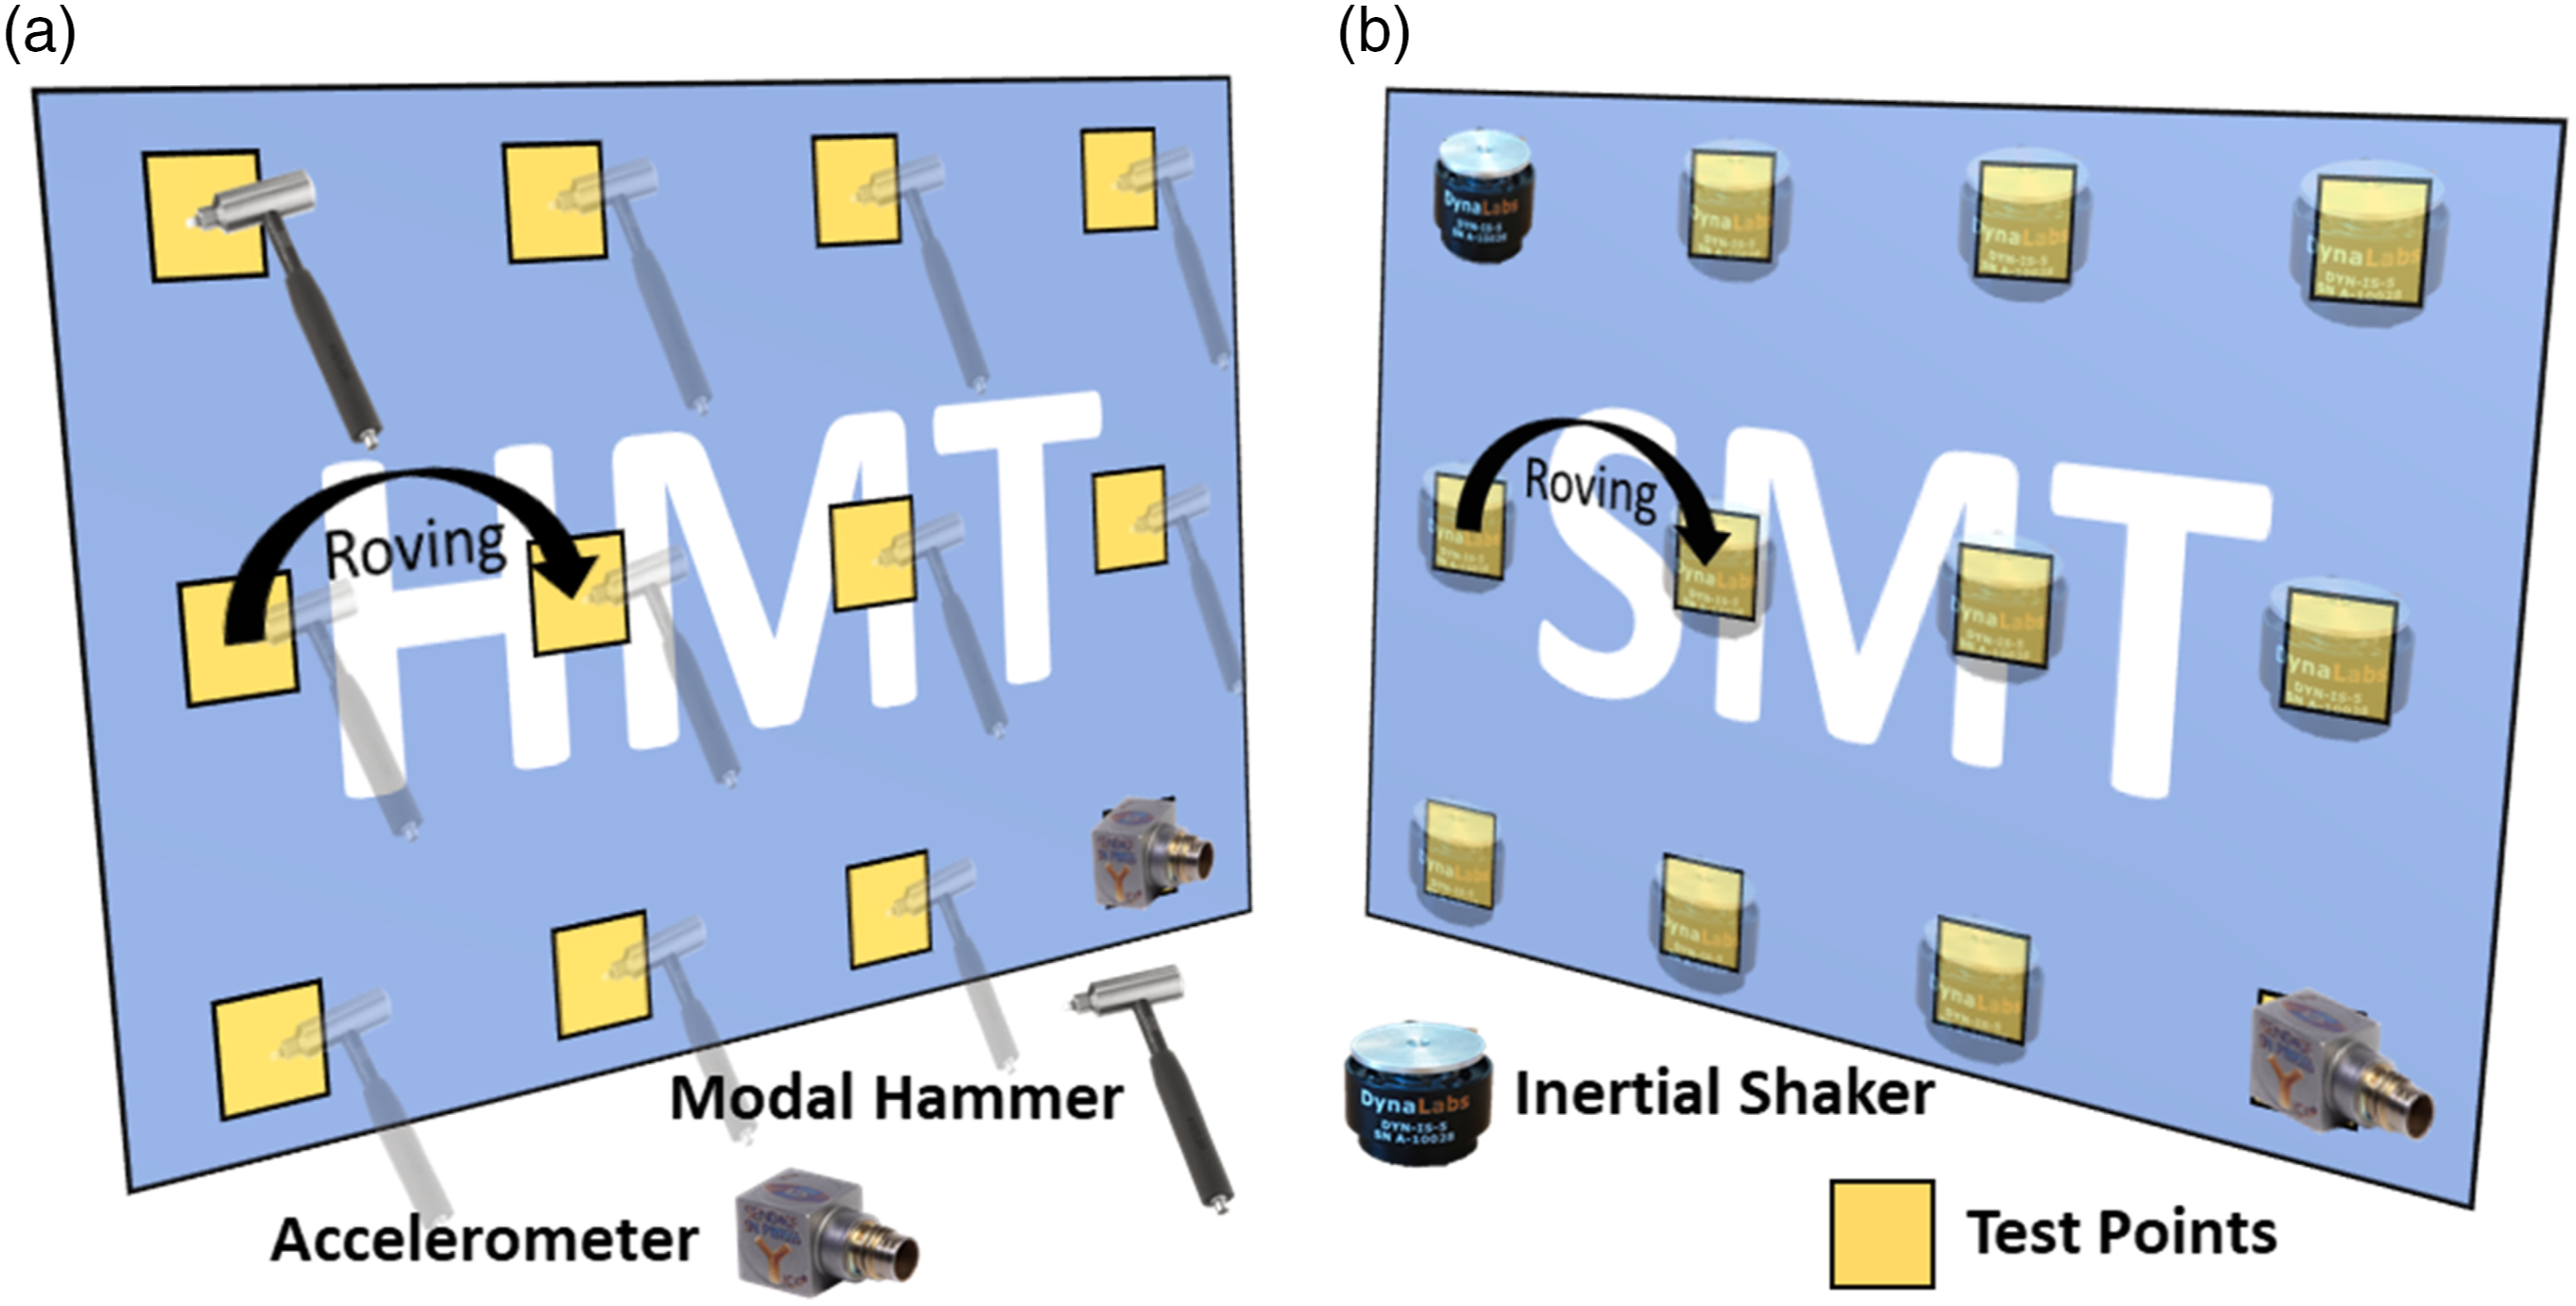
In these proposed methods, the multiple excitation point is determined on the structure, and response is measured from a single point. This type of modal test is called the MISO. As shown in Figure 1, the only difference between the two methods is the excitation tool. The inertial shakers work differently than the conventional modal shakers. The vibration is transmitted to the structure with a stinger in the classical modal shaker. However, in the inertial shaker, the whole mass vibrates, and this vibration is sent directly to the structure with the conserved energy. It is challenging to apply the roving shaker method with classical modal shakers. Since all the disadvantages of shaker tests will be revealed for all excitation points, the test time is increased, and performance can be reduced. Therefore, with an inertial shaker, the structure can be quickly excited with the desired vibration intensity. It is only necessary to attend to the undesirable mass effect of the inertial shaker. This study investigates and presents the roving inertial shaker method’s superiority using an inertial shaker over a classical approach.
Experimental modal analysis of a plate bolted on four sides
In this section, the experimental modal analysis of a steel plate with bolt connections on four sides is carried out using the roving hammer and roving shaker methods. According to the mode shapes correlations, the numerical modal analysis is performed with the finite element software to compare with the experimental results. A steel plate with 500 × 500 × 2.5 mm is fixed using 15 bolts randomly to 45 mm of the plate sides' thickness. The experimental test setup to perform the experimental modal analysis is shown in Figure 2. Four side bolt-on steel plate and experimental modal analysis test equipment for roving inertial shaker method.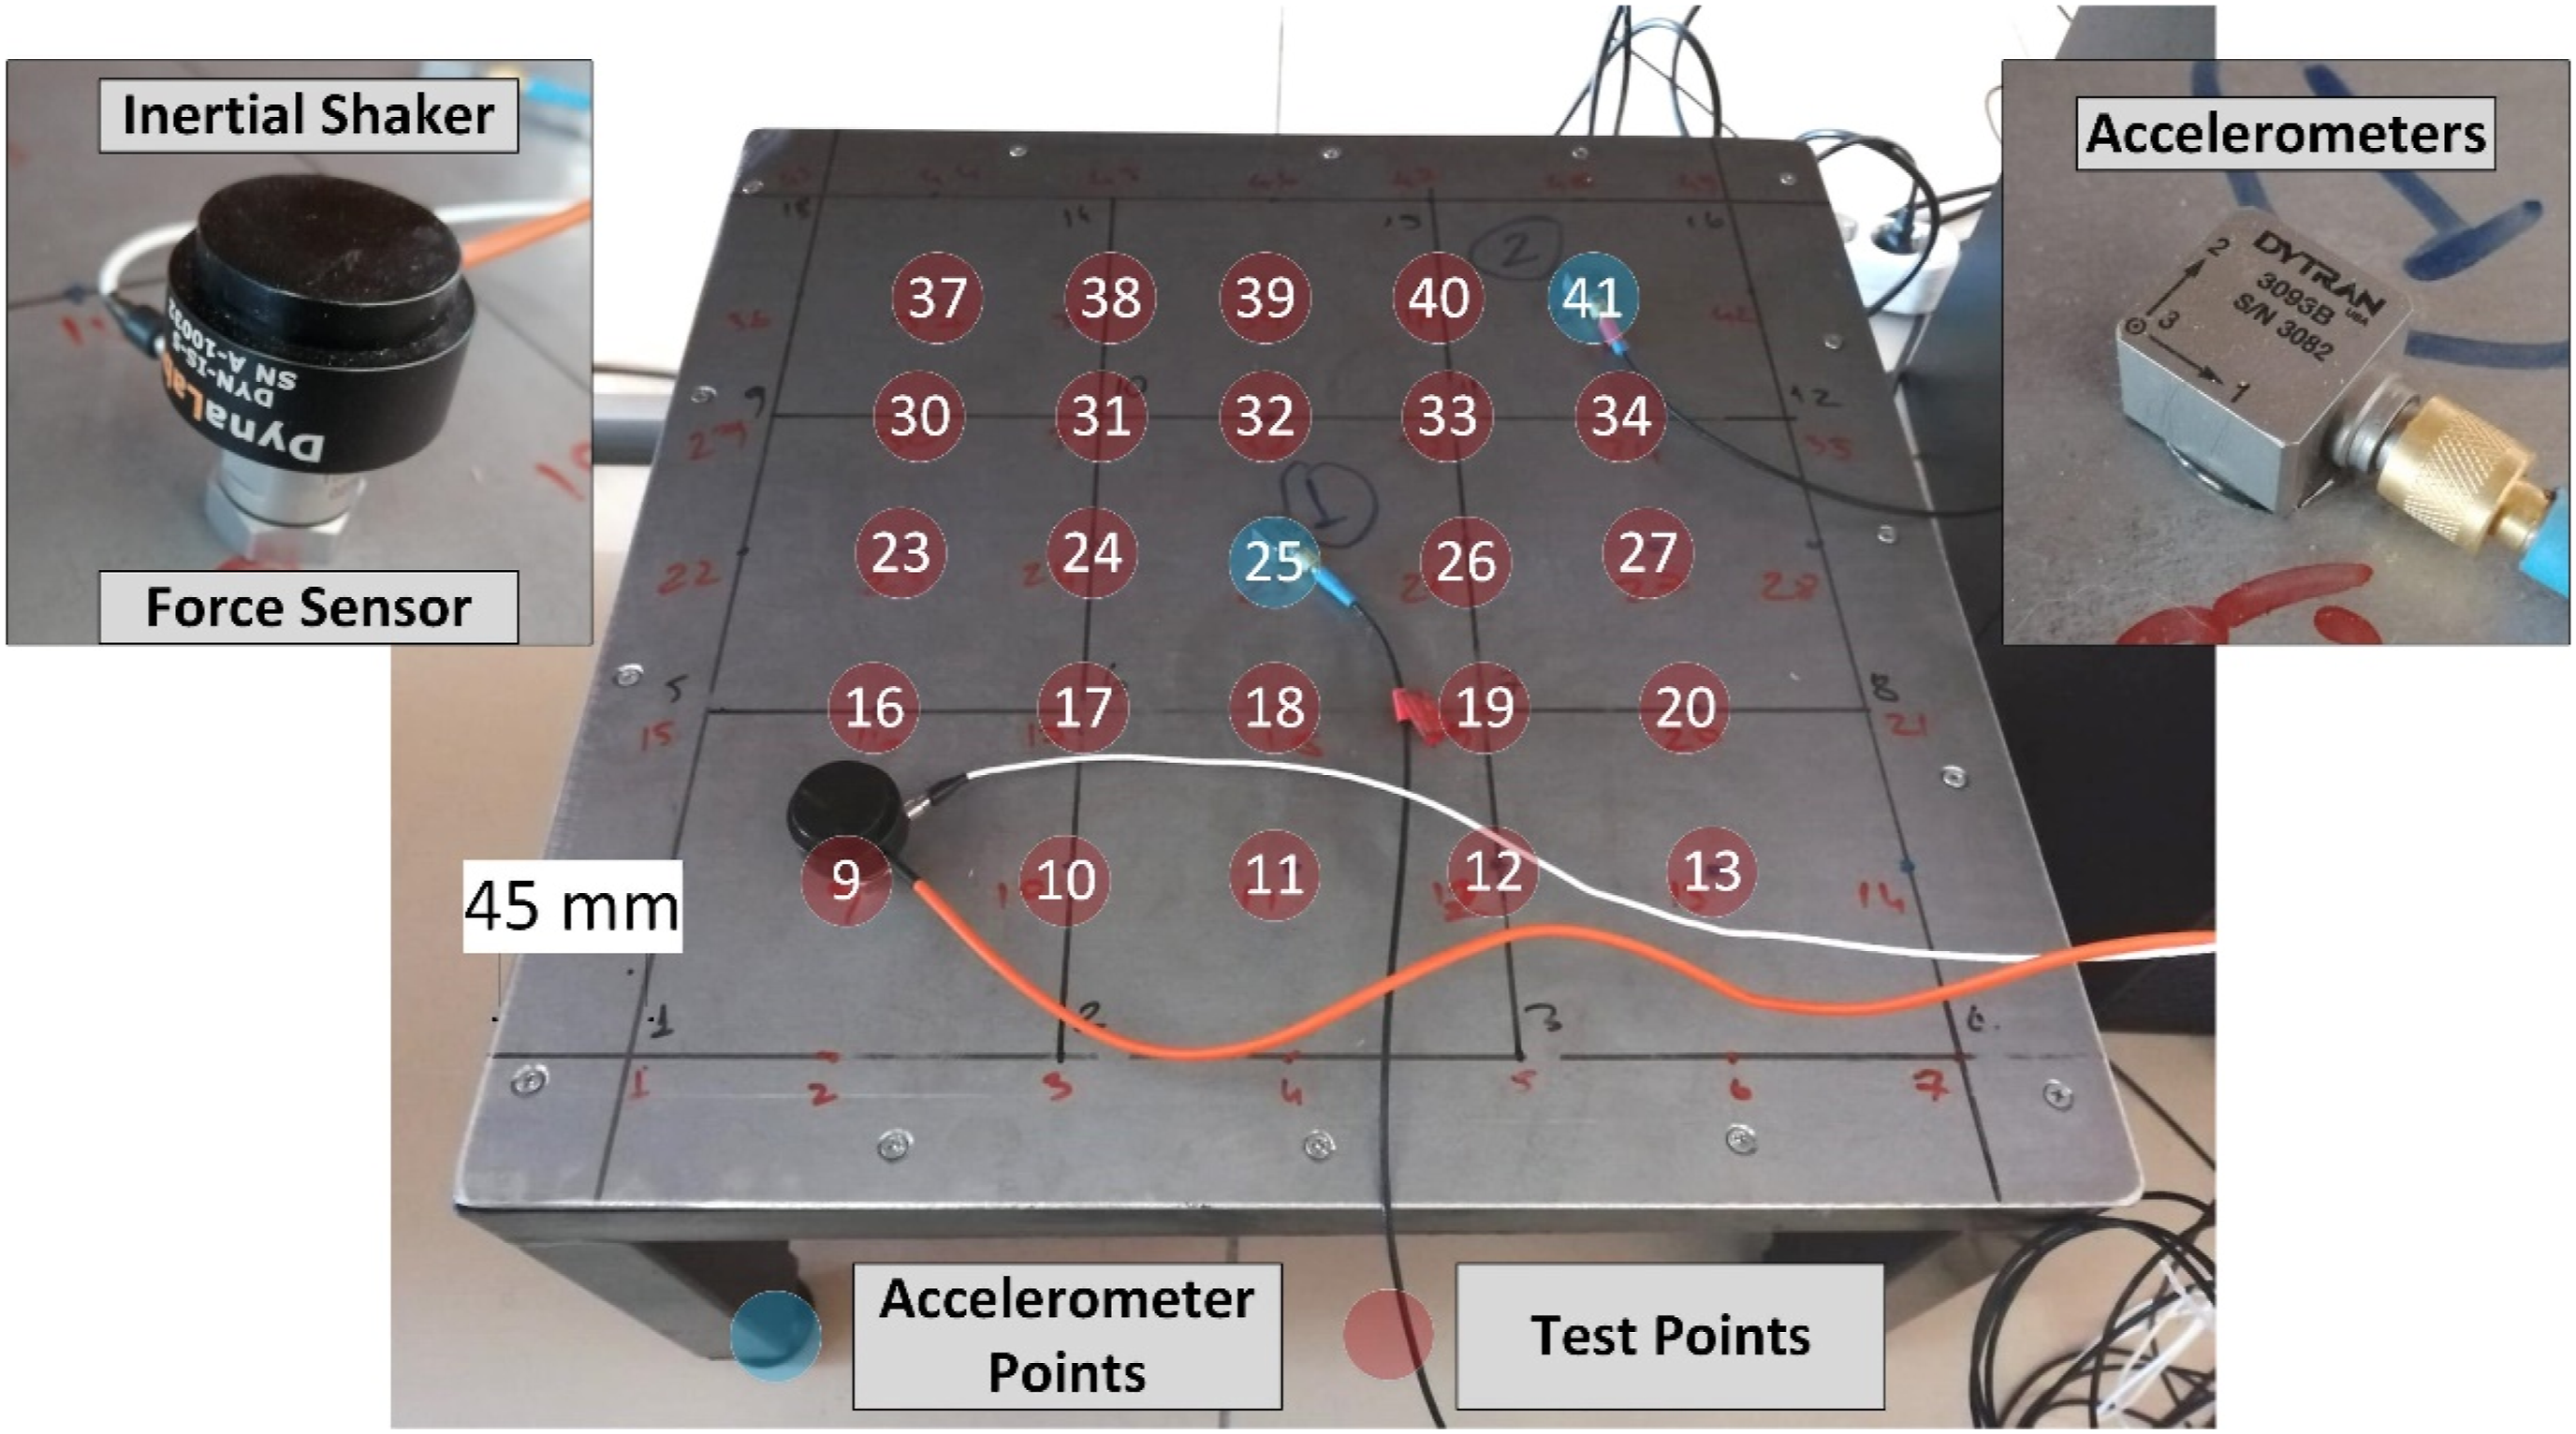
An inertial shaker is used in the roving shaker method to excite the structure, and a modal hammer is used in the roving hammer method. Dynalabs 25 inertial shaker allows the 5 N maximum output force and 10–1000 Hz frequency range. For the shaker test, the force sensor of Dytran company with model number 1053V4 with a sensitivity of 10 mV/lbf is used to measure excitation. The Dytran modal hammer with model number 5800B2 is used for the roving hammer method. Dytran’s triaxial accelerometer with model number 3093B is used to measure responses for each technique. It has a measuring range of 50 g and a sensitivity of 100 mV/g. The Dewesoft/Sirius acquisition system is used to perform the experimental modal analysis.
A burst random signal is used to excite the plate in the roving shaker test. The measurement is repeated four times per point, and the result is averaged to ensure high-quality FRFs are obtained. Similarly, the trigger is repeated four times per point in the roving hammer method, and the result is averaged. The sampling rate is selected as 2000 Hz for each modal test, and the FRF frequency range is used as the bandwidth of 500 Hz. The obtained FRF data are analyzed using the LMS/TestLab PolyMax. First, the necessary pre-tests (linearity, reciprocity, etc.) are carried out. The structure is determined to be suitable for modal testing. Forty-nine points are determined at equal intervals on a steel plate with bolt connections on four sides to obtain high spatial resolution for the mode shapes, as shown in Figure 2. These points are called test points. Edge points are fixed, and FRFs are obtained from 25 points (9… 13, 16… 20, 23… 27, 30… 34, 37… 41), excluding edge points. Two accelerometers are used in both methods to compare the results of response measuring position. These accelerometers are located at points 25 and 41. In the LMS/TestLab, the plate’s test geometry, as shown in Figure 3, is created to show experimental mode shapes. The FRFs are obtained from only 25 points in the middle area except for the edge points. Test geometry created in LMS/TestLab software.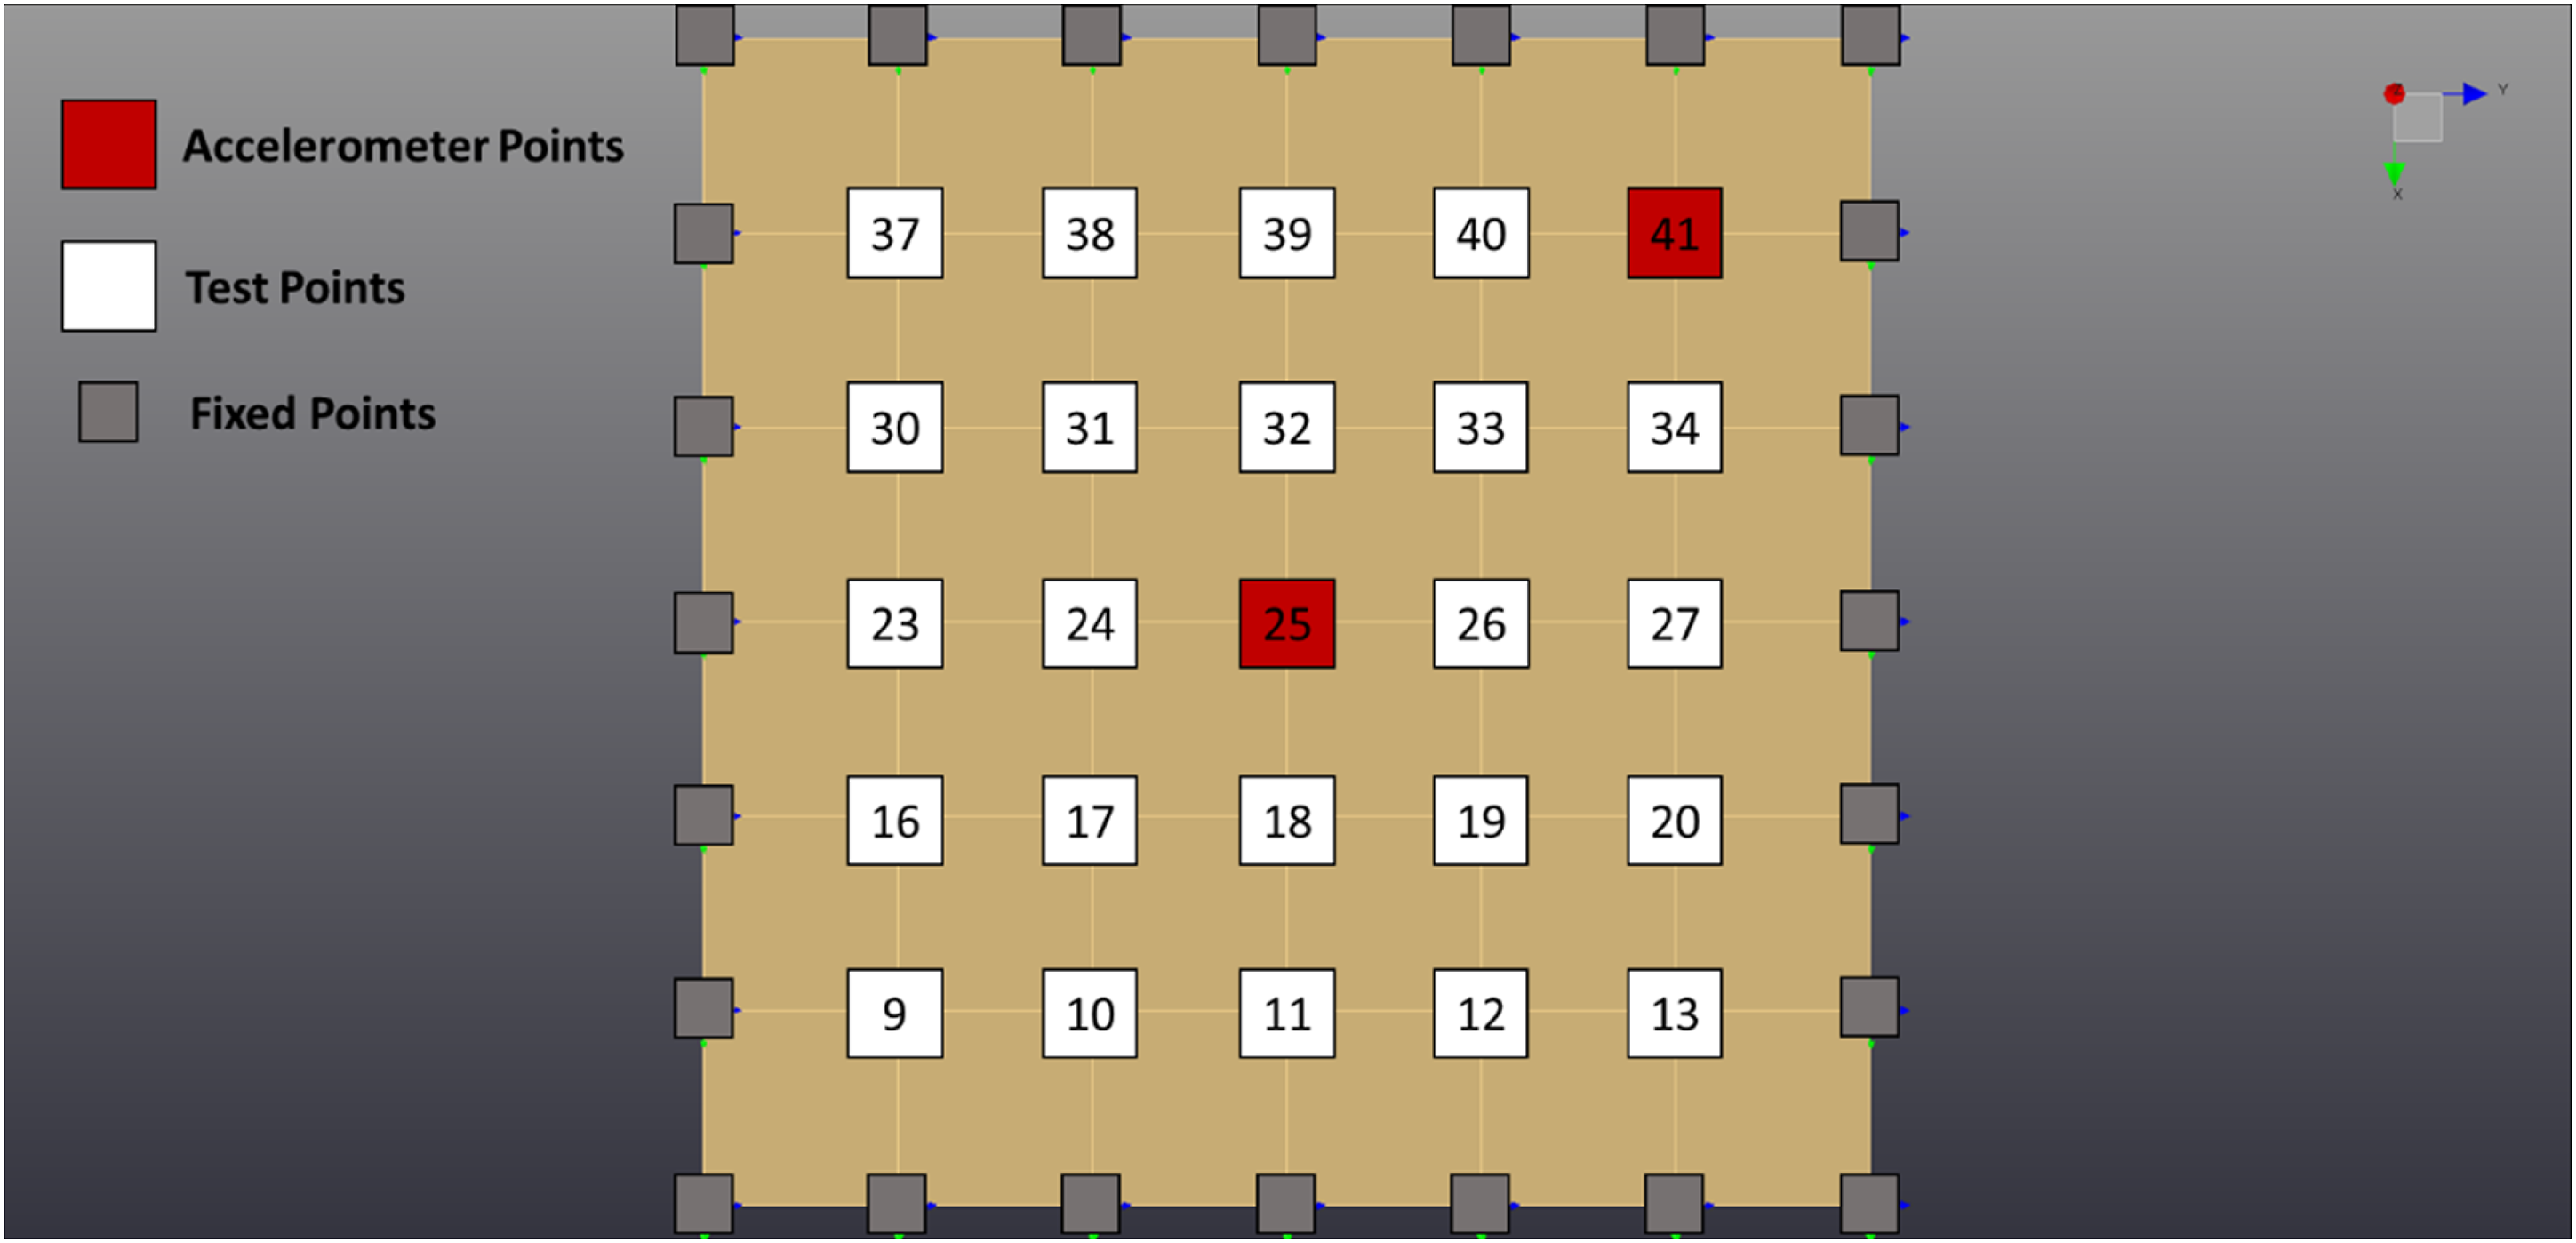
Two experimental data sets are obtained for the proposed methods, separately. For both methods, 25 FRFs are obtained from the accelerometer located at the 25th and 41st points. Shaker tests are abbreviated as SMT (Shaker Modal Test) and hammer tests as HMT (Hammer Modal Test). Thus, the roving shaker tests are named “SMT-1” and “SMT-2,” and similarly, the hammer tests are called “HMT-1” and “HMT-2”. In addition, SMT-1 and HMT-1 test data are obtained with the accelerometer at the 25th point, and SMT-2 and HMT-2 test data are obtained with the accelerometer at the 41st point. Using the LMS PolyMAX stability diagram, the structure’s possible modes are determined.26,27 The stabilization diagrams are given in Figure 4 for the shaker tests (SMT-1 and SMT-2).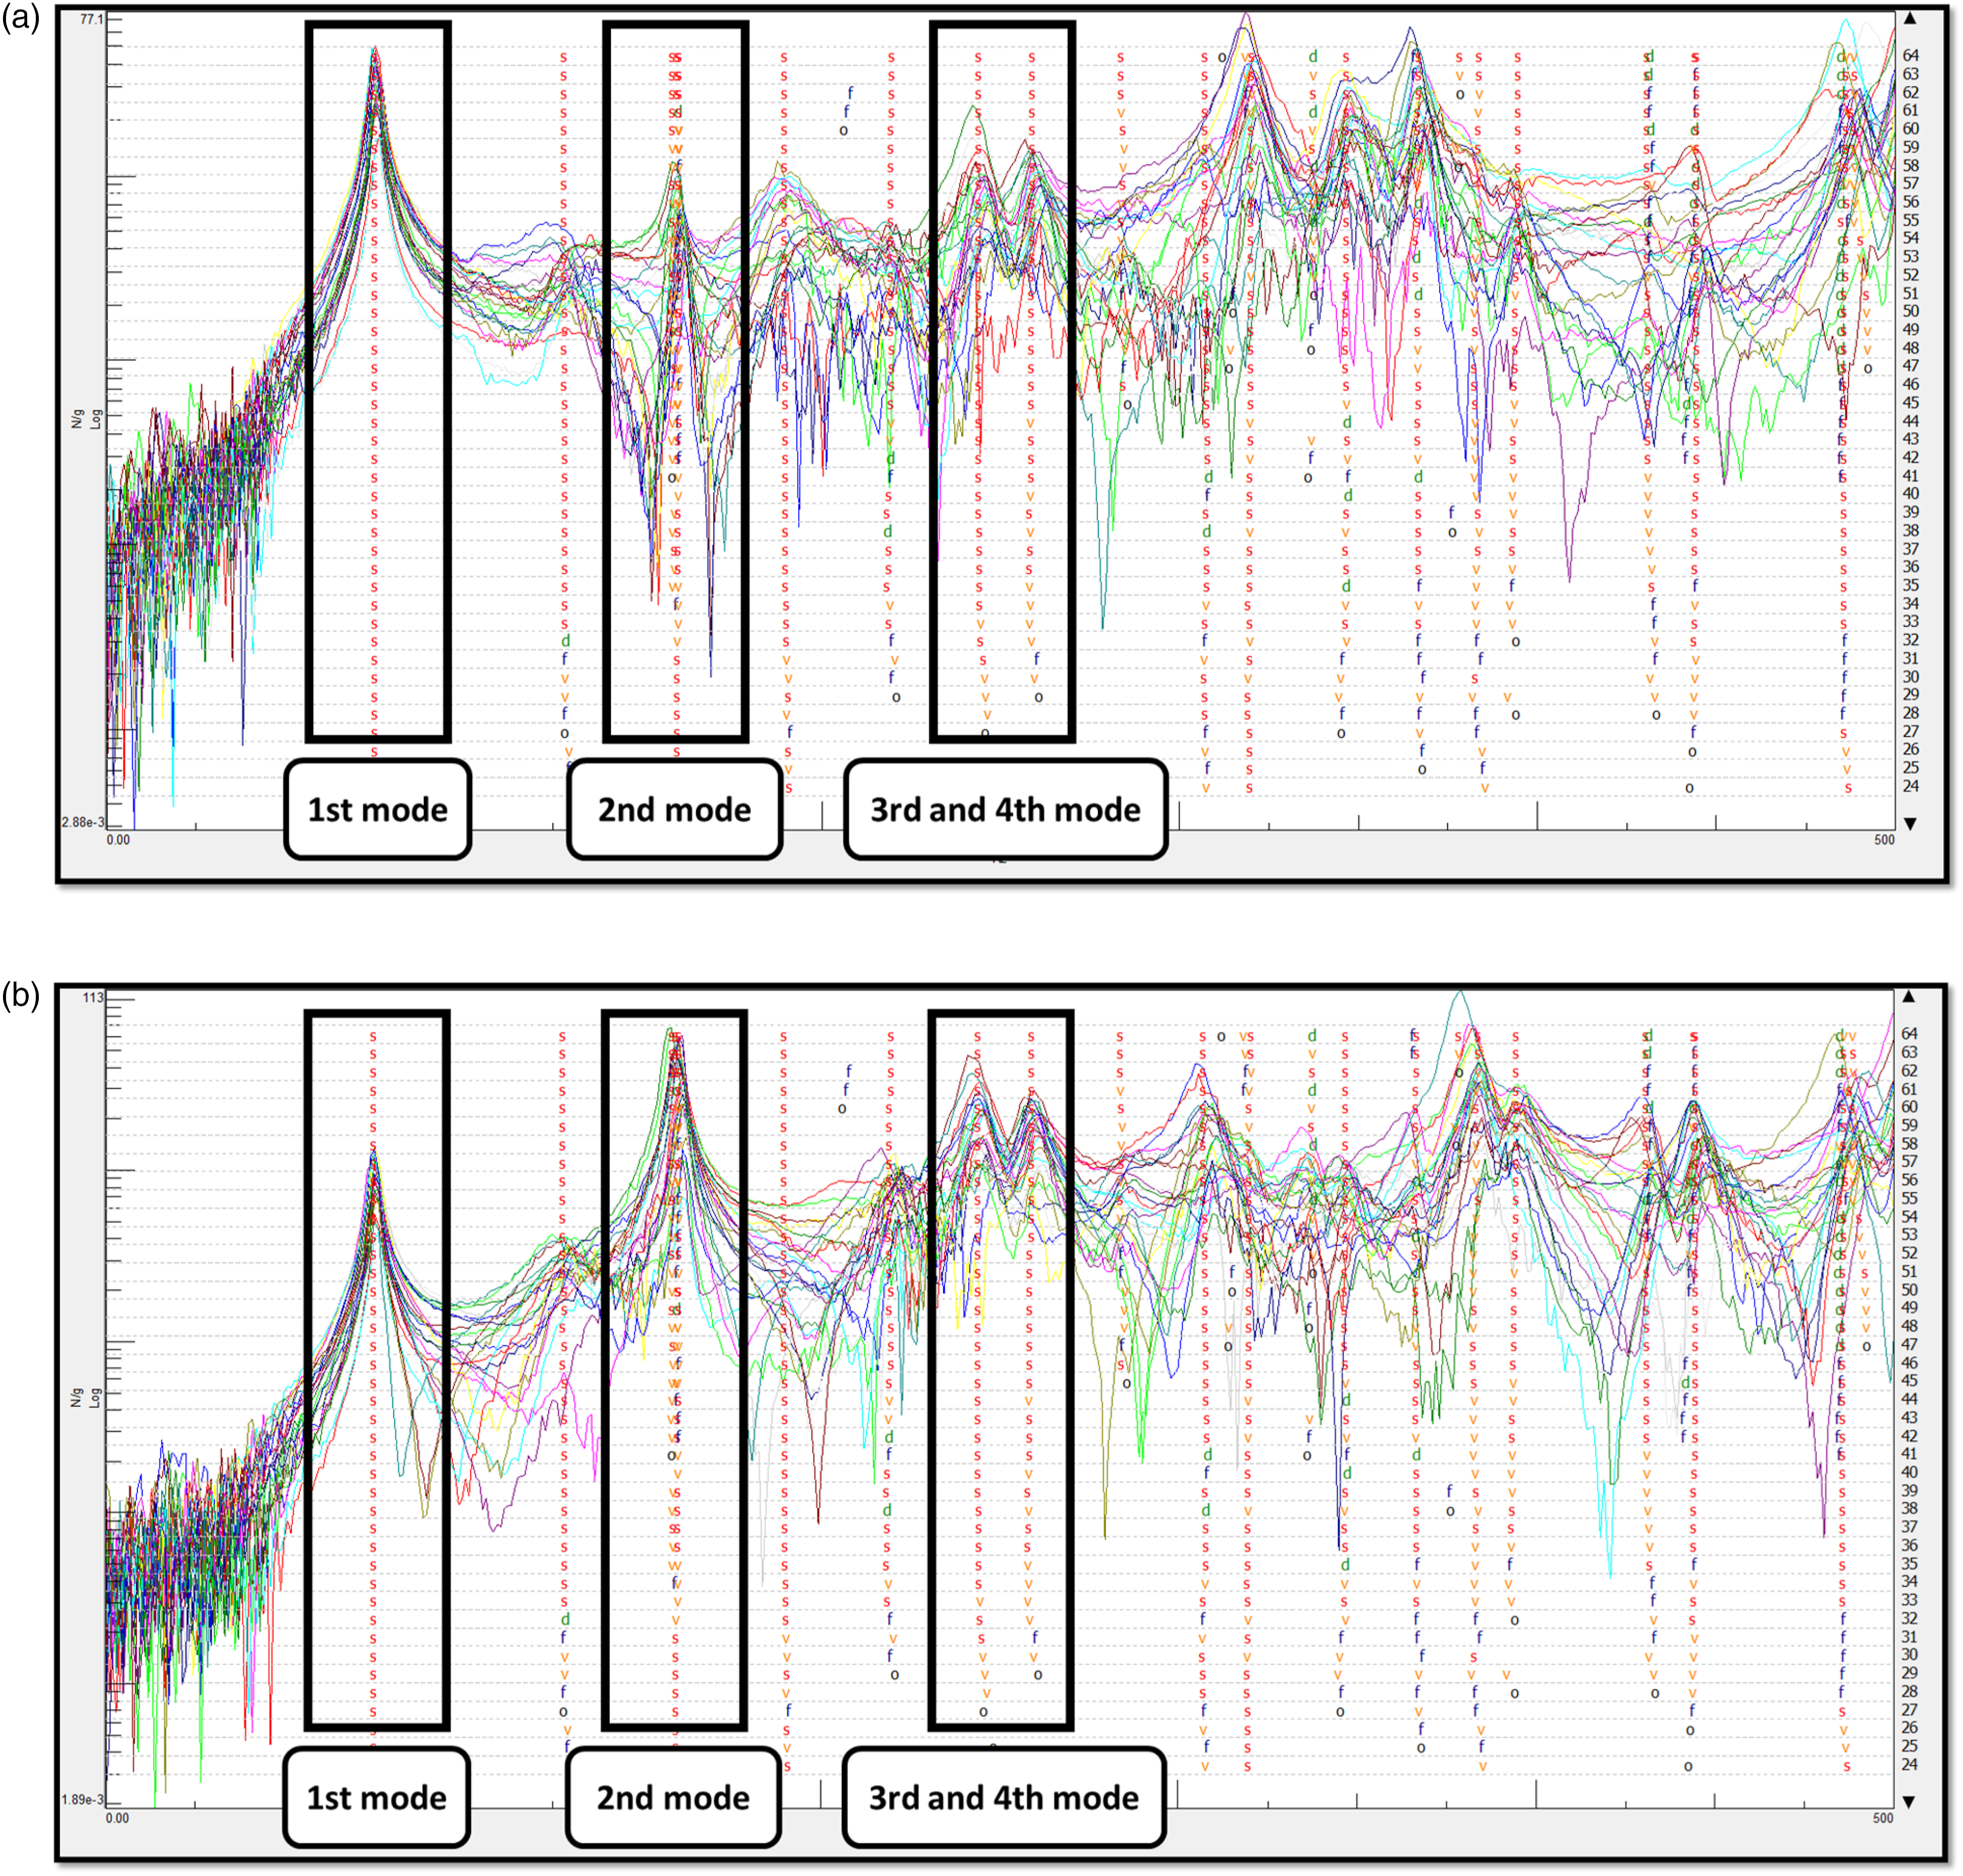
Here, the dominant “s” values and the peak frequencies identify the possible modes.
28
Four peak points are selected for SMT-1 and SMT-2 according to the stable poles after the curve fitting. Similarly, the PolyMax stabilization diagrams are given in Figure 5 for hammer tests (HMT-1 and HMT-2). It is seen that hammer tests contain more complex, less stabilized FRFs compared to roving shaker tests.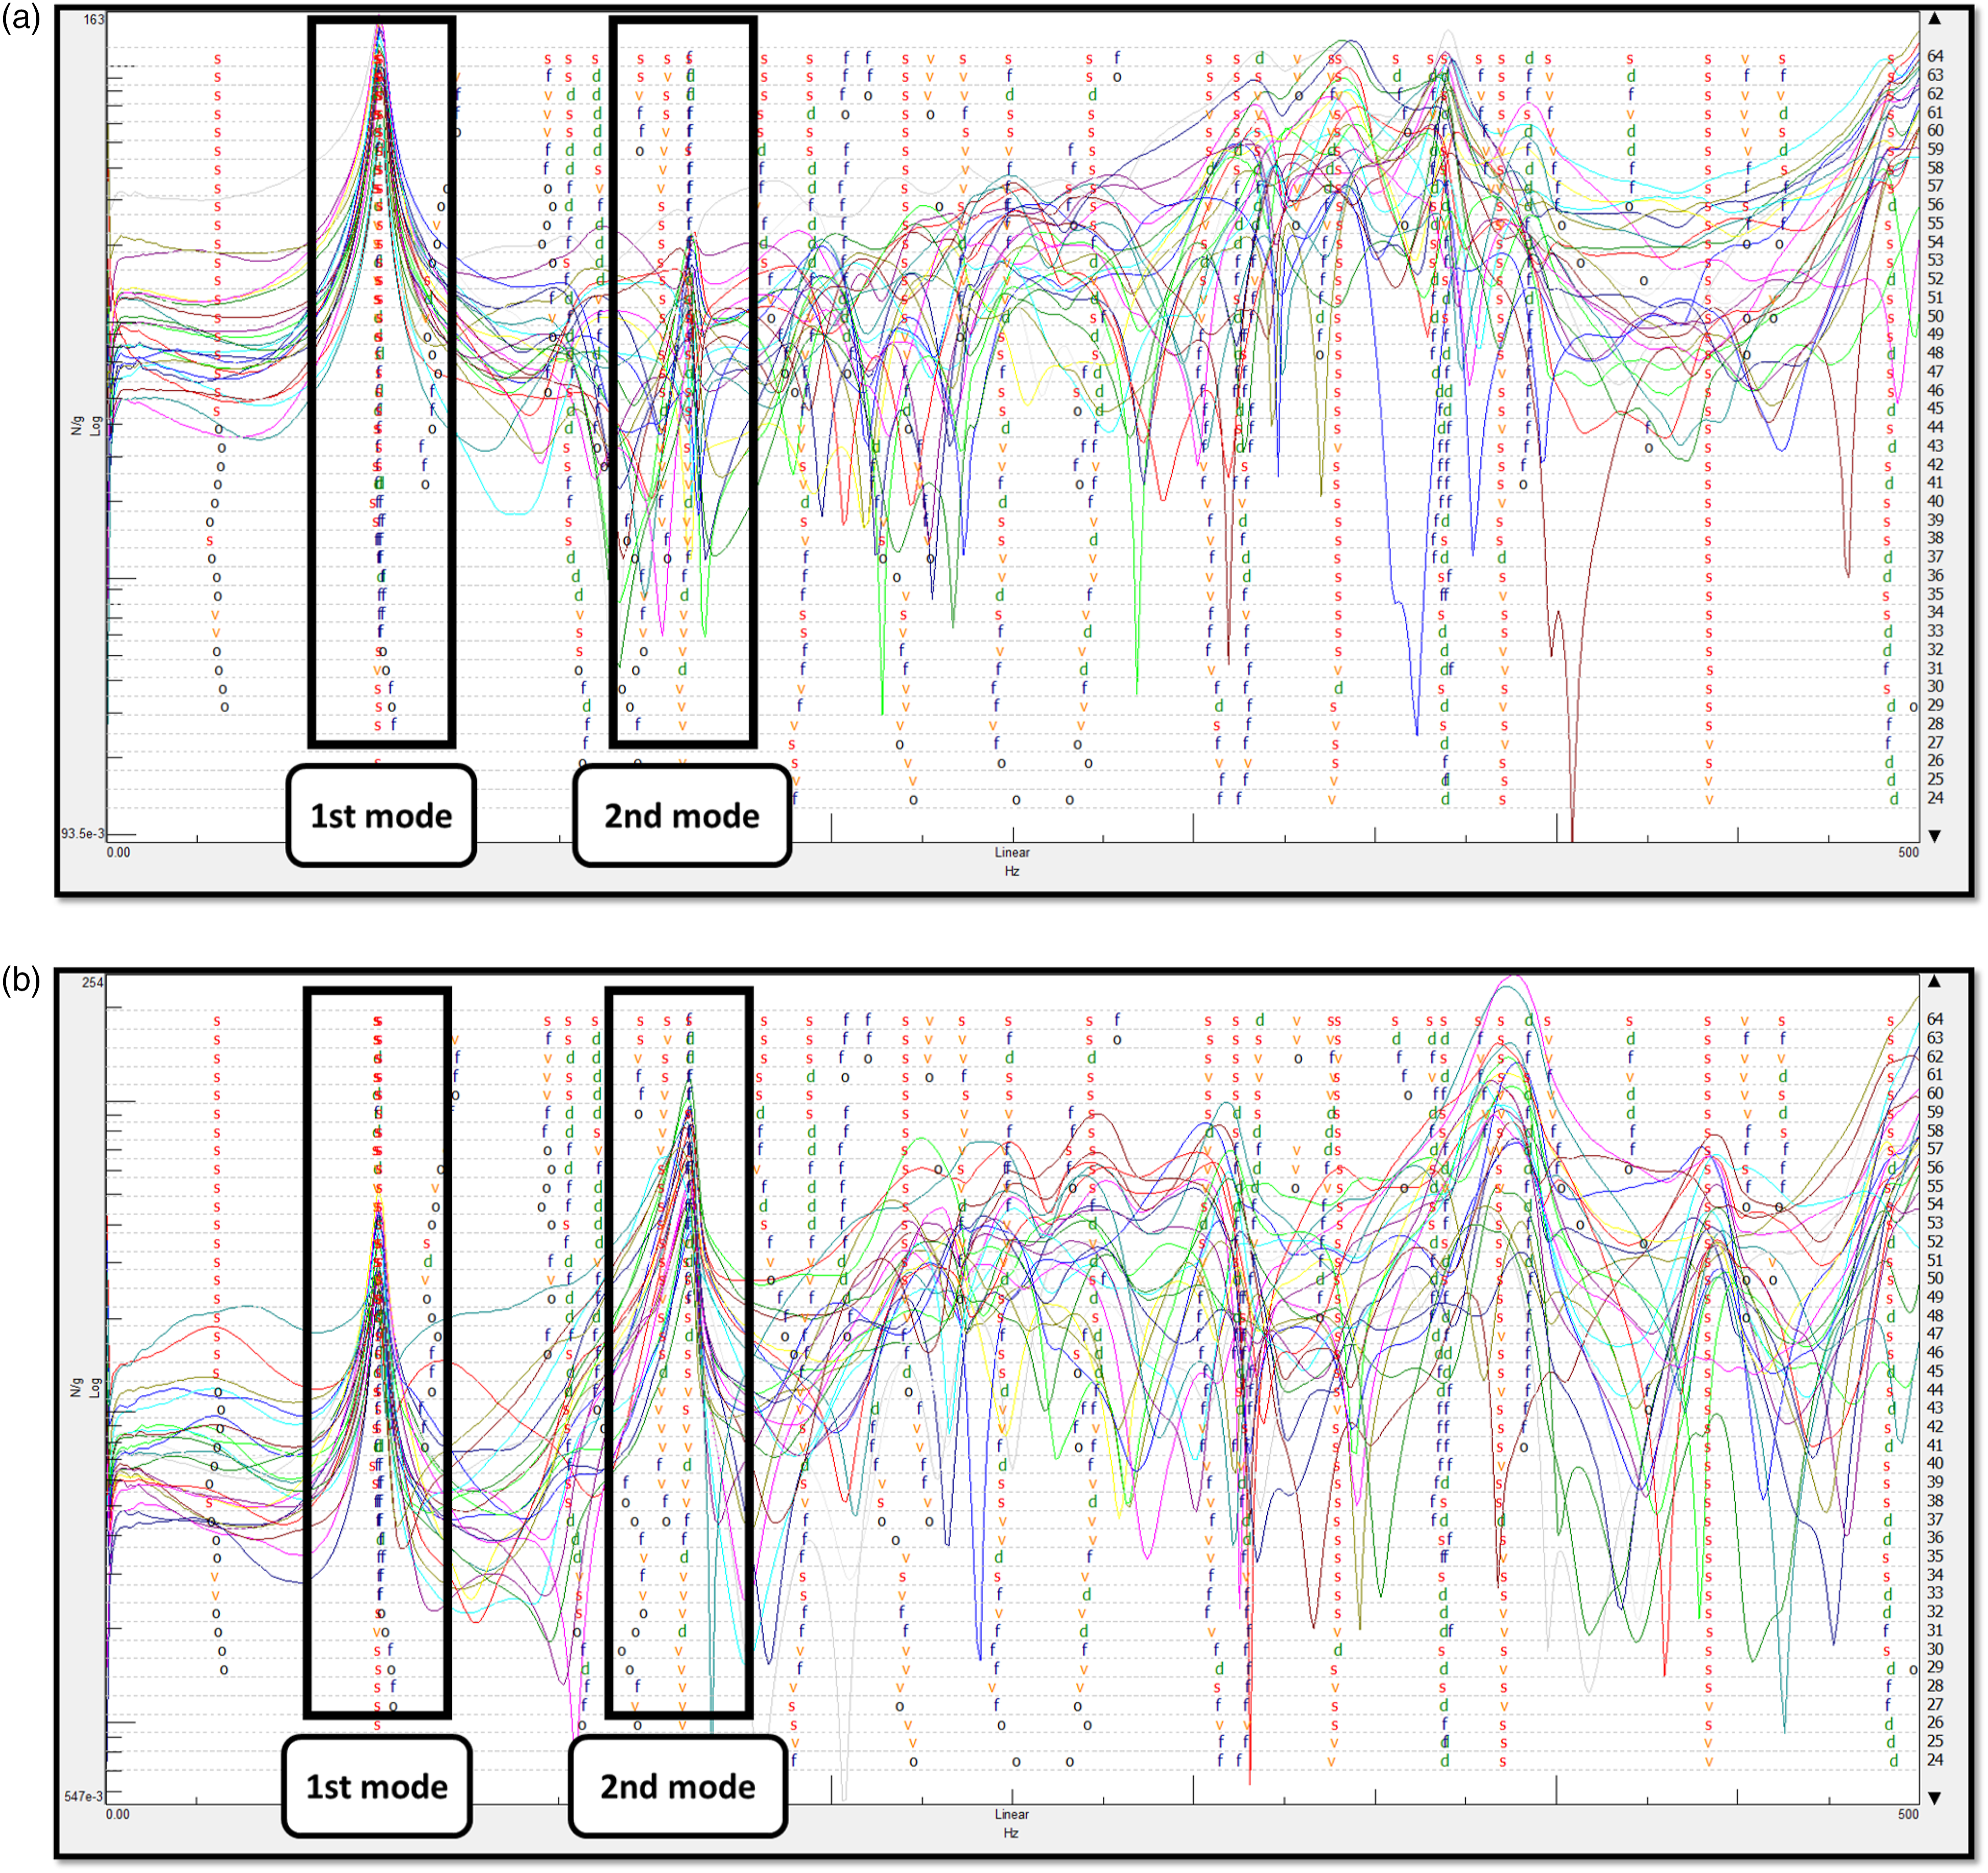
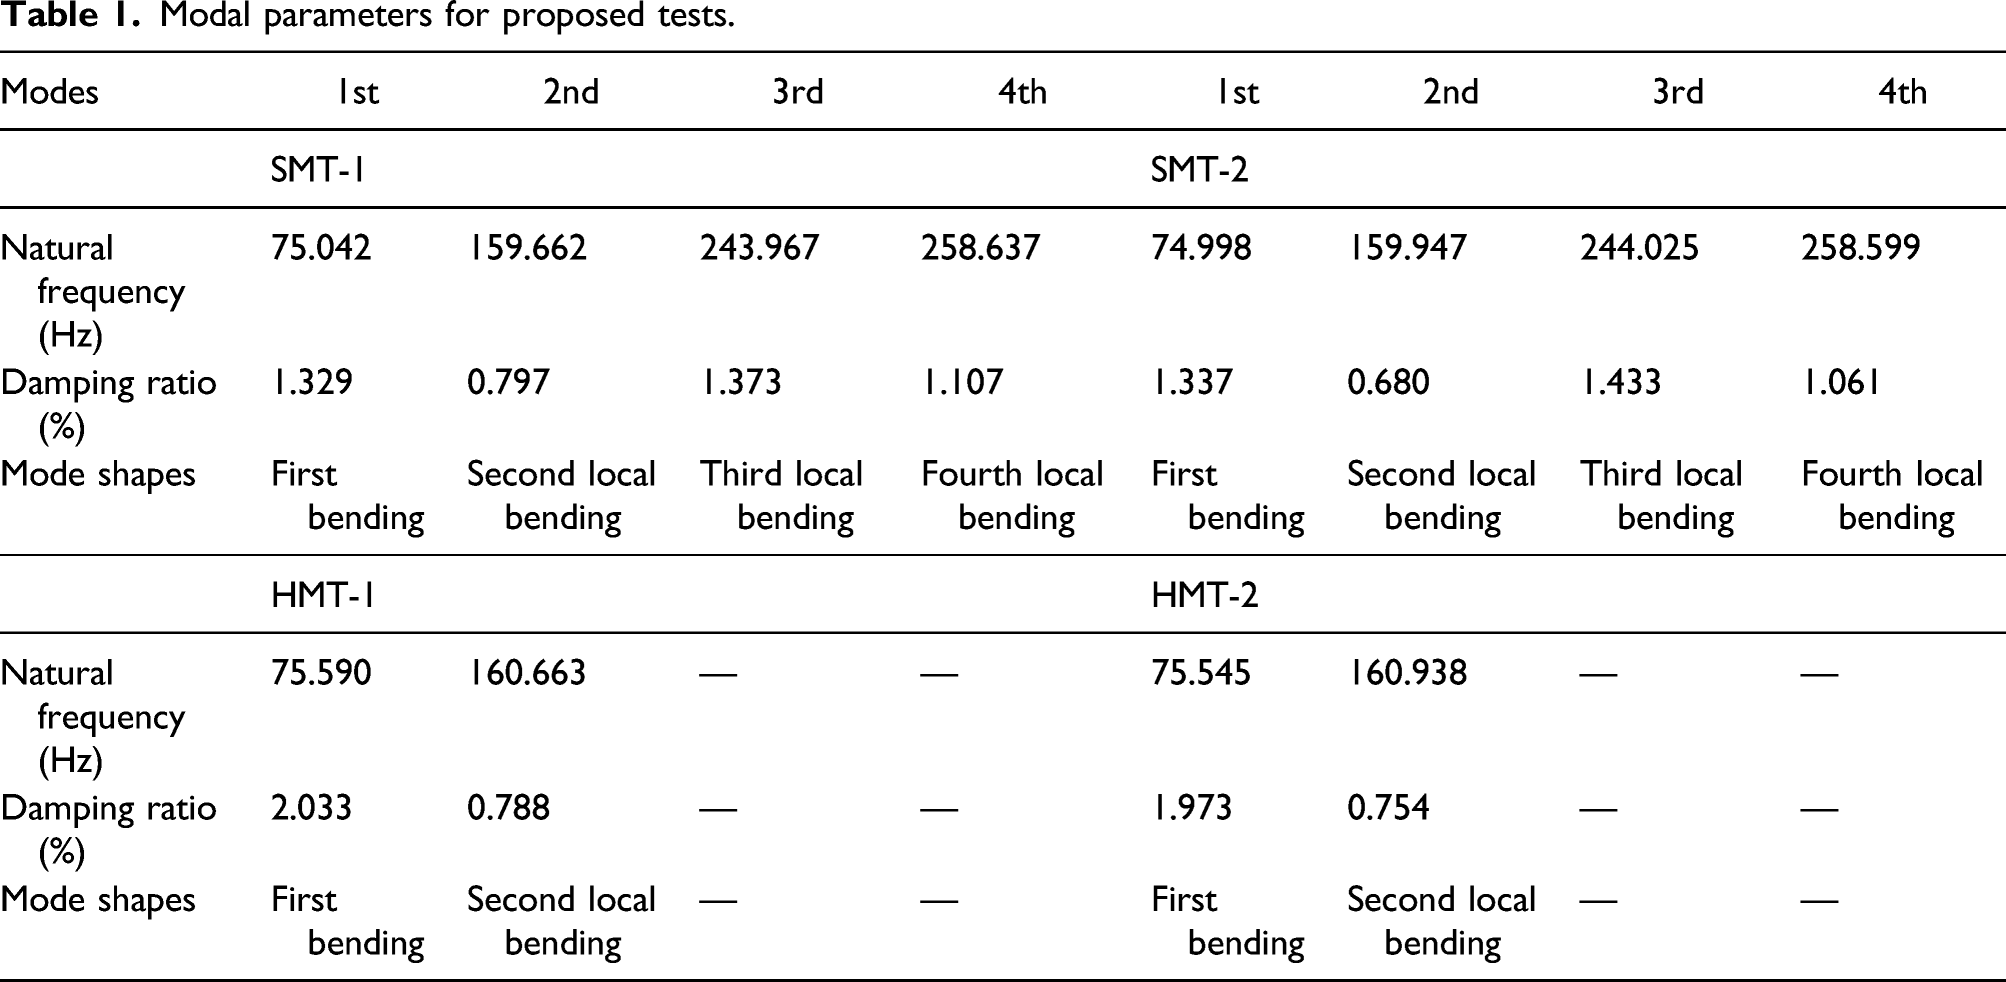
Modal parameters for proposed tests.
Investigation of roving shaker method results with modal analysis validation methods
This section presents the experimental results obtained with the roving shaker method to investigate the accelerometer position’s effect. Since the desired level of FRFs stability could not be obtained in the roving hammer method, hammer test results are not analyzed.
Synthesis of FRFs
FRFs synthesis of SMT-1 and SMT-2.
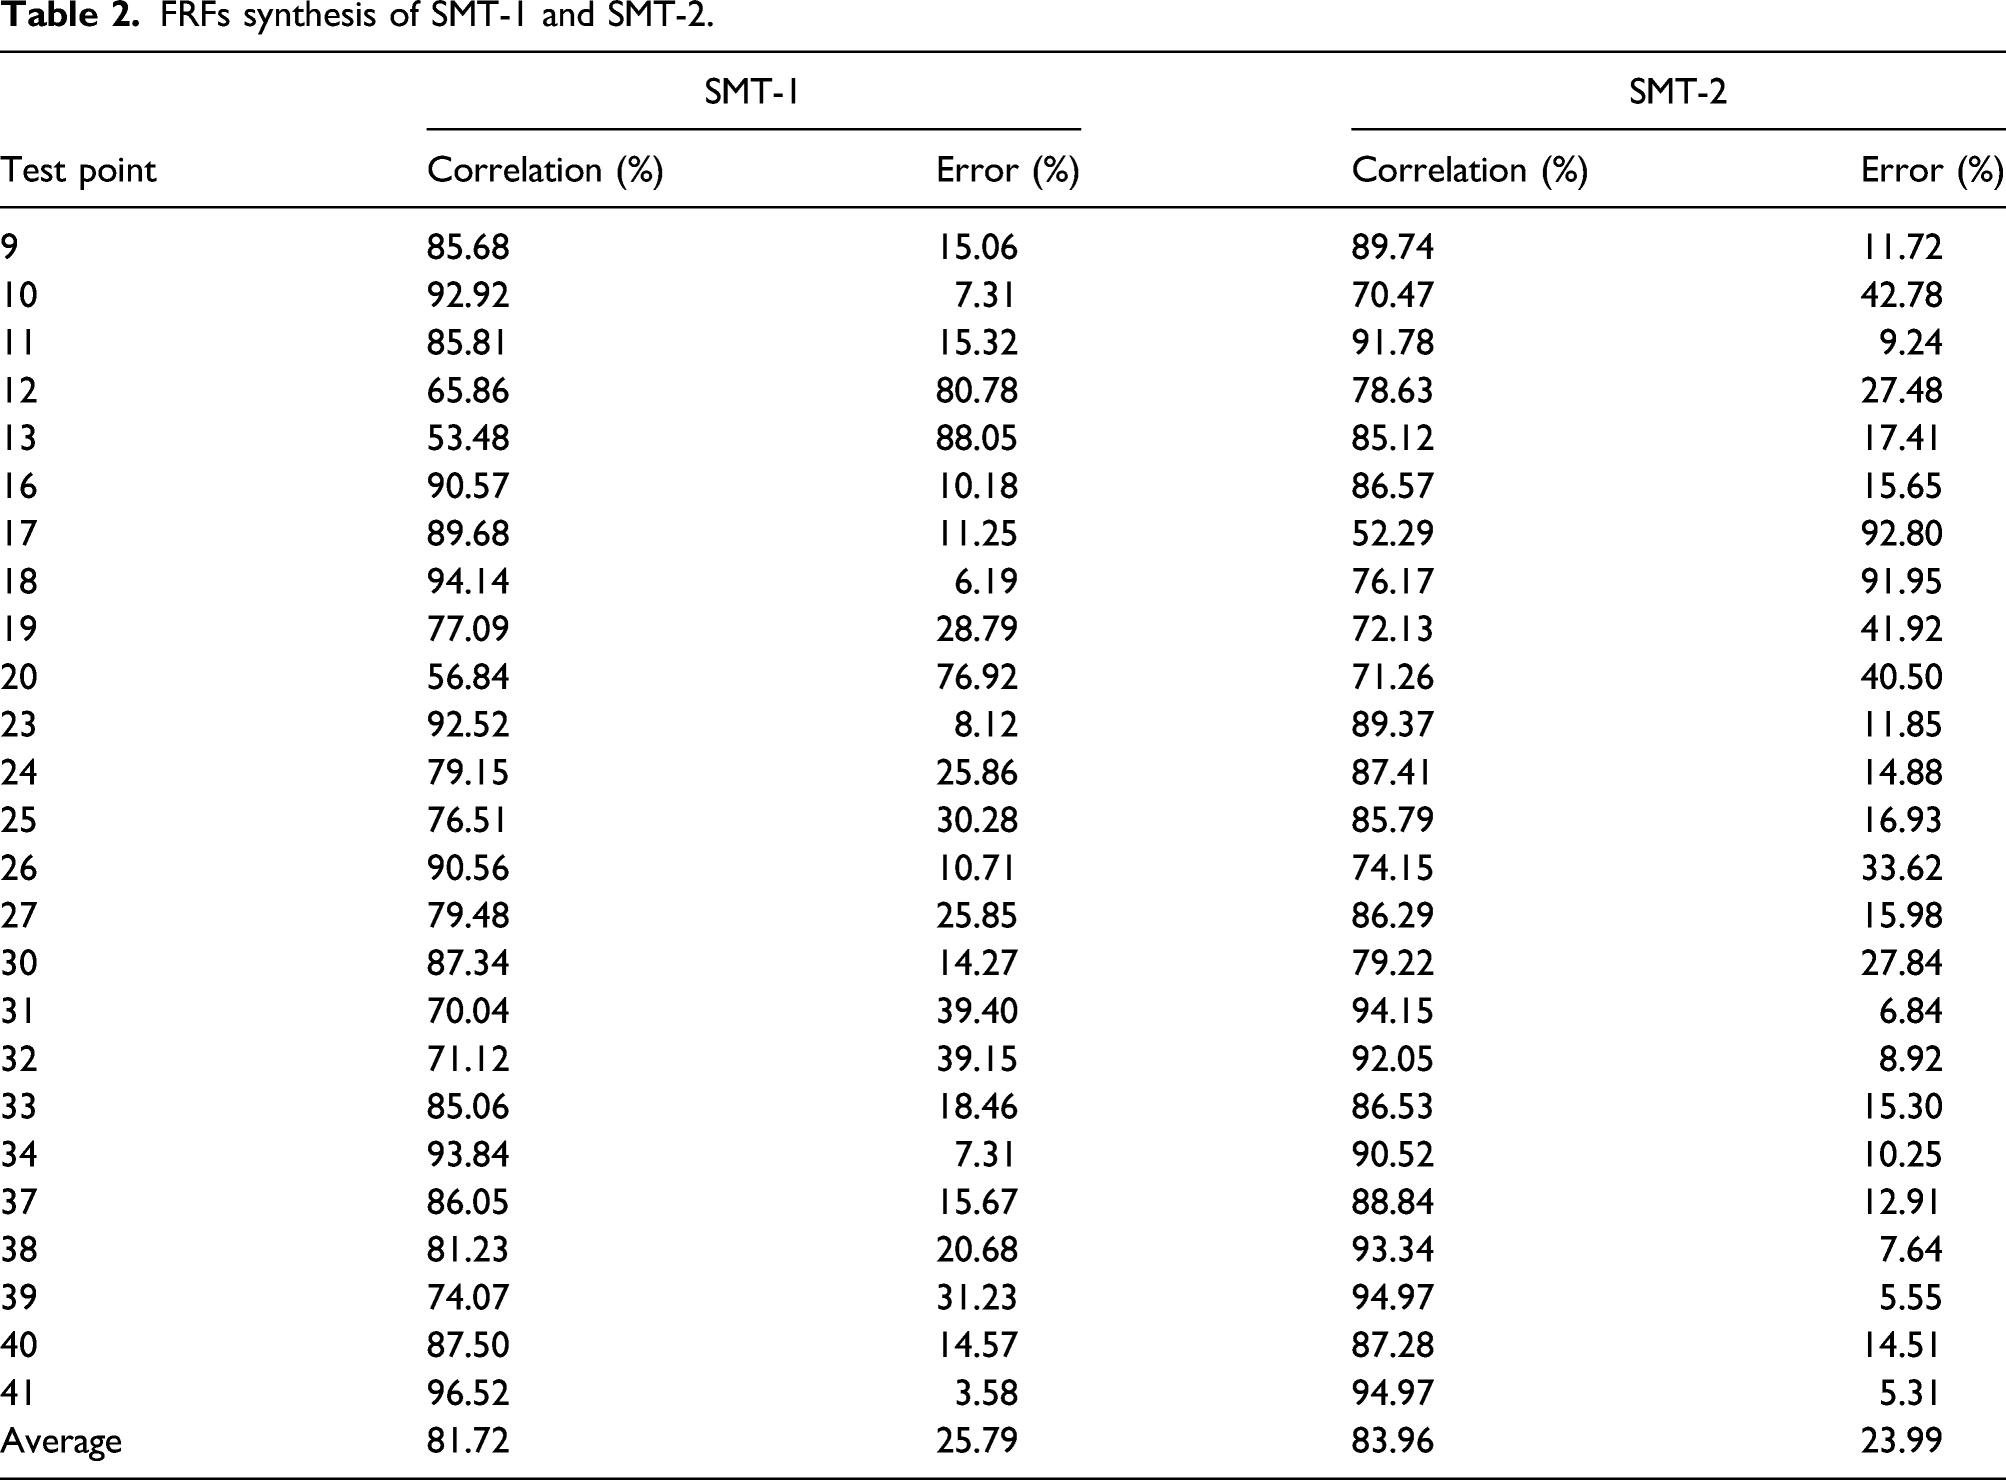
The average correlation for SMT-1 is 81.72%, and the error is 25.79%. Likewise, the average correlation for SMT-2 is 83.96%, and the error is 23.99%. These values are satisfactory when considering selected modes number, dynamical, and environmental conditions. The modal parameters of the synthesized FRF vector obtained from the test data are enough in defining. These correlation value percentages can be increased by decreasing the nonlinearity resources, such as boundary condition, material, and loading. Also, The SMT-2 gives better results with high correlation and low error values than SMT-1.
Modal assurance criterion (MAC)
The Modal Assurance Criterion (MAC) is one of the most popular identifying techniques to compare the modal vectors. MAC is used to evaluate the relationship between two modes that ignore system mass effects .
32
The modal assurance criterion matrices are obtained to show completely independent modes after the curve fitting. The MAC matrices are shown in Figure 6 for SMT-1 and SMT-2 by using LMS/TestLab. Modal assurance criterion 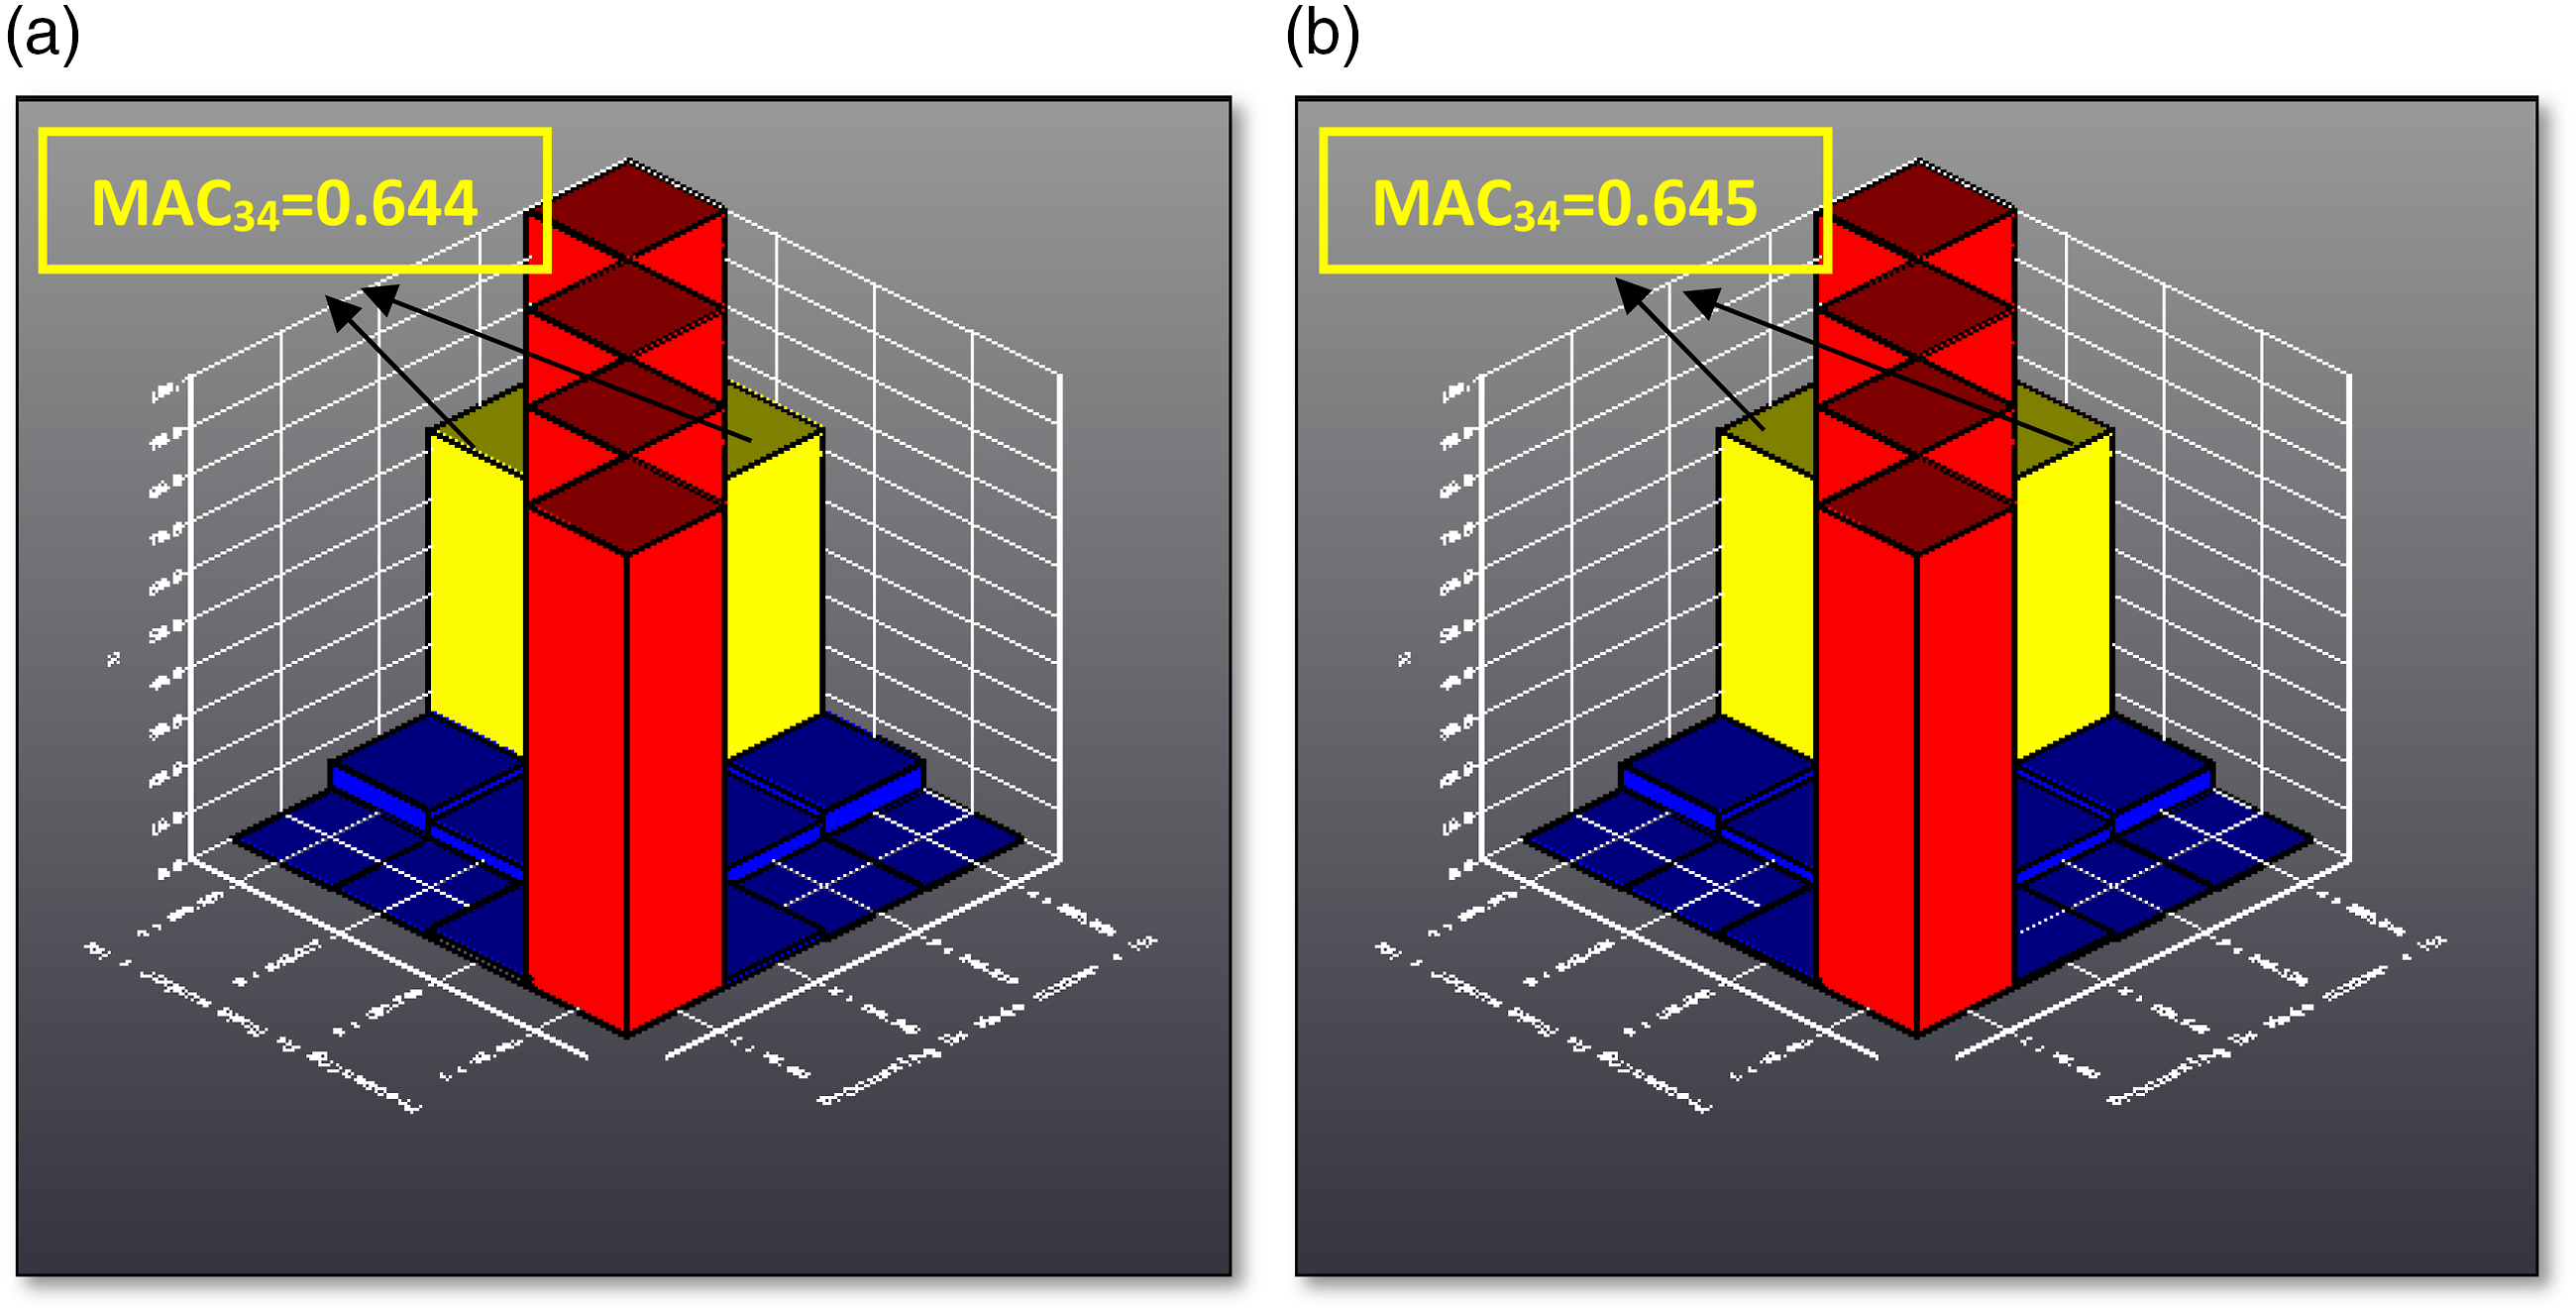
As can be understood from these results, four modes are selected for analysis according to the MAC. The MAC values of the third and fourth modes for SMT-1 and SMT-2 are 0.644 and 0.6452, respectively. This value is at a very high rate, and these modes are linearly dependent on each other. Also, this indicates that it may be a complex mode.
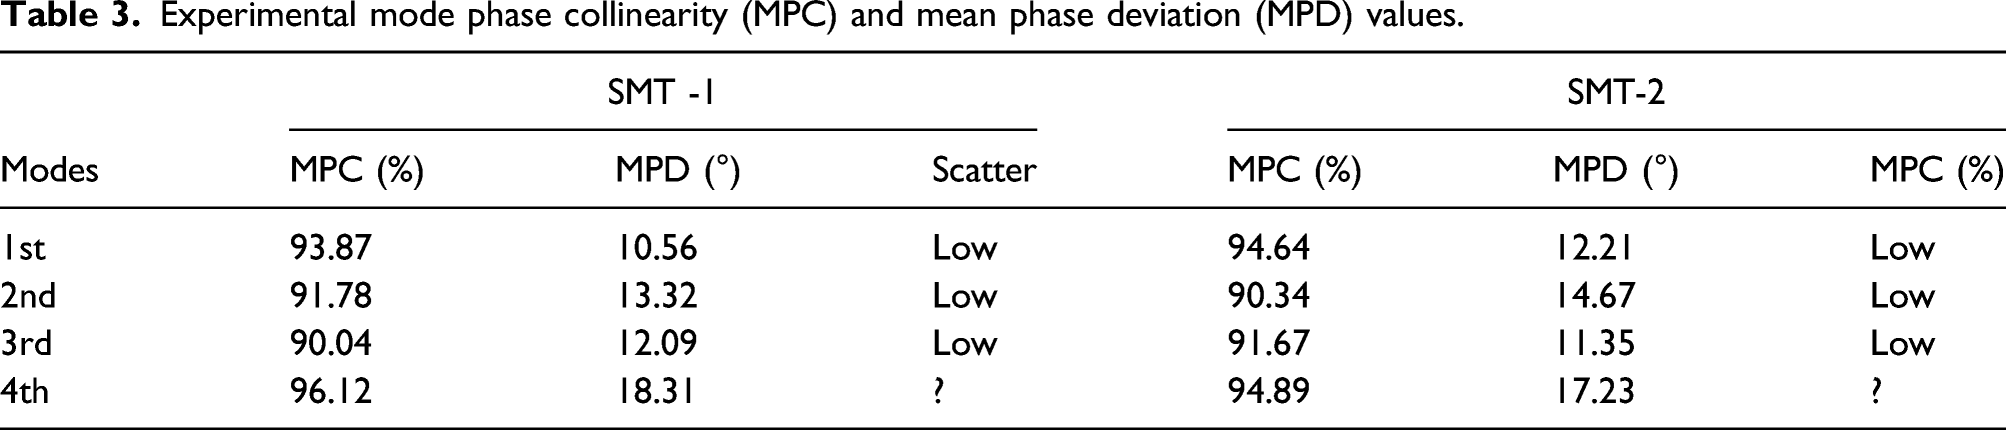
Mode phase collinearity (MPC) and mean phase deviation (MPD)
Experimental mode phase collinearity (MPC) and mean phase deviation (MPD) values.
Experimental and finite element analysis (TEST/FEA) correlation
Finite element-based numerical modal analyses are performed to compare with the experimental results. Bolt connections are applied form of a “beam joint” for the boundary conditions of the structure. Besides, the uncertain mass effect is considered in the finite element analysis.
34
In the experimental modal analysis, the accelerometers and inertial shaker caused an unknown mass impact on the structure. Therefore, this situation is considered in the finite element model. Accelerometers and inertial shaker masses are added as a distributed mass on the system, and numerical modal analysis is applied in this way. LMS/VirtualLab is software used to compare the dynamic characteristics of models obtained by testing and finite element (FE).31,35-38 TEST/FEA correlation is performed in LMS/VirtualLab software in two steps: geometric and dynamic correlation. TEST and FE models of the plate with bolt connection on four sides are presented in Figure 7. First, geometric correlation is performed with the marked yellow points in both models. Virtual models 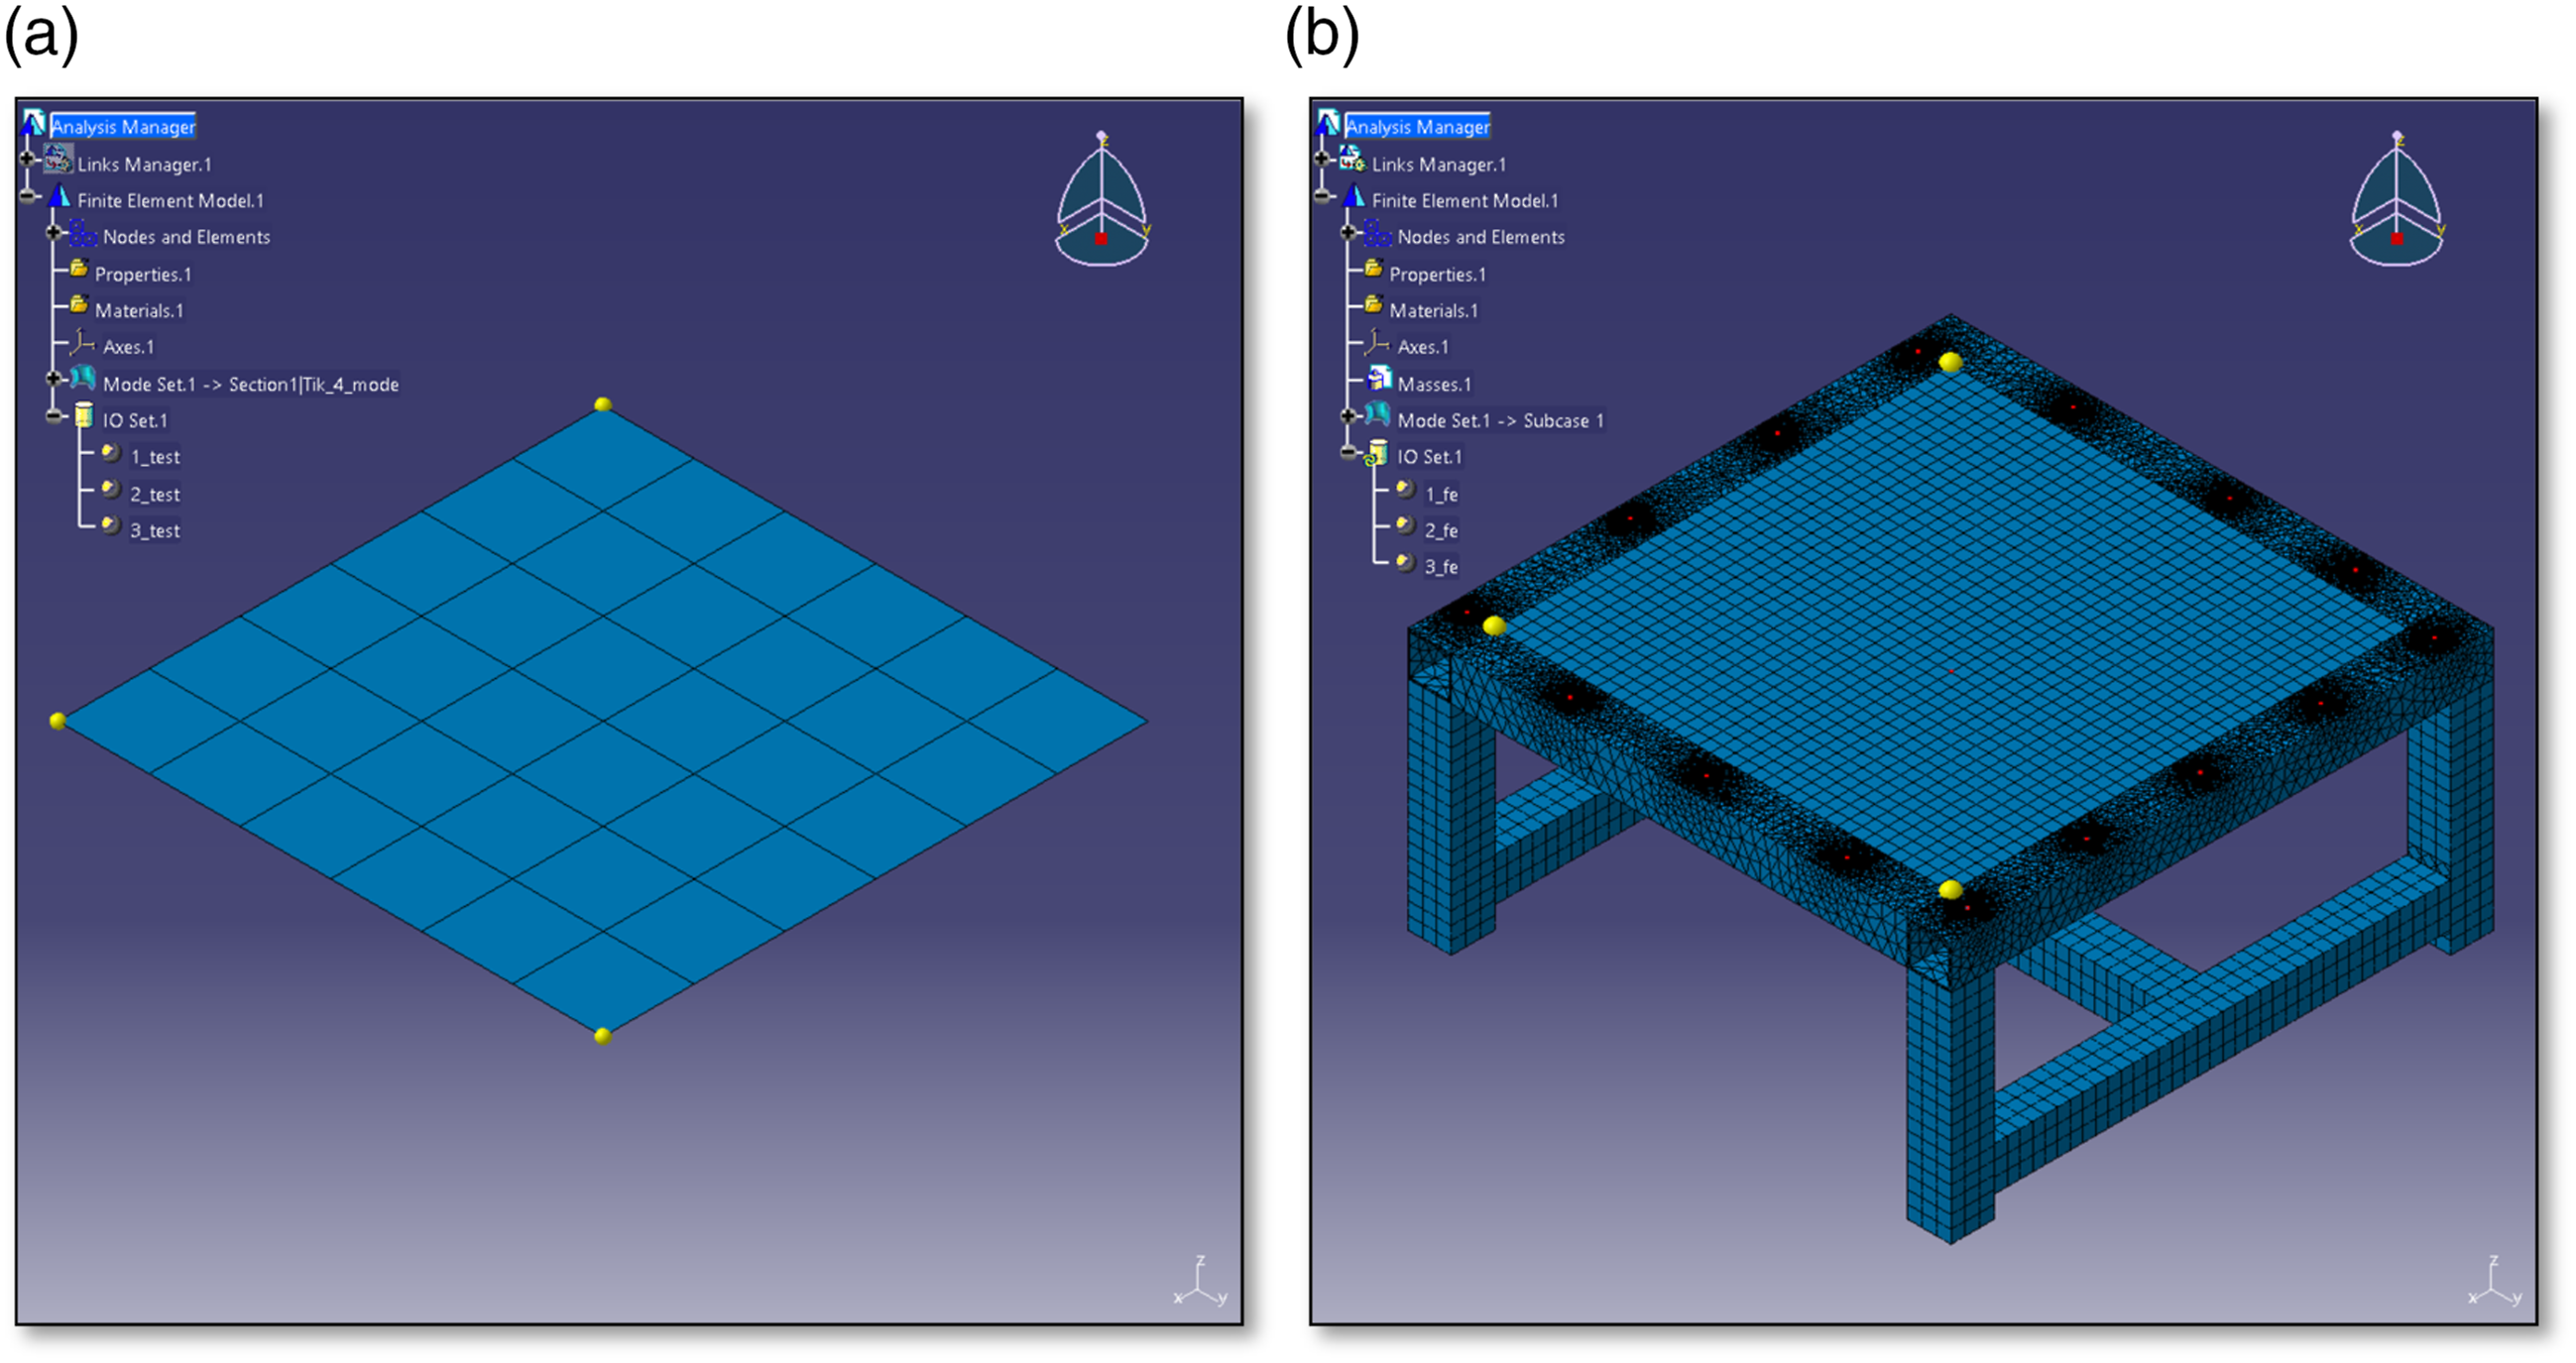
After the geometric correlation, the dynamic correlation of the models is performed. MAC value is calculated to compare TEST and FE models. In this part of the study, only SMT-1 and HMT-1 are used for the TEST/FEA correlation investigation.
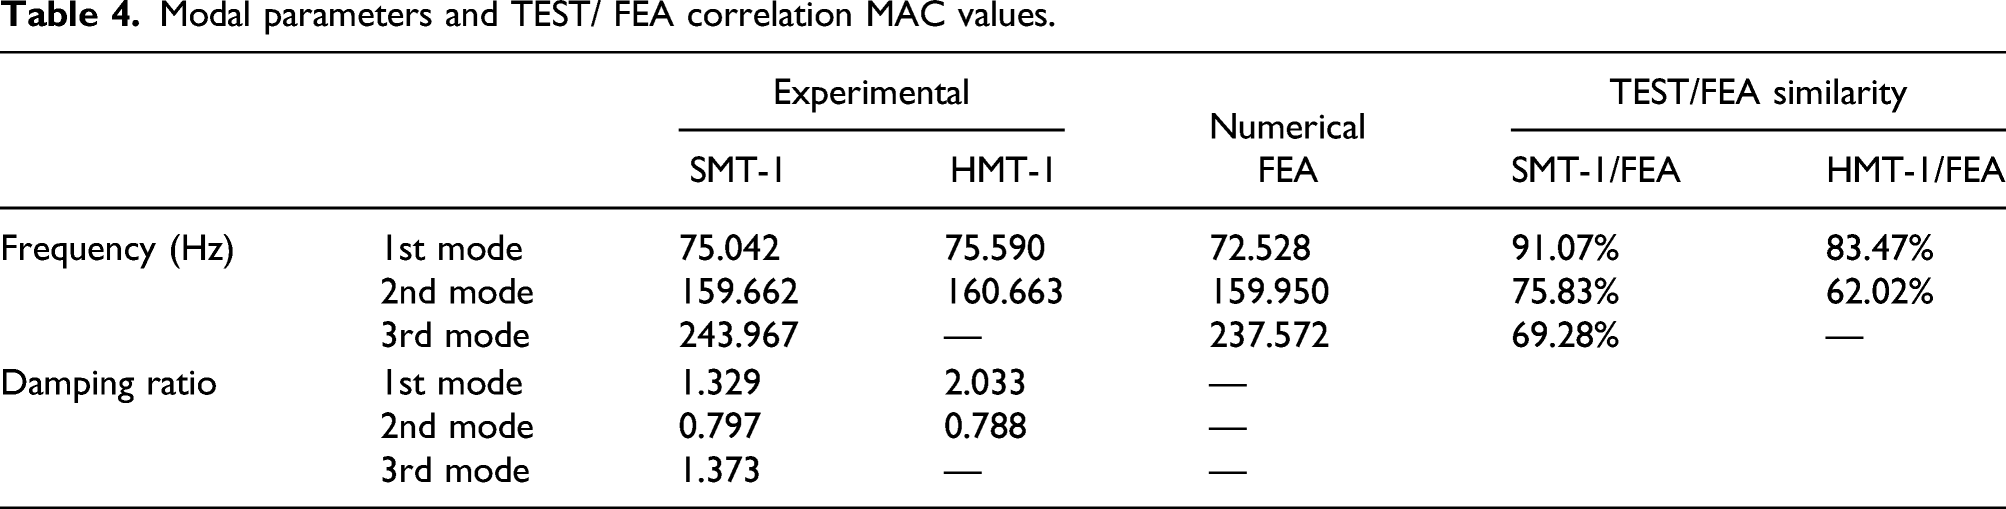
MAC is used to show a graphical demonstration of the correlations of the related data sets. The MAC matrix is shown in Figure 8 due to the TEST/FEA correlation based on modal analysis for the SMT-1. Here, in the FE model, the second mode and third mode have the same frequency value and symmetrical mode shapes due to the symmetrical structure. According to this, the third mode in the FE model is similar to the experimentally second mode, which is 75.83%. Also, the first modes of the models are 91.07% identical to each other. The third and fourth modes obtained from the TEST model are similar to the fourth mode of the FE model at 69.28 and 60.07%, respectively. MAC values of the TEST/FEA correlation for SMT-1 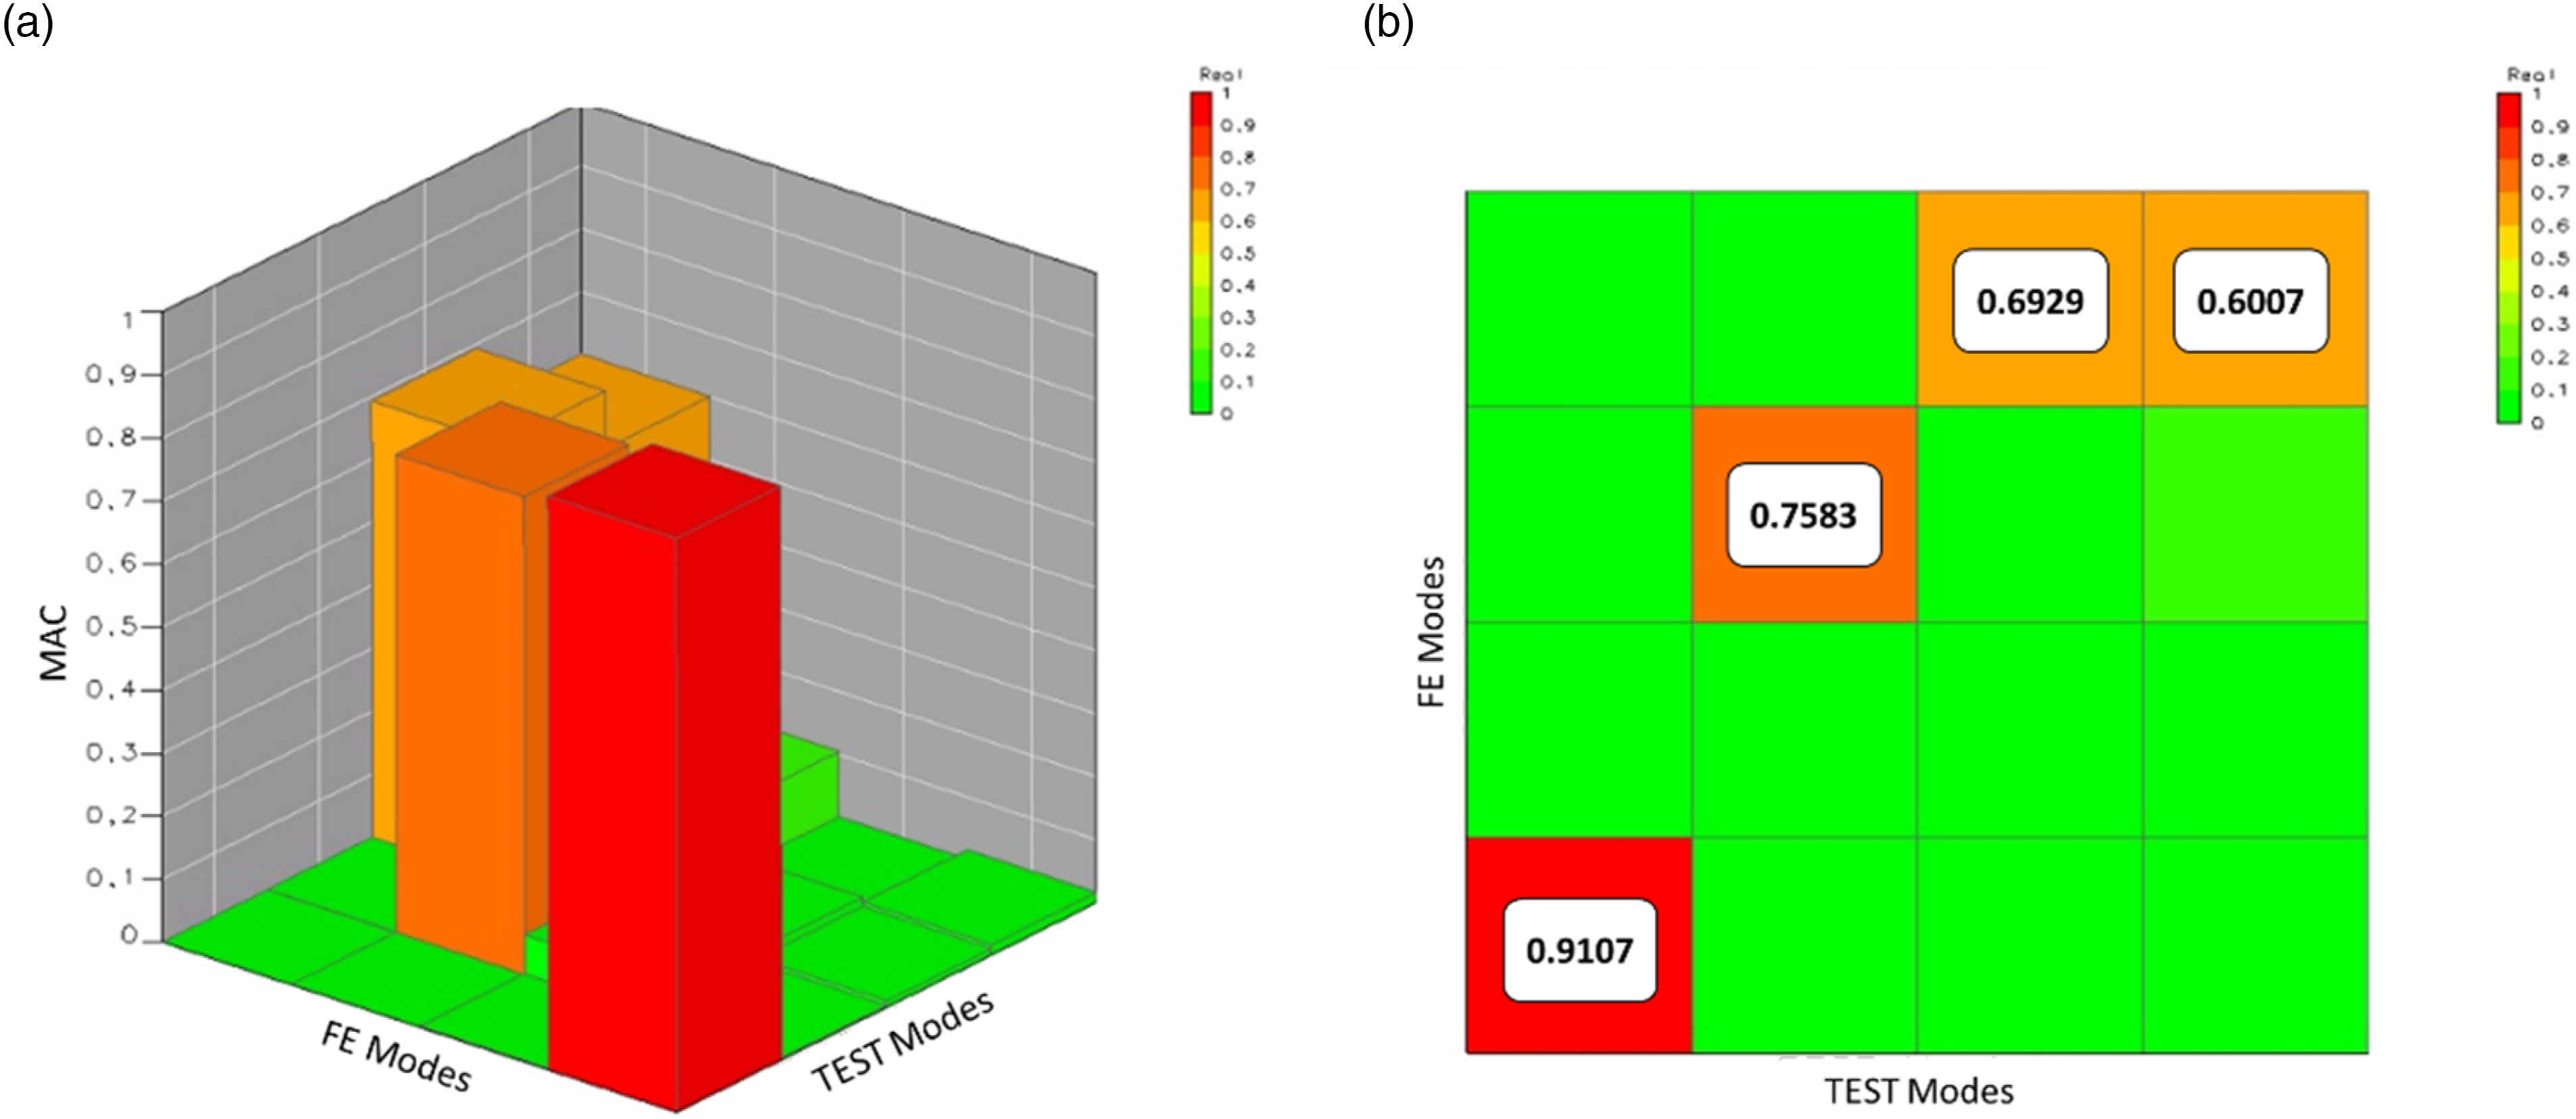
Also, the MAC matrix is not presented as a figure for the HMT-1, just presented as values. According to the correlation, the third mode in the FE model is similar to the experimentally second mode at a rate of 62.02%. The first modes of the models are 83.47% identical to each other. Also, the MAC values are low because model updating was not done. This study aimed to compare the proposed test method with the same FEA model.
Results and discussions
In this study, the roving inertial shaker method, a new experimental modal analysis approach, is applied to a plate structure compared with the traditional roving hammer method. The performance of hammer tests is low according to the FRFs obtained from the forms. Therefore, modal analysis validation methods do not need to be applied to the roving hammer results (HMT-1 and HMT-2). However, TEST/FEA correlation analysis compares TEST models of the SMT-1 and the HMT-1 with the FE model. It is observed that the MAC values of the SMT-1/FEA were higher than the HMT-1/FEA.
Then, to investigate the effect of the accelerometer position on experimental modal analysis, the modal analysis validation methods are examined for the roving shaker tests SMT-1 and SMT-2. Accordingly, the FRF synthesis is performed and compared. The SMT-2 gives better results with high correlation and low error values than SMT-1. Moreover, the MAC matrices are obtained by experimental results for SMT-1 and SMT-2. The third and fourth modes' similarity rates are found to be 64.4 and 64.527% for each test, respectively. This high rate indicates that these modes are linearly dependent on each other. Then, the MPC and the MPD values are calculated. The scatters of the fourth modes for SMT-1 and SMT-2 are uncertain according to the complexity analysis.
Finally, the comparison of finite element results with experimental results is conducted with the LMS/VirtualLab software for only SMT-1 and HMT-1. TEST/FEA correlation is achieved by obtaining MAC matrices. For SMT-1, the third and fourth modes of the TEST model are similar to the fourth mode of the FE model at 69.28 and 60.07%, respectively.
According to all these results, for the SMT-1, it is concluded that the third mode obtained in the TEST model is more compatible with the FE model. This conclusion is carried out by the following: • The MPC and the MPD values are examined in the TEST model, and the scatter of the fourth mode is calculated to be uncertain. • When the MAC values are examined in the SMT-1/FEA correlation, the third mode of the TEST model is 69.28%, similar to the fourth mode of the FE model. This is higher than the similarity rate of the other mode (60.07%). Also, this value is very close to the excellent recommendation of over 70% offered by LMS/VirtualLab.
Modal parameters and TEST/ FEA correlation MAC values.
Besides, the mode shapes obtained as a result of the experimental and the numerical modal analyses are presented in Figure 9. The mode shapes 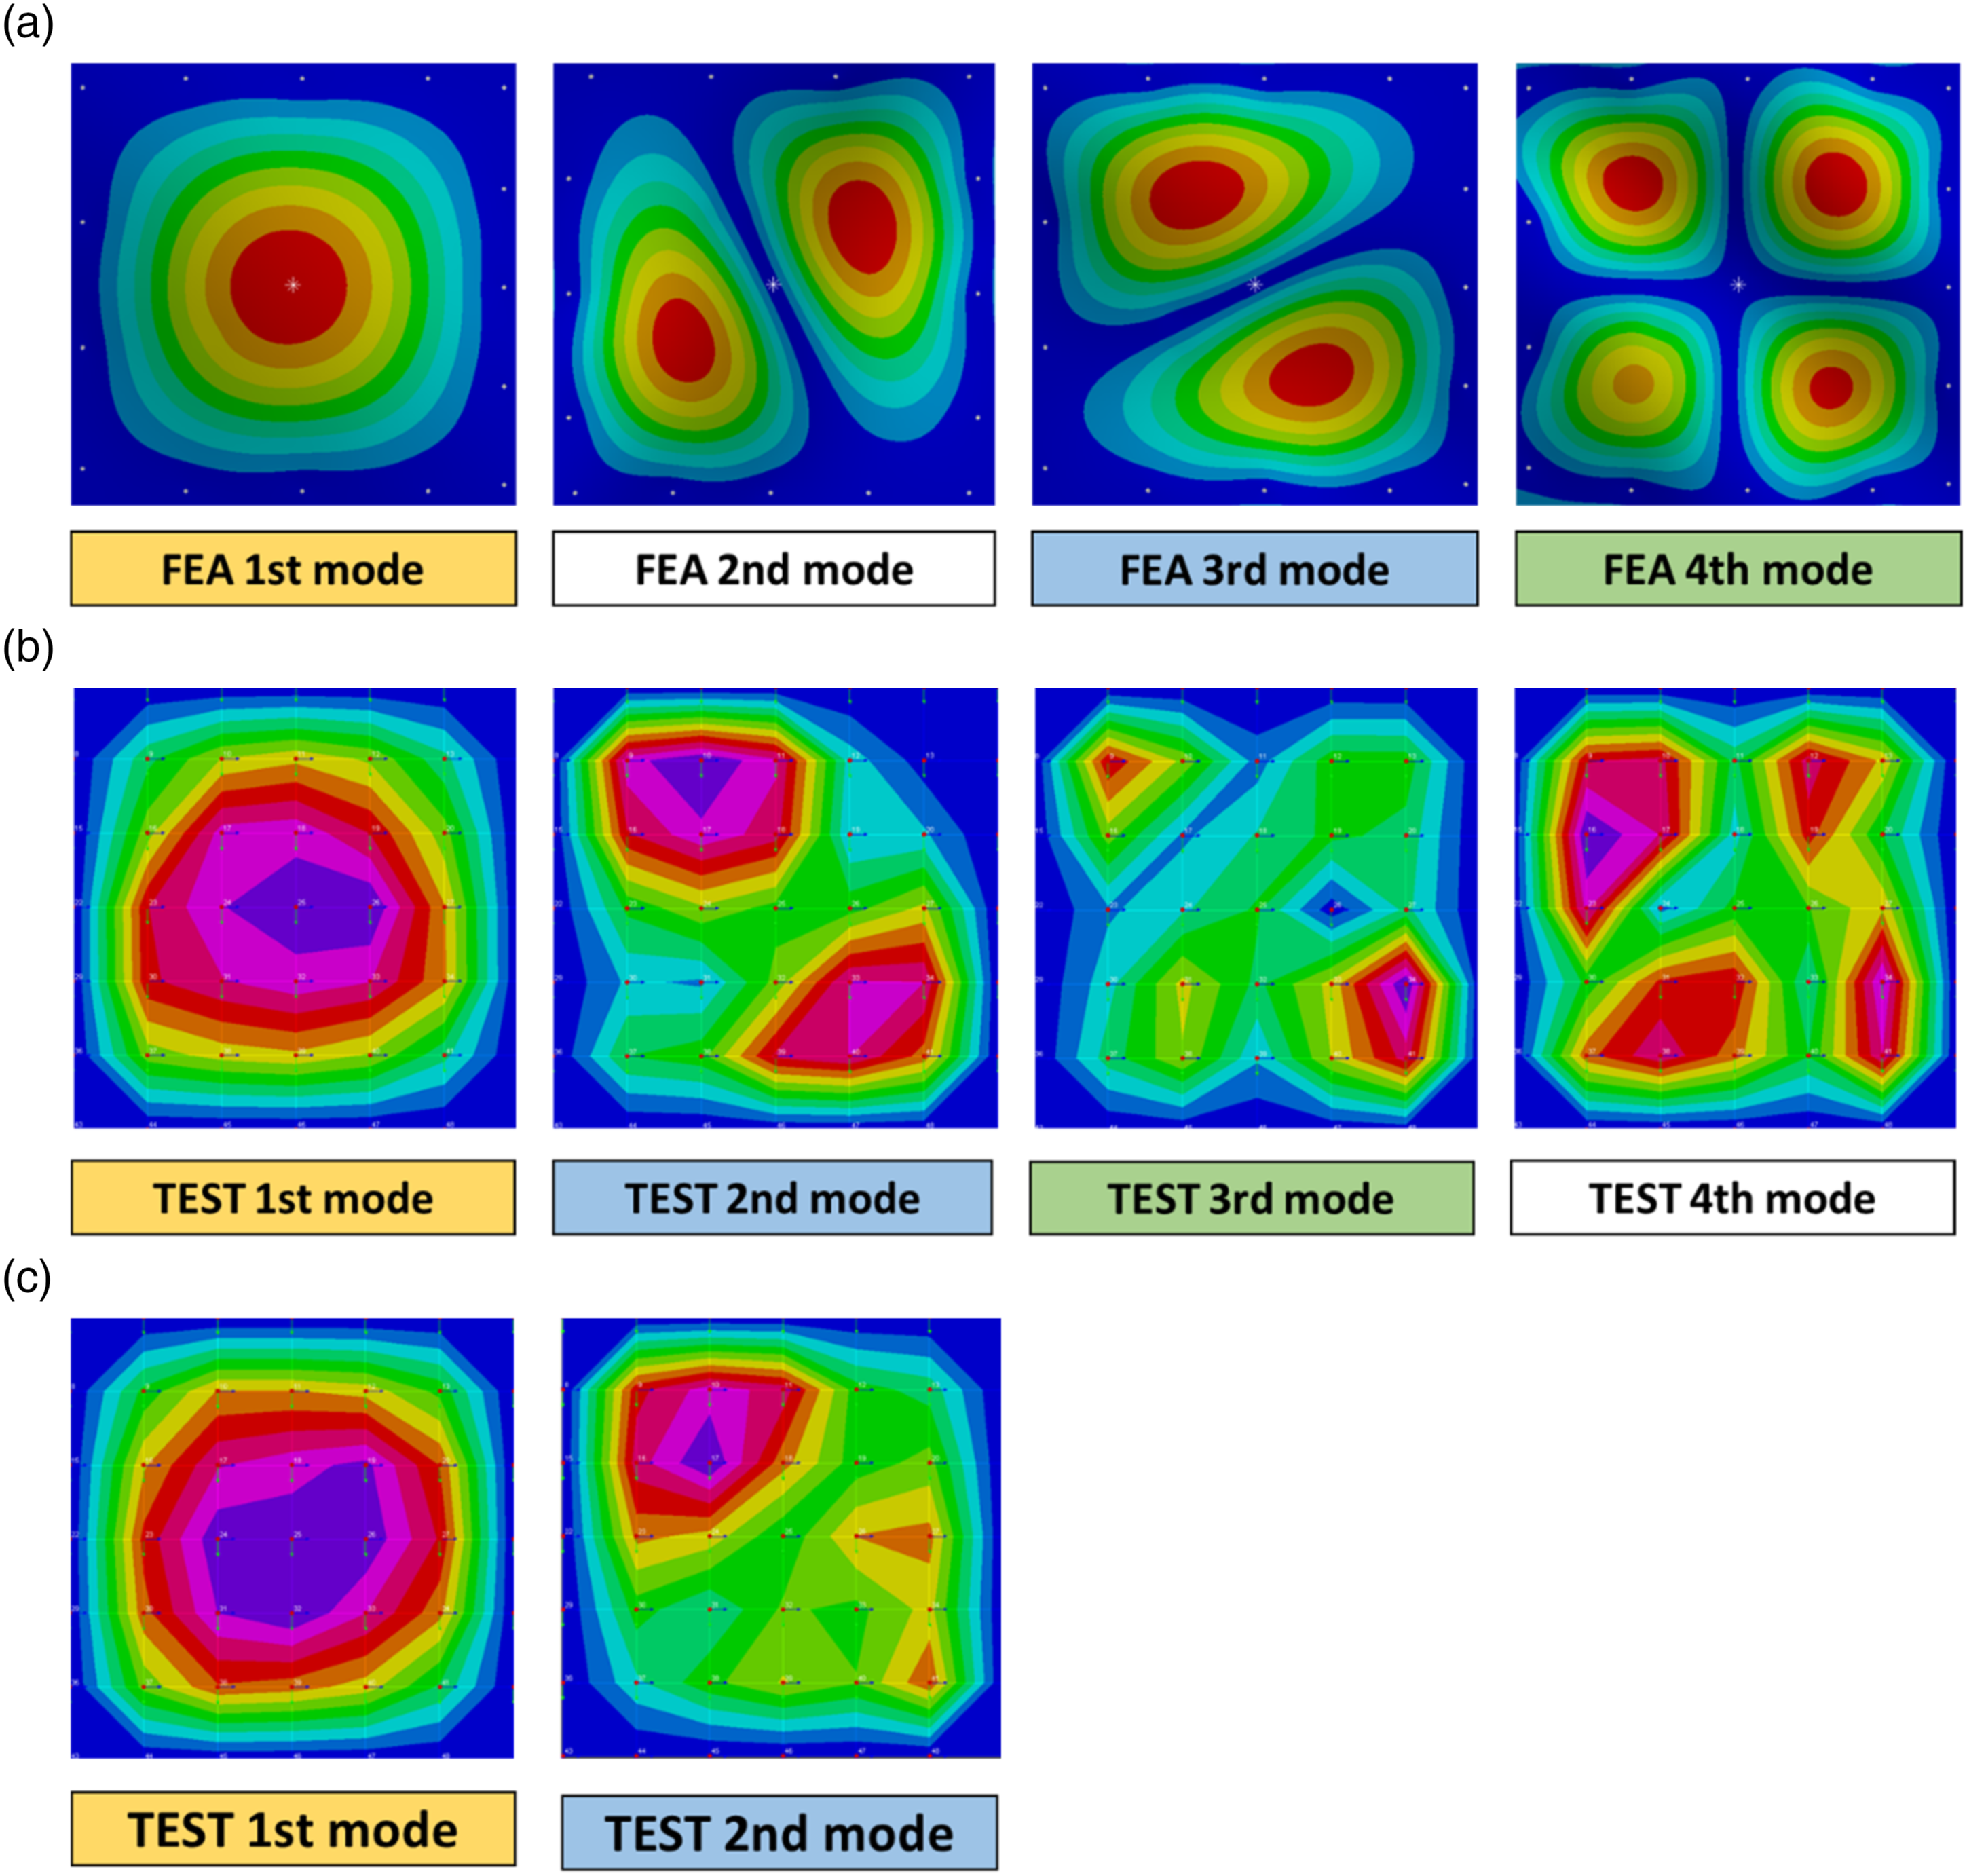
Conclusions
A new experimental modal analysis approach is discussed in this study, and its superiority over an existing classical method is presented. According to the traditional roving hammer method, only two modes are found of the steel plate with bolt connections on four sides. However, three modes are found with the roving shaker method. The roving shaker method and the roving hammer method provide similar results for the first two modes in natural frequency value detection. However, the roving shaker method’s superiority is presented when the TEST/FEA correlation results are examined. As a result, the roving inertial shaker approach gives the best results according to the high stabilization, high rate of TEST/FEA correlation, and number of modes.
Also, two FRF data sets (SMT-1 and SMT-2) obtained by the roving shaker method are examined by the modal analysis validation methods for the effect of the accelerometer position. Accordingly, the results for the two different locations are very close to each other. The accelerometer position does not affect the results of this study. However, the modal analysis validation results indicate that some modes are linearly dependent on each other. The MAC analysis of experimental data is insufficient to show the fundamental mode. The scatters of some modes are found as uncertain according to the complexity analysis. Thus, modal analysis validation methods are essential in determining the fundamental modes and compatible modes with the finite element analysis. Eventually, the experimental/numerical calculation and determination of modal parameters are successfully achieved using a new roving approach method proposed.
This method successfully obtains mode parameters at the plate, shell, beam, truss, and frame structures except for cantilever structures. An inertial shaker could cause a mass effect when it is attached upward to the systems with a free end.
In the future study, we aimed to implement the roving shaker approach using an inertial shaker to the helicopter cowlings, car doors, etc. in the laboratory in the laboratory environment and to compare it with the traditional shaker test.
Footnotes
Acknowledgments
This study was carried out within the scope of the intelligent structure project supported by TUBA (Academy of Sciences of Turkey).
Declaration of conflicting interests
The author(s) declared no potential conflicts of interest with respect to the research, authorship, and/or publication of this article.
Funding
The author(s) received no financial support for the research, authorship, and/or publication of this article.