
Abstract
In order to compare the differences in vibration before and after wheel re-profiling and assess the vibration impact of train under full-load and empty-load condition, the field vibration measurement was conducted on an underground metro track components (including rail, sleeper, and track-bed) by using a specific testing car. The results indicate that wheel re-profiling is effective in reducing track vibration, within the frequency range of 31.5–1250 Hz, the vibration acceleration levels of the track after wheel re-profiling were notably lower than those prior to re-profiling and the vibration acceleration levels of the rail, sleeper, and track-bed decrease by 4.7 dB, 6.6 dB, and 6.7 dB, respectively. In the frequency domain, the characteristic peak frequencies of the three track components, whether under full load or empty load, align closely with the frequencies associated with track irregularities. Full-load condition primarily affects the vibration acceleration at lower frequencies, with minor influence on higher frequencies. The vibration acceleration levels of all three track components are higher under full load than empty load. Additionally, under full-load condition, the transmission loss from the rail to the sleeper increases, while the transmission loss from the sleeper to the ballast remains nearly constant. The results of vibration acceleration levels obtained from routine vehicle operations validate the limited impact of axle load on track components vibration.
Introduction
With the rapid development of urban rail transit in China, a series of issues arising from metro tunnel vibrations have followed suit. 1 The substantial vibrations generated by metro vehicles during operation not only impact passenger comfort but may also lead to track structure damage. 2 Simultaneously, vibrations emanating from the wheel-rail interface propagate from the rail to the subgrade, transfer to tunnel walls, propagate to the ground, and disseminate through geological layers, triggering secondary vibrations and noise in nearby structures, thereby significantly affecting residents’ daily lives.3,4 Consequently, investigating the characteristics of vehicle-track vibrations has gained paramount importance.
At present, one of the vital methodologies for exploring vehicle-induced track vibration characteristics is field testing. 5 Scholars both domestically and internationally have divided their research into two categories: vibration testing of different track types and vibration testing of vehicle components. For the former, the majority focuses on testing existing tracks. Ge et al., 6 by conducting tests on the Dongguan metro line, analyzed the vibrational characteristics of four track types at various speeds within the frequency domain, revealing the stability of the vibration-damping effects of the floating slab tracks with steel spring isolation and rubber isolation. Huang, Liu et al., and Niu and Wang,7–9 through on-site testing of metro lines in Hunan and Beijing, scrutinized the damping effects of different track types. Their findings indicated variations in the damping effects of different track types at one-third octave frequencies, with the steel spring floating slab track demonstrating superior damping efficiency and the rubber isolation bed track ranking second. Wu et al. 10 studied the vibration transmission characteristics of metro tunnels with various track structural forms through hammer impact tests. Gao et al. 11 analyzed the lateral vibration of different damping clip-equipped track structures via dynamic frequency response testing of the track. They found that the double-layer nonlinear damping clip exhibited better suppression of lateral rail vibrations in the 400 Hz to 630 Hz frequency range compared to other damping clip-equipped track structures. Sun et al. 12 conducted field measurements of track decay rates and demonstrated that the shear-type damping clip could effectively absorb rail vibration energy.
In terms of vibration testing of vehicle components, Zhou et al., 13 through testing the acceleration of a domestic metro vehicle’s body, frame, and axle box, found that the characteristic peak frequencies of vibration acceleration and stress test data of a series of steel springs coincided with the frequencies of surface irregularities on corresponding track sections under different track structural forms. Li et al. 14 investigated vibration anomalies on the floor of a metro car and conducted extensive vibration testing and analysis, ultimately identifying local resonances caused by the vehicle body beam around 98 Hz. Literature15–19 conducted vibration testing on metro vehicle components before and after wheel re-profiling, analyzing the impact of wheel eccentricity on vehicle vibrations using indicators such as the root mean square of vibration acceleration, steadiness, and passenger comfort. From the perspective of wheel non-circular wear, they explained the generation of peak vehicle vibrations. Overall, wheel re-profiling significantly reduces wheel eccentricity and vehicle vibration acceleration, thereby enhancing various comfort indicators and significantly improving vehicle stability and passenger comfort.
The aforementioned studies provide valuable insights into track and vehicle vibrations. However, in the existing test literature, most of them are separate tests for vehicle or track vibration, and the research on the influence of wheel condition and axle load on track vibrations remains limited. Therefore, this study focuses on a specific metro line, conducting on-site vibration tests on different track structures including rail, sleeper, and track-bed under full load and empty load vehicle conditions, as well as after wheel re-profiling. Based on measured data, the study analyzes the impact of wheel conditions and vehicle axle loads on track vibrations.
Investigation overview
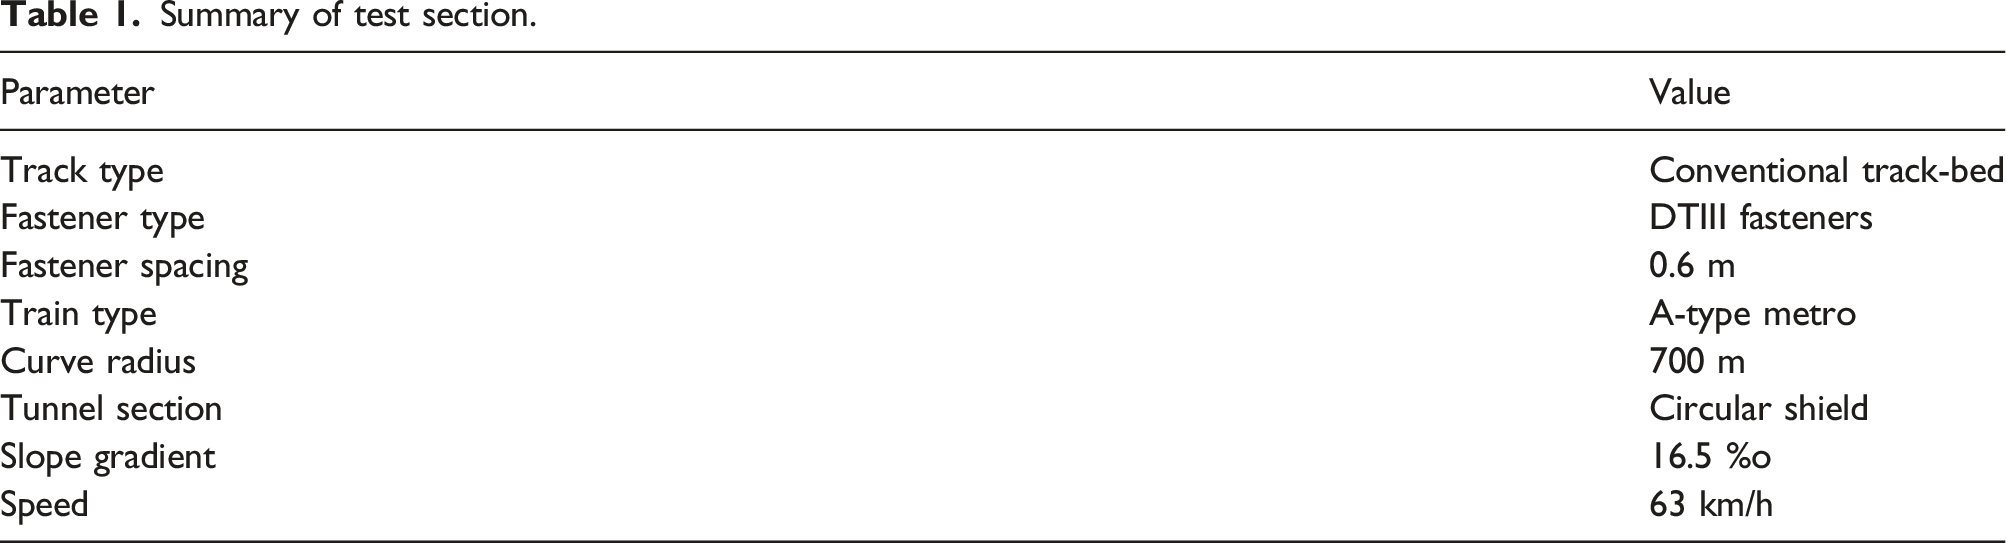
Summary of test section.
A certain degree of rail corrugation is observed in this section. An assessment of surface irregularities was conducted using the RMF 1100 corrugation measurement device. Figure 1 presents a visual representation of the rail surface condition. Figure 1(a) illustrates the corrugation of the inner rail surface at the field location, while Figure 1(b) provides the rail roughness, which corresponds to the roughness spectrum stipulated by ISO 3095:2013.
20
From the figures, it is evident that the roughness on the inner rail surface predominantly occurs within the wavelength range of 250–315 mm, which corresponds to the passing frequencies ranging from 55 Hz to 70 Hz, classifying it as a P2 resonant-type corrugation. This characteristic wavelength is notably more pronounced in Figure 1(a), indicating the distinct development of long-wave corrugation. Additionally, the presence of corrugation can be observed at the 50 mm and 80 mm wavelengths of the inner rail. In contrast, corrugation on the outer rail primarily manifests at the 50 mm wavelength, corresponding to the passing frequency of 350 Hz. Rail surface condition. (a) On-site corrugation of inner rail surface. (b) Roughness of inner and outer rail surface.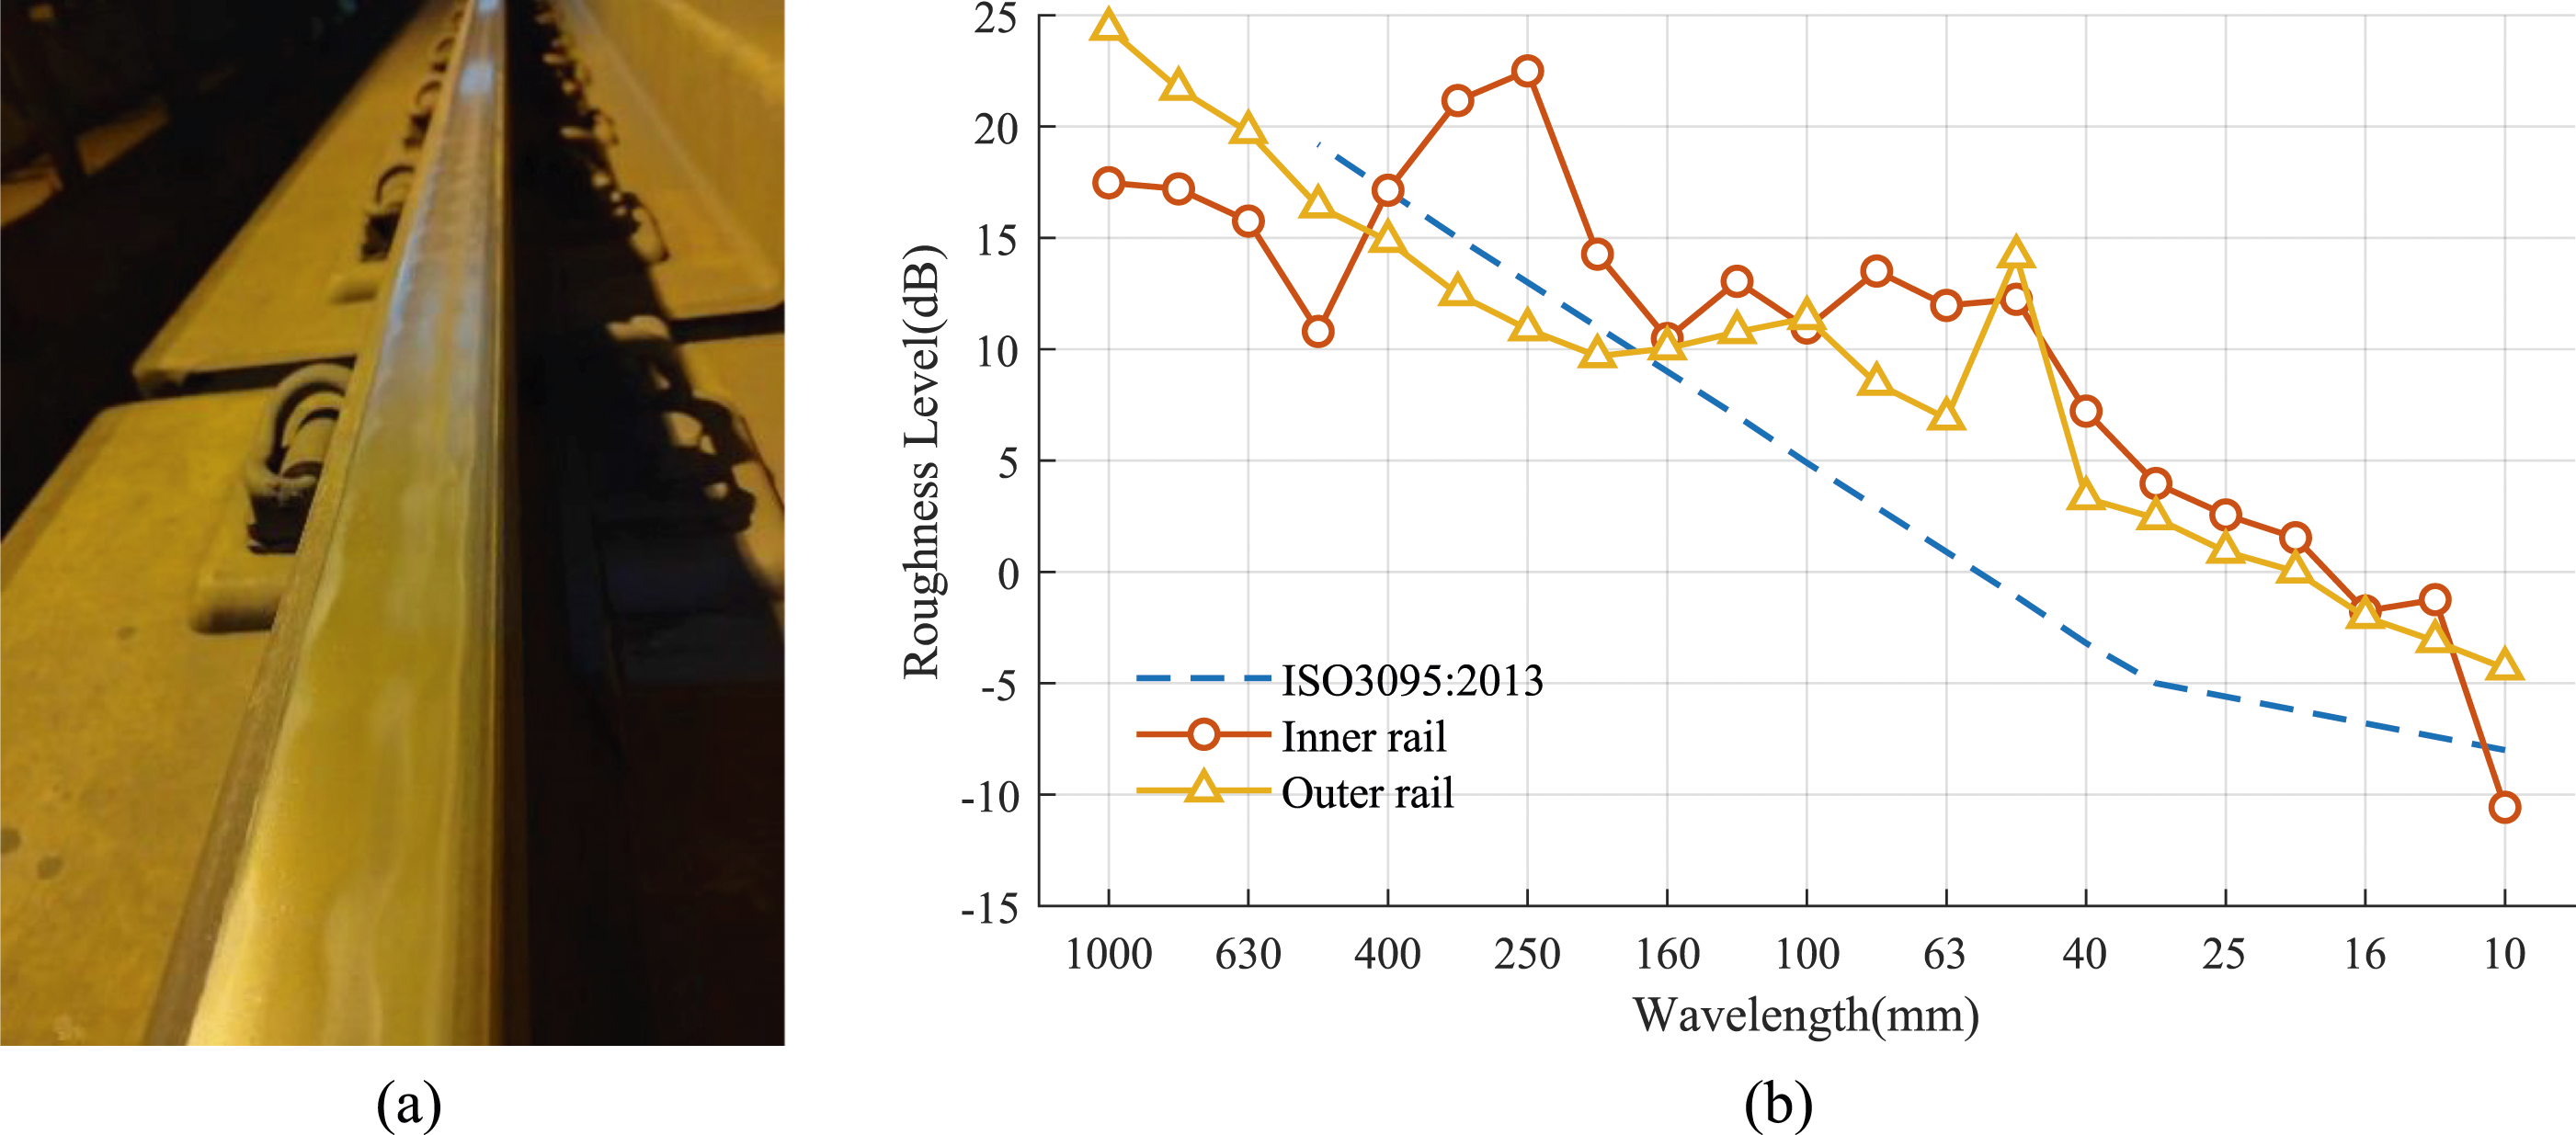
To acquire specific fastening details for this section, on-site hammer impact tests were conducted using LMS. Testlab instruments and PCB force hammer. Figure 2 illustrates the lateral and vertical displacement receptance, as well as the decay rate for this section. In Figure 2(a), the first-order resonance frequencies for both lateral and vertical modes of the rail are clearly discernible, along with the pinned-pinned frequency. Incorporating structural dynamics principles, the stiffness and damping coefficients for the fastener in this section are calculated as 48.64 MN/m and 1627.57 N·s/m, respectively, indicative of the typical fastening type. In Figure 2(b), the decay rate of the conventional track bed displays a pronounced magnitude at low frequencies. As frequency increases, the decay rate initially decreases before stabilizing. Notably, in the vicinity of the pinned-pinned frequency around 1250 Hz, the decay rate reaches a peak and then progressively declines. Track receptance and decay rate. (a) Receptance. (b) Decay rate.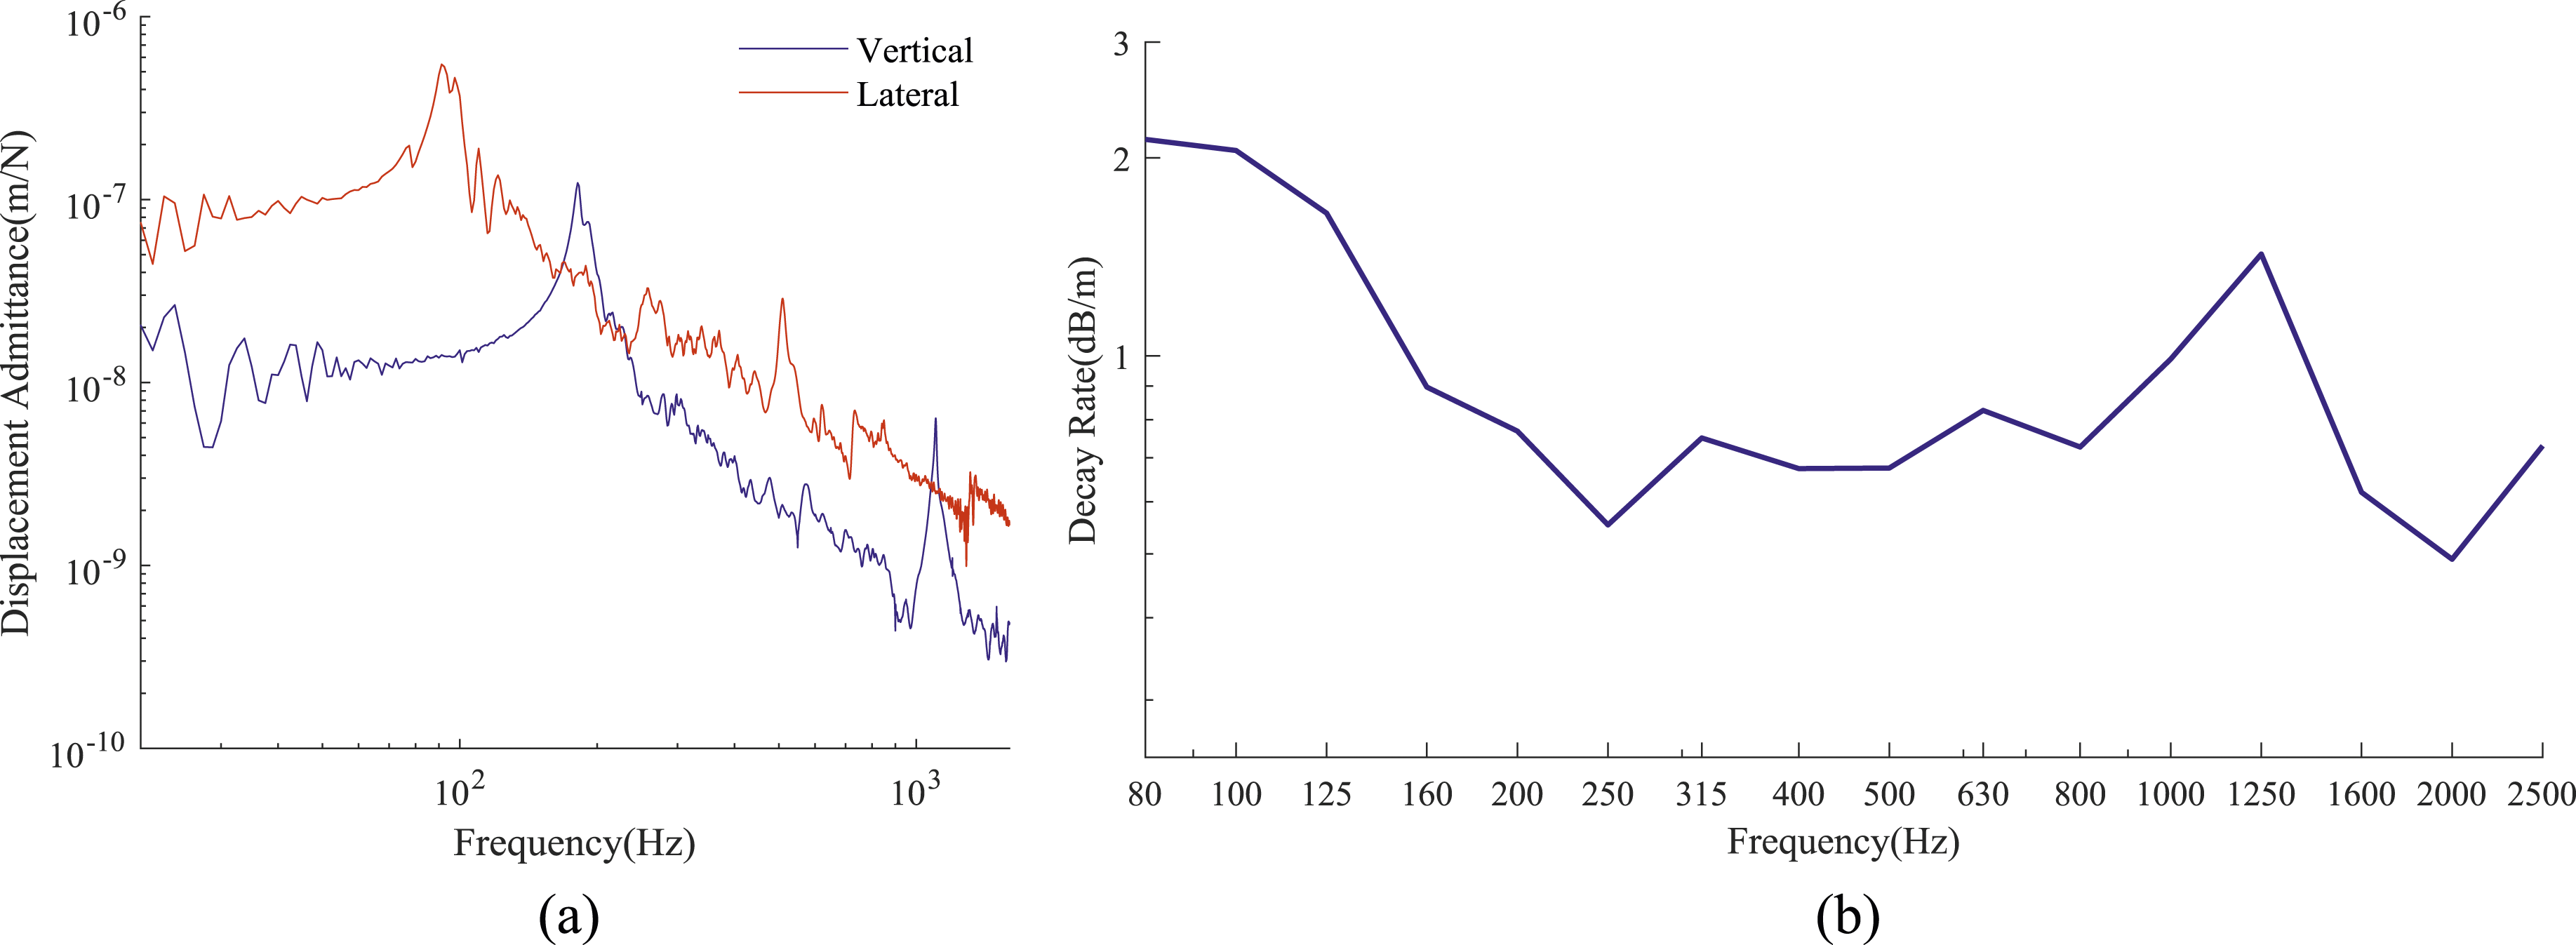
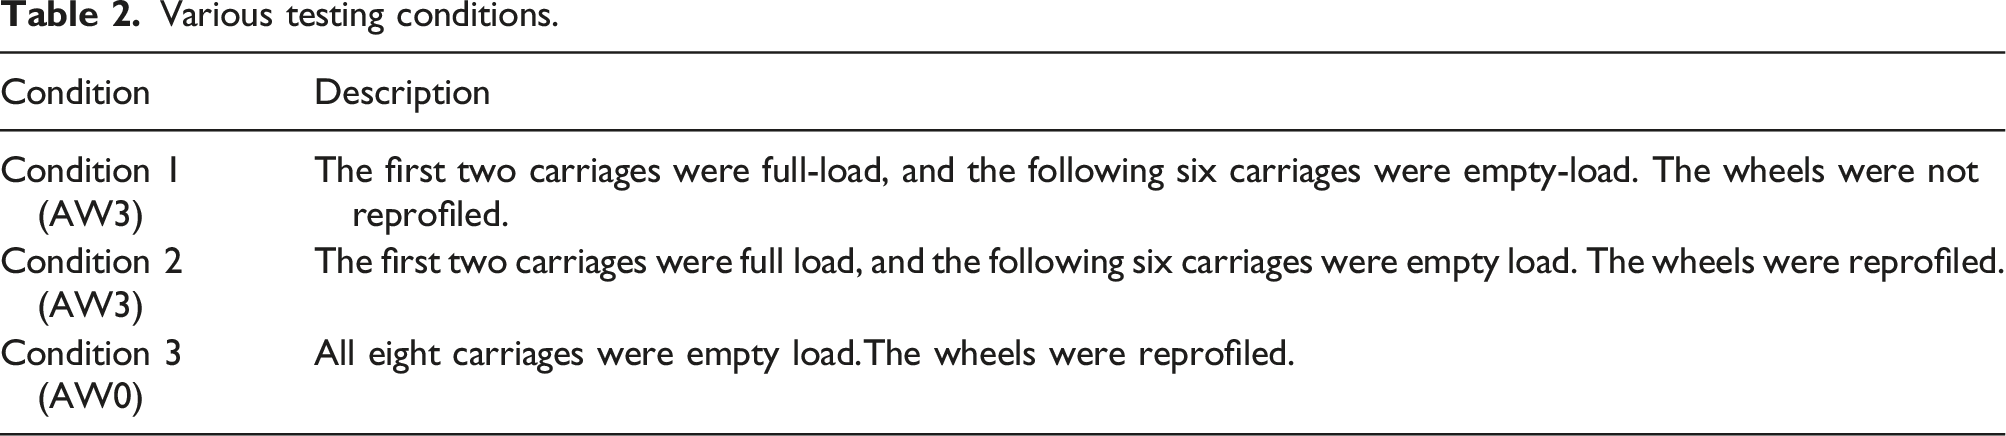
Various testing conditions.
During the track vibration experimentation, the schematic diagram illustrating the arrangement of measurement points for various track structures is depicted in Figure 3, with the measurement points predominantly situated on the outer side of the low rail in the curved section. The scope of the vibration testing encompass measurements of vertical acceleration for the rail, sleeper, and track-bed, as well as vertical displacement of the rail. Schematic of sensor placement. (a) Front view with accelerometers; (b) top view with displacement sensors.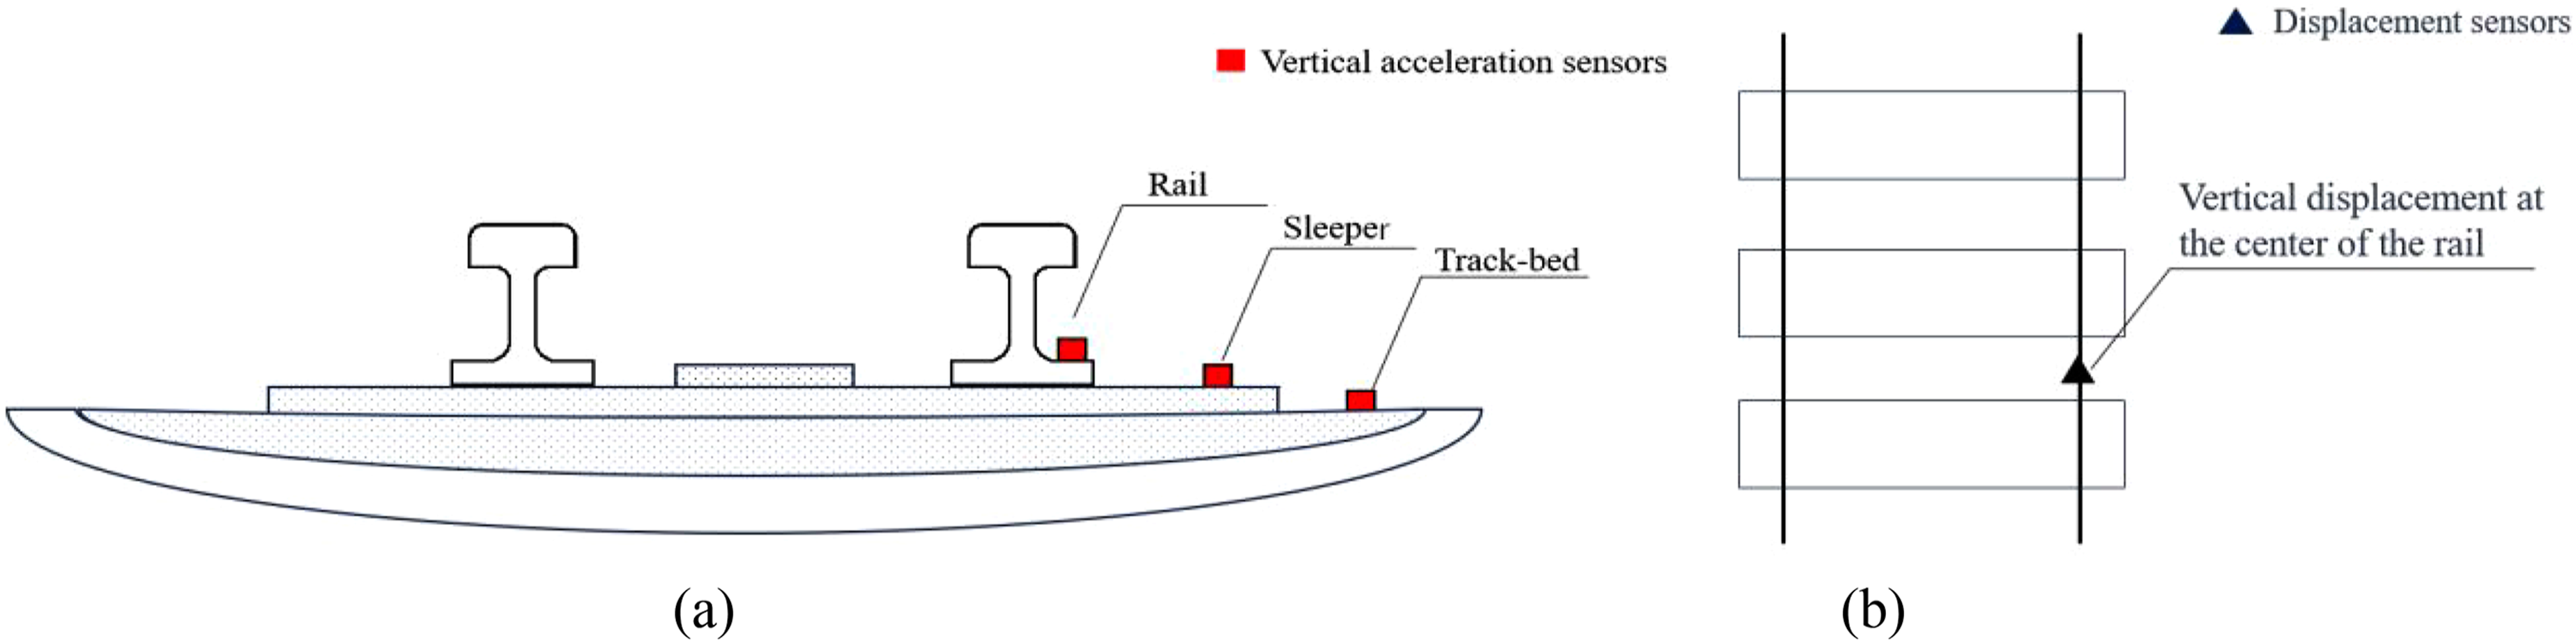
The testing was conducted using an NI CRIO-9031 data acquisition system equipped with 8 accelerometer channels and 4 displacement channels. The rail acceleration was measured using PCB-352C04 sensors with a sensitivity of 1.02 mV/(m/s2), a measurement range of ±500 g, a frequency response range of 0.5–10,000 Hz, and dimensions of 11.2 mm width by 22.4 mm height. Vertical acceleration of the sleeper and track-bed was measured using PCB-393B04 accelerometer sensors with a sensitivity of 1000 mV/g, a frequency response range of 0.06∼450 Hz, and a measurement range of ±5 g. The vertical displacement of the rail was measured using a contact-type displacement sensor. Figure 4 illustrates the vibration testing instrumentation. Testing instrumentation diagram. (a) NI CRIO-9031 data acquisition system. (b) PCB-352C04 accelerometer. (c) PCB-393B04 accelerometer. (d) Displacement sensor.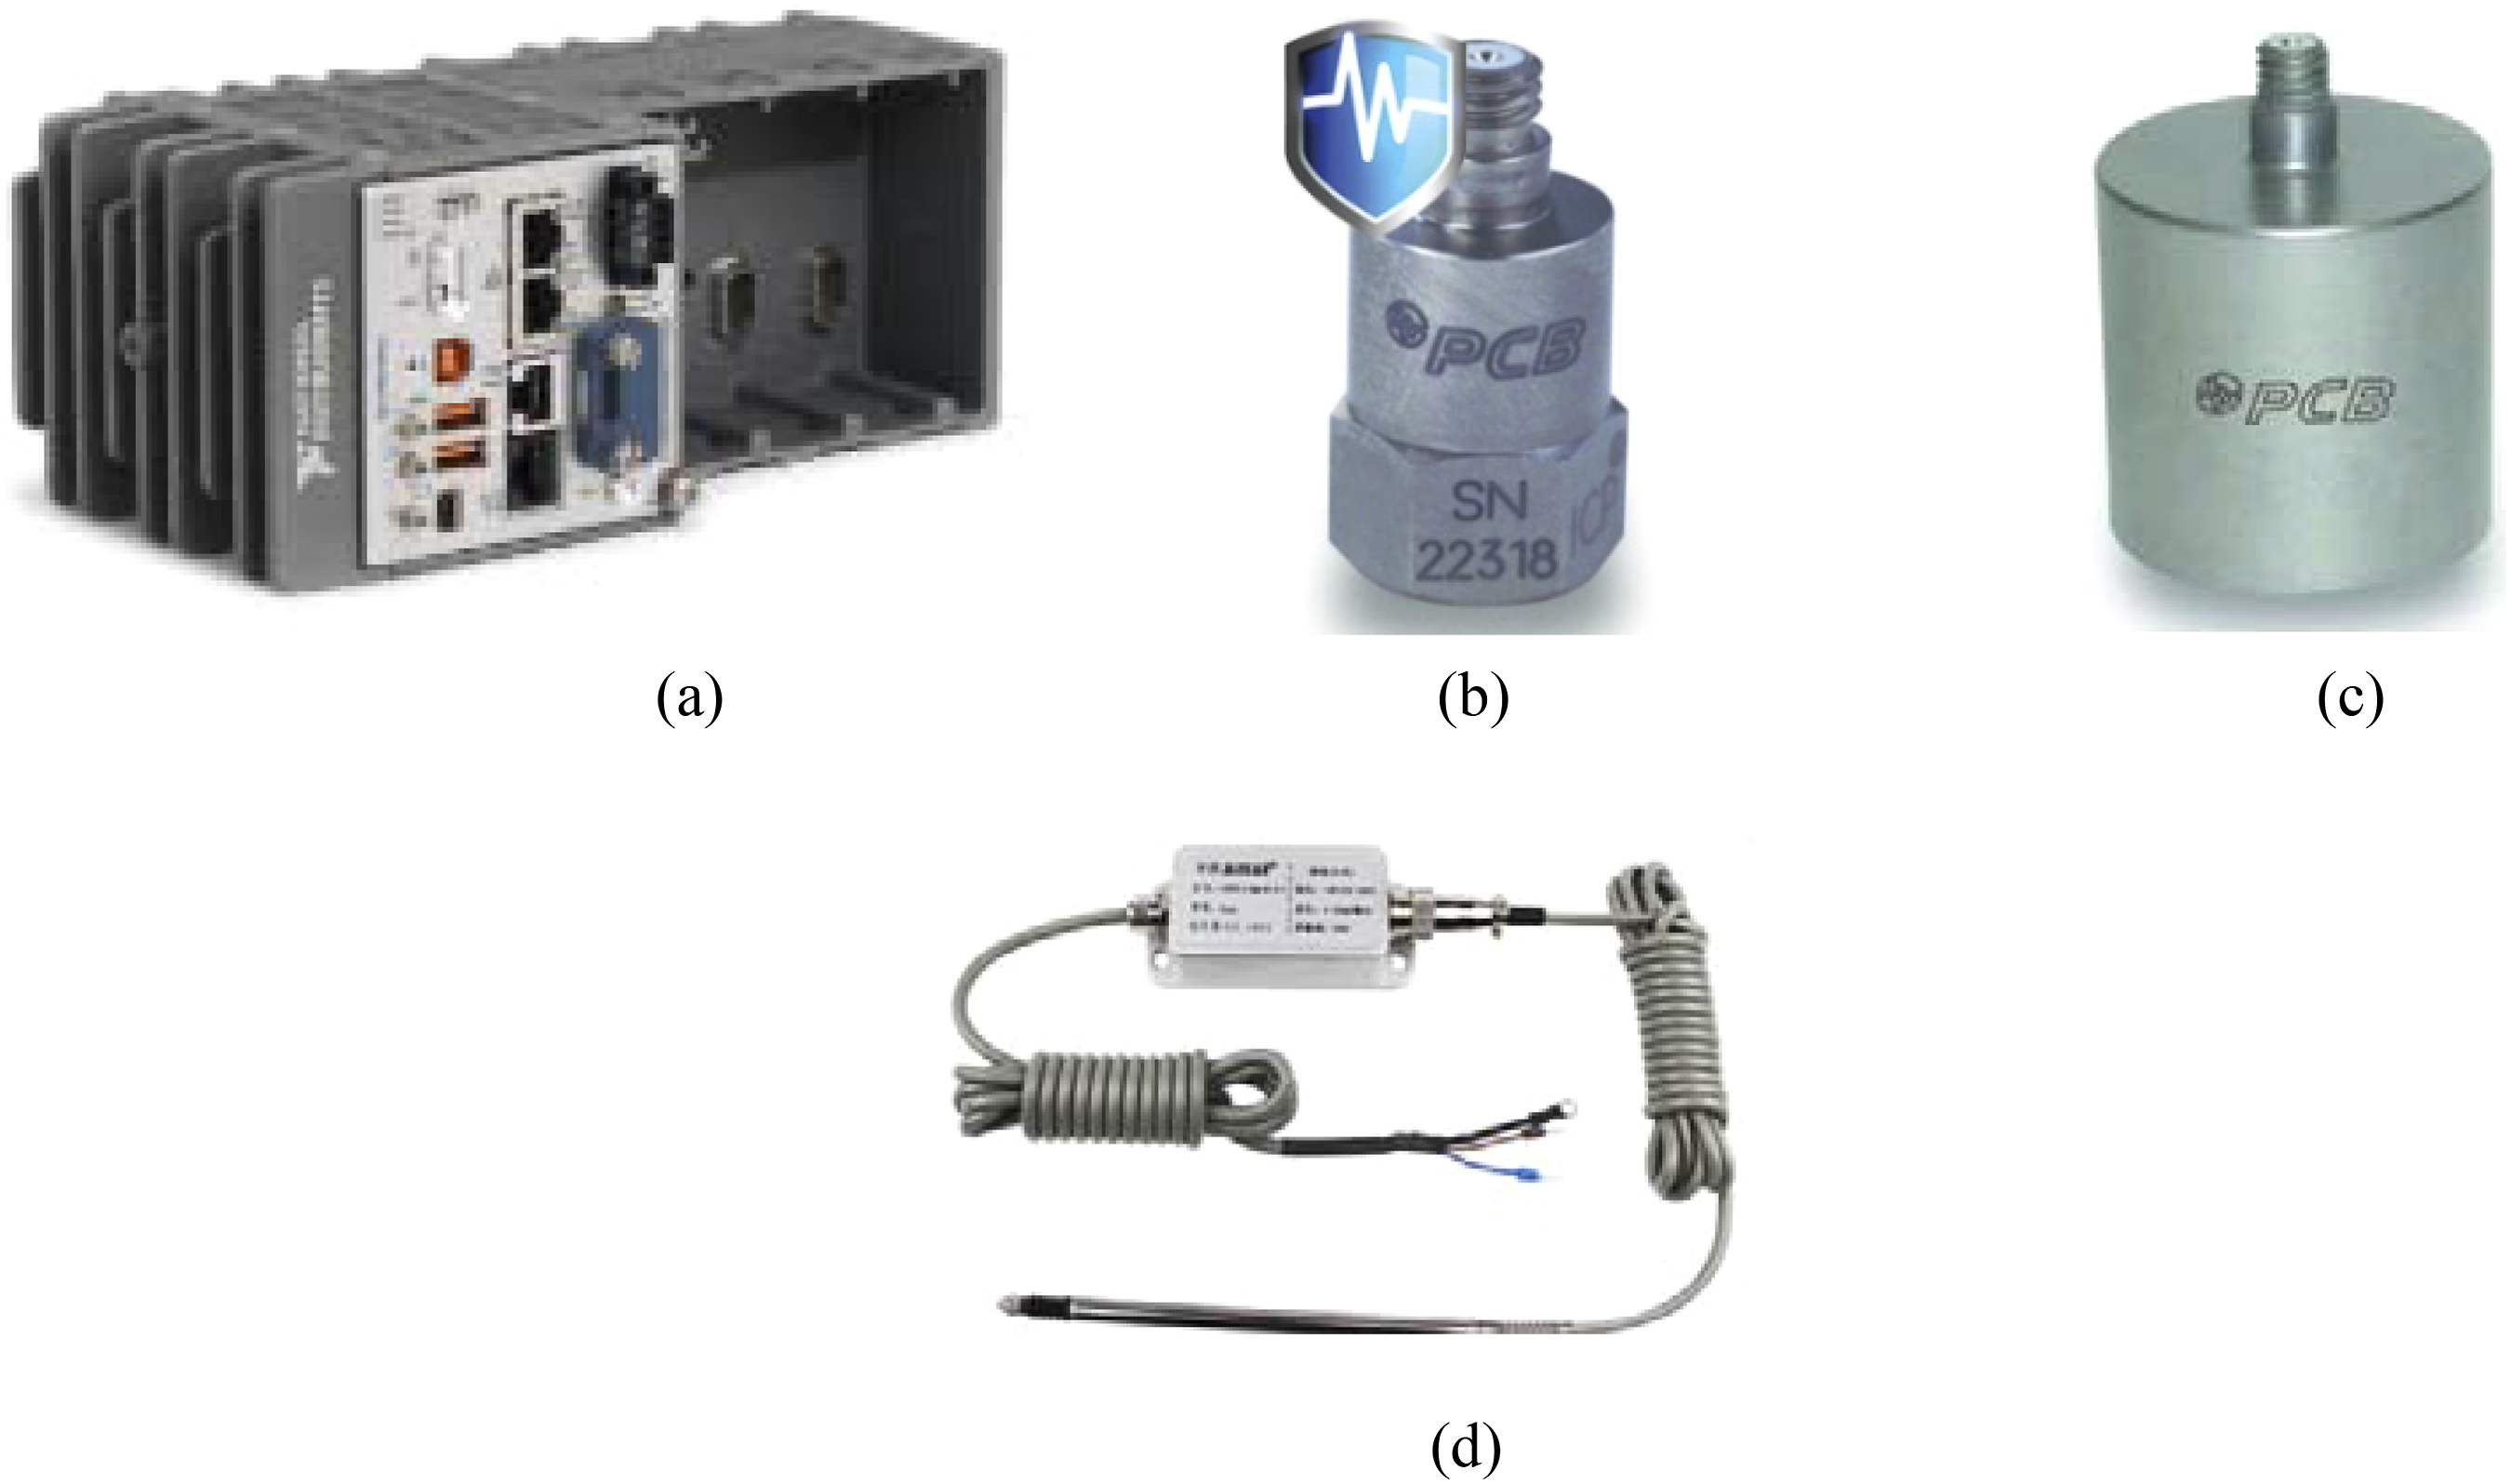
The analysis of vibration characteristics primarily involves an examination of the acquired vibration signals, leading to the derivation of key vibration evaluation metrics. This study employs several assessment criteria, encompassing peak of vibration acceleration, root mean square (RMS) of acceleration, vibration acceleration level, and transmission loss.
21
The calculation formula for RMS is defined as follows: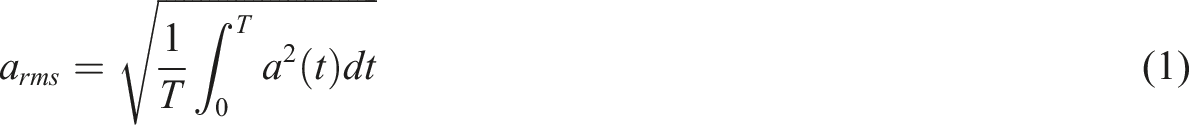
The calculation formula for the vibration acceleration level is given by:
The vibration attenuation characteristics within the system can be described using transmission loss. The transmission loss from the vibration input response 1 to the output response 2 is defined as follows:
Vibration data analysis and results
Impact analysis of wheel reprofiling on track vibration
The influence of wheel reprofiling on track vibration is examined through a comparison between full-load condition 1 and condition 2. Data from the first two carriages are extracted for analysis. Figure 5 depicts the temporal variation of the RMS of vibration acceleration for the three track structures before and after wheel re-profiling. The RMS of acceleration is calculated by moving window method, every 0.5 s is a window size, and the step size is 0.1 s. The vertical axis represents the logarithmically transformed results. The graph reveals that, prior to wheel re-profiling, the RMS for the rail, sleeper, and track-bed are higher than their corresponding values after wheel re-profiling. From the perspective of the whole time domain change, greater fluctuations in RMS of vibration acceleration are observed before wheel re-profiling. After wheel re-profiling, the maximum reduction in RMS of vibration acceleration for the rail, sleeper, and track-bed are 16.4 dB, 21.2 dB, and 21.9 dB, respectively. RMS of vibration acceleration for different track structures. (a) Rail. (b) Sleeper. (c) Track-bed.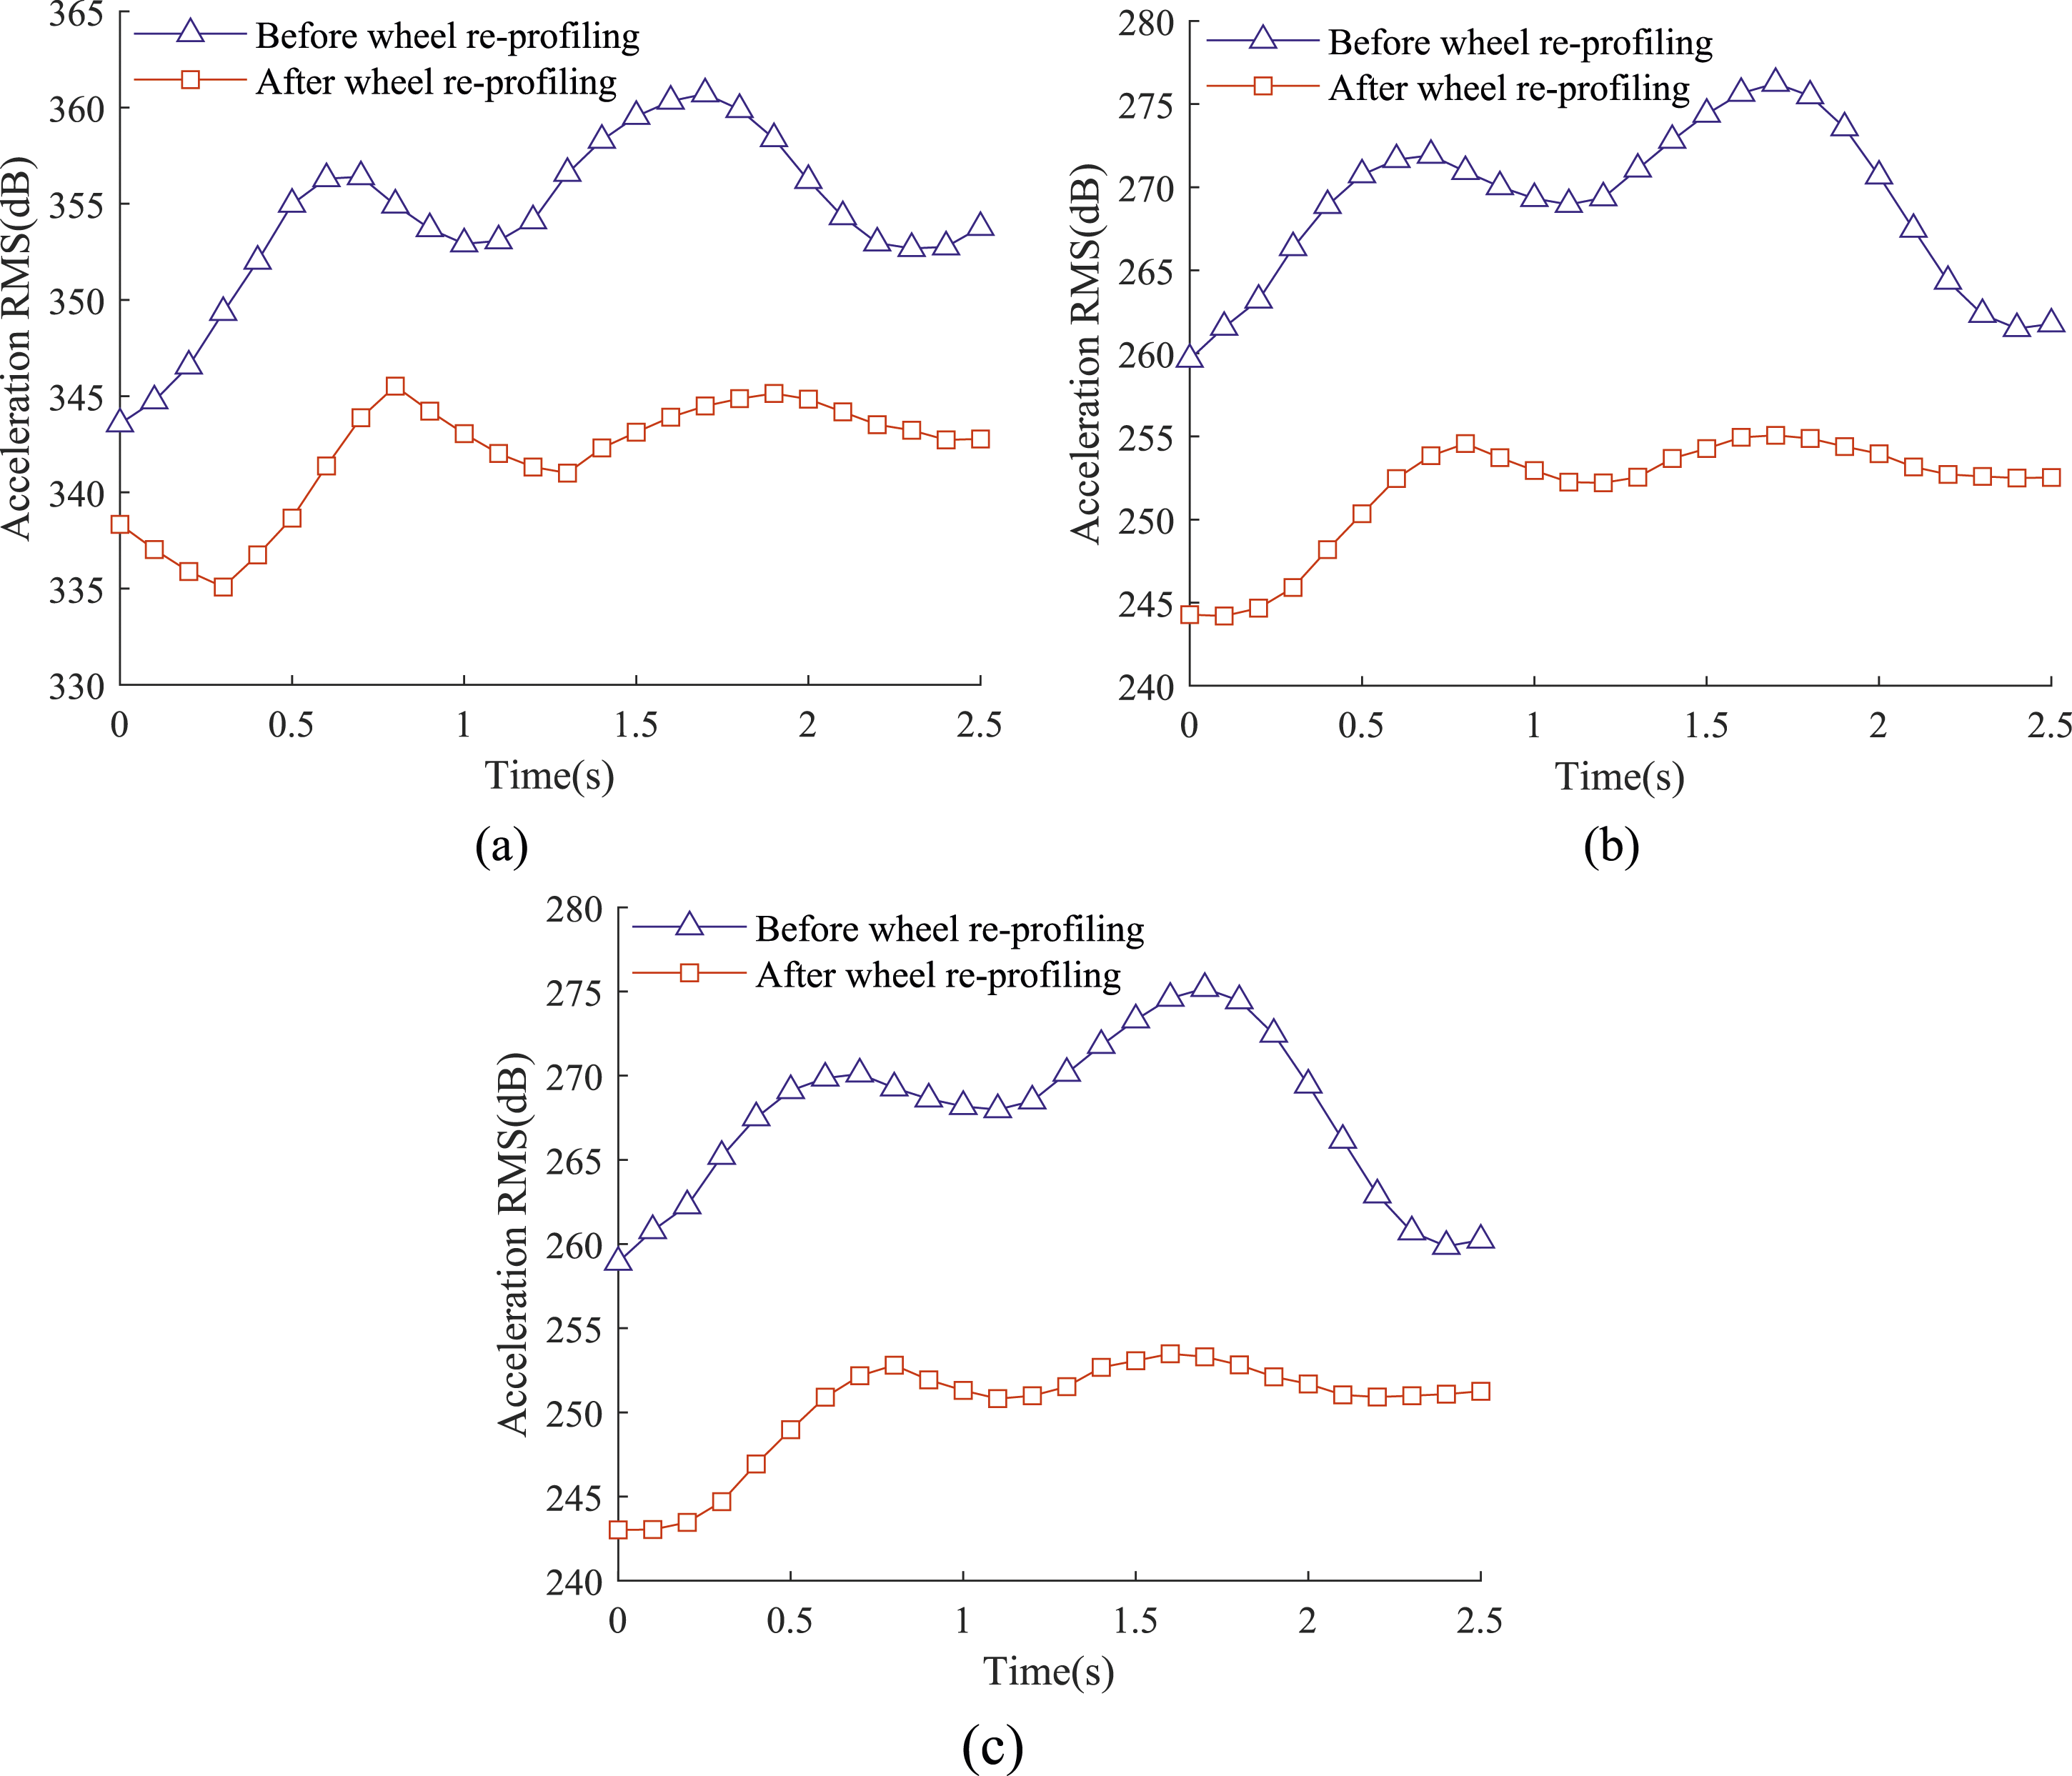
Figure 6 illustrates the one-third octave of the rail, sleeper, and track-bed before and after wheel re-profiling. Notably, the vibration energy of the rail, sleeper, and track-bed is predominantly concentrated in the frequency range above 40 Hz. Within the frequency range of 40 to 1000 Hz, it is evident that the vibrations induced by the train after wheel re-profiling are notably lower than those before re-profiling. As depicted in Figure 5(a), the vibration acceleration of the rail before and after wheel re-profiling exhibits distinct peak values at specific center frequencies, such as within the frequency ranges of 63–80 Hz and 315–400 Hz. Additionally, the graph clearly illustrates differences in vibration acceleration levels before and after wheel re-profiling. In the frequency range of 31.5 to 1250 Hz, the vibration acceleration levels corresponding to the three track structures are markedly lower after wheel re-profiling. However, within the low-frequency range of 1–25 Hz, the patterns of vibration acceleration levels between the three track structures before and after wheel re-profiling do not align uniformly. Specifically, for the sleeper, there is an amplification phenomenon in vibration acceleration levels within the 1–25 Hz range, resulting in levels greater than those before re-profiling. Conversely, for the rail and track-bed, both amplification and reduction phenomena are observable within the low-frequency range. One-third octave of different track structures. (a) Rail. (b) Sleeper. (c) Track-bed.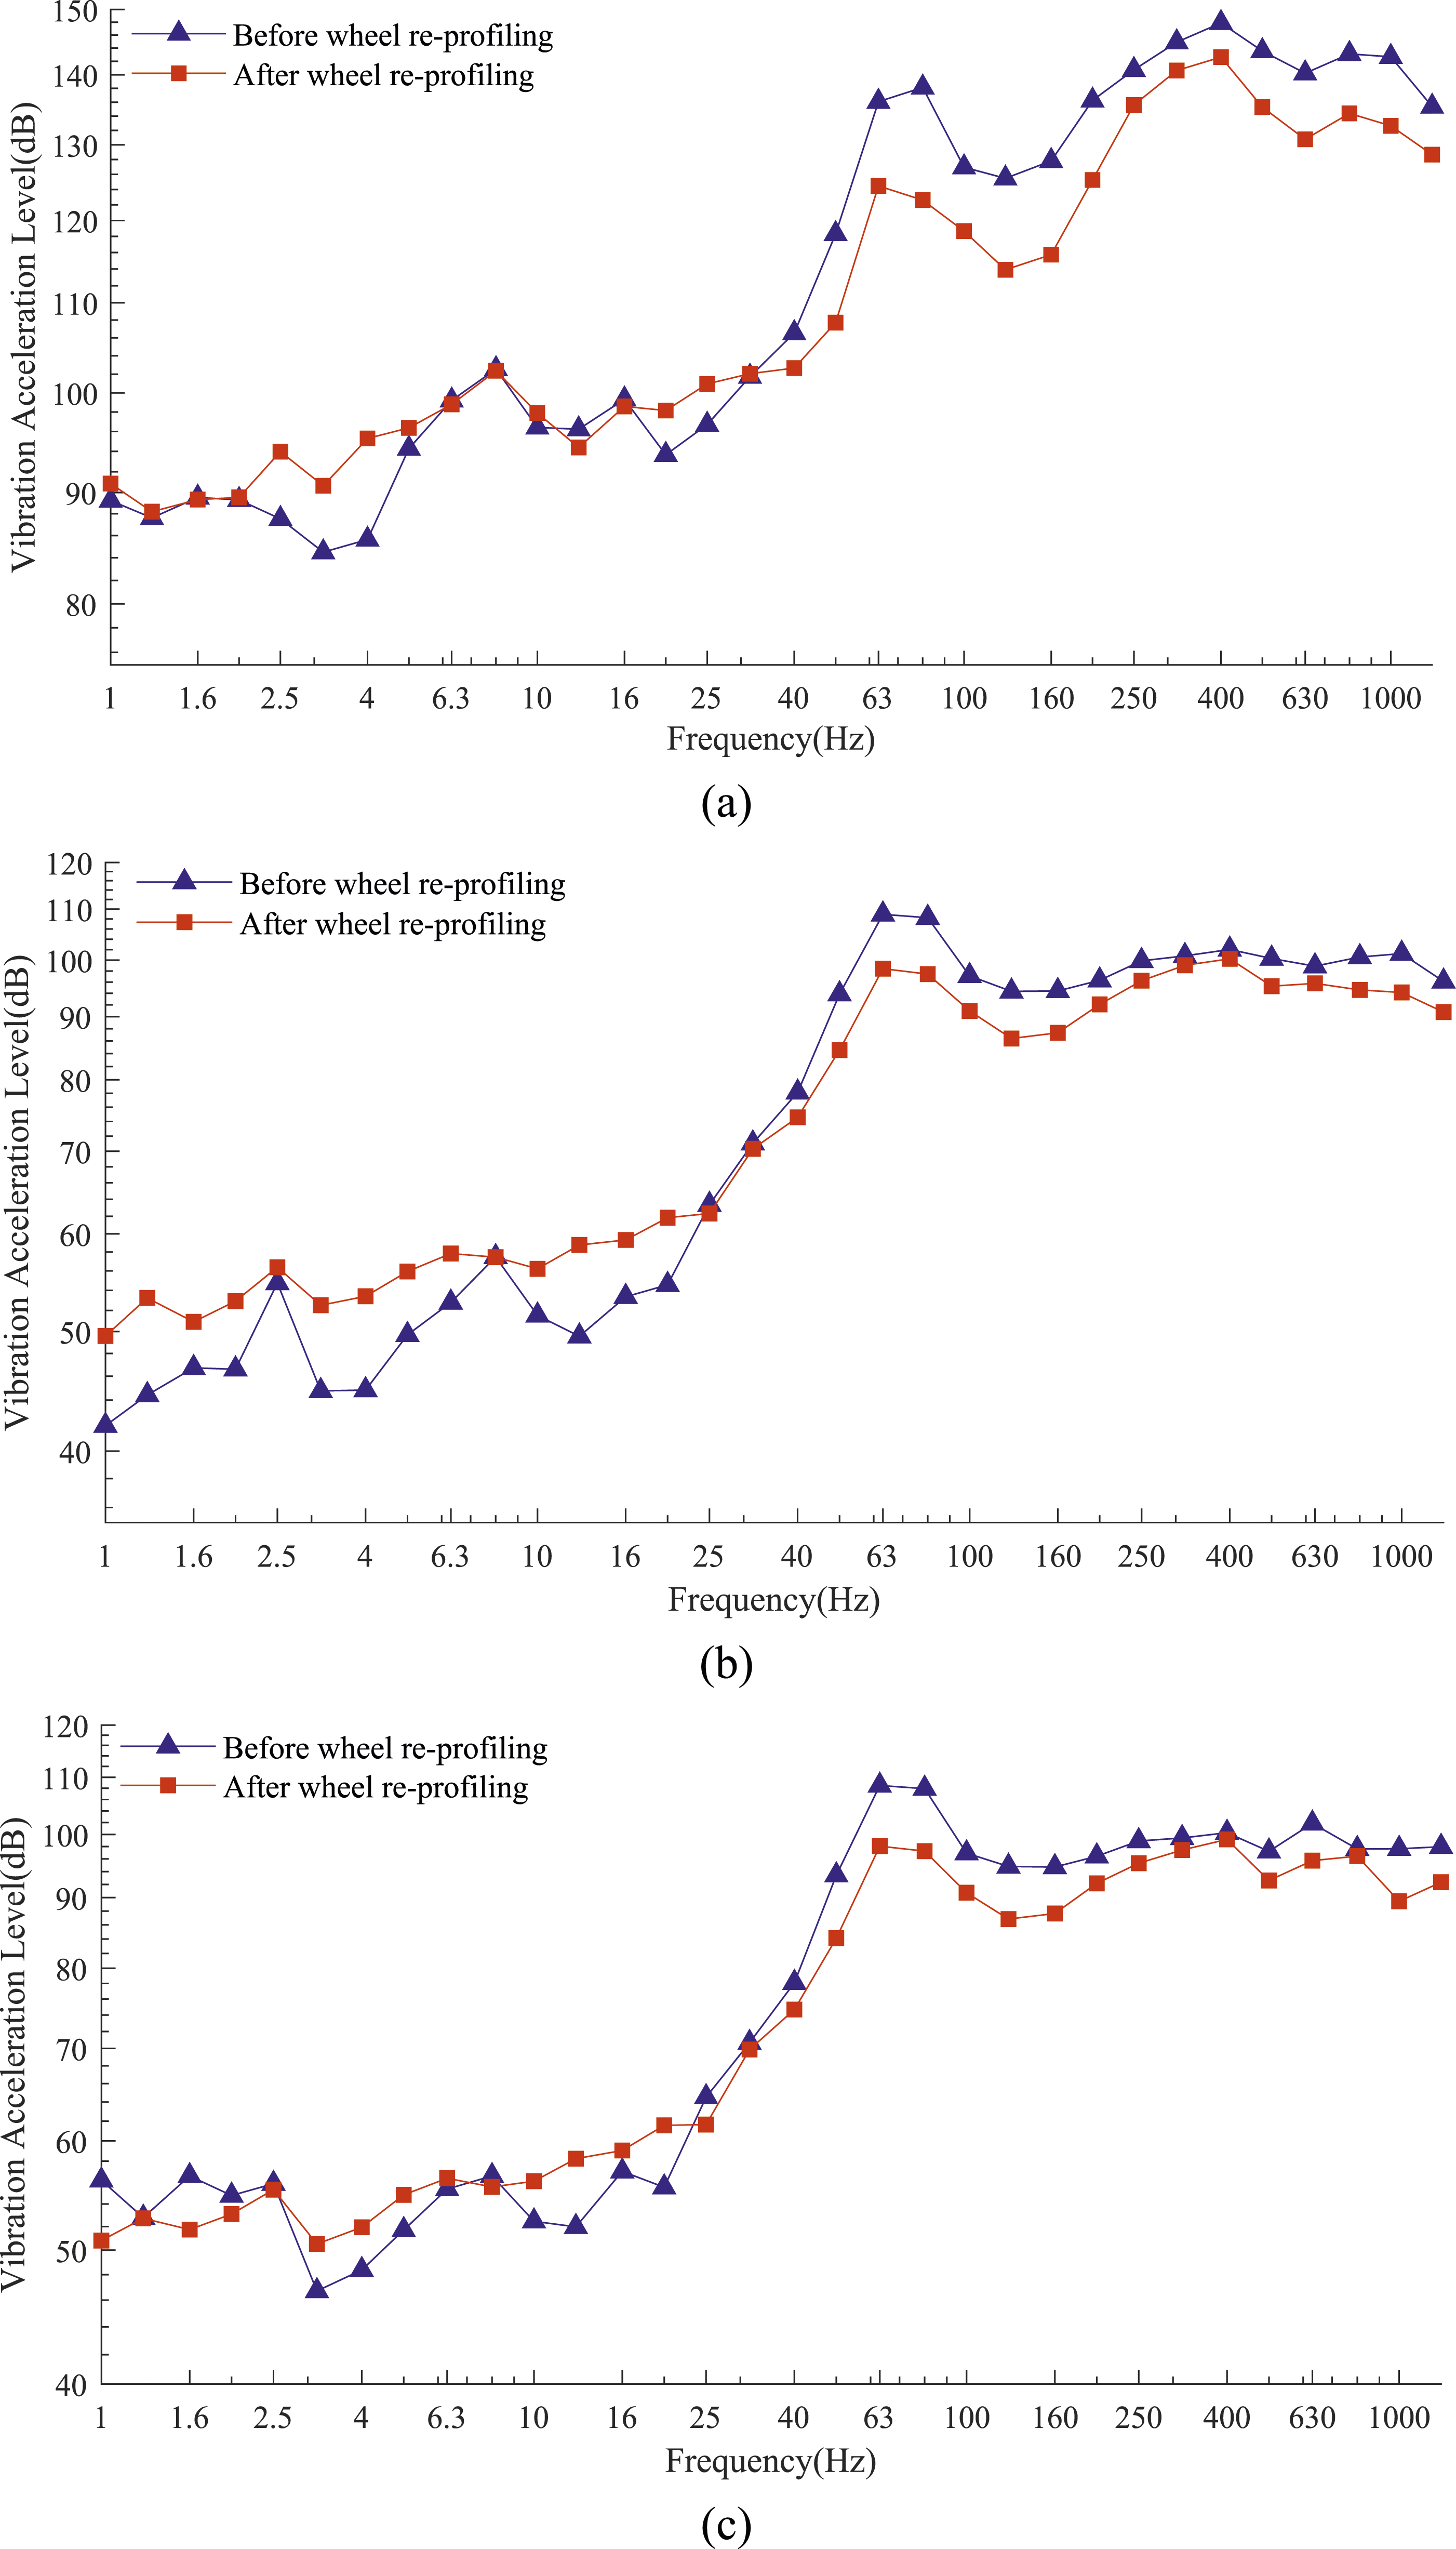
Corresponding vibration responses before and after wheel reprofiling.
Influence of full-load and empty-load conditions
Time domain analysis
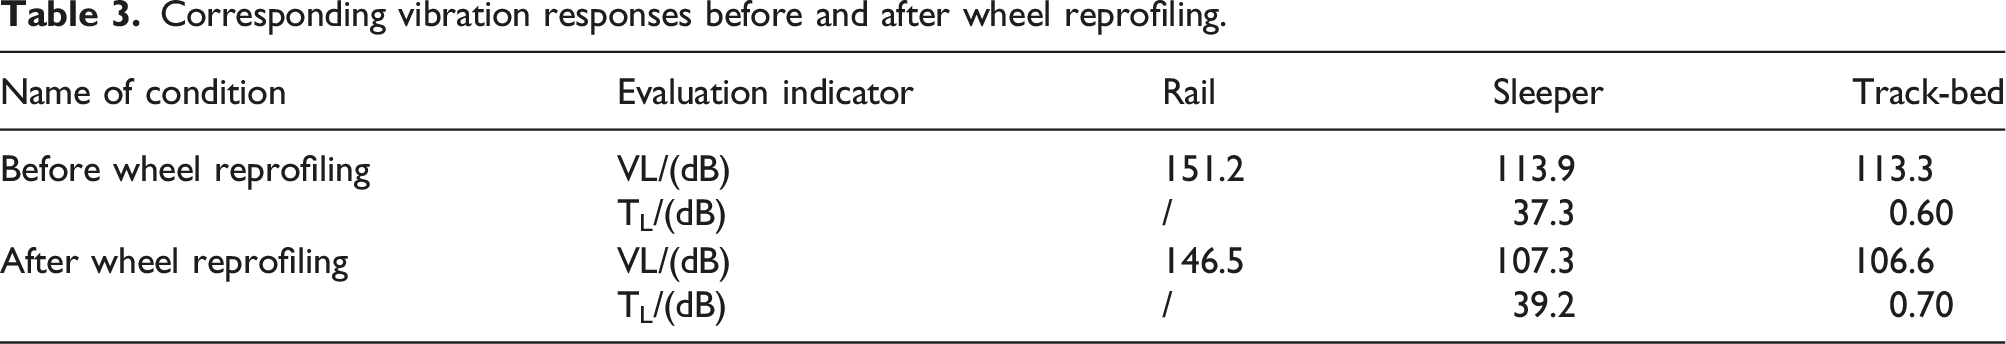
In order to contrast the influence of full load and empty load on track vibrations, two scenarios are selected for vibration data analysis: condition 2 (first two train cars are full-load, remaining six cars empty-load) and condition 3 (all eight cars are empty-load), with the wheel profile reprofiling. Figure 7 illustrates the vertical displacement of the rail as the train passes under these two conditions. From Figure 7(a), it is evident that during the passage of eight cars, the vertical displacement of the rail exhibits distinct trends. The first two cars, simulated to be loaded by the addition of sand, result in a maximum displacement approaching 0.8 mm, while the following six unloaded cars induce a maximum displacement of merely 0.4 mm. Figure 7(b) shows that the vertical displacements are quite similar when all eight cars are in the empty-load state. The vertical displacement of the rail. (a) Condition 2 (AW3). (b) Condition 3 (AW0).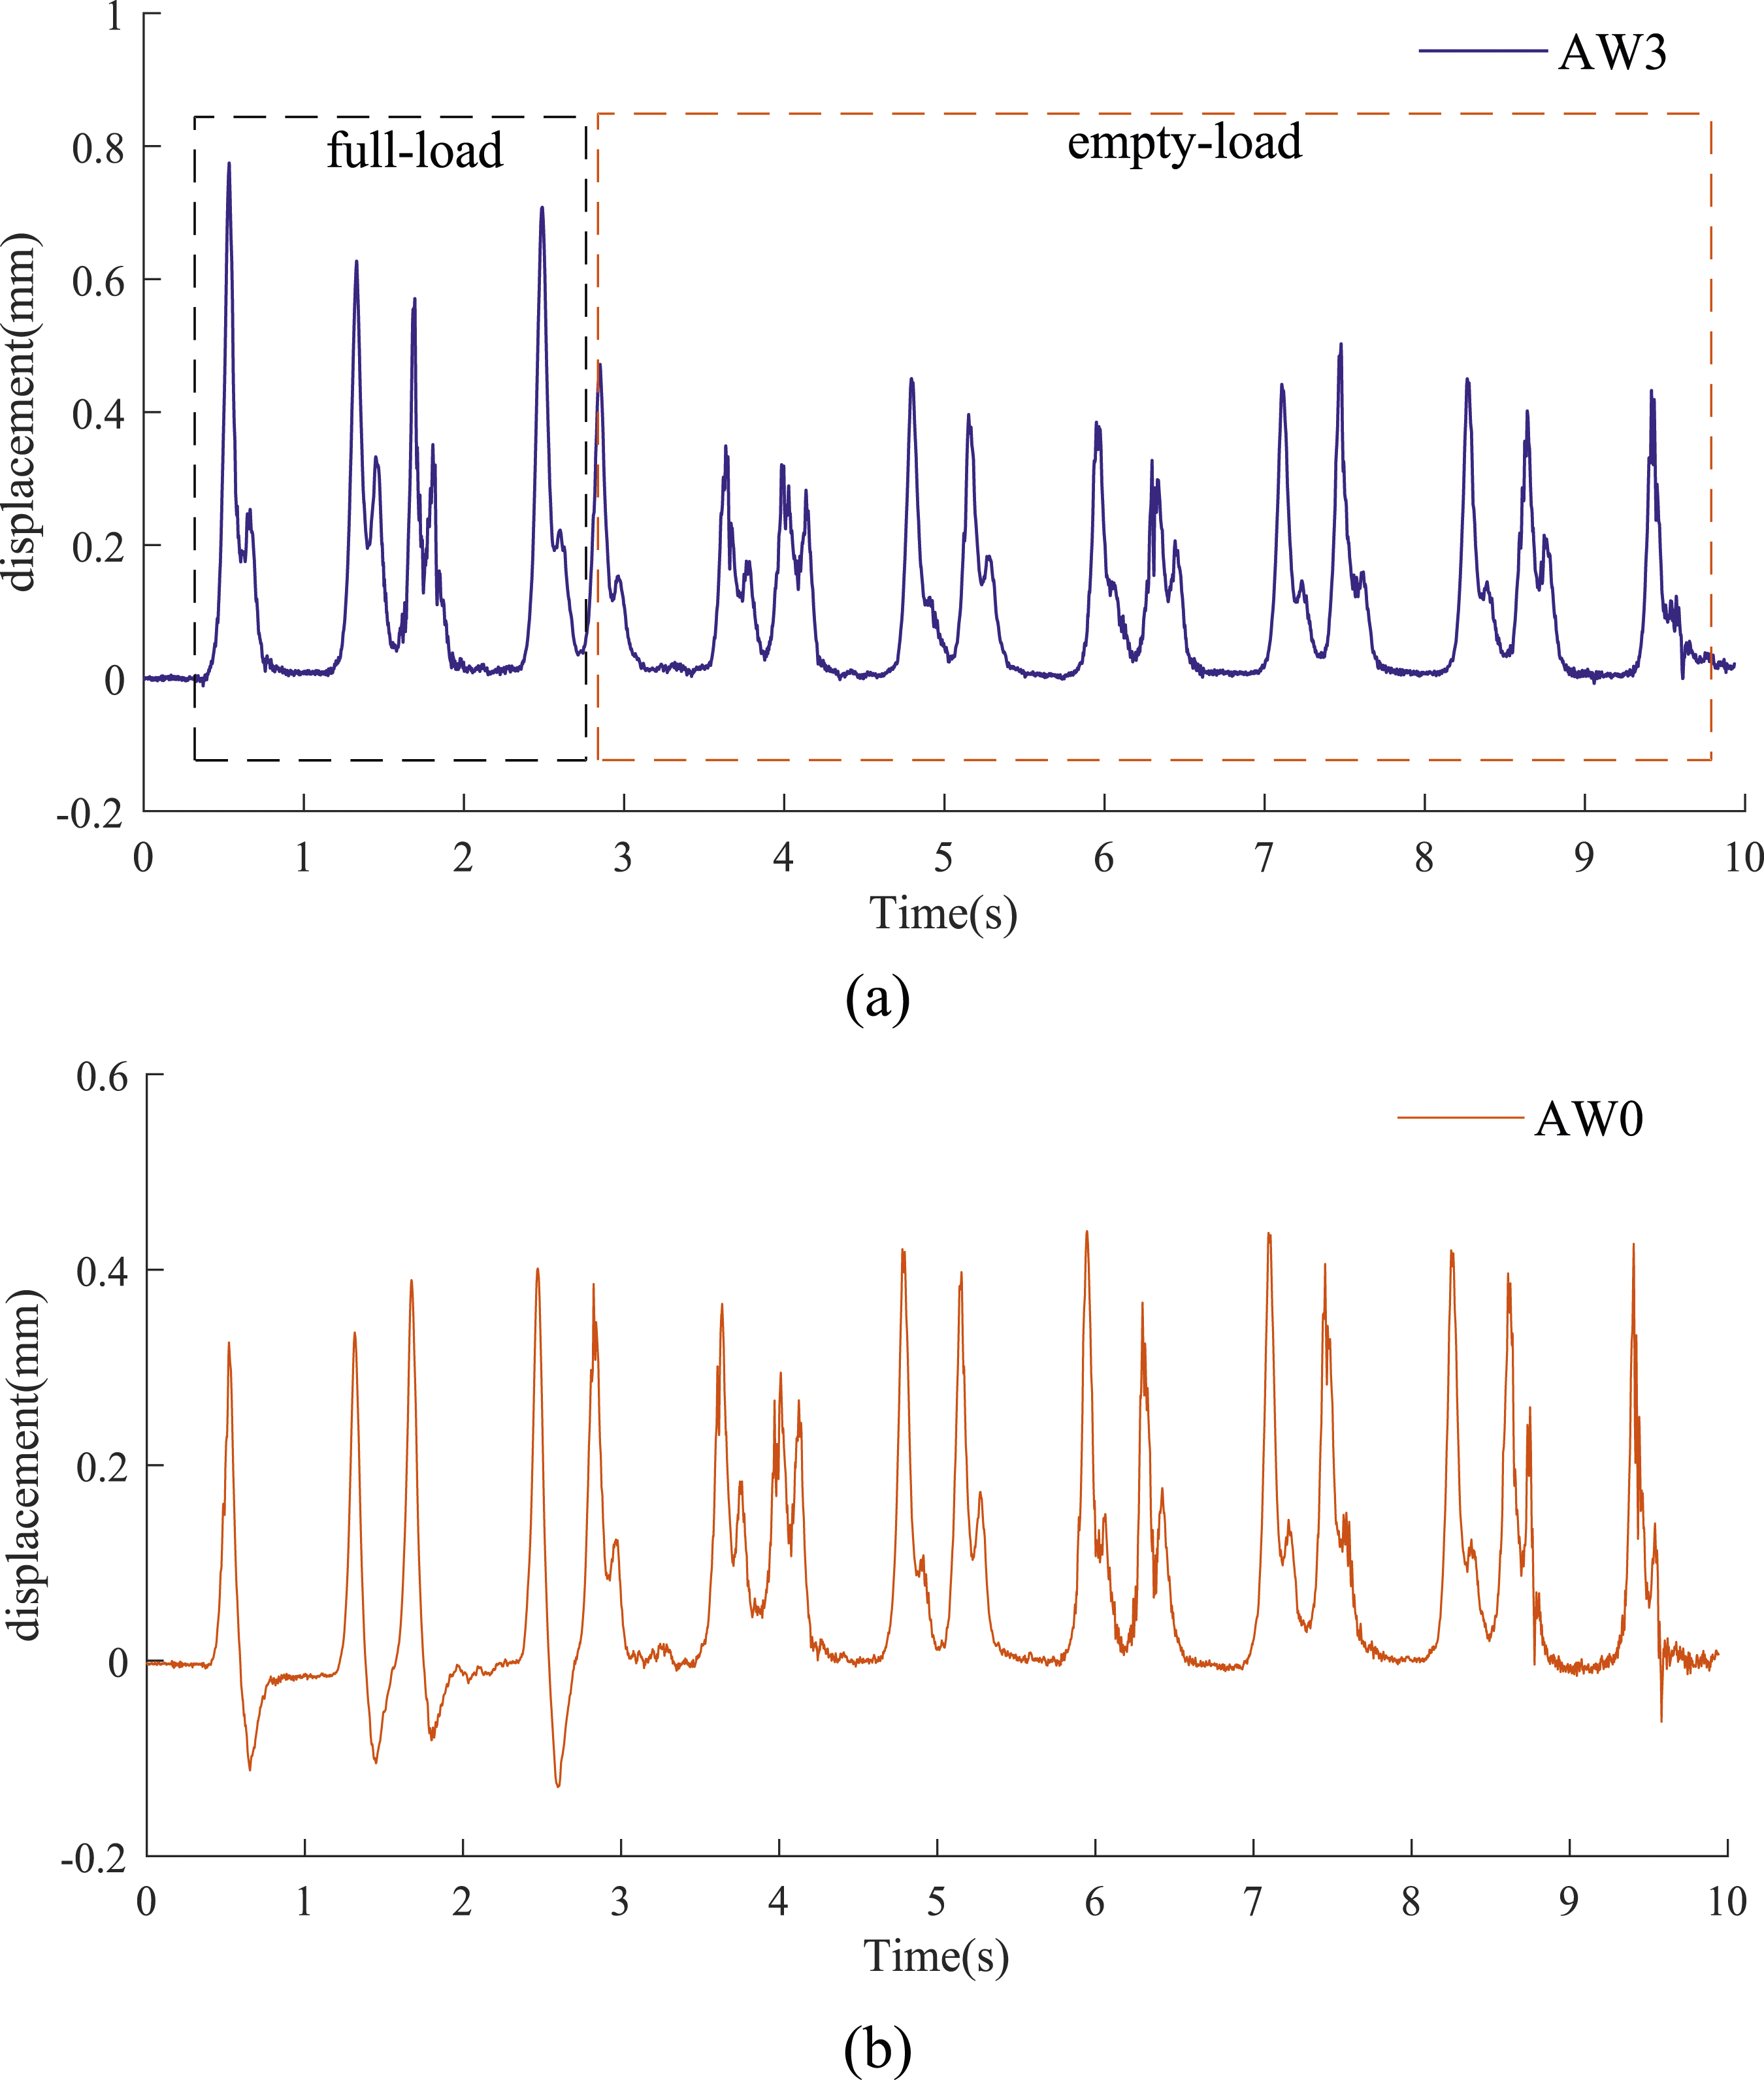
Figure 8 depicts the time domain waveform of the vibration acceleration of the rail, sleeper, and track-bed as the train passes through under two different conditions. The time domain waveforms of the vibration acceleration for the corresponding rail, sleeper, and track-bed structures exhibit relatively close resemblance between the two scenarios. Time domain waveform diagrams of track structures under two conditions. Condition 2 (AW3): (a) rail. (b) Sleeper. (c) Track-bed. Condition 3 (AW0): (e) rail. (f) Sleeper. (g) Track-bed.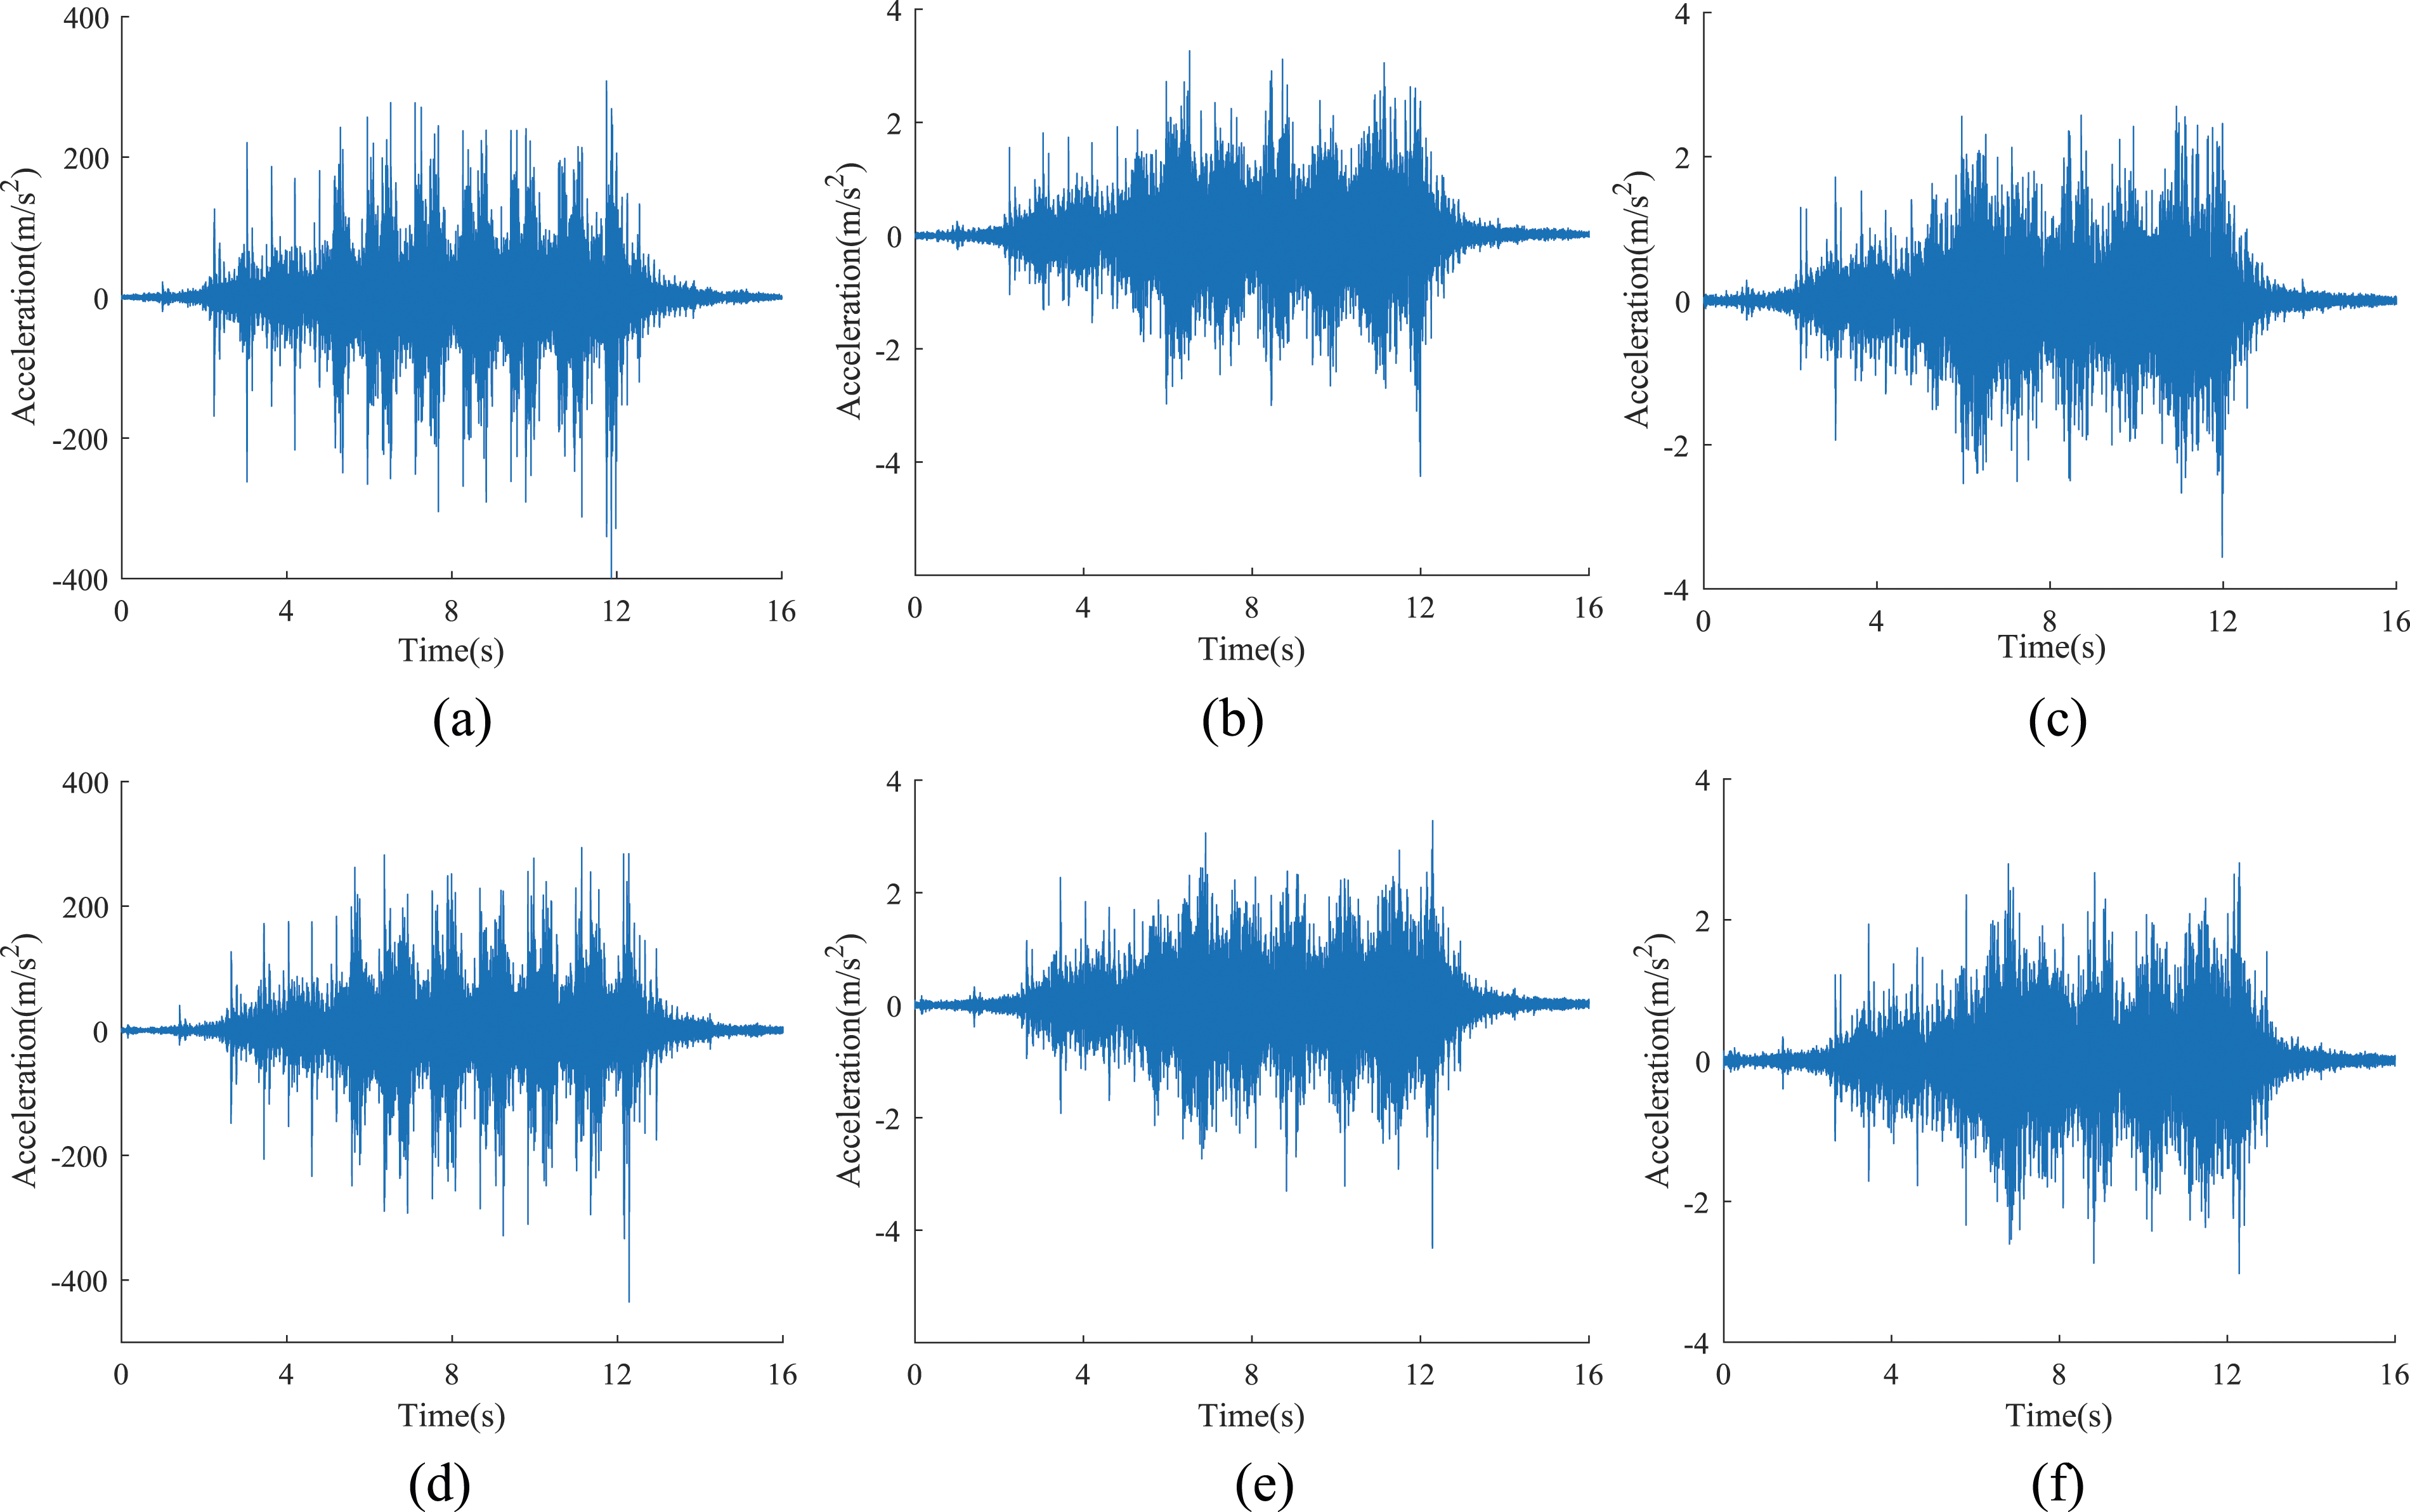
Vibration response metrics for full-load and empty-load conditions.
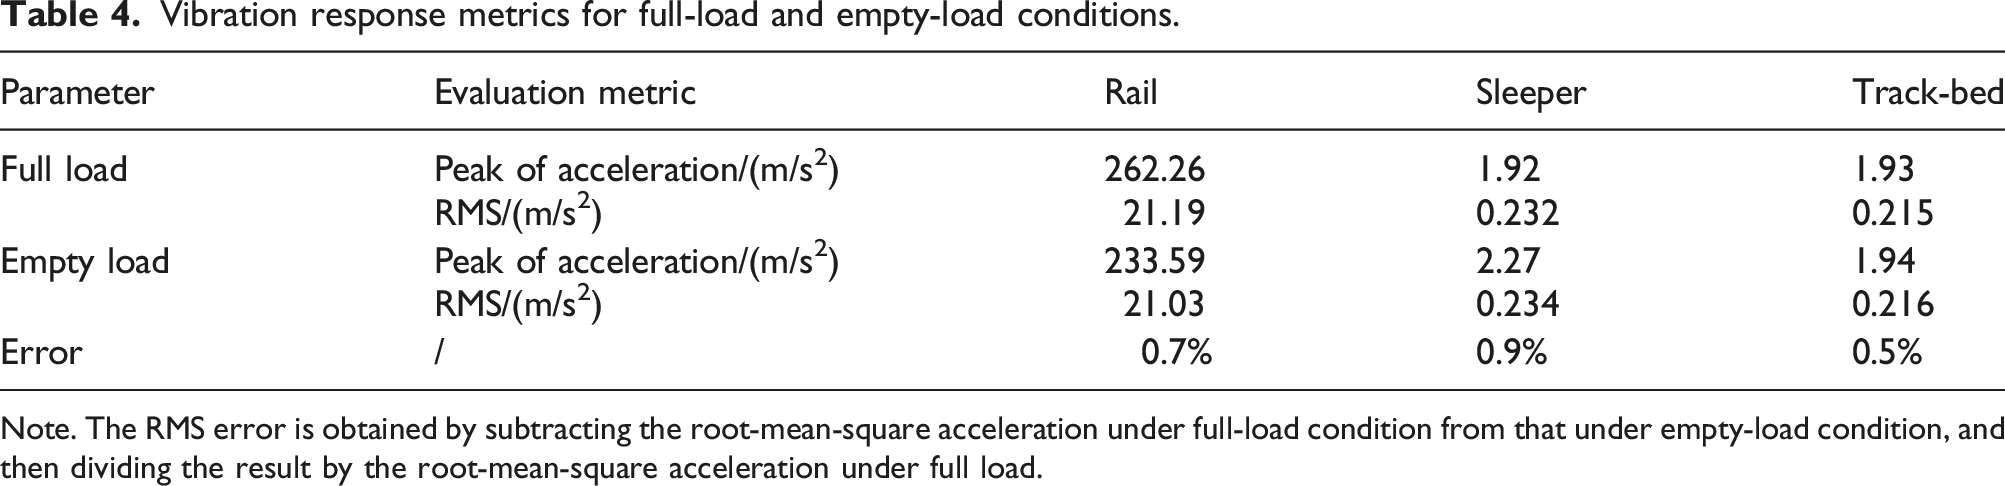
Note. The RMS error is obtained by subtracting the root-mean-square acceleration under full-load condition from that under empty-load condition, and then dividing the result by the root-mean-square acceleration under full load.
Frequency domain analysis
Figure 9 displays the frequency domain plots of the three track structures under full-load and empty-load conditions. In the frequency domain, it can be observed that, for frequencies below 50 Hz, the vibrational acceleration of the rail, sleeper, and track-bed under full load is greater than that under empty load. In frequency bands above 50 Hz, the vibrational acceleration under full-load and empty-load conditions exhibit a closer resemblance. Notably, irrespective of full load or empty load, distinct peaks are evident at 70 Hz and 350 Hz. Considering the vibration’s origin from irregularity in the track, coupled with Figure 1(b), the resonance-induced P2 wave corrugation on the rail surface occurs at the passing frequency range of 55–70 Hz. This accounts for the presence of the peak at 70 Hz. The peak of acceleration at this frequency is closely linked to the P2 force arising from wheel–rail interaction. Furthermore, the presence of a short-pitch 50 mm wavelength (corresponding to the passing frequency of 350 Hz) contributes to the peak in the 350 Hz frequency range. Frequency domain plots of various track structures. (a) Rail. (b) Sleeper. (c) Track-bed.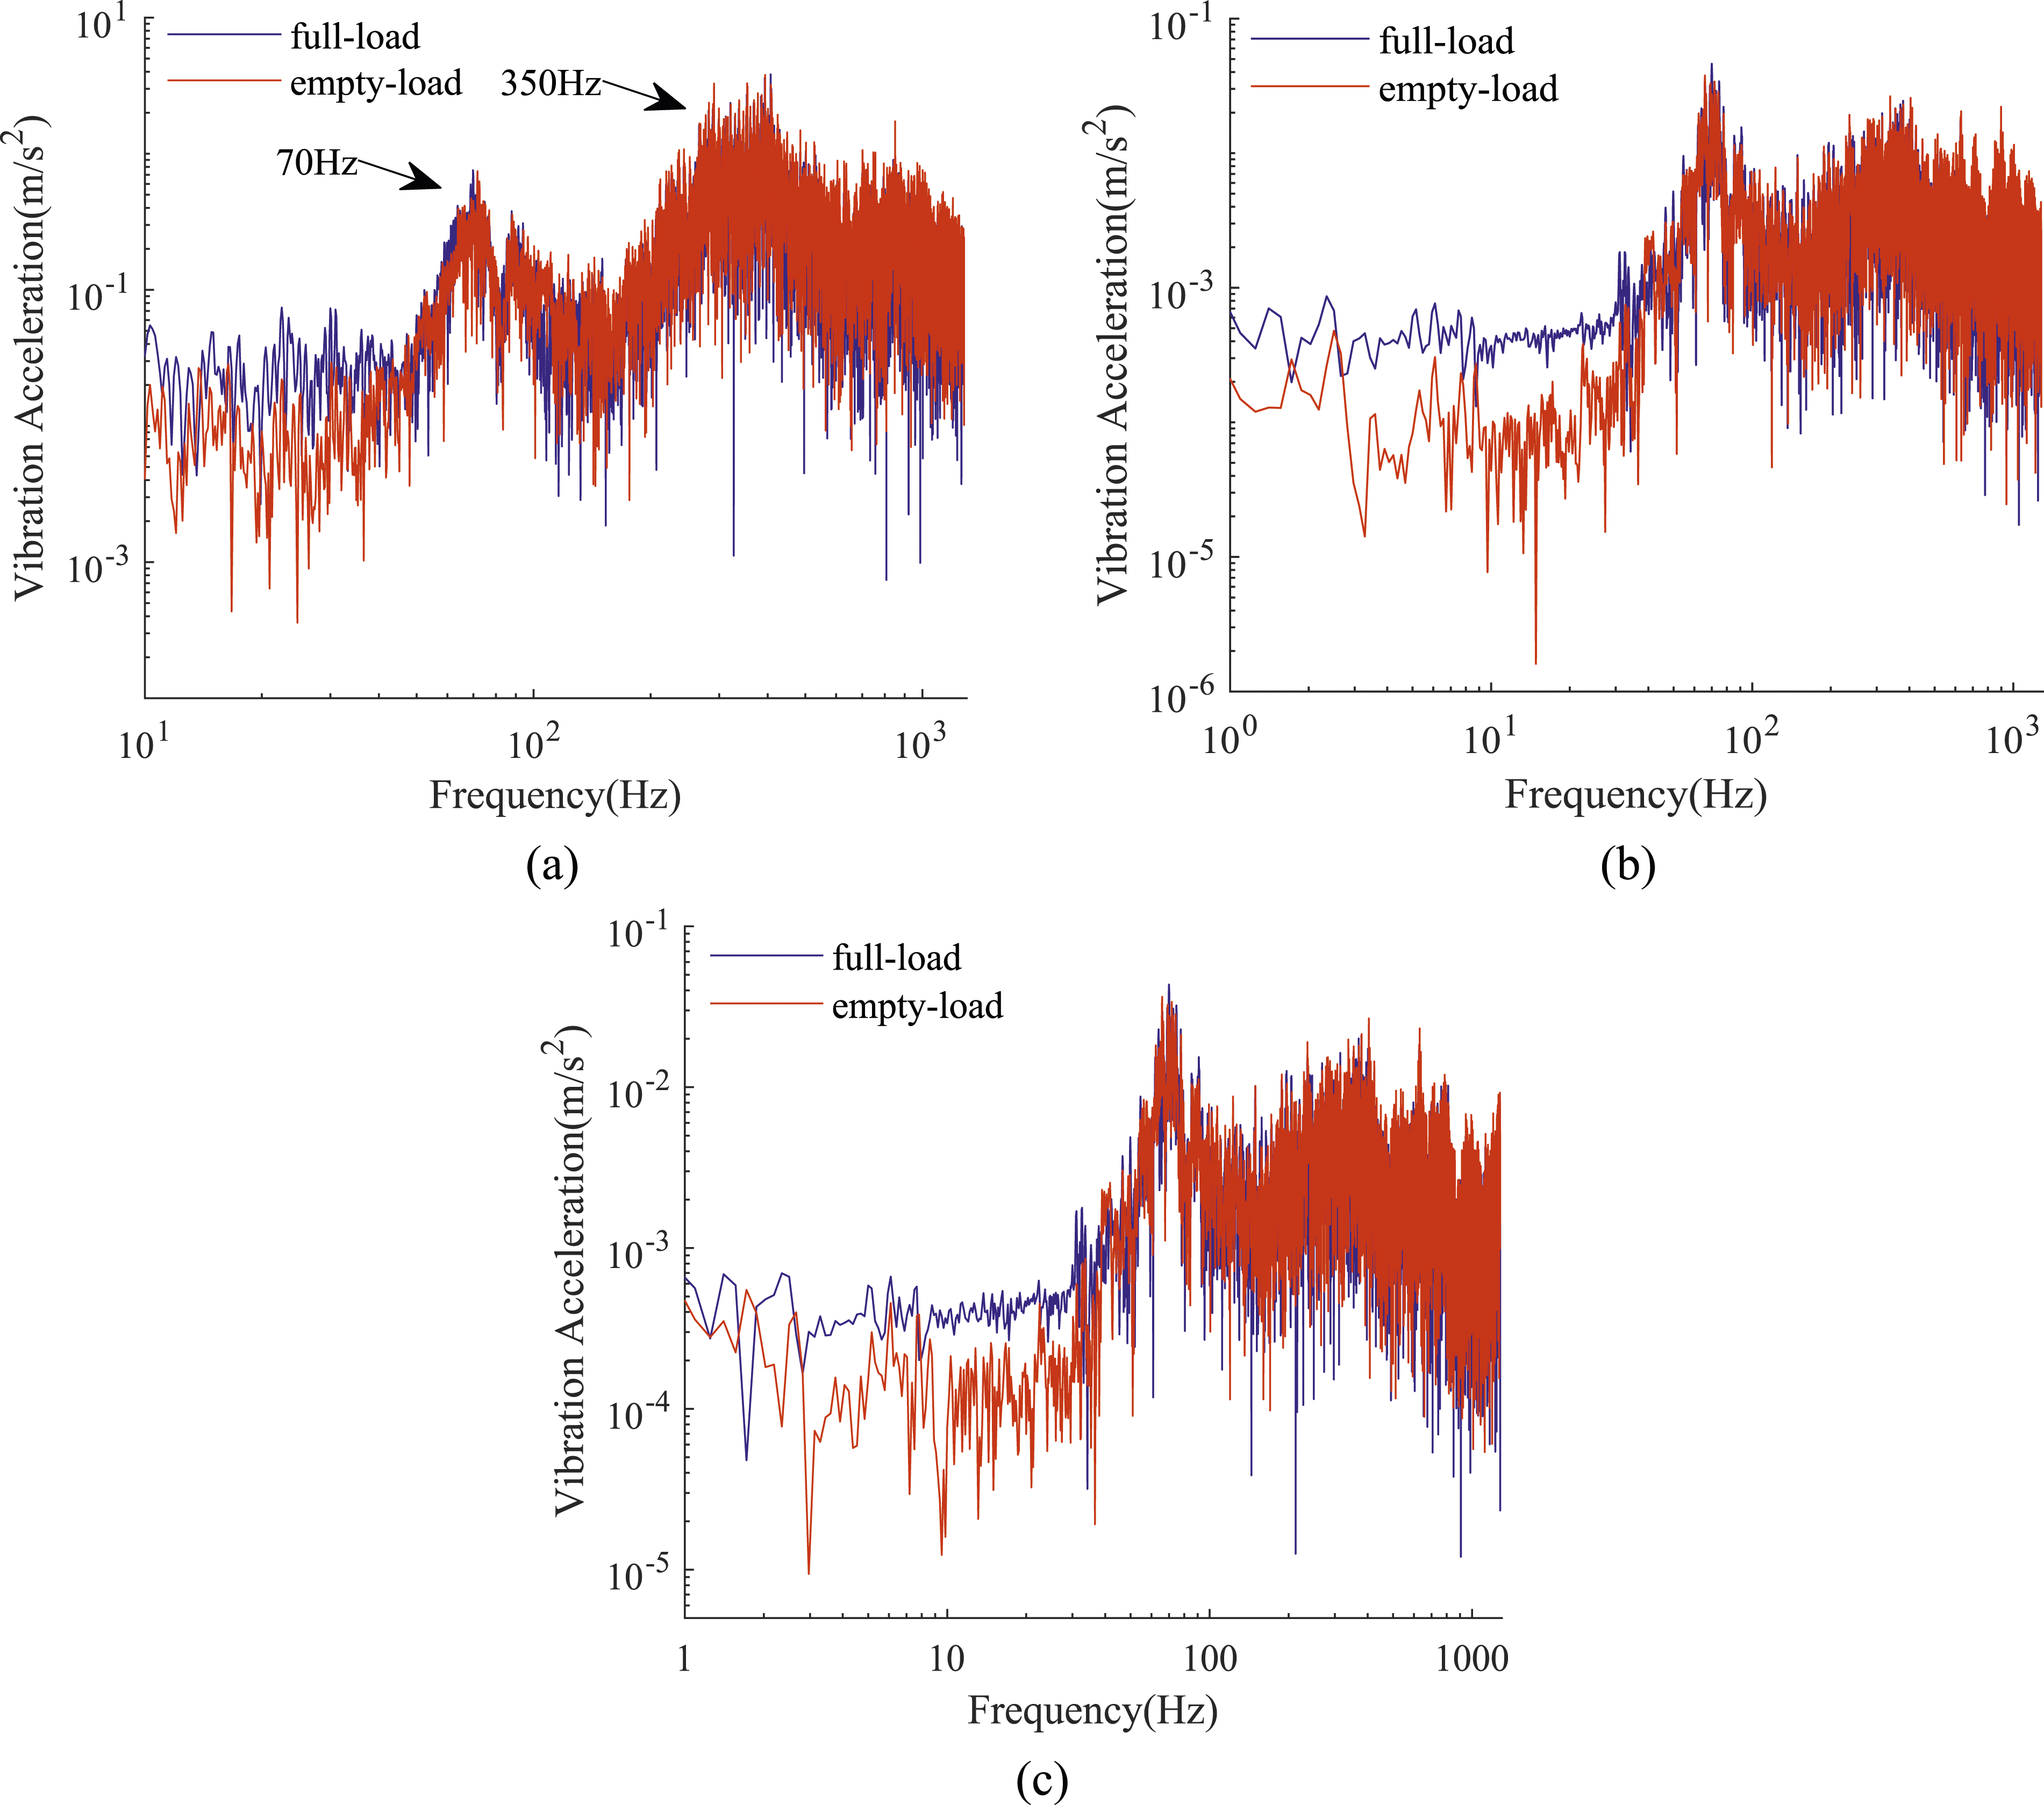
Vibration acceleration level analysis
Figure 10 illustrates the 1/3-octave frequency spectra of vibration acceleration for the rail, sleeper, and track-bed under full-load and empty-load conditions. The vibration acceleration levels of the three track structures exhibit consistent patterns. In the frequency range of 50–1250 Hz, the vibration acceleration levels of the rail, whether under full load or empty load, are fairly close. Conversely, within the lower frequency range of 1–40 Hz, the vibration acceleration level of the rail under full-load condition surpasses that under empty-load condition. This phenomenon is attributed to the substantial influence of wheel–rail interaction within the higher frequency range of 50–1250 Hz. The similarity observed around 63 Hz (the frequency band affected by P2 force) under full-load and empty-load conditions suggests that the predominant contributing factor is the resonance effect between the unsprung mass and the track, rather than the axle load. In contrast, lower frequencies are less impacted by wheel-rail interaction but are significantly influenced by axle load. The vibration acceleration level trends for the sleeper and track-bed mirror those of the rail. 1/3-octave frequency spectra of different track structures. (a) Rail. (b) Sleeper. (c) Track-bed.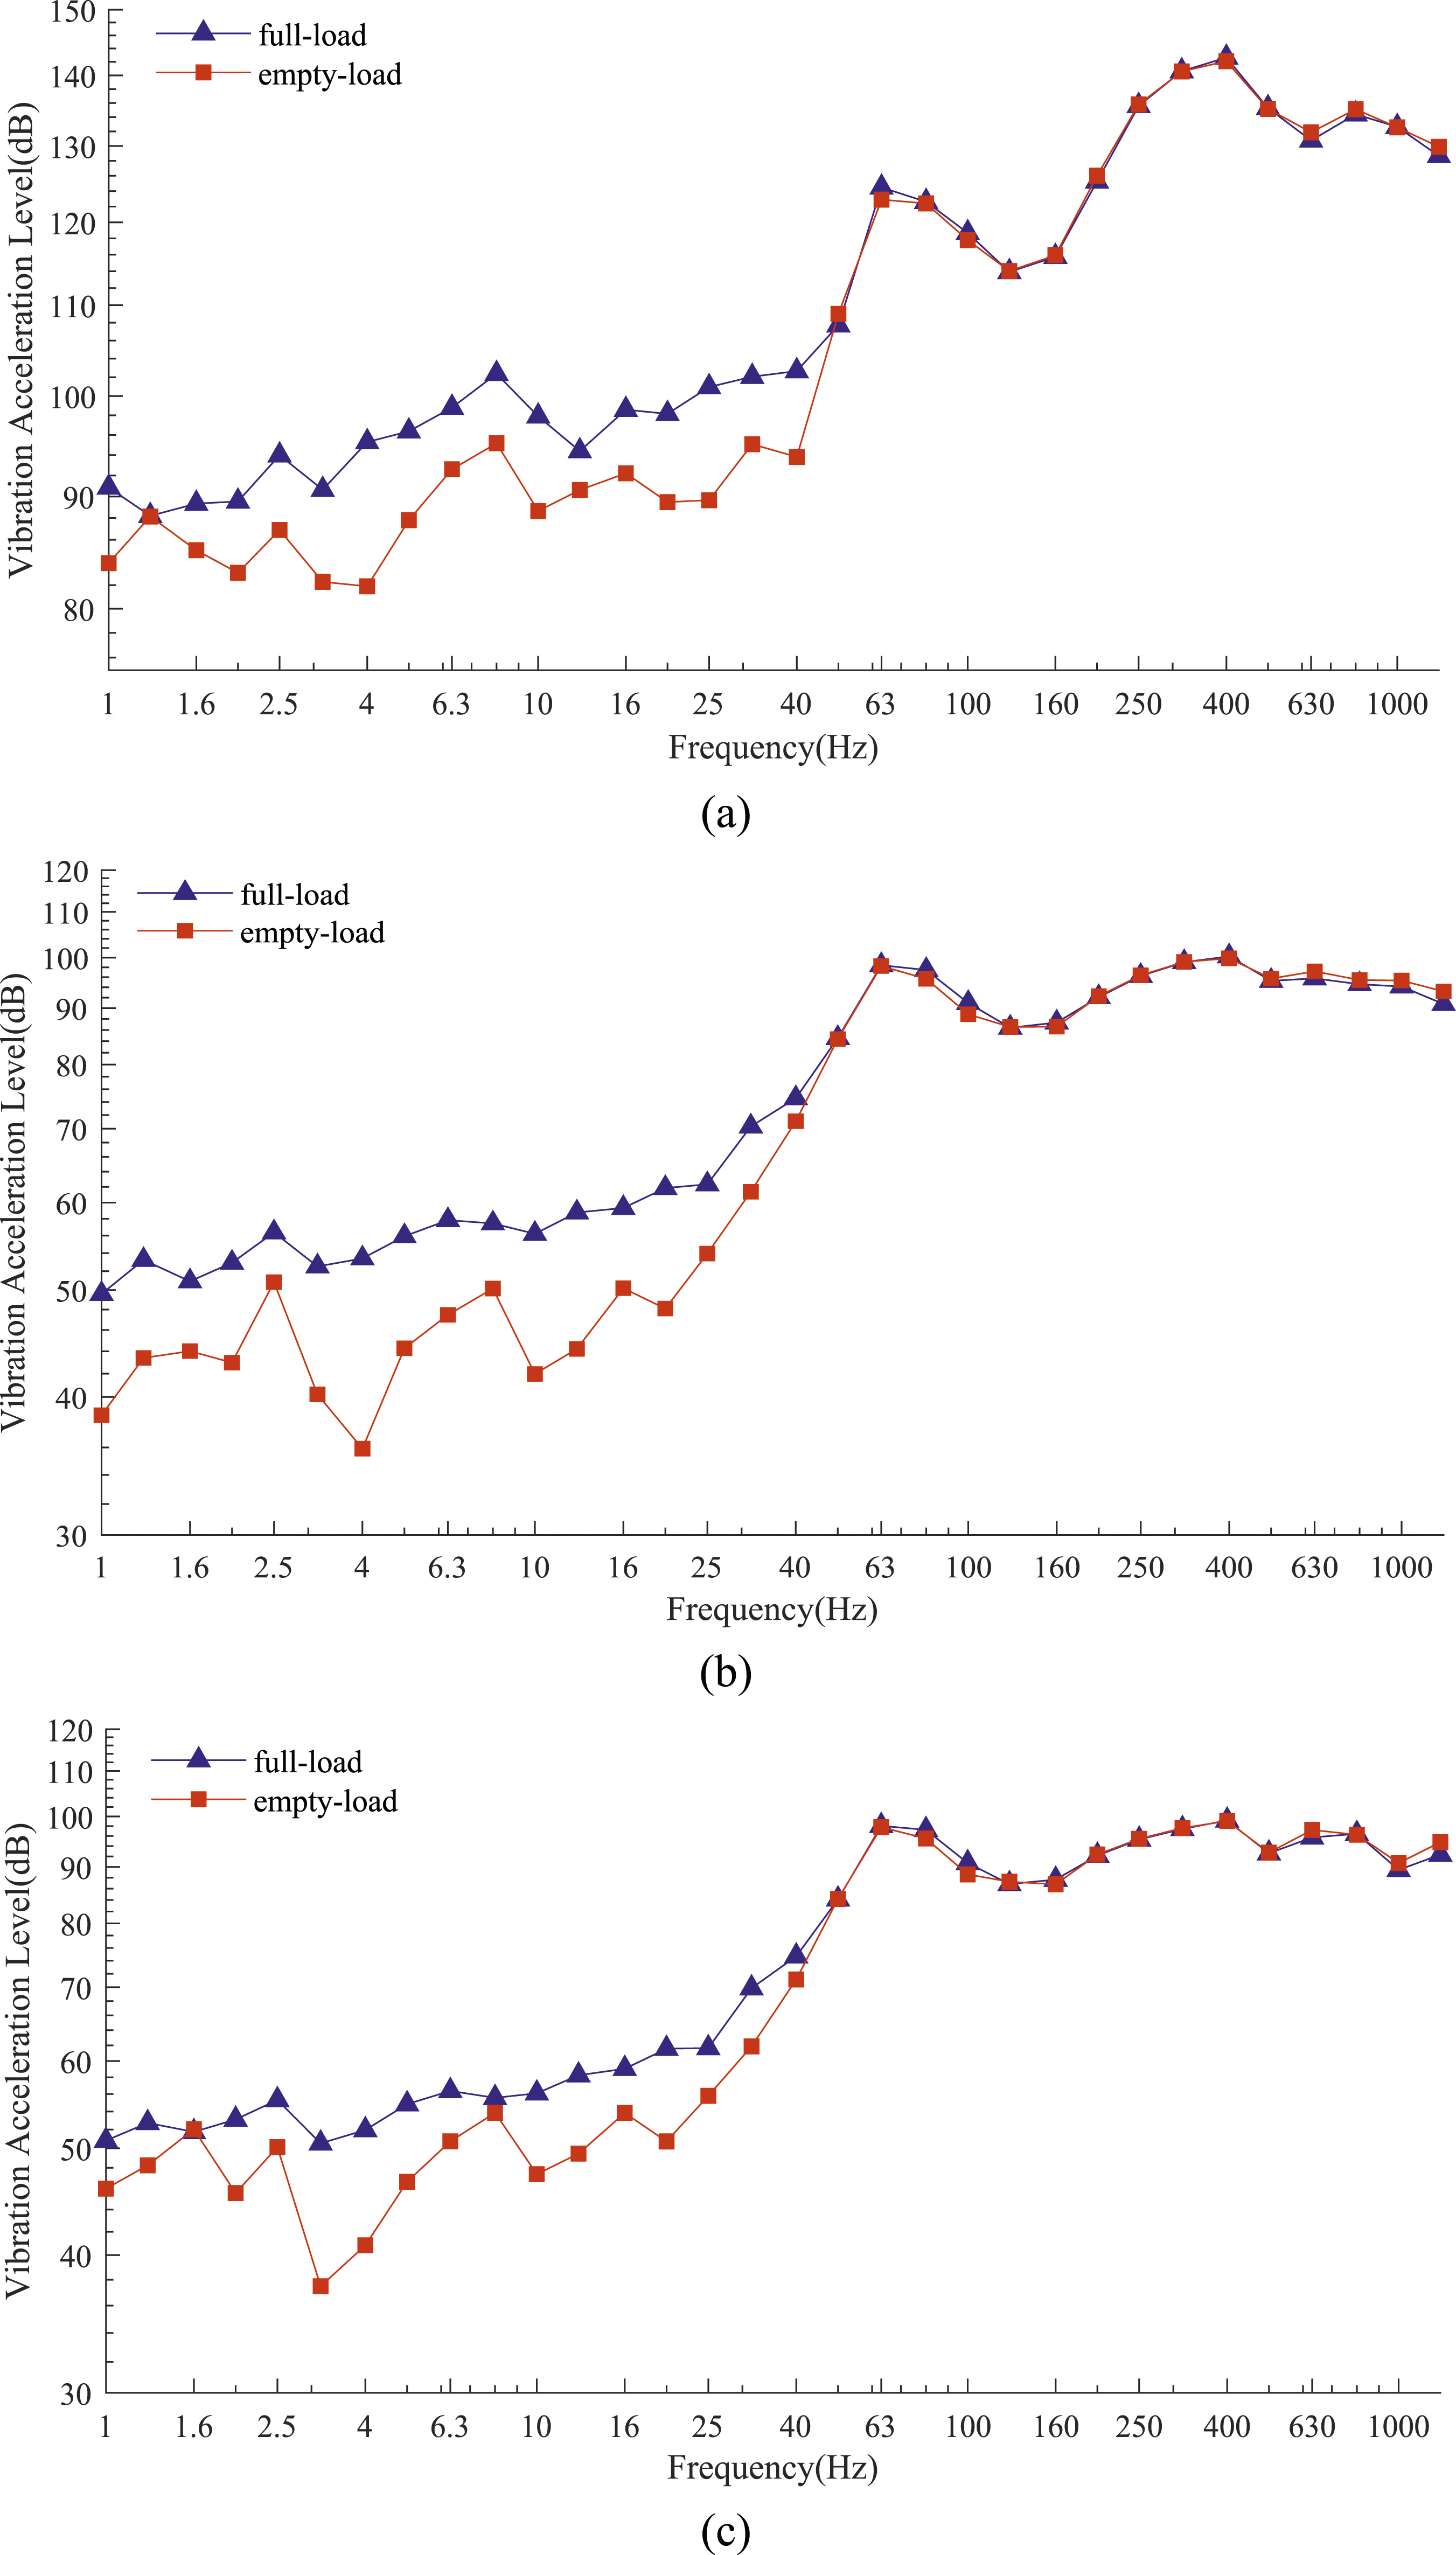
From Figure 10, it can be observed that full-load condition exert a more substantial impact on lower frequencies. Differences in vibration acceleration levels at lower frequencies are computed pairwise among the three track structures (rail, sleepers, and track-bed) under full load and empty load, as illustrated in Figure 11. The results depicted in Figure 11 indicate that within the frequency range of 3.15–5 Hz, significant differences in vibration acceleration levels among the three track structures are evident. Both the rail and sleeper exhibit their highest differences at around 4 Hz, while the track-bed’s peak difference occurs at 3.15 Hz. This suggests that the frequency range of 3.15–5 Hz is where axle load exerts a pronounced influence on the track structure. Vibration acceleration level differences in the 1–40 Hz range.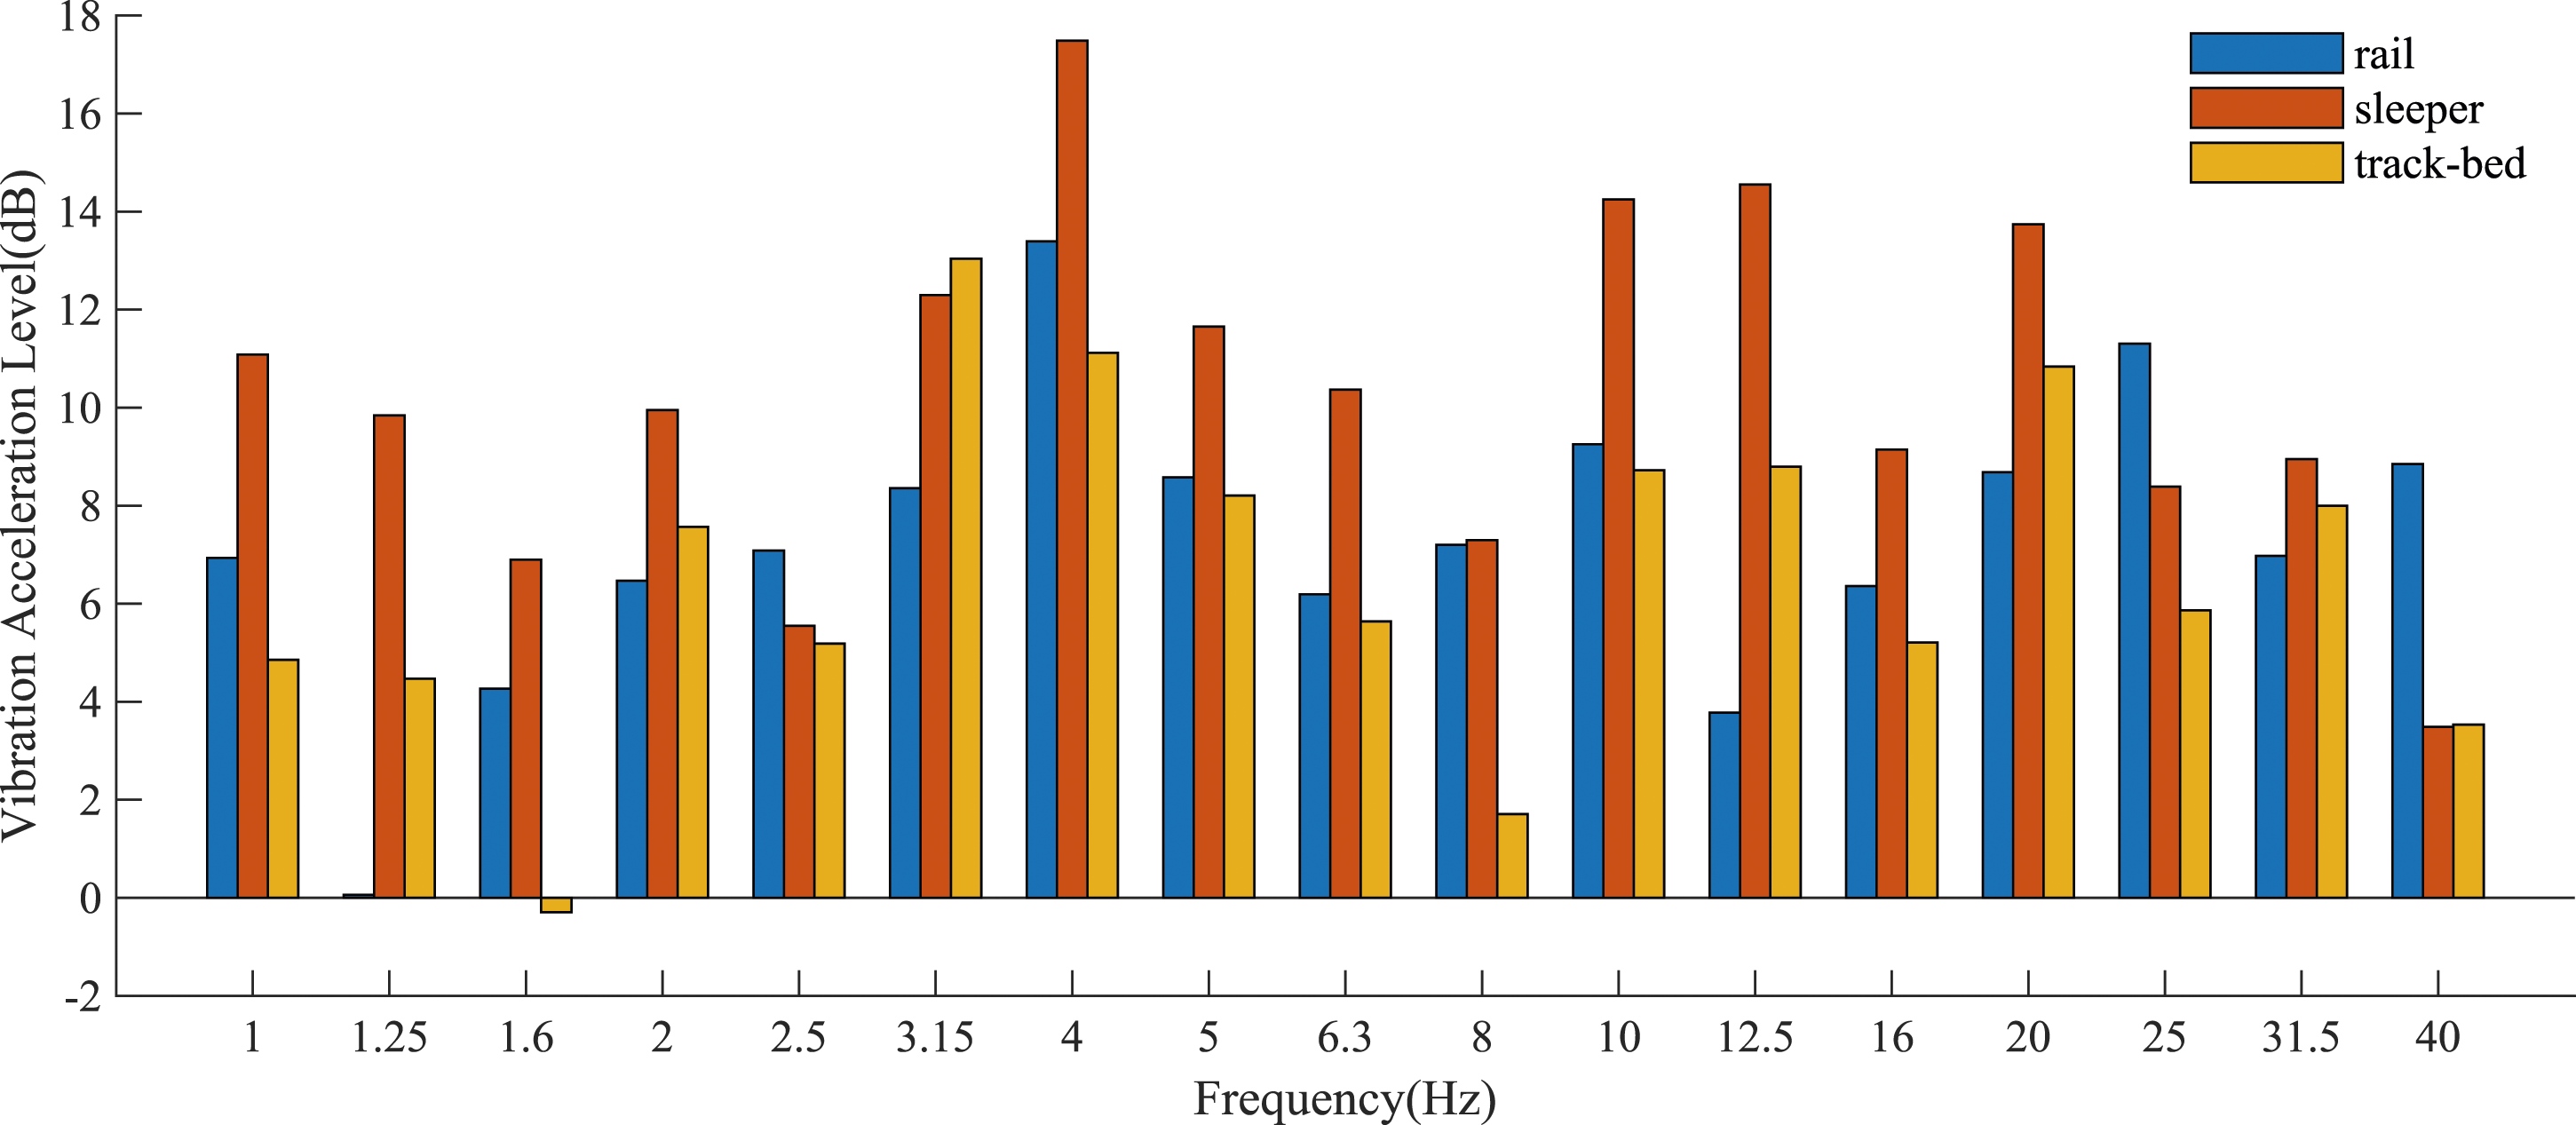
Figure 12 and Table 5 present the vibration acceleration levels and transmission loss for different track structures under full-load and empty-load conditions. The results indicate that the vibration acceleration levels for each track structure are higher under full load compared to empty load. Specifically, the rail, sleeper, and track-bed experienced increases of 1.2 dB, 0.5 dB, and 0.5 dB, respectively. This suggests that the influence of full-load condition on the vibration response of the three track structures is relatively modest. Regarding transmission loss, it is observed that full load leads to an increase in transmission loss from the rail to the sleeper, while there is minimal change in transmission loss from the sleeper to the track-bed. Vibration levels of different track structures. Transmission loss.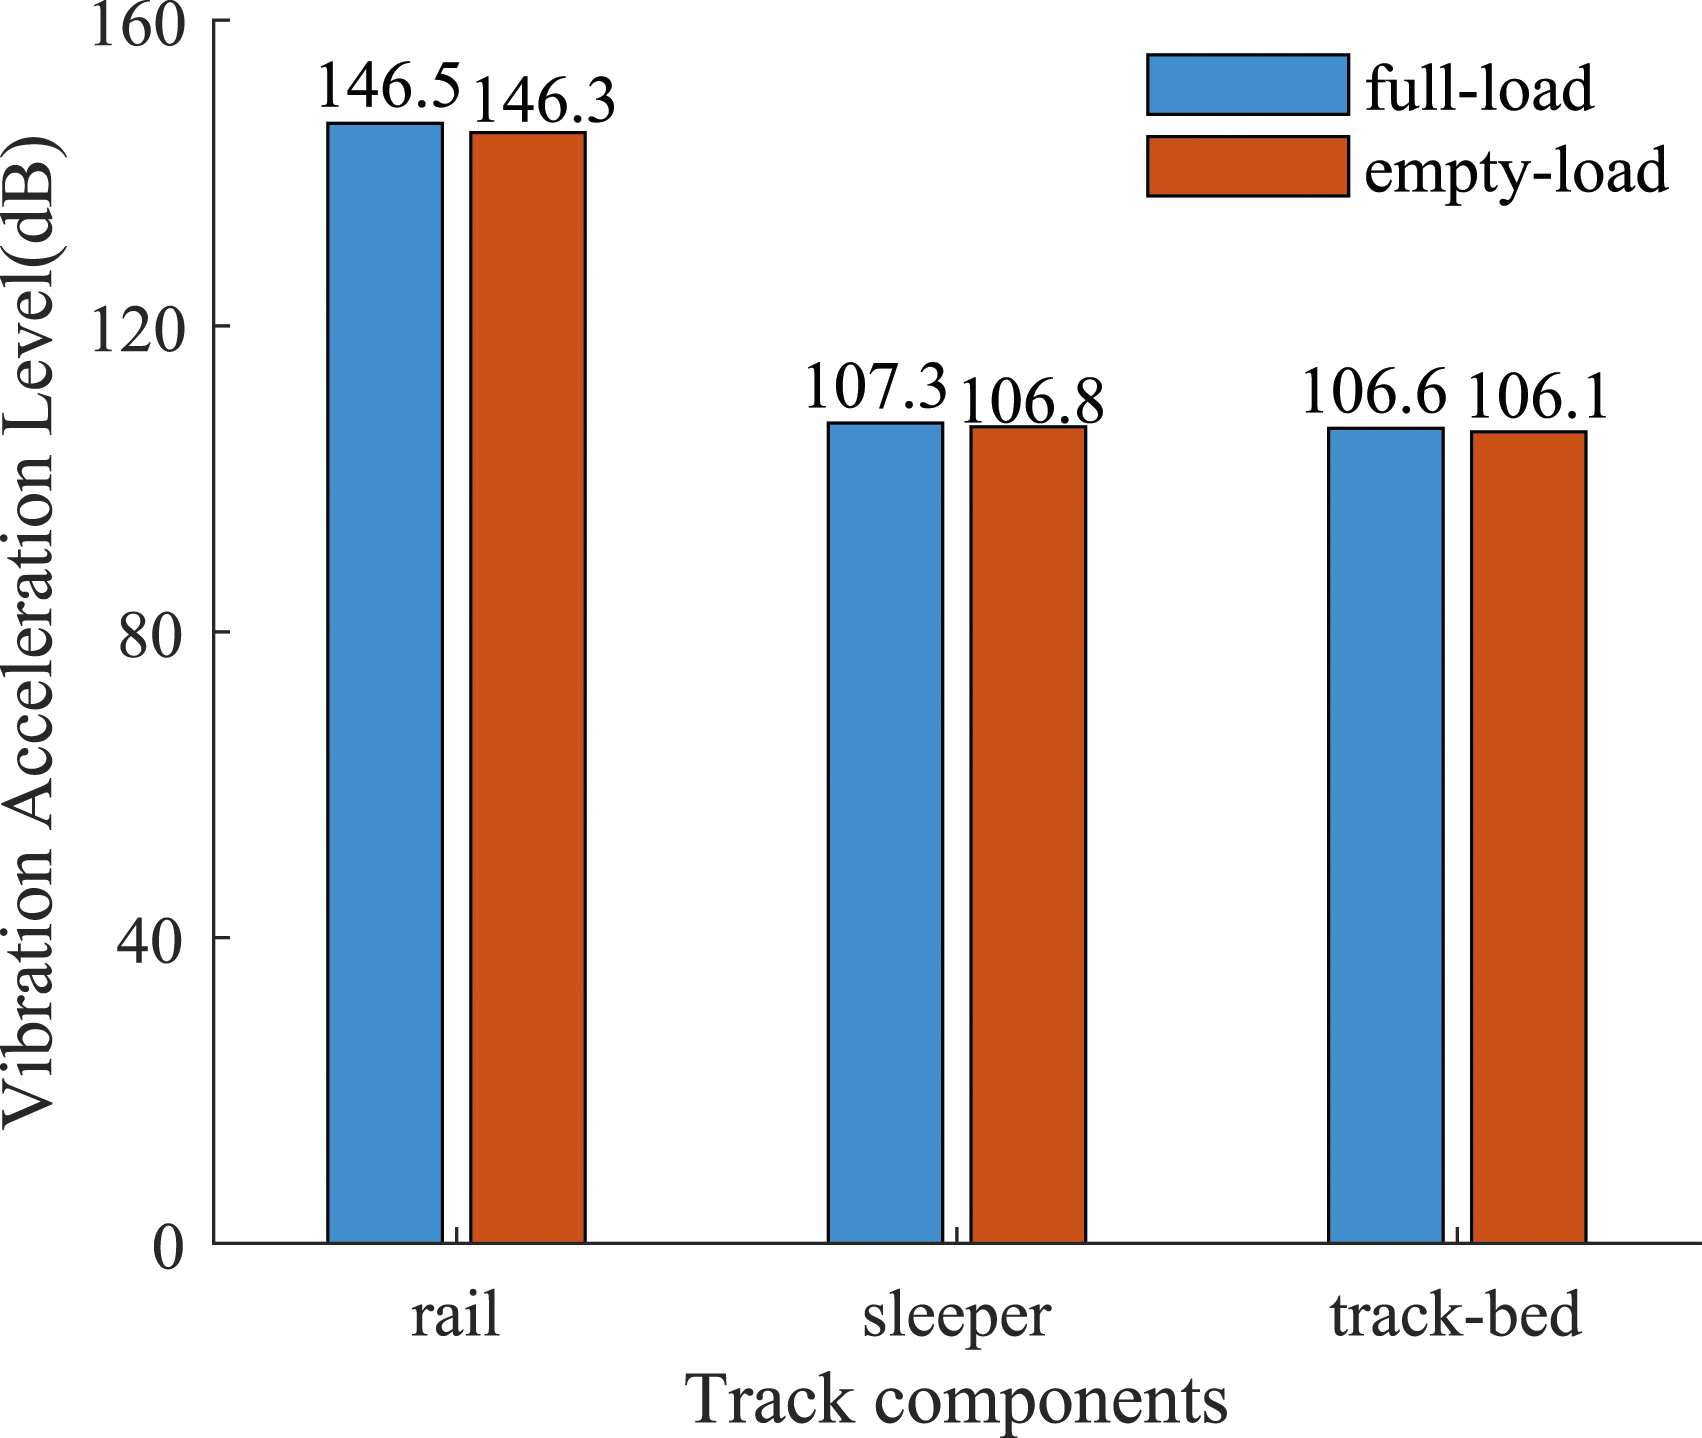
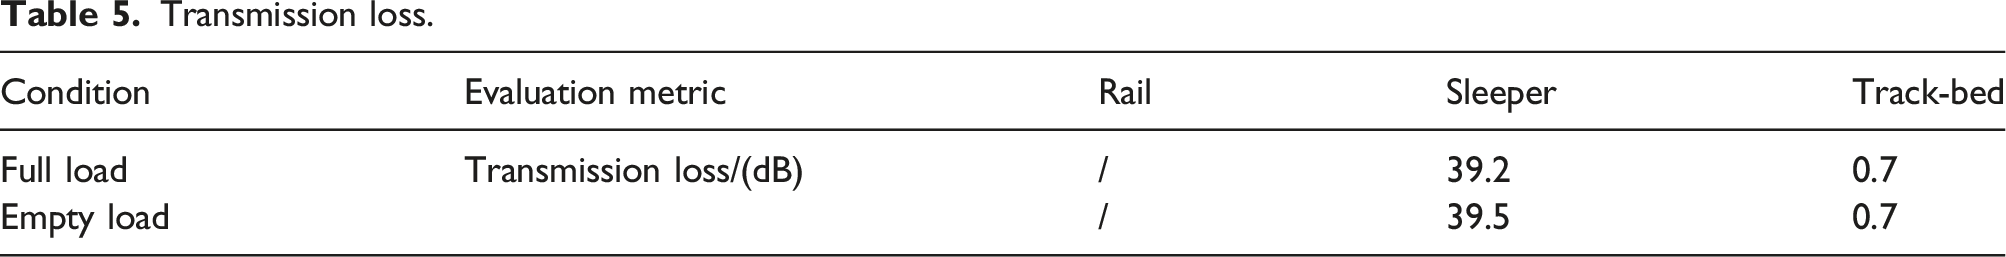
Figure 13 presents the vibration acceleration levels of the three track structures during regular daytime vehicle operations over a total of 205 train passes. The figure illustrates that regardless of whether it is during peak travel hours or periods of relatively low passenger occupancy, the vibration acceleration levels of the three track structures fluctuate within a certain range over time. There is no noticeable trend of significantly higher vibration acceleration levels during peak travel hours. This indicates that axle load has a relatively minor influence on the vibration acceleration levels. Vibration levels of different track structures during regular operation.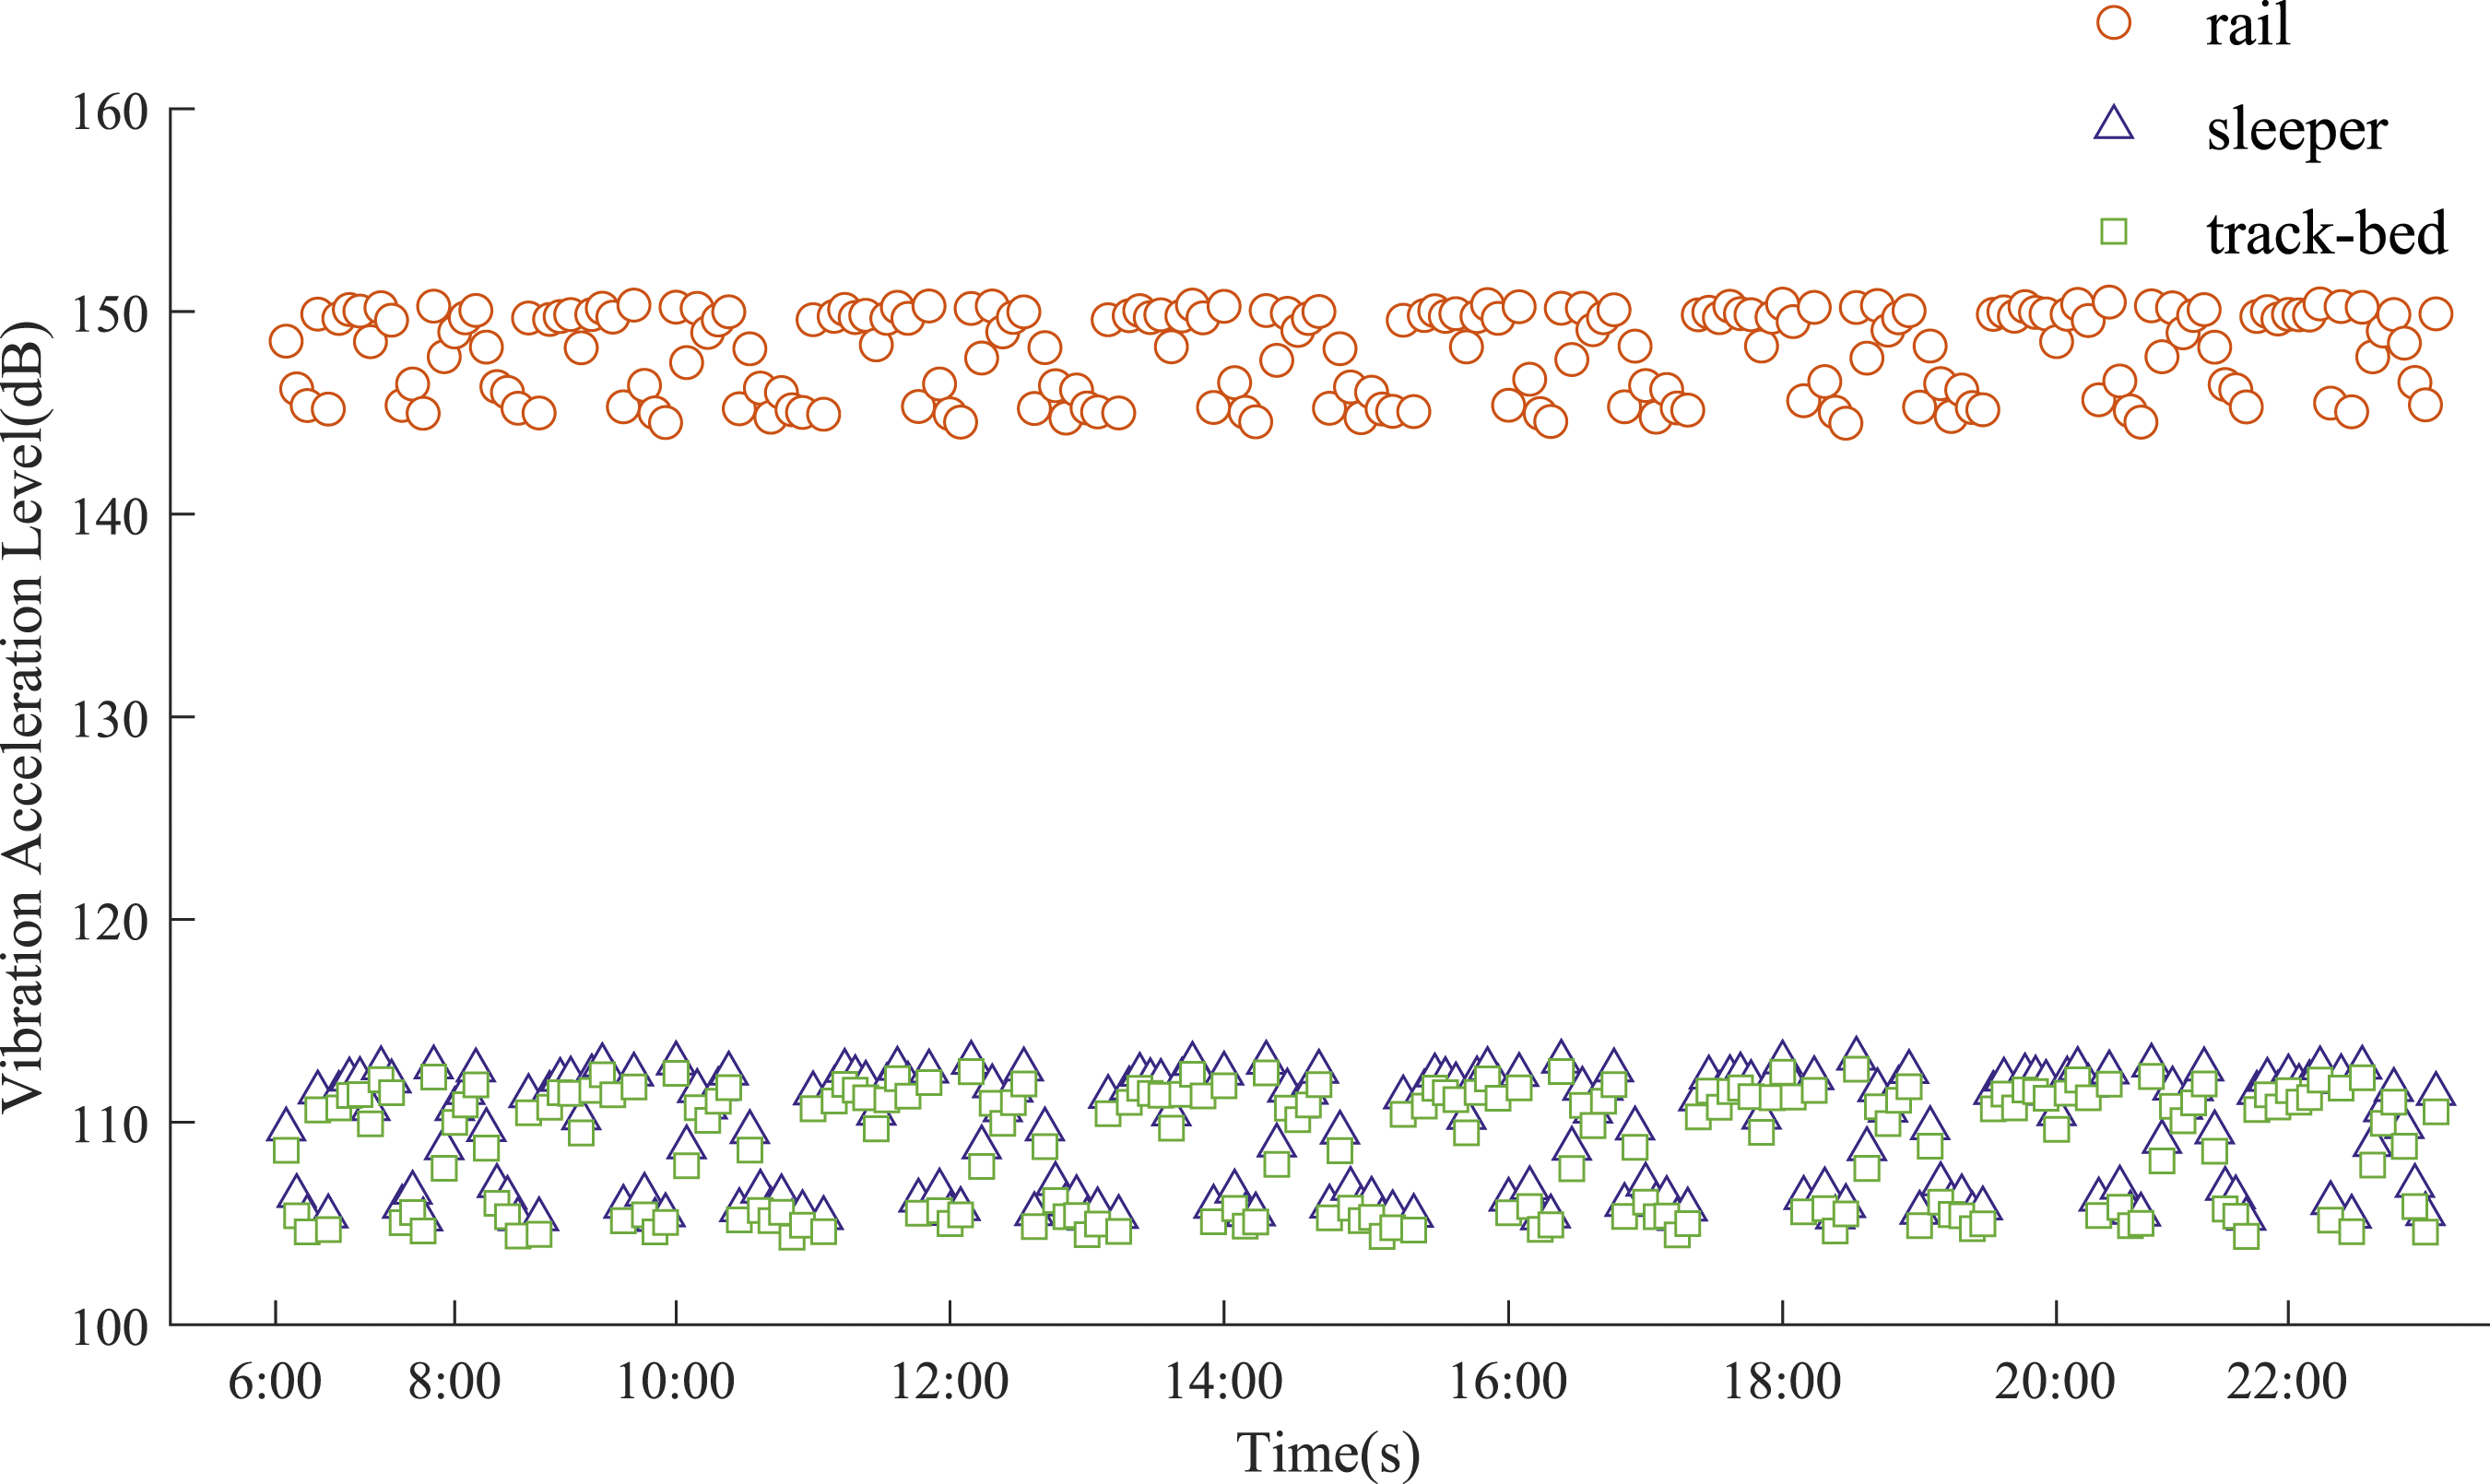
Conclusion
A dedicated experimental train was employed to conduct vibration tests on the rail, sleeper, and track-bed within the metro tunnel. This study analyzes the vibration characteristics of these three track structures, investigates changes in vibration after wheel reprofiling, and compares the differences between empty and full-load conditions. The key conclusions are summarized as follows: (1) In the time domain, the RMS of vibration acceleration after wheel reprofiling is notably lower compared to before. In the frequency domain, within the 31.5–1250 frequency range, the vibration acceleration levels for all three track structures are considerably lower after wheel reprofiling. (2) Wheel reprofiling is effective in reducing the vibration levels of the track structures. The vibration levels of the rail, sleeper, and track-bed decreases by 4.7& dB, 6.6 dB, and 6.7 dB, respectively. Wheel reprofiling leads to an increase in transmission loss from the rail to the sleeper, while transmission loss from the sleeper to the track-bed remained nearly unchanged. (3) The RMS of vibration acceleration of the rail, sleeper, and track-bed under full-load conditions are within 1% of those under empty-load conditions. Peaks are observed in the frequency domain at 70 Hz and 350 Hz for both full load and empty load. These peak frequencies align with the resonance frequencies of the track irregularities. (4) Full-load condition primarily impacted the vibration acceleration levels within the low-frequency range of 1–40 Hz, attributed to the significant influence of axle load at lower frequencies. The vibration acceleration levels under full-load and empty-load conditions exhibit minimal differences at higher frequencies, while the vibration acceleration levels of all track structures are higher under full load than under empty load. Transmission loss from the rail to the sleeper increases under full load, while transmission loss from the sleeper to the track-bed remains relatively unchanged. Comparing the vibration acceleration levels from regular operational conditions suggests that the impact of axle load on vibration acceleration levels is limited.
The vibration of different track components is affected by many aspects. In this paper, the main conclusions are based on the test of A-type vehicles with 8 sections, specific speed, specific axle load conditions, and ordinary track bed conditions. Therefore, for other vehicles and other track structures, etc., further research is needed.
Footnotes
Declaration of conflicting interests
The author(s) declared no potential conflicts of interest with respect to the research, authorship, and/or publication of this article.
Funding
The author(s) disclosed receipt of the following financial support for the research, authorship, and/or publication of this article: This research was supported by Chinese National Natural Science Foundation “Identification and Assessment Method of High Speed Train Out-of-round Wheel Based on Wayside Monitoring” (51868024).