
Abstract
The vibration tests were carried out using a 162kW wheeled tractor to evaluate the Whole-body vibration while the tractor working in the field, driving on concrete road and in-parking state. The tractor ride comfort was analyzed using the joint weighted acceleration of seat surface vibration from 1 to 80 Hz as the evaluation indicator, according to ISO2631 standard suggestions. During field work, the combined acceleration of the driver’s whole body vibration is 1.39, and the subjective feeling is extremely uncomfortable. Based on the multi-body dynamics analysis software, a tractor dynamics simulation model including the seat, cab mounts, chassis, tyre and road coupling system was established. By changing the model parameters, the influence of the tractor driver’s whole body vibration under the condition of the artificial test track was further analyzed. The analysis shows that the factors that have a greater impact on the driver’s whole body vibration when driving on the artificial runway are the vertical stiffness of the tyre, the vertical stiffness of the seat suspension, and the damping coefficient of the tyre.
Introduction
Tractors are widely used in agricultural production activities, its working environment is very harsh. The severe vibration generated by the tractor during operation affects the physical and mental health of the driver and the efficiency of operation. Therefore, reducing tractor vibration has always been the focus of research by designers. 1 During the actual operation of the tractor, its vibration performance depends on many variables, including soil type, type of operation, tyre pressure, tractor mass distribution, forward speed, etc.2–7 The vibration generated by road excitation needs to be transmitted to the human body through three vibration isolation elements, namely tires, cab suspension, and seats, and relevant vibration research has focused on these three areas. Gomez-Gil et al. 8 studied the effect of seat-mounted ground clearance on the driver’s lateral vibration characteristics. Roberto studied the vibration transmission characteristics of the tractor seat in three directions on different road surfaces. The test results showed that the seat has good isolation against vertical vibration and poor vibration isolation in the horizontal direction, suggesting that the influence of transverse and longitudinal rocking motion should be minimized when the tractor is manufactured. 3 Maciejewski 9 developed a model of the horizontal seat suspension and human coupling system, optimizing the vibration isolation performance of the seat suspension. Zhu designed a six-legged parallel suspension for tractor cab damping and used the sensitivity method to optimize the design of the system. 10 Tong studied the vibration characteristics of tractor cabs and suspension isolation. The root-mean-square (RMS) values of acceleration in all directions of the cab center of mass were reduced by rubber suspension isolation, with the greatest reduction in the RMS value in the lateral tilt direction. 11 Mehdizadeh et al. 12 matched the stiffness and damping of the cab suspension system using the seat surface vibration weighted acceleration as the optimization objective. Xue investigated the effect of tyre pressure on the driver’s lateral ride vibration characteristics illustrating that changes in front tyre pressure had little effect on the root mean square value of lateral acceleration at the seat, while increasing rear tyre pressure resulted in a gradual increase in the root mean square value of lateral acceleration. 13
A large number of theoretical and experimental studies have been carried out on the vibration characteristics of tractors, but most of the tests are carried out for specific types of operation and several combinations of tests, and the extensiveness of the test findings is insufficient. The research on vibration damping components is also mostly directed at a certain aspect of the seat, cab mounts and tyres, lacking systematic and comprehensive analysis. During the actual operation of the tractor, the vibration of the seat, cab, chassis and tyre-road system are coupled to each other. In this paper, a variety of tractor use scenarios are tested and driving smoothness analysis is carried out around the test data. A multi-system coupled dynamics model of tractor component interaction is developed to provide a comprehensive analysis of the factors influencing tractor smoothness.
Smoothness evaluation methods
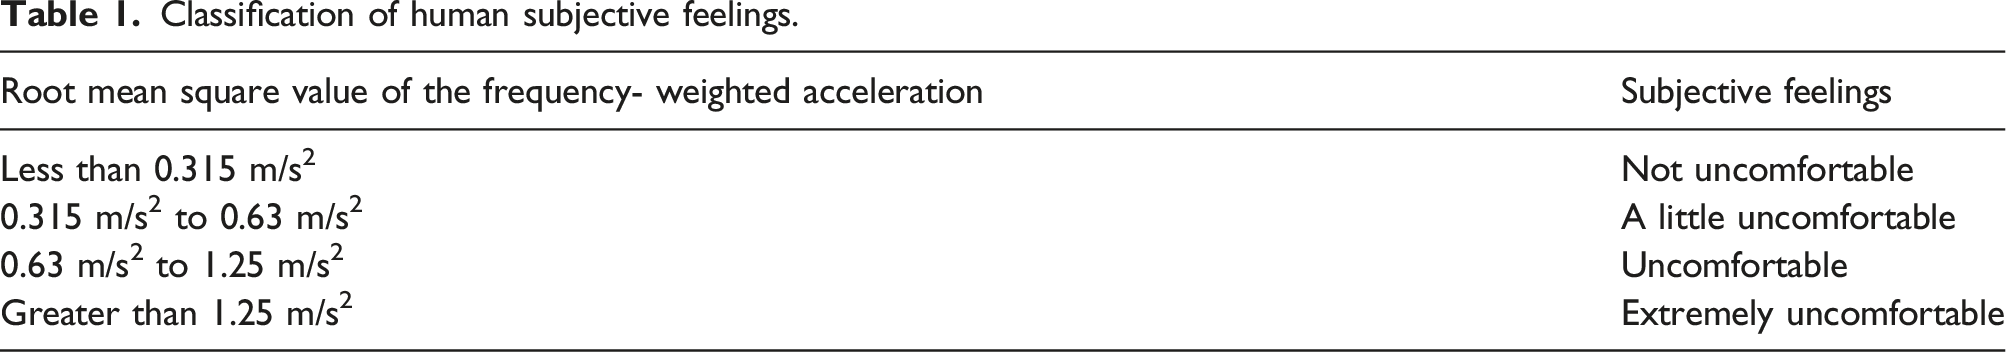
The tractor’s smoothness is mainly evaluated according to the driver’s comfort. As shown in Figure 1, In the analysis of tractor smoothness, the root mean square value of the weighted vibration along the x, y and z directions at the seating surface is used as the evaluation index. According to the international standard ISO 2631-1 “Mechanical vibration and shock- Evaluation of human exposure to whole-body vibration -- Part 1: General requirements,” the relationship between the subjective perception of the human body is shown in Table 1. Vibration model of the human body in the seated position seen Figure 1. x,y,z refer to the direction of translational vibration. For rotational vibration, they refer to the axis of rotation, r. (Rotation about x-,y-,and z-axes is designated roll, pitch and yaw, respectively.)
14
Vibration model of the human body in the seated position. Classification of human subjective feelings.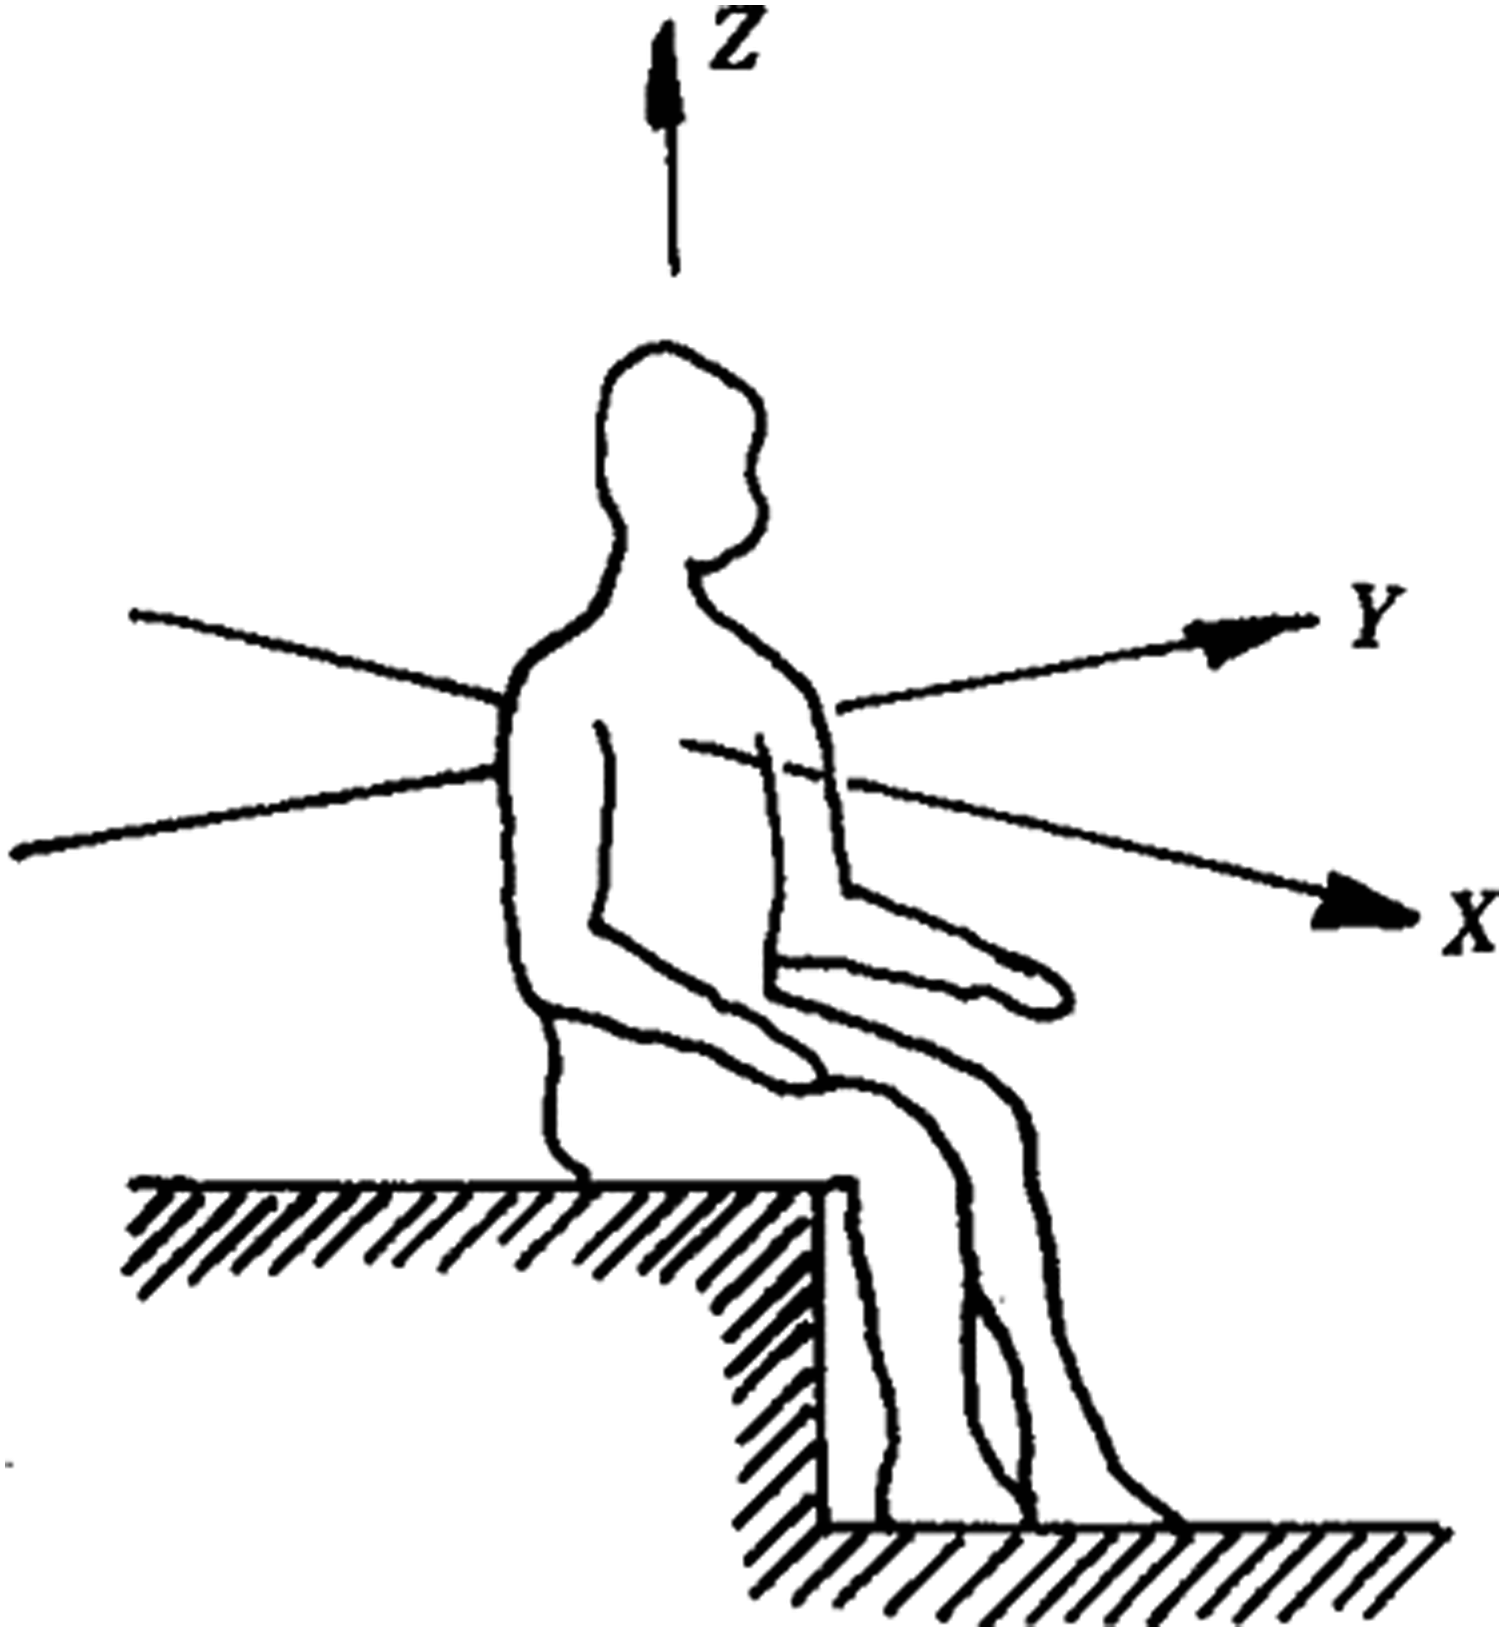

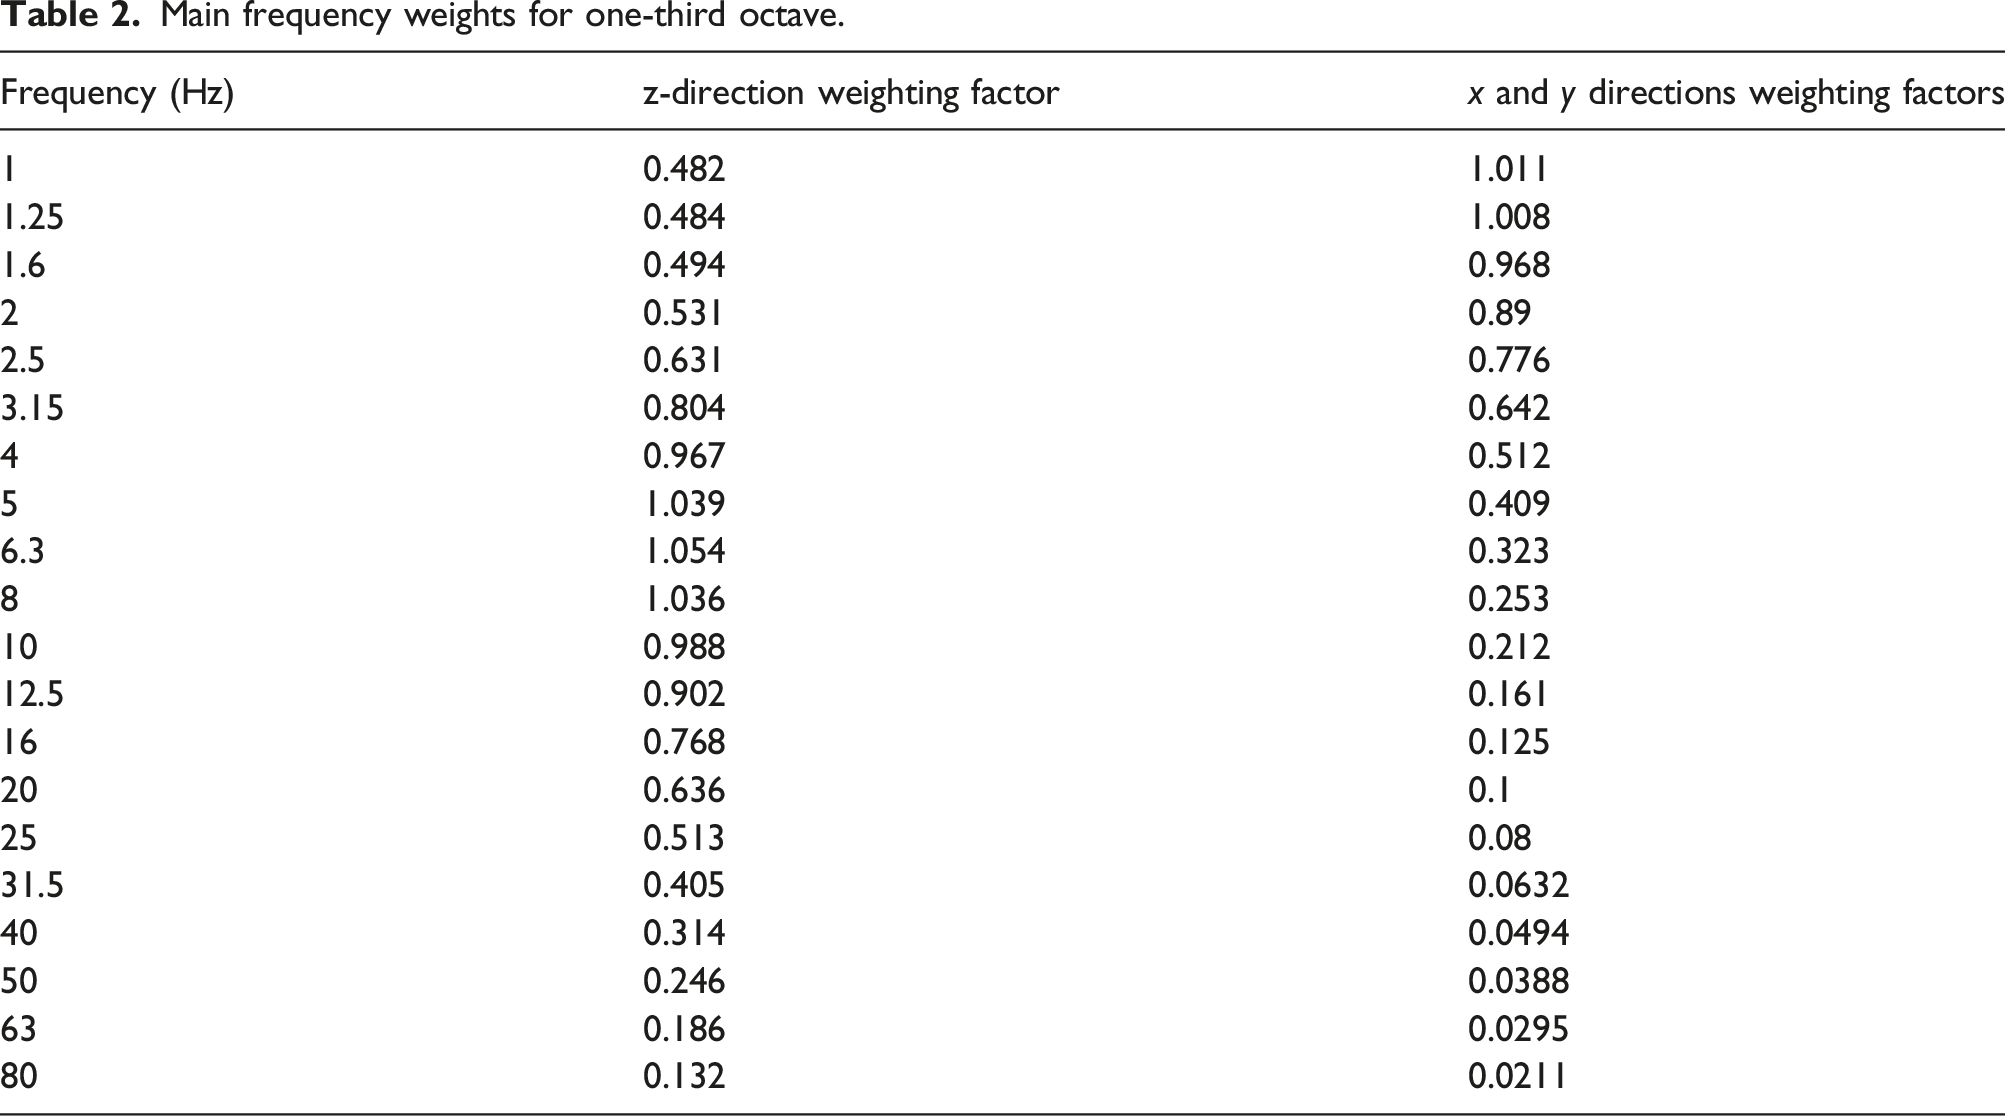
Main frequency weights for one-third octave.
Driver whole-body vibration test analysis
Test subjects and test conditions
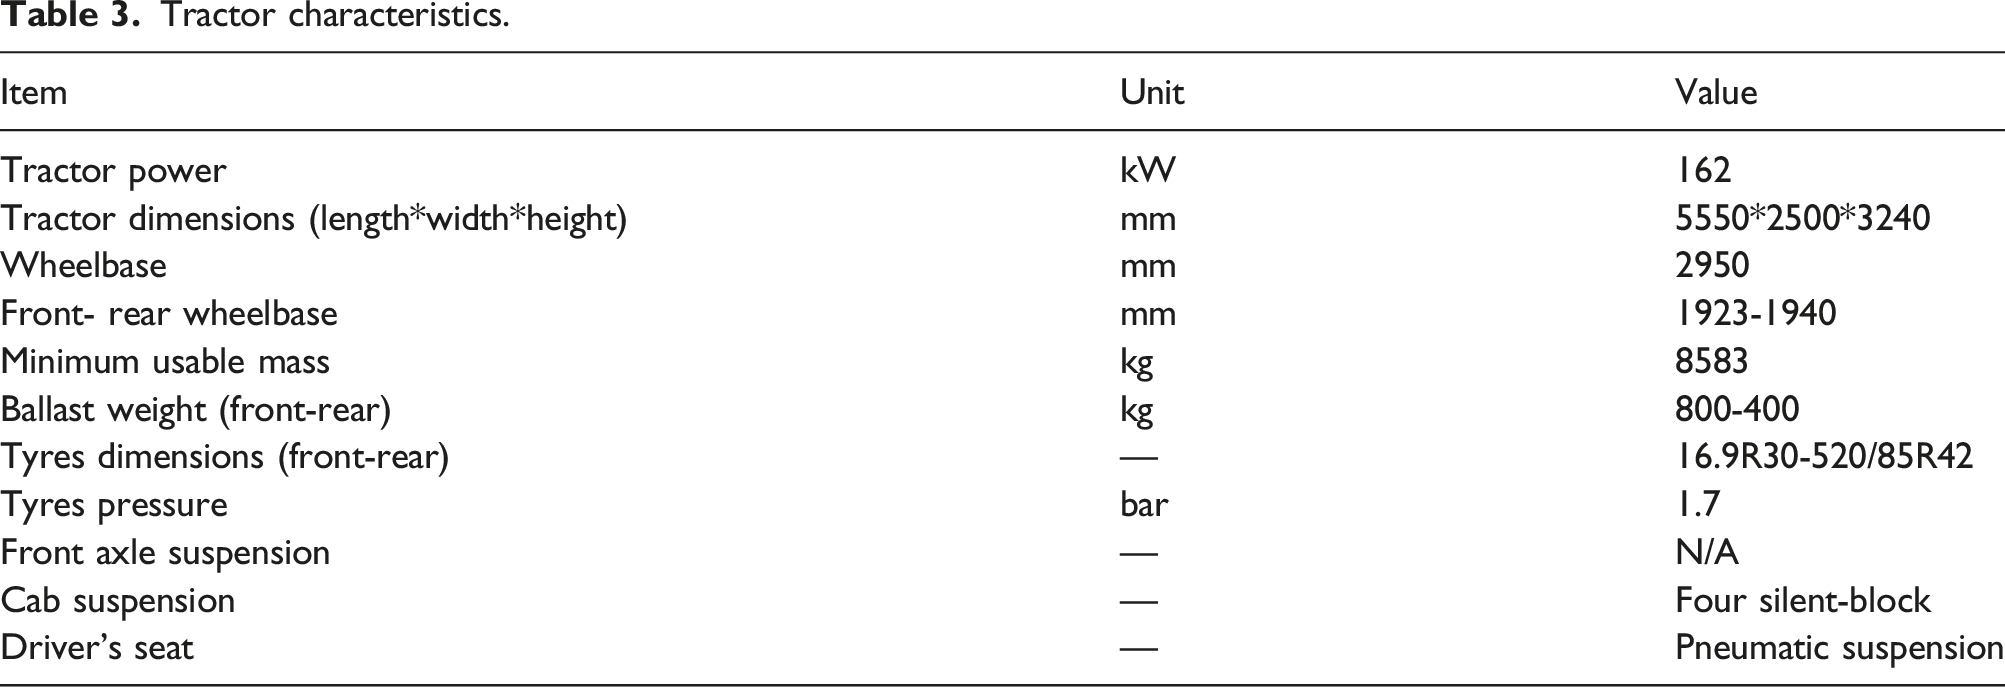
Tractor characteristics.
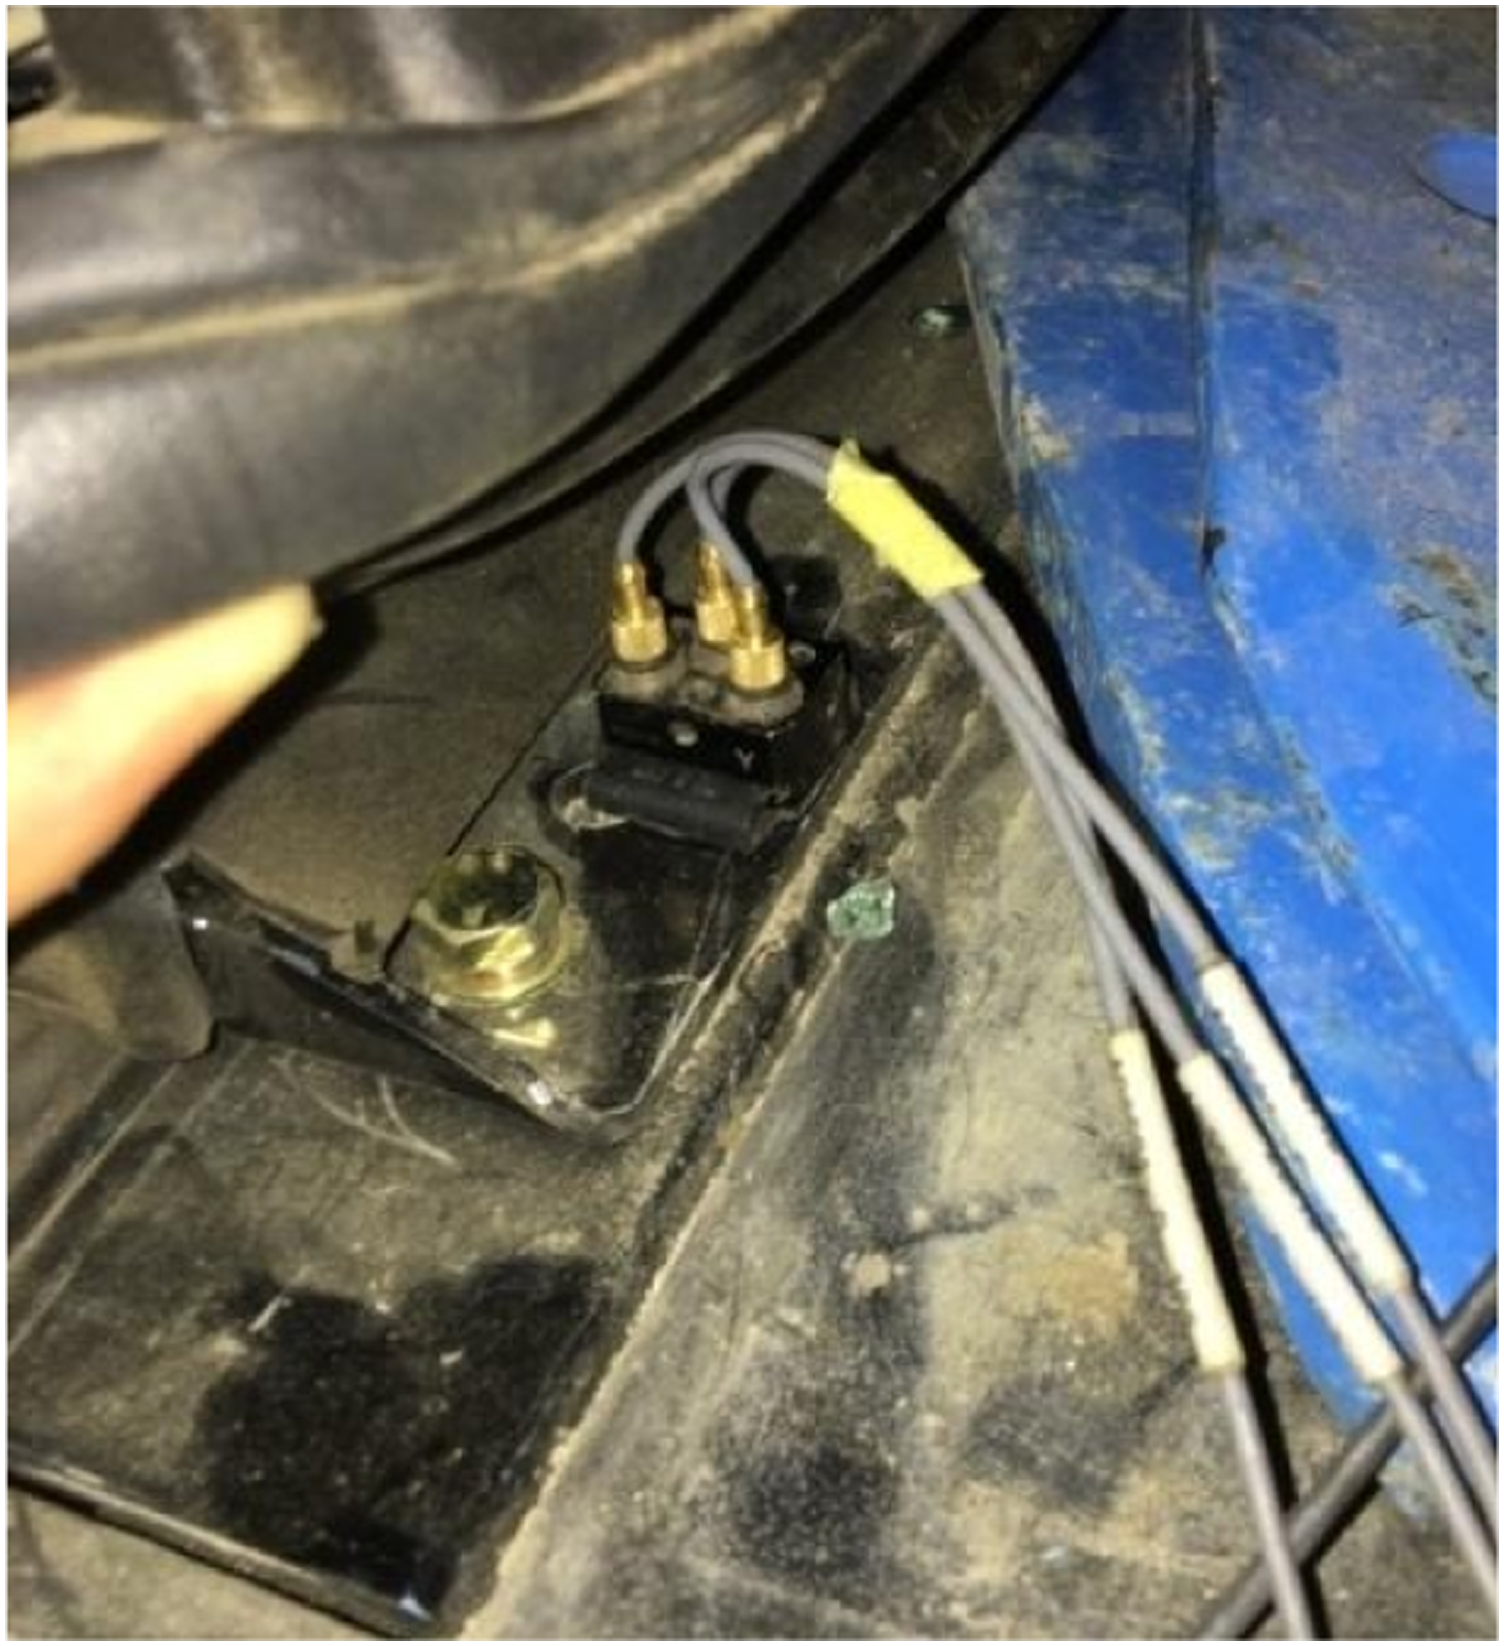
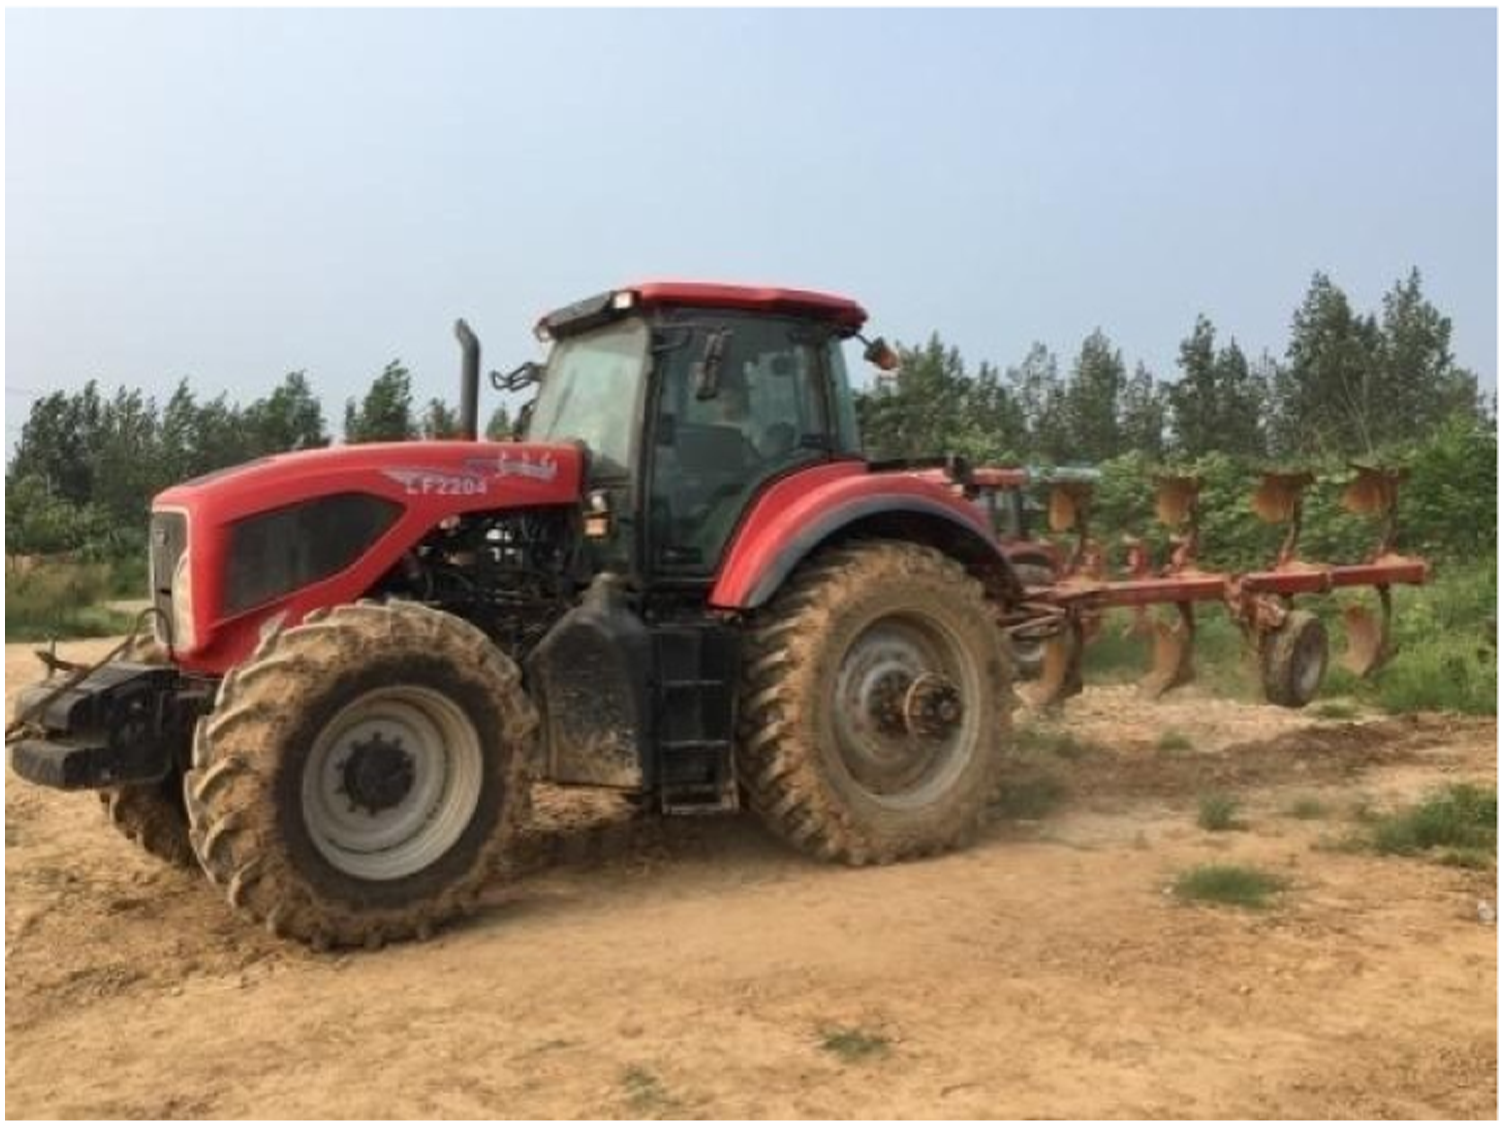
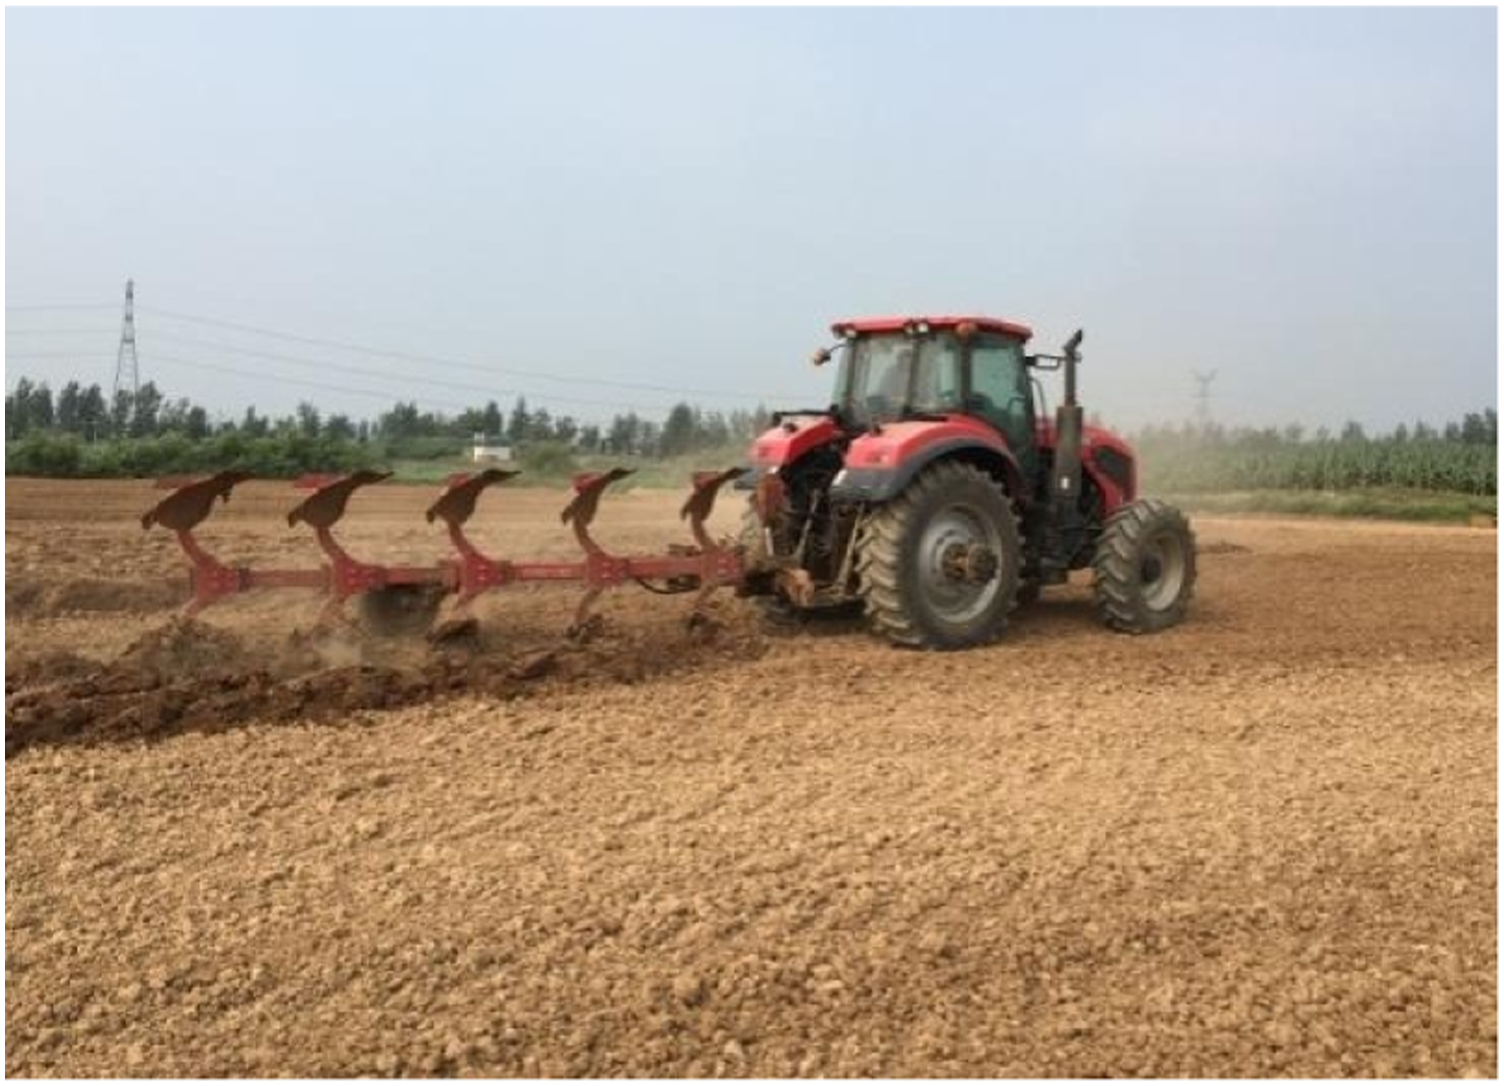
The test conditions include: (1) ploughing operation in the field with a four-share plough at approx. the vehicle speed is about 8 km/h; (2) driving in the field with a four-share plough (lifted state) at approx. 8 km/h; (3) driving with a four-share plough (lifted state) on a concrete road transit at approx. 25 km/h; (4) parking in place with the throttle fully open and the engine at a maximum speed of 2320 r/min. The tractor driver is a male, weighing 72 kg and standing 177 cm tall (Figures 2–5). Seat surface measurement point. Seat rail measurement point. Parking measurement scene. Field operations measurement scene.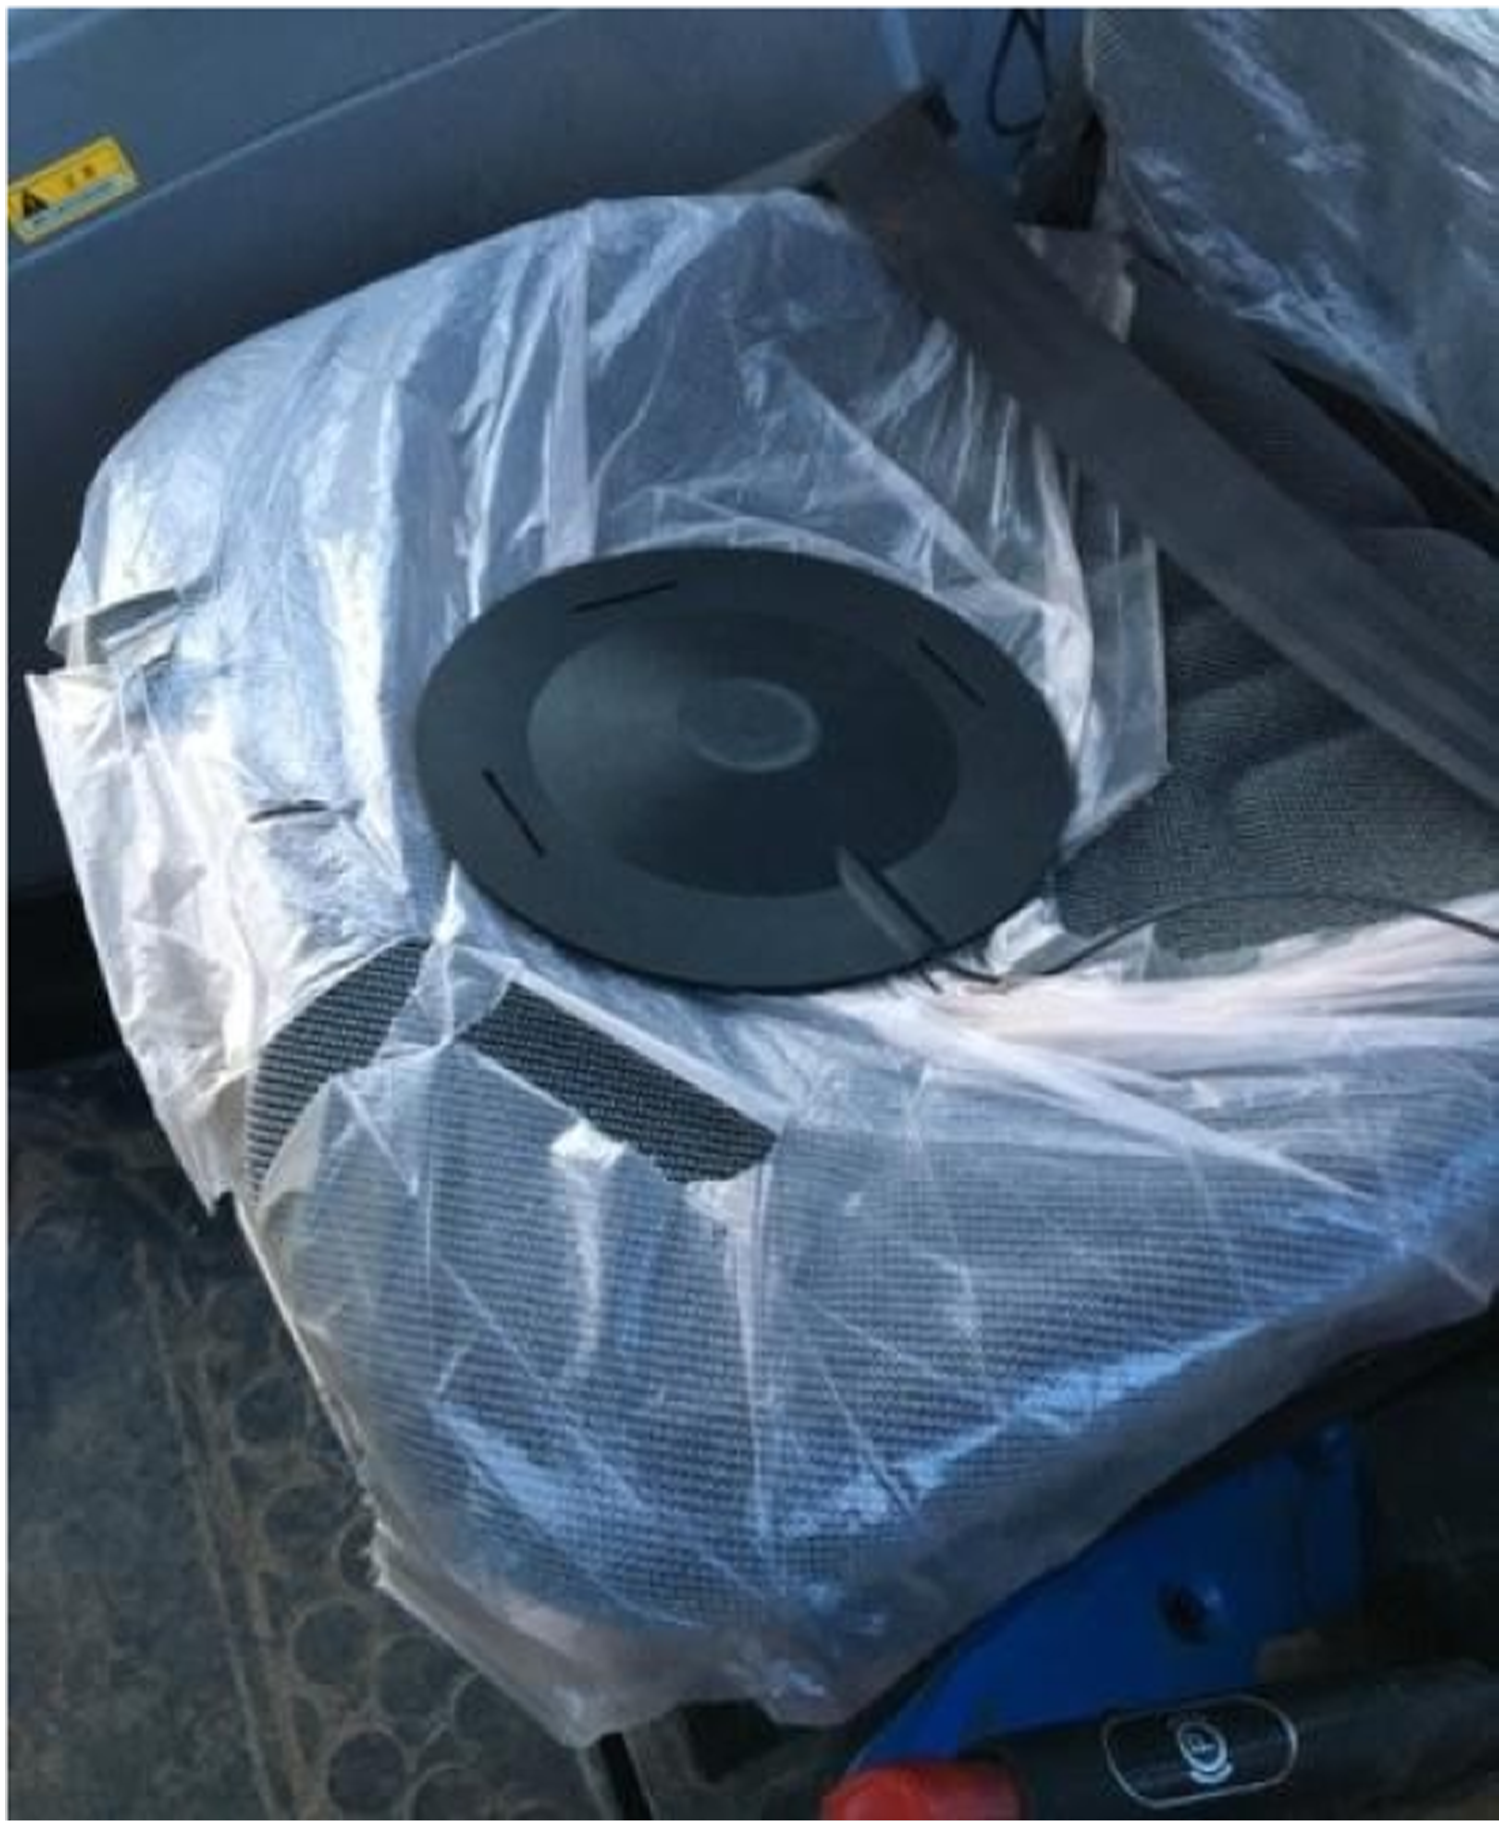
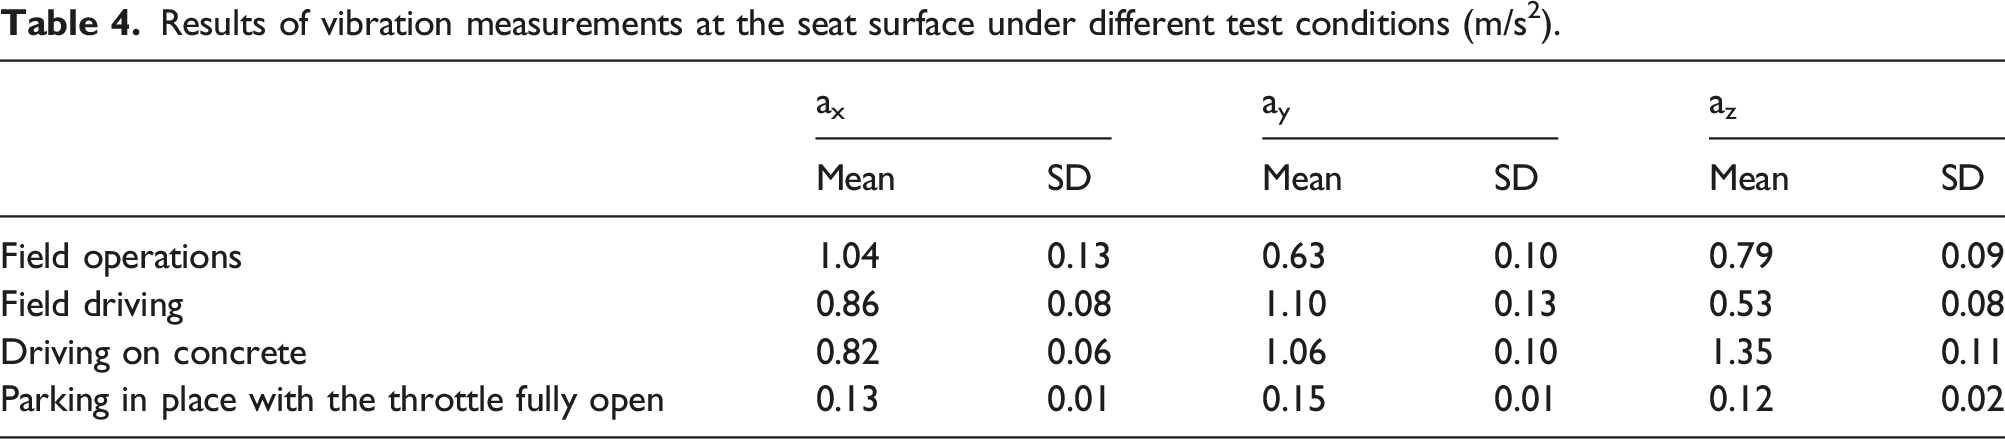
Results of vibration measurements at the seat surface under different test conditions (m/s2).
Time and frequency domain analysis of test data
The time domain curves of the collected vibration signals are band-pass filtered from 1 to 80 Hz. The seat surface measurement point vertical vibration time domain curves for each test condition was shown in Figure 6. Time domain curves of vertical vibration at the seat surface measurement points. (a) Field operations; (b) Field driving; (c) Driving on concrete; (d) Parking in place with the throttle fully open.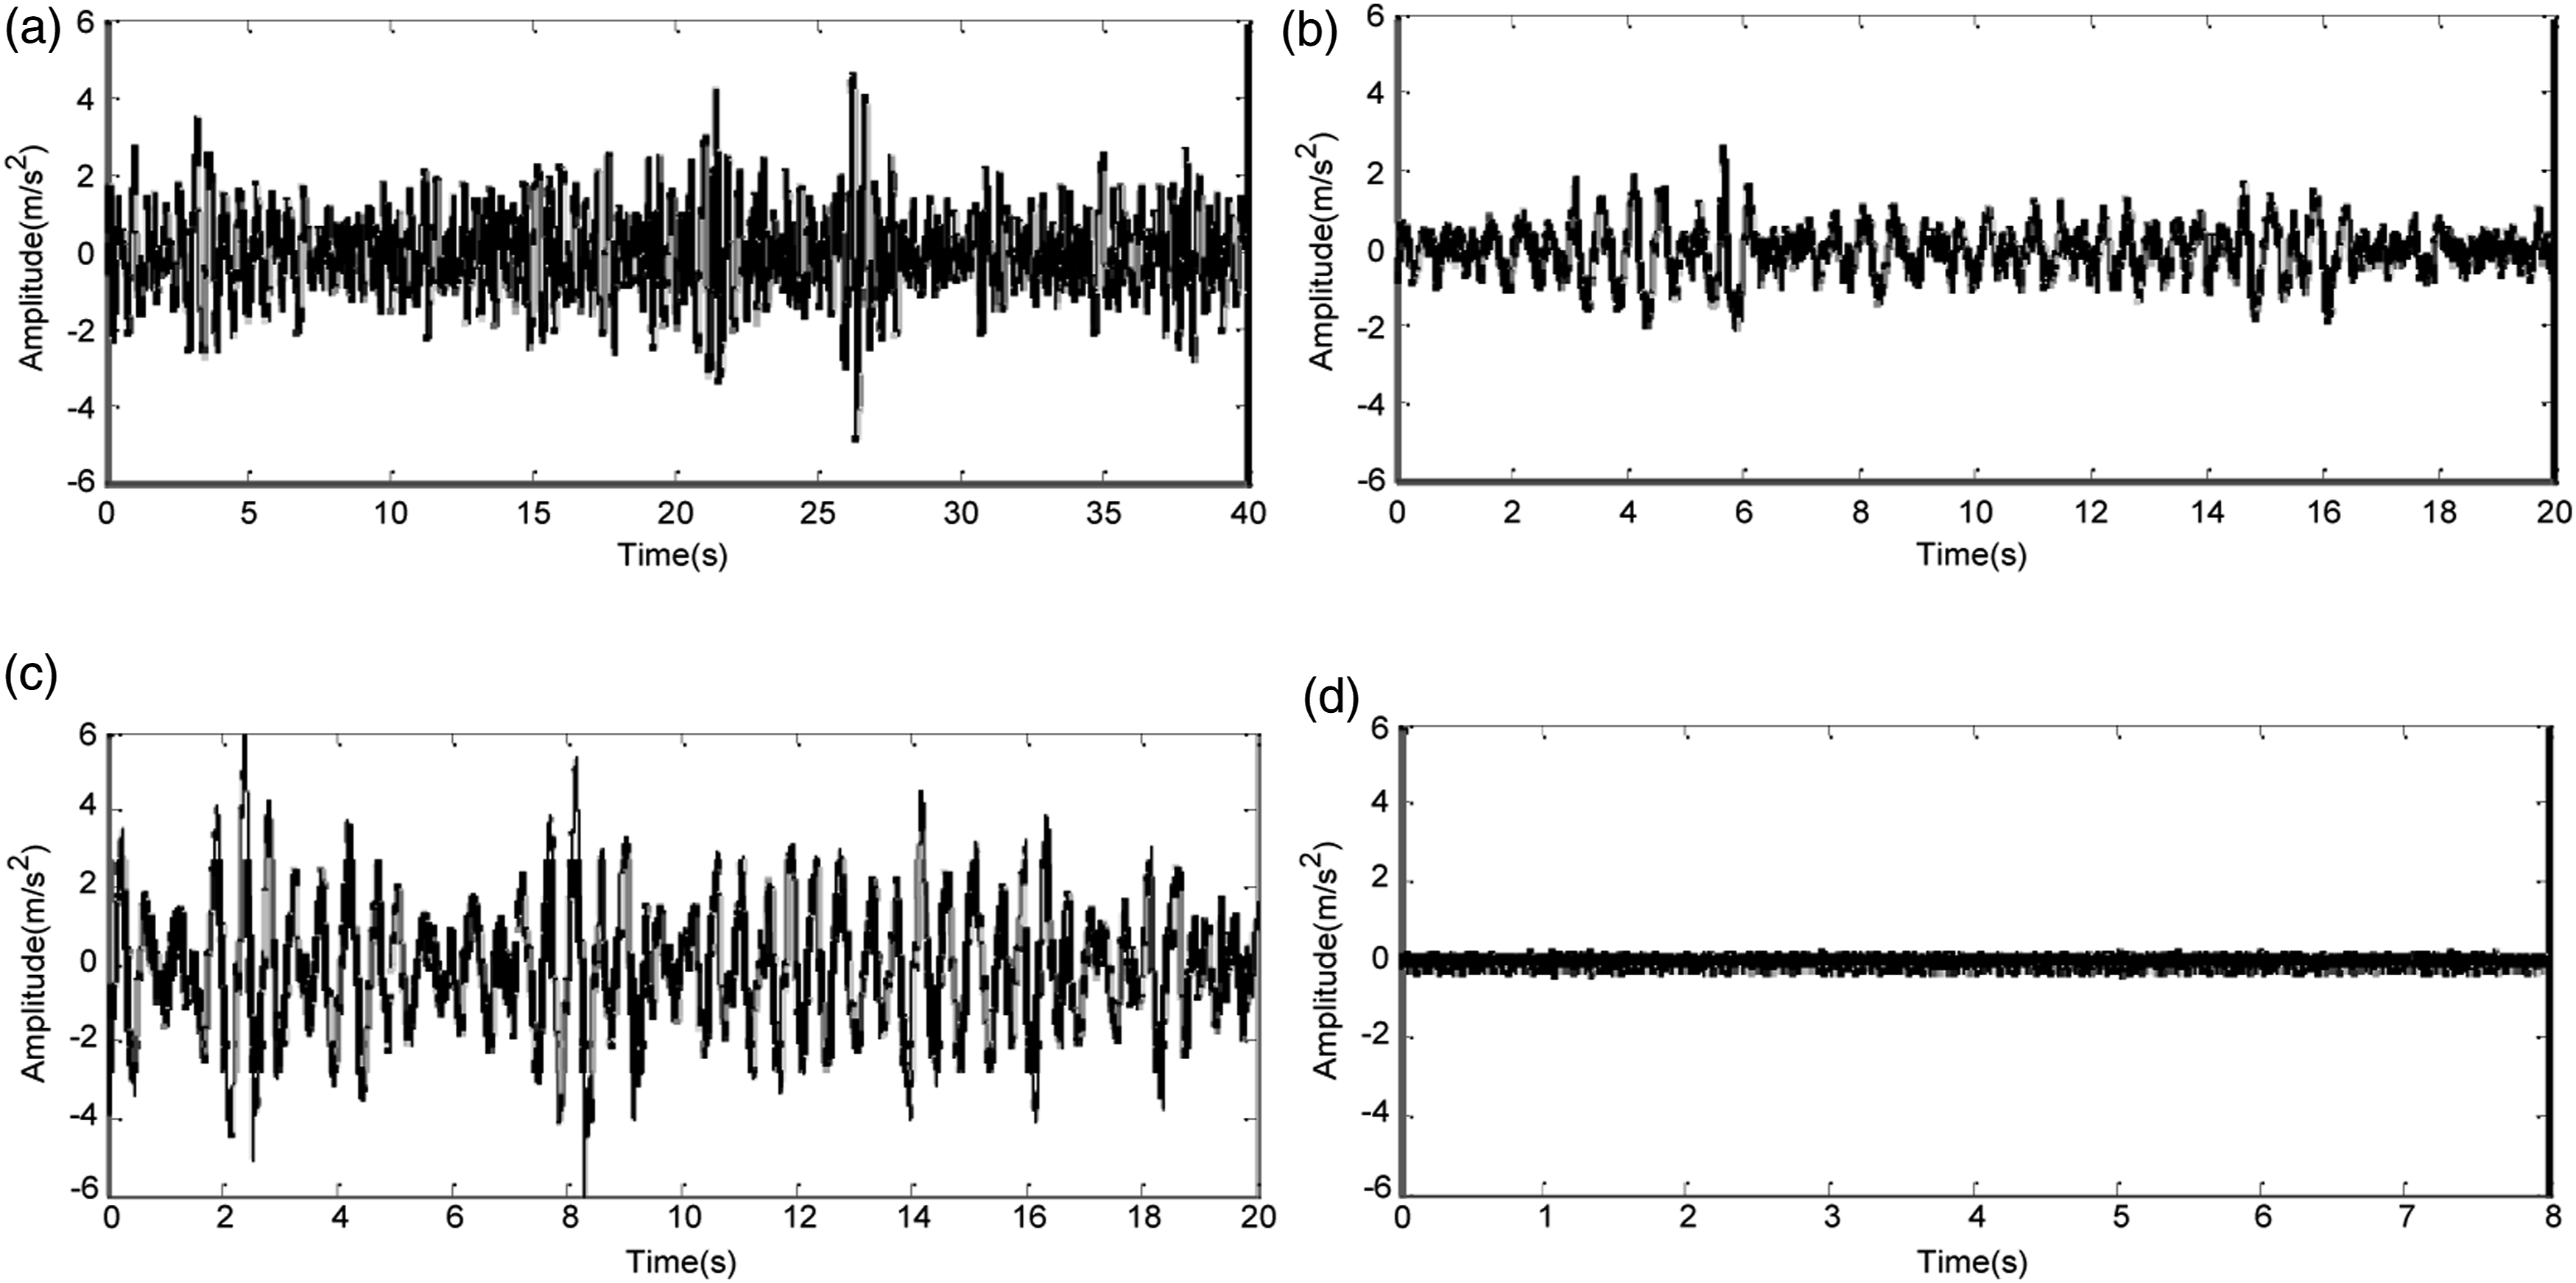
ax, ay and az are the acceleration at the seat surface in the X, Y and Z directions respectively. The units are m/s2.
From the vibration values, the seat surface vibration are the largest with the condition of the driving on concrete, and the Z-directional vibration is larger than that of the other two directions. A larger is generated at higher vehicle speed due to the greater stiffness of the road surface. Comparing the field operation and field driving data, the interaction between the implement and the soil makes a greater impact on vibration. The vibration of the field driving condition is lower than that of the field operation condition. Engine excitation made little effect on seat surface vibration (Figure 7). 1/3 octave curve of seat and seat rail measurement points for vertical vibration. (a) Field operations; (b) Field driving; (c) Driving on concrete road; (d) Parking in place with the throttle fully open.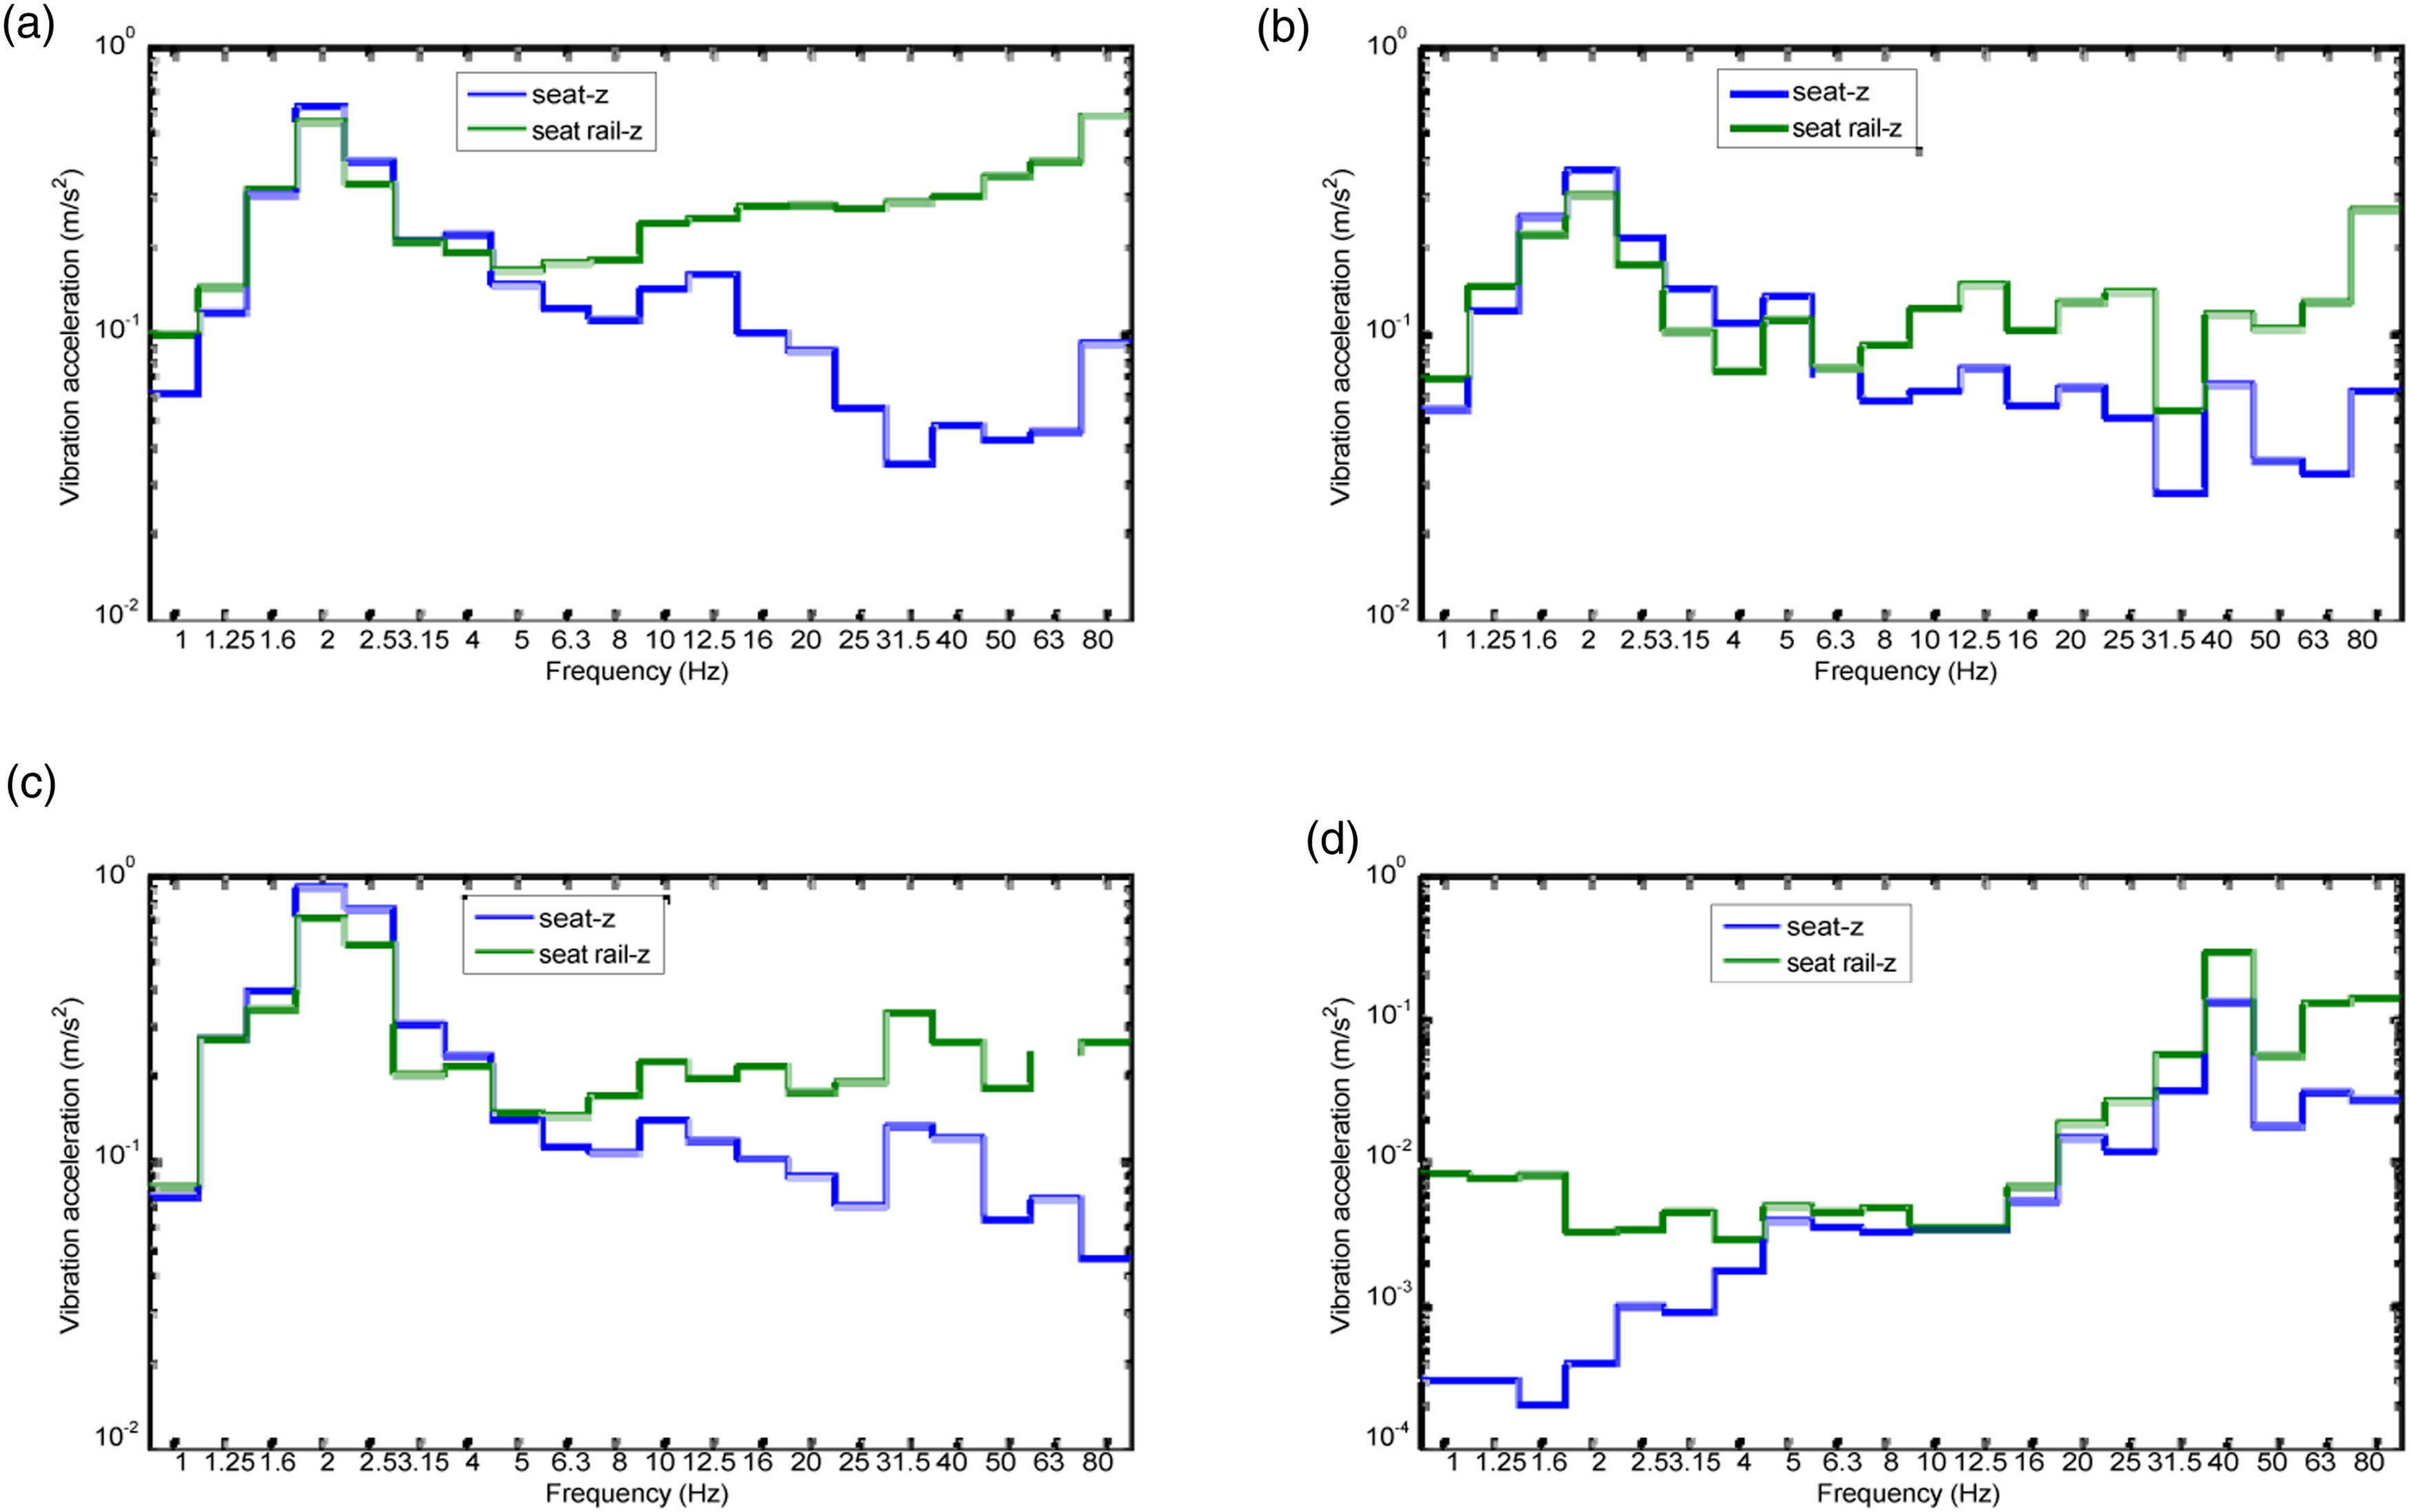
As the one-third octave curves of the seat and seat rail pendulum from 1 to 80 Hz were analyzed, the vibration isolation of the seat from the seat rail position varies in different scenarios and condition. The best isolation was found in field operation conditions. Except for the in-place parking condition, the seat does not provide any vibration isolation in the 2–4 Hz band. This phenomenon should be related to the inherent frequency of the seat-driver system. The source of vibration in the in-place parking condition is mainly from the mid to high frequency excitation such as the engine ignition frequency. The vibration amplitude at the lower frequencies is very small and significantly different from the other conditions.
A similar conclusion exists for the analysis of the vibration data for the cab mounts. The left front suspension was taken as an example for analysis. The vibration isolation effect is best under field operation conditions. The rubber suspension makes essentially no vibration isolation effect at low frequencies within 20 Hz, as shown in Figure 8. According to the stiffness of the rubber mounts and the mass distribution of the cab, the sixth-order inherent frequency of the cab mounts system was between 3.8 and 15.7 Hz, which is precisely the reason for the failure of the vibration isolation of the cab mounts system in the low frequency band within 20 Hz. The 1/3 octave curves of vertical vibration at the left front suspension measurement point of the cab (a) Field operations; (b) Field driving; (c) Driving on concrete road; (d) Parking in place with the throttle fully open.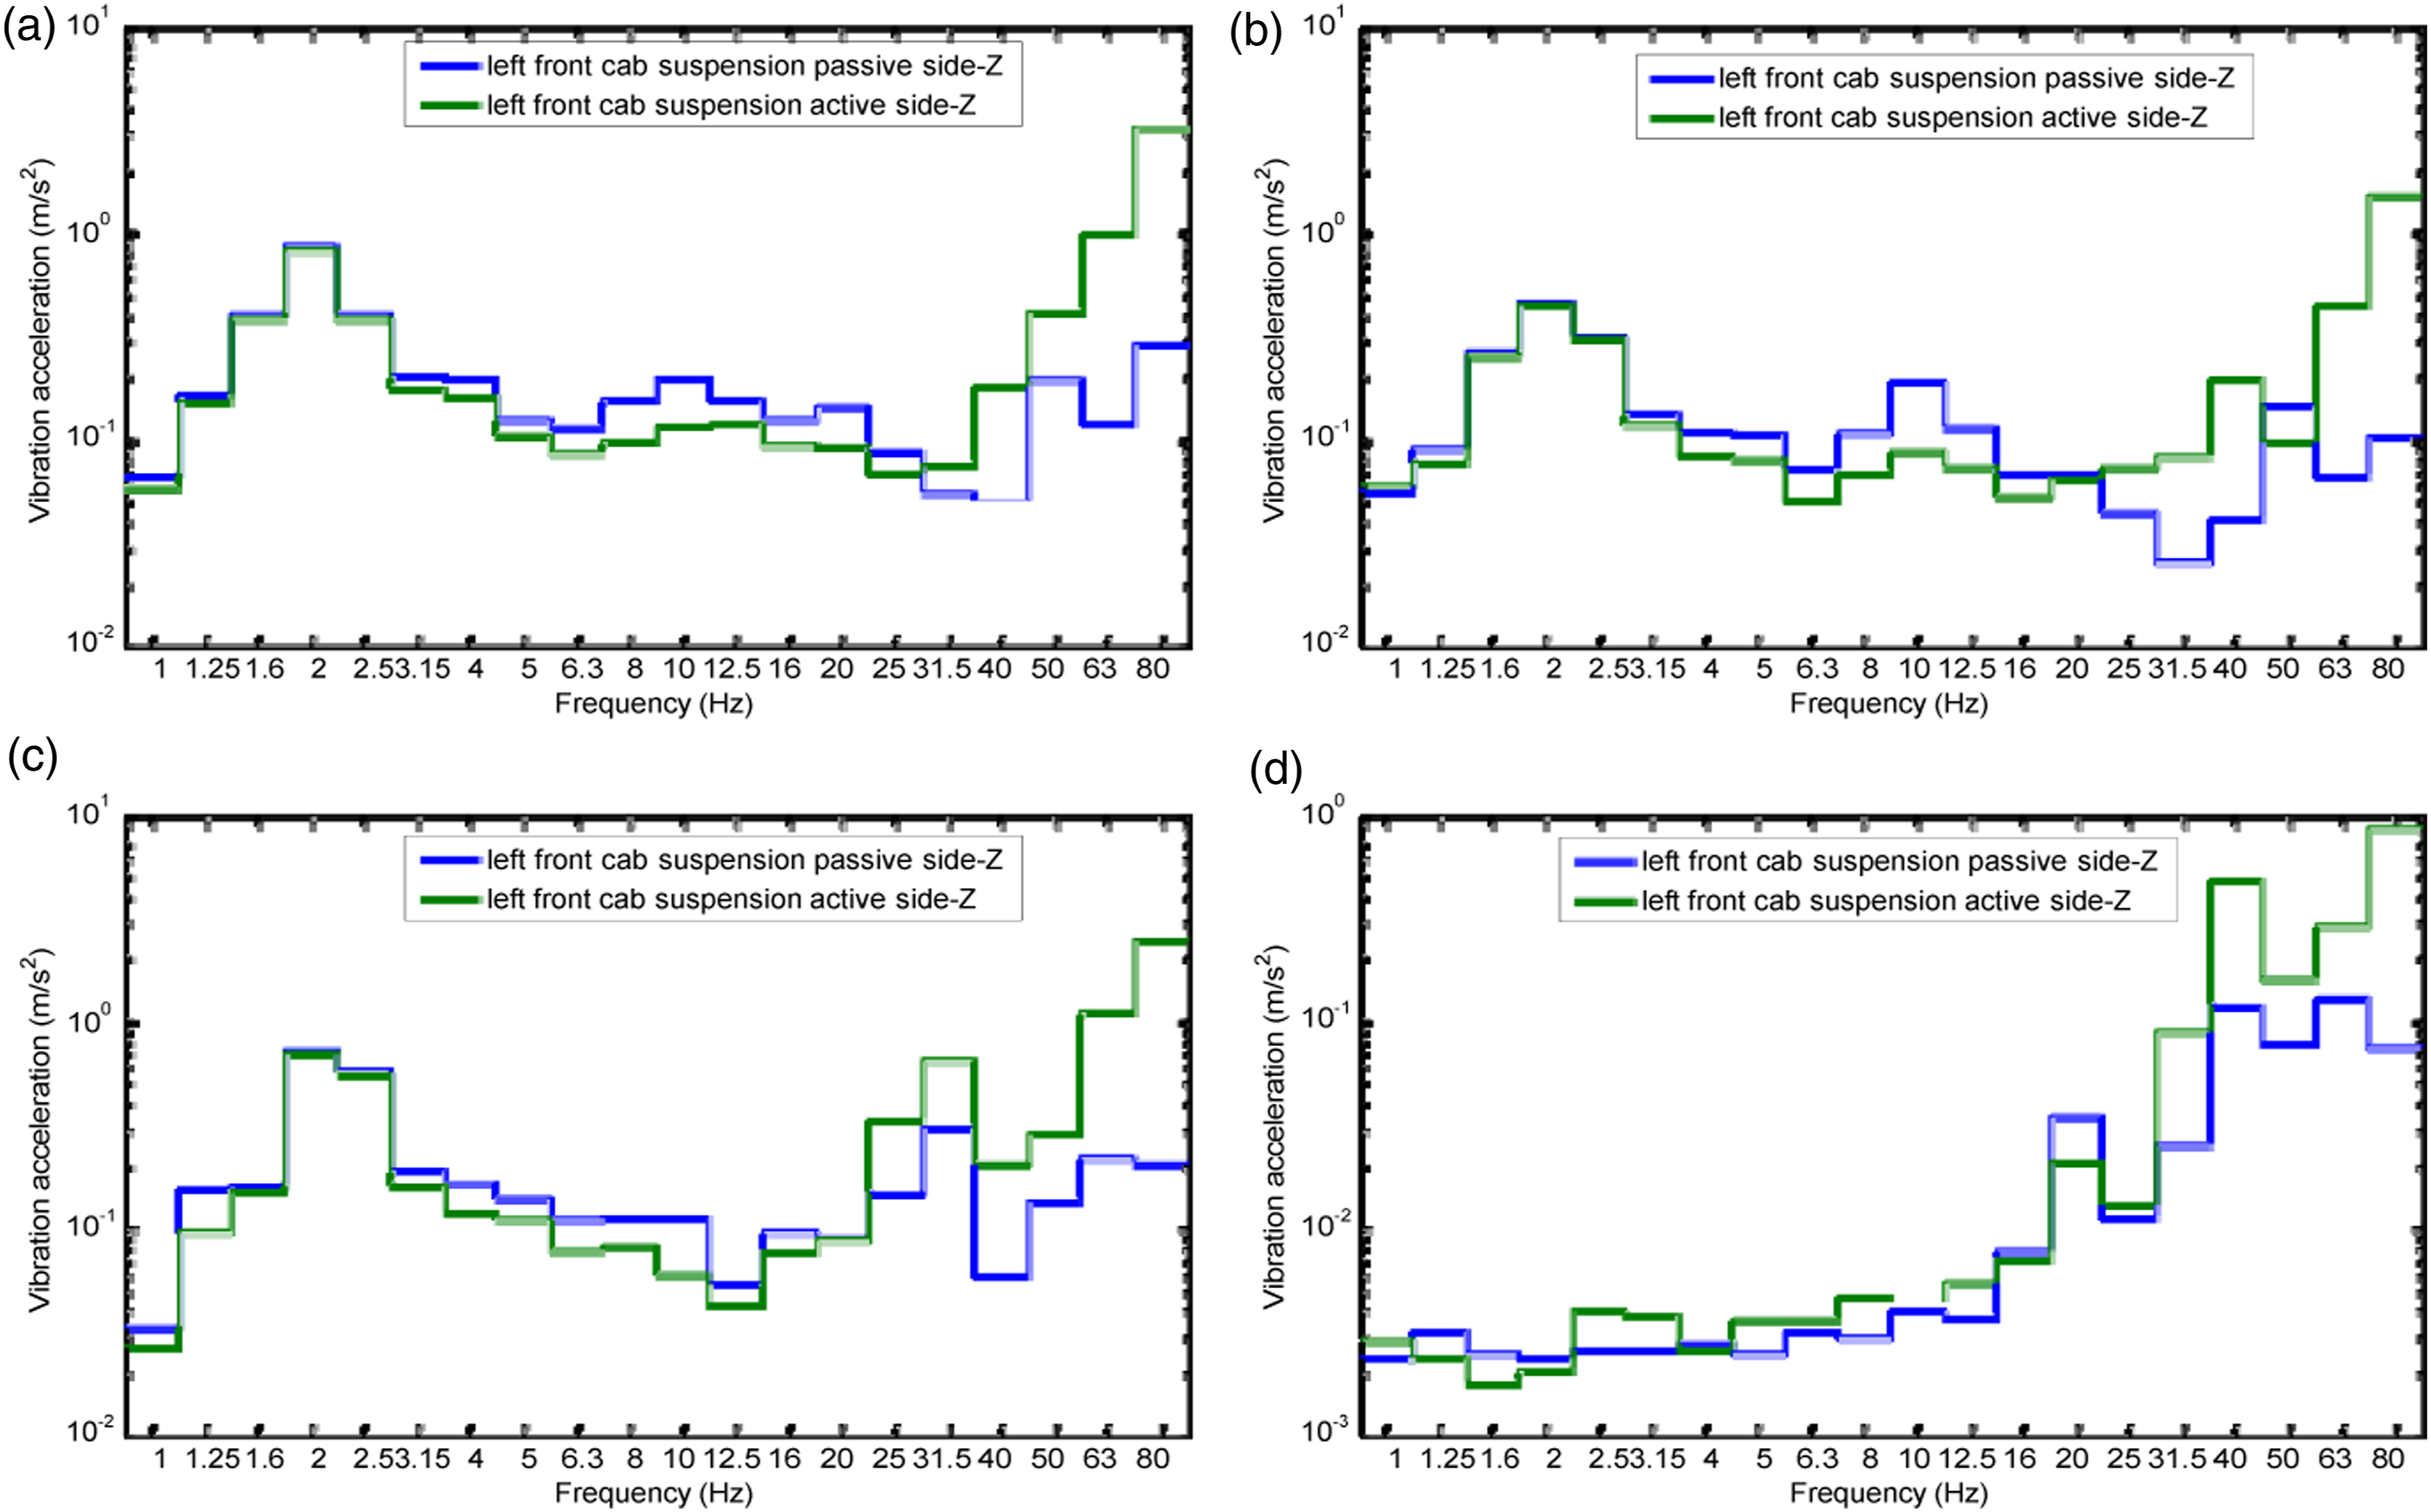
Smoothness analysis under four operating conditions
Driver whole body vibration results under different test conditions (m/s2).
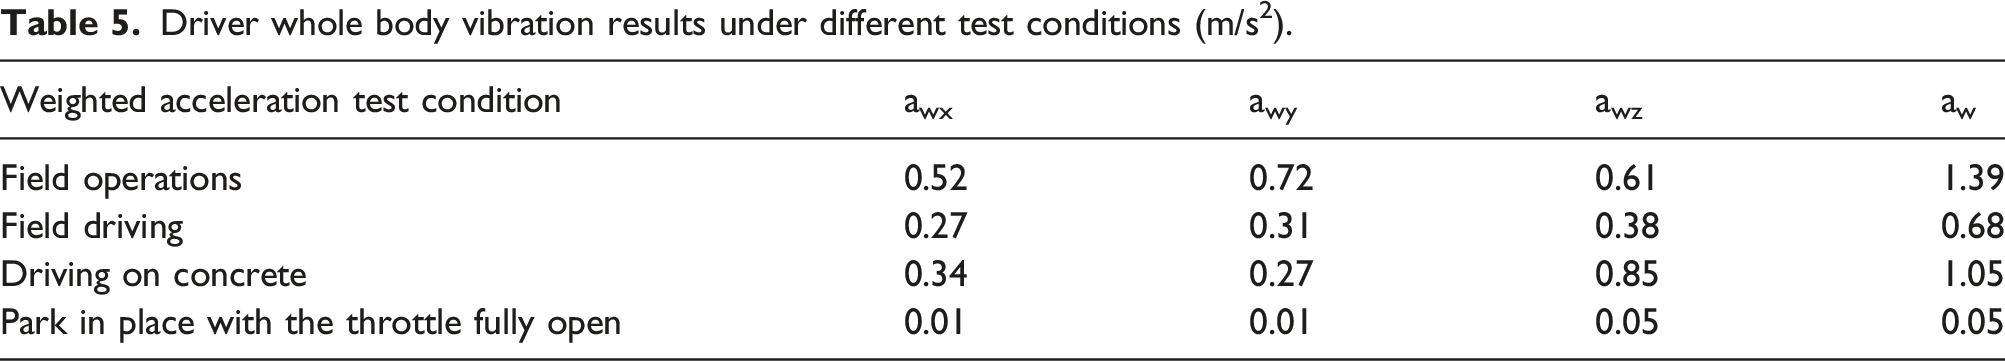
The maximum value is 1.39 for field operation in terms of the smoothness evaluation index, leading to a subjective feeling of extreme discomfort. In terms of the different directions of vibration, the X and Y directions of vibration are significantly greater in field operations than in other test conditions. The X and Y components were multiplied by a factor of 1.4, as specified in ISO 2631-1. According to the European Directive 2002/44/EC, The typical whole-body vibration exposure on agricultural tractor operators is less than 1.15 m/s2 for an 8-hour working day.
15
According to this assessment, driving this tractor for long periods of time in the field can be detrimental to the physical and mental health of the operator (Figure 9). Manual test track measurements.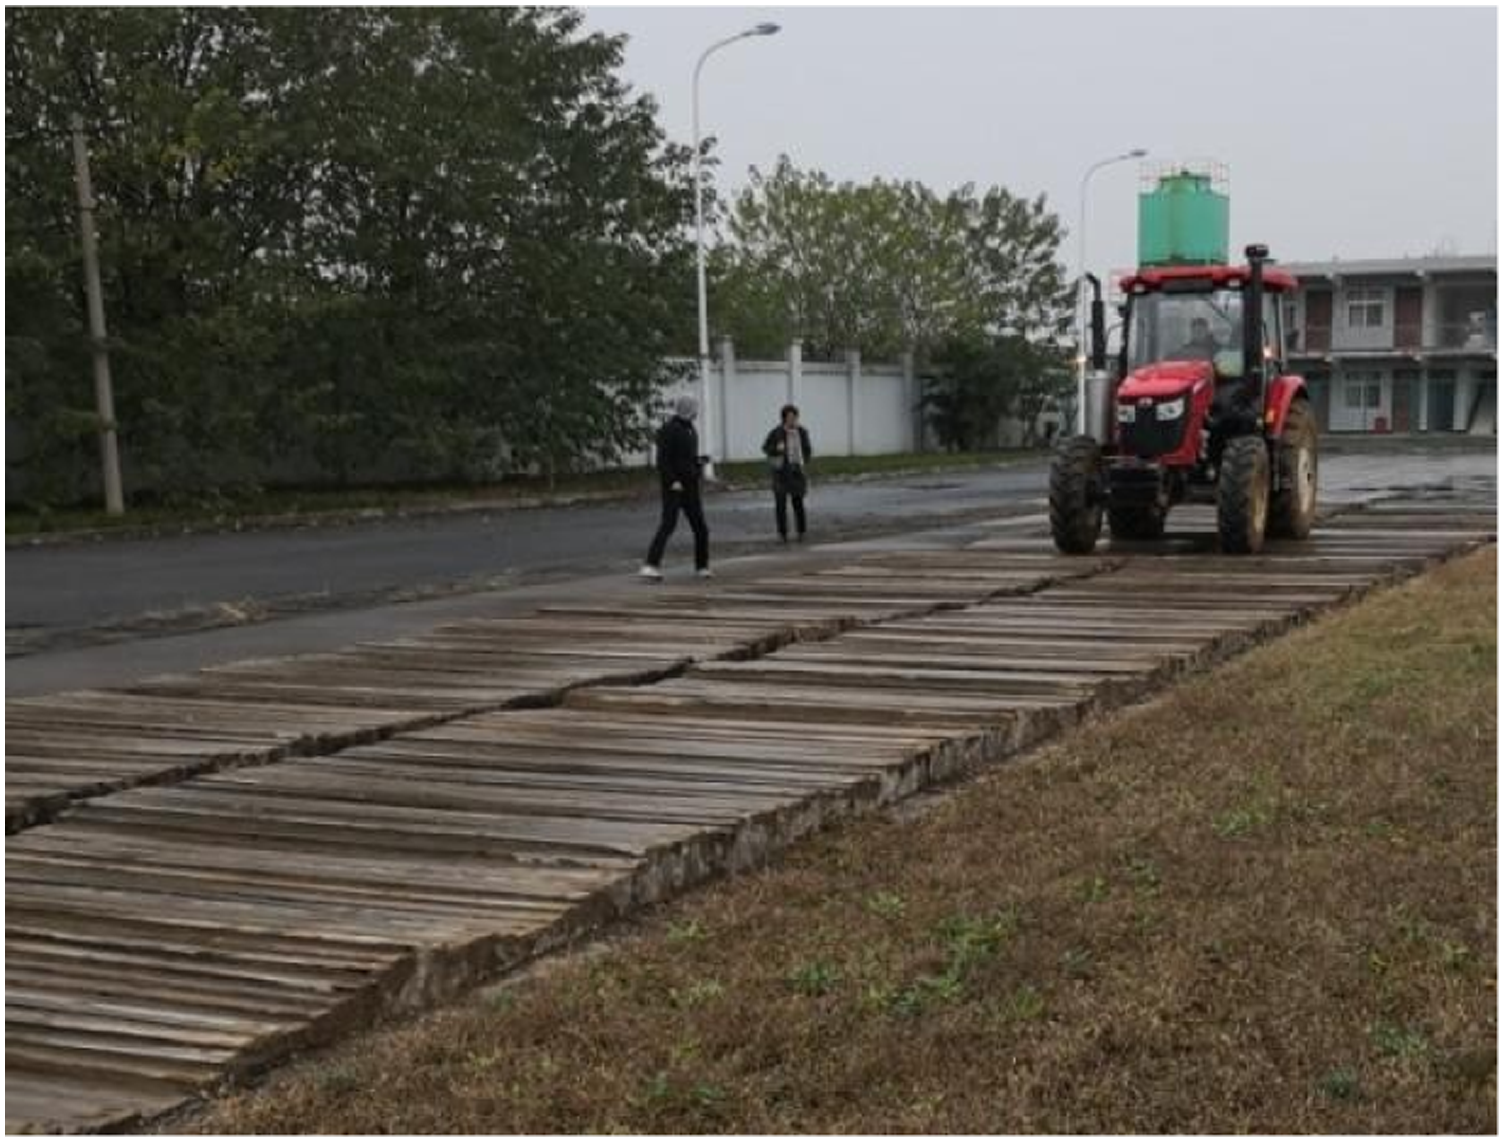
Test on artificial track
Driver whole body vibration results measured on artificial track (m/s2).
The artificial test track consisted of 626 rigid concrete strips with undulating height, so the vibration tested on this track was mainly from road excitation. After the analysis of the test data, the whole-body vibration evaluation index aw for the driver was calculated to be 2.73, which is much higher than the field operating conditions. However, it still meets the requirements of aw ≤3.0 as stipulated in China agricultural machinery promotion and appraisal outline DG/T 001-2019 “Agricultural wheeled and crawler tractors.” The test value is more reasonable when compared with other domestic artificial test track test data.
Modeling and simulation
Multi-rigid body dynamics model for tractors
In this paper, the multi-body dynamics software, Adams is used for tractor multi-cylinder dynamics modeling. Adams uses the first class Lagrangian equations with multipliers to establish the dynamical equations of the system, and automatically establishes the Lagrangian equations of motion for the system based on the mechanical system model.
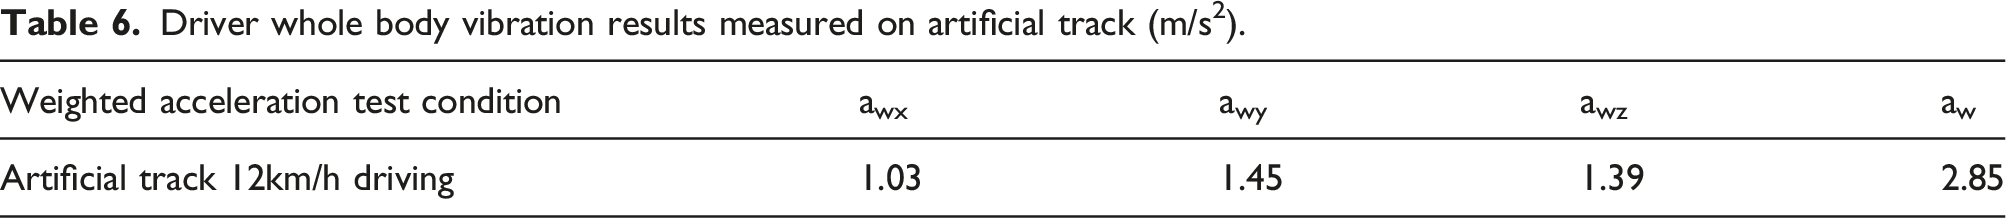
Mass values of tractor parts.
The tractor does not have a frame, so the engine oil pan is strengthened, and the driveline, front and rear axles together constitute the tractor chassis system, which plays a load-bearing role. Rubber suspension is installed between the cab and chassis to form a four-point suspension cab system.
The simplified model of the whole tractor 1/2 is shown in Figure 10. Only the stiffness and damping of the seat mounts, cab mounts and tyre drops are shown in the figure, which are modeled in Adams considering stiffness and damping in all three directions. The engine, driveline, front and rear axles and front and rear mating points are rigidly connected, the cab is simplified to a rigid body without consideration of local vibrations, and the driver and seat suspension are considered as one part.
16
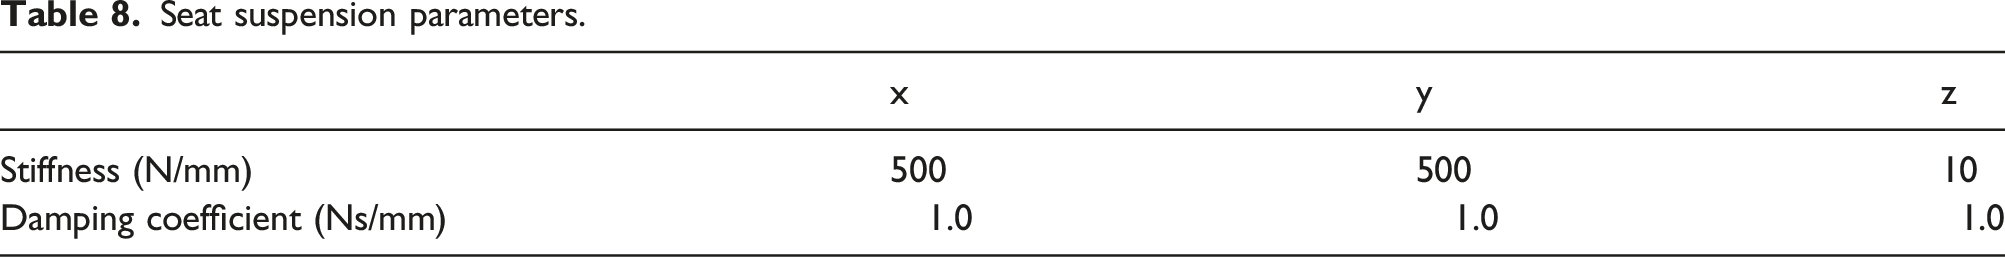
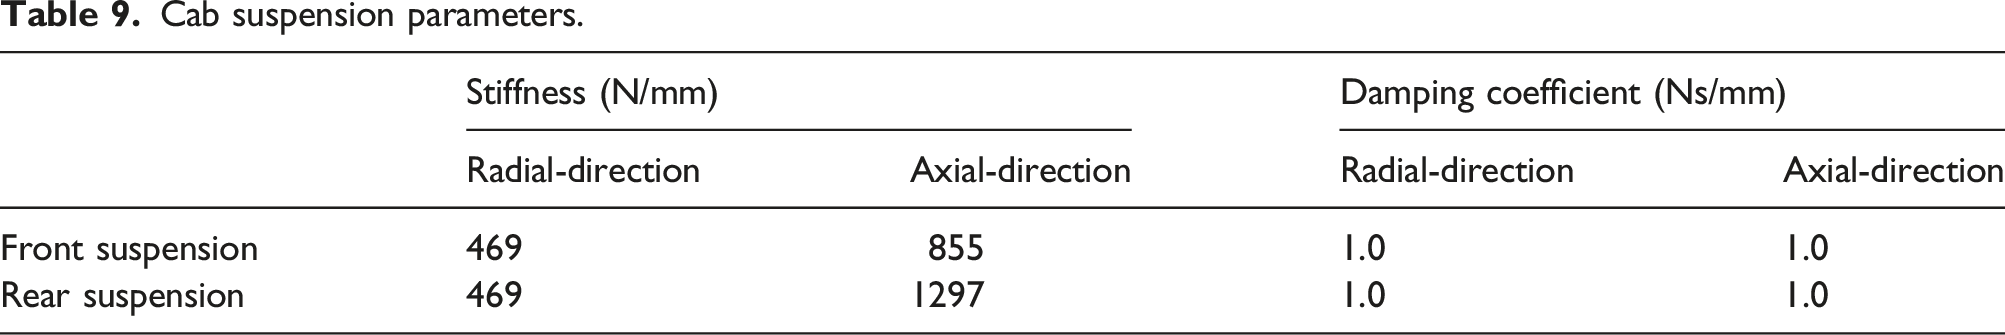
The seat suspension and cab suspension stiffness and damping parameters were measured by the test, and the relevant parameters are shown in Tables 8 and 9. Simplified 1/2 model of the complete tractor. Seat suspension parameters. Cab suspension parameters.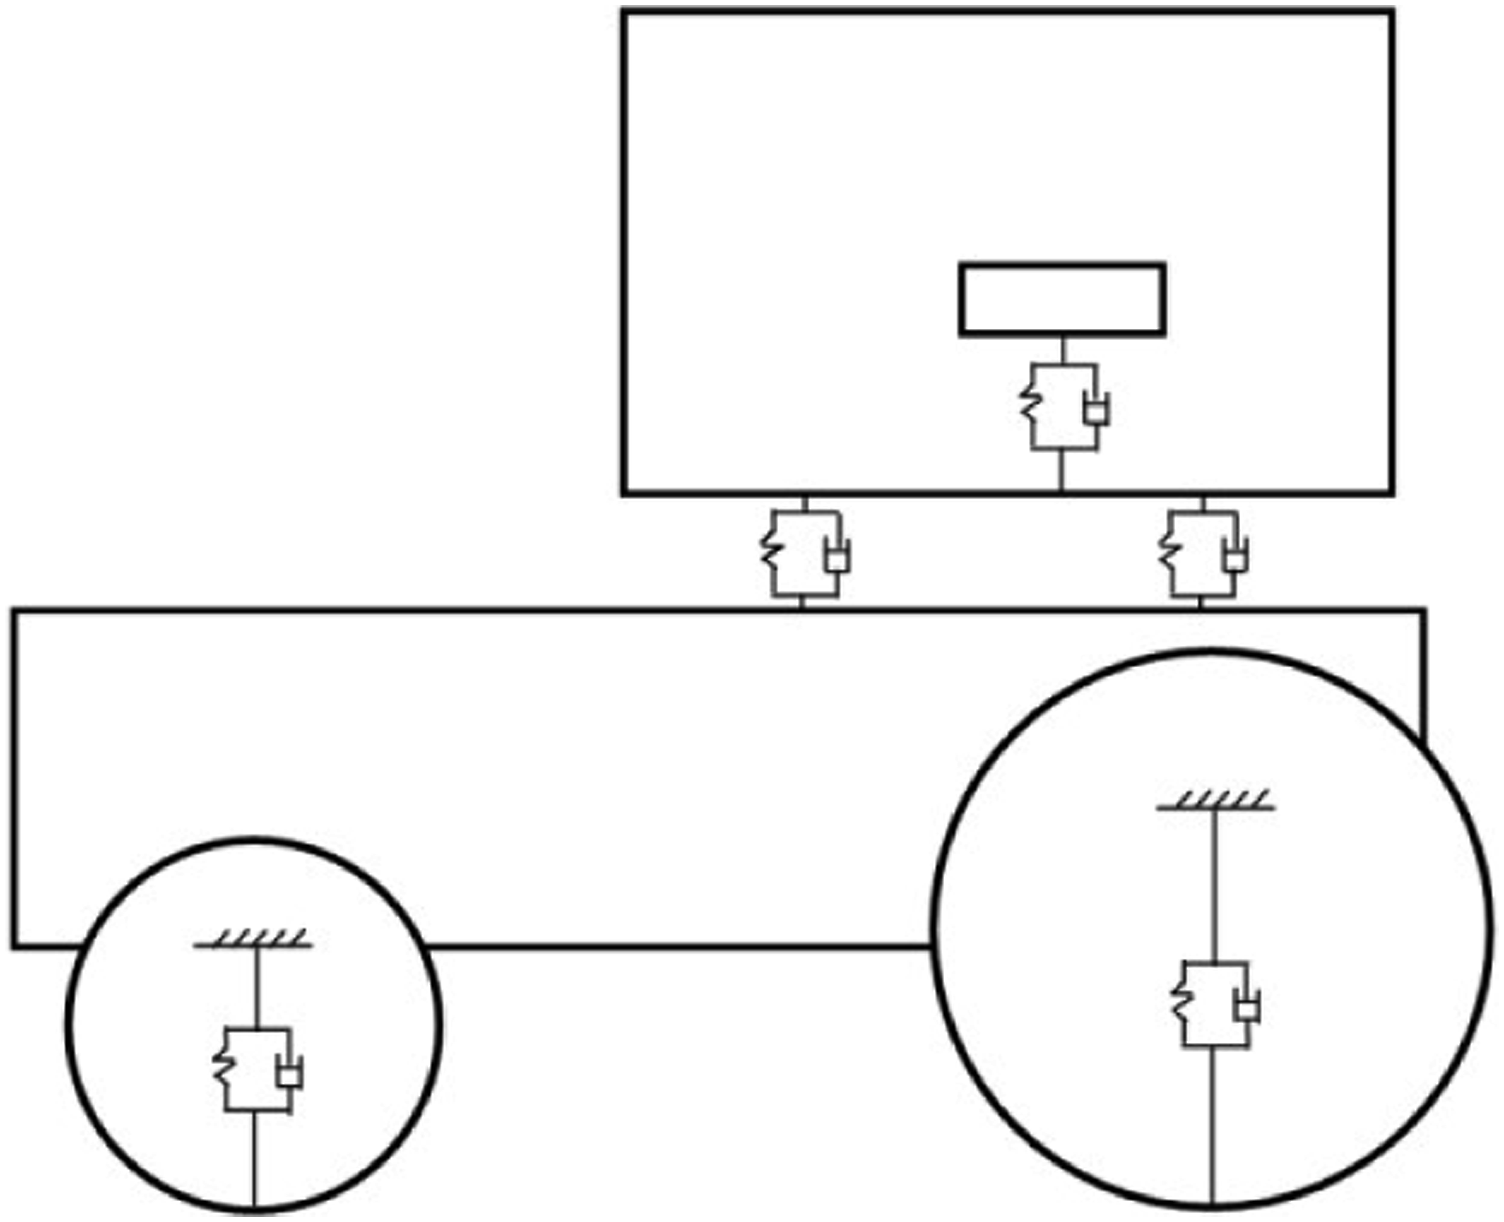
Tyre-road model
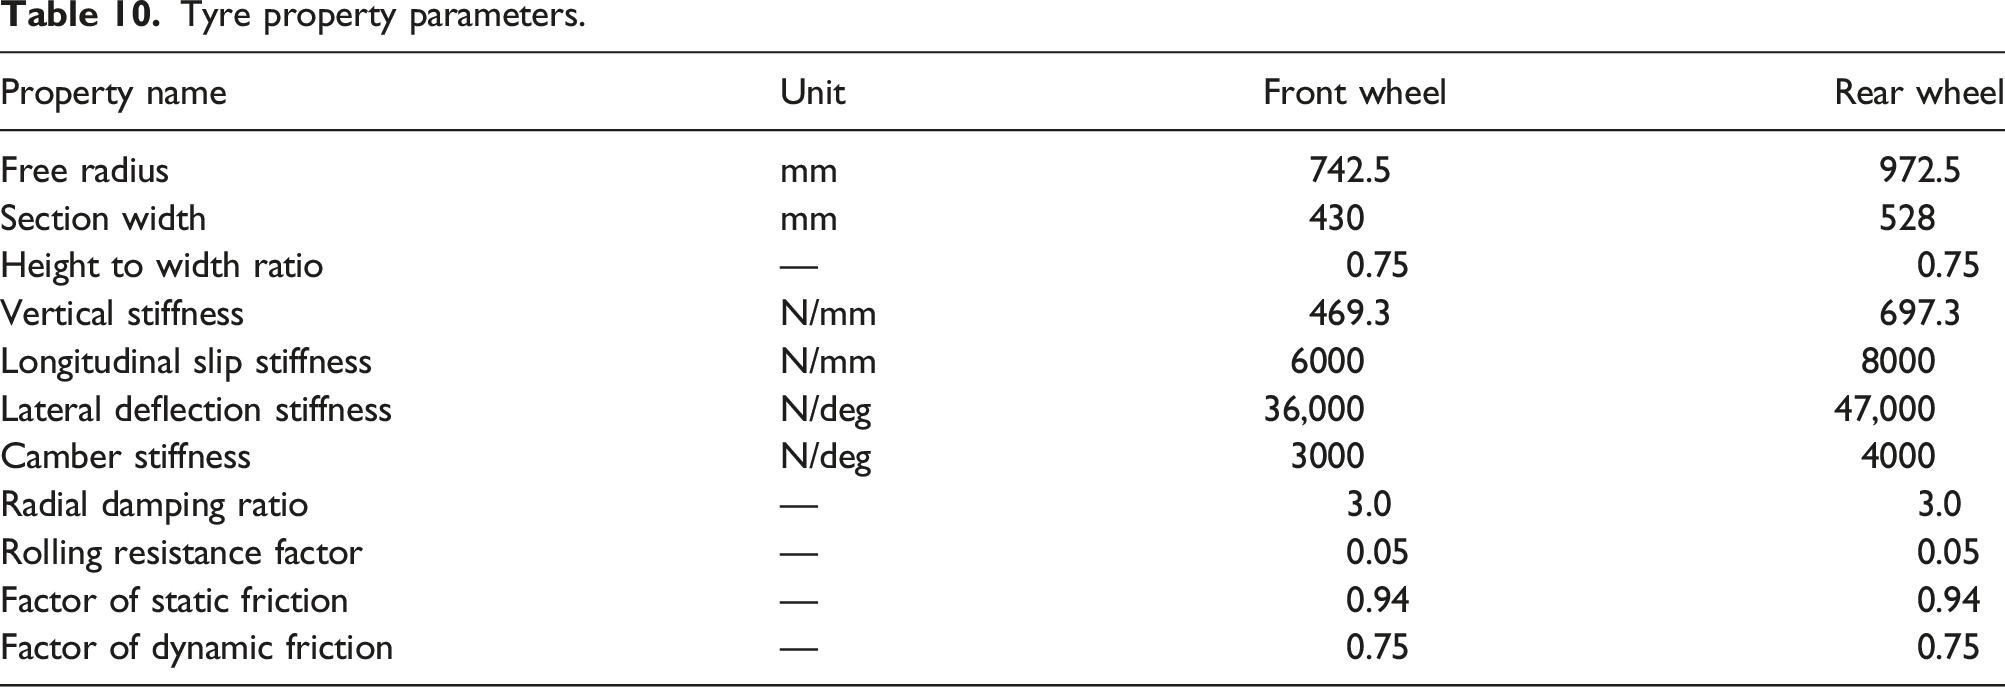
Tyre property parameters.
The tyre model is established in Adams software,
18
and the tyre stiffness and damping parameters are calculated from the tyre pressure and size.19,20 Constraints are established according to the motion relationship between the components, and the whole vehicle dynamics simulation model is shown in Figure 11. Tractor road surface model.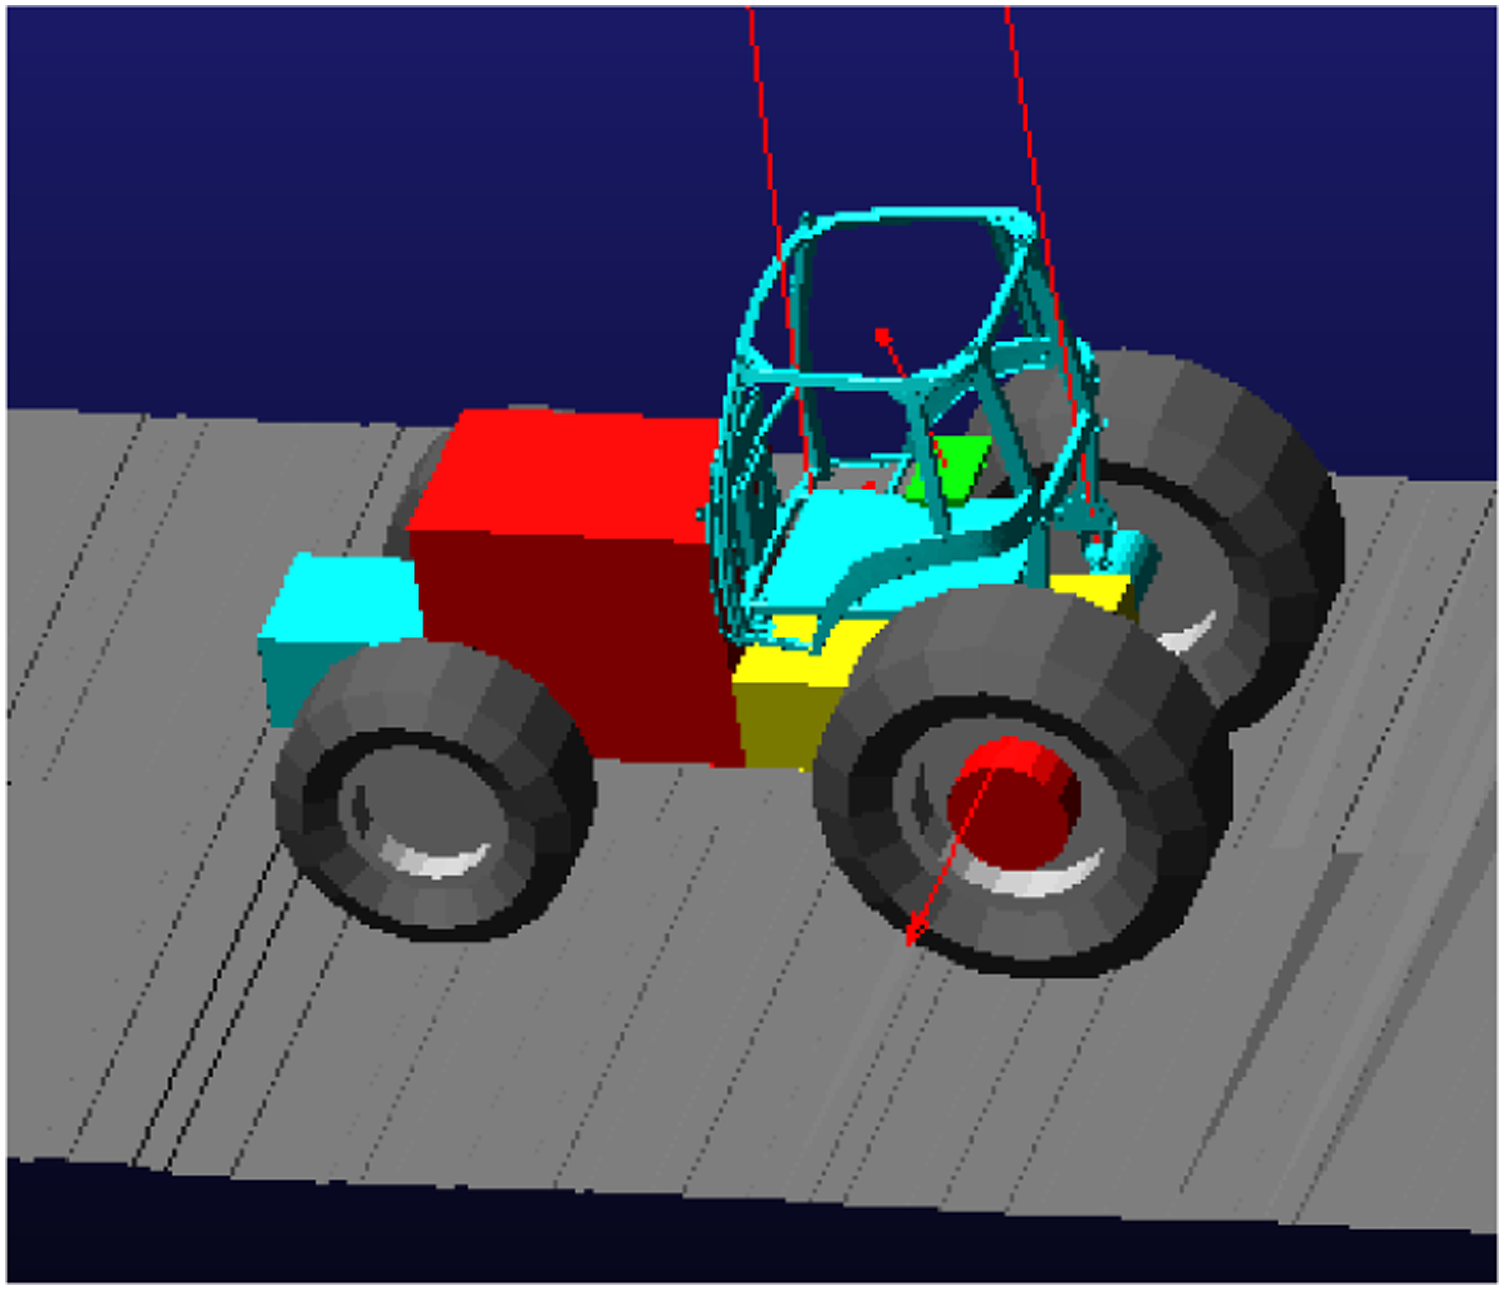
Simulation results
The simulation studies the situation of a tractor running on the artificial test track. The simulated acceleration time domain signals in the three directions at the seat surface are shown in Figure 12. The simulated combined acceleration of the driver's whole body vibration is 2.66, which is 6.7% smaller than the test value of 2.85. The error in all three directions is within 10%, indicating that the simulation model has a high degree of confidence. Seat position acceleration in three directions (a) X-axis; (b) Y-axis; (c) Z-axis with tractor running on the artificial test track.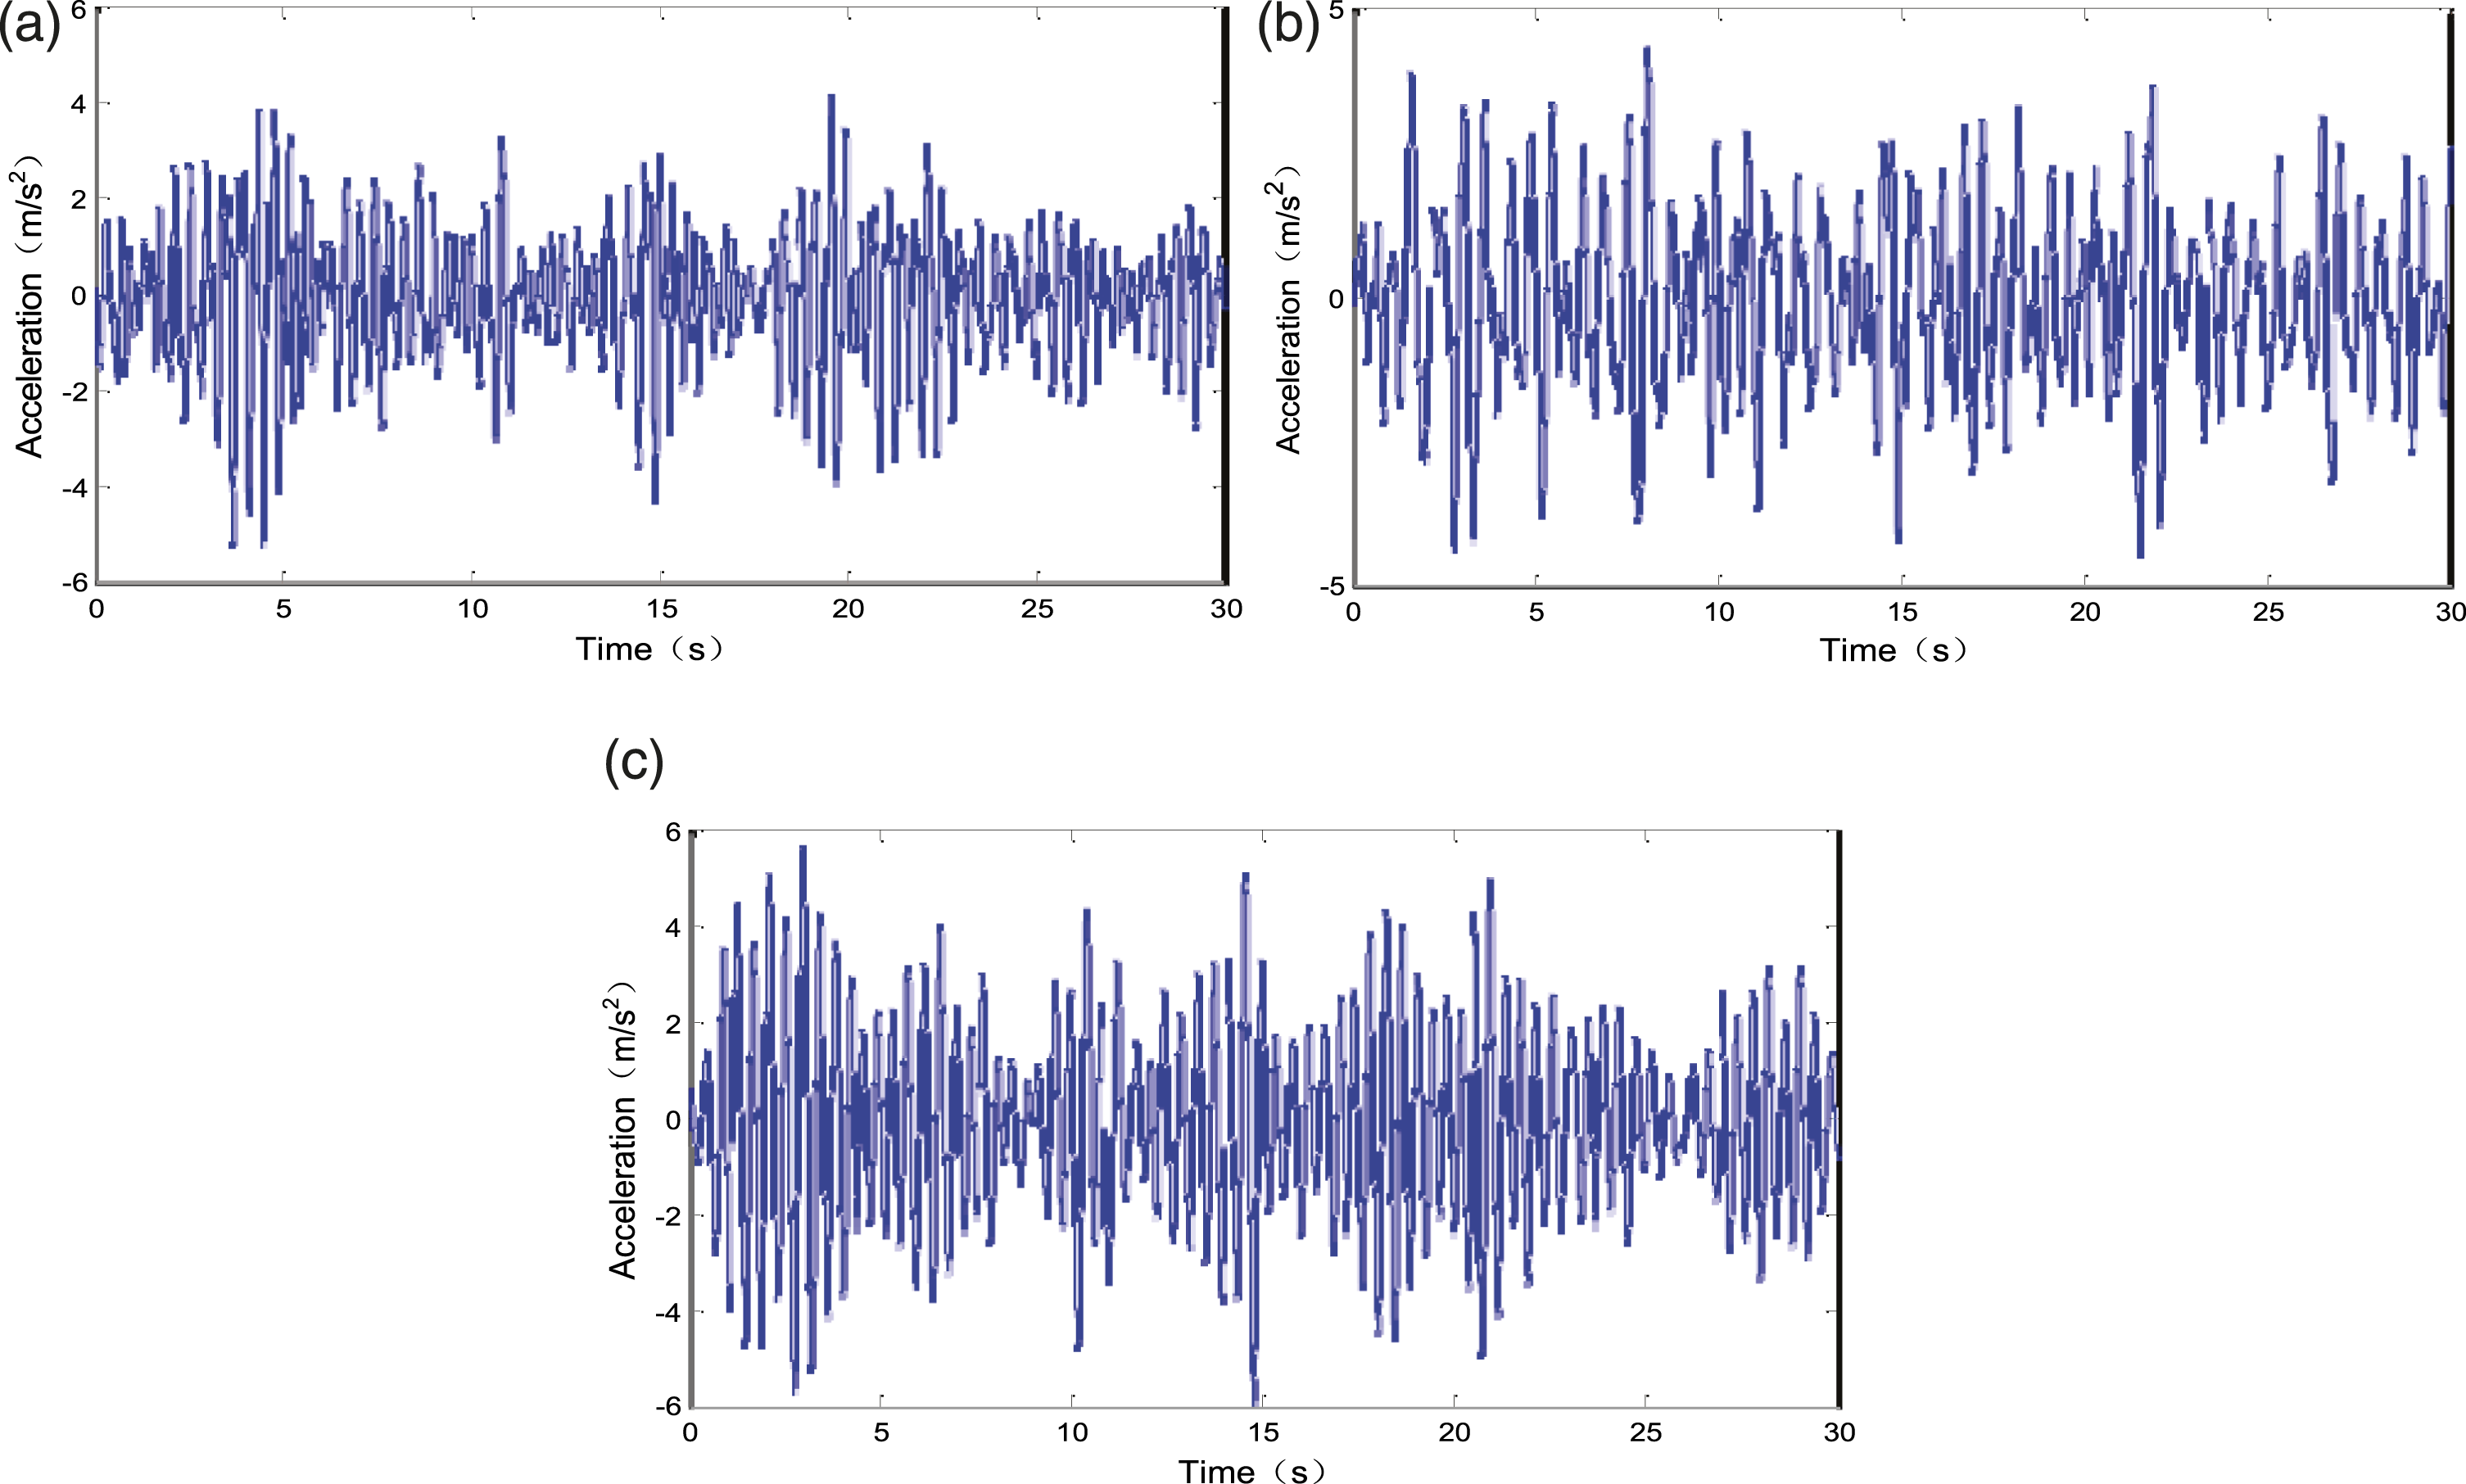
Numerical model-based analysis of smoothness influencing factors
The factors affecting the smoothness of tractor driving are analyzed based on a numerical dynamic model of a tractor running on an artificial track. This model only changes the parameters, such as the stiffness and damping of the elastic elements, without considering the changes in speed and mass distribution (Figure 13). Comparison of simulation and test results with tractor running on the artificial test track.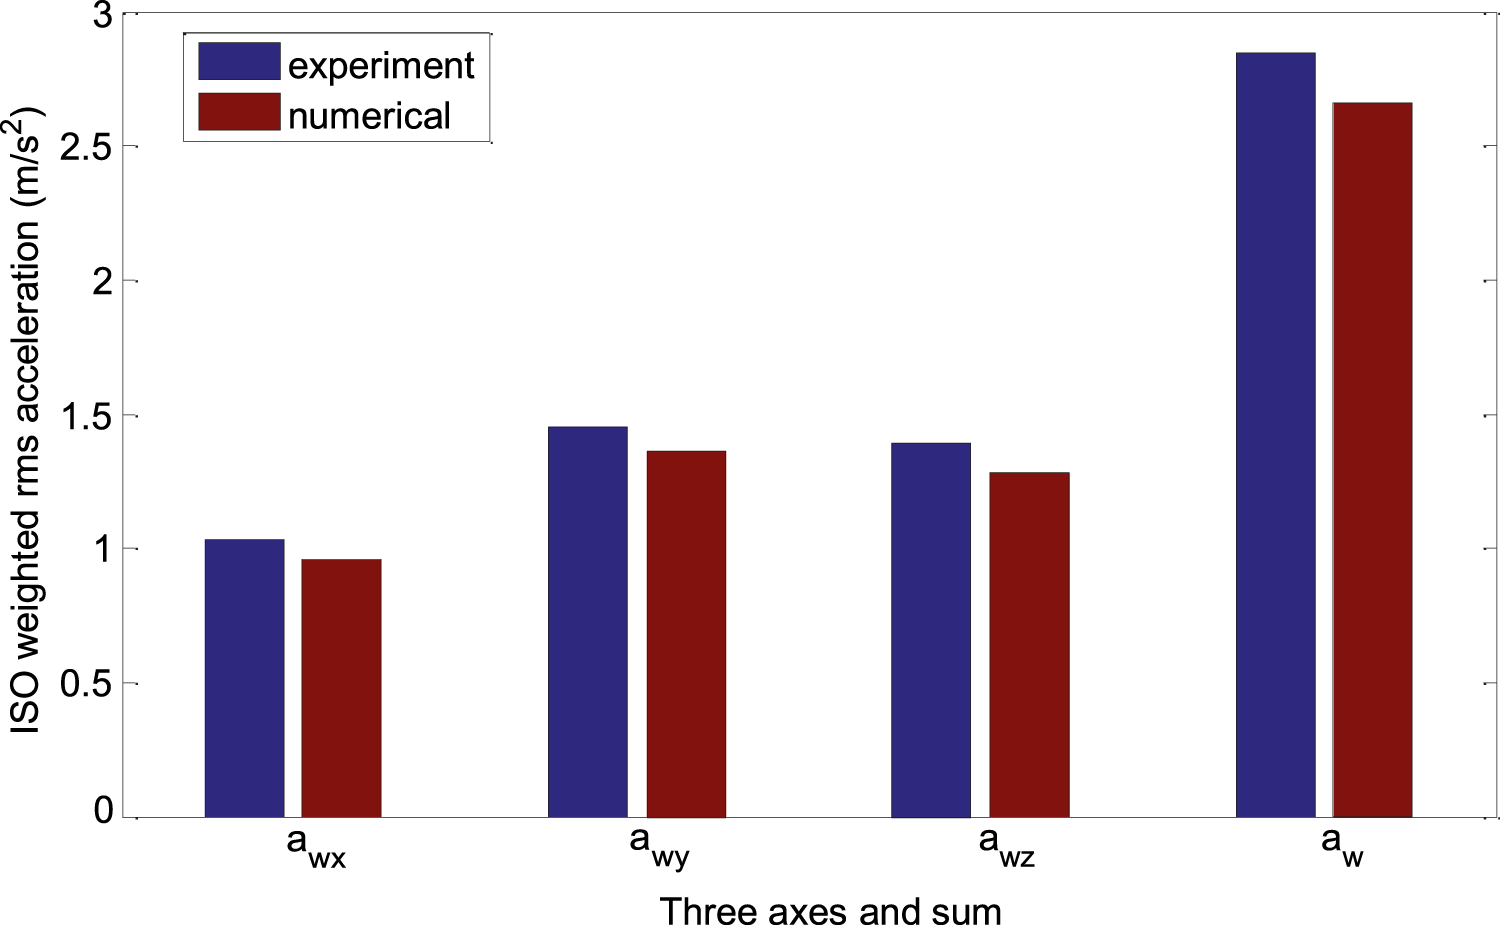
Seat suspension parameters
Figure 14 shows the effect of changing the seat suspension stiffness. The horizontal coordinates are dimensionless values. Value 1 is the base value and the stiffness value in the initial simulation model. Value 2 represents a 100% increase and value 0.5 represents a 50% decrease compared with the base value. The vertical coordinate is the joint acceleration of the driver’s whole-body vibration obtained from the numerical research. Figure 15 shows the effect of changing the seat suspension damping. The physical meaning of the horizontal and vertical coordinates is the same as above. Effect of seat suspension stiffness. Effect of seat suspension damping.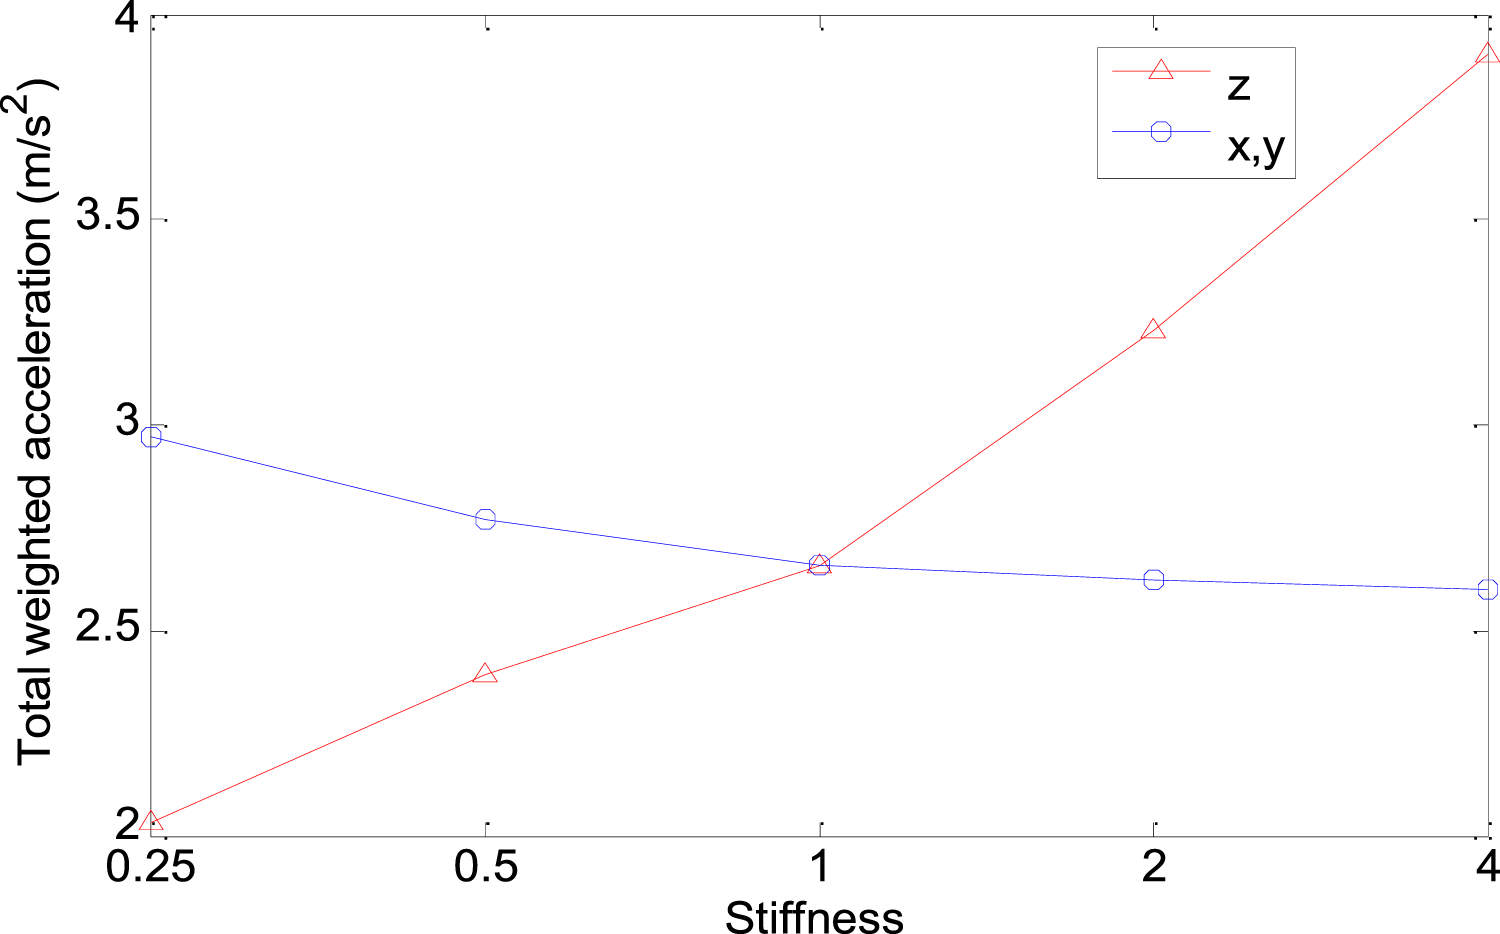
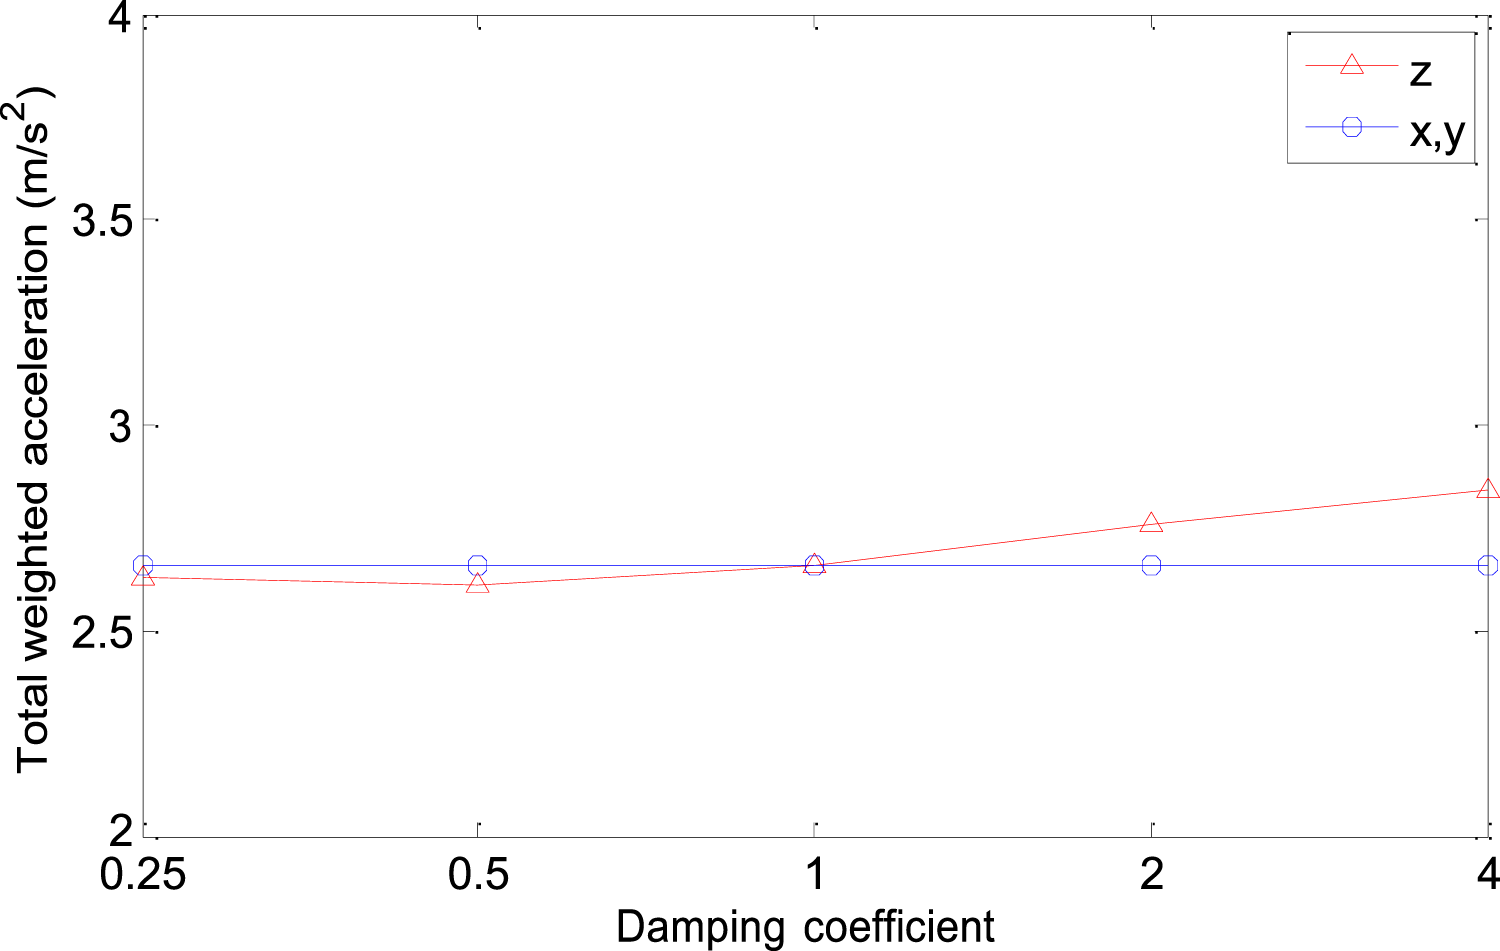
The z-directional stiffness of the seat suspension makes a greater effect on the joint acceleration of the driver’s whole-body vibration. The smaller the z-directional stiffness is, the more the seat suspension absorbs the impact from the road, resulting in less whole-body vibration for the driver. The change in damping has a definite effect on the smoothness of driving. In addition, the vehicle may have acceleration, deceleration, and non-linear driving behavior in actual driving, so the effect of x- directional and y-directional stiffness and damping is more related to the driver's operating behavior. Since the tractor in the model is driven along a straight line at a perfectly constant speed, the changes in lateral and longitudinal model parameters make little effect on the results.
Cab suspension parameters
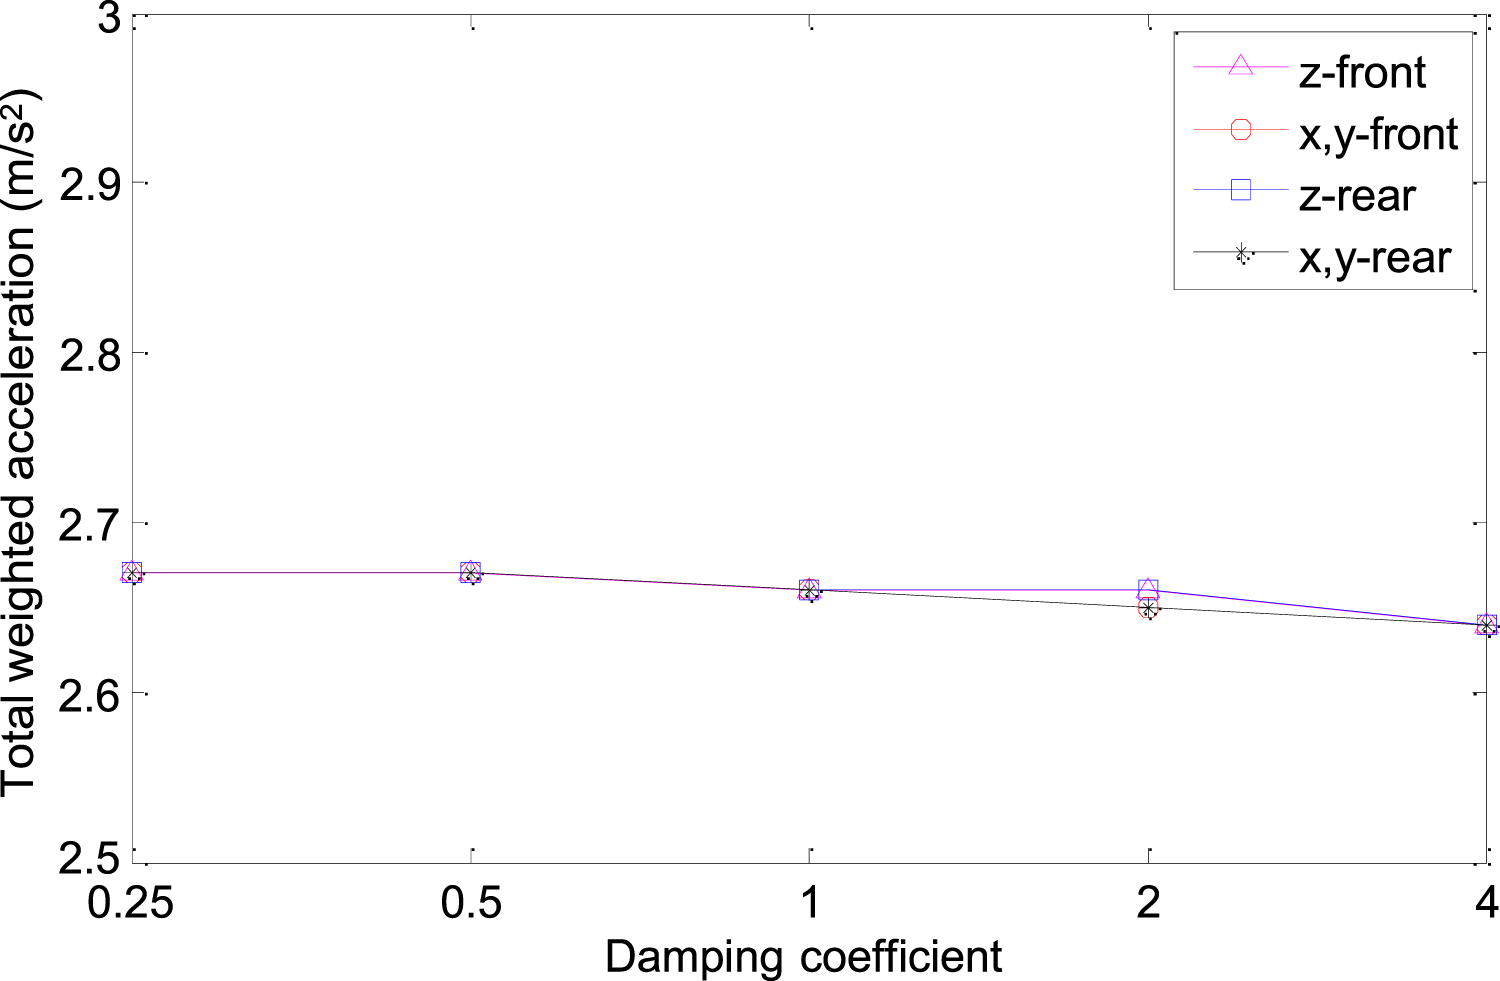
Figures 16 and 17 show the effects of changing the cab mount stiffness and damping, respectively. The cab has four rubber mounts, and the analysis was carried out separately for the front and rear mounts. As can be seen from the figures, reducing the rigidity of the cab mounts in the current scenario instead makes the driver’s whole-body vibration intense, revealing the complexity of the multi-system dynamics. The effect of damping on the results is largely negligible. Effect of cab suspension stiffness. Effect of cab suspension damping factor.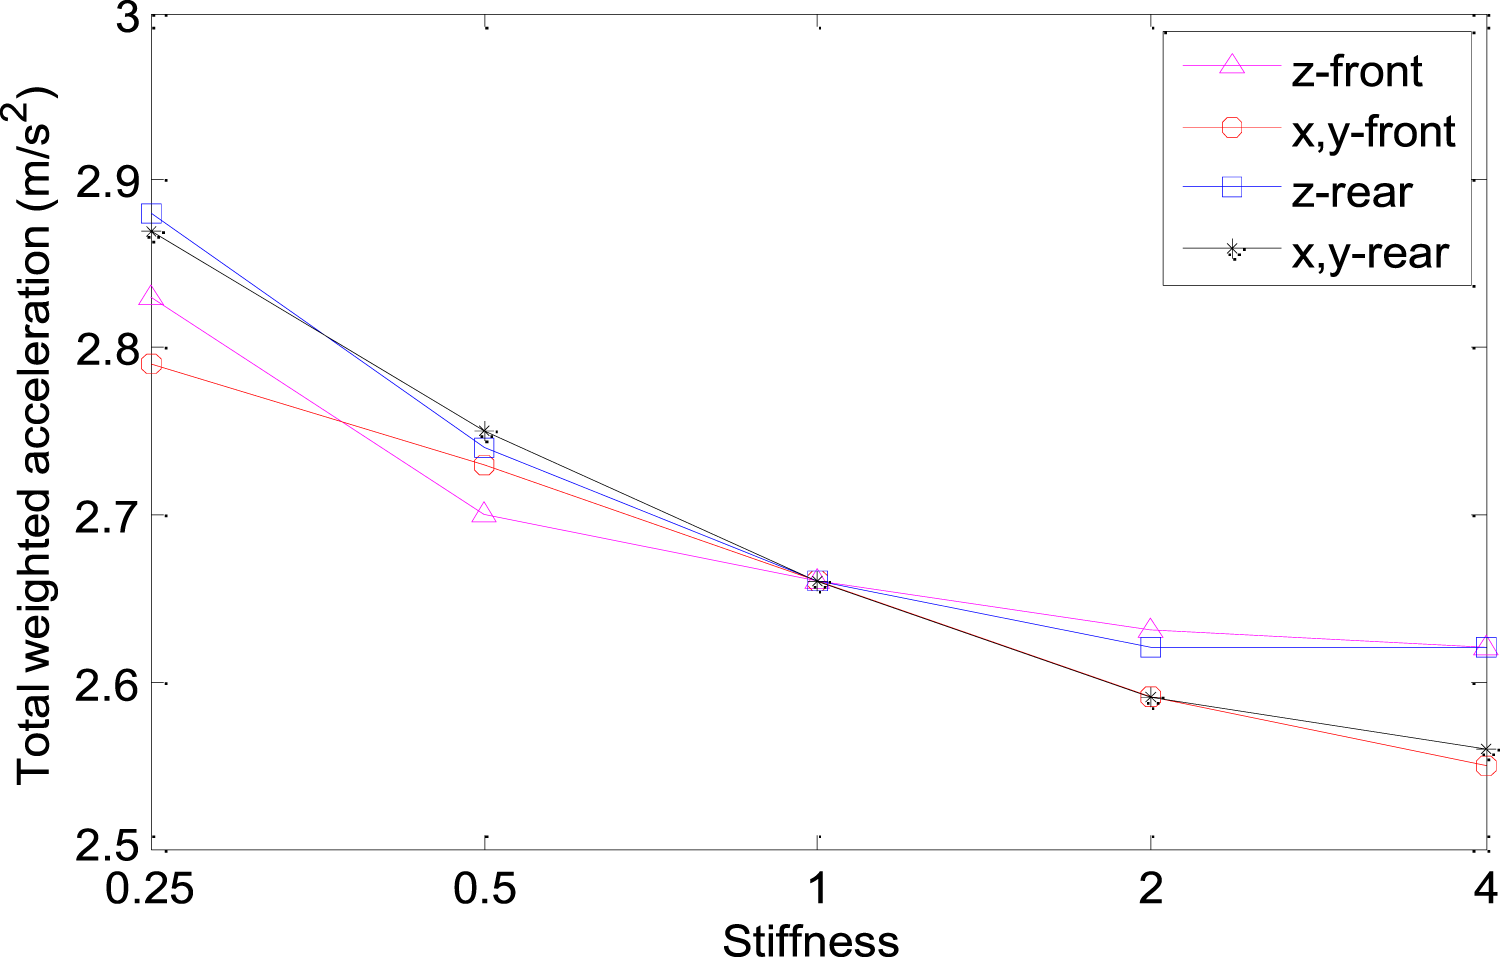
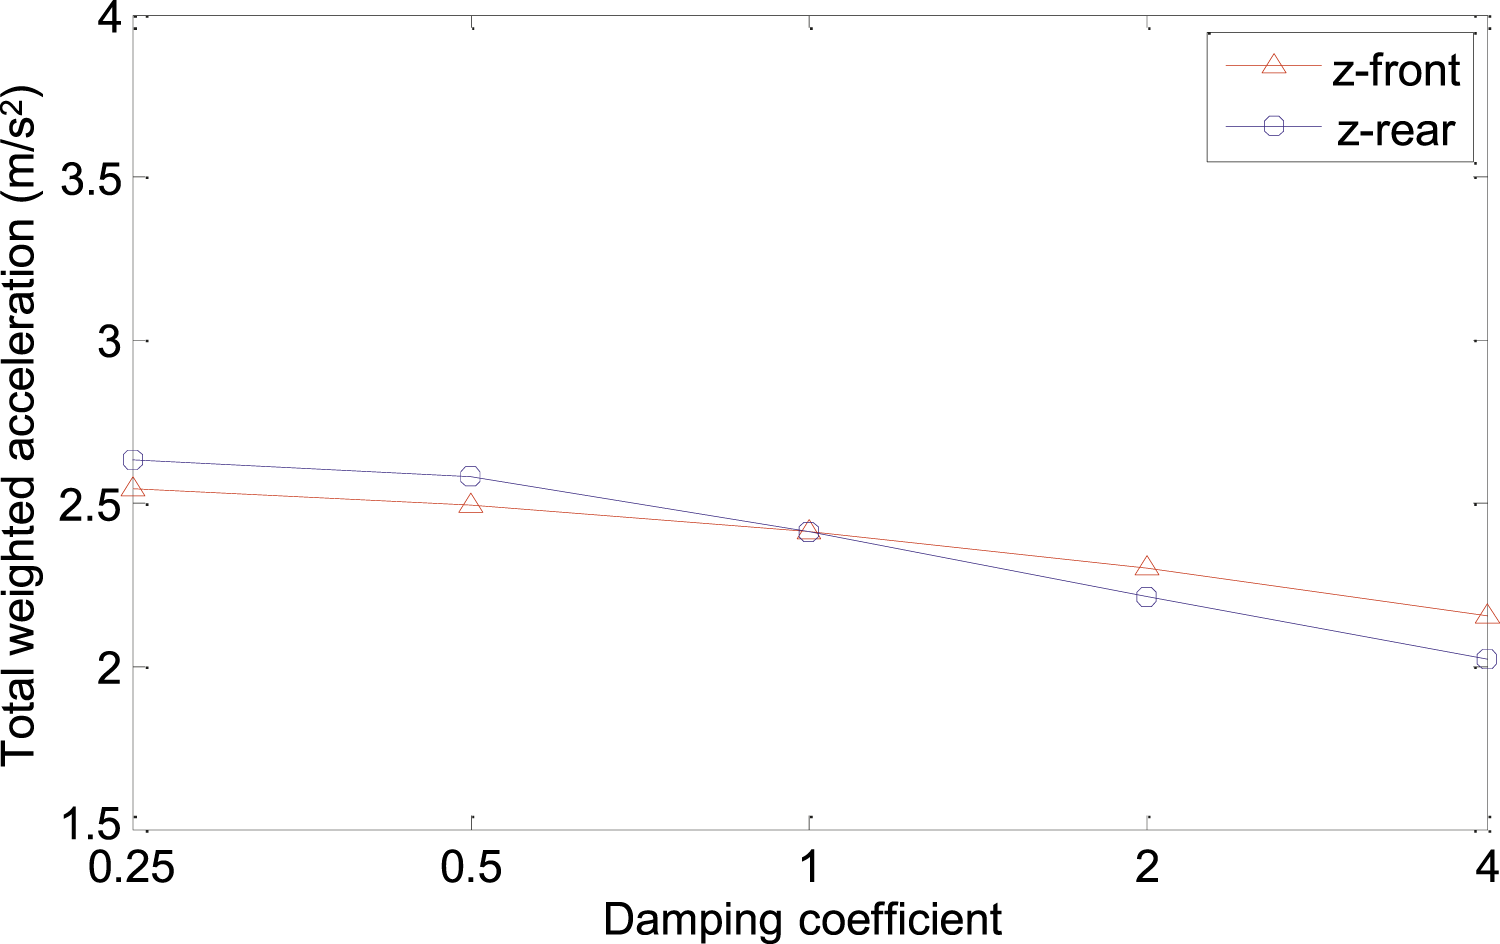
Tyre parameters
Because the sizes of the front and rear tyres are different, and the seat is closer to the rear tyre in spatial location, the effects of the front and rear tyres need to be considered separately in the numerical model. As shown in Figures 18 and 19, both tyre vertical stiffness and damping make a great effect on the results, with the tyre stiffness making a particularly significant effect. As can be seen from the graphs, increasing tyre stiffness significantly increases driver’s whole-body vibration in the current scheme. And the driver’s whole-body vibration decreases when the tyre damping increases. The stiffness and damping of the rear tyre make a greater effect on the results than the stiffness and damping of the front tyre. Effect of tyre vertical stiffness. Effect of tyre damping.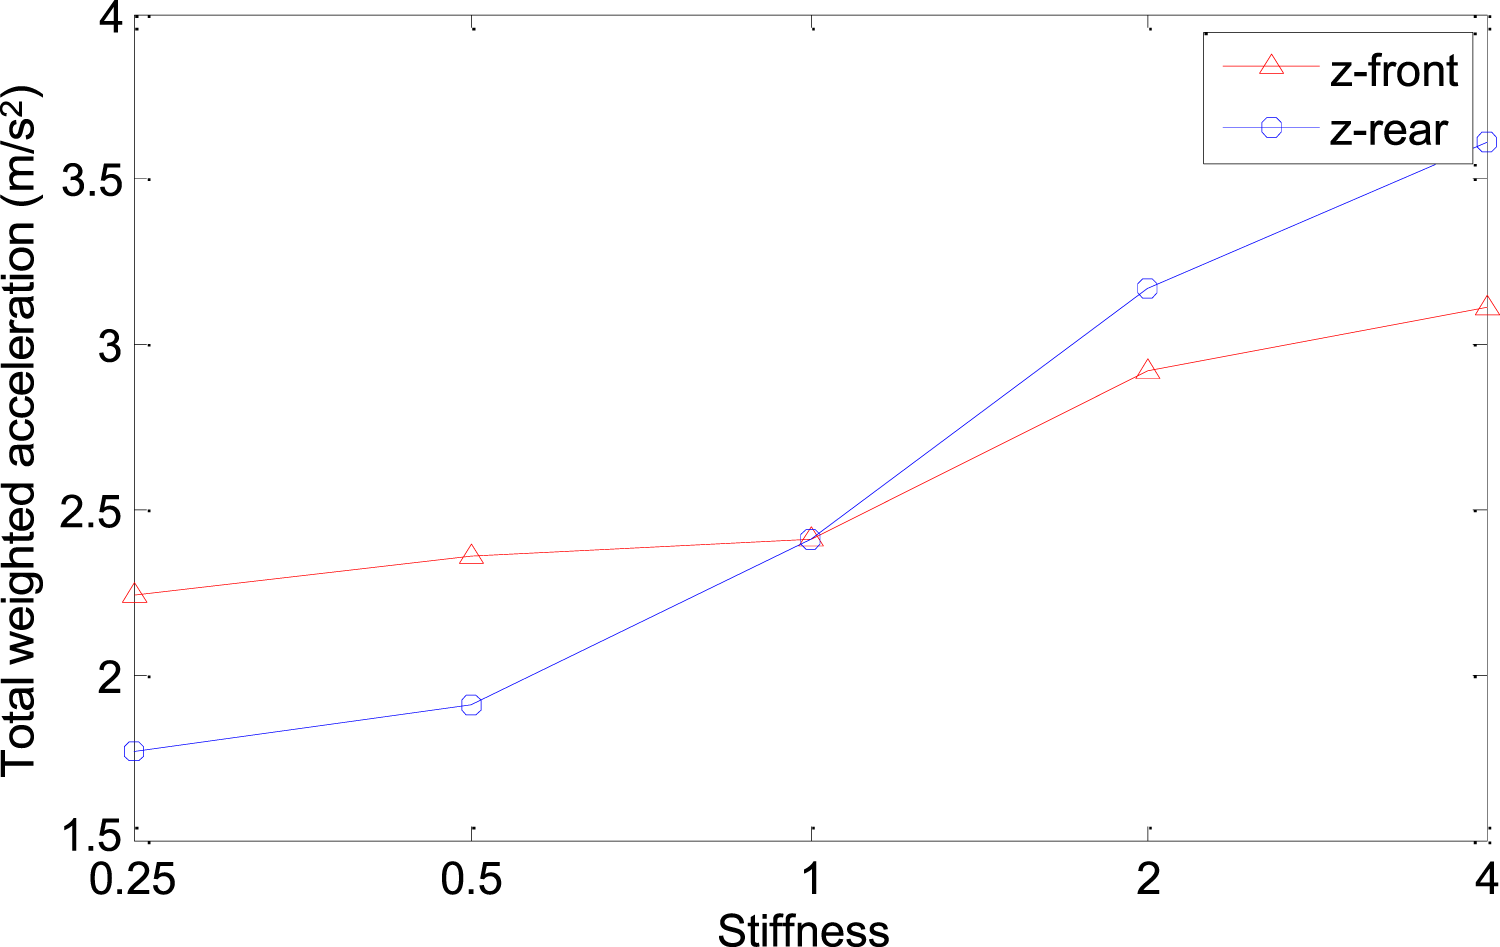
Conclusions
The objective of the work was to establish a simulation model to evaluate the main factors affecting the magnitude of driver’s whole body vibration. The main conclusions are as follows: (1) The results show that the seat surface vibration is highest and the subjective feeling is uncomfortable under the field working condition. The vibration isolation performance of the seat and cab suspension is significantly different under varying conditions. The result of spectrum analysis shows that the seat does not have any vibration isolation in 2–4 Hz and the cab mounts do not have any vibration isolation below 20 Hz. This phenomenon is related to the inherent frequency of the respective systems. (2) The influence of the model parameters on the driver’s whole-body vibration was further analyzed by building a numerical dynamics model of the tractor being driven on an artificial track. The analysis showed that the factors with greater influence were the vertical stiffness of the seat suspension and the vertical stiffness and damping factor of the tyres.
Footnotes
Declaration of conflicting interests
The author(s) declared no potential conflicts of interest with respect to the research, authorship, and/or publication of this article.
Funding
This research was funded by Ministry of Science and Technology of the People’s Republic of China, grant number 2022YFD2001202.