
Abstract
Taxi drivers are daily exposed to frequent and prolonged whole-body vibration. This can cause complications such as back pain among them. Since the vibration level depends on many factors, the present study was performed to model the impact of vehicle speed on the attributes of whole-body vibration among the Peugeot 405 taxi drivers. In this experimental study, the whole-body vibration was measured while other variables including tire pressure, engine speed, road gradient, number of passengers, and type of tire, springs, and shock absorbers had been fixed. The measurements were done according to ISO2631–1 at different speeds of 20, 40, 60, and 80 km/h. Increasing the vehicle speed caused an increase in the average value of vibration attributes including Z-axis (vertical) r.m.s. acceleration, 8-h equivalent acceleration, vibration dose value (m/s1.75), and crest factor (P < 0.05). At the speed of 80 km/h, the average vibration dose value (17.6 m/s1.75) exceeded the upper limit of the ISO 2631–1:1997 health caution zone (>17). Further, 8-h equivalent acceleration, at the speeds of 60 and 80 km/h, was beyond the upper limit (>0.9 m/s2). According to the crest factor, increasing speed would cause greater vibration peaks along the Z-axis (worst-case axis). The amount of whole-body vibration is sensitive to speed changes so that urban taxi drivers who are usually driving at low speeds for inner-city transits will be exposed to a lower average value of whole-body vibration. Due to the evident effect of speed on whole-body vibration attributes, it is strongly recommended to be given full consideration to this factor in preparing vibration control plans for vehicles.
Introduction
Taxi drivers are daily exposed to frequent and prolonged whole-body vibration (WBV). 1 This type of vibration is within the frequency range of 1–80 Hz. 2 It is considered as one of the hazardous physical factors in workplace and leads to many harmful effects on the body. The harmful health effects will appear when a person is in contact with a vibrating surface. The roughness of road driving surface causes vertical vibration in vehicles, which is transmitted to the body of driver and passengers. Typically, people in everyday life are exposed to WBV in automobiles, buses, trains, bicycles, and motorcycles.2,3 The most common side effects are back pain, digestive disorders, damage to auditory system, and impaired concentration. 4 To prove the aforementioned effects, in a study by Mitsuhiko et al. 1 on 248 taxi drivers, the prevalence of back pain was estimated to be 45.8%. This type of vibration, in addition to the aforementioned disorders, reduces the safety of people inside vehicles. 5 In view of the foregoing, assessment and control of exposure to WBV among taxi drivers would be of utmost importance whereas they spend many more hours in their car. Mitsuhiko et al. 1 reported that taxi drivers in Japan work 18 h every other day. They assessed WBV among drivers of 12 types of taxi vehicles and concluded that the WBV level was within the range of health caution determined by ISO2631–1 standard. 1 Springiness, which is dependent on the springs and shock absorbers, has a considerable impact on reducing vibrations imposed on driver and passengers’ whole body. According to the studies, various factors affect the levels of WBV among taxi drivers. For example, Bouazara et al. 6 and Hansson 7 reported that suspension system under the seat has led to considerable decrease in WBV; but this suspension is a lot of cost and complexity. Mitsuhiko et al. 1 and Chen et al. 8 found that decrease of speed is an important factor for low back pain caused by WBV. Hostens and Ramon 9 and Eger et al. 10 showed that vehicle speed associated significantly with vibration magnitude measured at the seat. Besides, the same study has noted that increasing the speed of the vehicle resulted in increase in vibration.11,12 Despite the importance of the effect of vehicle speed on transmission of WBV to taxi drivers, literature reviews revealed that so far there have not been any similar studies on WBV of taxi drivers in Iran. Accordingly, the present study was conducted to assess WBV attributes among the Peugeot 405 taxi drivers. Currently, around 150,000 Peugeot 405 vehicles offer transport services to the passengers in Iran that the exposure level of the drivers of this type of taxis to WBV can be important. The large number of this type of vehicles and relatively long working hours (10 h a day) of drivers apparently indicate the importance of addressing this issue in Iran. Drivers compete along the route to pick up passengers. This causes the more frequent the speed change of vehicles on the path. Given that speed can be one of the influential factors on the level of WBV, the aim of the study was to assess the influence of the vehicle speed on the vibration stress of taxi drivers in Iran.
Material and methods
Study environment
This experimental study was carried out on Peugeot 405 taxis car produced in 2014 in Iran. The driver of the taxi works 10 h a day continuously. The mileage of the taxi at the start of testing was about 18,649 mile. In order to increase the precision and eliminate the confounding factors, before the start of testing, the vehicle underwent technical examinations at the Light Vehicle Mechanized Technical Inspection Center. The examinations included testing the springs and shock absorbers by SAXON Vehicle brake tester (Figure 1) and tire balance by Tire Balance Tester. In order to test the springs and shock absorbers based on Figure 1, a vibration at a fixed frequency (typically 16 Hz) and amplitude of about 1 cm is applied to the tires on the front and rear axles. Then, the tester specifies the isolation percentage of the applied vibration. The springs and shock absorbers will be applicable if the percentage is greater than 50%. According to the steering wheel deviation test, in cases of tire imbalance or vibration while on the move, a lead piece is connected to the uncoordinated part of the tire to rebalance it. Confirmation of the examination results by the center (OK) indicates that the vehicle is safe technically and no additional vibration is transmitted to the cabin. When the results are not accepted by the technical inspection center (Not OK), the defective parts should be replaced or repaired.
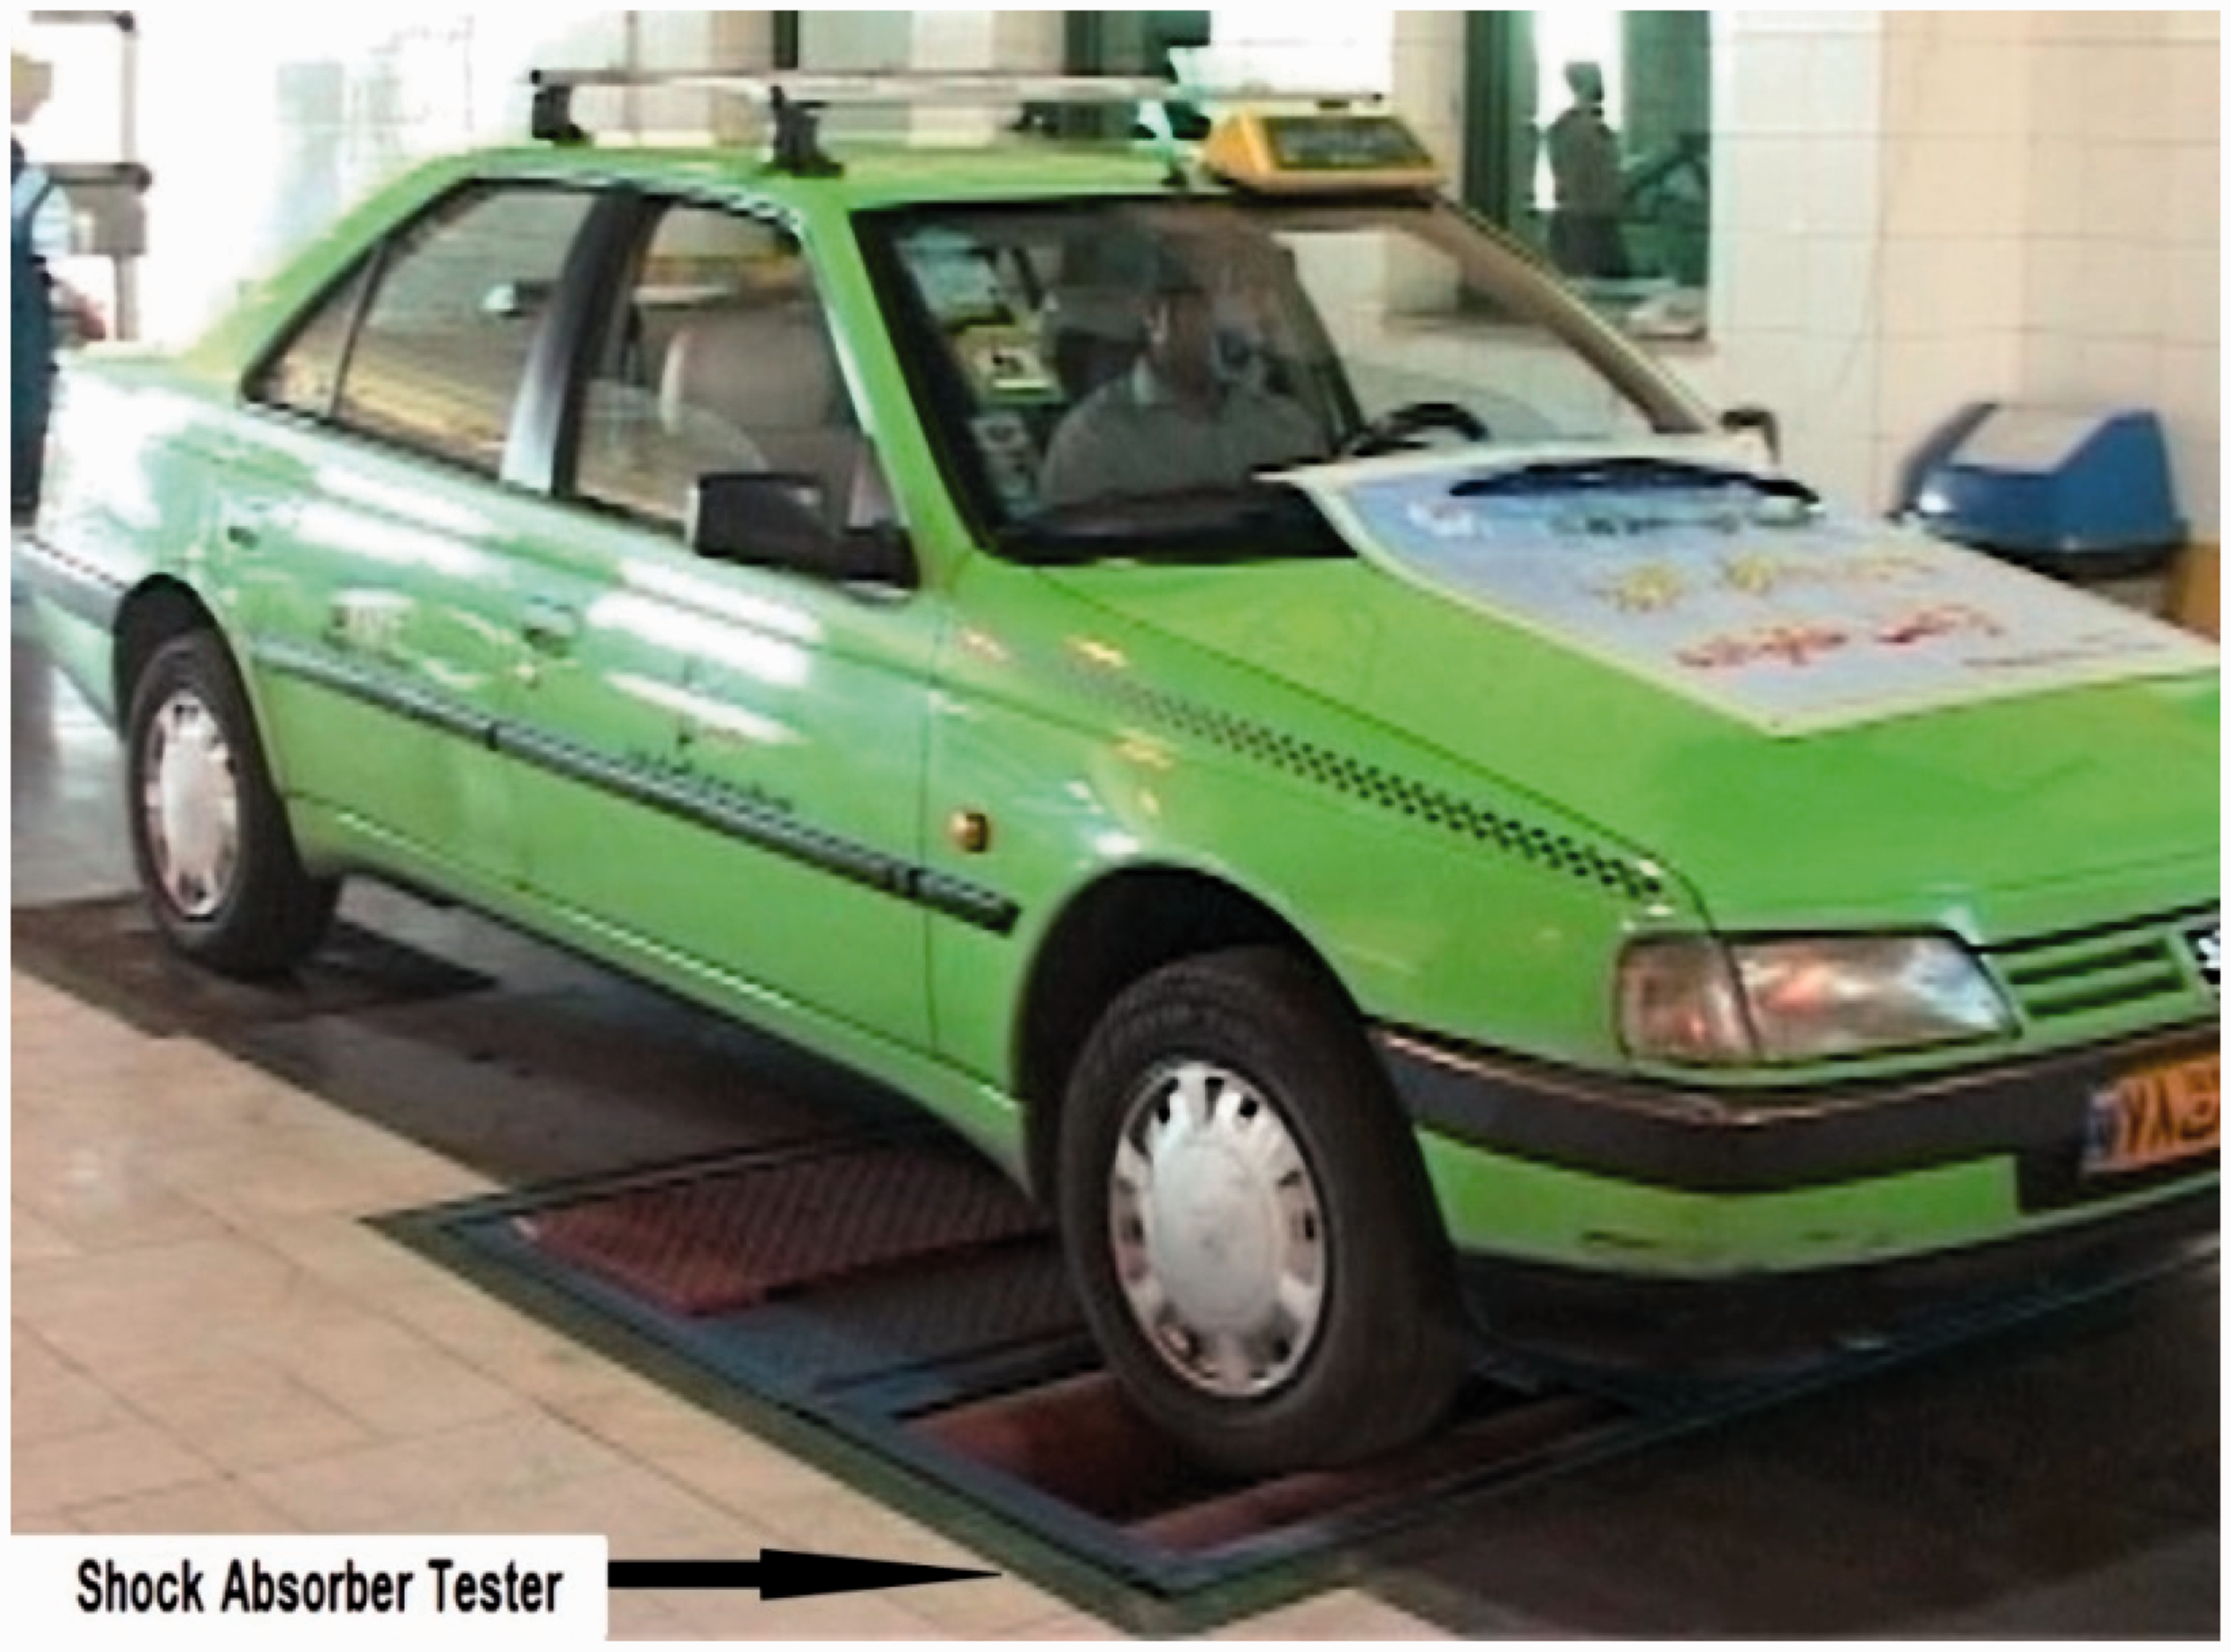
Test conditions of springs and shock absorbers.
After the technical test of the taxi, the WBV attributes were measured in a real environment on the Highway Karaj-Qazvin in the Alborz Province. The asphalt-paved highway is almost straight and has a length of approximately 95 km that is shown in Figure 2. Highways are prepared approximately from asphalt with the same degree of roughness in Iran.
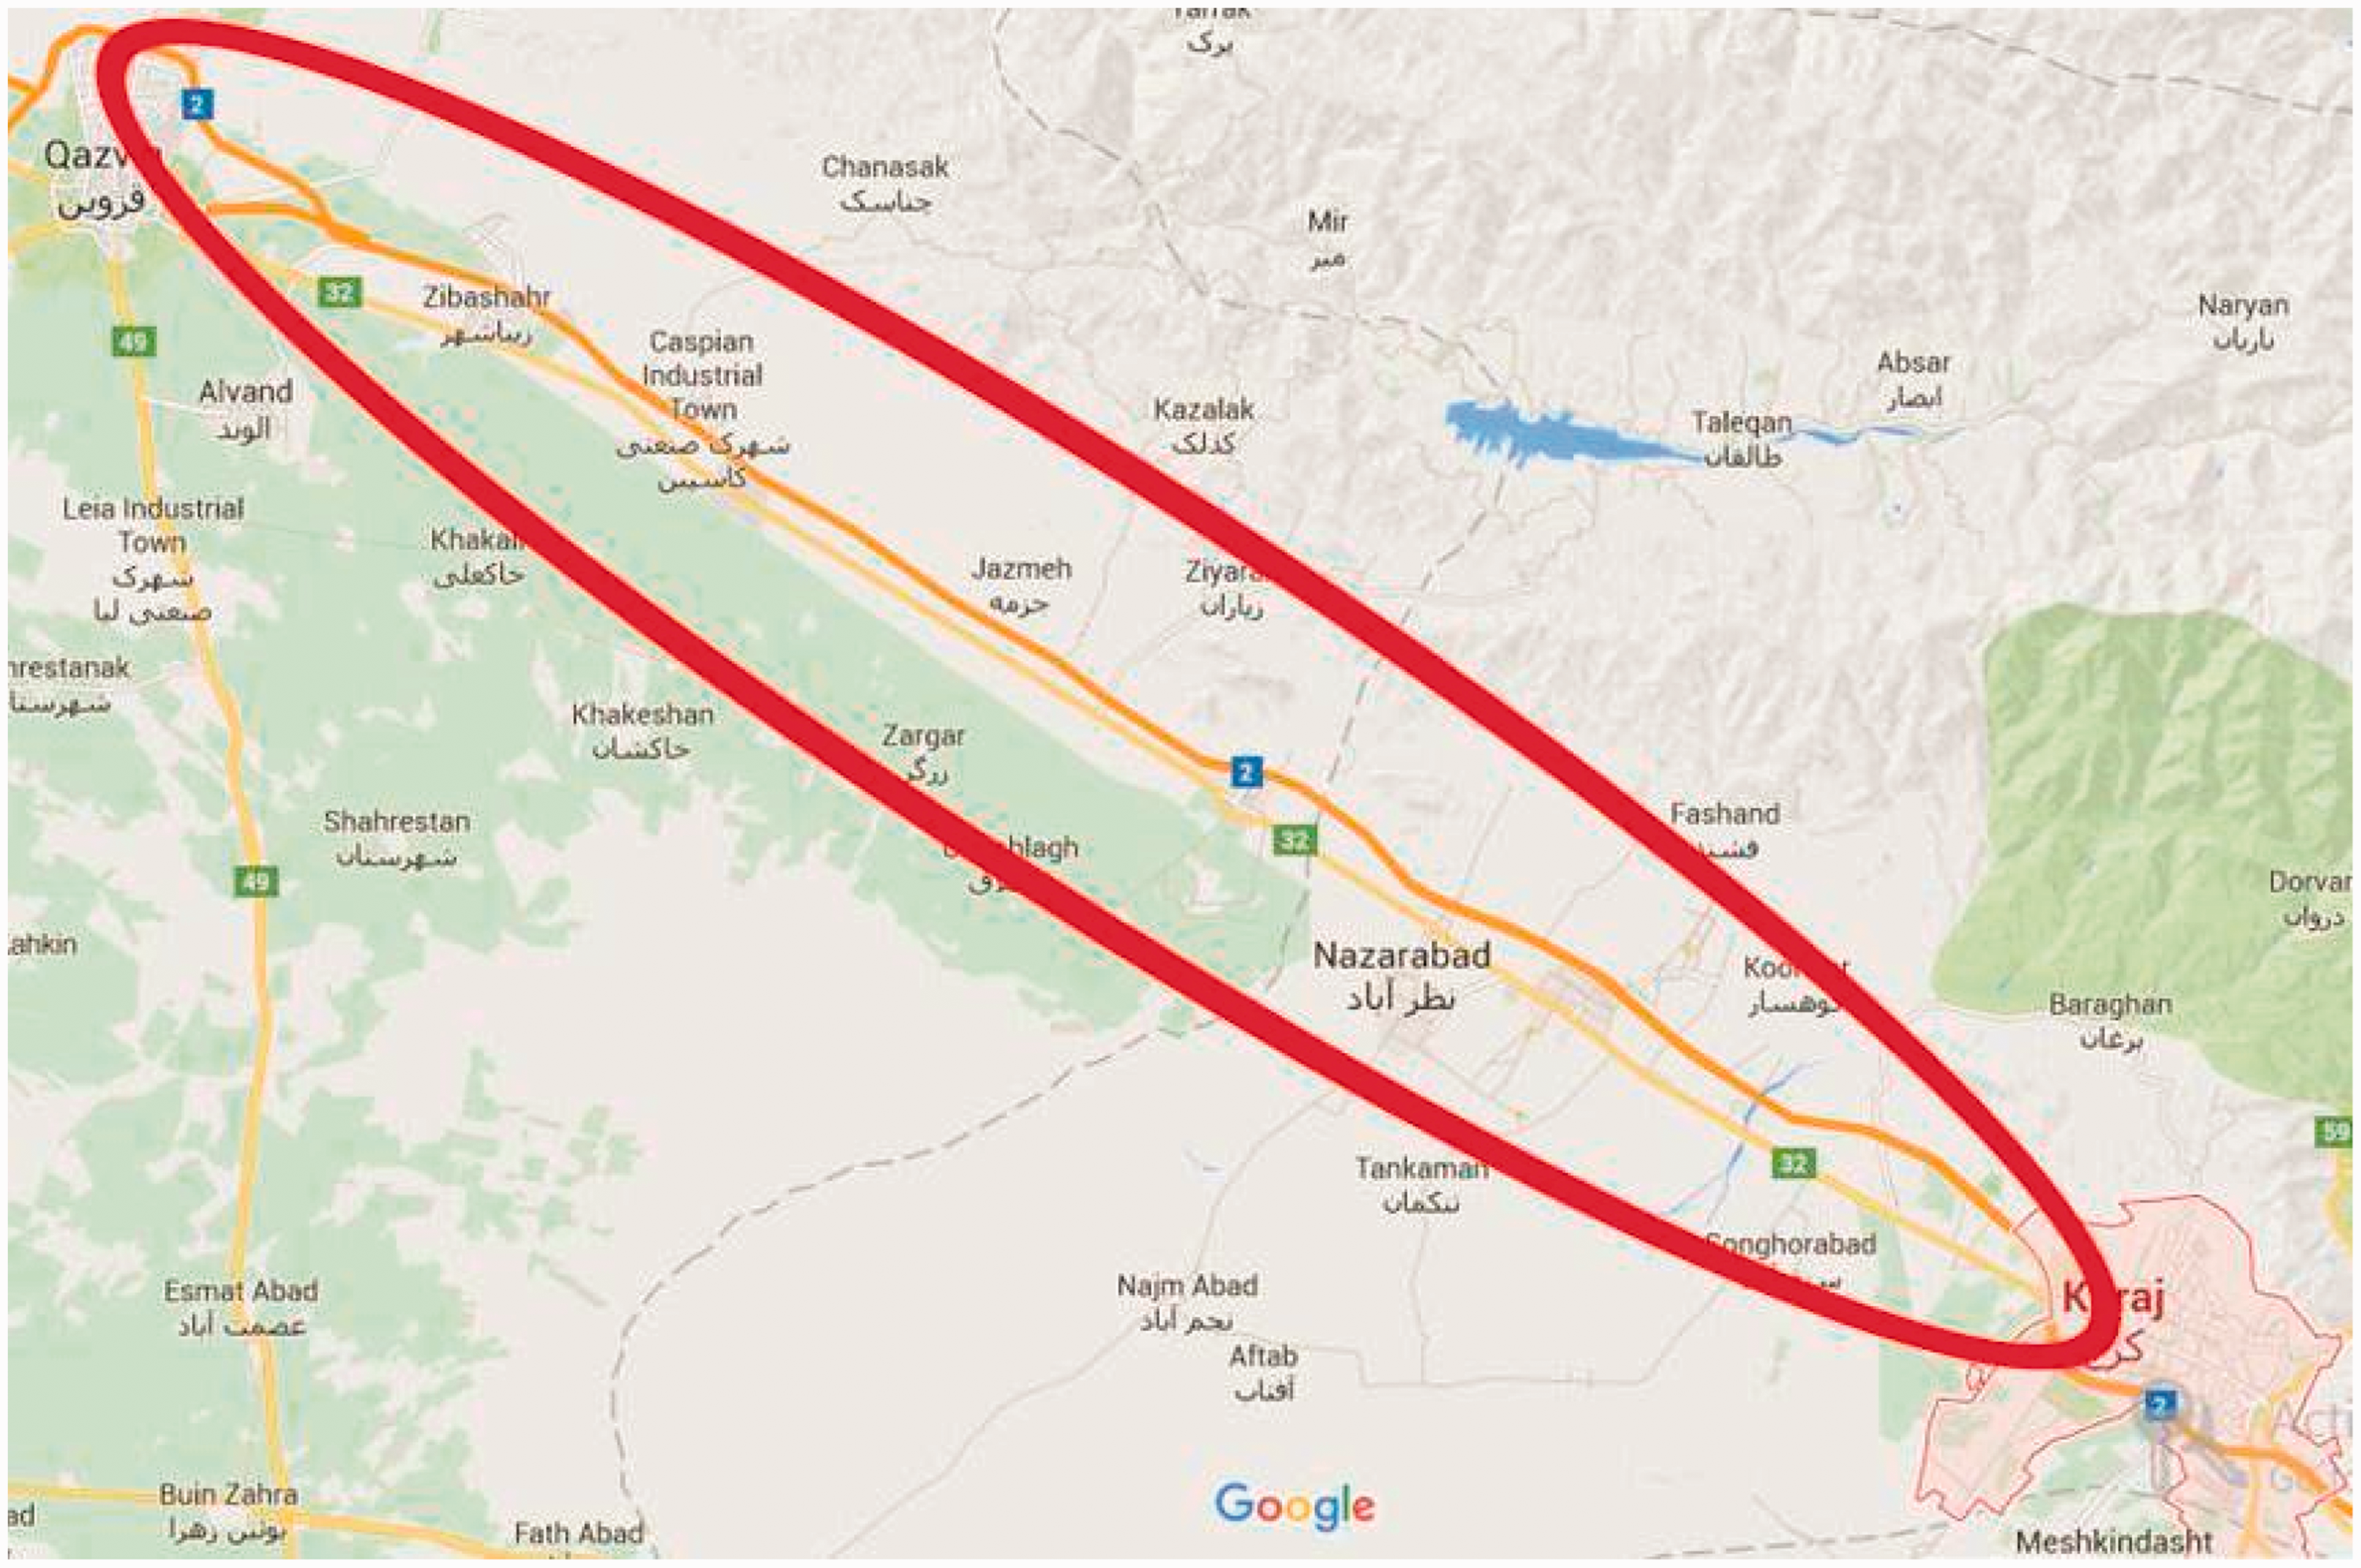
Highway Karaj-Qazvin in the Alborz Province.
It should be noted that during testing, tire pressure (30 PSI (pounds per square inch)), engine speed (3000 rpm (rotation per minute)), the type of driver’s seat, type and size of tires, tire rims, springs, shock absorbers, and type of tire tube were constant. Also, the type of rear brakes are drum brake and front brakes are disc brake.
Measurement of WBV attributes
In this study, WBV attributes were measured in accordance with ISO 2631–1 while the vehicle was in motion.
13
As mentioned earlier, the frequency of WBV varies in the range 1 to 80 Hz. Since the risk of damage is not the same at all frequencies of the vibration, so ISO 2631–1 suggests using weighing frequency band. Hence, frequency weighting filters of Wc for vibration in the X-axis, Wd for vibration in the Y-axis, and Wk for vibration in the Z-axis (seated position) were used in this research. However, to assess the magnitude of the vibration, this standard proposes to select the axis that has the highest intensity (as worst-case axis).
2
If the crest factor (CF) is more or less than 9, then the effective vibration acceleration (ar.m.s.) in each of the three axes, resultant effective vibration acceleration in the three axes, and 8-h equivalent frequency-weighted r.m.s. acceleration should be measured. The ISO2631–1 standard has defined a health caution zone for exposure to the 8-h equivalent frequency-weighted r.m.s. acceleration. The upper and lower limits of the health caution zone are 0.9 m/s2 and 0.45 m/s2, respectively. The standard also recommends calculating the CF. If the CF value is greater than 9, then calculation of vibration dose value (VDV) is also proposed. Similar to A(8), the VDV has also a health caution zone for vibration exposure. The upper and lower limits of the zone are 17 m/s1.75 and 8.5 m/s1.75, respectively. It is worth mentioning that measurement of vibration attributes was carried out by calibrated SVAN 958A Vibration Level Meter and Analyser, a product of America and Poland. The device is equipped with a WBV sensor to a thickness of 12 mm. According to the standard, this sensor was placed on the driver’s seat. This study was done on an urban taxi. Because of the high traffic of cars in the city, the maximum speed limit for the taxis in Tehran is 80 km/h. For this reason, the vibration attributes were assessed at speeds of 20, 40, 60, and 80 km/h in this study. The measurements were done for 30 min and with 18 replications at each speed. Vibration meter was set in accordance to the ISO 2631–1 standard for the measurement of WBV. Subsequently, frequency-weighted r.m.s. acceleration was measured 18 times in three axes of X, Y, and Z and at each of the considered speed levels (equation (1)).

According to the ISO2631–1 standard, the resultant average frequency-weighted r.m.s. acceleration in the axes of X, Y, and Z at each of the speed levels was calculated by equation (2). In this equation, the frequency-weighted r.m.s. acceleration values in horizontal axes (X, Y) are multiplied by a factor of 1.4.

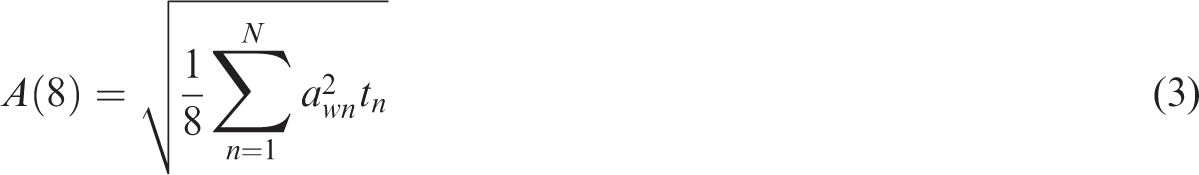
This study examined the exposure of drivers to 8-h equivalent frequency-weighted r.m.s. acceleration (A(8)) at different speed levels. Considering that the driver drives in the entire 10-h work shift, then the A(8) at each of the speed levels of 20, 40, 60, and 80 km/h was calculated using equation (3).
Peak vibration acceleration (apeak) in worst-case axis was measured during 30 min at each of the speed levels. According to the ISO2631–1, frequency-weighted r.m.s. acceleration (ar.m.s.) was measured in the axis with the highest vibration acceleration level (worst-case axis). Further, CF was calculated using these two attributes (apeak and ar.m.s.) based on equation (4).

If the CF is greater than 9, it is recommended to calculate VDV in addition to the WBV attributes. In this study, the VDV at the time of 30 min was measured using the resultant frequency-weighted r.m.s. acceleration at each of the speed level (equation (5)).

Considering that the driver spends 10 h driving per day on average, VDV of each speed level was expanded to the 10-h work shift using equation (6).

Given that this research is an experimental study, it requires statistical analysis to confirm the obtained results. To determine the proper statistical test for the analysis, the normality of each of the variables was initially tested using the Kolmogorov–Smirnov test with a margin of error greater than 0.05. After ensuring normal distribution of data, one-way ANOVA and post hoc test (Bonferroni) were used to compare the average values of WBV attributes including frequency-weighted r.m.s. acceleration (ar.m.s.) in each of the axes X, Y, and Z, and resultant value of the three axes (Axyz), as well as 8-h equivalent frequency-weighted r.m.s. acceleration (A(8)) and VDV at different speed levels of 20, 40, 60, and 80 km/h.
Results
Intercity passenger taxis in Iran include approximately one million vehicles of different types, of which about 150,000 vehicles are of Peugeot 405 model, accounting for about 15% of total number of taxis in Iran. In this study, technical test of the Peugeot 405 taxi was approved by the Light Vehicle Mechanized Inspection Center. The technical inspection examination results are presented in Table 1.
Test results of Light Vehicle Mechanized Inspection Center.
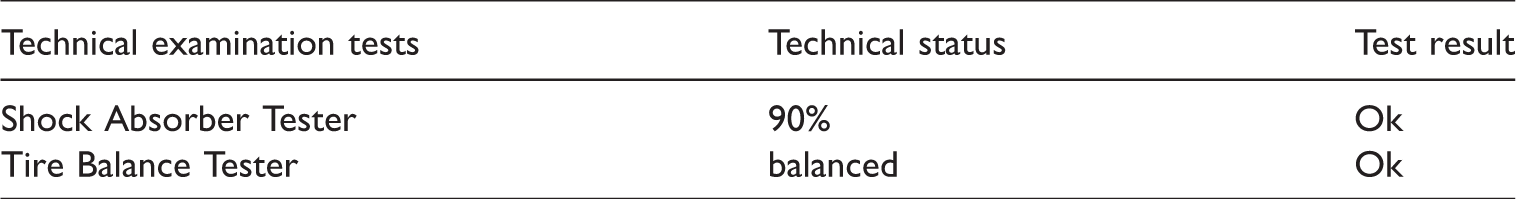
The results showed flawless functionality of the springs and shock absorbers. This means that there was no need to replace or repair these parts, and they could well reduce sudden vibrations. The results also indicated that the car tires were in perfect balance. In other words, the tires of each axle were quite parallel, without any deviation relative to each other. As a result, they could not cause any interference while measuring the WBV attributes. Based on the foregoing, the vibration attributes are mainly due to the roughness of the road surface. Furthermore, for better comprehension, the difference in vibration acceleration signals in each of the high and low speeds, which was recorded within 60 s, is depicted in Figure 3. The measured values of the WBV attribute at different speed levels are presented in the Table 2.
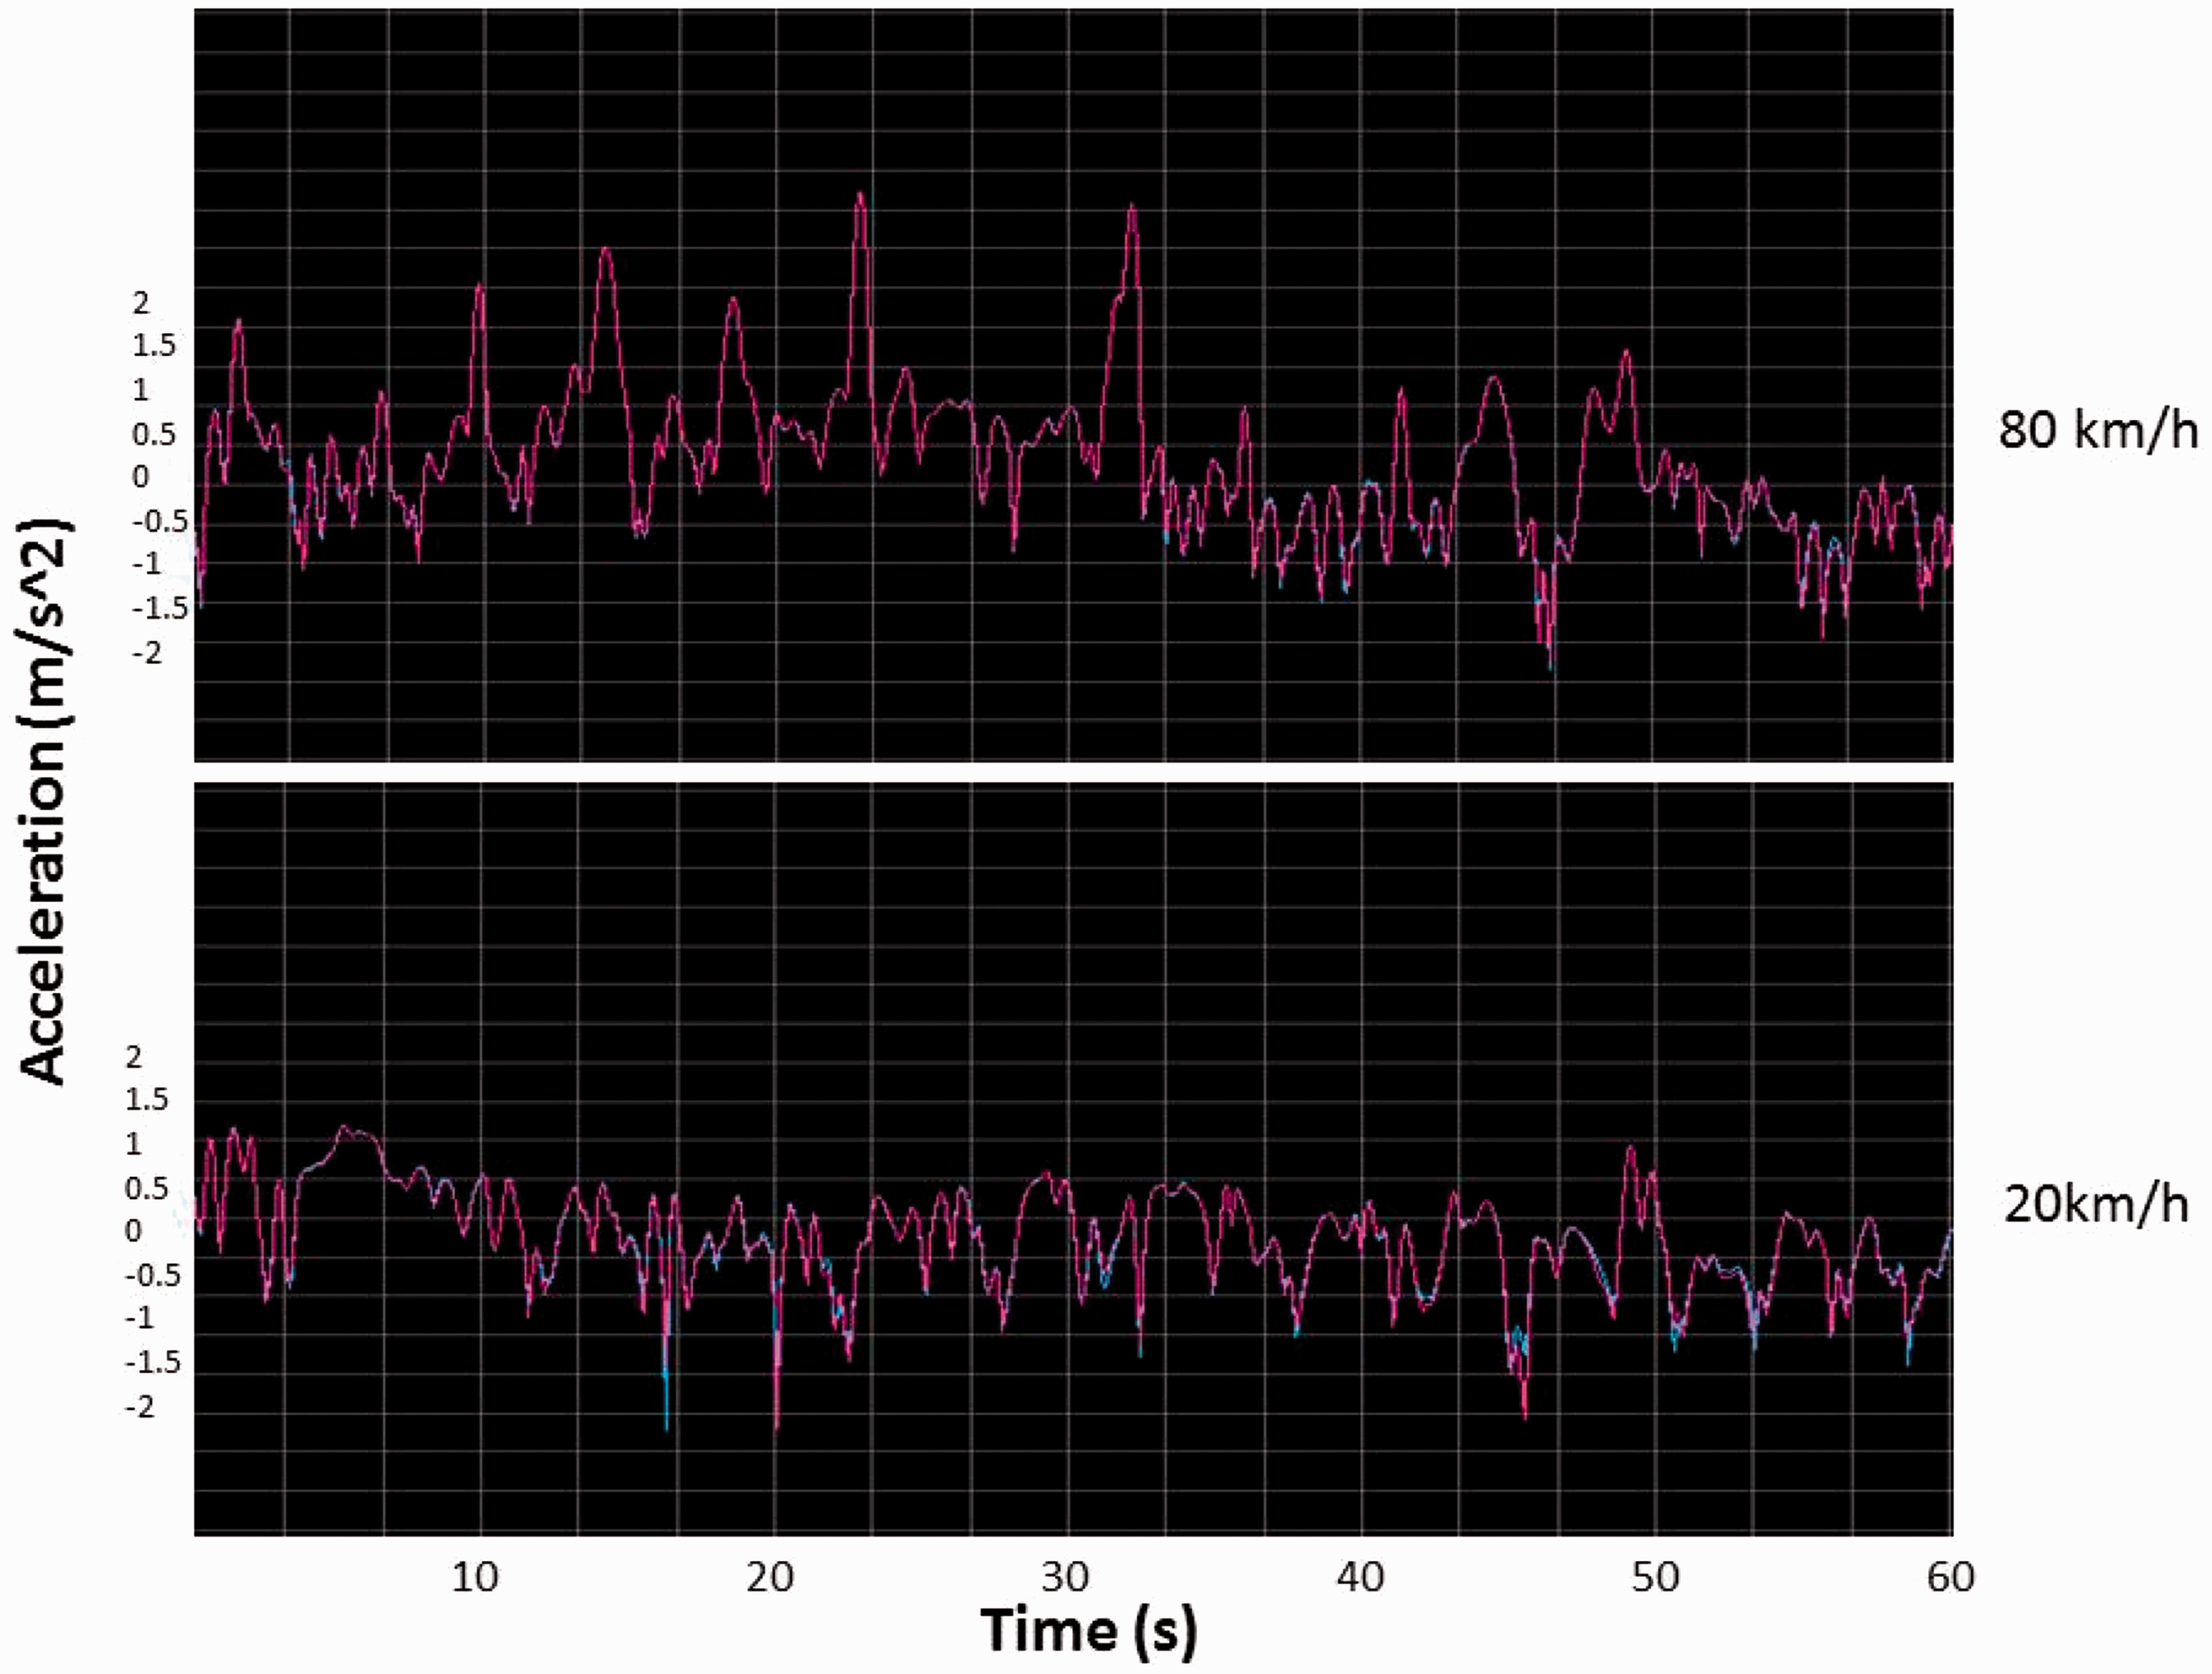
Vibration acceleration signals at the speeds of 80 and 20 m/s2 within 60 s.
Average value of WBV attributes at different speeds.
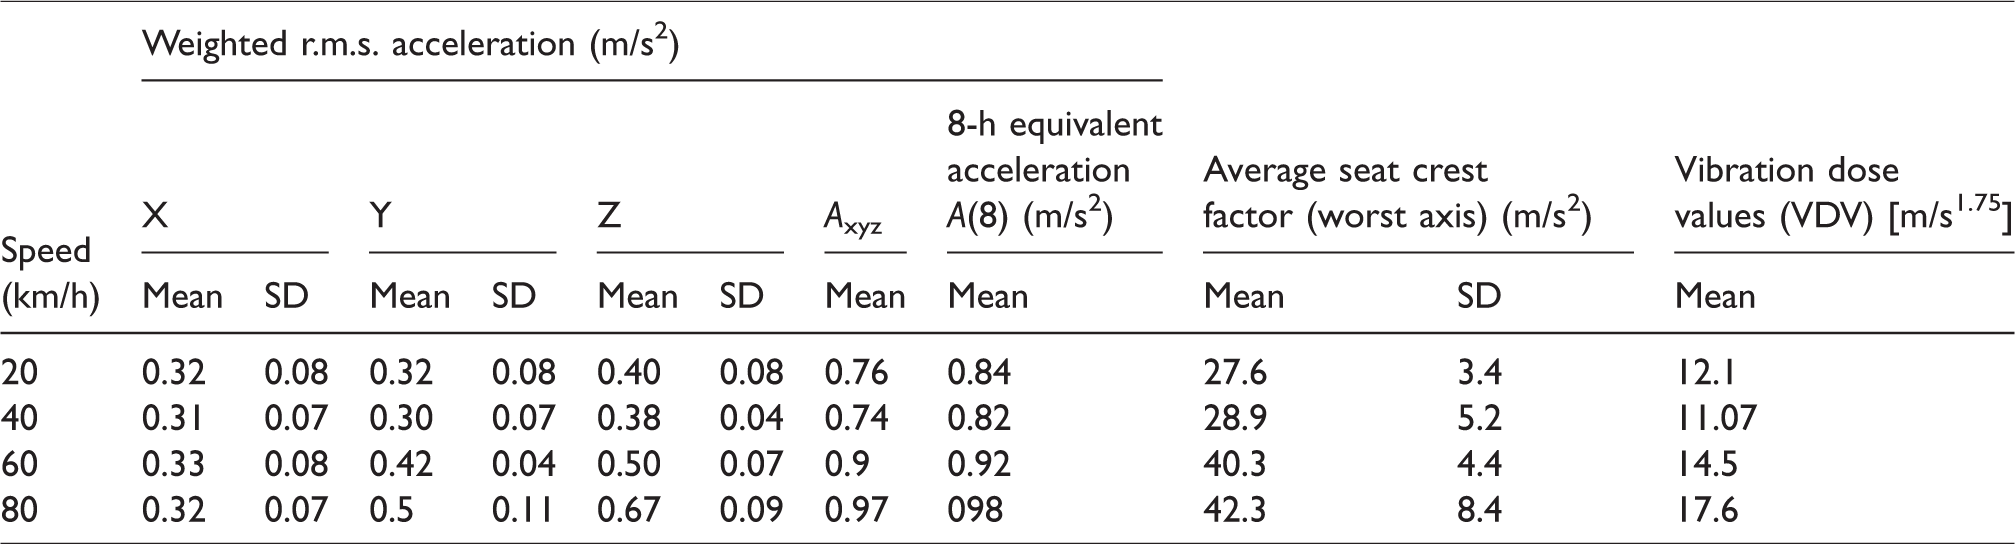
According to Table 2, the average value of the frequency-weighted r.m.s. acceleration varies in each axis. Its peak value was measured in the Z-axis. Thus, the intensity of vibration acceleration in this axis is dominant compared to that of the other axes. The highest average weighted r.m.s. acceleration values in the X- and Y-axes were measured at the speed of 80 km/h. The average value was 0.5 m/s2 in the Y-axis and 0.67 m/s2 in the Z-axis. The average frequency-weighted r.m.s. acceleration in the X-axis showed no significant difference in different speed levels studied. The highest 8-h frequency-weighted r.m.s. acceleration values were 0.92 m/s2 and 0.98 m/s2, respectively, measured at the speeds of 60 and 80 km/h. According to the standard ISO 2631–1, it can be noted that the driver of the Peugeot 405 at these speeds is exposed to the excessive WBV acceleration. Further, the 8-h equivalent frequency-weighted r.m.s. acceleration were within the health caution zone at speeds of 20 and 40 km/h. The CF was measured using peak acceleration and effective frequency-weighted acceleration (ar.m.s.) in the Z-axis, which had the highest intensity of vibration acceleration. The highest CF was 42.3 measured at the speed of 80 km/h. As the table suggests, the highest VDV was 17.6 m/s1.75 recorded at the speed of 80 km/h. This value is beyond the upper health caution limit (17 m/s1.75) recommended by ISO2631–1 standard. It should be mentioned that the DVD values at all speed levels were within the health caution zone. The lowest VDV recorded at the speed of 40 km/h was close to the lower limit of health caution zone (8.5 m/s1.75) while the peak value measued at the speed of 80 km/h was near the upper limit (17 m/s1.75). All quantitative variables, including frequency-weighted r.m.s. acceleration (ar.m.s.) in each of the axes X, Y, and Z, and resultant value of the three axes (Axyz), as well as 8-h equivalent frequency-weighted r.m.s. acceleration (A(8)) and VDV at different speed levels of 20, 40, 60, and 80 km/h had a normal distribution. Accordingly, one-way ANOVA and post hoc test were used to analyze the measured variables at a confidence level of 0.95. Table 3 gives the results of statistical tests.
One-way ANOVA model to compare the average values of the quantitatively variables at different speed levels.
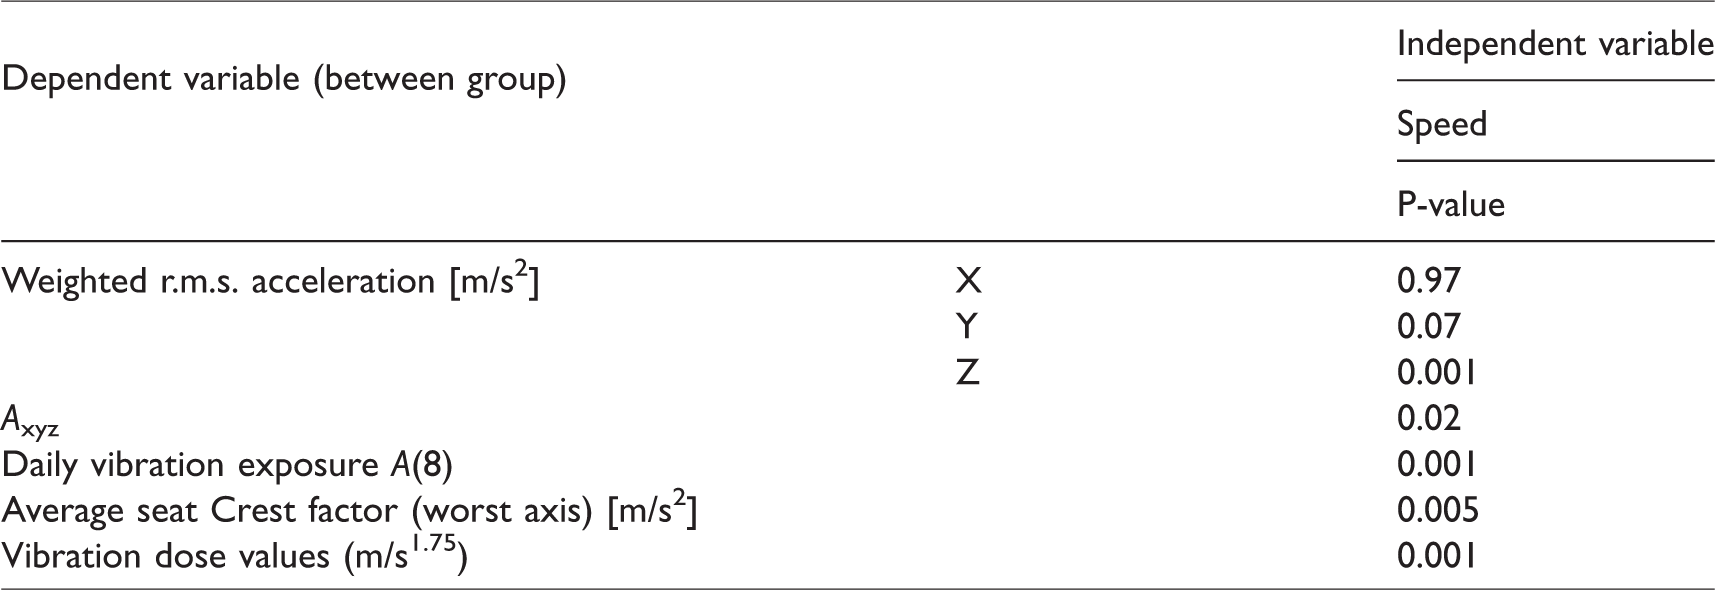
According to the results of one-way ANOVA and post hoc, no significant difference was observed in the r.m.s. acceleration of X- and Y-axes at each of the speed levels, and hence, it was concluded that speed has no effects on the frequency-weighted r.m.s. acceleration in these axes. However, the r.m.s. acceleration of Z-axis was significantly different at all speed levels, except for 60 and 80 km/h. With increasing speed, the average frequency-weighted r.m.s. acceleration increased dramatically in this axis. Furthermore, based on the results of post hoc test, the average resultant value of the three axes (Axyz) at the speed levels of 20 and 40 km/h were significantly lower than that of at speed 80 km/h. The average values of other variables (A(8), VDV, and CF) were significantly different at various speed levels of 20, 40, 60, and 80 km/h (P-value < 0.05). Increasing the speed of the vehicle resulted in a significant increase in A(8) (P-value < 0.05) so that for every 20 km/h increase in speed, A(8) increased approximately 0.1 m/s2 on average. Besides, the speed level significantly associated with VDV (P-value <0.05) so that the VDV was higher at high speeds. For every 20 km/h increase in speed, VDV increased about 0.5 m/s1.75 on average. Figure 4 shows the relationship between VDV and speed.
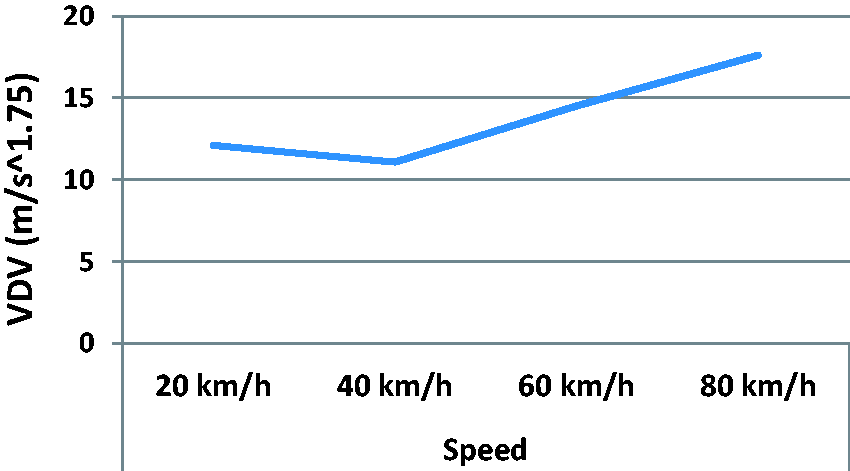
Relationship between vibration and speed.
According to Figure 4, if the driver drives only 8 h with each of the speeds, then the driver will be exposed with least amount of VDV at 40 km/h speed. Again, it is said that only 8 h of exposure at each speed, that exposure durations is considered equal time at each speed.
Discussion
Taxi drivers are subjected to prolonged exposure to WBV. A variety of factors affect the value of this type of vibration.1,2 This study outlined the effect of vehicle speed on different WBV attributes including ar.m.s., Axyz, A(8), and VDV. The results of this study showed that increase in the vehicle speed causes an increase in the value of most of the WBV attributes. So, it can be concluded that a taxi driver is exposed to higher levels of WBV at high speeds. If the driver drives only 8 h with each of the speeds, then the driver will be exposed with least amount of VDV at 40 km/h speed. This is in line with the findings of Uys et al.’s 14 study on suspension settings for optimal ride comfort of off-road vehicles at different speeds. According to their reports, increasing speed causes further transfer of frequency-weighted r.m.s. acceleration by the vehicle suspension system. They just outlined the impressibility of frequency-weighted r.m.s. acceleration and neglected other WBV attributes. This could be because their calculations were based on the simulated environment and there is the possibility that their simulations were not exactly close to reality. However, in this study, which was conducted in a real environment, the role of vehicle speed was evaluated effective on all of the vibration attributes including ar.m.s., Axyz, A(8), and VDV. The reason is that, at high speeds, feedbacks from the road surface exert greater force on the vehicle and this will cause increased vibration attributes. As mentioned earlier, several factors affect the value of WBV among drivers. Lakušić and Tkalčević Lakušić 5 examined the association between vibration and road roughness at the speeds of 80 and 40 km/h. Their results showed that at the speed of 40 km/h, vibration had a higher direct relationship with increasing roughness of road. This result is probably due to the fact that the tires will have more opportunity for contact with the roughness of road surface and pass unevenness of the road surface with a slower time. As a result, the car gets out of balance with less acceleration. Thus, according to the results of this study and similar literature, it is concluded that at high speeds, vibration acceleration on drivers’ whole body is more. Nguyen and Inaba 15 studied the amount of tractor drivers’ WBV at the speeds of 0.6, 1.6, and 2.6 m/s in each of the pressure modes of 80 and 330 PSI. According to their results, with increasing the vehicle speed to an average of 0.8 m/s, vibration acceleration will also be increased by 0.1 m/s2, on average. In the present study, it was also showed that averagely, for every 20 mph (5.5 m/s) increase in speed, the 8-h equivalent acceleration will be increased to approximately 0.1 m/s2. The probable reason for the difference in the speed levels, at which an increase of 0.1 m/s2 was recorded, may be the less weight of Peugeot 405 vehicle and less thickness and width of its tires compared to tractors. Less vehicle weight and tire width reduce vertical force of vehicle weight on the road and the contact area of the tires with roughness of road surface while on the move. As a result, at high speeds, the Peugeot 405 car will be affected by the roughness of road surface less than tractors.
In a study by Paddan and Griffin 16 on WBV in vehicles, it was revealed that frequency-weighted r.m.s. acceleration in Z-axis is dominant over the other axes. The same results were reported by Khavanin et al. 17 on subway drivers’ exposure to WBV. The present study, the amount of which is related to the vehicle speed so that at high speeds, acceleration value in Z-axis rises, more than other axes of X and Y. The reason for the increase in vibration acceleration with increasing the speed could be increased vibration frequency. Similar results indicate greater amount of vertical vibrations in vehicles. This may probably be due to the similarities of degrees of freedom in shock absorbers and other connections of tires to the vehicle body, which limit the movement of the vehicle against vibrations. According to the 8-h equivalent acceleration results for each of the speed levels used in this study, it is concluded that prolonged driving at high speeds can cause an increase in vibration acceleration. In other words, as the duration of exposure to vibration increases, the resulting cumulative effect will also be intensified. According to the results of the present study, vehicle speed is an important parameter in transmit of WBV to drivers and can leave harmful effects on human health.
Conclusion
The amount of vibration transmitted to the whole body of the Peugeot 405 taxi driver is sensitive to speed changes. A driver who is driving in a city at a slow speed will be exposed to lower amounts of WBV upper health caution limit. Given these results, it is suggested to be given full consideration to the role of speed factor while preparing vibration control schemes for passenger cars (such as Peugeot 405), for example, permissible speed limits reduced in highways and streets. Also, driving at speed of 40 km/h is recommended in roads.
Footnotes
Declaration of conflicting interests
The author(s) declared no potential conflicts of interest with respect to the research, authorship, and/or publication of this article.
Funding
The author(s) received financial support for the research, authorship, and/or publication of this article: This study as a Master's degree thesis (code: 28838) was supported by Environment Research Center of Tehran University of Medical Sciensec and Neyshabur University of Medical Sciences.