
Abstract
This paper develops a simulated dynamics model focused on the vibration coupling between a heavy-duty vehicle and the protective structure of the payload and verifies it through field experiments, which monitor the dynamic response under complex driving conditions such as uneven surfaces, turning, deceleration, and excessive gradients in real time. Compared with the results of the experiments and the simulations (with numerical methods), it can be found that the model can accurately estimate dynamic response of protective structures. The maximum acceleration at the bottom of the protective structure becomes larger as the amplitude of the road surface roughness increases. Furthermore, when the vehicle turns, the vibration of the protective structure increases sharply with braking, and when the vehicle begins decelerating, the lateral acceleration of the freight increases significantly in the first few seconds. In addition, the maximum acceleration at the bottom of the protective structure increases with the increase in speed when the heavy-duty vehicle is driving on a gradient, but that increase is small when the speed exceeds 80 km/h.
Keywords
Introduction
Heavy mechanical and electrical products often experience serious damage during transportation due to conditions such as uneven surfaces, turning, deceleration, and excessive gradients.1–4 Such damage exposes both the producer and the buyer to the risk of suffering significant economic losses,5–10 and due to the particularity of this type of product, re-customized production and transportation may result in significant time delay. Therefore, it is necessary to protect heavy mechanical and electrical products from being easily damaged during transportation. There have been some relevant studies carried out. Liu et al. 11 studied the mathematical relationship between road surface roughness and vibration in the car and established a quarter car model by applying Laplace transform and power spectral density (PSD). 12 A new mathematical model is proposed for the vibration transmission between layer suspension and road surface roughness. Meanwhile, Iwabuki et al. 13 conducted a vibration test by driving a test vehicle over a large bridge, while carefully checking the impact of bridge vibration and low-frequency noise on the vehicle. The experimental results for stress, displacement, vibration acceleration, and the low-frequency sound pressure level revealed that driving speed and vehicle suspension type were the most important factors in the generation and propagation of bridge vibration and low-frequency noise. Zhang 14 simplified the vehicle into a three-dimensional model, which sought to take account of the impact of the road’s four-wheel excitation difference on the body vibration, since this more truly reflects the actual vibration of the vehicle during driving. Bernad et al. 15 studied the forces exerted by goods in the course of transportation, given different stacking regimes, and transformed them into various changes in the shape, speed, and acceleration of the goods when internal excitation was applied during transportation. However, these researchers have mainly focused on the vehicle’s own vibration under ordinary road conditions, which does not consider the influential variables, such as complex driving conditions and the relationship between the vehicle and the protective packaging encompassing the cargo.
In the case of valuable heavy-duty electromechanical products, for example, protective structures are often used, and the flexibility of those structures can reduce the dynamic response caused by vibration and shock. Some work has been done in this area, however. For example, Weigel et al. 16 conducted experiments to study the vibration experienced when goods are transported with multi-layer stacking. They found that the vibration transmission rate of the goods in the resonance state can be reduced by choosing a pallet of greater rigidity, and a high-strength pallet can effectively reduce the resonance of the cargo. Yan et al. 17 sought to test the vibration isolation performance of a tubular sandwich engine mount (TSEM) in a trackless rubber tire vehicle (TRTV). The results showed that, compared to the vehicle equipped with a conventional bracket, the TSEM was associated with a reduction in the vertical acceleration of the vehicle. Fan et al. 18 studied and compared two types of protective structures based on ultra-high performance fiber concrete (UHPFRC). The results show that a protective structure with broken details between the inner and outer panels is better than a protective structure with connecting details. These studies focus on single-factor analyses of uneven road surfaces, turning, deceleration, and excessive gradients. That is because it is difficult to meet the complex load conditions and find suitable test sites at the same time during the test.19–21 In addition, the driver needs to be skilled enough to control the vehicle under the test conditions, which poses a difficult challenge. However, the protective structures can suffer more severe damage under complex loading conditions. To design safer protective structures, attention should first be paid to the vibrational interaction between the heavy vehicle and the protective structure, and more accurate inputs to the protective structure are needed.22–25 The SIMPACK simulation method26-29 is an effective method which is used in this study.
A simulated dynamics model is proposed, which is focused on the vibration coupling between a heavy-duty vehicle and the protective structure. And then the field experiments are conducted to monitor in real-time the dynamic response under complex driving conditions such as uneven surfaces, turning, deceleration, and excessive gradients. The experimental results and simulation results (numerical methods) are consistent, which showed that the simulated dynamics model can well evaluate the dynamic response of the protective structure under complex carrying conditions and provides a scientific basis for the better protection of cargo in heavy-duty vehicles.
Experimental equipment and method
Equipment
The purpose of this experiment was to test the dynamic response of heavy-duty vehicles and their protective structures. The test equipment was a JMC SXQ3250M5N-4 heavy-duty vehicle, and a bamboo-based structure commonly used to protect electromechanical products. The dimensions of this structure were 5600 mm × 1900 mm × 3120 mm. As shown in Figure 1, the horizontal beams at the upper and lower ends of the B and D axes, and the vertical columns, are the main load-bearing members, with a cross-sectional size of 250 mm × 120 mm. The remaining members are secondary load-bearing, with a cross-sectional size of 60 mm × 60 mm. Measuring points on the protective structure.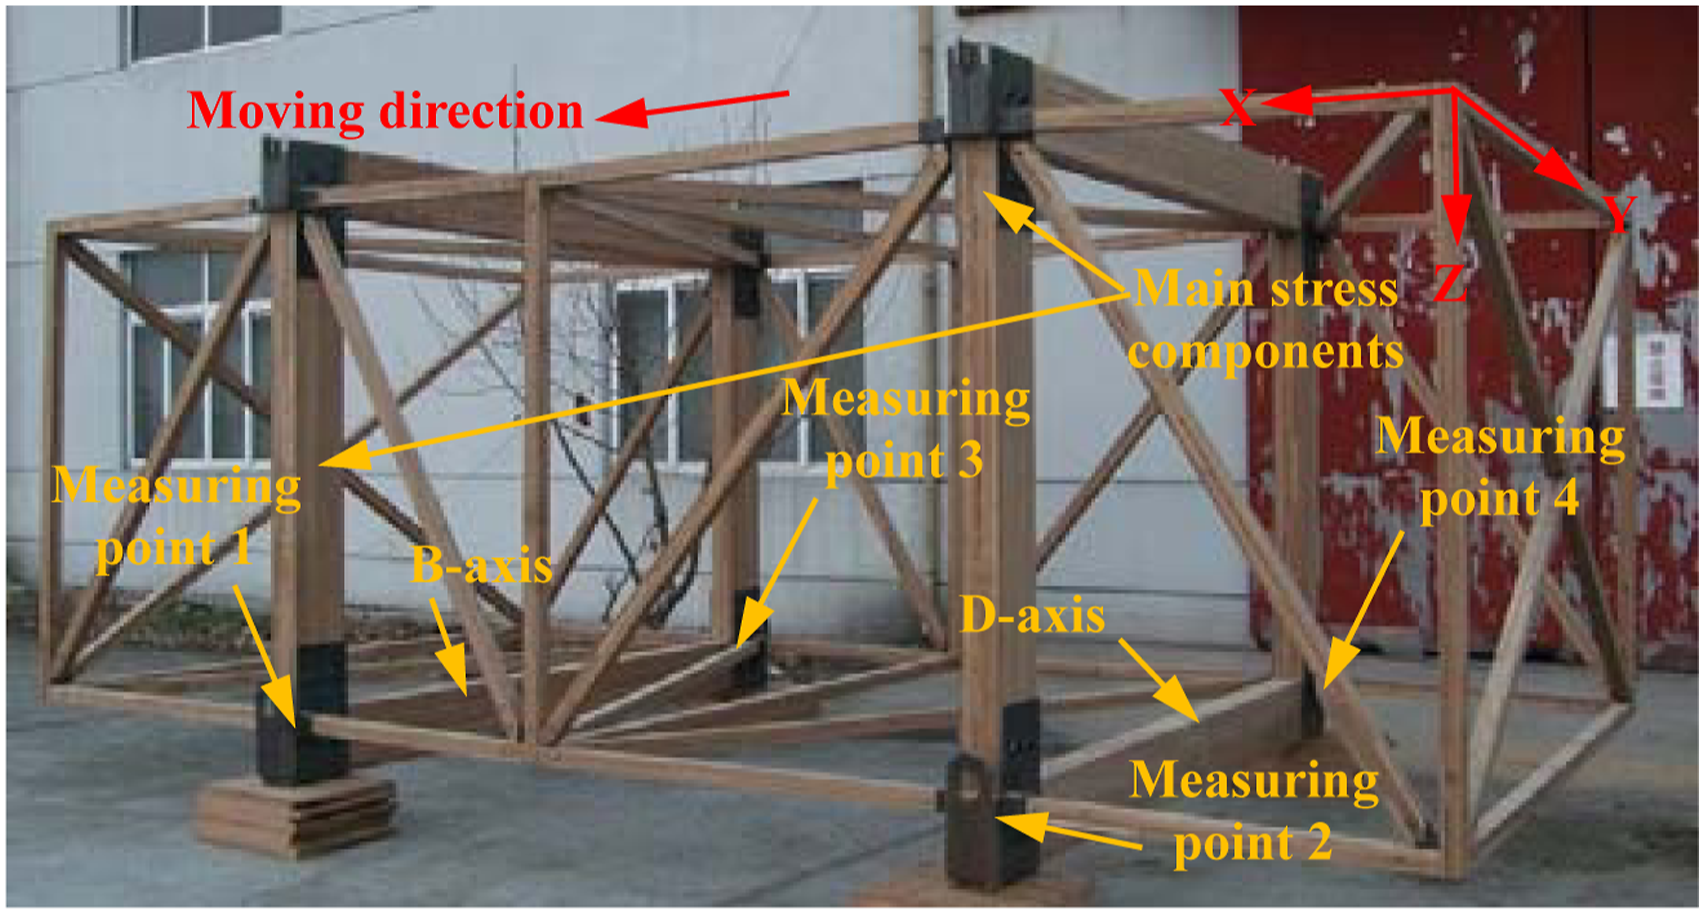
Method
The protective structure was placed in the vehicle cargo box. Then, a weight of 3000 kg cargoes (dimensions of 5000 mm × 1500 mm × 2500 mm) was placed in the protective structure symmetrically. Four measuring points were selected at the front left, rear left, front right, and rear right of the protective structure, following the method set out in the Chinese national “Automobile Ride Comfort Random Input Driving Test Method” (GB/T4970-1996). The layout of the measuring points is shown in Figure 1.
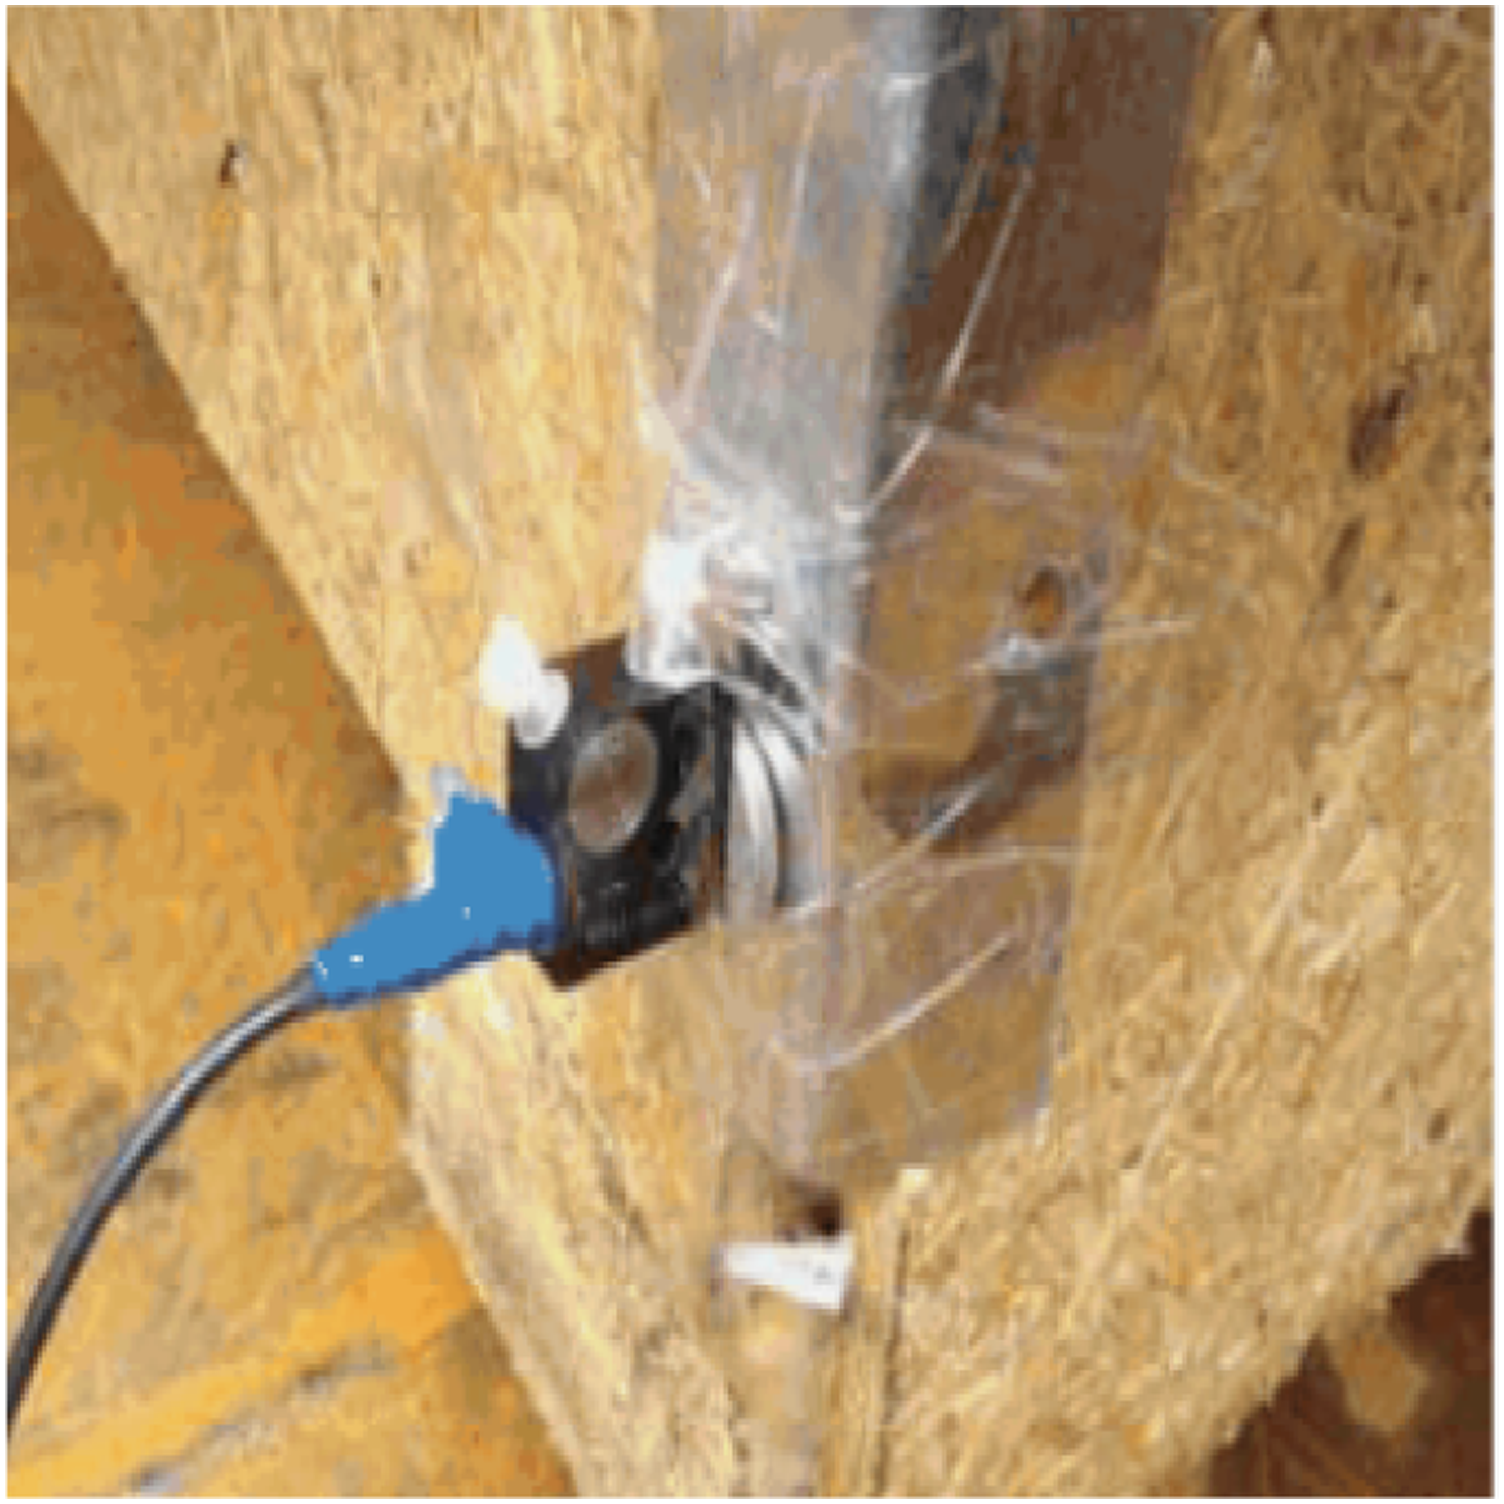
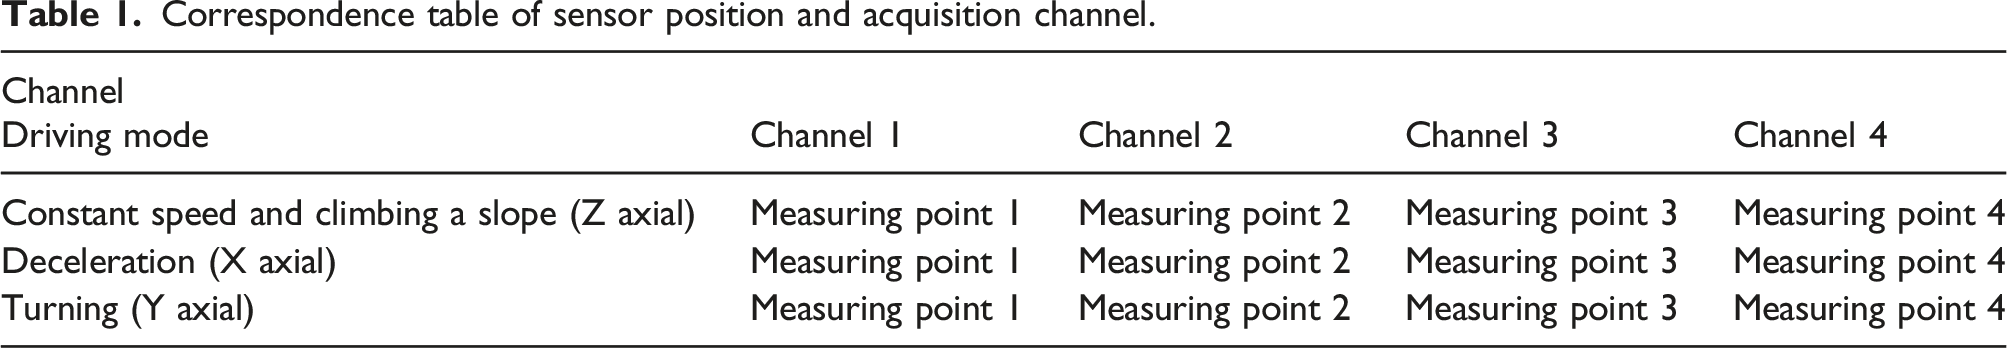
Piezoelectric accelerometer sensors (CA-YD-152A) were fixed by a pad at each measuring point in order to measure movement in different directions. These sensors can measure the acceleration in the X, Y, and Z axial directions. Its acquisition frequency is 0.5–5 kHz. Figures 2 and 3 show the sensors at the left rear and the front right of the protective structure, respectively. Data was collected from the sensors by means of four data acquisition channels: channel 1, channel 2, channel 3, and channel 4. Channel 1 and channel 3 collected the vibration data in the X direction, while channel 2 and channel 4 collected data in the Y direction. The correspondence between the data collection channels and the sensors is shown in Table 1. This test adopts the Adcars data acquisition and processing system, which consists of a computer, data acquisition box, and signal conditioner. The signal collected by the sensor is amplified by the signal conditioner during the test, and the signal data collected by the Adcars system is saved to the computer. The AD conversion precision of the system is 16 bit and the maximum sampling frequency is 256 kHz. Sensor layout of the left rear channel. Sensor layout of the right front channel. Correspondence table of sensor position and acquisition channel.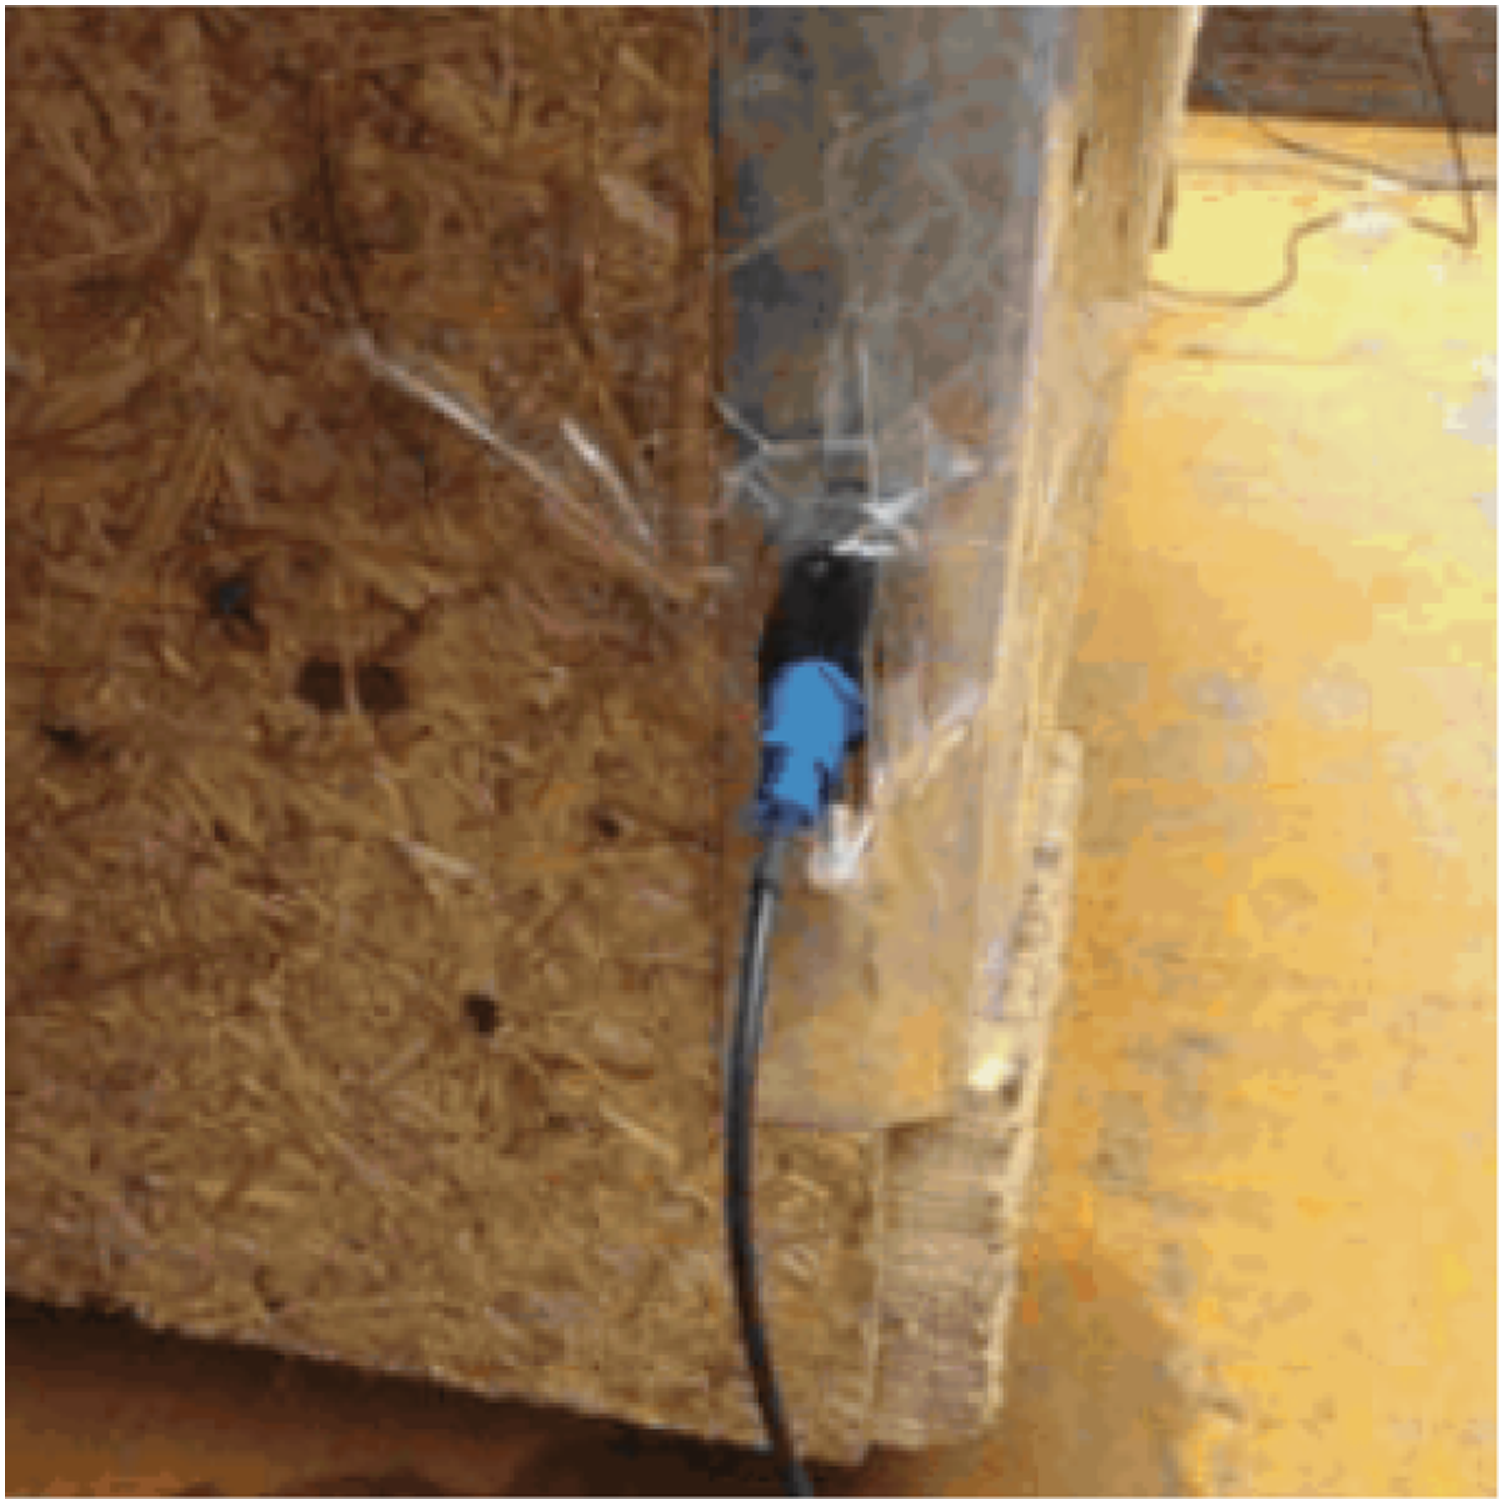
Acquisition frequency
To avoid frequency confusion, the acquisition frequency 
The acquisition time interval 
According to the requirements of vibration signal processing, the highest frequency
Results
Dynamic response analysis under different road conditions
In China, heavy-duty vehicles are limited to speeds of 40 km/h, 50 km/h, 60 km/h, and 70 km on roads of grades B, respectively. Considering that sometimes the vehicle speed will exceed the limited value, the maximum speed considered in this study is set at 80 km/h. The dynamic response of the protective structure was tested and analyzed when driving at speeds from 40 km/h to 80 km/h.
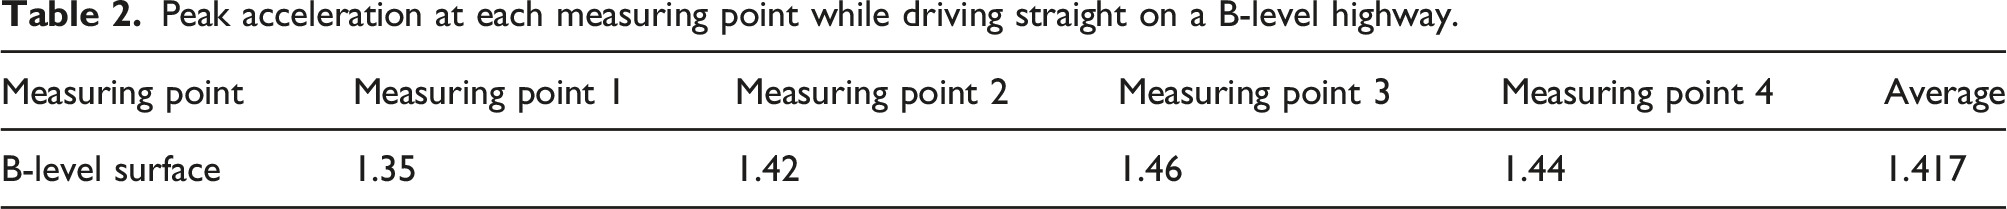
Figure 4 shows the acceleration obtained at measuring point 2 when the truck was driving at a constant speed of 60 km/h on a Class B road. It can be seen from the figure that the peak acceleration of the protective structure on the B-level road surface was 1.42 m/s2. The acceleration peak values of other measuring points are shown in Table 2. Measurement of acceleration at point 2 while driving straight on a B-level highway. Peak acceleration at each measuring point while driving straight on a B-level highway.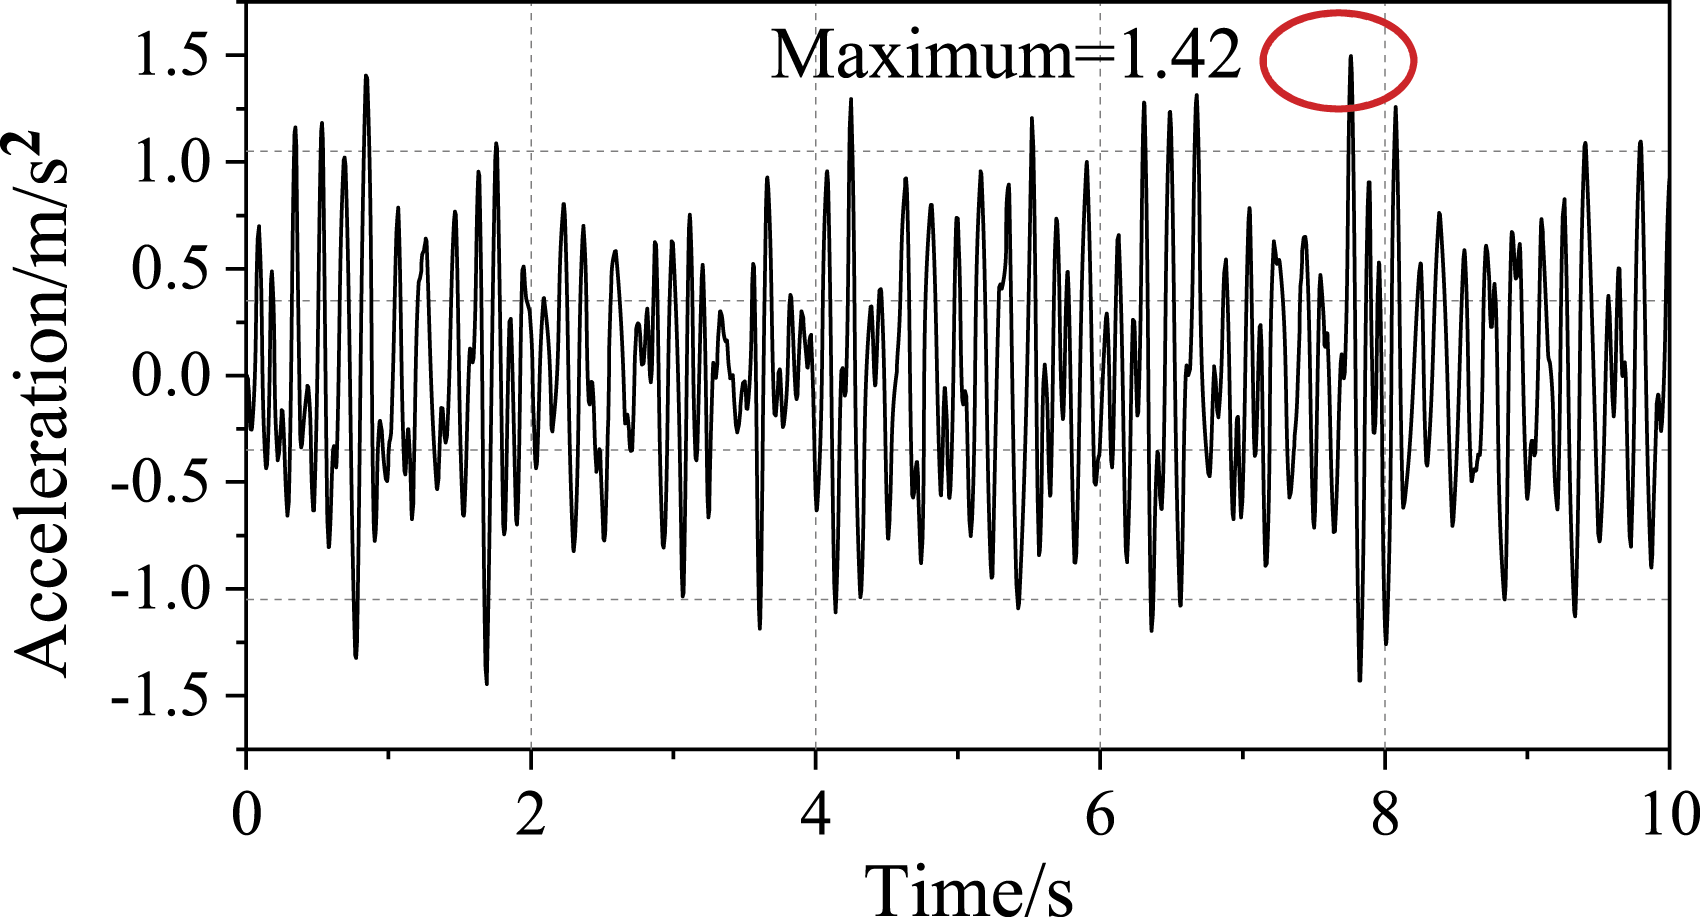
Dynamic response analysis when turning
Turning is a very common situation when driving a vehicle. 30 In this section, the dynamic response in turning situations is studied. The test vehicle was driven on B roads and decelerated from 40 km/h, 50 km/h, 60 km/h, 70 km/h, and 80 km/h to 30 km/h while executing a continuous curve. The test distance was 200 m and the radius is 30 m.
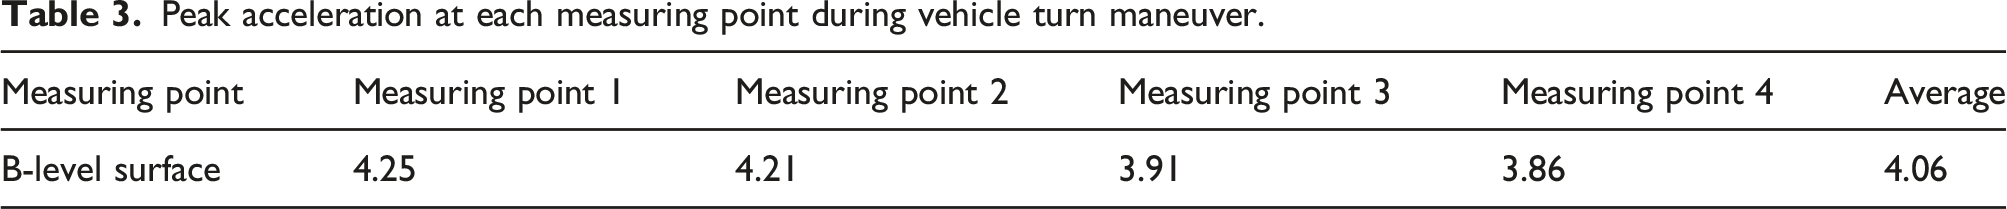
Figure 5 is the acceleration change diagram of measuring point 2 for a turn on a Class B road while the vehicle speed was reduced from 60 km/h to 30 km/h. It can be seen from the figure that the acceleration of the protective structure in the y direction increased sharply at the beginning of the turn, with a peak acceleration of 4.21 m/s2. The peak acceleration values of other measuring points are shown in Table 3. Measurement of acceleration at point 2 during vehicle turn maneuver. Peak acceleration at each measuring point during vehicle turn maneuver.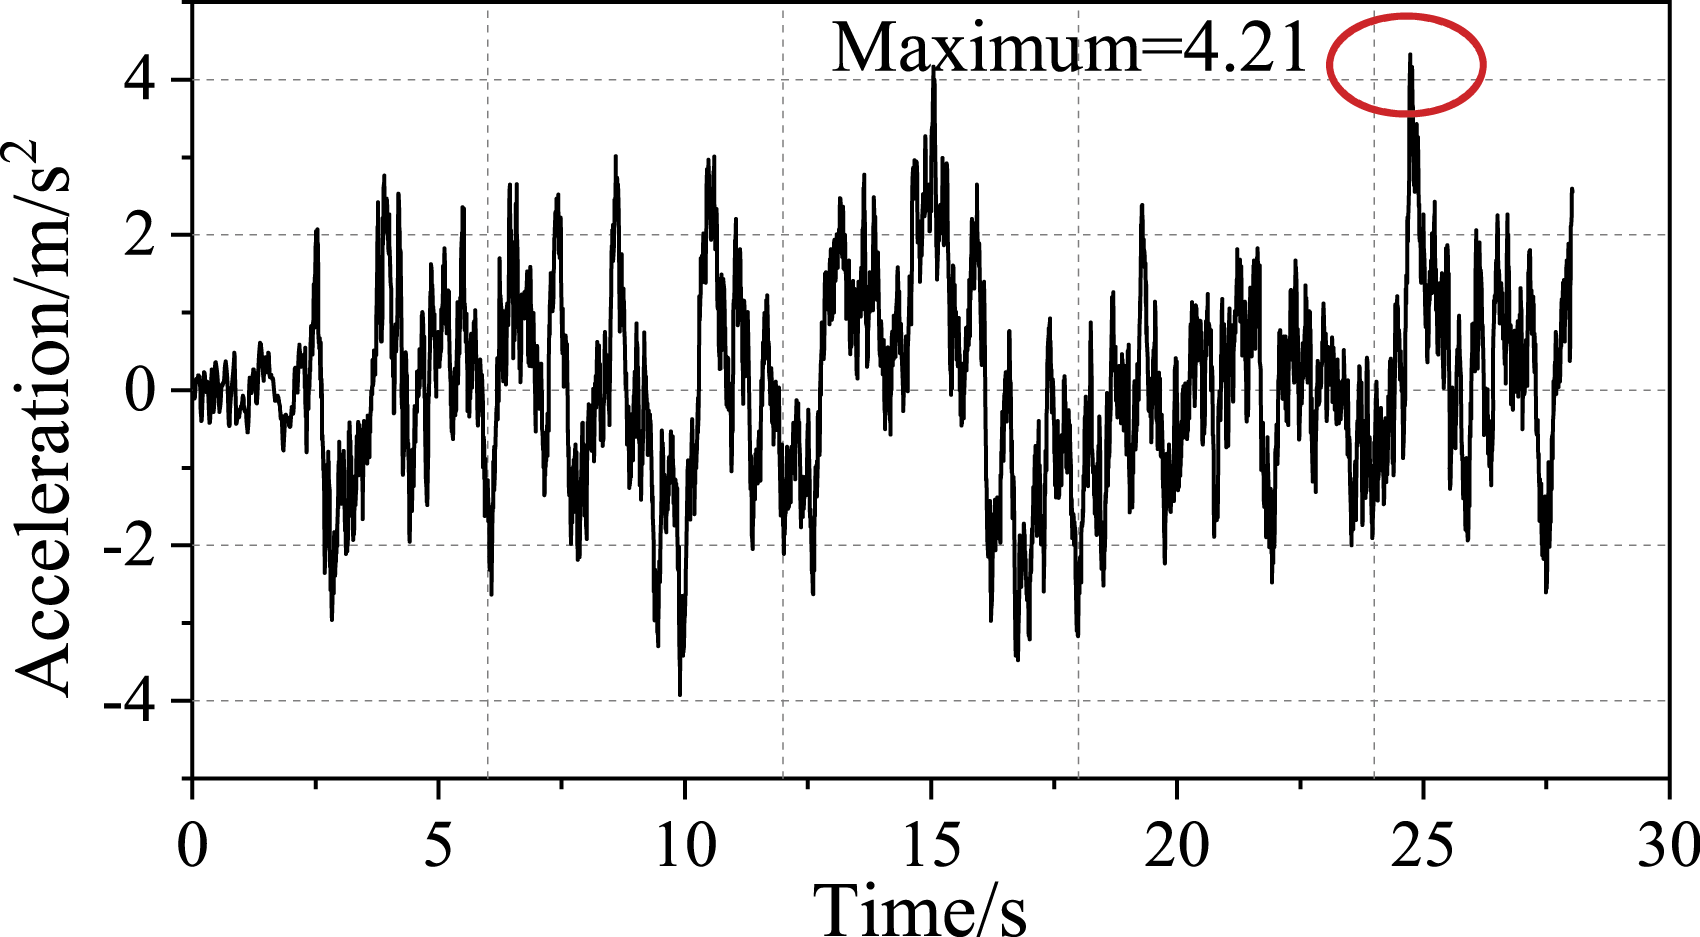
Dynamic response analysis when decelerating
This test is a vibration test when the vehicle is decelerating. The vehicle was driven on B roads, and the speed was reduced from 40 km/h, 50 km/h, 60 km/h, 70 km/h, and 80 km/h respectively, to a stop. The driving distance during deceleration was 100 m.
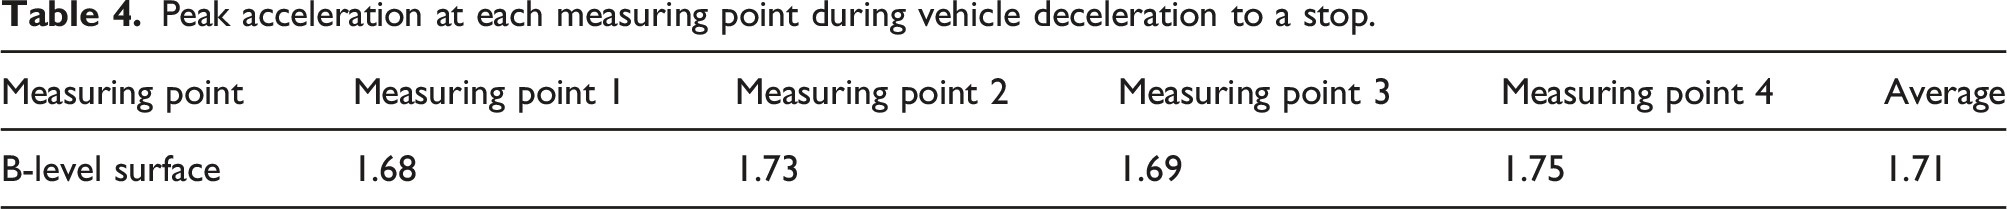
Figure 6 is the acceleration change diagram for measuring point 2 when the vehicle was decelerated from 60 km/h to a stop on a B-level road. It can be seen from Figure 7 that (1) the longitudinal acceleration of the protective structure was relatively stable before the car decelerated; (2) when the car just started to decelerate, the longitudinal acceleration of the protective structure increased significantly, with a peak acceleration of 1.73 m/s2. Subsequently, the longitudinal acceleration decreased as the speed of the car decreased. The peak acceleration values of other measuring points are shown in Table 4. Measurement of acceleration at point 2 during vehicle deceleration to a stop. Measurement of acceleration at point 2 when driving up a slope. Peak acceleration at each measuring point during vehicle deceleration to a stop.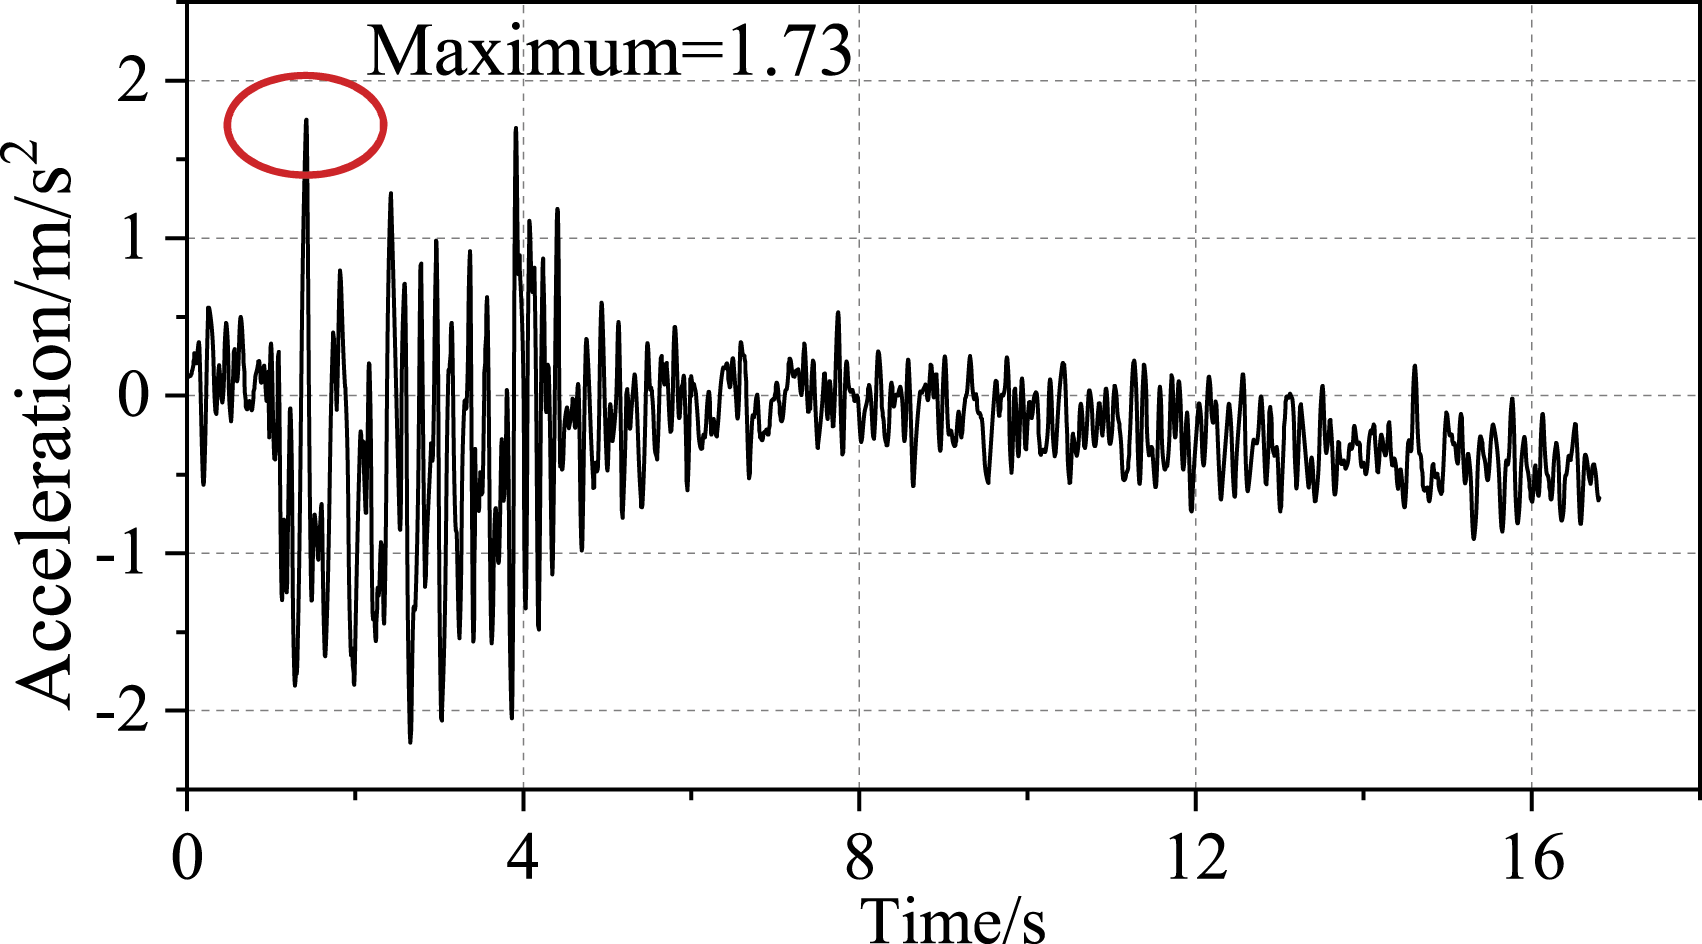
Dynamic response analysis when ascending a slope
Climbing a hill (slope) is a common driving maneuver. 31 This test carried out a dynamic response analysis when ascending a slope 30 m long, with rises of 0.5 m, 1 m, 1.5 m, and 2 m. Experiments were conducted at constant speeds of 50 km/h, 60 km/h, 70 km/h, and 80 km/h.
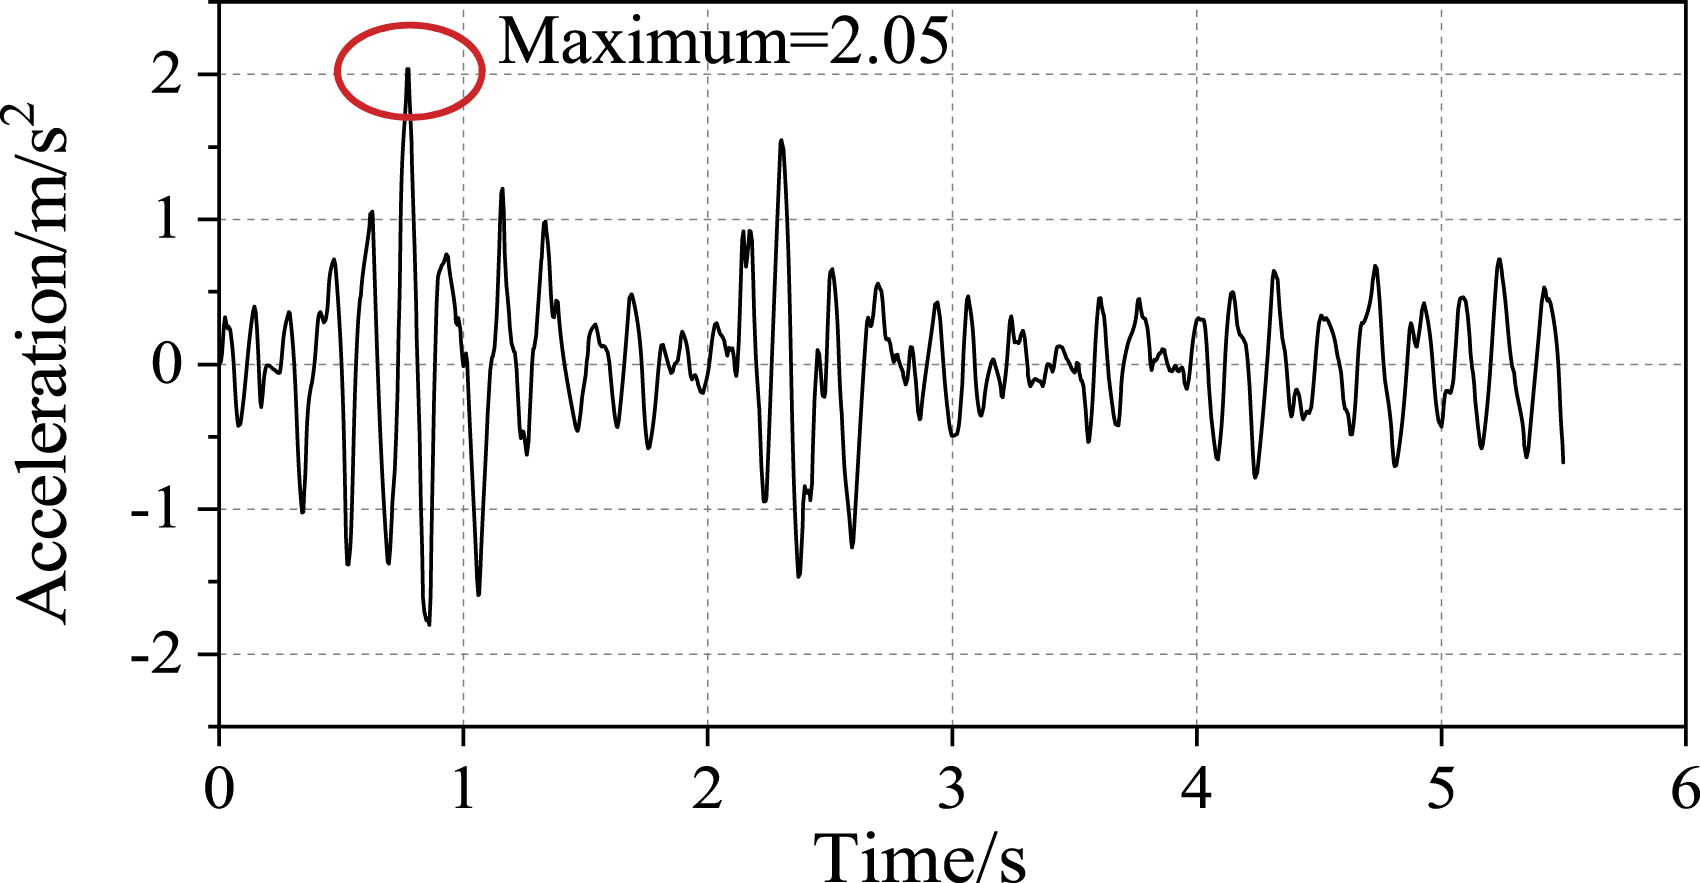
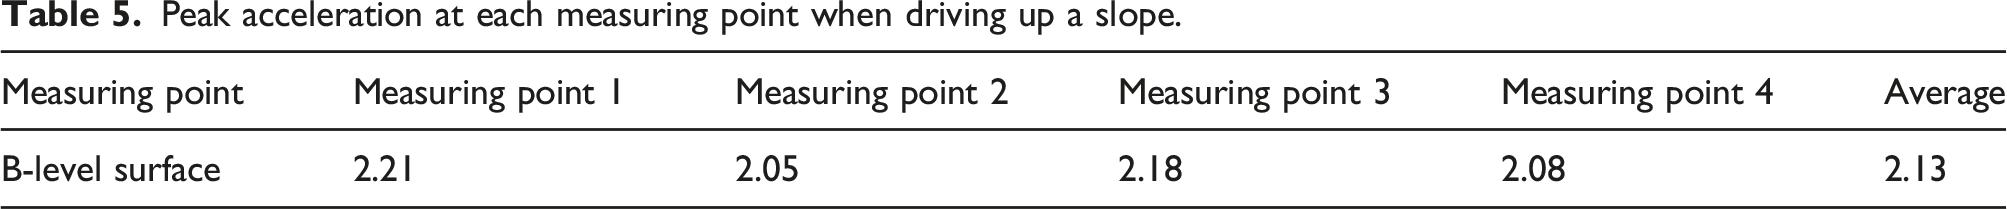
Figure 7 is the acceleration change diagram for measuring point 2 when the vehicle was driving up a slope of length 30 m and height 1 m (gradient = 3.3%) at a speed of 60 km/h. It can be seen from Figure 8 that the maximum acceleration value at measuring point 2 increased significantly when the front and rear wheels of the vehicle drove up the slope, and the peak acceleration was 2.05 m/s2. In other cases, the peak acceleration value was small. The peak acceleration values of other measuring points are shown in Table 5. Simulation frameworks of random pavement excitation. Peak acceleration at each measuring point when driving up a slope.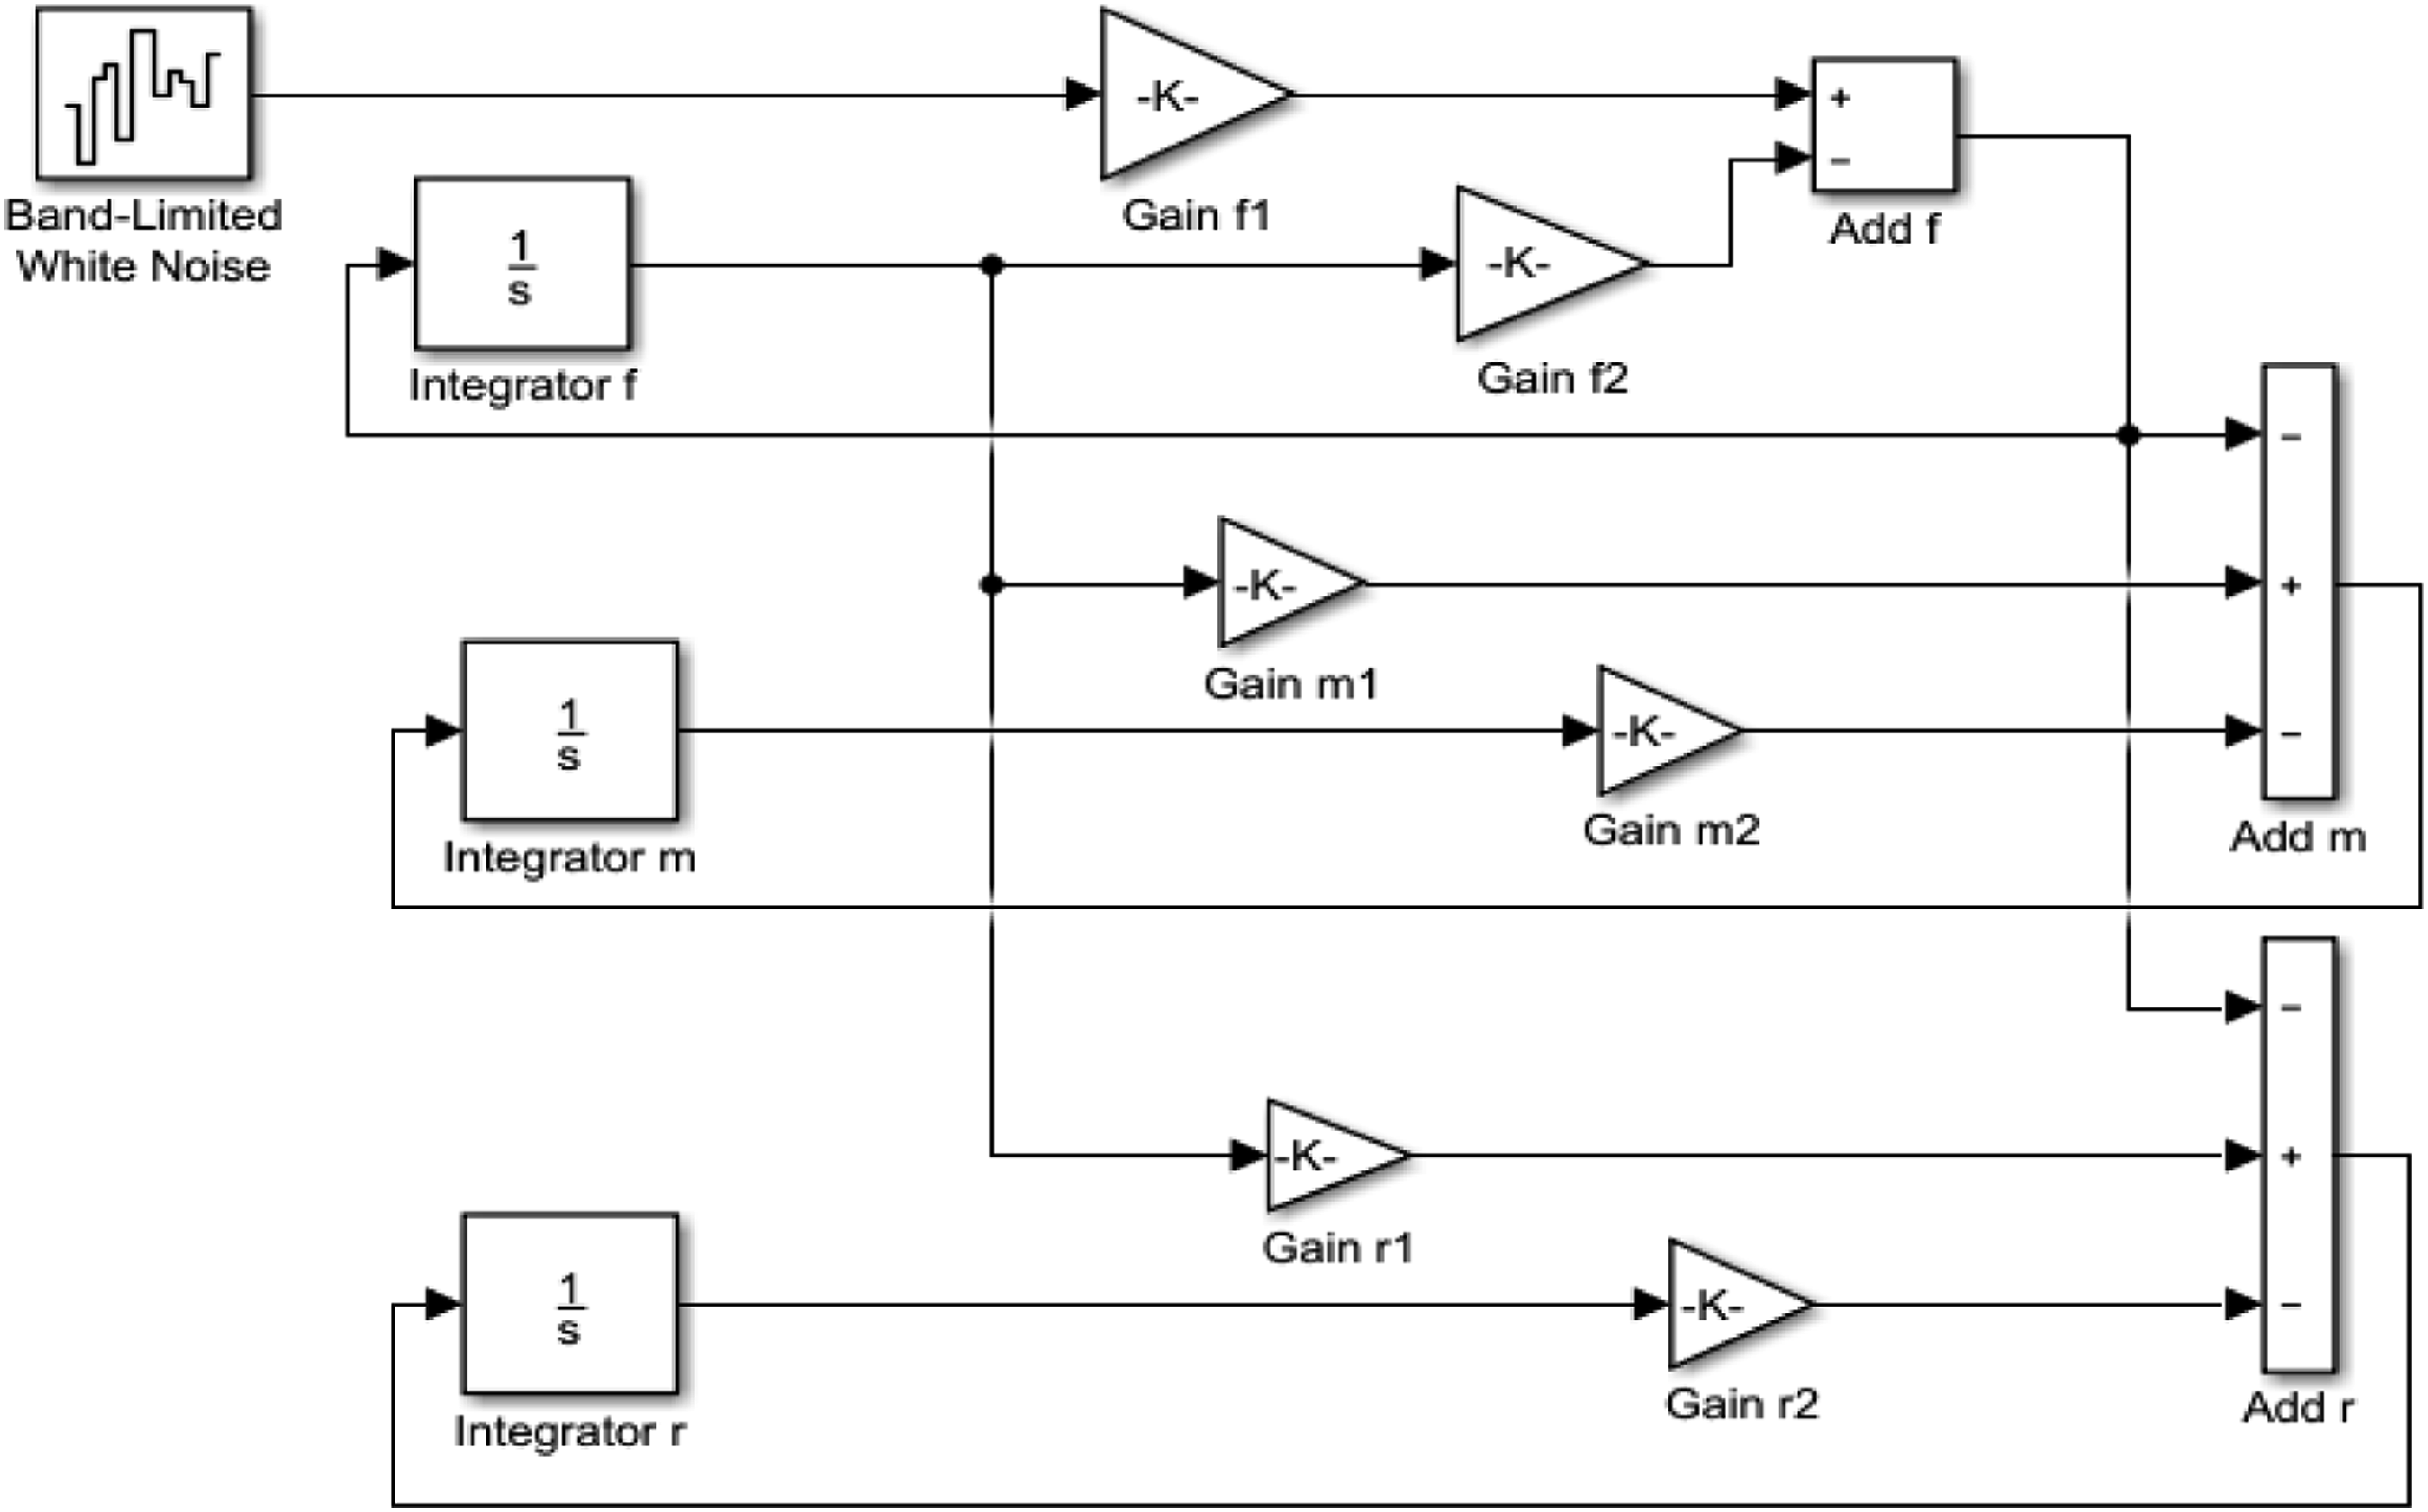
Dynamic response analysis using SIMPACK simulation
Pavement excitation model based on SIMULINK
During the signal process, there have been many studies on the power spectrum analysis model. Currently, the time-domain research methods for pavement excitation are mainly divided into theoretical simulation methods and experimental verification methods. Compared with theoretical simulation, the experimental verification method is more intuitive and effective, but it needs a lot of time and money, and it is not suitable for the early stage of research. Therefore, the theoretical simulation method is the most common method. For the simulation method of the power spectral density input by the pavement, scholars at home and abroad have done many kinds of studies and verification, which can be mainly classified into the following types: filter white noise method, harmonic superposition method, Poisson’s method, Fourier transform method, time series analysis method, fractal analysis method, and so on.
Because the filtering white noise analysis method has the advantages of small calculation amount and fast operation speed, and it is suitable for the simulation of the standard pavement excitation model, so the filtering white noise method can be used to simulate the pavement excitation in this paper. The simulated generation method for filtered white noise pavement excitation can be derived as follows


Assuming 


Substituting equations (8) and (9) into equation (6), the frequency response function of the system can be obtained as follows
Based on the frequency response function, the differential equation for the system can be obtained as follows
The equation of state of the linear system can be obtained based on equation (11)
Then

The random pavement excitation
Considering that the front wheel, middle wheel, and rear wheel have a certain hysteresis under pavement excitation, a pavement excitation time-domain model based on filtered white noise is established in the SIMULINK platform, and its block diagram is shown in Figure 8.
Random pavement excitation
According to statistical data, the pavement grades are basically within A to C grades in China. In this paper, random pavement excitation simulations are carried out on A grade, B grade, and C grade pavement. In the SIMULINK simulation, it is considered that the car is driving at a speed of 30 km/h and 60 km/h on the pavement grades A, B, and C, respectively. The random pavement excitation is shown in Figure 9. It can be seen from the figures that with the increase of the pavement grade, the pavement excitation increases, which indicates that the pavement roughness increases. Pavement of wheels driving on different grades of pavement: (a) front wheel (v = 30 km/h), (b) middle wheel (v = 30 km/h), (c) rear wheel (v = 30 km/h), (d) front wheel (v = 60 km/h), (e) middle wheel (v = 60 km/h), and (f) rear wheel (v = 60 km/h).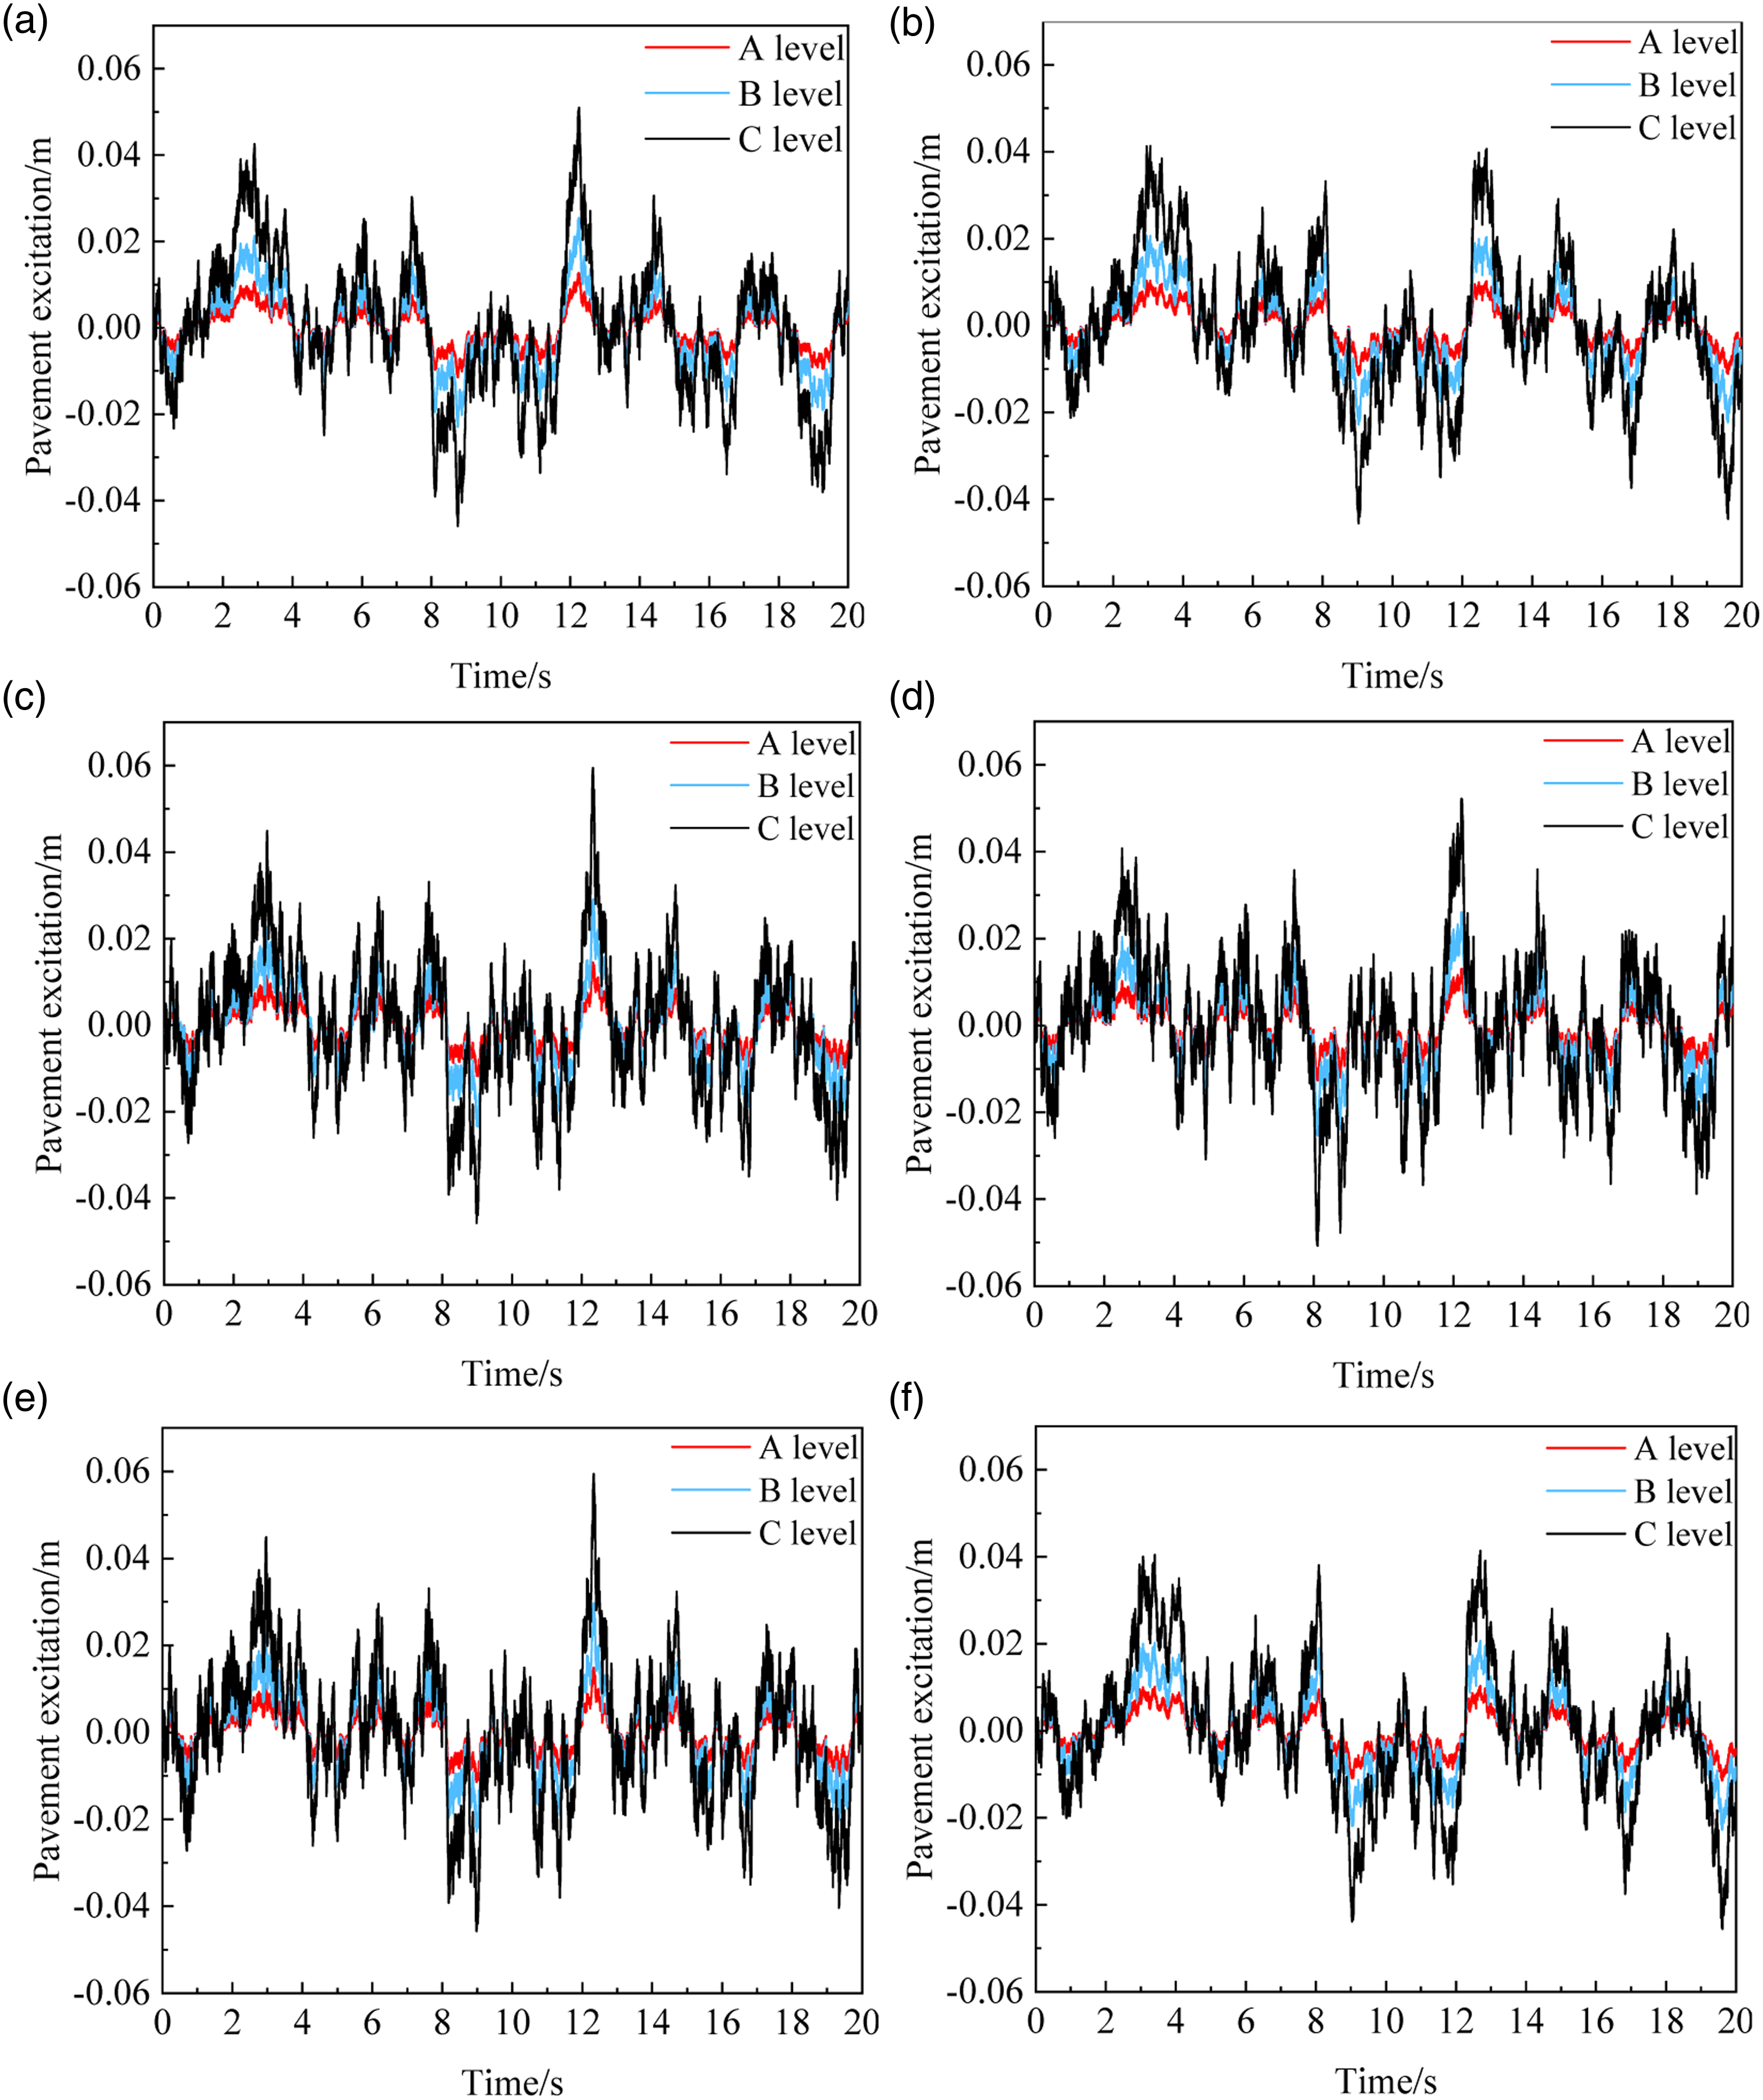
Pavement excitation verification
The pwelch function is called to process the pavement excitation obtained by simulation, and its power spectral density curve is obtained, which is compared with the standard power spectral density for verification. Due to the large proportion of grade and grade roads in China, taking the front wheel excitation when the vehicle speed of 60 km/h is driving on the B grade and C grade roads as an example, the simulated power spectral density is compared with the standard power spectral density, as shown in Figure 10. It can be seen from the figure that the power spectral density of the pavement excitation is in good agreement with the standard power spectral density, indicating that the pavement excitation model based on SIMULINK is credible. Power spectrum density of pavement: (a) Class B of pavement and (b) Class C of pavement.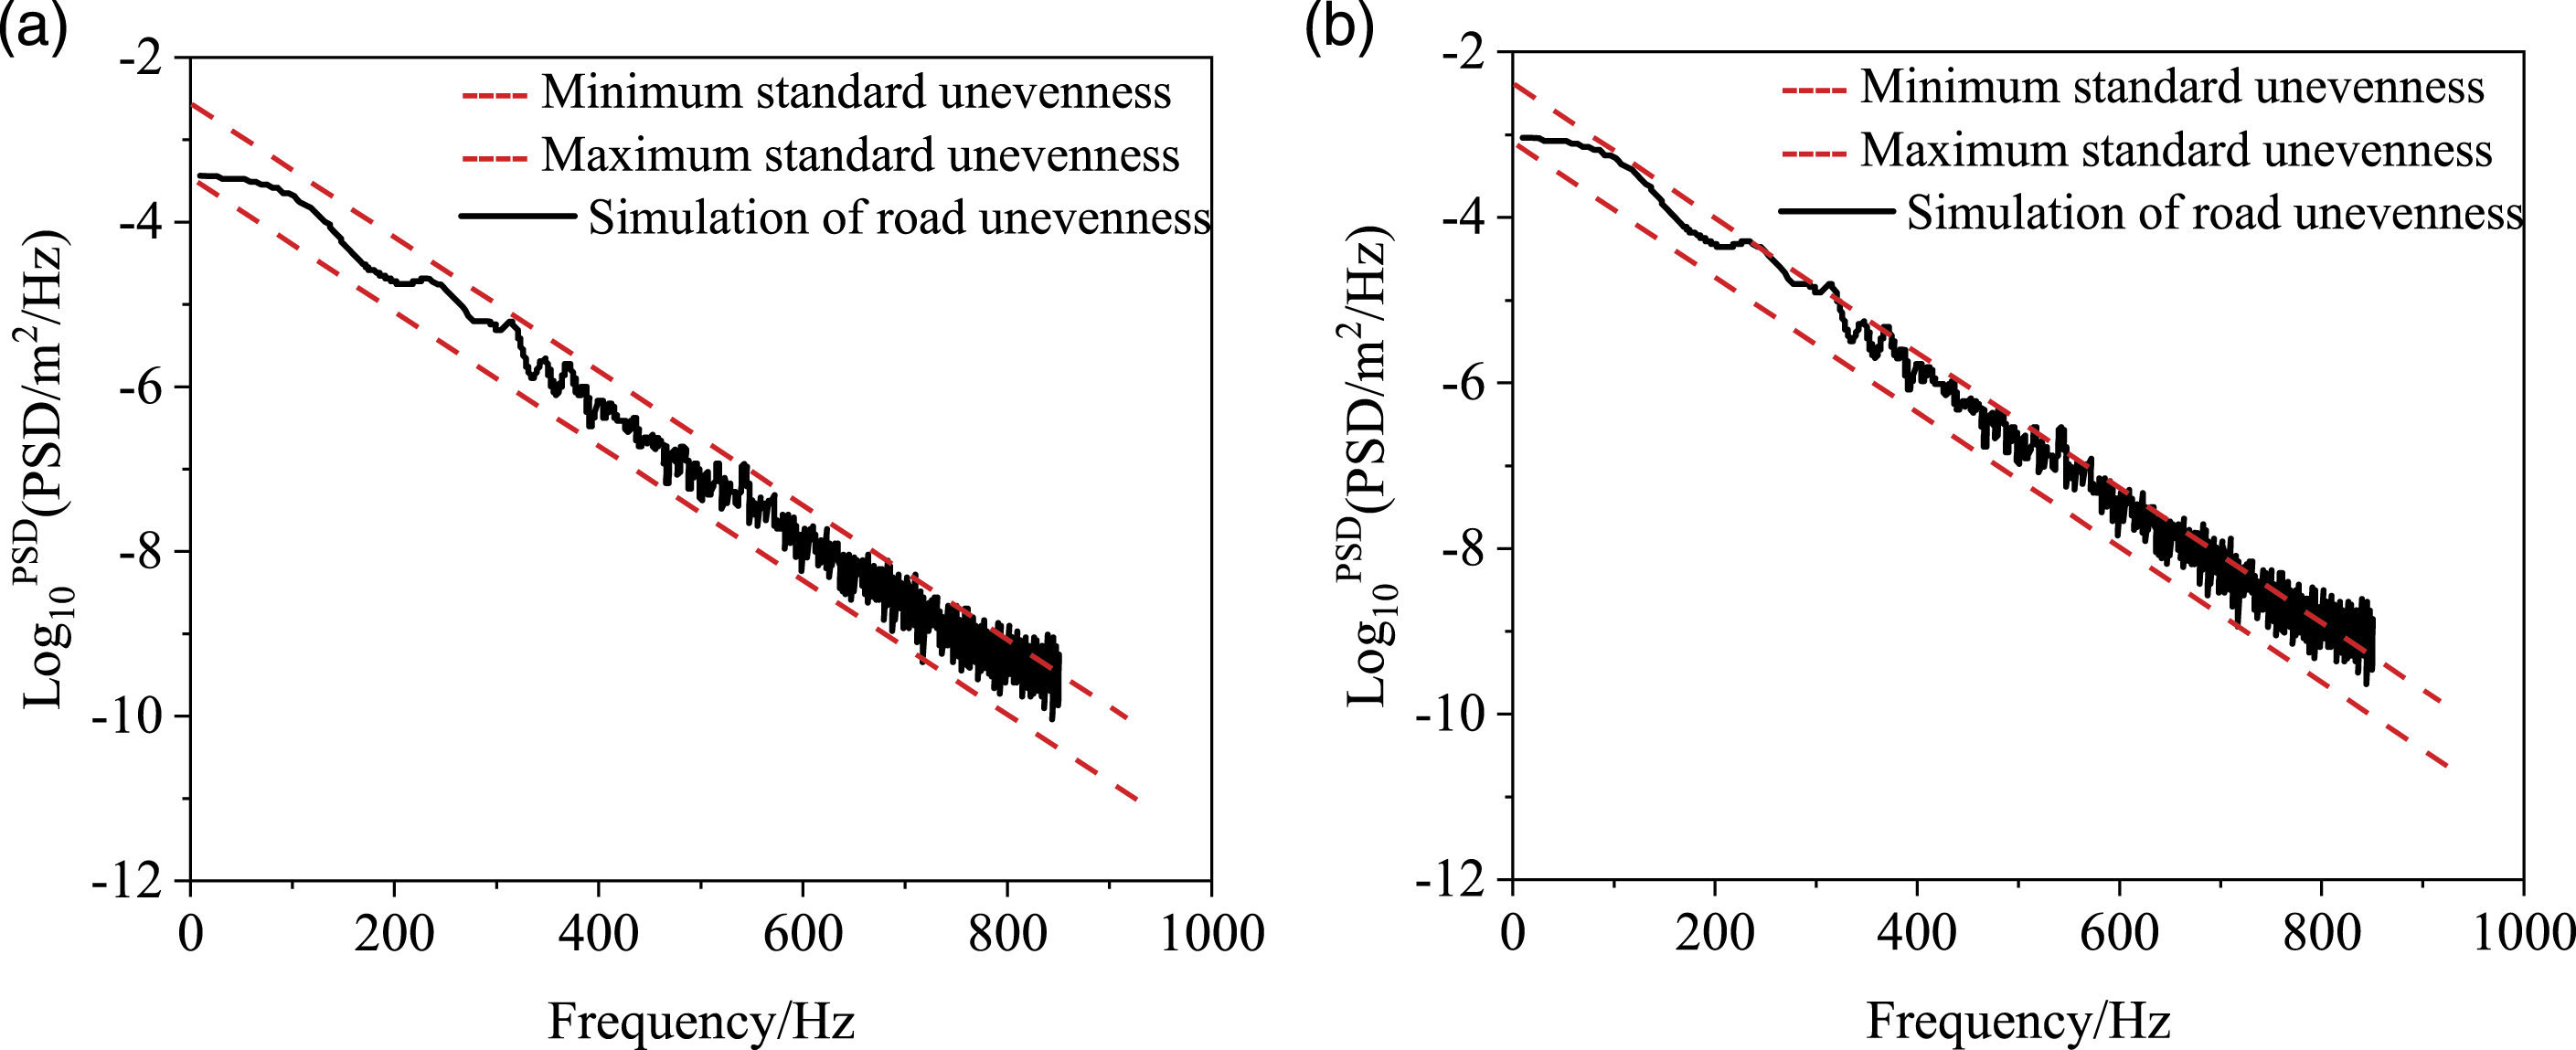
Model establishment and verification
SIMPACK was used to simulate the SXQ3250M5N-4 heavy-duty vehicle. The model was verified by comparing the measured vertical vibration acceleration of the vehicle body with the vertical vibration acceleration simulated by the SIMPACK multi-body model. On this basis, the regularity of the dynamic response of the protective structure was studied under different road surface conditions and maneuvers. The SIMBEAM module in the SIMPACK software was used to establish a leaf spring model with equivalent stiffness. The leaf spring of the heavy-duty vehicle was modeled as a Timoshenko beam type. The elastic part on both sides of the leaf spring was regarded as a flexible body. The other part was regarded as a rigid body. A structural model of the front suspension frame was developed as shown in Figure 11. The same method was used to build a balanced suspension structure model, as shown in Figure 12. Front suspension structure model. Balanced suspension structure model.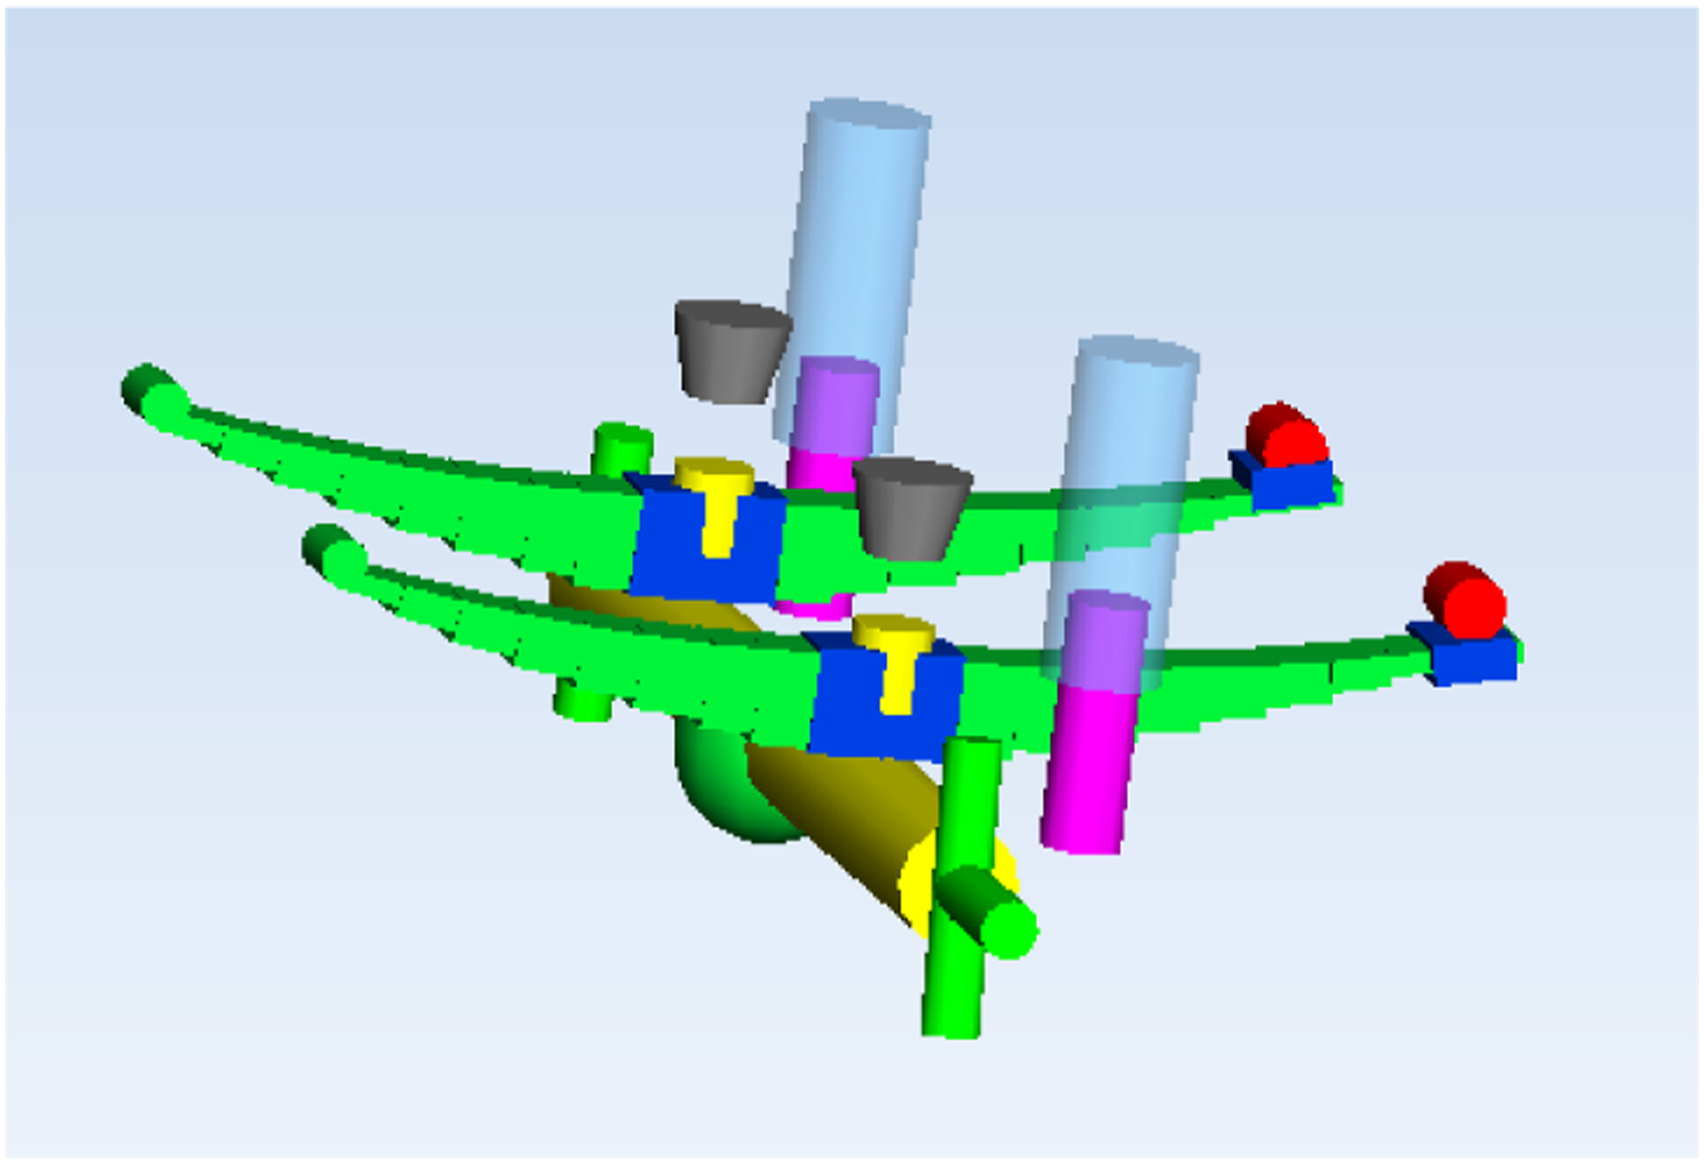
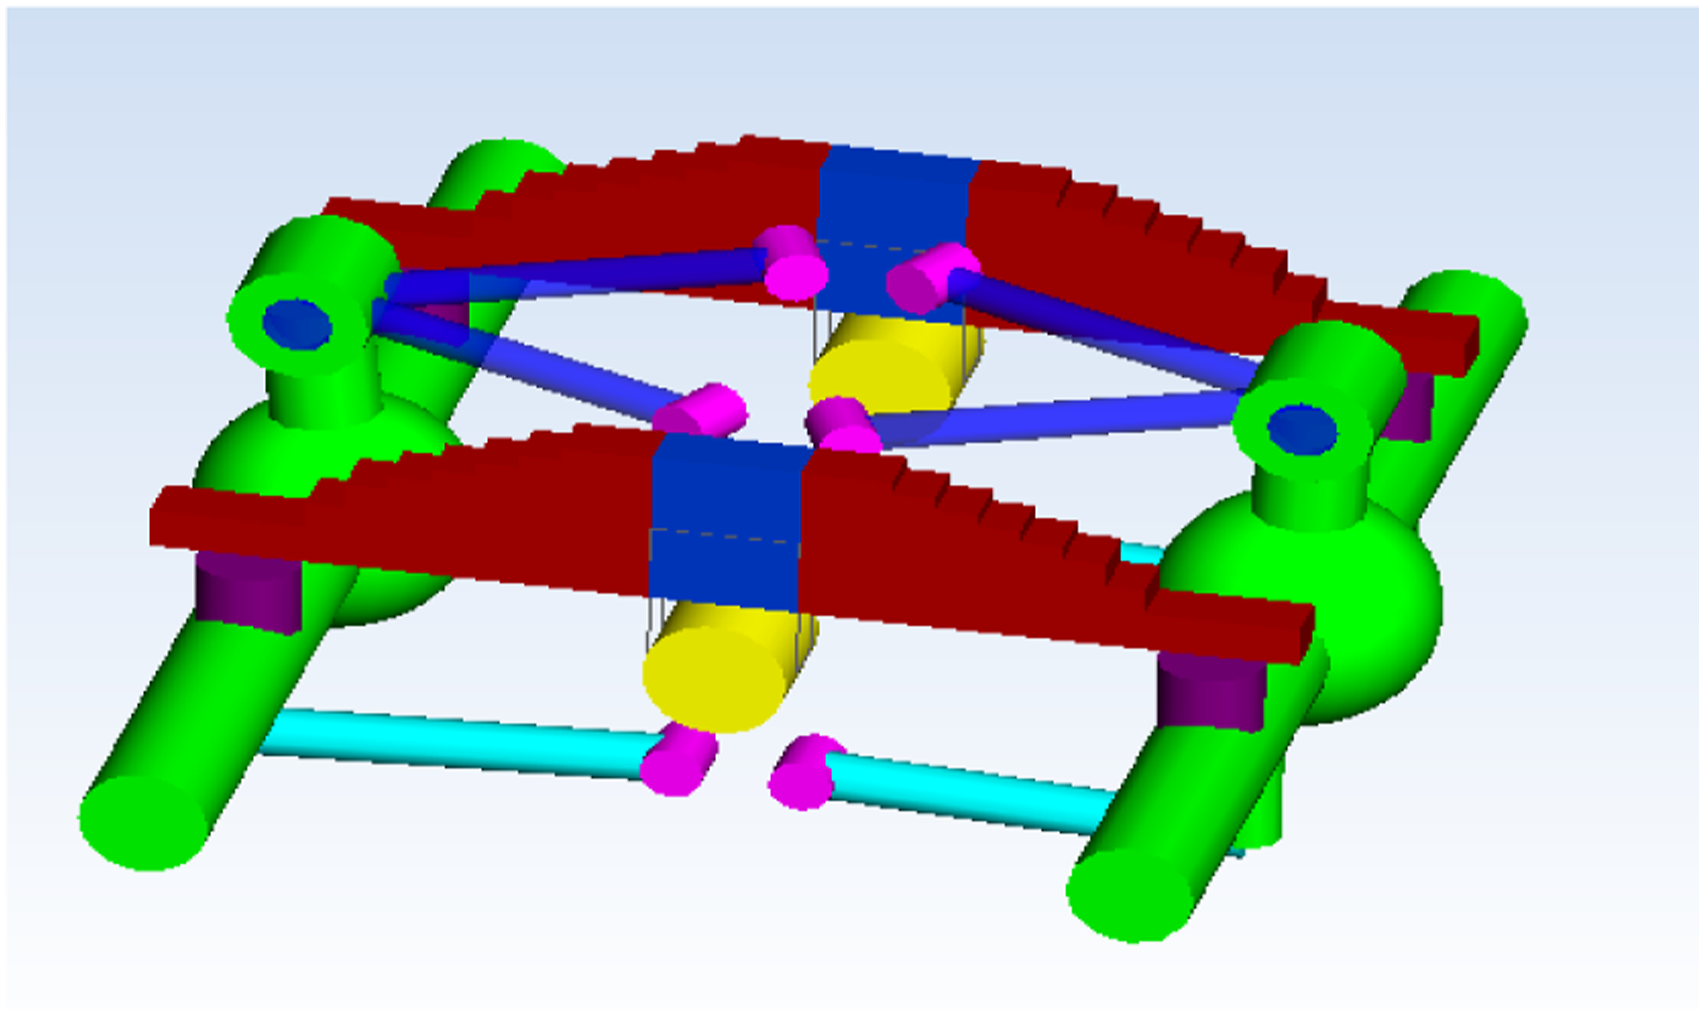
The tire sub-model mainly consisted of a virtual frame and tires. The number 19 vehicle in SIMPACK was hinged between the virtual frame and the ground, and the rotational degree of freedom between the tire and the ground was open. A SIMPACK type 253 tire was applied between the tire and the ground.
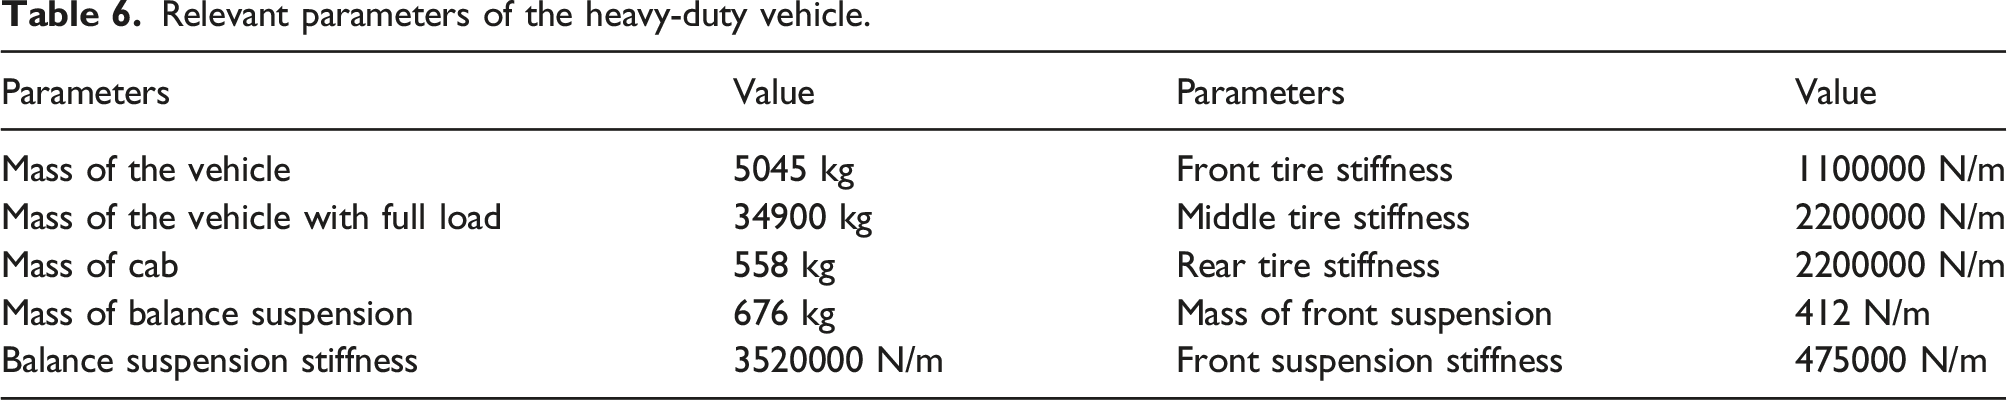
Relevant parameters of the heavy-duty vehicle.
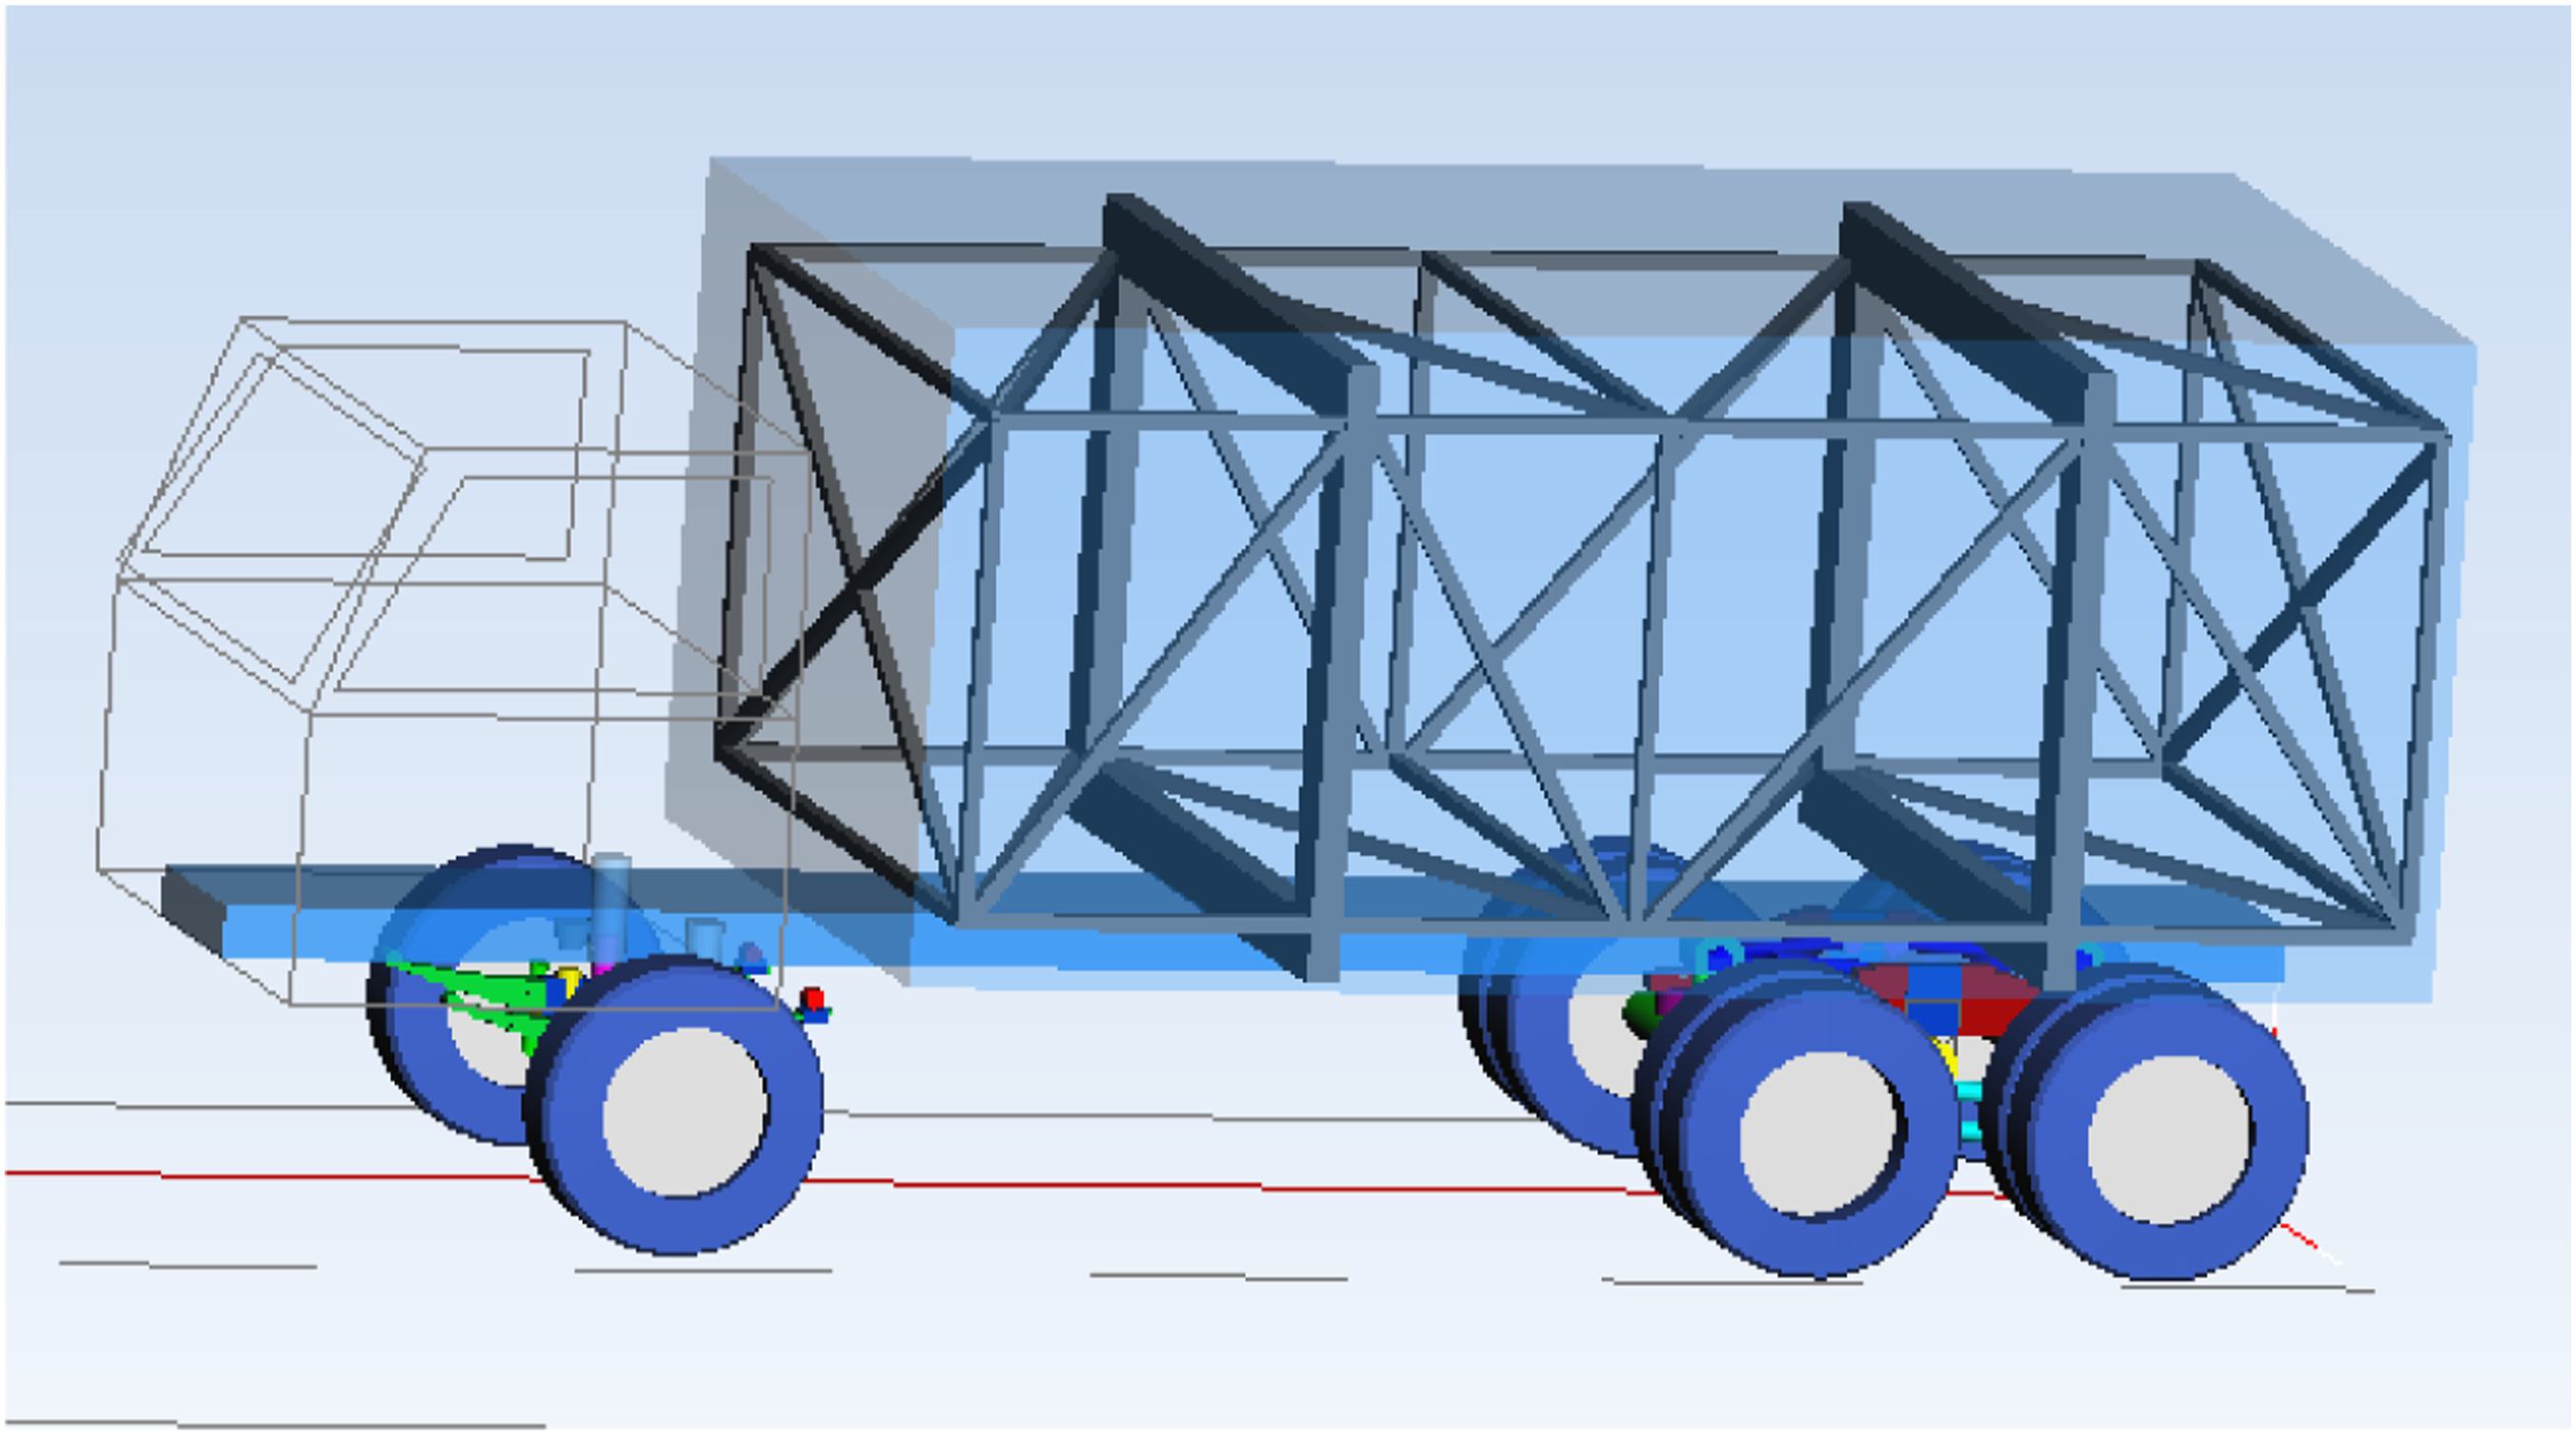
Whole vehicle–protective structure model.
The protective structure sub-model and dimensions were set up in SIMPACK according to the dimensions articulated in Figure 14. Protective structure model.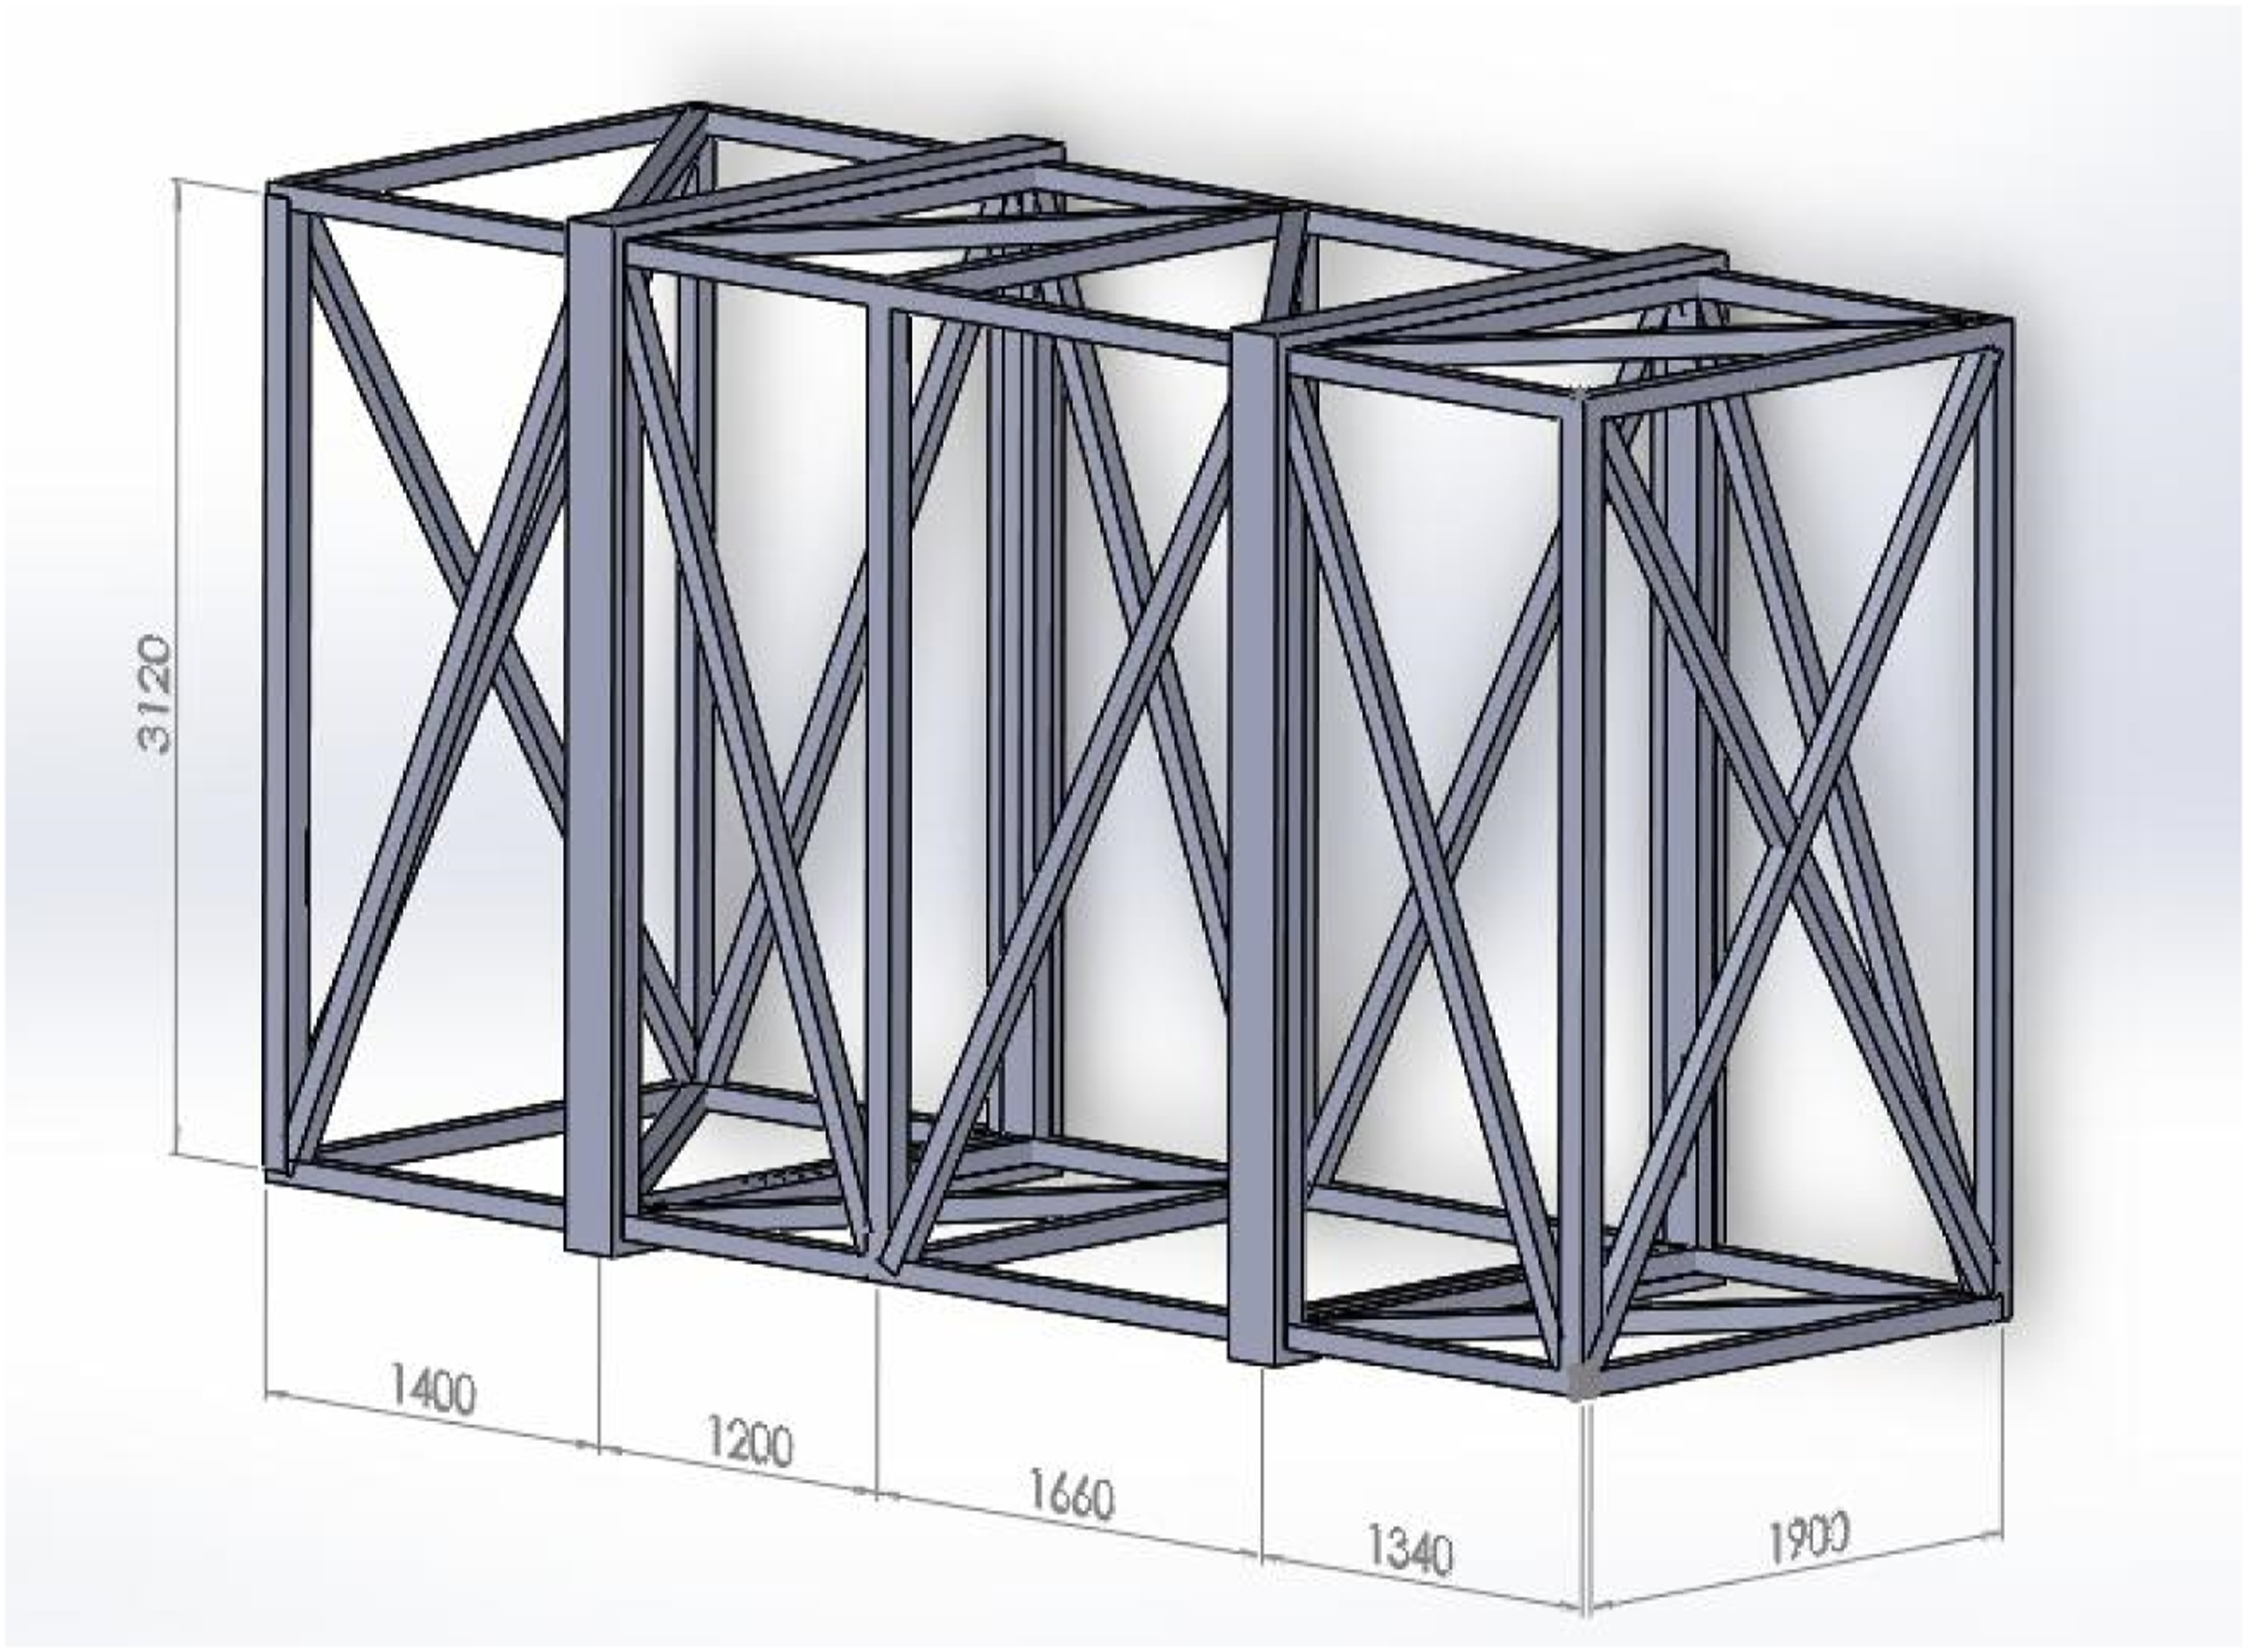
In order to verify the accuracy of the SIMPACK model, the situation of a truck driving on a Class B road at a constant speed of 60 km/h was compared with the SIMPACK model. Figure 14 shows the comparison between the experimentally measured and simulated acceleration for measuring point 1 and measuring point 2. It can be seen that the simulation is similar to the measured vertical acceleration trend for both measuring points. Furthermore, the maximum difference between the peak and trough values of the two curves is 15.59%. Hence, the SIMPACK model that we developed can be considered to be credible.
Dynamic response analysis using SIMPACK to simulate the effect of different road surface conditions
This section uses SIMPACK to simulate road conditions similar to those of China’s A, B, and C grade roads. Considering that the acceleration of the center of mass can roughly reflect the acceleration response of the vehicle, the maximum acceleration of the center of mass of the protective structure within a heavy-duty vehicle under A, B, and C road conditions was analyzed at speeds of 40 km/h, 50 km/h, 60 km/h, 70 km/h, and 80 km/h. Figure 15 shows that (1) the maximum acceleration of the center of mass of the protective structure increases as the roughness of the road surface increases and is proportional to the vehicle speed; (2) A and B grade surfaces have similar effects on the maximum acceleration of the center of mass of the protective structure, whereas that maximum acceleration was greater with the, rougher, C grade road surfaces; and (3) when a heavy-duty vehicle is moving at a constant speed, the maximum acceleration of the center of mass of the protective structure increases significantly between 60 km/h and 80 km/h. Measured and simulated acceleration in a scenario of a truck driving on a Class B road at a constant speed of 60 km/h: (a) Measuring point 1, (b) Measuring point 2, (c) Measuring point 3, and (d) Measuring point 4.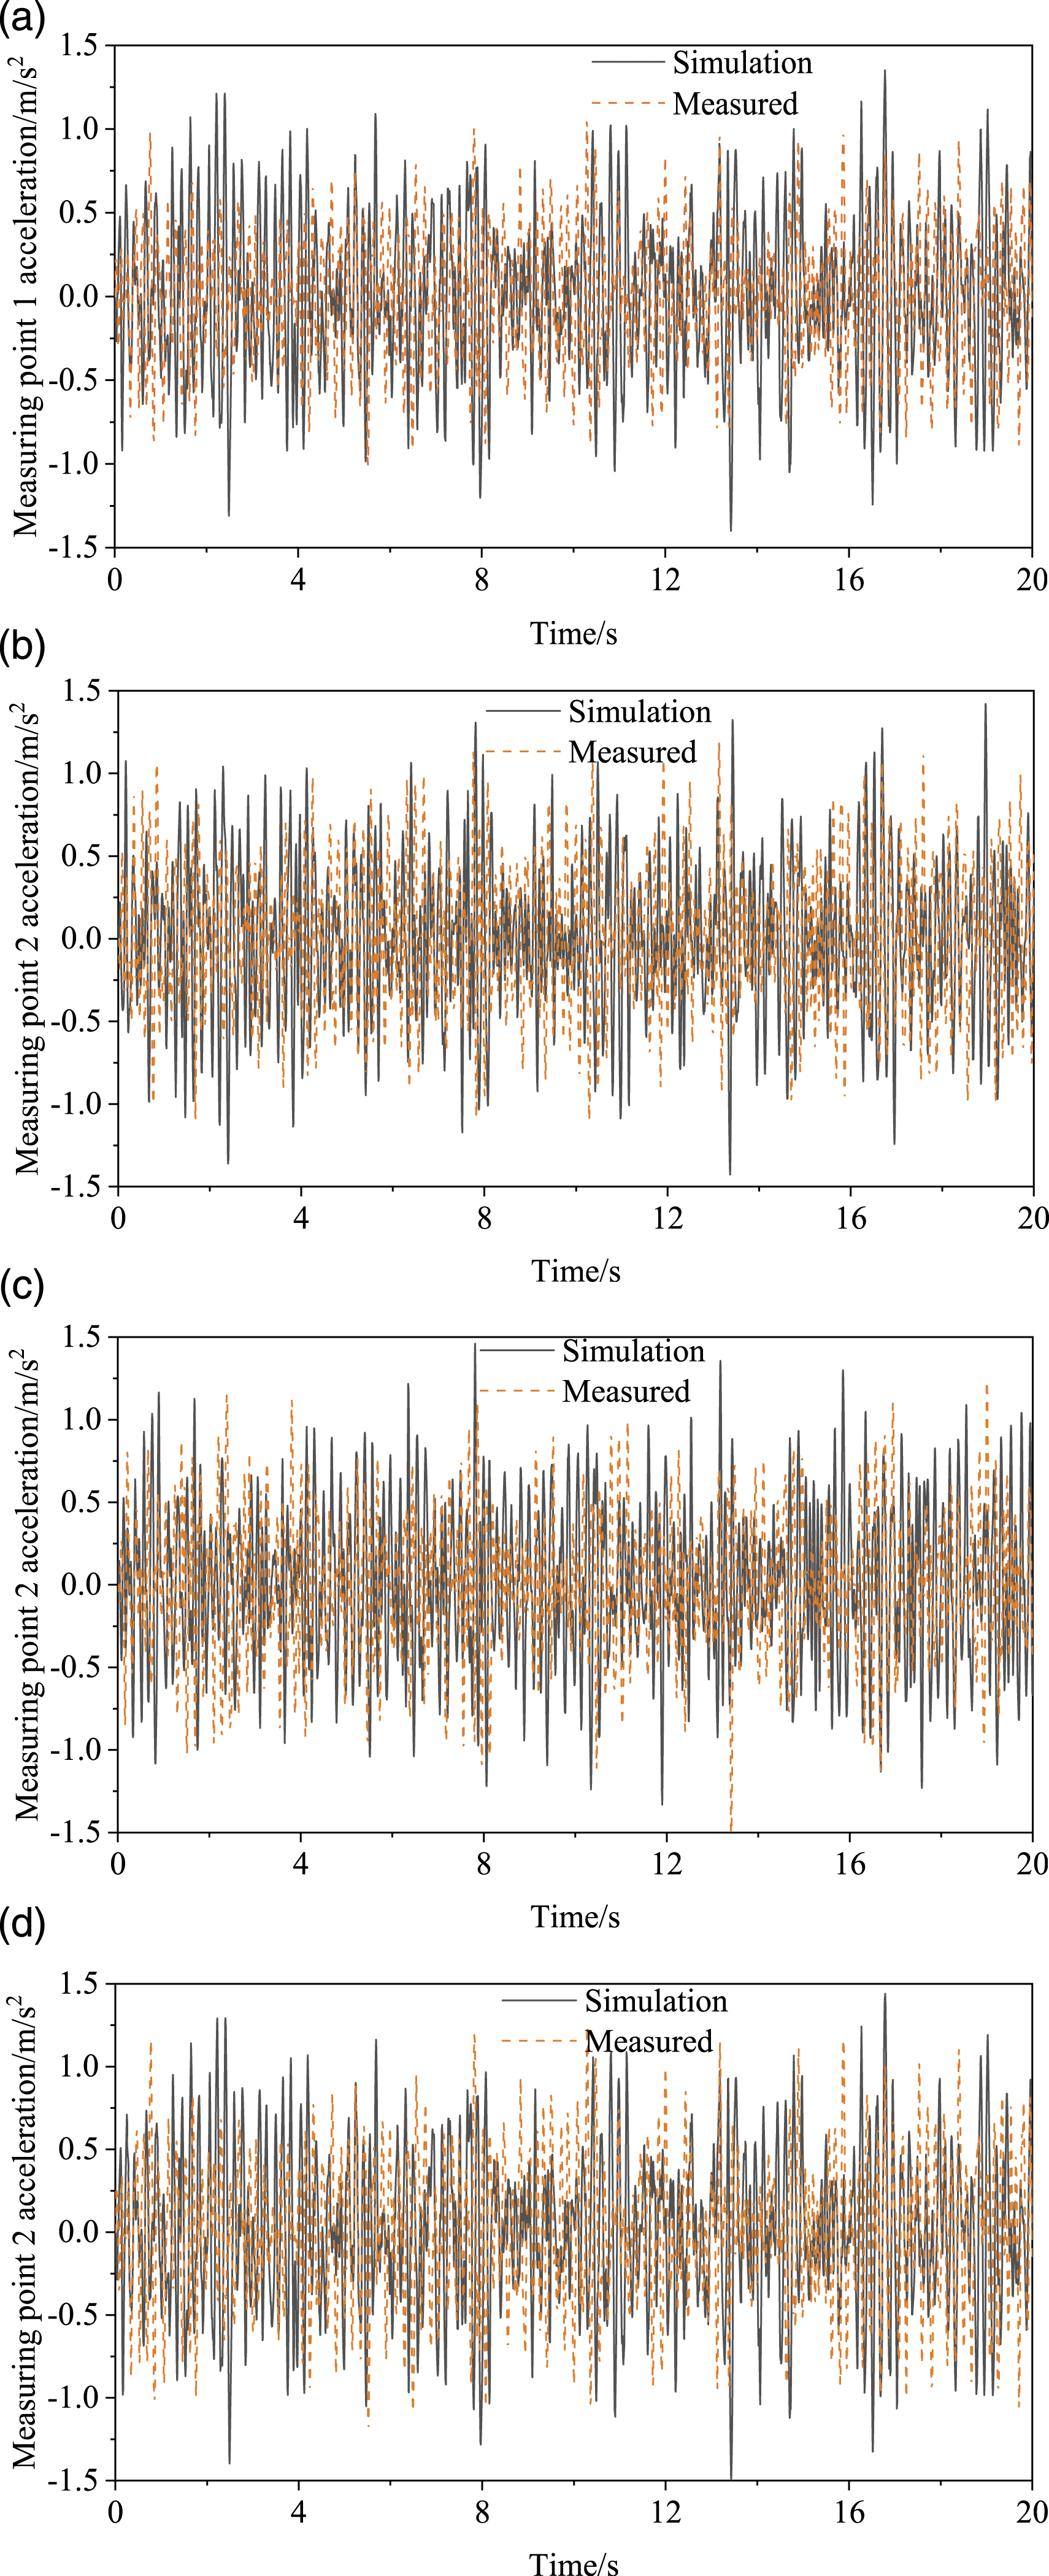
Dynamic response analysis using SIMPACK to simulate turning maneuvers in different road surface conditions
This section again uses SIMPACK to simulate road conditions similar to China’s A, B, and C grade surfaces but this time with a turning maneuver. The same environment was set up in the simulation as used in the experiment described in section 3.2 (a vehicle driving on A, B, or C grade roads, decelerate from 40 km/h, 50 km/h, 60 km/h, 70 km/h, or 80 km/h to 30 km/h with a continuous turn over a distance of 200 m). The simulated maximum acceleration of the center of mass of the protective structure is shown in Figure 16. It can be seen from the figure that (1) the A, B, and C grade road surfaces have similar effects on the maximum acceleration of the protective structure; and (2) the maximum acceleration of the protective structure increases more sharply when the vehicle’s speed in the turning state is increased from 70 km/h to 80 km/h than it does with the other increments in vehicle speed. Maximum acceleration of center of mass of the protective structure when the vehicle is traveling on different grades of road surface.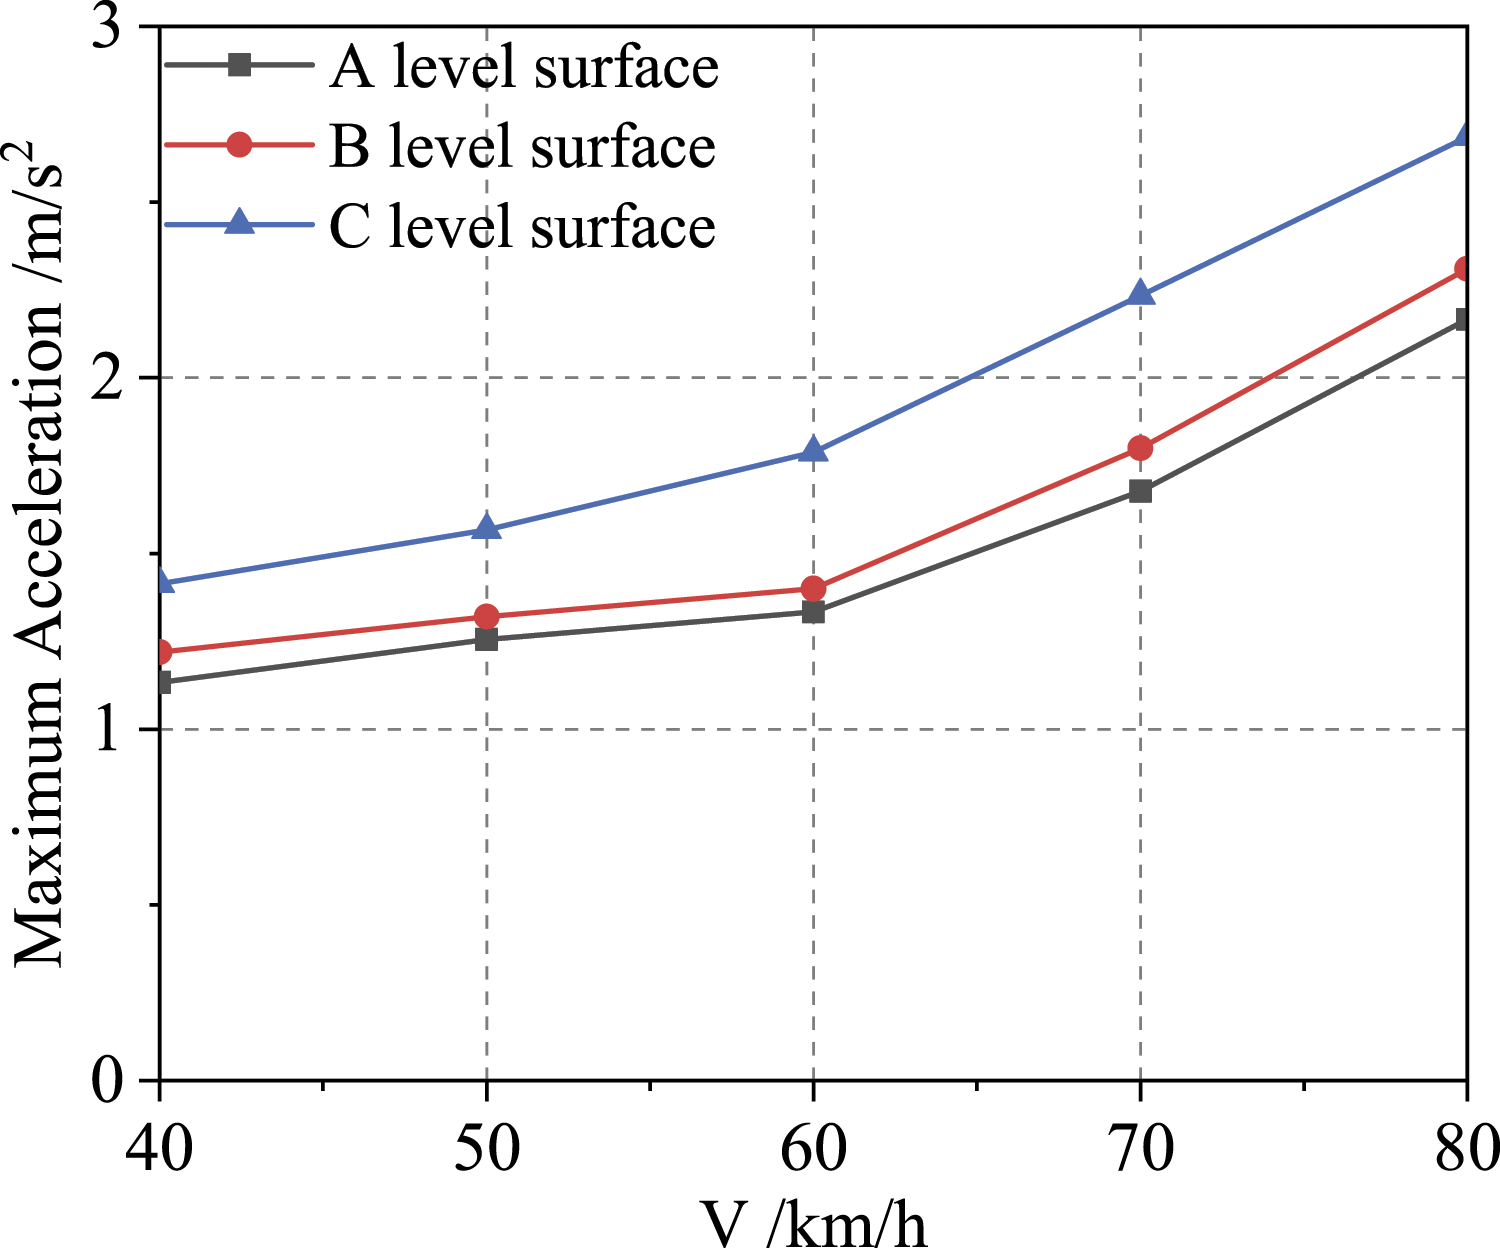
Dynamic response analysis using SIMPACK to simulate deceleration
This section reports the use of SIMPACK to replicate the experiment reported in section 3.3. The vehicle was simulated as driving on A, B, or C grade roads, with deceleration over a distance of 100 m from, respectively, 40 km/h, 50 km/h, 60 km/h, 70 km/h, or 80 km/h to a stop. The maximum acceleration of the center of mass of the protective structure is shown in Figure 17. Maximum acceleration of the center of mass in the turning state.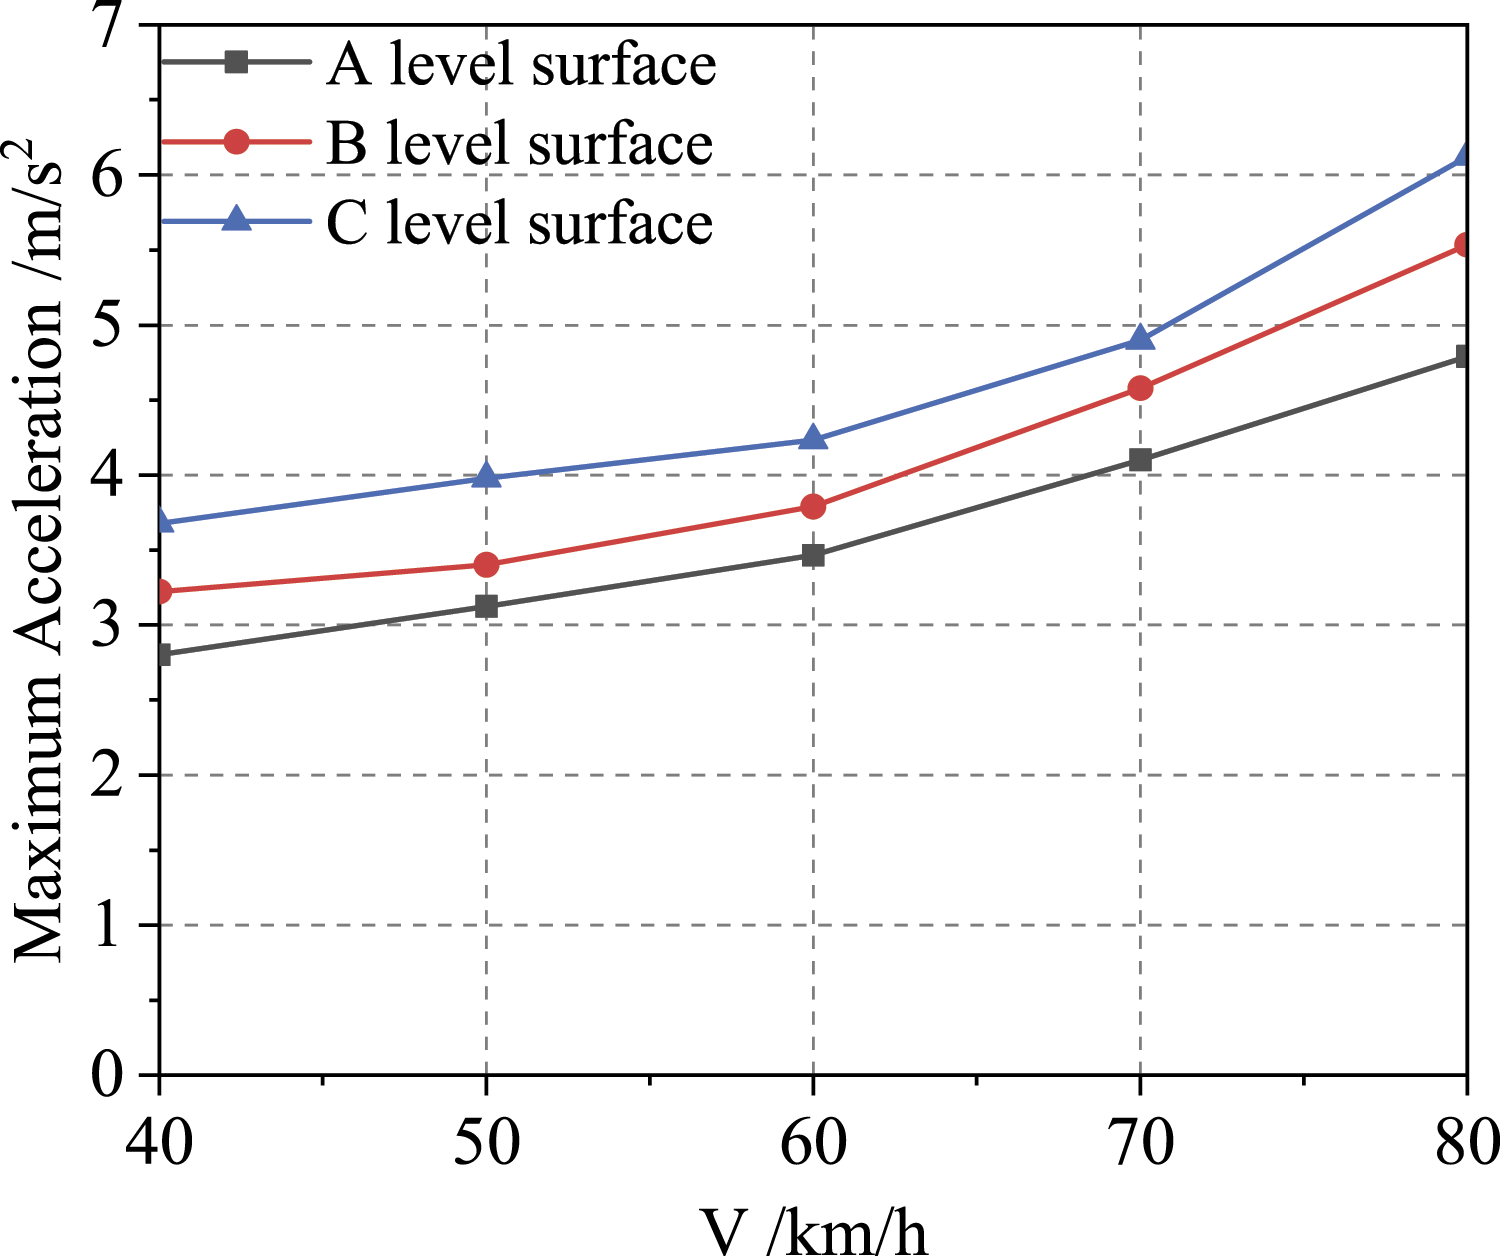
It can be seen from the figure that (1) a C grade road surface has a more obvious impact on the maximum acceleration of the protective structure than the A or B road surface and (2) when the vehicle is decelerating from speeds between 50 km/h and 70 km/h, the increase in the maximum acceleration of the protective structure is more marked than the increase at other speed increments.
Dynamic response analysis using SIMPACK to simulate a vehicle climbing a slope
In this section, SIMPACK is used to simulate a continuous ramp road surface model with a length of 30 m and heights of, respectively, 0.5 m, 1 m, 1.5 m, and 2 m. The vehicle was set to move at speeds from 20 km/h to 100 km/h with increments of 10 km/h. The relationship between the maximum acceleration at the bottom of the protective structure and the vehicle speed while ascending slopes of different vertical heights is shown in Figure 18. Maximum acceleration of the center of mass under deceleration.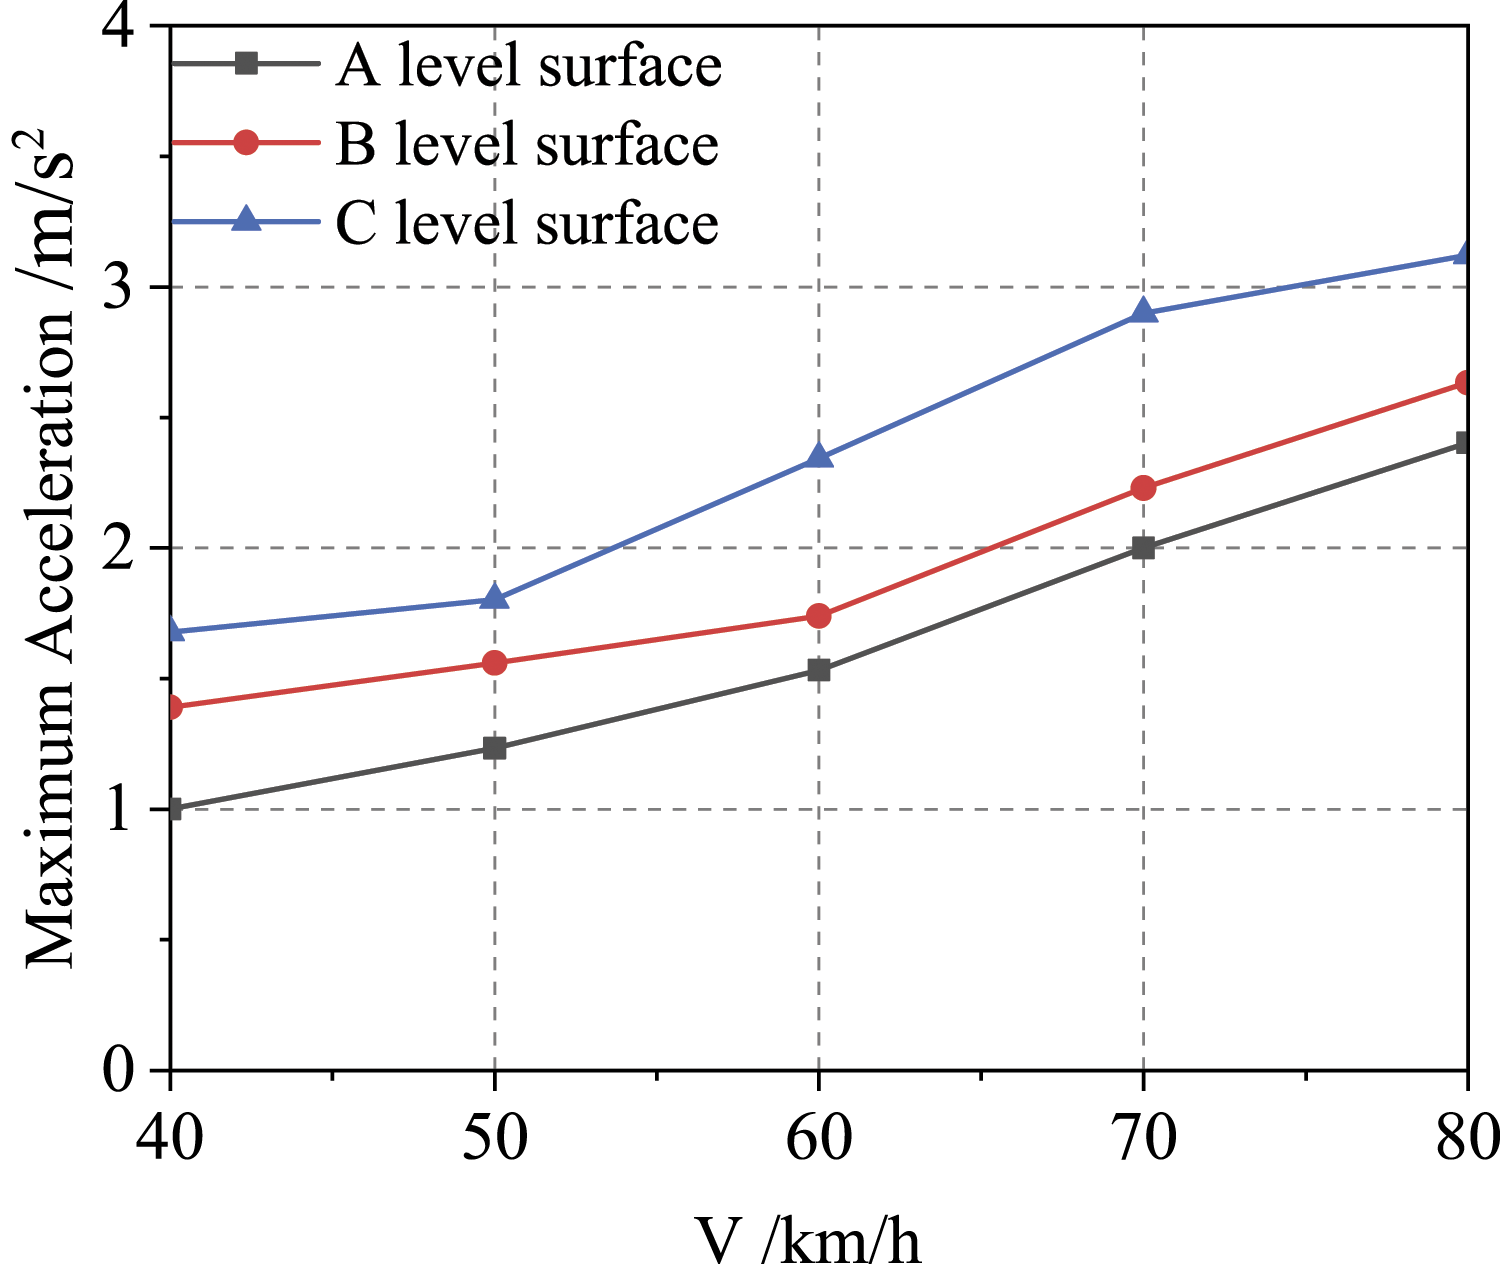
The figure reveals that the maximum acceleration at the bottom of the protective structure increases (1) as the gradient of the slope increases and (2) as the speed of the vehicle increases. In addition, there is a particularly marked increase in the maximum acceleration at the bottom of the protective structure when the vehicle speed increased from 30 km/h to 40 km/h Figure 19. Maximum acceleration of protective structure under slope road.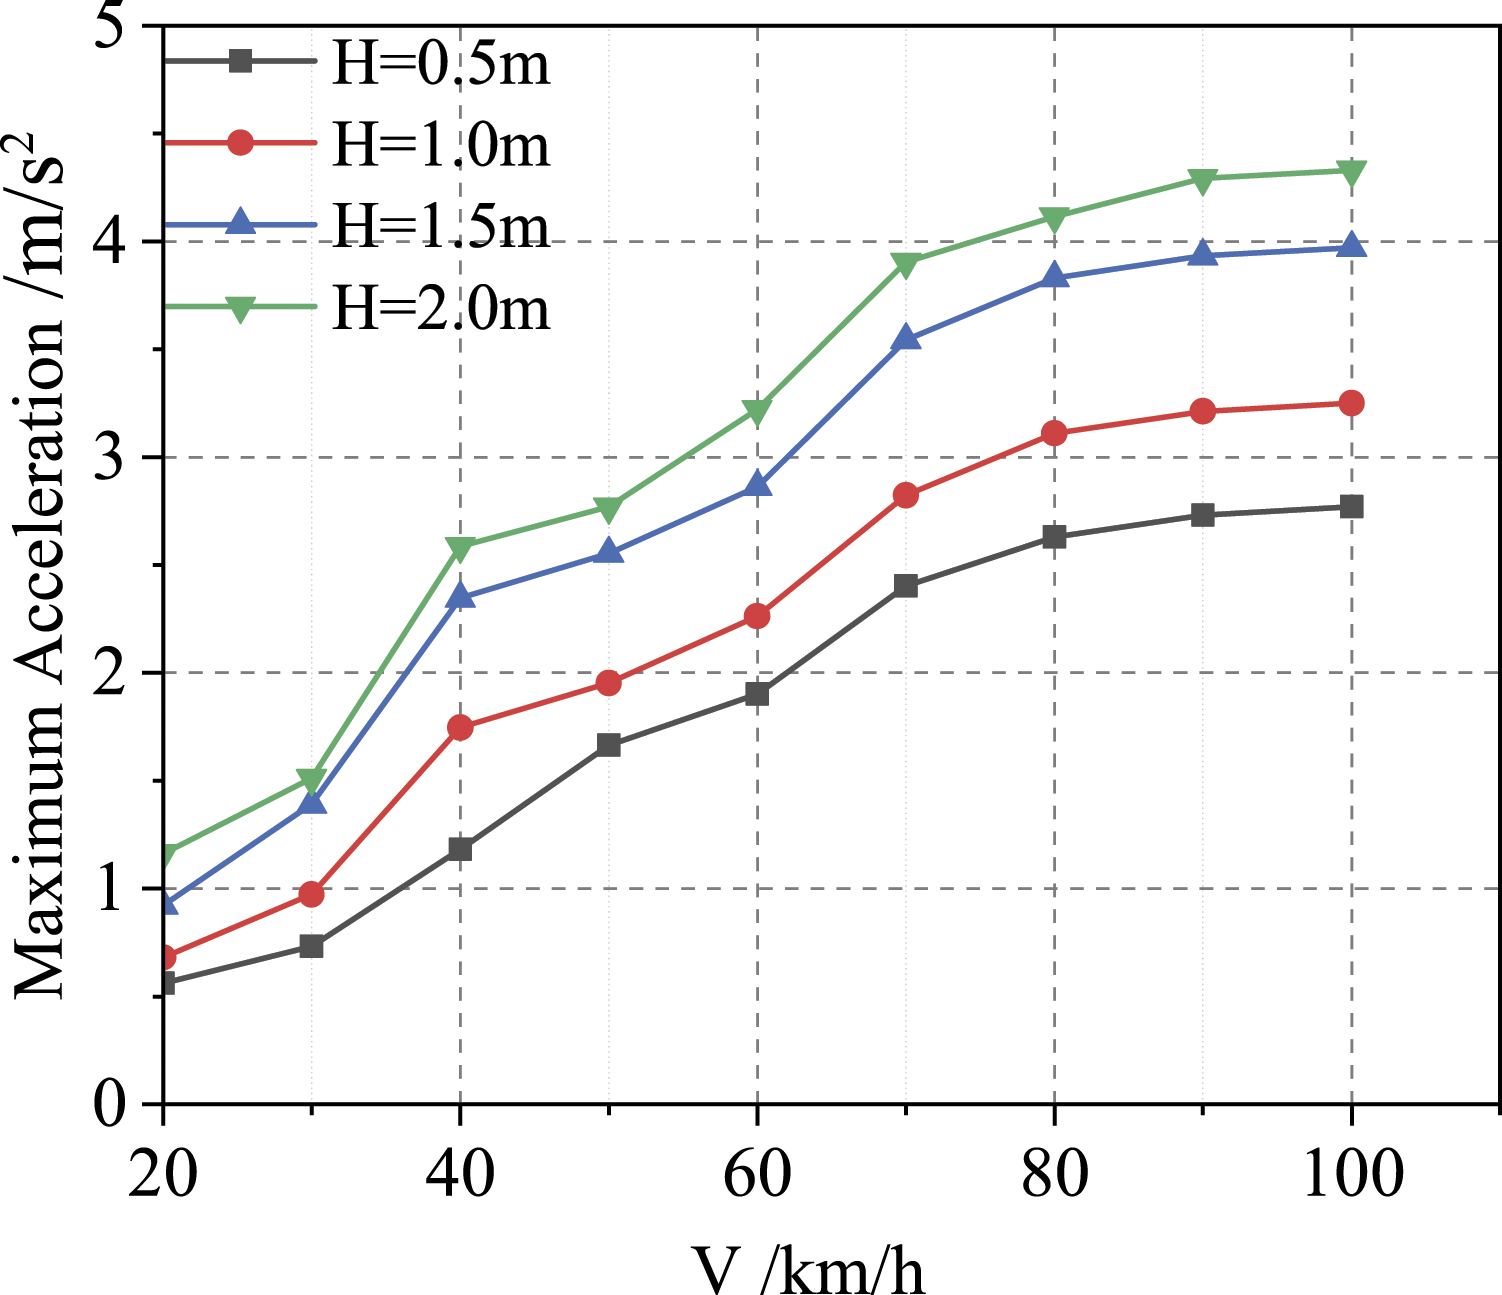
Conclusion
The objective of this study is the development of a reliable and efficient simulated dynamics model to evaluate the dynamic response of protective structures within heavy-duty vehicles in complex transportation conditions. It has used field experiments and SIMPACK simulation to explore the dynamic response with respect to different grades of roads, turning, deceleration, and climbing maneuvers. The coincidence between experimental results and simulation results shows that the simulated dynamics model can be accurate enough to evaluate the dynamic response of the protective structure. It has also been found that the maximum acceleration of the bottom of the protective structure increases: (1) When the roughness of the road surface increases. The effect of road surface roughness on the maximum acceleration of the protective structure is particularly marked when the vehicle’s speed increases in the range 60 km/h to 80 km/h. (2) When the vehicle turns. The effect of turning and deceleration on the maximum acceleration of the protective structure is particularly marked when the speed is between 70 km/h and 80 km/h. (3) When the vehicle is decelerating. The acceleration of the protective structure increases sharply in the first few seconds to reach a peak and then gradually decreases as the speed of the vehicle slows down. The effect of deceleration on the maximum acceleration of the protective structure is particularly marked when the vehicle’s speed is between 50 km/h and 70 km/h. (4) When a heavy-duty vehicle is driving up a slope at a constant speed. The effect of driving up a slope on the maximum acceleration of the protective structure is particularly marked when the vehicle speed is between 20 km/h and 40 km/h. On the other hand, when the vehicle speed exceeds 80 km/h, the maximum acceleration of the protective structure changes less markedly as the speed continues to increase.
Footnotes
Declaration of conflicting interests
The author(s) declared no potential conflicts of interest with respect to the research, authorship, and/or publication of this article.
Funding
The author(s) received no financial support for the research, authorship, and/or publication of this article.