
Abstract
Stiffened U-rib plates are the elementary components of steel box girders in bridges that directly bear the input external energy before transferring it to other components. Research on the dynamic characteristics of stiffened U-rib plates is the basis for examining vibration and noise in steel box girders. Most relevant studies have focused on the vibrational modes and single-frequency responses in this context, and few researchers have sought to optimize the design of stiffened U-rib plates to reduce responses due to vibrations and noise. This study identifies the global and local laws of vibrational transmission in stiffened U-rib plates subjected to harmonic loads through structural intensity (SI) analysis that is carried out by jointly using standard finite element software and a post-processing code created by the authors. The contributions of each component of vibrational waves are represented to reflect the dominant roles of the bending wave in the baseplate and the in-plane wave in the U-ribs, respectively. The effects of parameters of the U-rib plates on SI are also quantitatively investigated. SI analysis can be used as a new criterion for designing and optimizing bridges as well as formulating measures for vibration reduction.
Introduction
The propagation of vibrations and noise in bridges due to loads imposed on them by traffic can be irritating to those working and living in the vicinity of a railway line. Tracks on a bridge typically produce more noise than normal tracks on the ground when a train crosses the bridge, with a common increase of 10 dB or more. Steel bridges are generally noisier than concrete bridges.1–3 In this case, the radiation of noise in steel bridges needs to be controlled to prevent negative impacts due to it along the railway.
The local vibration in large-format plates is the main source of noise in steel bridges. Closed stiffeners are generally used to provide a large bending stiffness as the ratio of the width span of the bridge increases. U-ribs are normally arranged on the roof of the steel box girder (see Figure 1), and bear the external energy that is directly input before transferring it to other components. In this situation, the vibrational characteristics of the stiffened U-rib plate should be prioritized for examination. While a considerable amount of research has been reported on the vibrational characteristics for stiffened plates by using factorial methods,4,5 finite element analysis (FEA),6,7 and energy analysis,8,9 the relevant studies have focused on opening stiffeners, such as flat ribs and T-ribs, rather than closed U-ribs. One approach involving the latter equates the U-rib to the beam based on its mass and stiffness. This method has been used to investigate the local vibrational characteristics of U-ribs in orthotropic steel decks.4,9 However, the method focuses on the low-order vibrational responses of the baseplate while ignoring local vibrations in the stiffeners. The stiffened plates used in the girders of the bridge.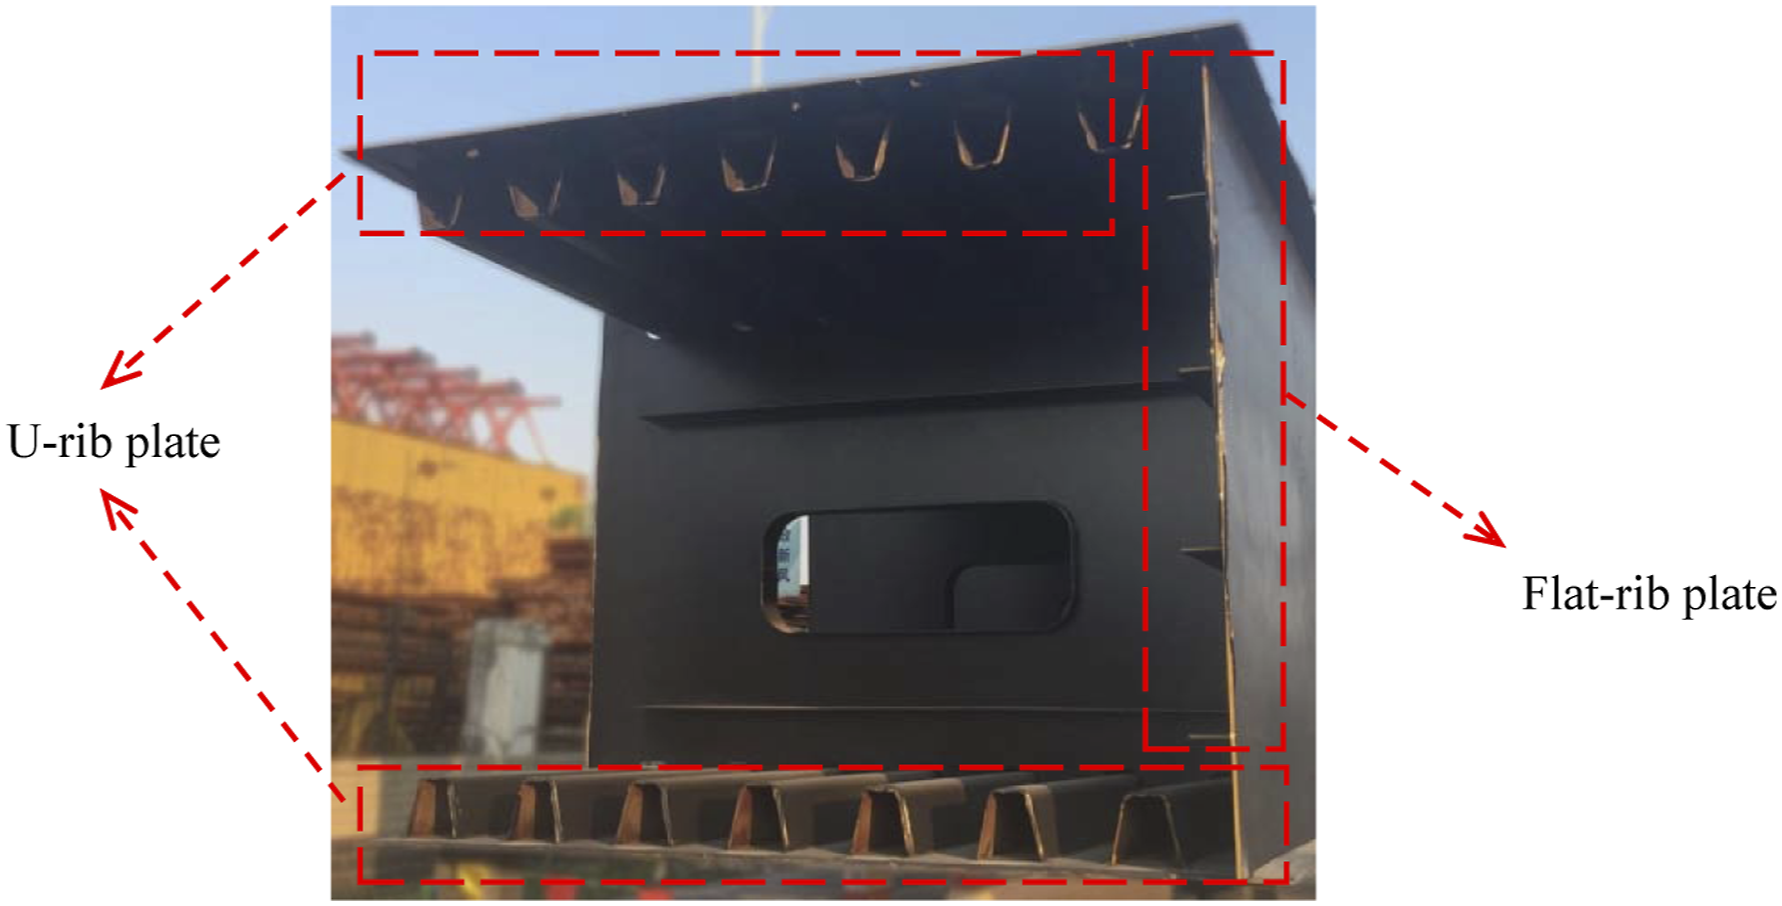
Because the transmission of energy is the source of vibrations, the relevant studies have sought to describe the path of transmission of vibrations from the perspective of energy flow. A method based on the vector of structural intensity to represent energy flow was proposed by Noiseux, 10 who considered stress and displacement to express the power transmitted through a unit cross-section. The intensity of the structure constitutes a vector field, and the magnitude and direction of any vector in the field can be used to characterize energy flow at any given point. Theoretical11,12 and experimental13,14 methods of SI analysis have been extensively examined and developed in the relevant research.
The analysis of the vibrational responses of complex structures is especially challenging because the complex coupling conditions make the factorial method difficult to implement. Many researchers have considered FEA instead.15,16 The overall vibrations and local vibrations in coupled plates are the focus of this work. Li et al. 17 analyzed the characteristics of flow of vibrational energy in an L-shaped coupled plate and visualized the transmission of vibrations by using a streamline diagram. The influence of different parameters on the flow of energy in open-stiffened plates was studied by Xu et al., 18 and included the number and shapes (flat rib, L-rib, and T-rib) of the ribs as well as the excitation forces. Local vibrations in the stiffeners were not considered in this work. Cho et al.19,20 extended this work in two ways: First, they analyzed local vibrations and, second, investigated the proportion of components of SI to identify the dominant component.
Despite considerable research on the SI of engineering structures, such as composite plates,21,22 cantilever plates, 23 cross-stiffened plates, 18 box structures, 24 ships, 25 and aviation casings,26,27 little work has been reported on the flow of vibrational energy in U-rib plates.
The main aims of this study are (i) to explore the global and local laws of vibration transmission in stiffened U-rib plates and (ii) to identify the dominant components of vibrational energy flow in them. To achieve these, particular focus is given to the SI vector fields of the structures; therefore, a FE model is built and a post-processing code for 3D visualization is composed. Based on this method, the vibrational energy flow in the baseplate and U-ribs are analyzed, including the overall SI and their components (longitudinal wave, transverse plane wave, bending wave, and torsional wave). Finally, to optimize real-world engineering structures, the influence parameters of stiffeners on SI vector fields are discussed.
Structural intensity theory
Formulation
This section presents a brief outline of the theoretical background of the process of a hybrid FE–SI analysis. SI is defined as the product of a stress tensor and a velocity vector at a specific time in the temporal domain. It represents the power of vibrational flow per unit of cross-sectional area of a structure under dynamic loading.
In the time domain, the general tensor formulation of transient SI yields
10

In case of a single frequency, the time-averaged SI during the period can be expressed as

The SI in the plates and shells can be expressed in the form of power flow per unit width. In case of a single frequency, the velocities can be replaced by displacements by using complex algebra. As the elements of the plate and the shell are two dimensional (2D), energy may flow in the local x and y directions. The x and y components of the SI for a vibrating flat can be expressed as
18
(a) Forces (moments) and (b) displacements of elements of the plate.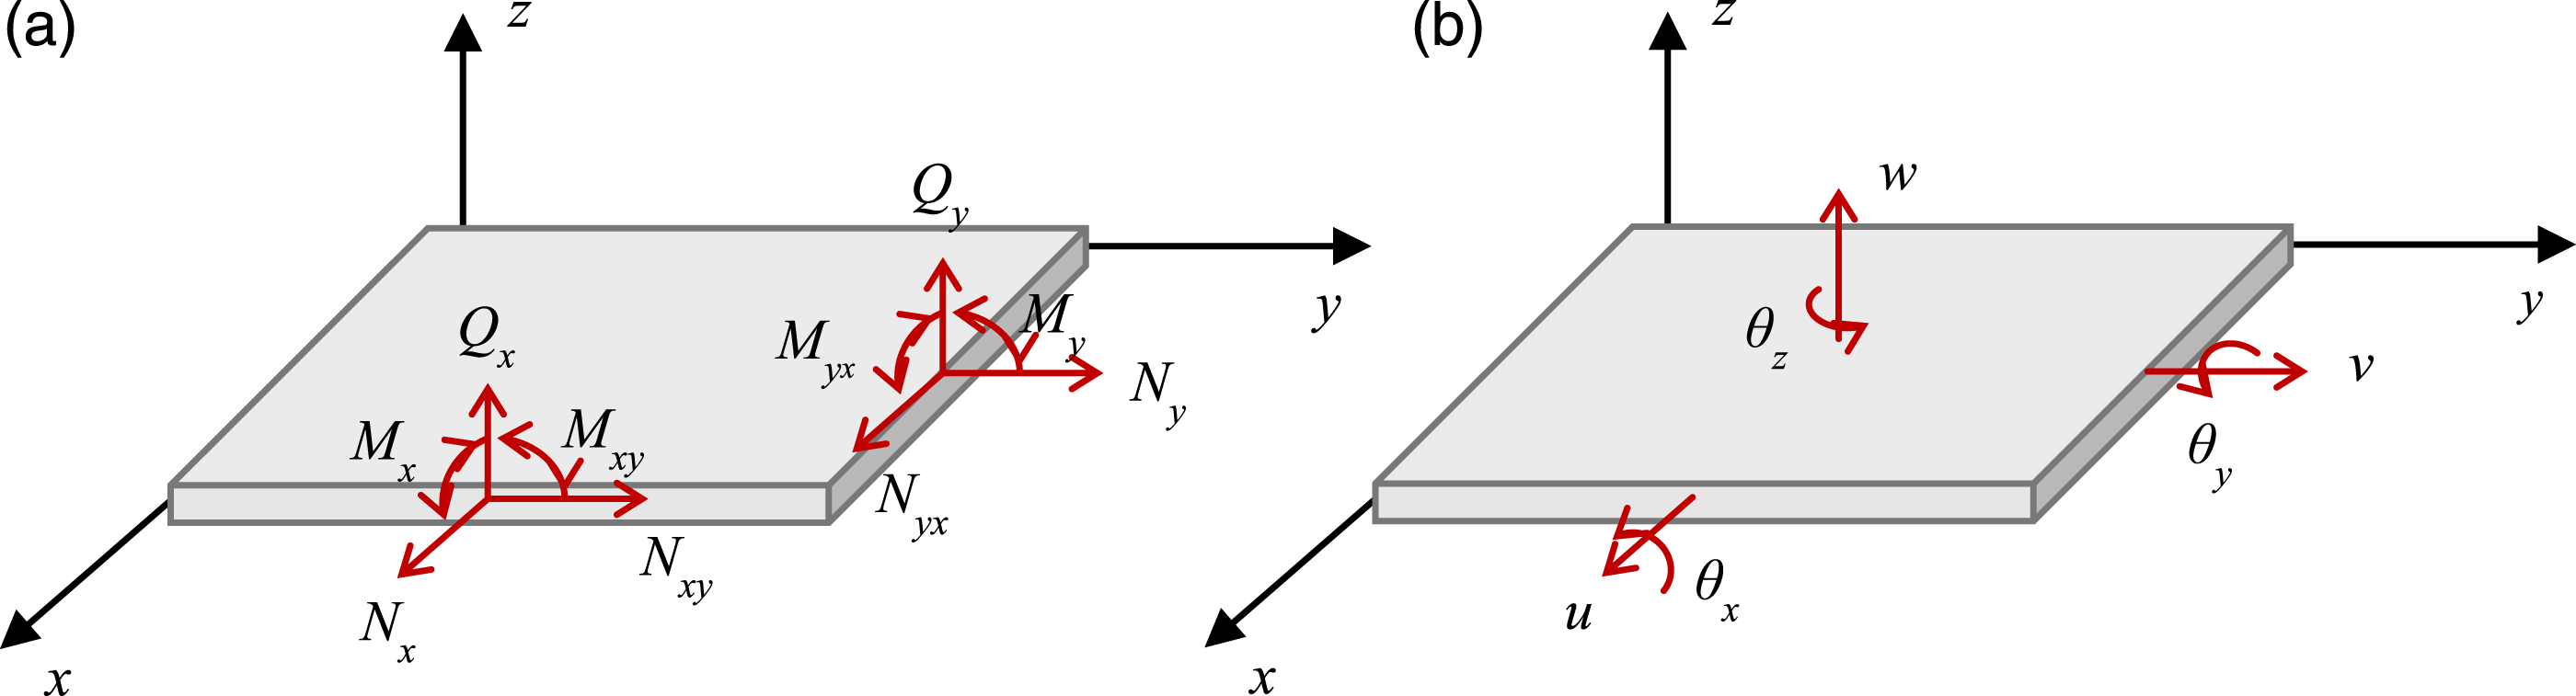
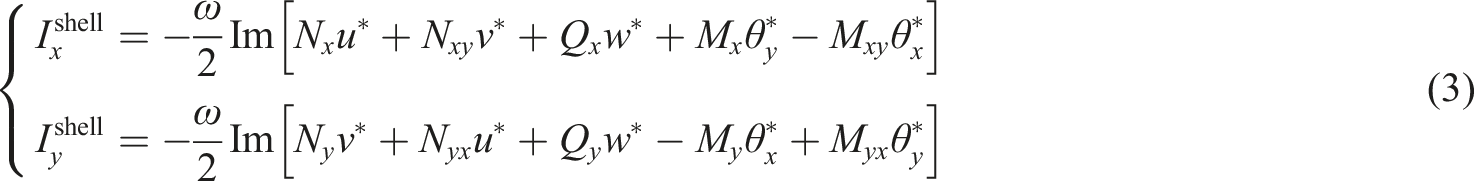
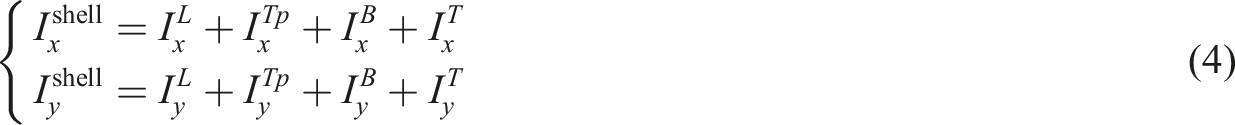
Vibrations are transmitted in the structure in the form of various waves, including longitudinal waves, transverse plane waves, bending waves, and torsional waves. They generate the components of SI corresponding to each term of Equation (3).
28
Thus, SI can be expressed as
Execution and 3D visualization
The standard finite element software (ANSYS Academic Research Mechanical 13.0) is used with a post-processing code programmed by the authors of this study for hybrid FE–SI analysis. First, the FE model is established by the finite element software, and the stress and velocity vectors are calculated. Second, the SI vectors of each element are calculated by the programmed code. Finally, a geometric model is constructed based on the post-processing code and 3D vector graphics are drawn to visualize the scenario. This includes normalization, coordinate calculation, and scale selection.
Verification
This section involves the use of two models from Xu et al.
18
to verify the reliability of hybrid FE–SI-based analysis. The first model is a 1440 × 1080 × 6 mm steel stiffened plate with a flat rib of size 1080 × 110 × 10 mm. A single-point harmonic force is applied to it and a damper perpendicular to the direction of the plane is provided. The second model is a practical cross-stiffened panel, with dimensions of 6096 × 3048 mm, as a prototype, as shown in Figure 3. The SIs of the baseplate under excitation by a uniform load on the surfaces of the short and long sides are calculated. Schematic of a rectangular cross-stiffened plate.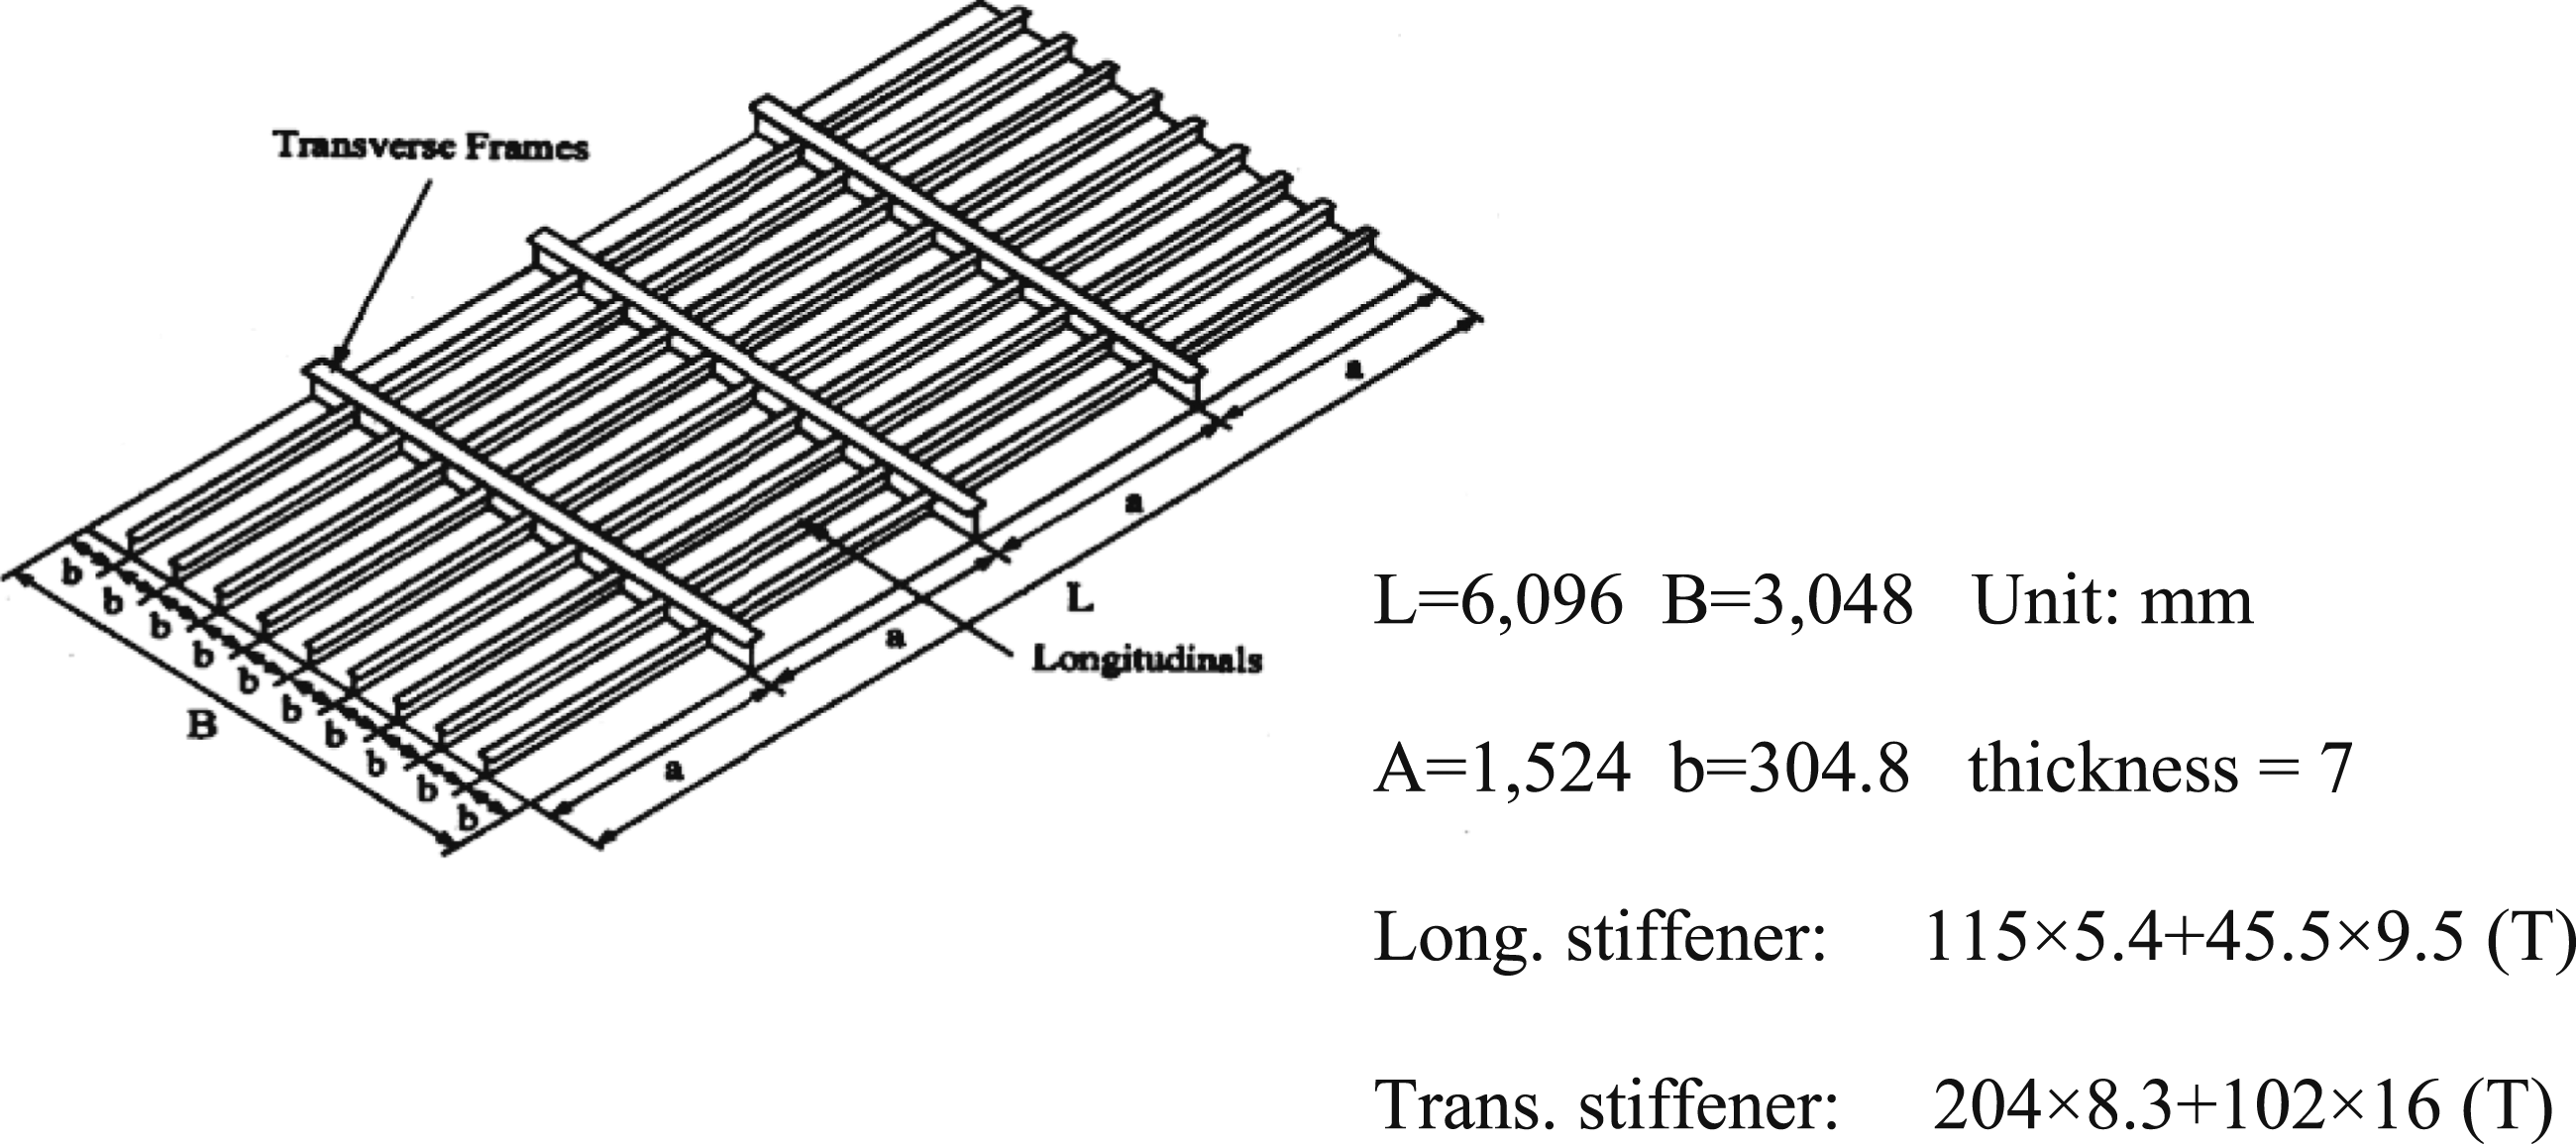
The above cases are used to calculate the identical geometric and boundary conditions through hybrid FE–SI analysis. Figure 4(a) presents comparisons of the SI vectors of model 1, and Figures 4(b) and (c) present comparisons of the results for model 2 under longitudinal and transverse excitations, respectively. The SI vectors obtained are very similar to those generated by Xu et al.
18
This verified the reliability of the proposed method. Comparison of SI vectors: (a) flat-rib plate under out-of-plane concentrated pressure; (b) cross-stiffened plate under in-plane pressure in the longitudinal direction; and (c) cross-stiffened plate under in-plane pressure in the transverse direction.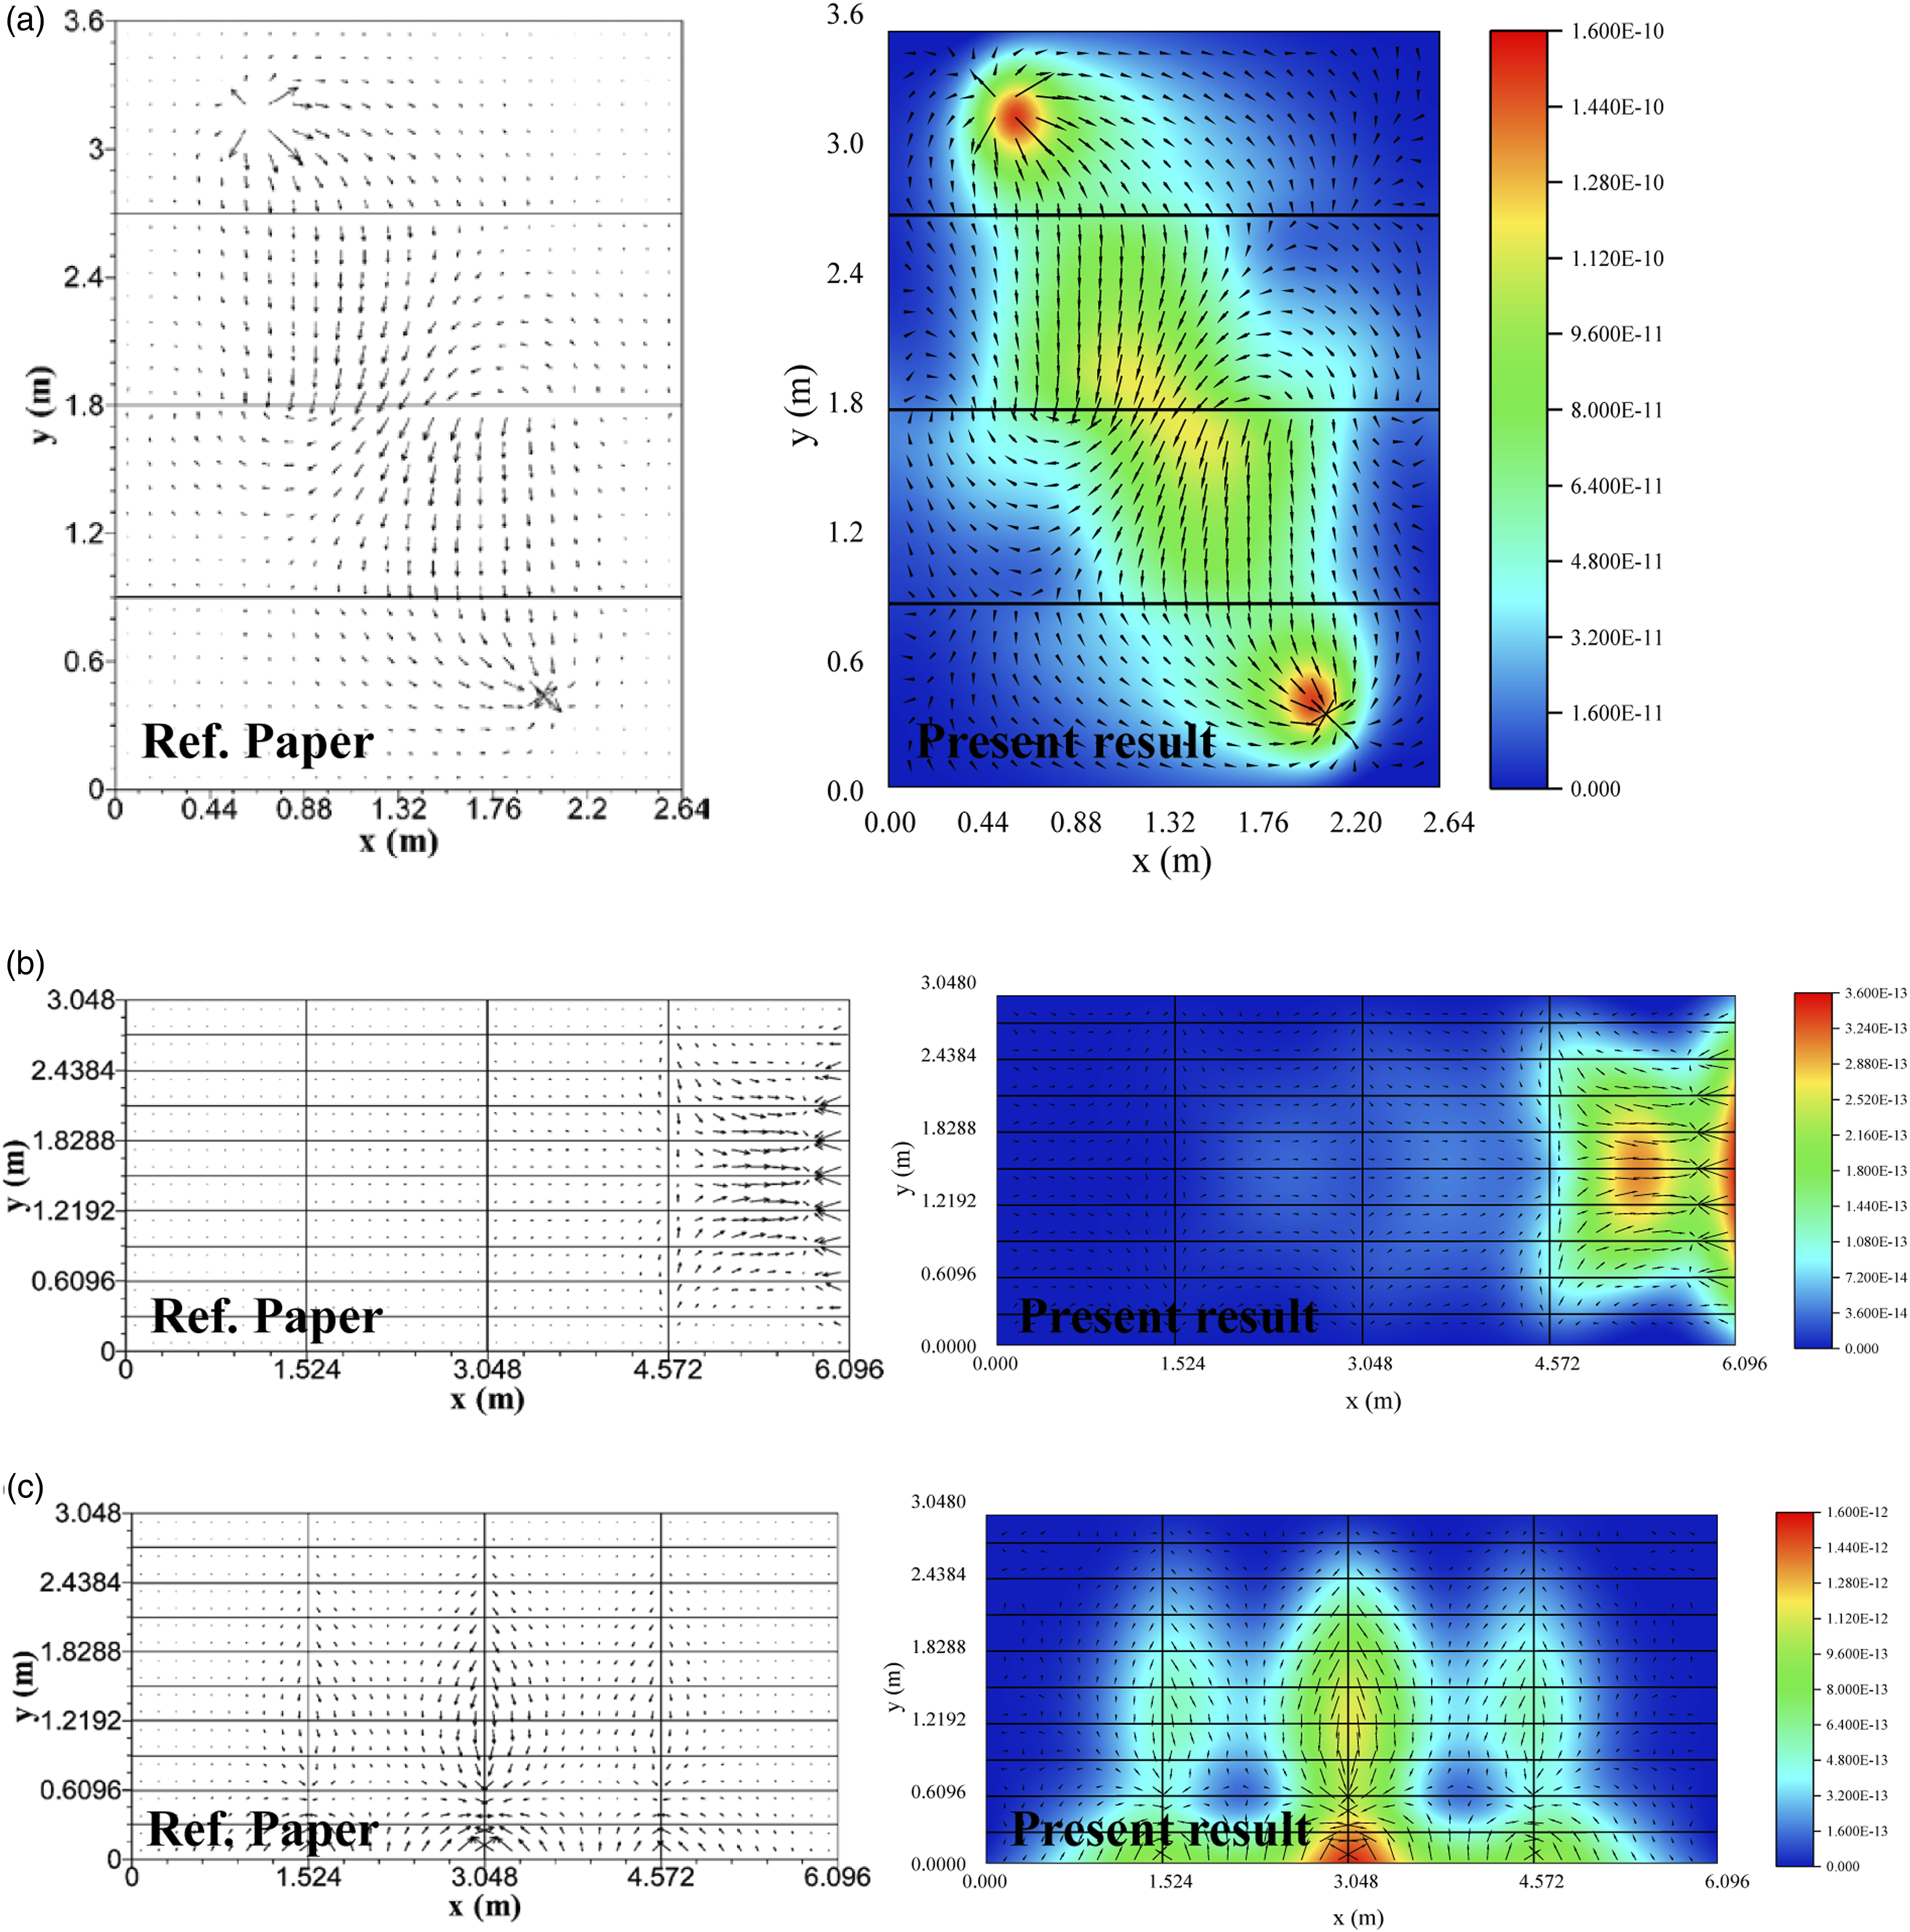
SI characteristics of U-rib plates
This section investigates the characteristics of transmission of vibrational energy, including the baseplate and the U-rib in Section “SI levels in the baseplate” and “SI levels in the stiffeners,” respectively. Each part consists of an SI vector field, its component, and cross-sectional SI analysis.
Figure 5 shows a roof of a steel box girder stiffened by U-ribs, where the structure consists of a thick baseplate and seven welded U-ribs. Since both global and local vibrations need to be considered, an FE model of the whole structure was established as all the components were simulated by eight-node elastic shell elements (element type: SHELL93). A unit nodal force was applied vertically to the plate at x = 200 mm and y = 2300 mm. A dashpot of 2000 N.s/m was attached vertically to the baseplate at x = 4550 mm and y = 700 mm and was modeled by a 3D spring-damper element (element type: COMBINE14). The Young’s modulus, density, and Poisson’s ratio of steel were assumed to be 210 GPa, 7850 kg/m3, and 0.3, respectively. A boundary condition with four fixed constraints was assumed. In actual bridge engineering, a large number of experimental data have proved that the damping ratio of steel bridges typically ranged from 0.5% to 1%. Thus, a constant structural damping of 1% was assigned in calculation. Note that the specific value of damping ratio does not affect the dominant components of vibrational energy flow discussed in this paper. By conducting mesh convergence tests by using various mesh sizes (0.1–0.01 m), it was found that the 0.05 m mesh yielded similar results to further reduced mesh sizes but with much lower computational cost. Therefore, the mesh size is determined to be 0.05 m. Dimensions of the U-rib plate of a typical bridge (unit: mm).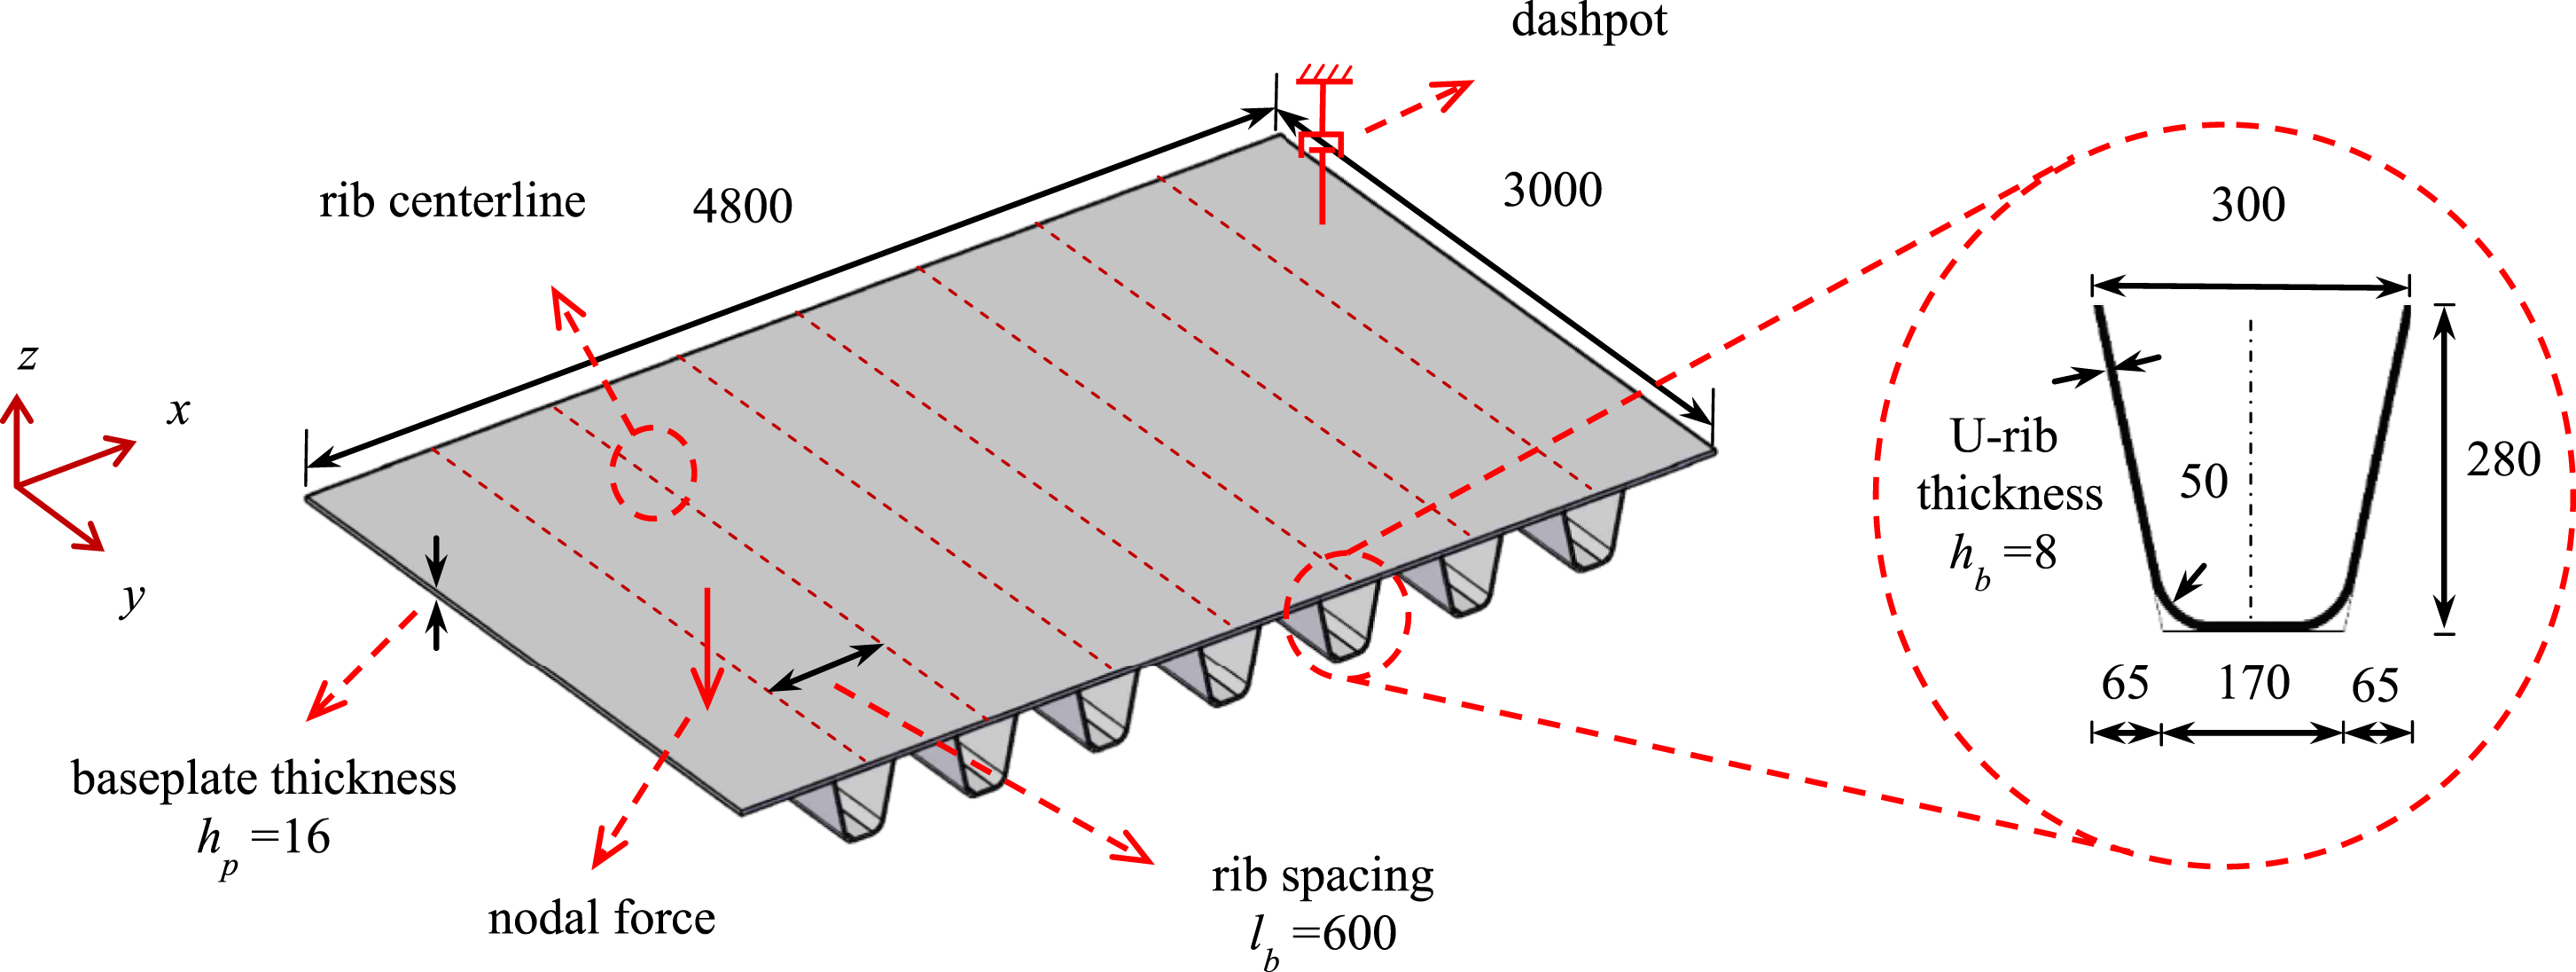
Figure 6 plots the shapes of the low-order vibrational modes and their corresponding frequencies. The first three orders of vibration mainly represented global vibrations of the U-rib plates, whereas their local vibrations tended to be more substantial at higher-order modes. FE model and shapes of natural vibrational modes.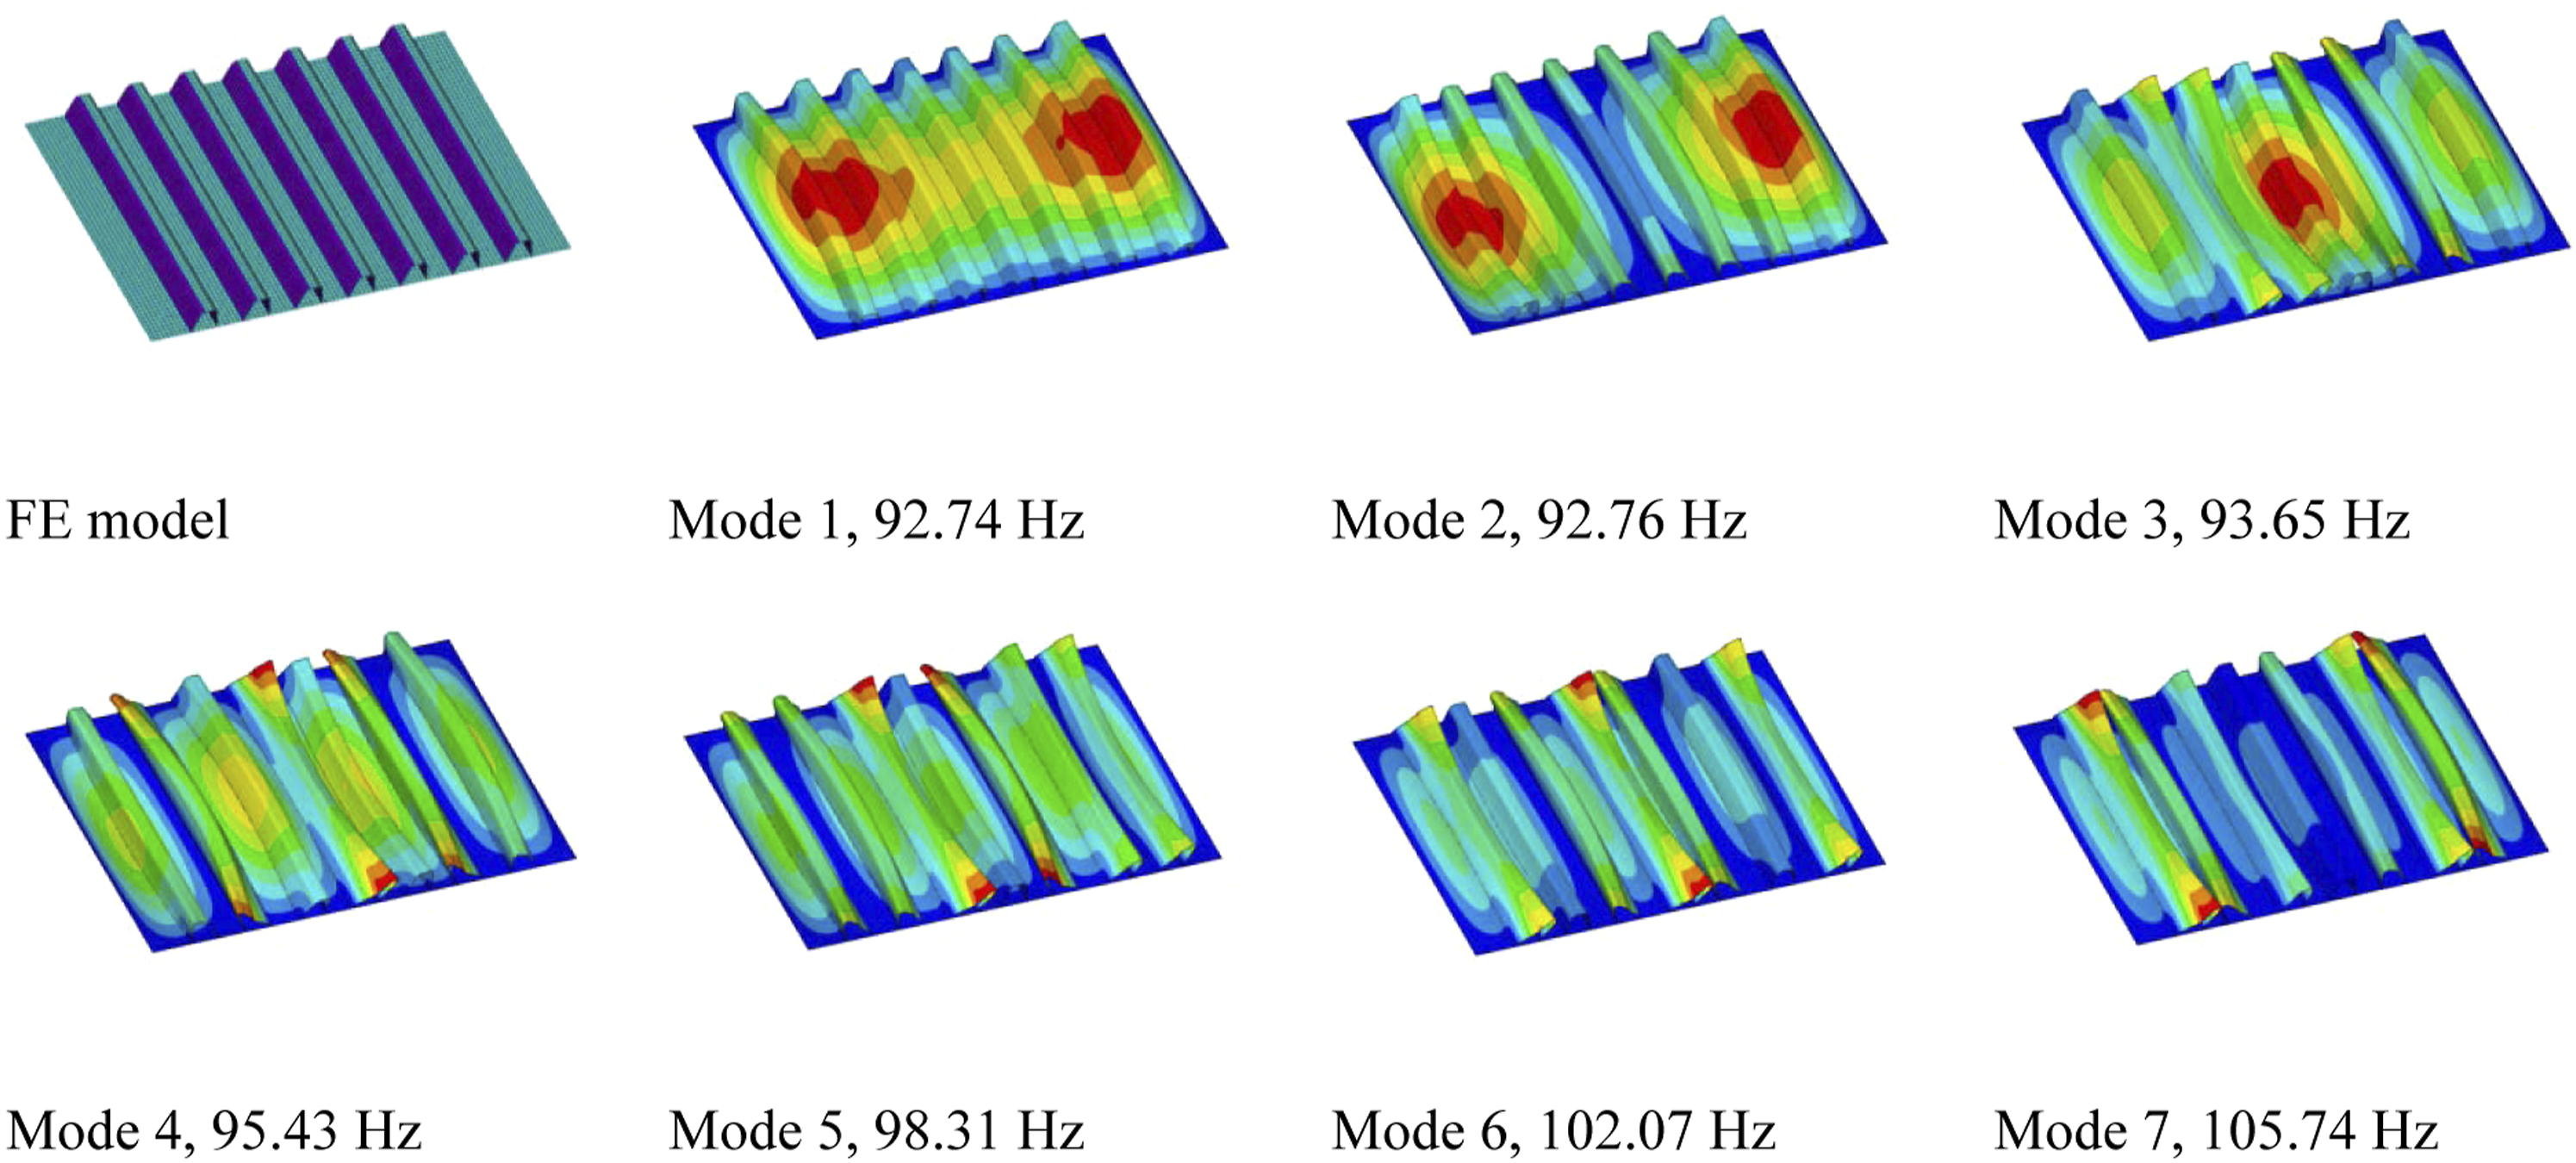
SI levels in the baseplate
The transmission of vibrational energy in the baseplate is considered first. Figure 7 gives the SI vectors in the baseplate at excitation frequencies of f = 93 Hz (dominated by the overall vibration), f = 95 Hz (dominated by overall + local vibrations), and f = 105 Hz (dominated by local vibration). R1 to R7 represent the corresponding positions of seven U-ribs on the baseplate. The arrows represent the normalized SI vectors and their lengths represent the relative values of the SI vectors. SI vectors in the baseplate: (a) 93 Hz, (b) 95 Hz, and (c) 105 Hz.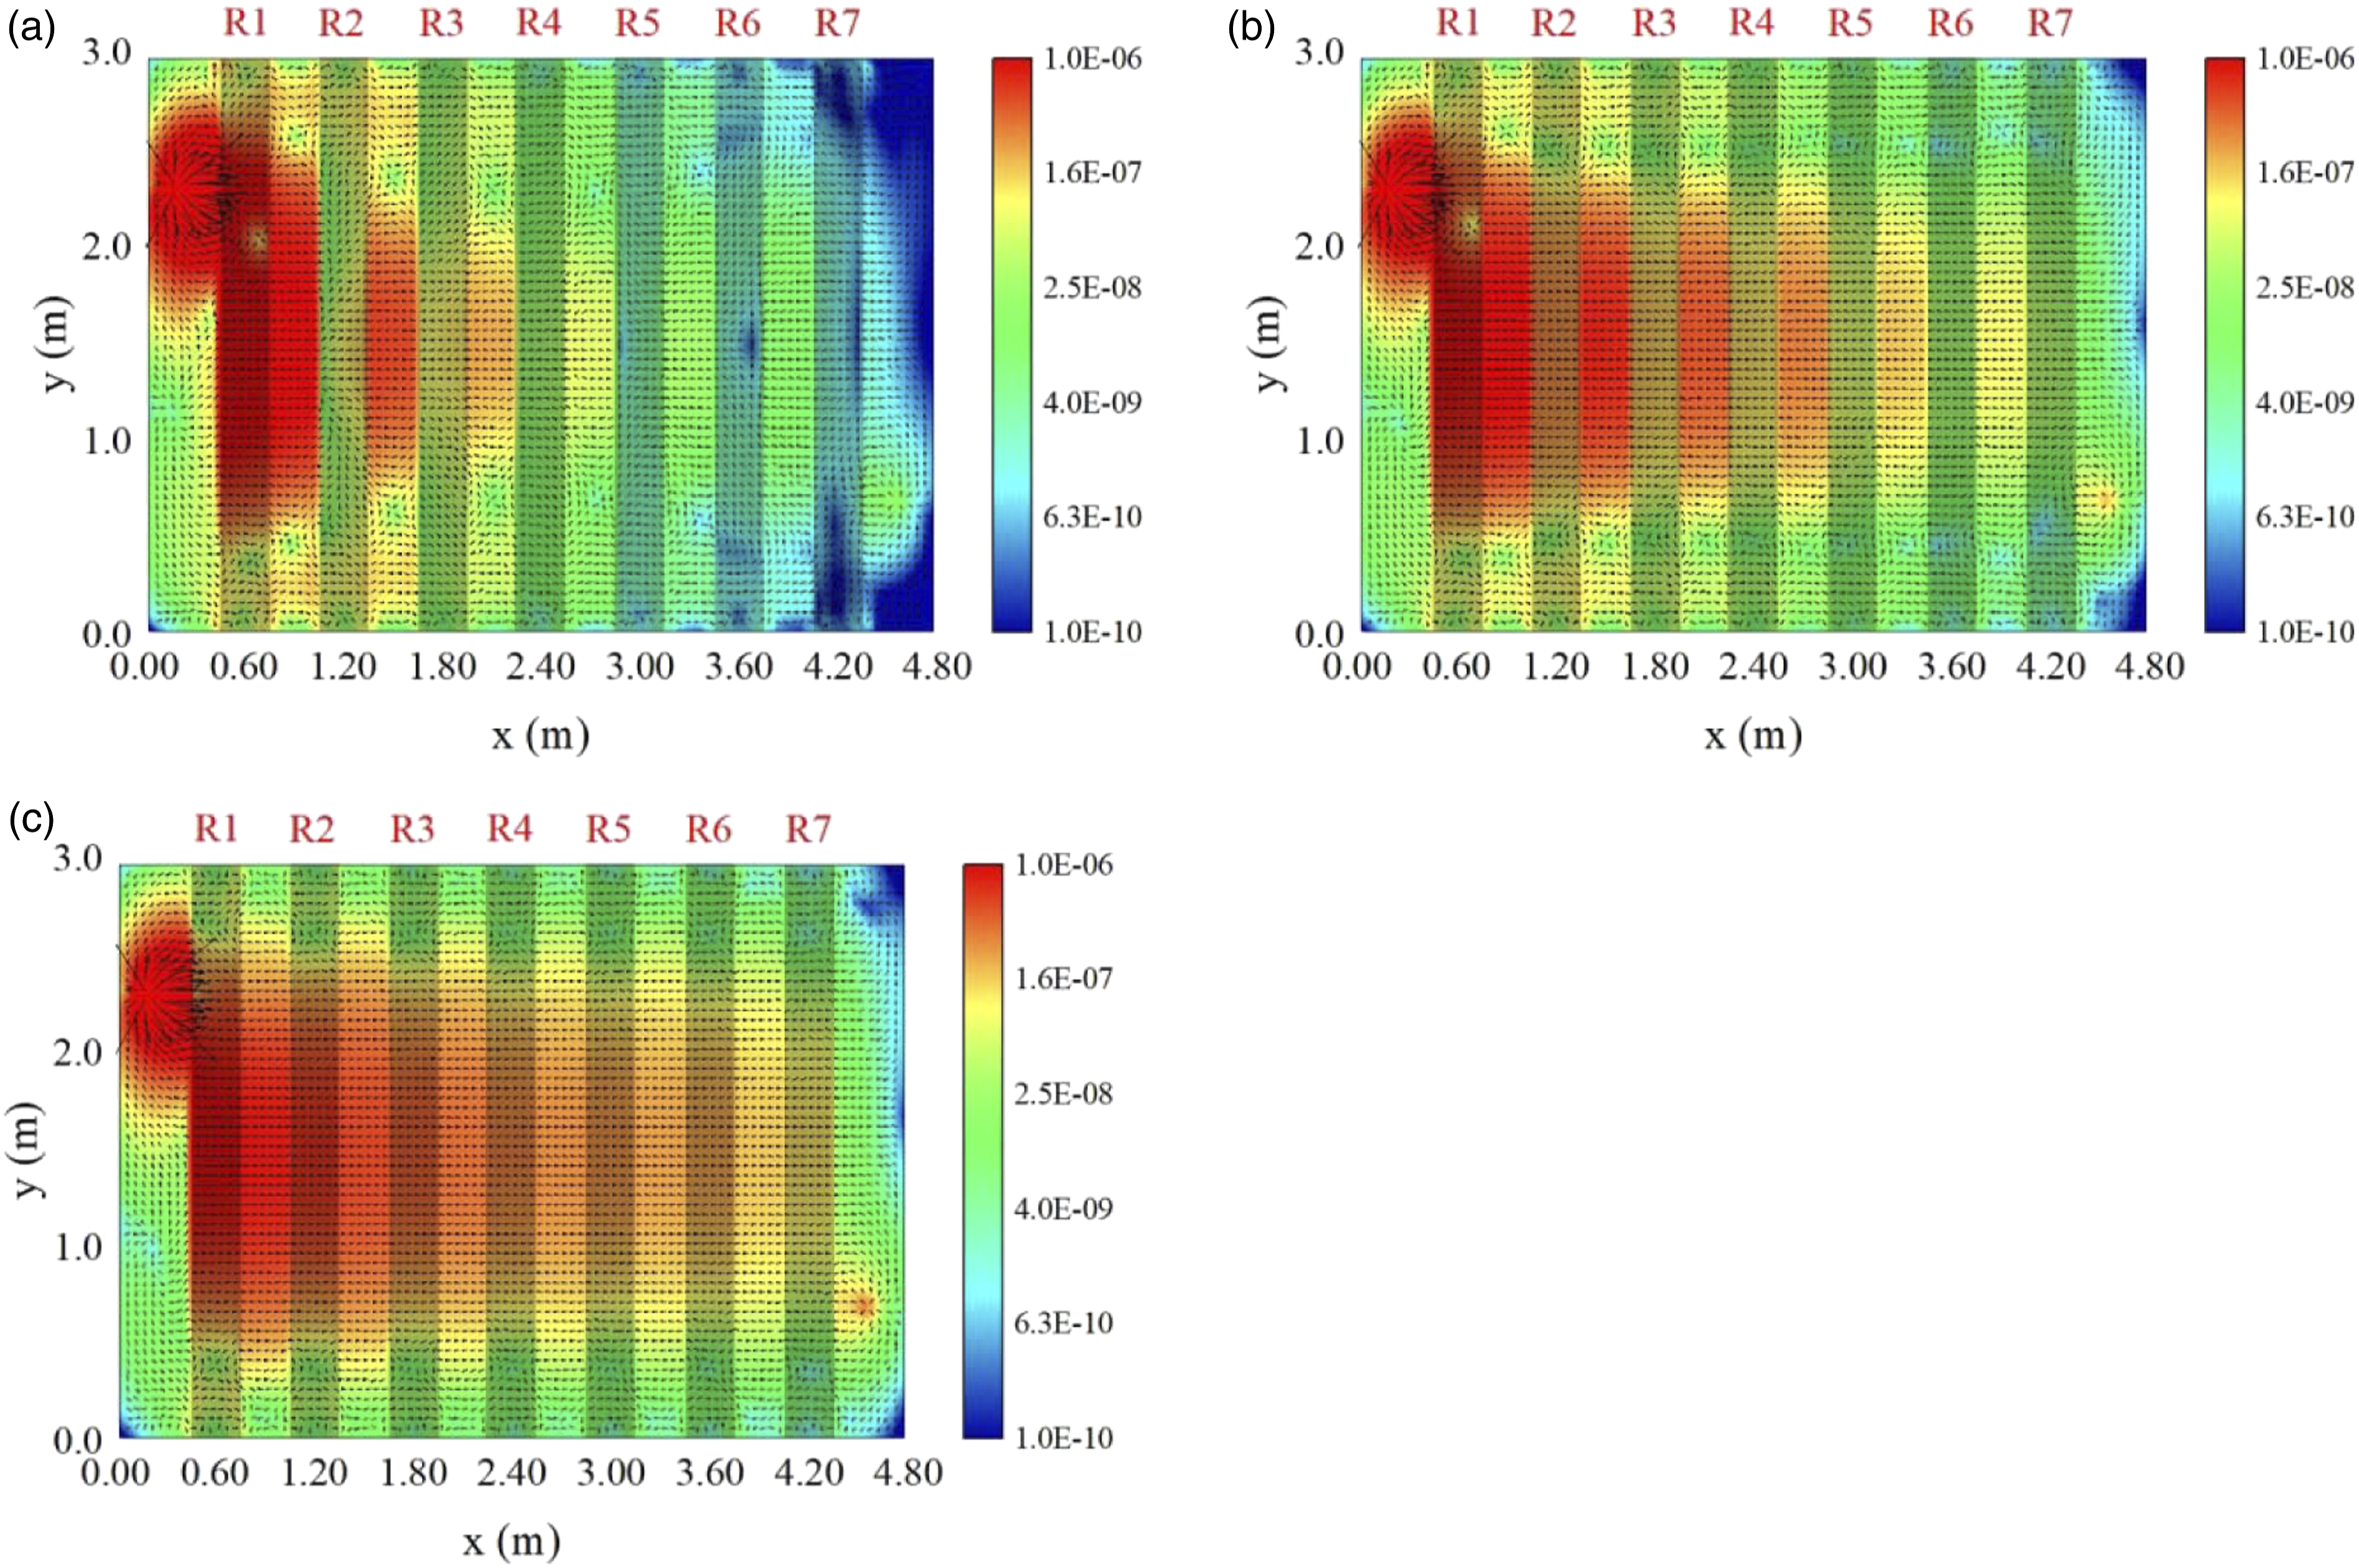
In this case, the vibrational energy diffused from the excitation point and decreased as it arrived at the dashpot and the fixed boundary. The U-ribs acted a significant barrier to transmission and helped “redistribute” vibrational energy as it was uniformly diffused in the baseplate. The peak SI amplitude occurred at 93 Hz, which is consistent with the mode dominated by the overall vibration.
Properties of vibration attenuation
Figure 8 shows the sum of SIs in different cross-sections along the x-axis. For each position (see Figure 8(a)), the peak SI occurred at approximately 93 Hz, which was close to the natural frequency of the structure. A comparison of Figure 8(b)–(d) shows that the effect of attenuation of the U-ribs was significant. After crossing R1, the total SI of the baseplate decreased significantly, with an average attenuation of about 18 dB over the entire frequency band. x = 400 mm (see Figure 8(b)) was the main position of interest for the components of SI. The curves of total SI and components of the bending wave were almost coincident. The order of contribution to the vibrational energy was bending wave > torsional wave > transverse plane wave > longitudinal wave. This indicates that the bending wave had the largest vibrational energy, and was the main contributor to vibrations of the baseplate. When the distance to the excitation position increased (see Figures 8(c)–(f)), the energy of the bending waves decreased gradually. At x = 2700 mm (see Figure 8(f)), the bending wave had decreased to become negligibly small by then. The large bending and torsional stiffnesses of the U-rib caused the out-of-plane wave to rapidly attenuate. Total SI and SI values of the components of different cross-sections in the baseplate: (a) schematic of the studied section, (b) p1, x = 400 mm, (c) p2, x = 900 mm, (d) p3, x = 1500 mm, (e) p4, x = 2100 mm, and (f) p5, x = 2700 mm.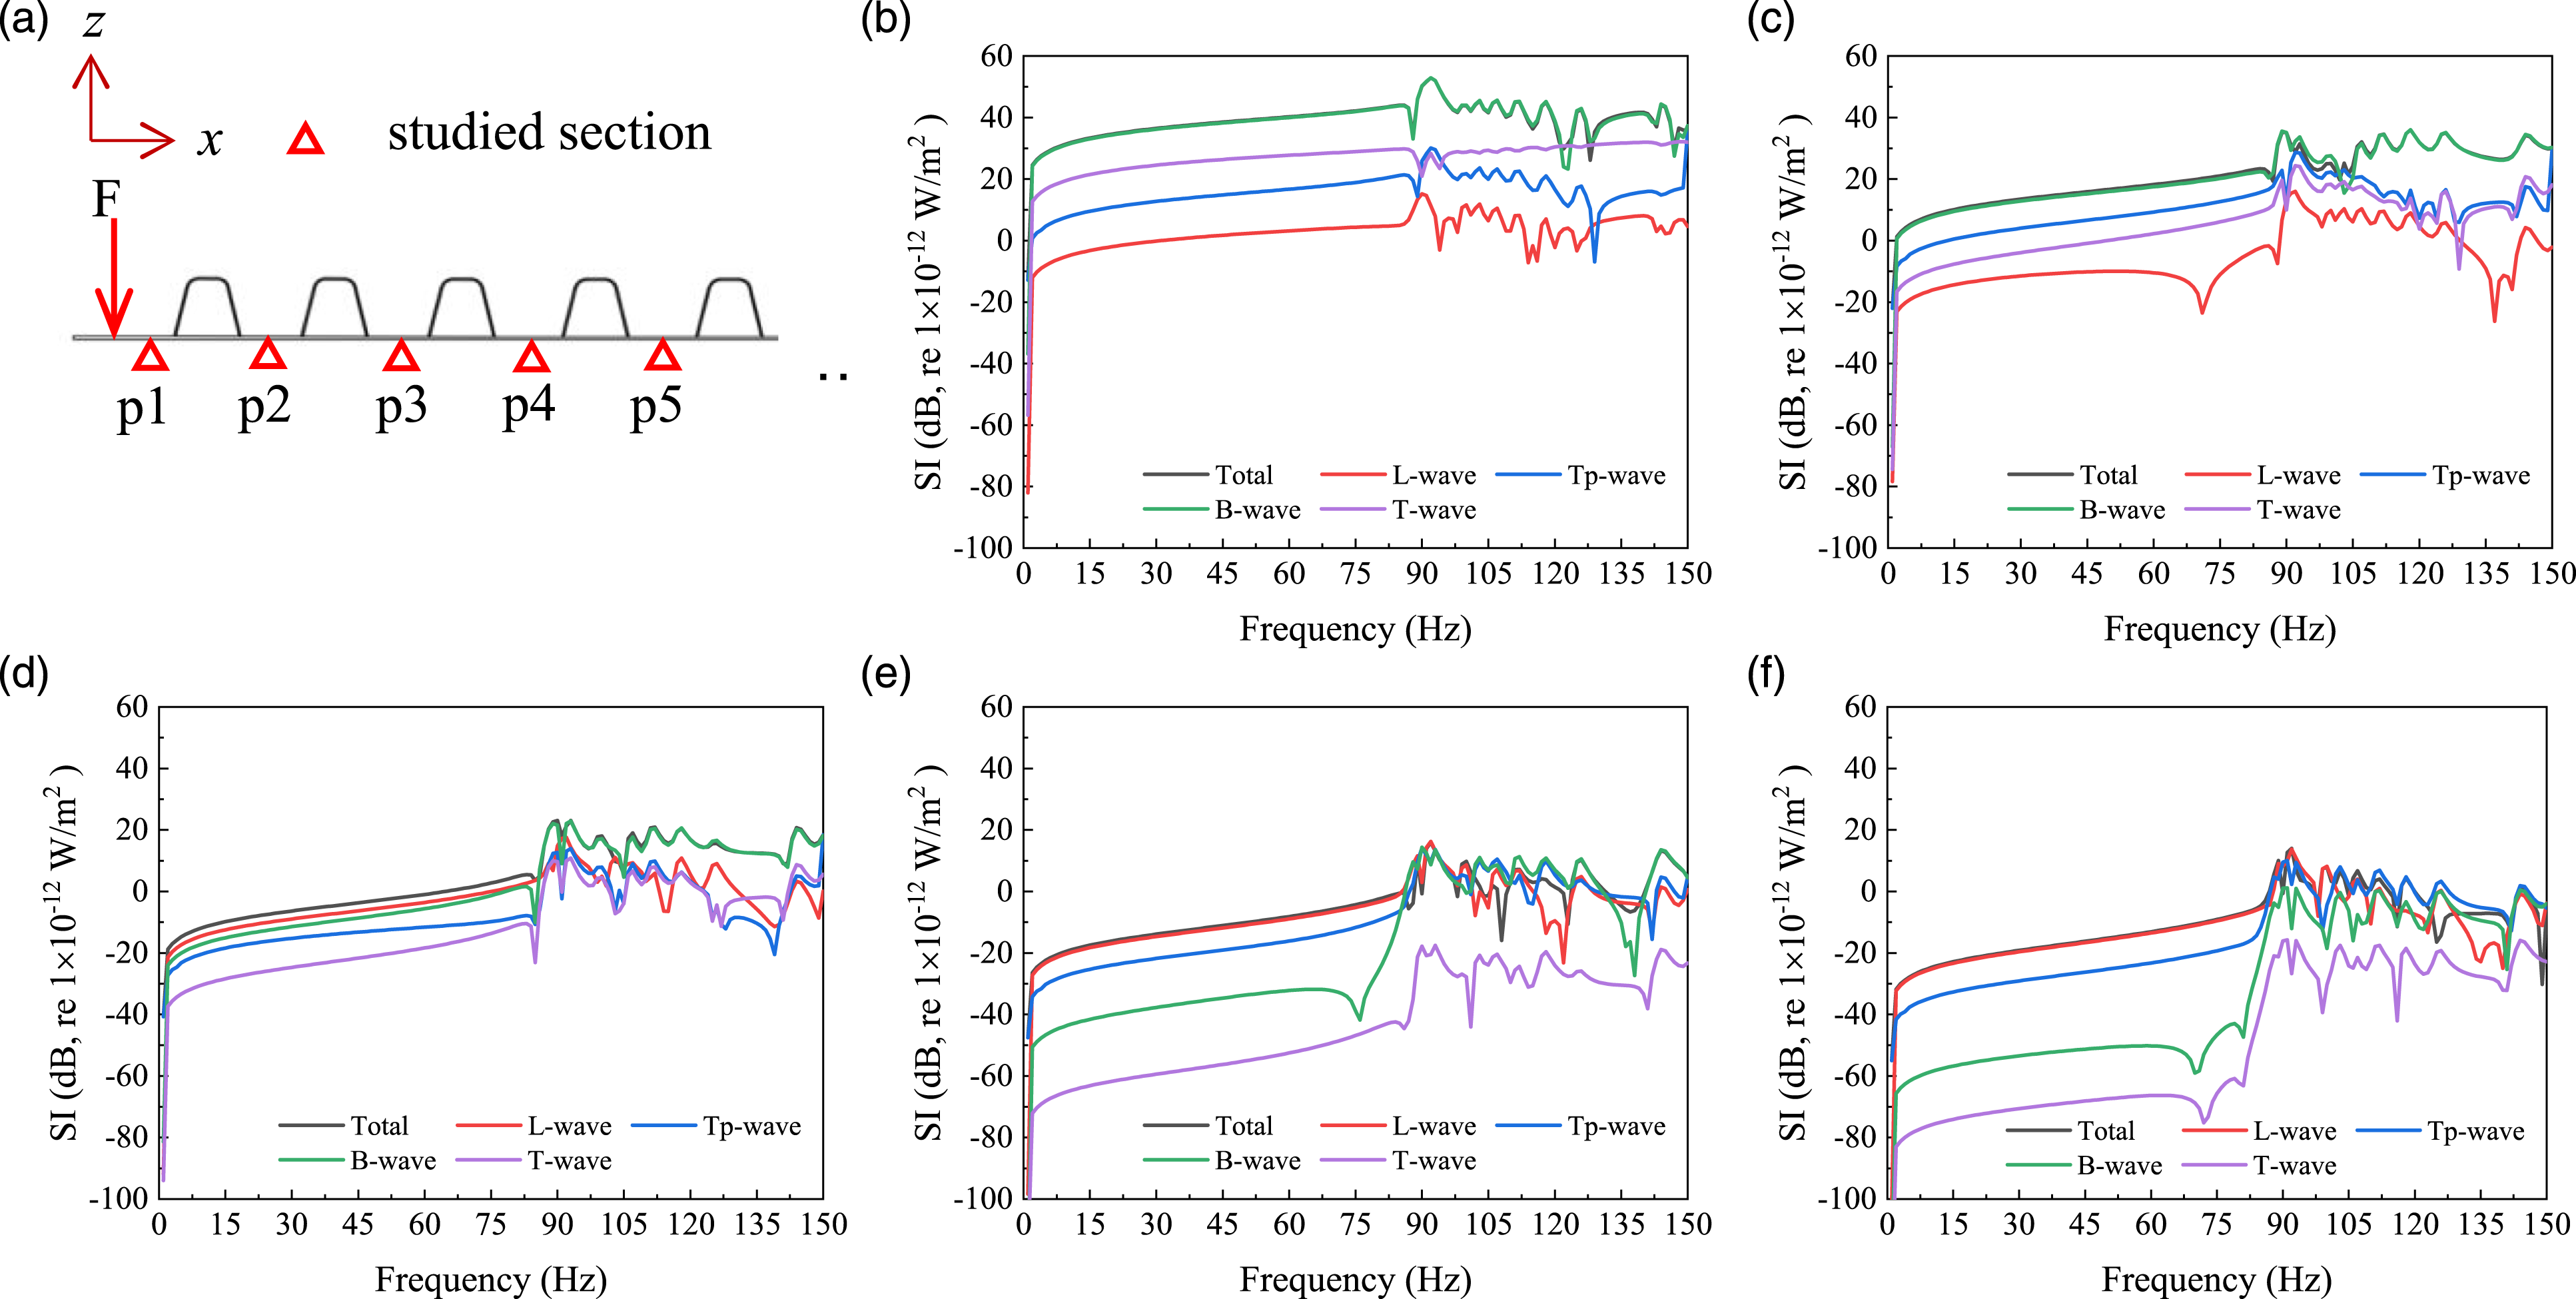
Contribution of SI components
Figure 9 shows the distribution of the SI components of the baseplate at 93 Hz. The bending wave made the largest contribution to the transmission of vibrational energy, with a peak value of 2.15 × 10⁻⁵ W/m2 (compared with values of 1.09 × 10⁻⁷ W/m2 for the longitudinal wave, 1.18 × 10⁻⁷ W/m2 for the transverse plane wave, and 9.11 × 10⁻⁷ W/m2 for the torsional wave). Hence, the bending wave played a dominant role in the vibrational energy of the SI of the baseplate. However, the peak of the component of the torsional wave (see Figure 9(d)) occurred near the boundary because of which the energy it carried needed to be attended to even though it exhibited a non-dominant amplitude. The effect of “redistribution” of the U-ribs was mainly reflected in the component of the bending wave, and the vibrational energy carried by the longitudinal and the transverse plane waves could freely cross through the U-ribs without changing their direction of transmission. Components of SI of the baseplate (93 Hz): (a) longitudinal wave, (b) transverse plane wave, (c) bending wave, and (d) torsional wave.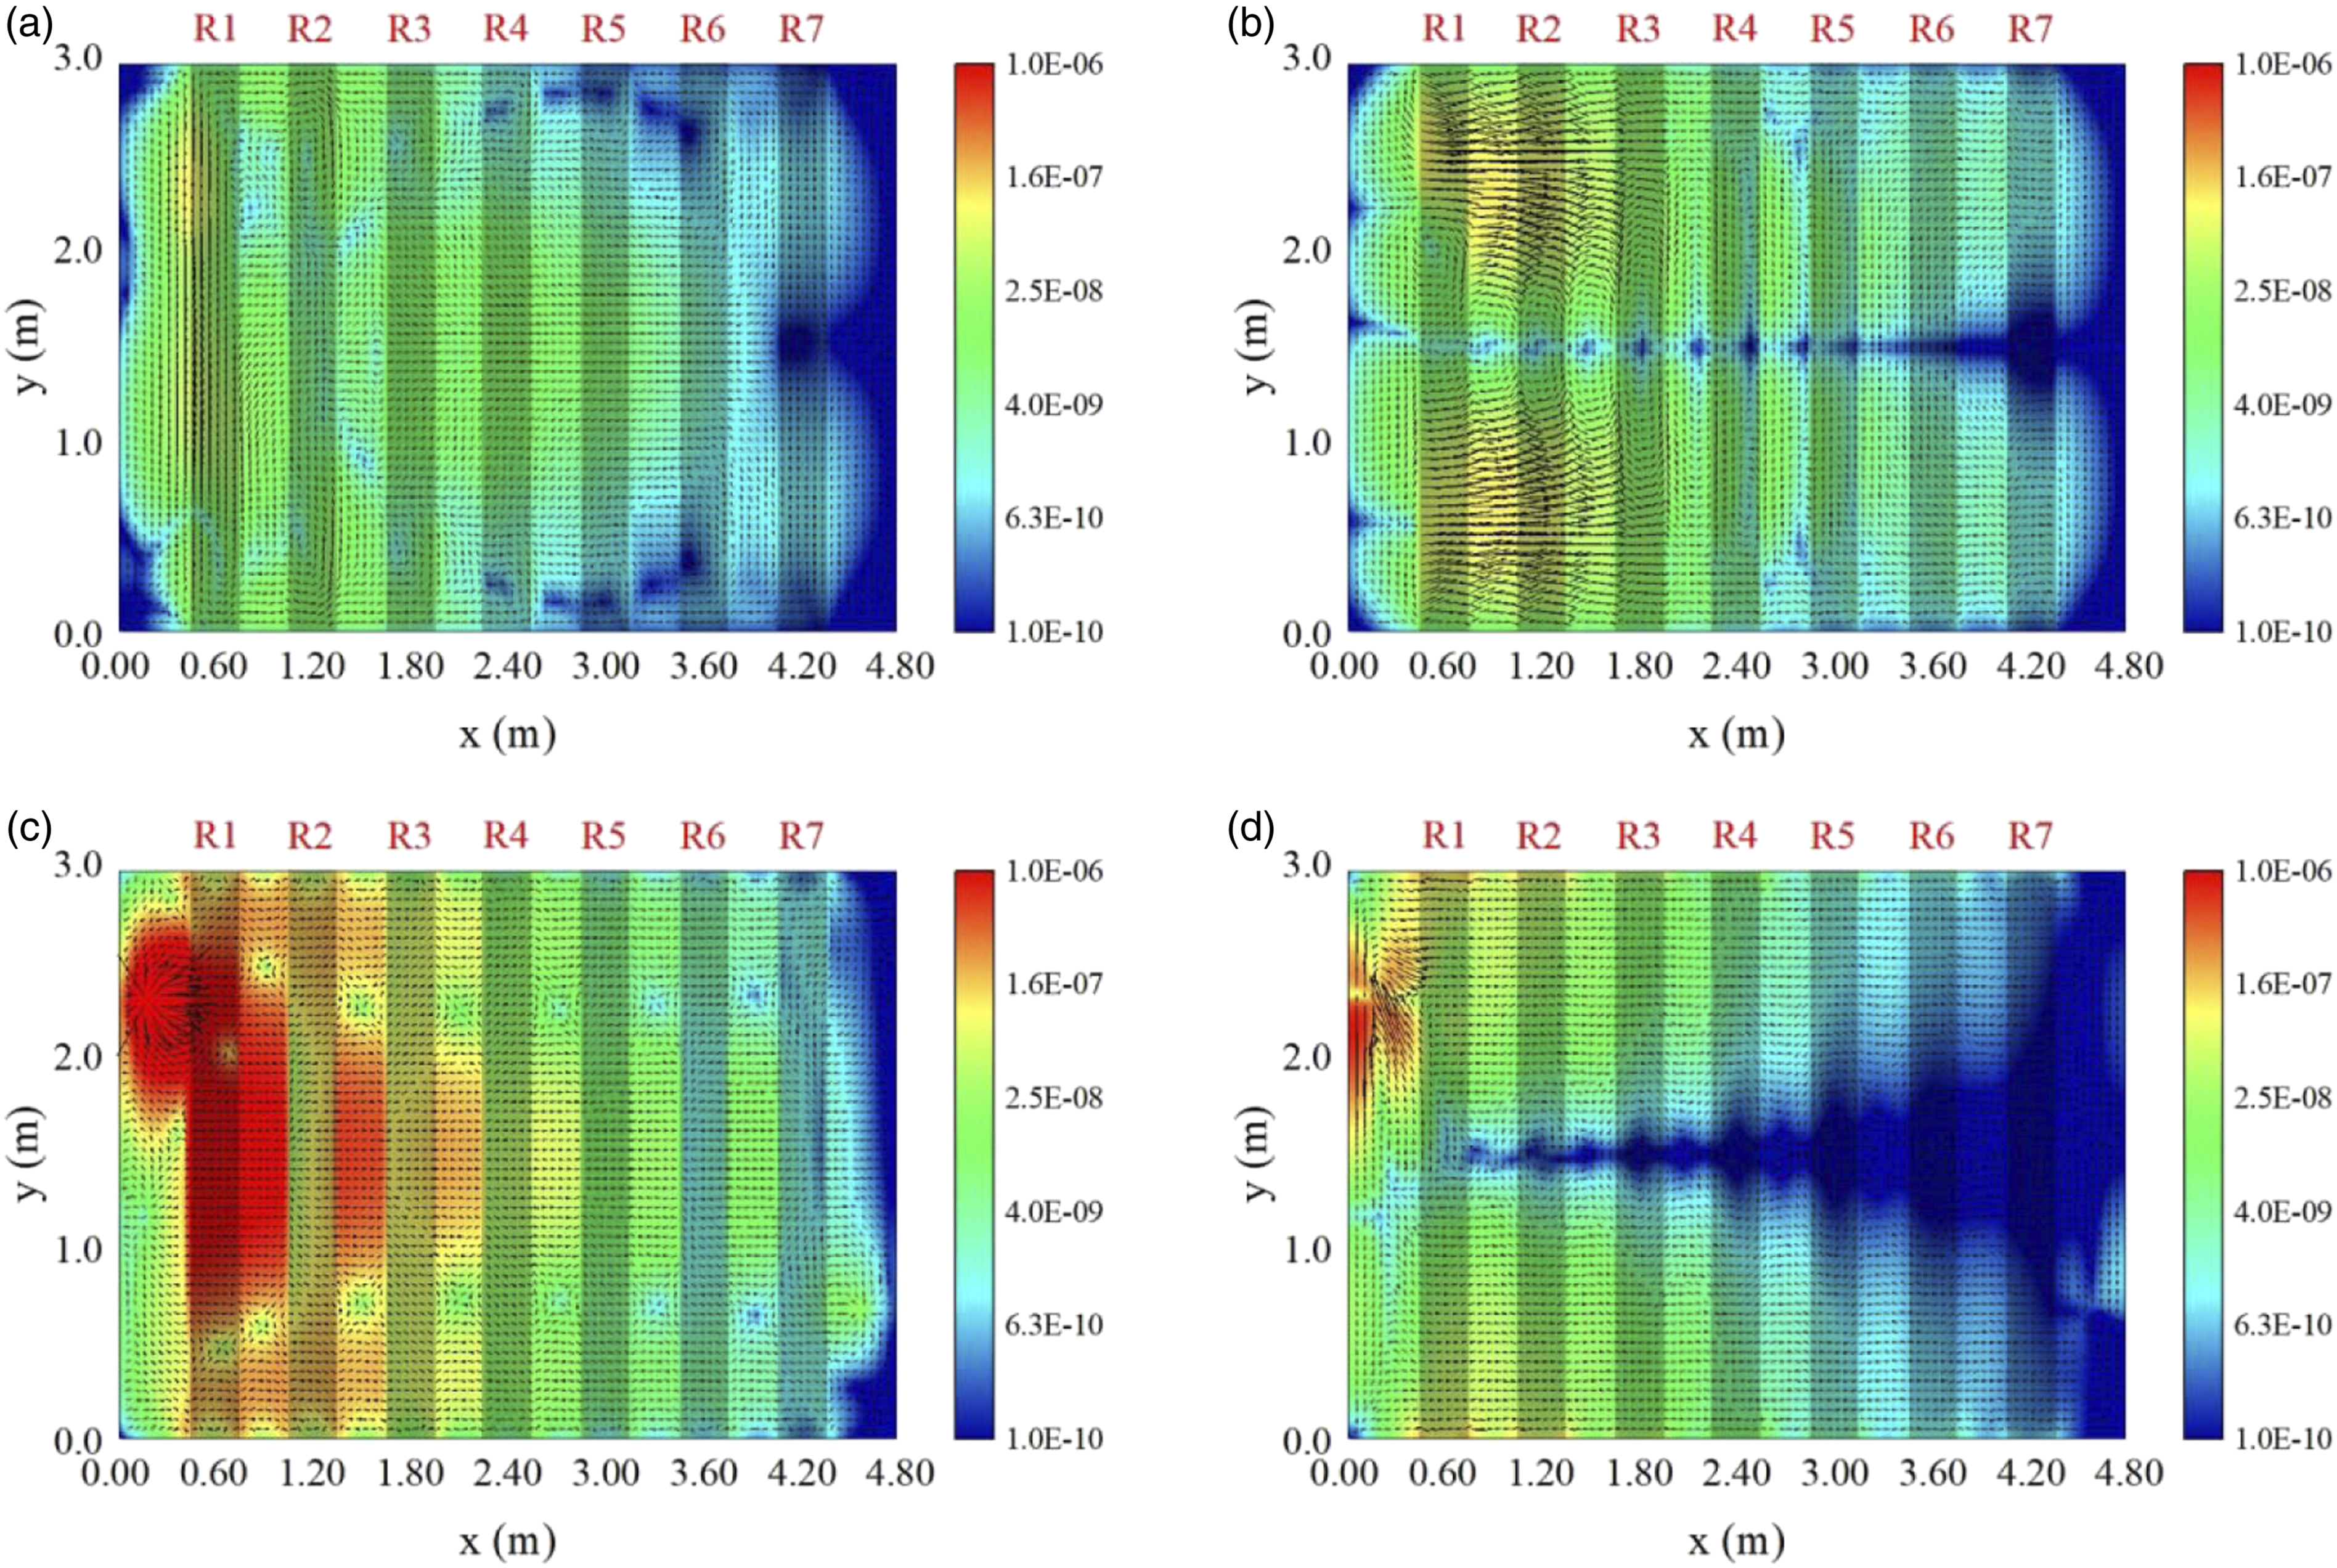
SI levels in the stiffeners
This section investigates the characteristics of transmission of the vibrational energy in the stiffeners. For a single-U-rib system, when the vibration is transmitted transversely (along the x-axis) along the stiffened plate, it is transmitted through two paths: (i) the baseplate and (ii) the baseplate → U-rib → baseplate.
Contribution of SI components
Figure 10 shows the local vector field of the space of SI in the stiffened U-rib plate, where the scale of the baseplate and the U-ribs was identical. The results show that larger SI amplitudes were more widely distributed in the U-ribs than in the baseplate. The peak amplitudes of SI of the baseplate and the U-ribs were 2.15 × 10⁻⁵ W/m2 and 1.33 × 10⁻⁵ W/m2, respectively. The vibrational energy of the U-ribs exhibited relatively large amplitudes and a wider distribution that may lead to stronger local vibration than in the baseplate. Enlarged view of spatial vectors of SI near the excitation force (93 Hz).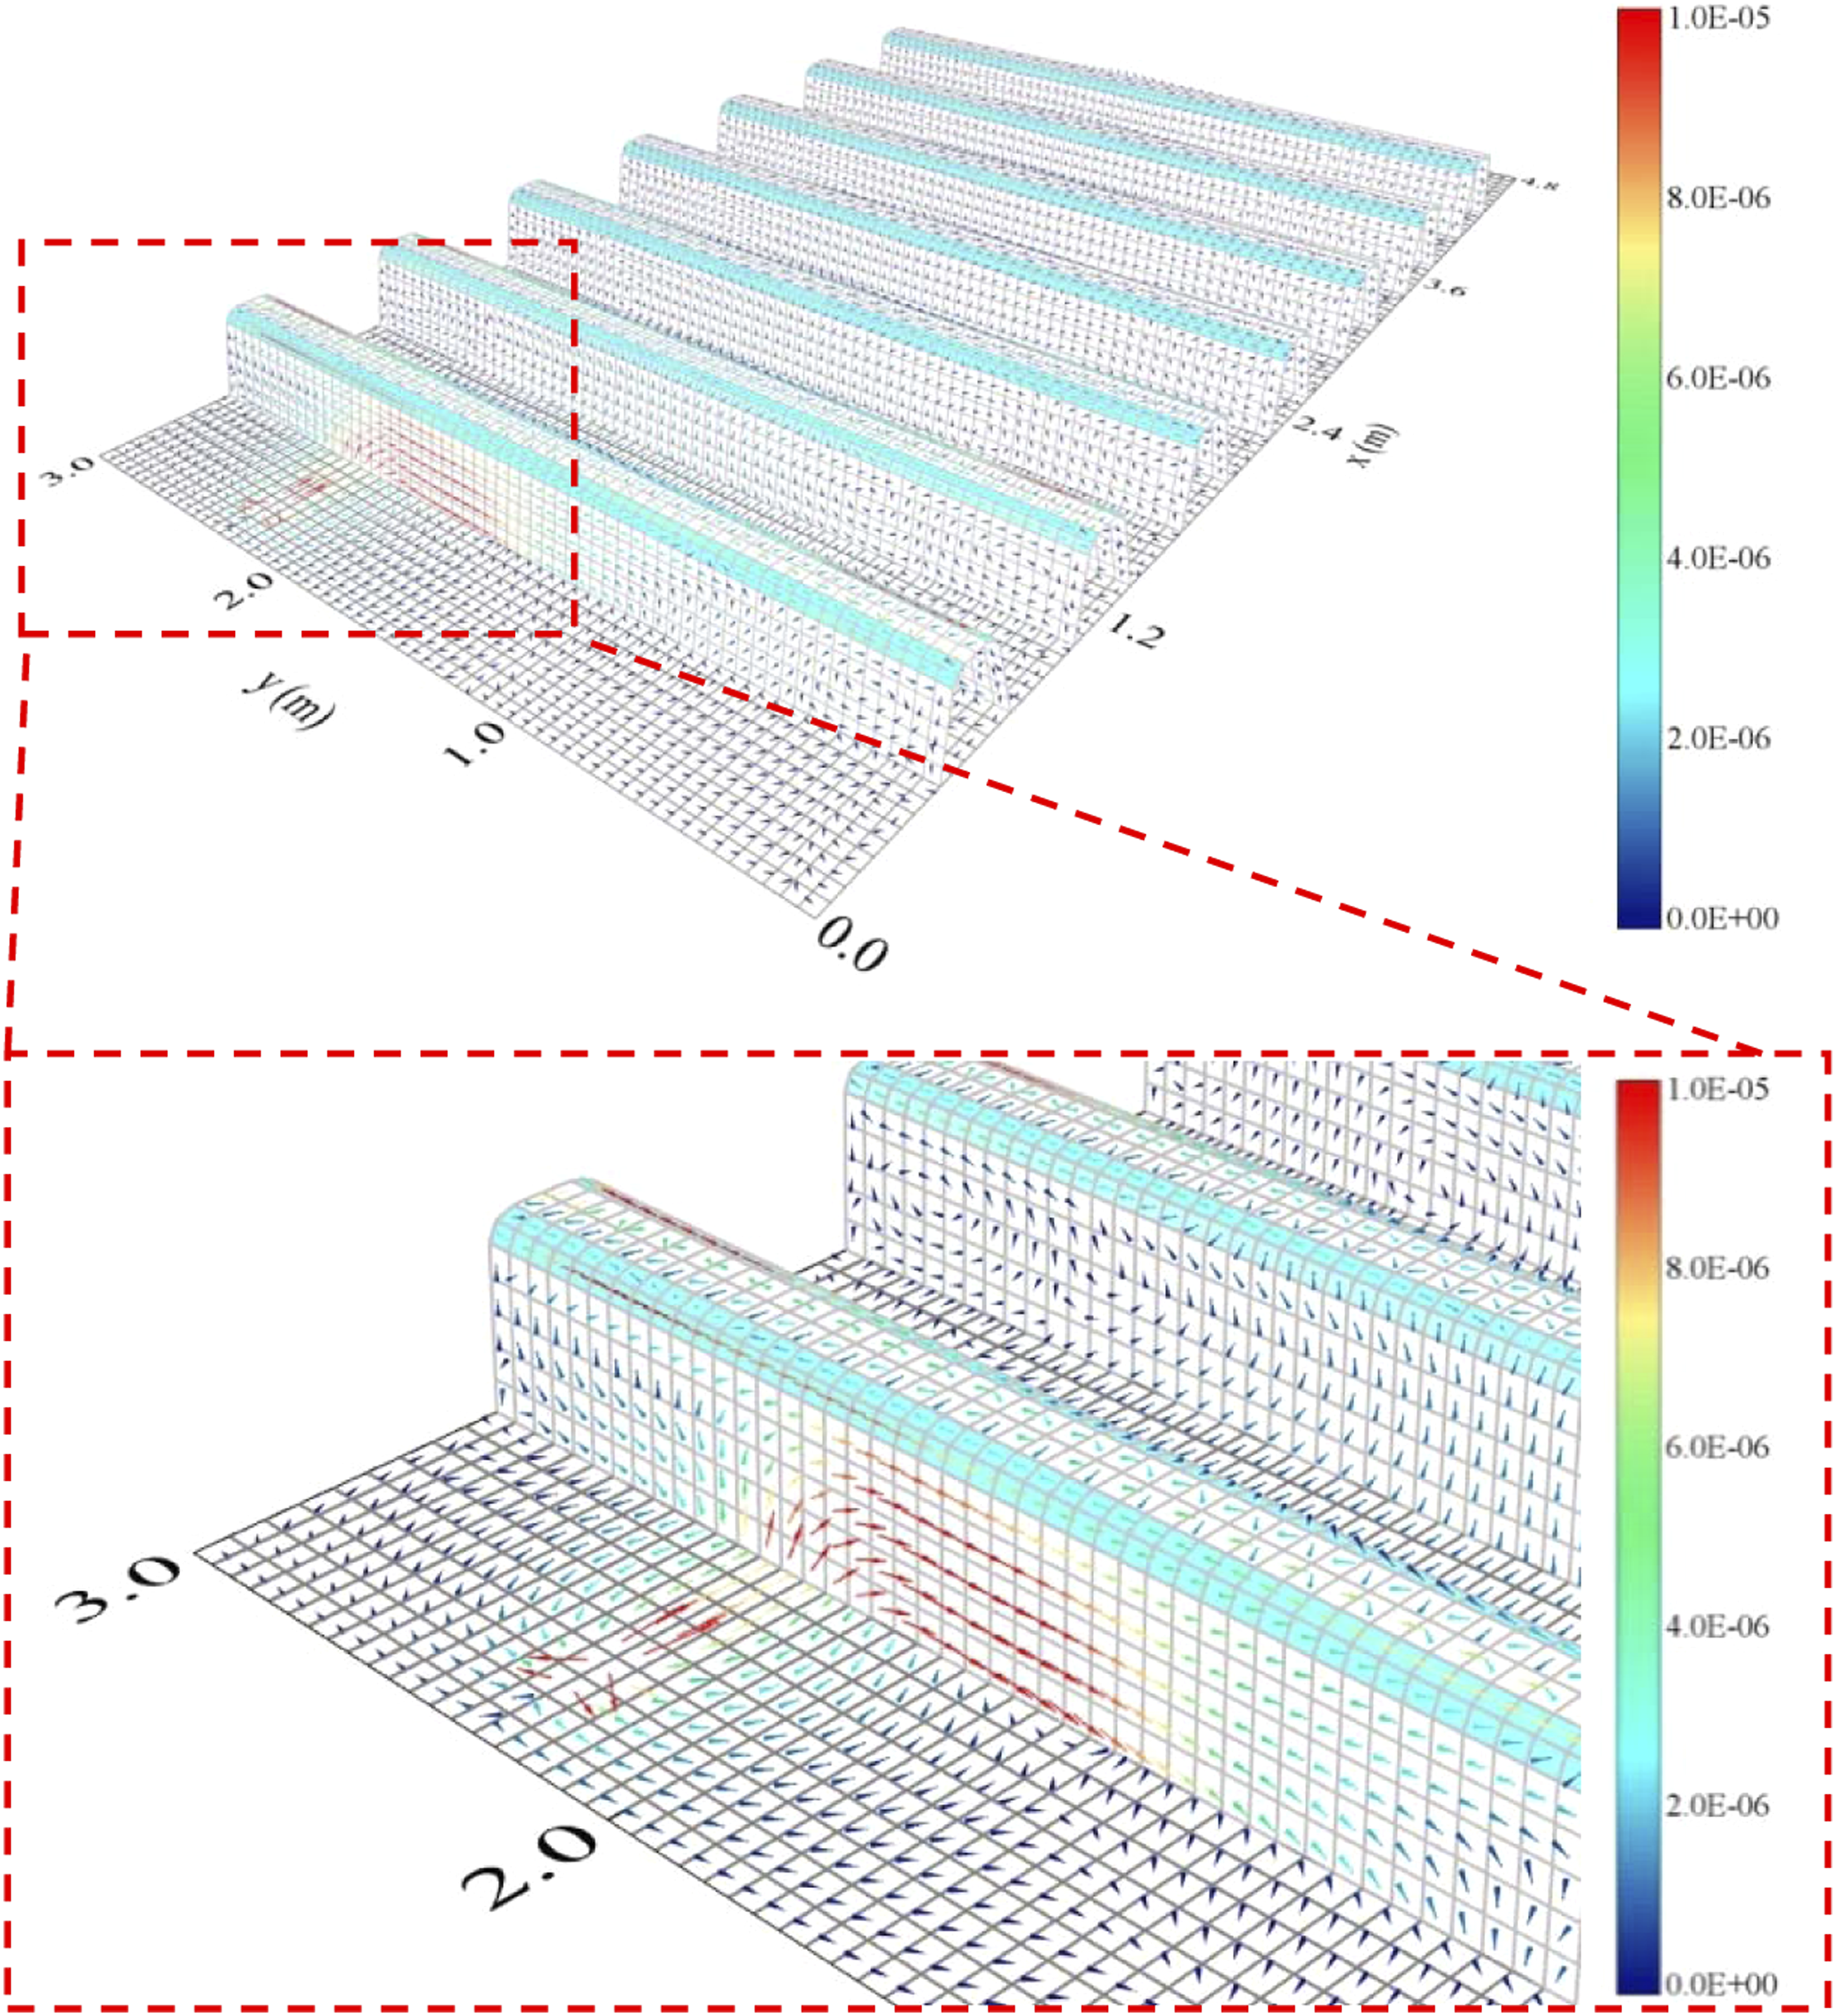
Figure 11 shows the vector fields of the SI space of each component. In contrast to the baseplate, the vibrational energy in the U-ribs was mainly carried by the transverse plane wave and its peak value reached 1.33 × 10⁻⁵ W/m2, while the component of the longitudinal wave also reached a large value of 9.56 × 10⁻⁶ W/m2. The bending wave (1.25 × 10⁻⁶ W/m2) and the torsional wave (2.14 × 10⁻⁸ W/m2) made large contributions to the baseplate but were not significant in U-ribs. Enlarged view of the spatial vectors of components of SI near the excitation force (93 Hz): (a) longitudinal wave, (b) transverse plane wave, (c) bending wave, and (d) torsional wave.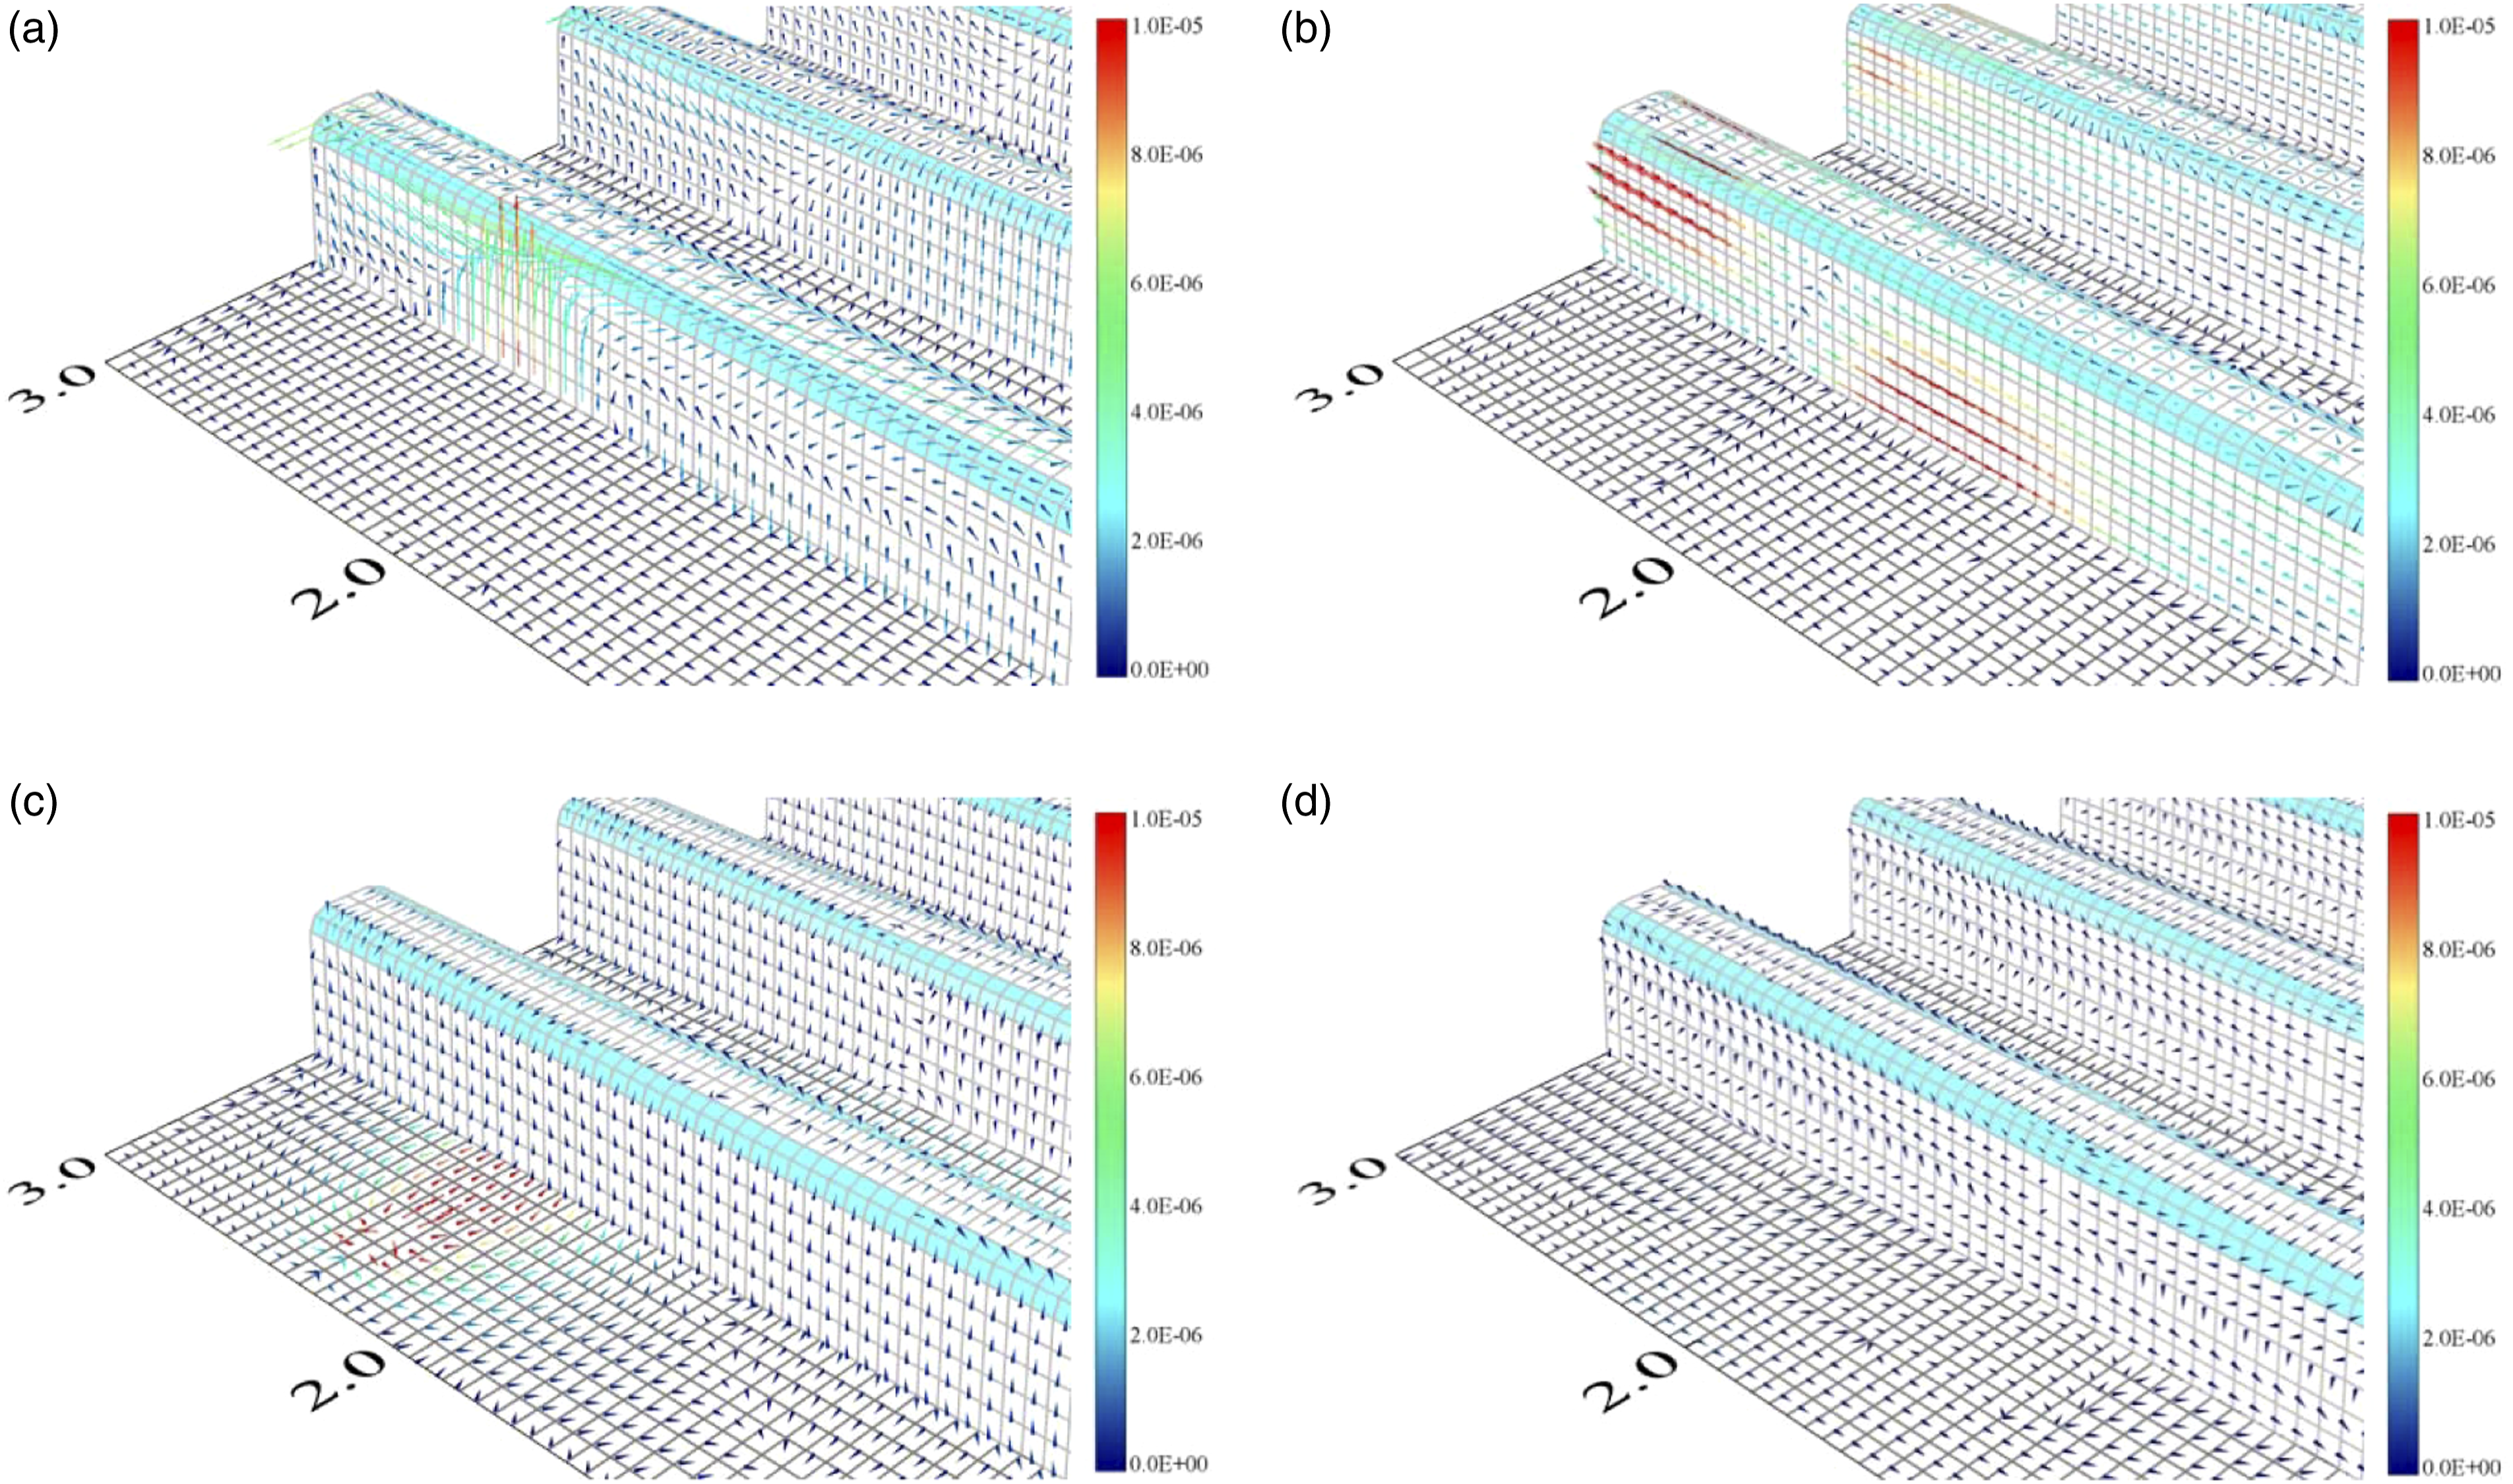
A comparison of Figures 10 and 11 shows that the total SI vector field in the U-ribs featured almost a superposition of the vector field of the components of the longitudinal wave and the transverse plane wave. This revealed the mechanism of vibration transmission in U-ribs. The vibrational energy was carried by the bending wave first and the waveform was then converted at the boundary of coupling, and flowed into the U-rib. Following this, the vibrations were transmitted in the form of the longitudinal waves along the z-axis in the U-rib and were then converted into transverse plane waves along the y-axis. Finally, at the second coupling boundary, they flowed back to the baseplate in the form of bending waves. This explains the “redistribution” effect as well as the sudden changes in energy flow in the baseplate.
Energy transformation and dissipation
The transmission of vibrational energy in the U-ribs at medium and low frequencies is investigated in this section. Figure 12 shows a schematic diagram of the sections for which the vibrational energy was calculated. Figure 13 shows the total SI of each cross-section. The SIs of different sections exhibited the same trend in all frequency bands, 0–150 Hz. Along the x-axis, the degrees of reduction in the vibrational energies of the U-ribs and the baseplate with distance to the excitation position were equivalent. Sections #1 and #4 recorded larger values of SI while sections #3 and #5 yielded lower values. Schematic of the stiffened U-rib plate showing the studied section. All SI vectors of cross-sections of the U-rib.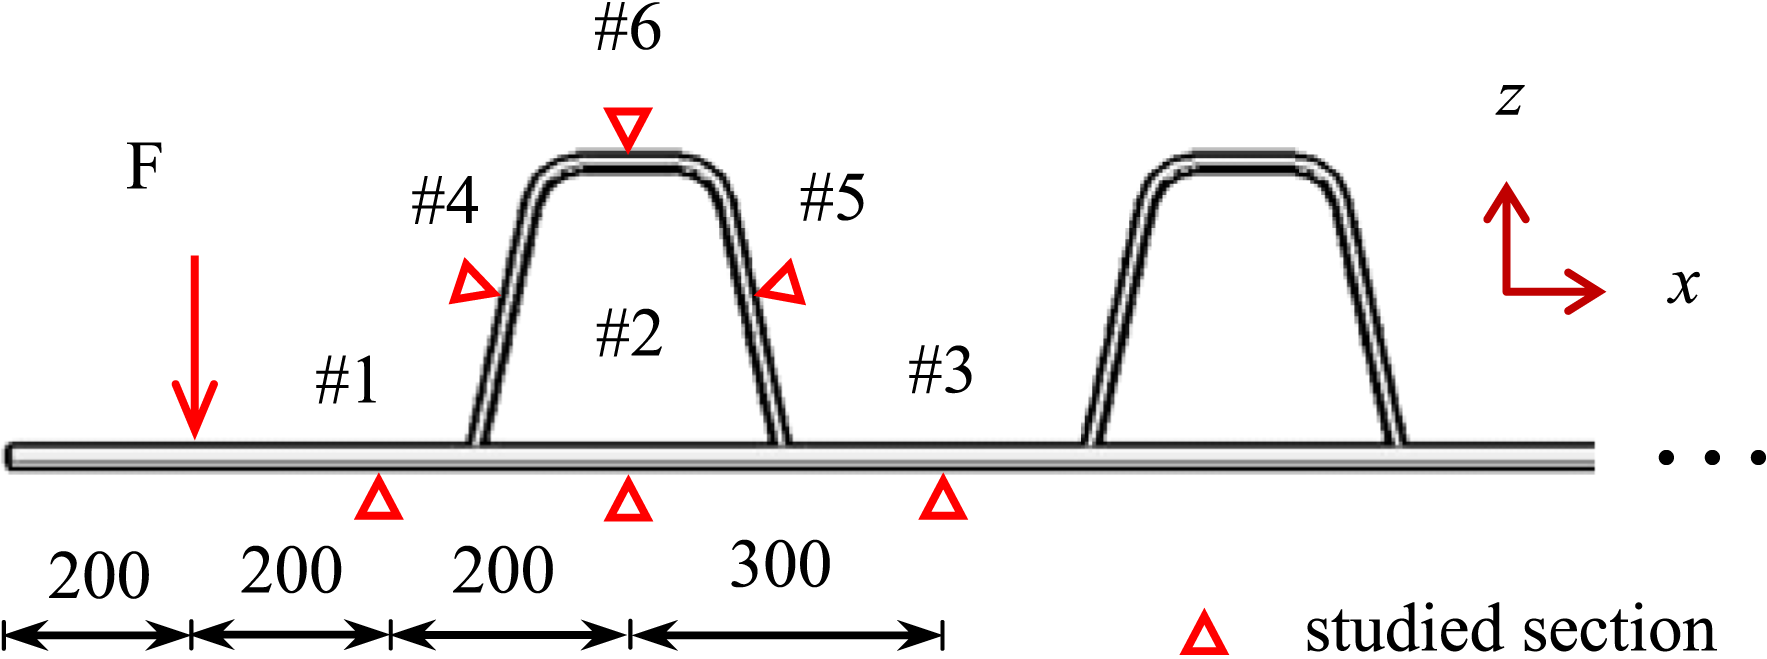
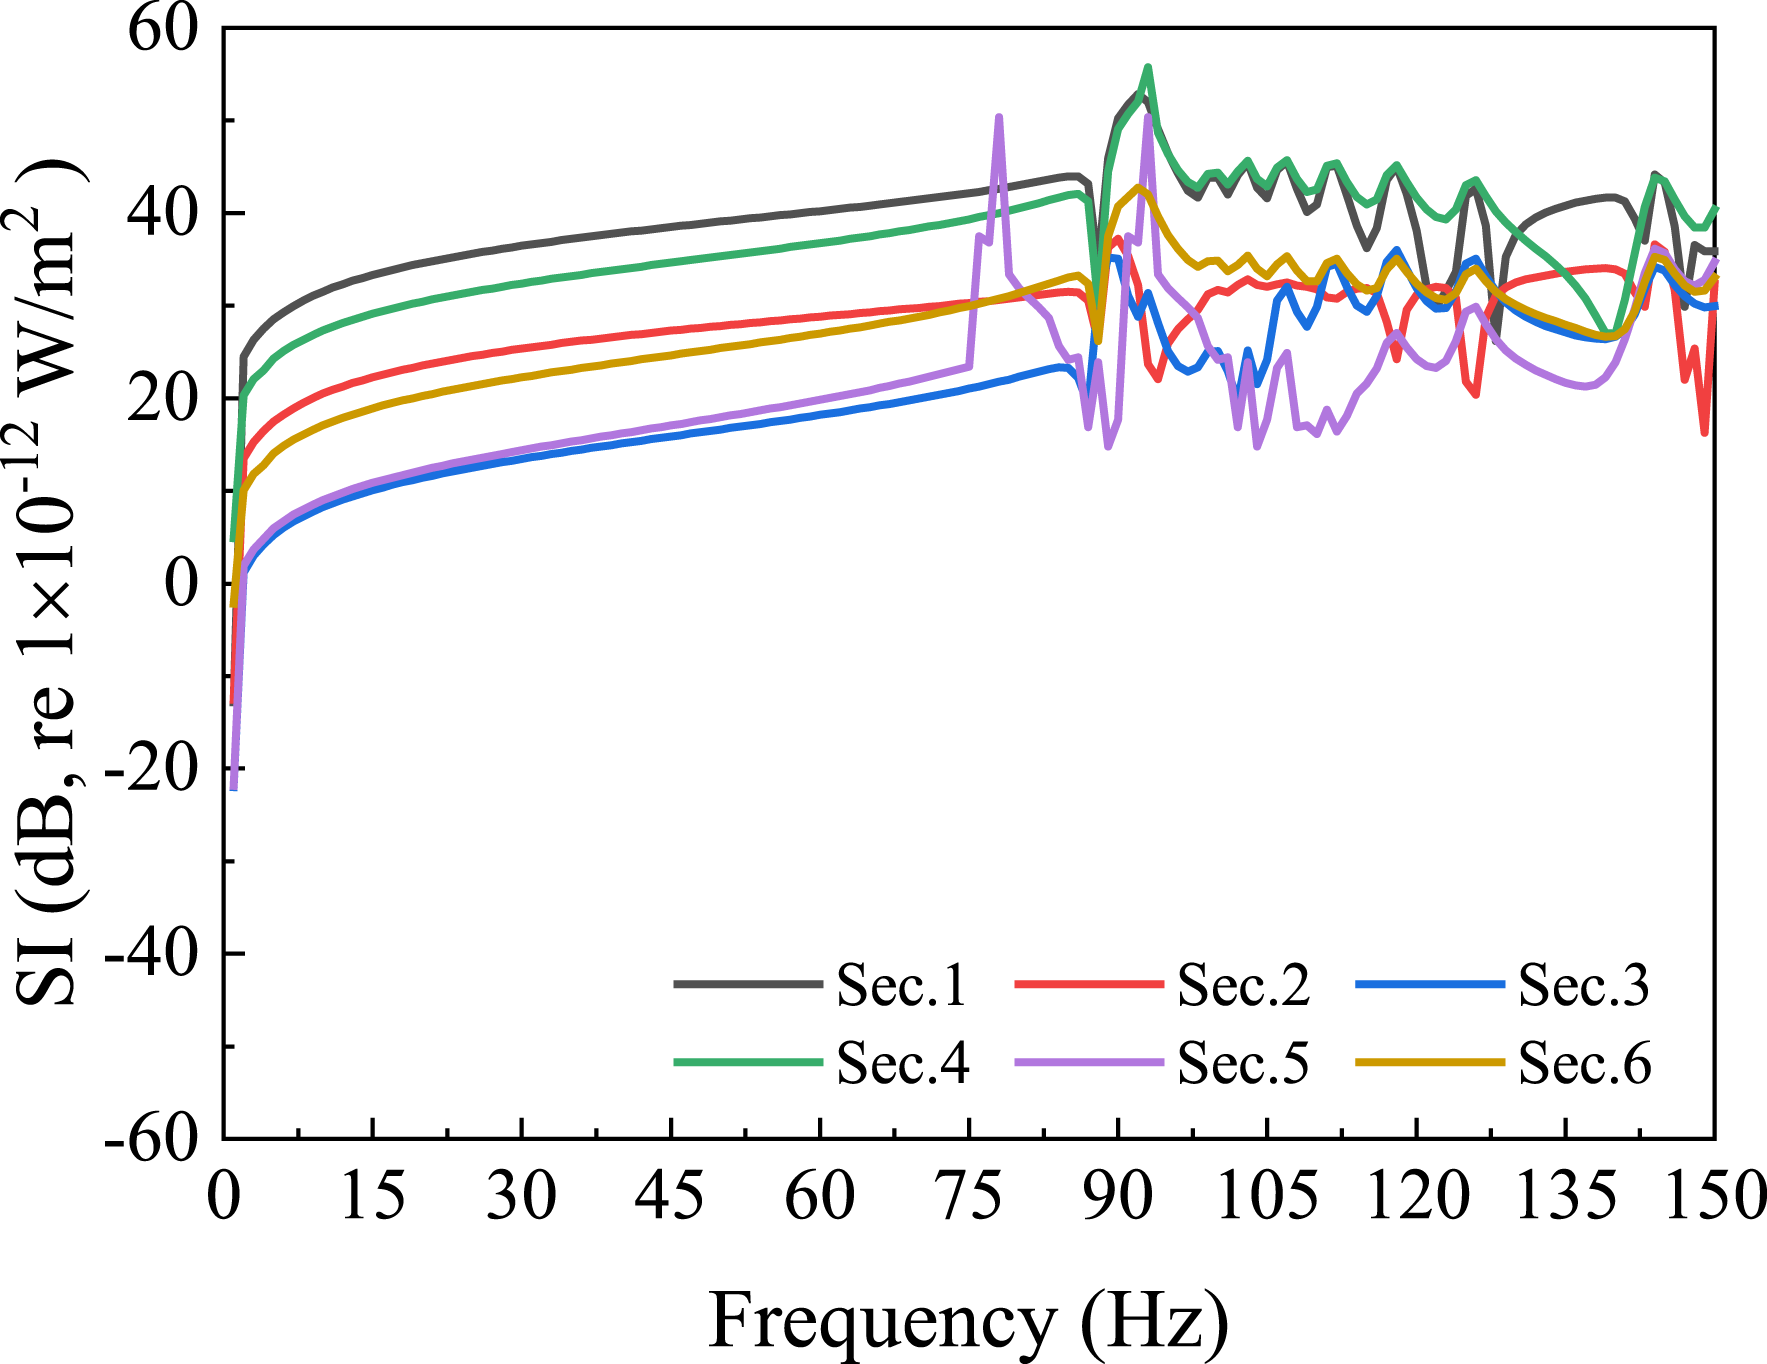
Figure 14 shows the components of the SI of each cross-section. Figure 14(a) and (b) show that the longitudinal and transverse plane waves in the U-ribs (sections #4, #5, and #6) dominated the frequency bands. The bending waves (sections #1, #2, and #3) in the baseplate played a decisive role in energy transmission, and this confirms our hypothesis regarding the conversion of waveforms. Vectors of components of SI of cross-sections of the U-rib: (a) longitudinal wave, (b) transverse plane wave, (c) bending wave, and (d) torsional wave.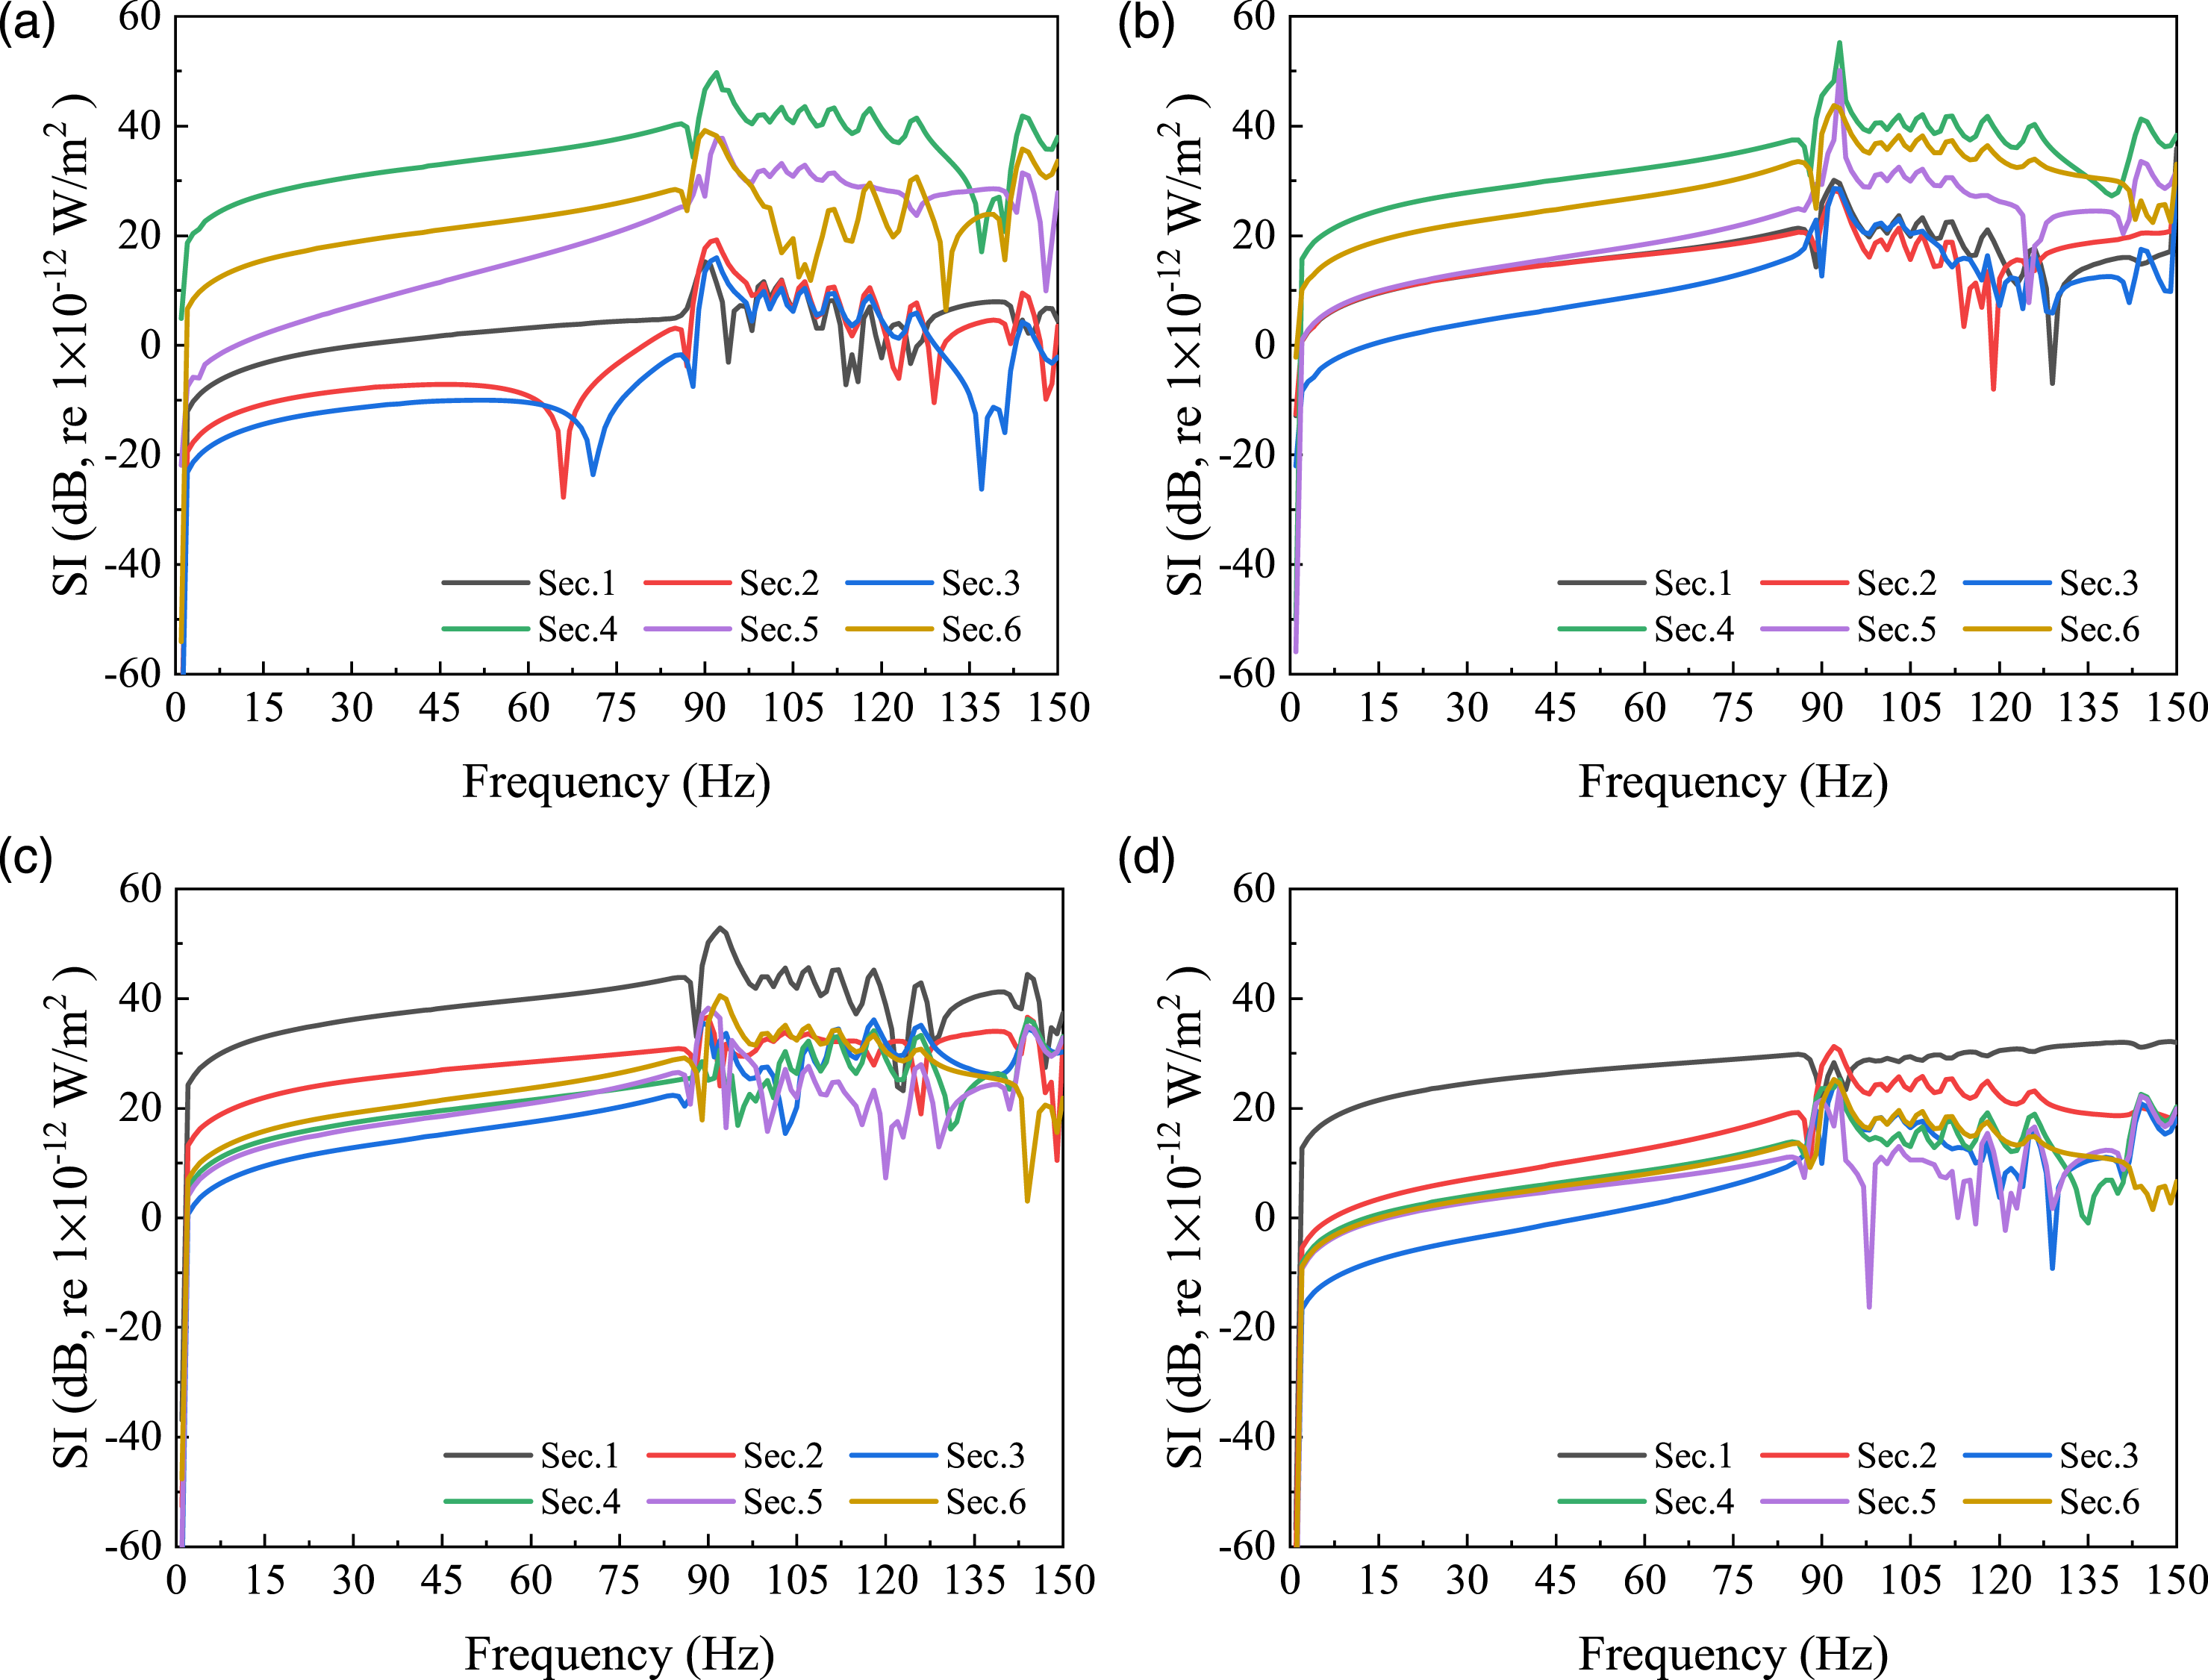
Discussion
Effect of baseplate/U-rib thickness
The thickness of the plate affected the transmission of vibrational energy. Standard component sizes are commonly used for prefabrication in engineering. We thus studied some standard thicknesses of the plate as typical cases.
The total cross-sectional SIs for different thicknesses of the baseplate are shown in Figure 15. When x = 400 mm (see Figure 15(a)), the SI decreased with an increase in the thickness of the plate. The average SIs of each frequency band decreased by 2.8 dB and 1.9 dB, respectively, as the thickness of the baseplate was increased from 12 to 16 mm and from 16 to 20 mm, respectively. Cross-sectional SI levels of baseplates of different thicknesses: (a) p1, x = 400 mm, (b) p2, x = 900 mm, and (c) p3, x = 1500 mm.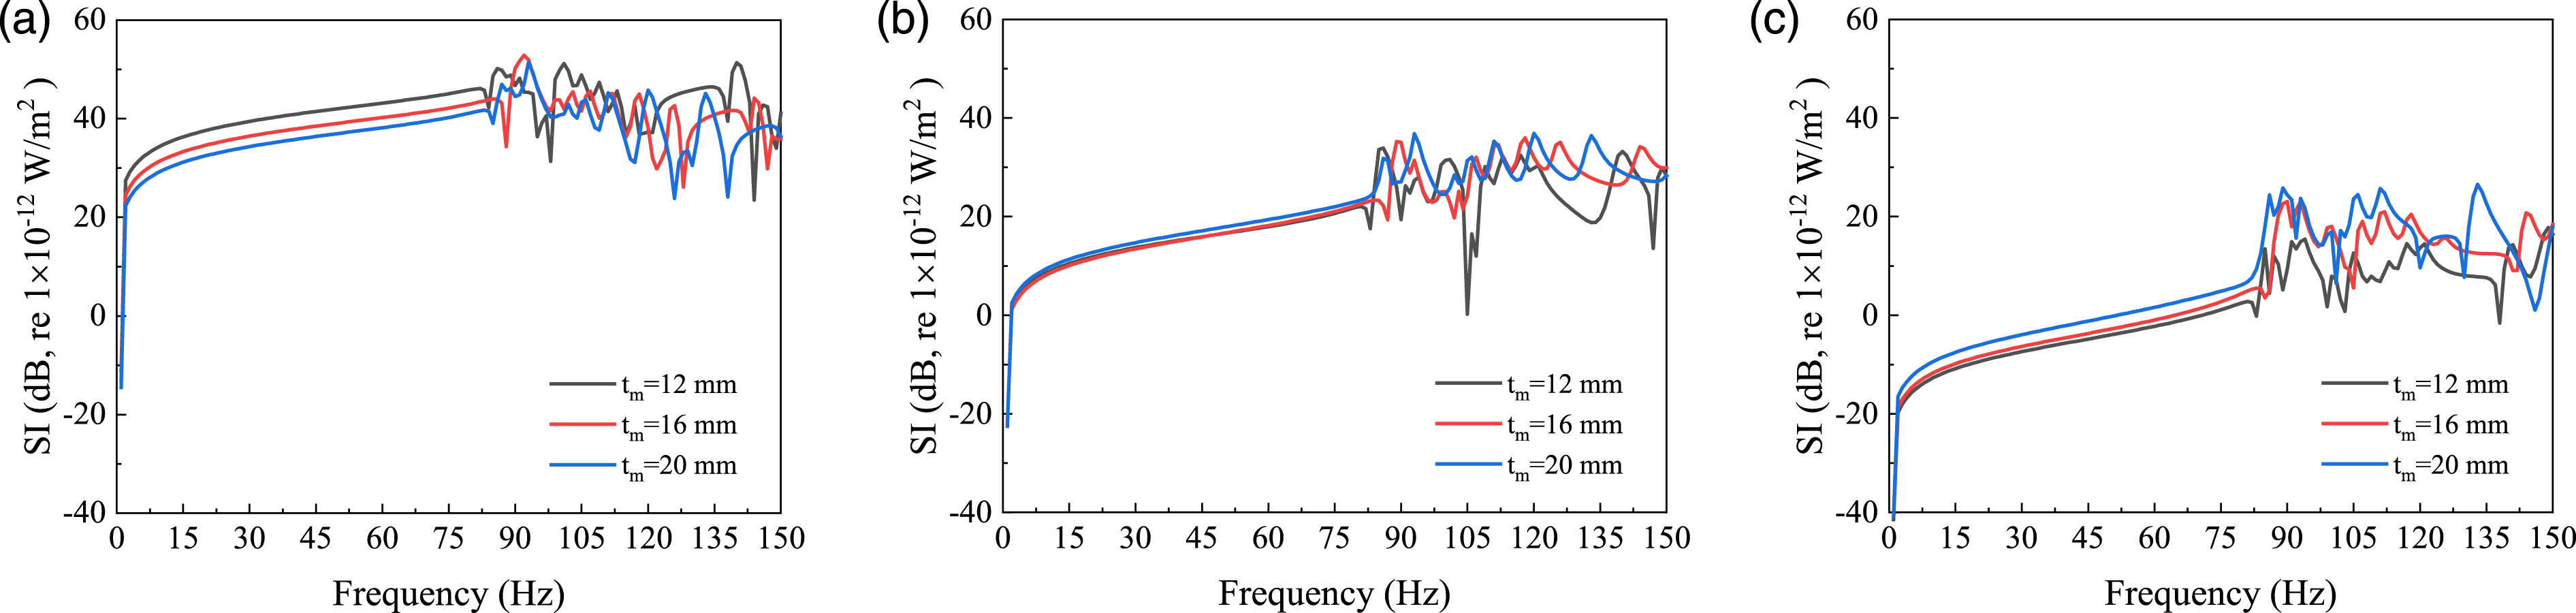
Figure 16 shows the total cross-sectional SIs for U-ribs of different thicknesses. When x = 400 mm (see Figure 16(a)), the average SI of each frequency band decreased by 0.5 dB and 1.4 dB, respectively, as the thickness of the U-rib increased from 6 to 8 mm and from 8 to 10 mm, respectively. All these conclusions are based analyses using the same position and value of the input power. Above all, vibrations in the U-rib plates could be controlled by changing the thickness of the baseplate or the U-rib. Cross-sectional SI levels of U-ribs with different thicknesses: (a) p1, x = 400 mm, (b) p2, x = 900 mm, and (c) p3, x = 1500 mm.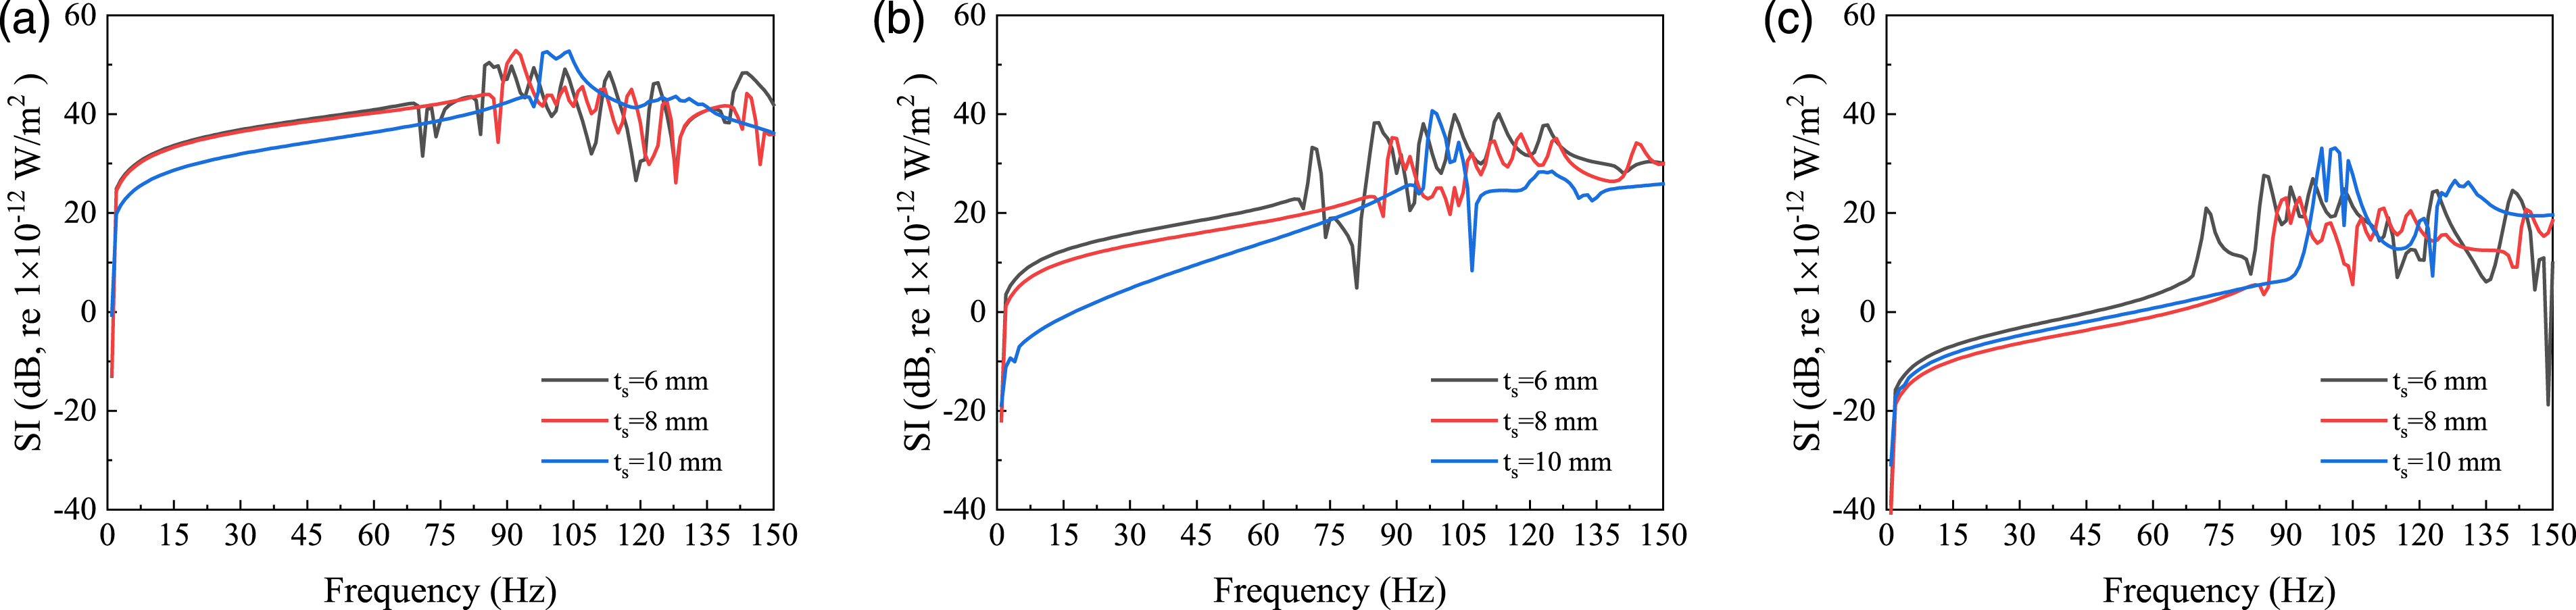
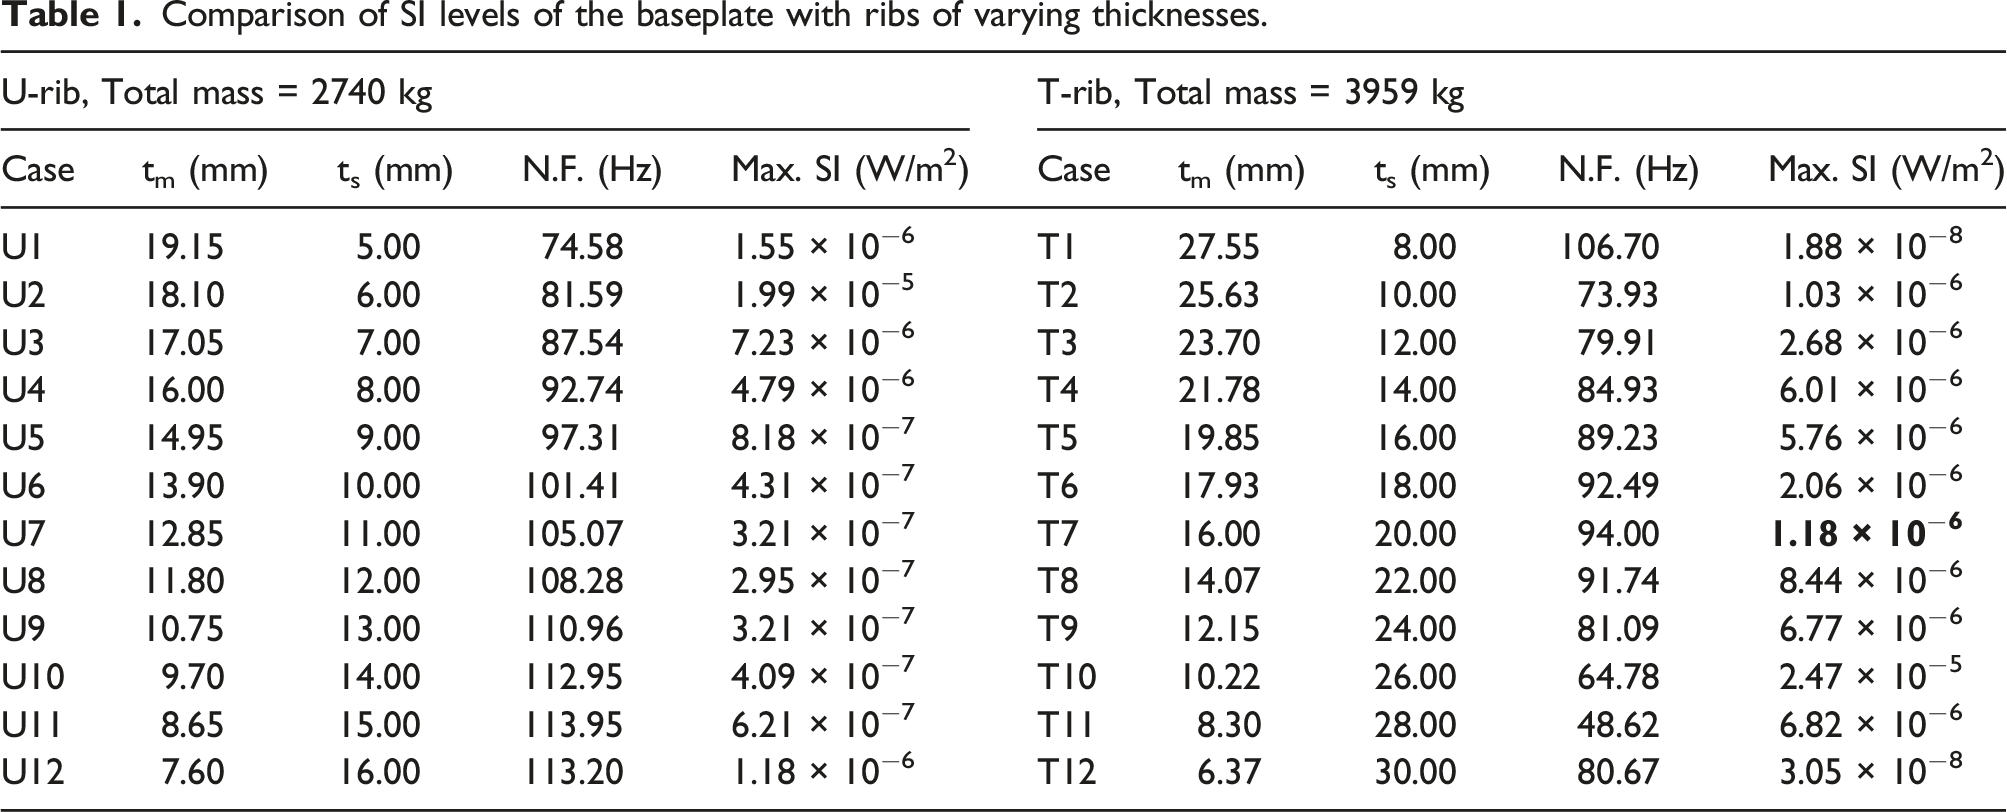
In light of future applications of SI analysis to bridges, the analysis here focuses on optimizing the design of stiffened plates by minimizing the SI in them under the action of external harmonic loads. The models and conditions of calculation were the same as in the previous example. The thicknesses of the baseplate tm and the rib ts were selected as variables. However, the overall weight of the structure remained constant during the process.
Comparison of SI levels of the baseplate with ribs of varying thicknesses.
Effect of rib shape
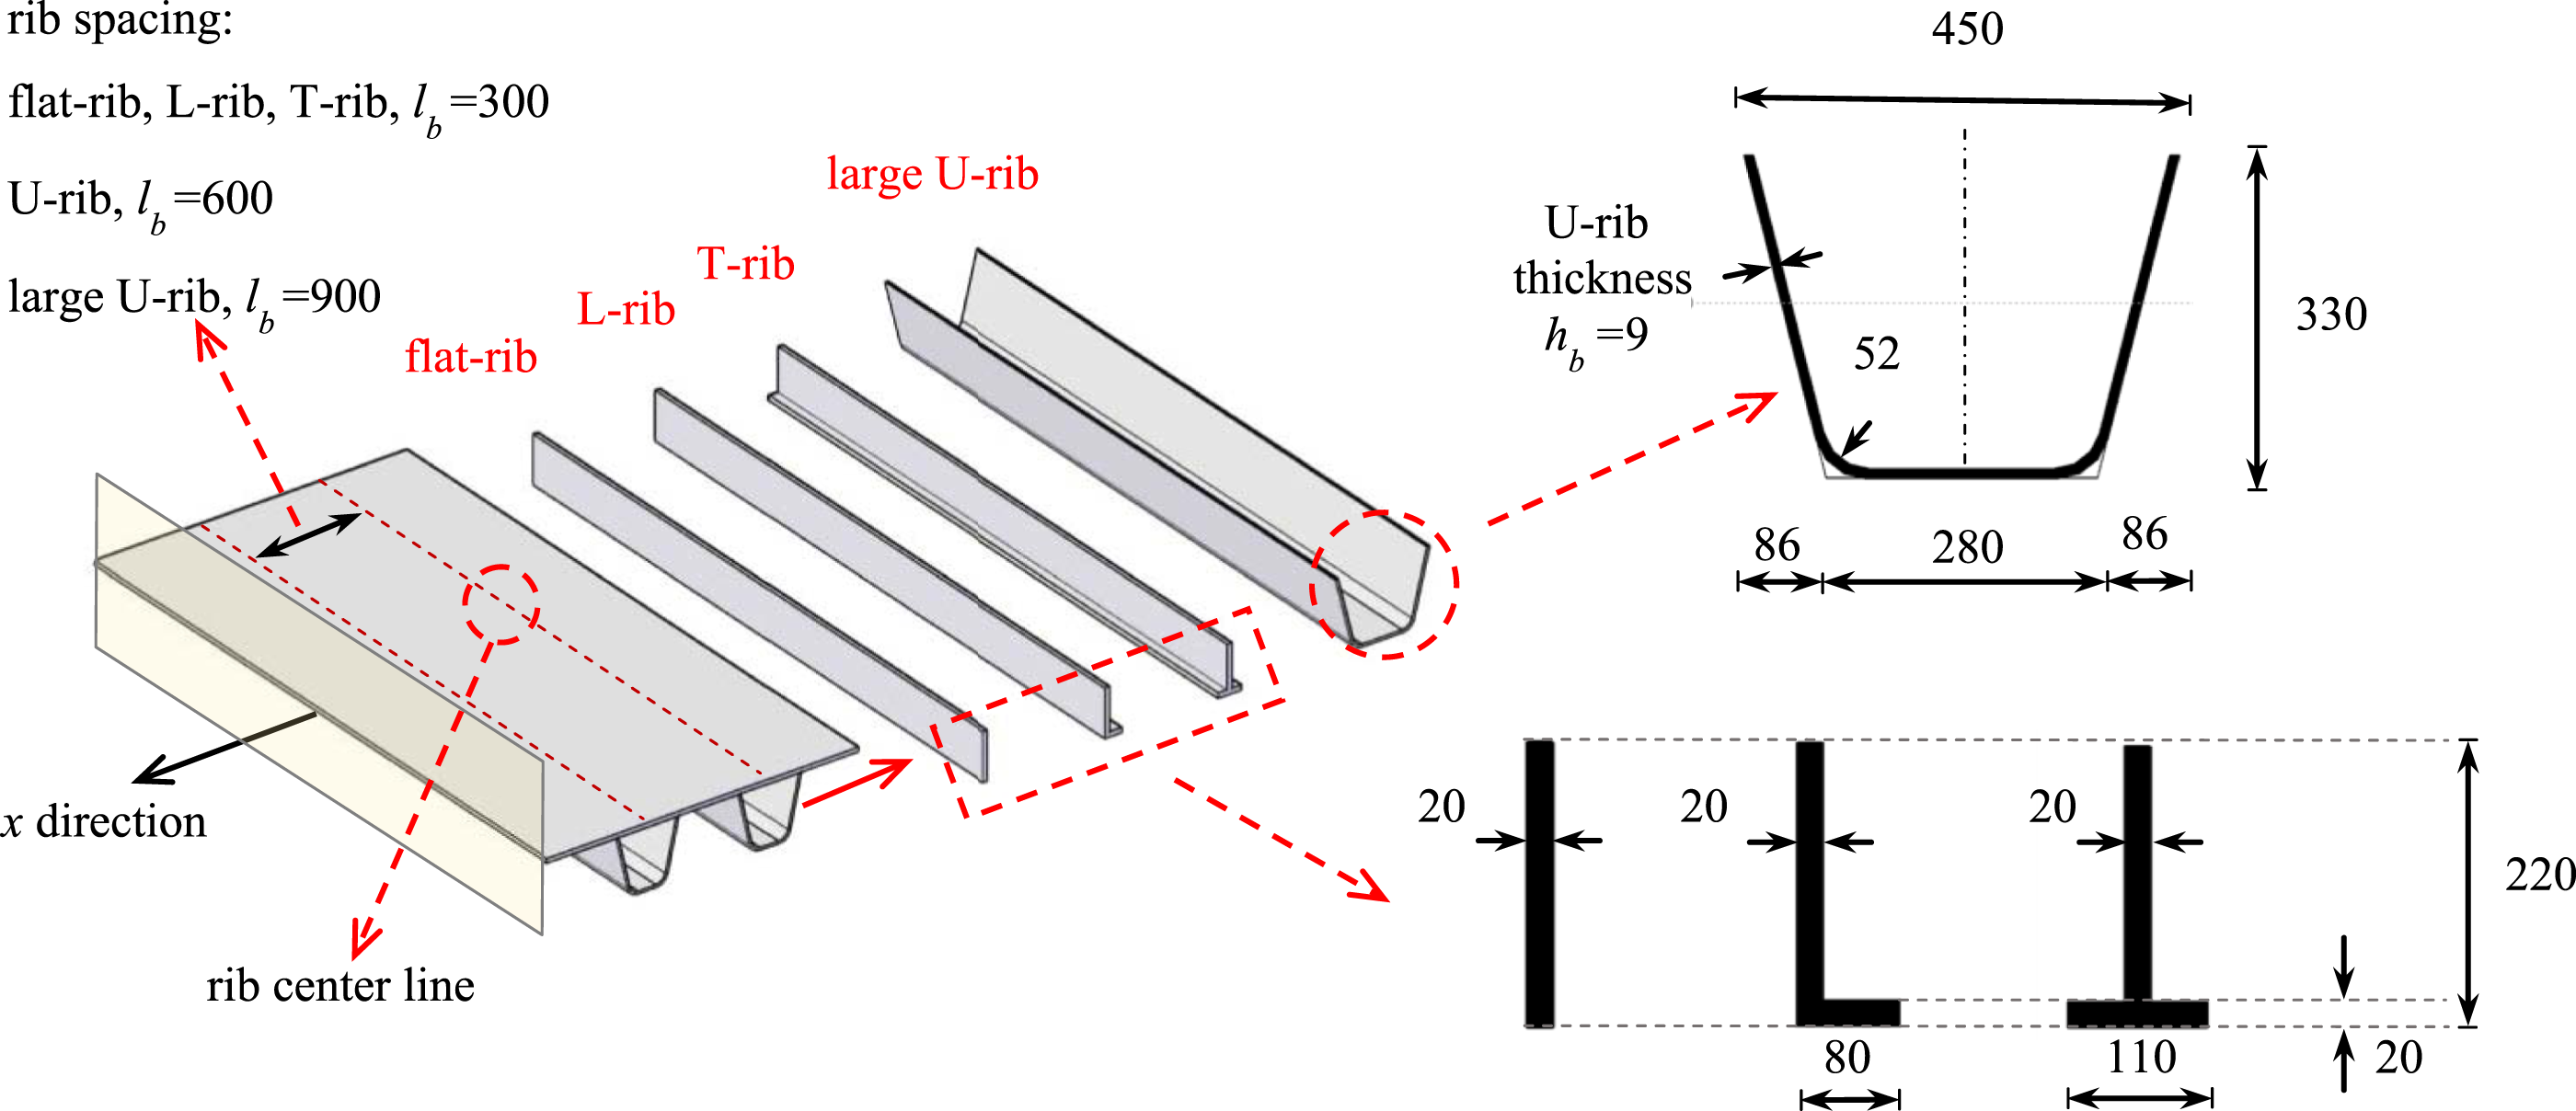
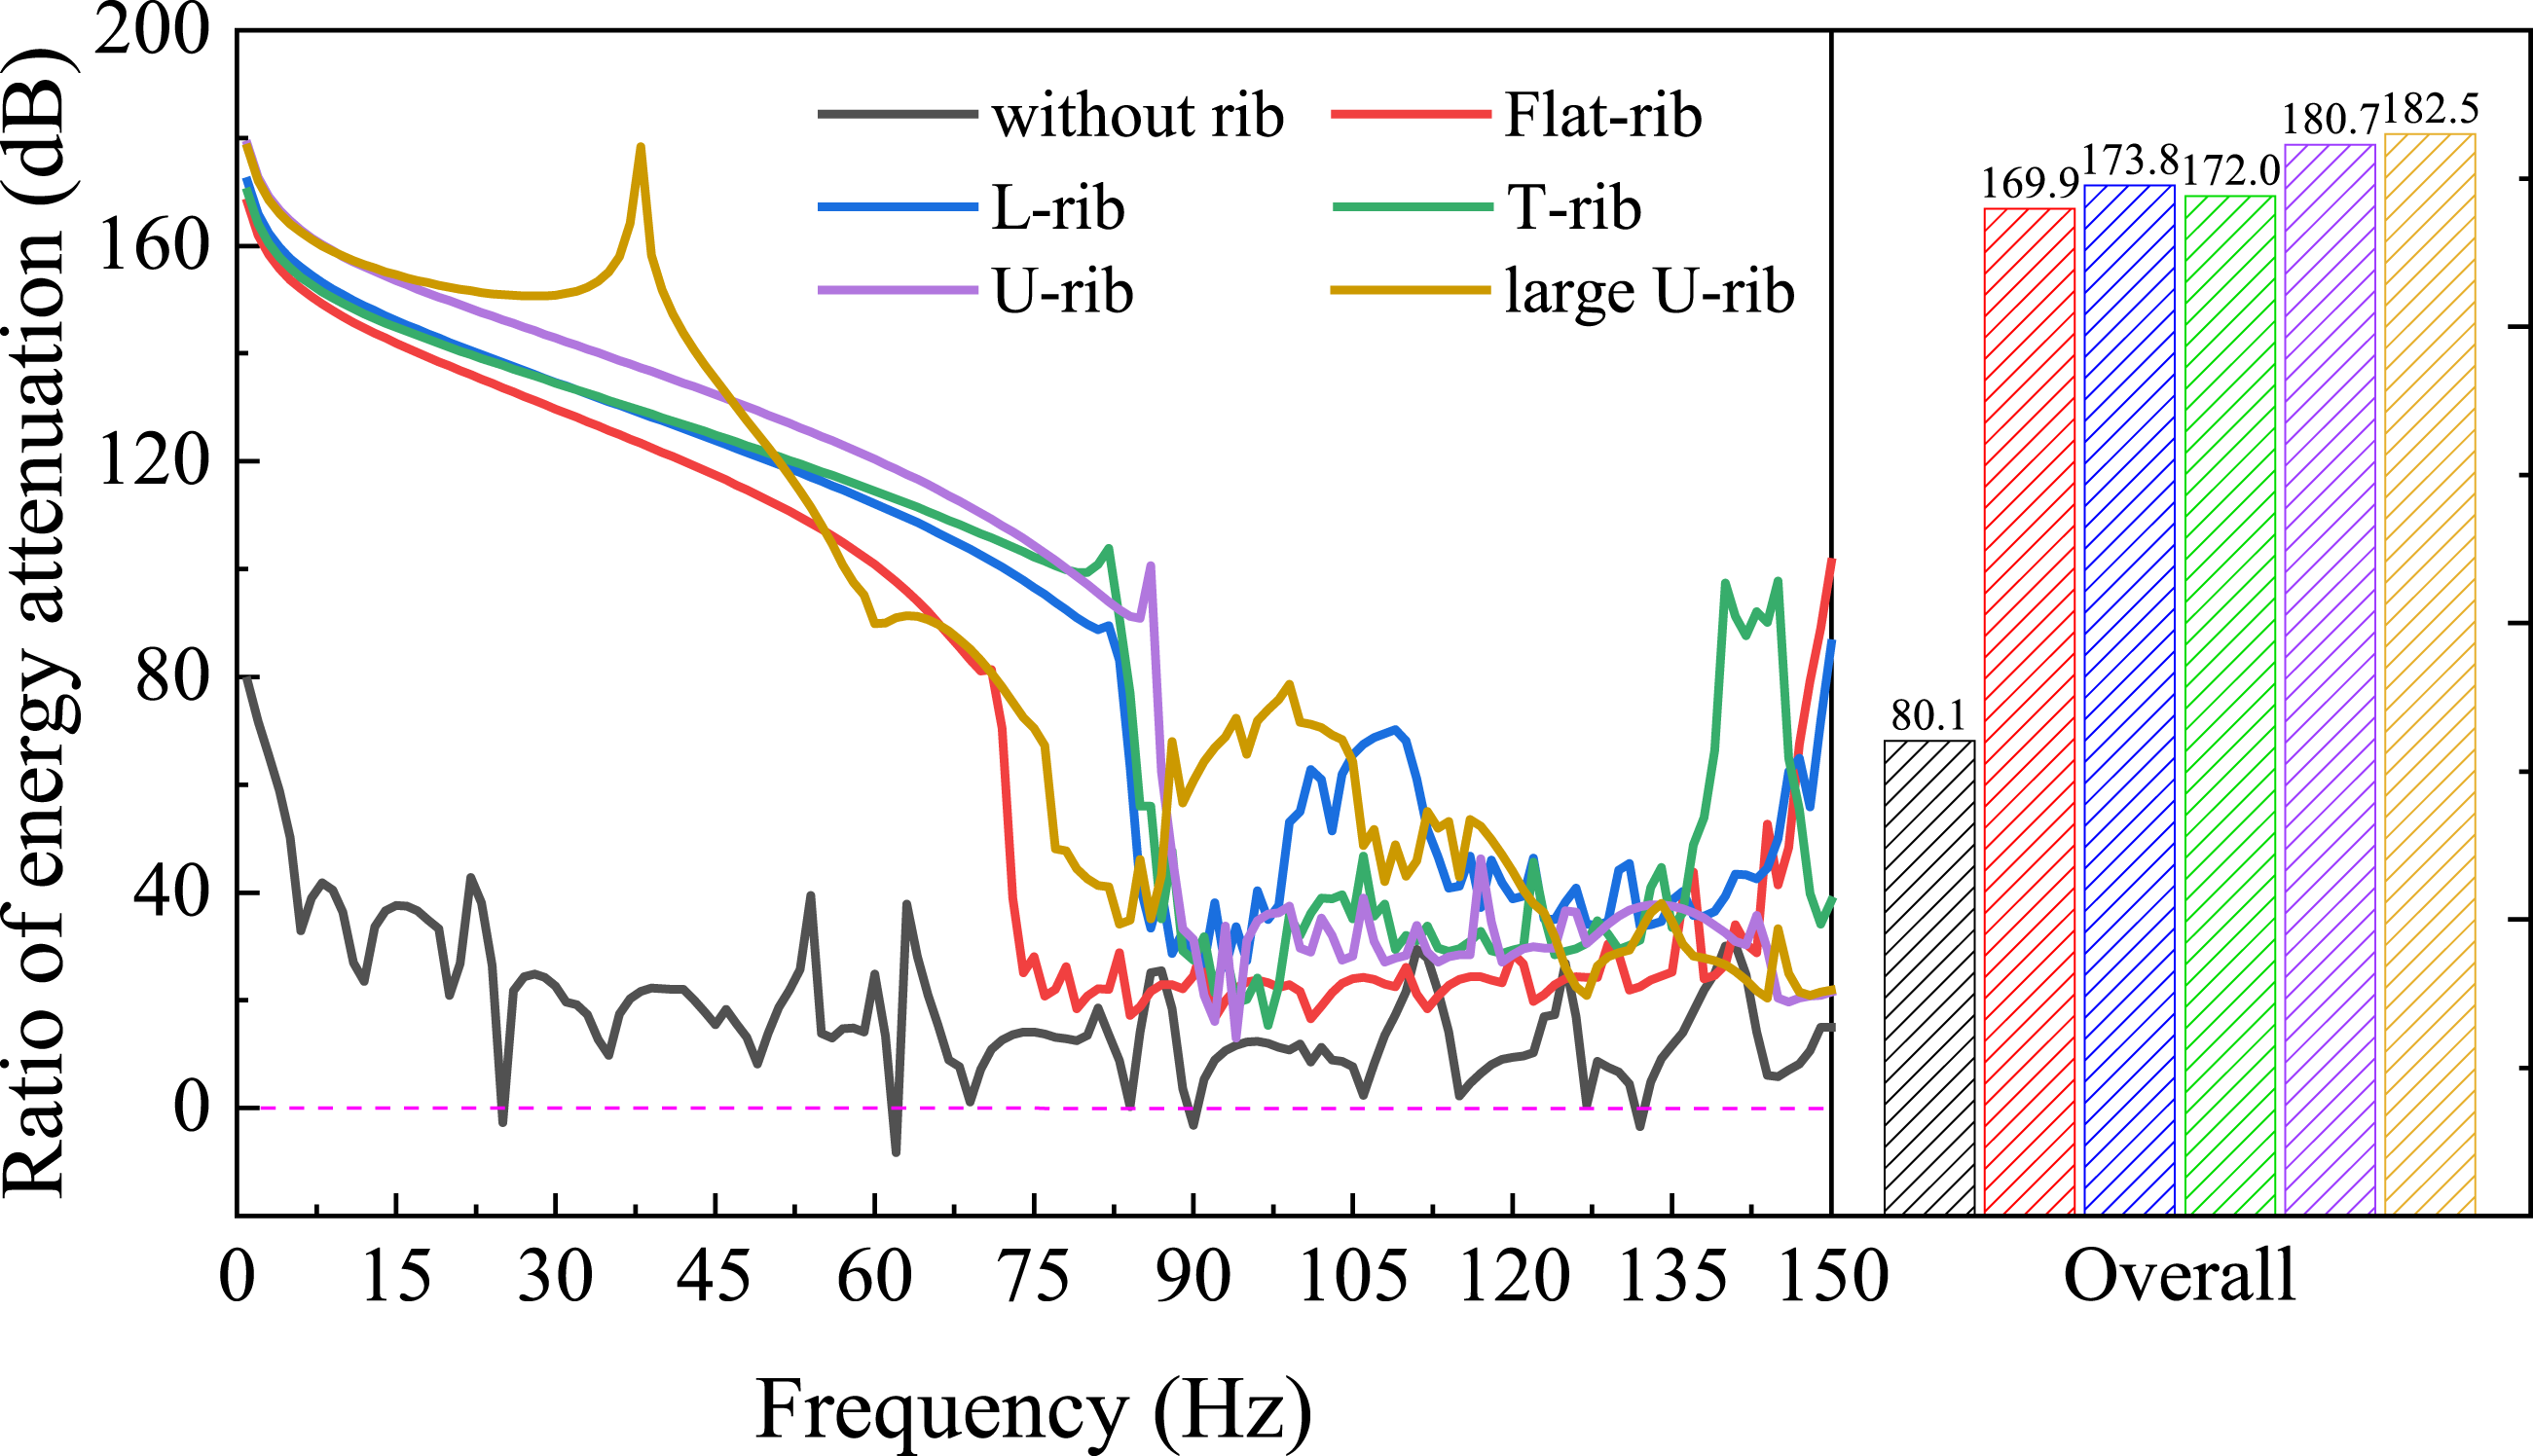
Typical rib shapes used in engineering practice include flat ribs, L-ribs, T-ribs, U-ribs, and large U-ribs. The transmission of vibrational energy is influenced due to changes in the coupling boundary for each. Figure 17 shows the parameters of ribs that accord to sizes used in practice. The degree of attenuation in vibrational energy is expressed in a stiffened plate system by the ratio of energy attenuation (EAR), which is defined as the ratio of the system’s input power to its output power Dimensions of ribs of different shapes (unit: mm).
The input and output powers of the stiffened plate system are expressed by

The calculated input and output powers are illustrated in Figure 18. In general, from 0–150 Hz, the output powers for ribs of all shapes decreased significantly after stiffening, while the input powers did no change significantly. Figure 19 plots the ratio of energy attenuation for ribs of different shapes. First, the ratio of energy attenuation exhibited the same trend as the output power, increasing prominently in the range of frequency of 0–90 Hz. This was related to the natural frequency of the structure. Second, a large U-rib in general yielded the best effect in terms of dissipating energy. Closed ribs had a higher ratio of energy attenuation than opened ribs, by about 10 dB on average. In this case, the order of overall the effect of vibration attenuation was large U-rib > U-rib >> L-rib > T-rib > flat rib. Input and output powers of plates with ribs of different shapes: (a) without rib, (b) flat rib, (c) L-rib, (d) T-rib, (e) U-rib, and (f) large U-rib. Ratio of energy attenuation of plates with ribs of different shapes.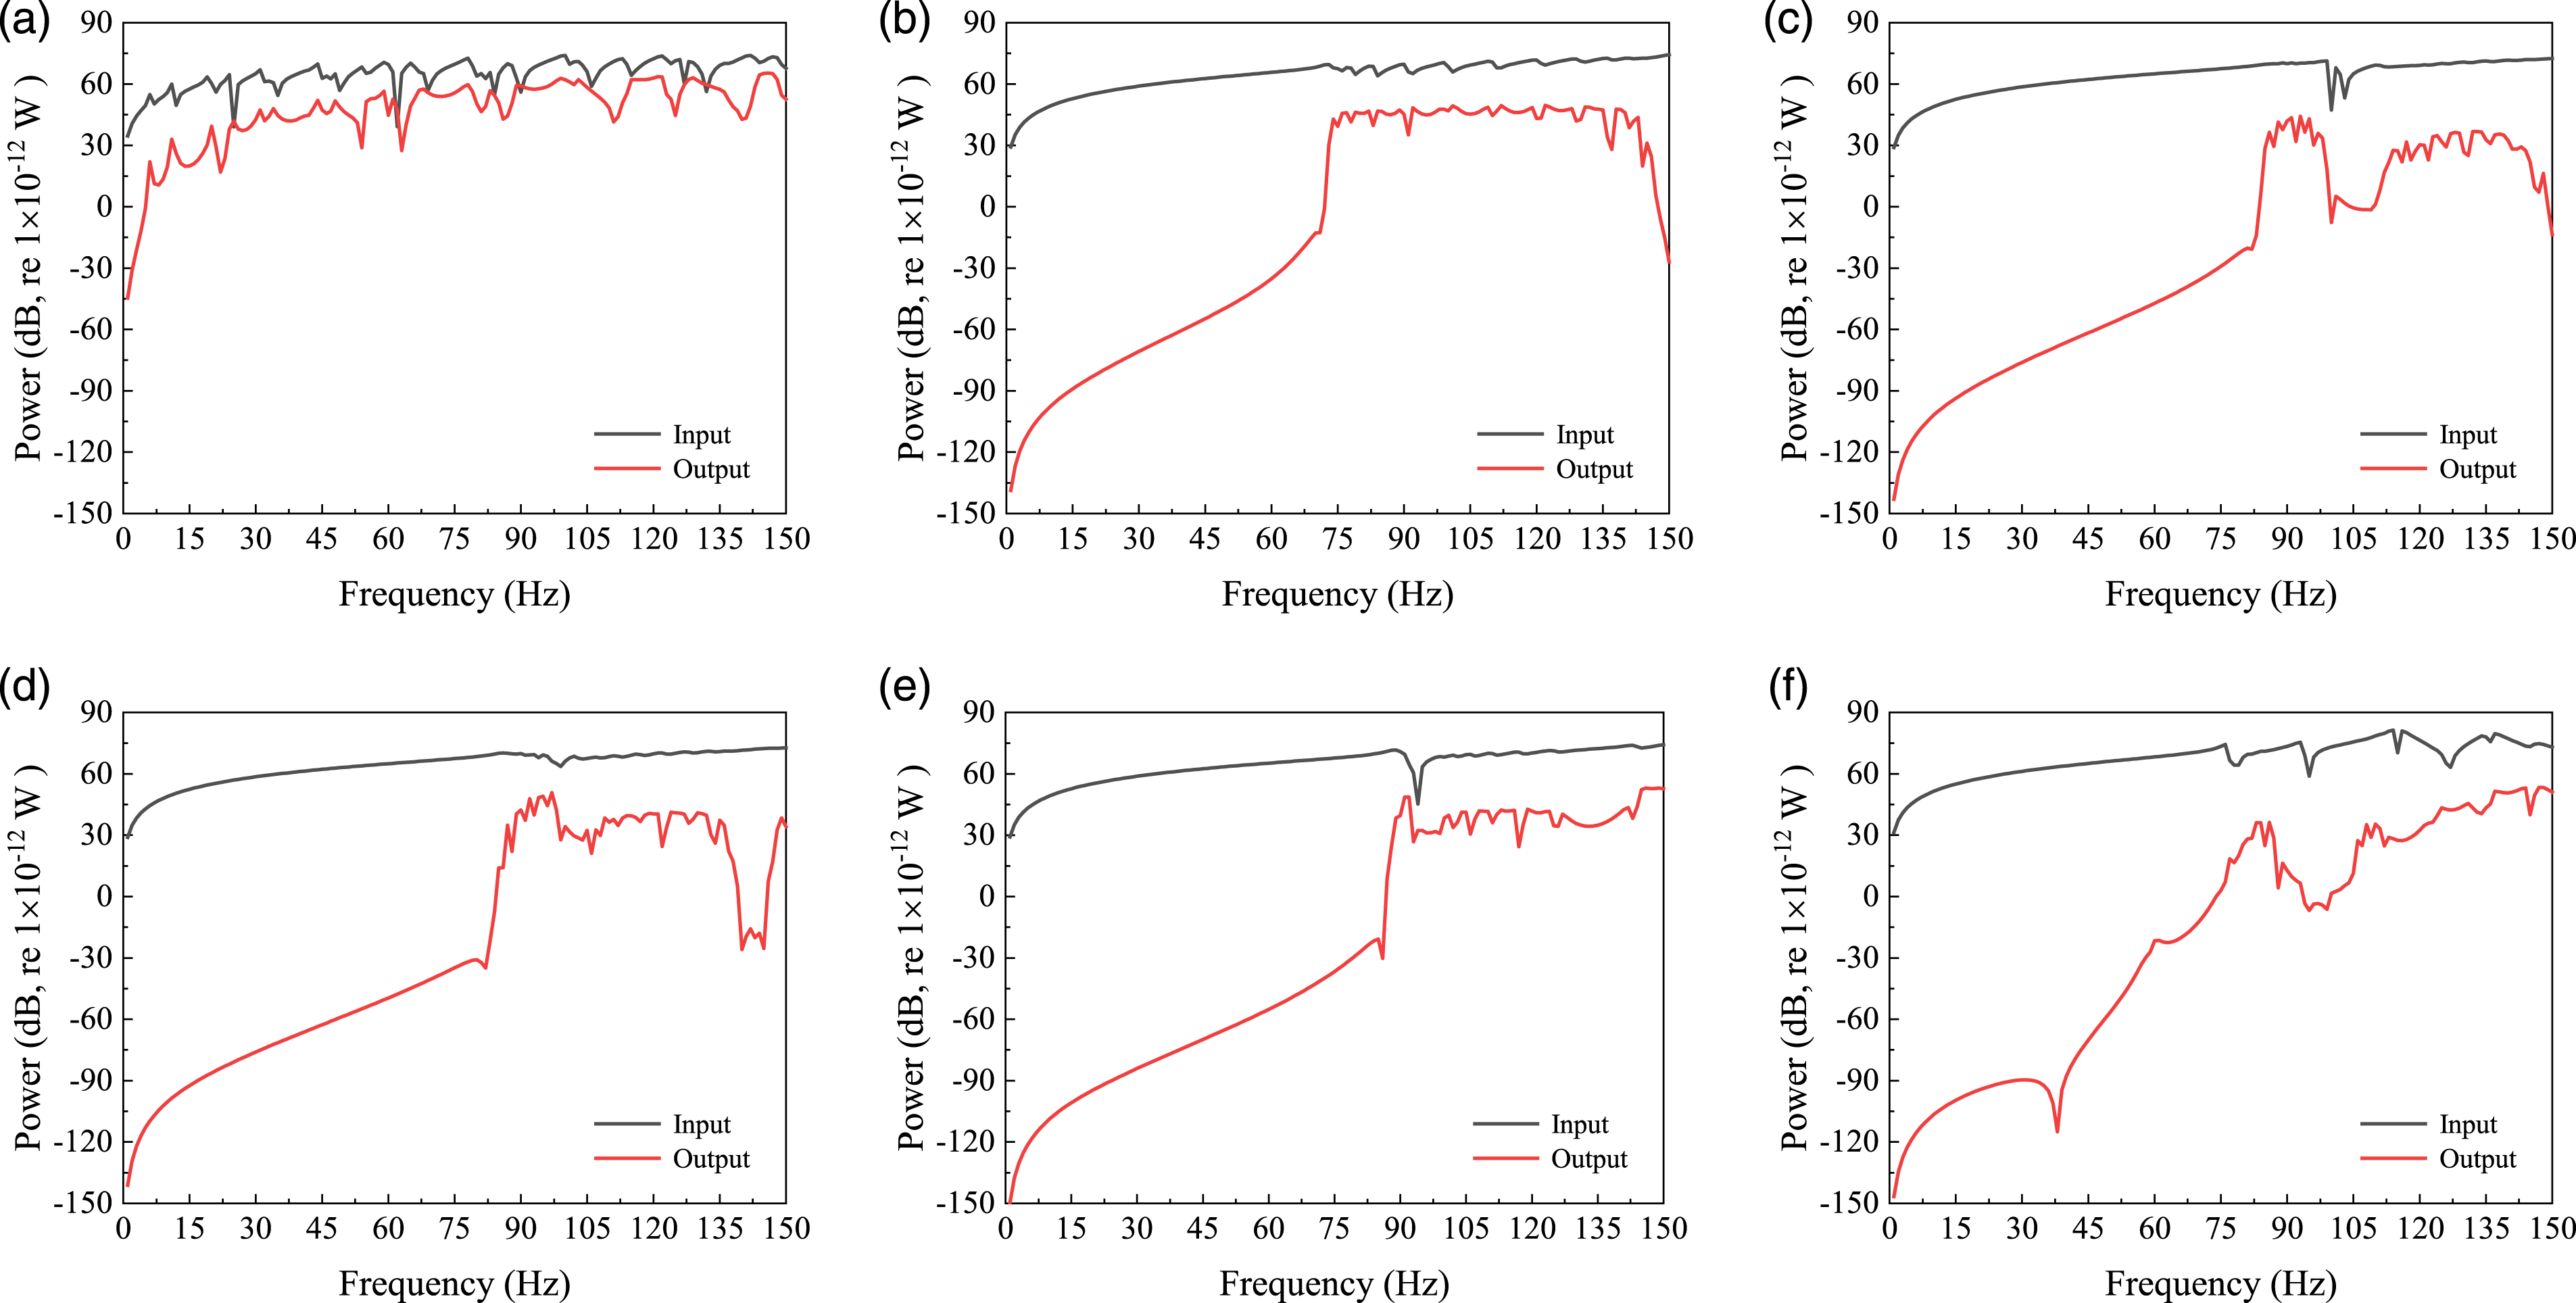
The mode of energy flow distribution for a single-frequency case is compared herein. The SI vector field for each shape of the rib at 93 Hz is shown in Figure 20. For the plate without a rib (Figure 20(a)), the vibrational energy diffused from the excitation point and gathered in the dashpot while decreasing only slightly. Even when x = 4200 mm, the value of SI was 2.88 × 10⁻⁷ W/m2, with no significant attenuation than at the peak of 4.58 × 10⁻⁶ W/m2. For opened ribs (Figure 20(b)–(d)), each shape reduced the vibrations significantly by redistributing the energy flow. The T-rib plate had the highest rate of attenuation in the vibrations. Its peak SI value was 3.38 × 10⁻⁶ W/m2 but then decreased to 9.30 × 10⁻⁸ W/m2 (with values of 4.09 × 10⁻⁷ W/m2 for a flat rib and 4.57 × 10⁻⁷ W/m2 for the L-rib) after crossing two ribs (x = 1050 mm). In case of closed ribs (Figure 20(e)–(f)), both the U-rib and the large U-rib reduced the vibrations sufficiently well. The large U-rib recorded better performance, with an SI value of 1.51 × 10⁻⁹ W/m2 (with U-rib 5.66 × 10⁻⁷ W/m2) when x = 1500 mm. Total SI in the baseplate with ribs of different shapes (93 Hz): (a) without rib, (b) flat rib, (c) L-rib, (d) T-rib, (e) U-rib, and (f) large U-rib.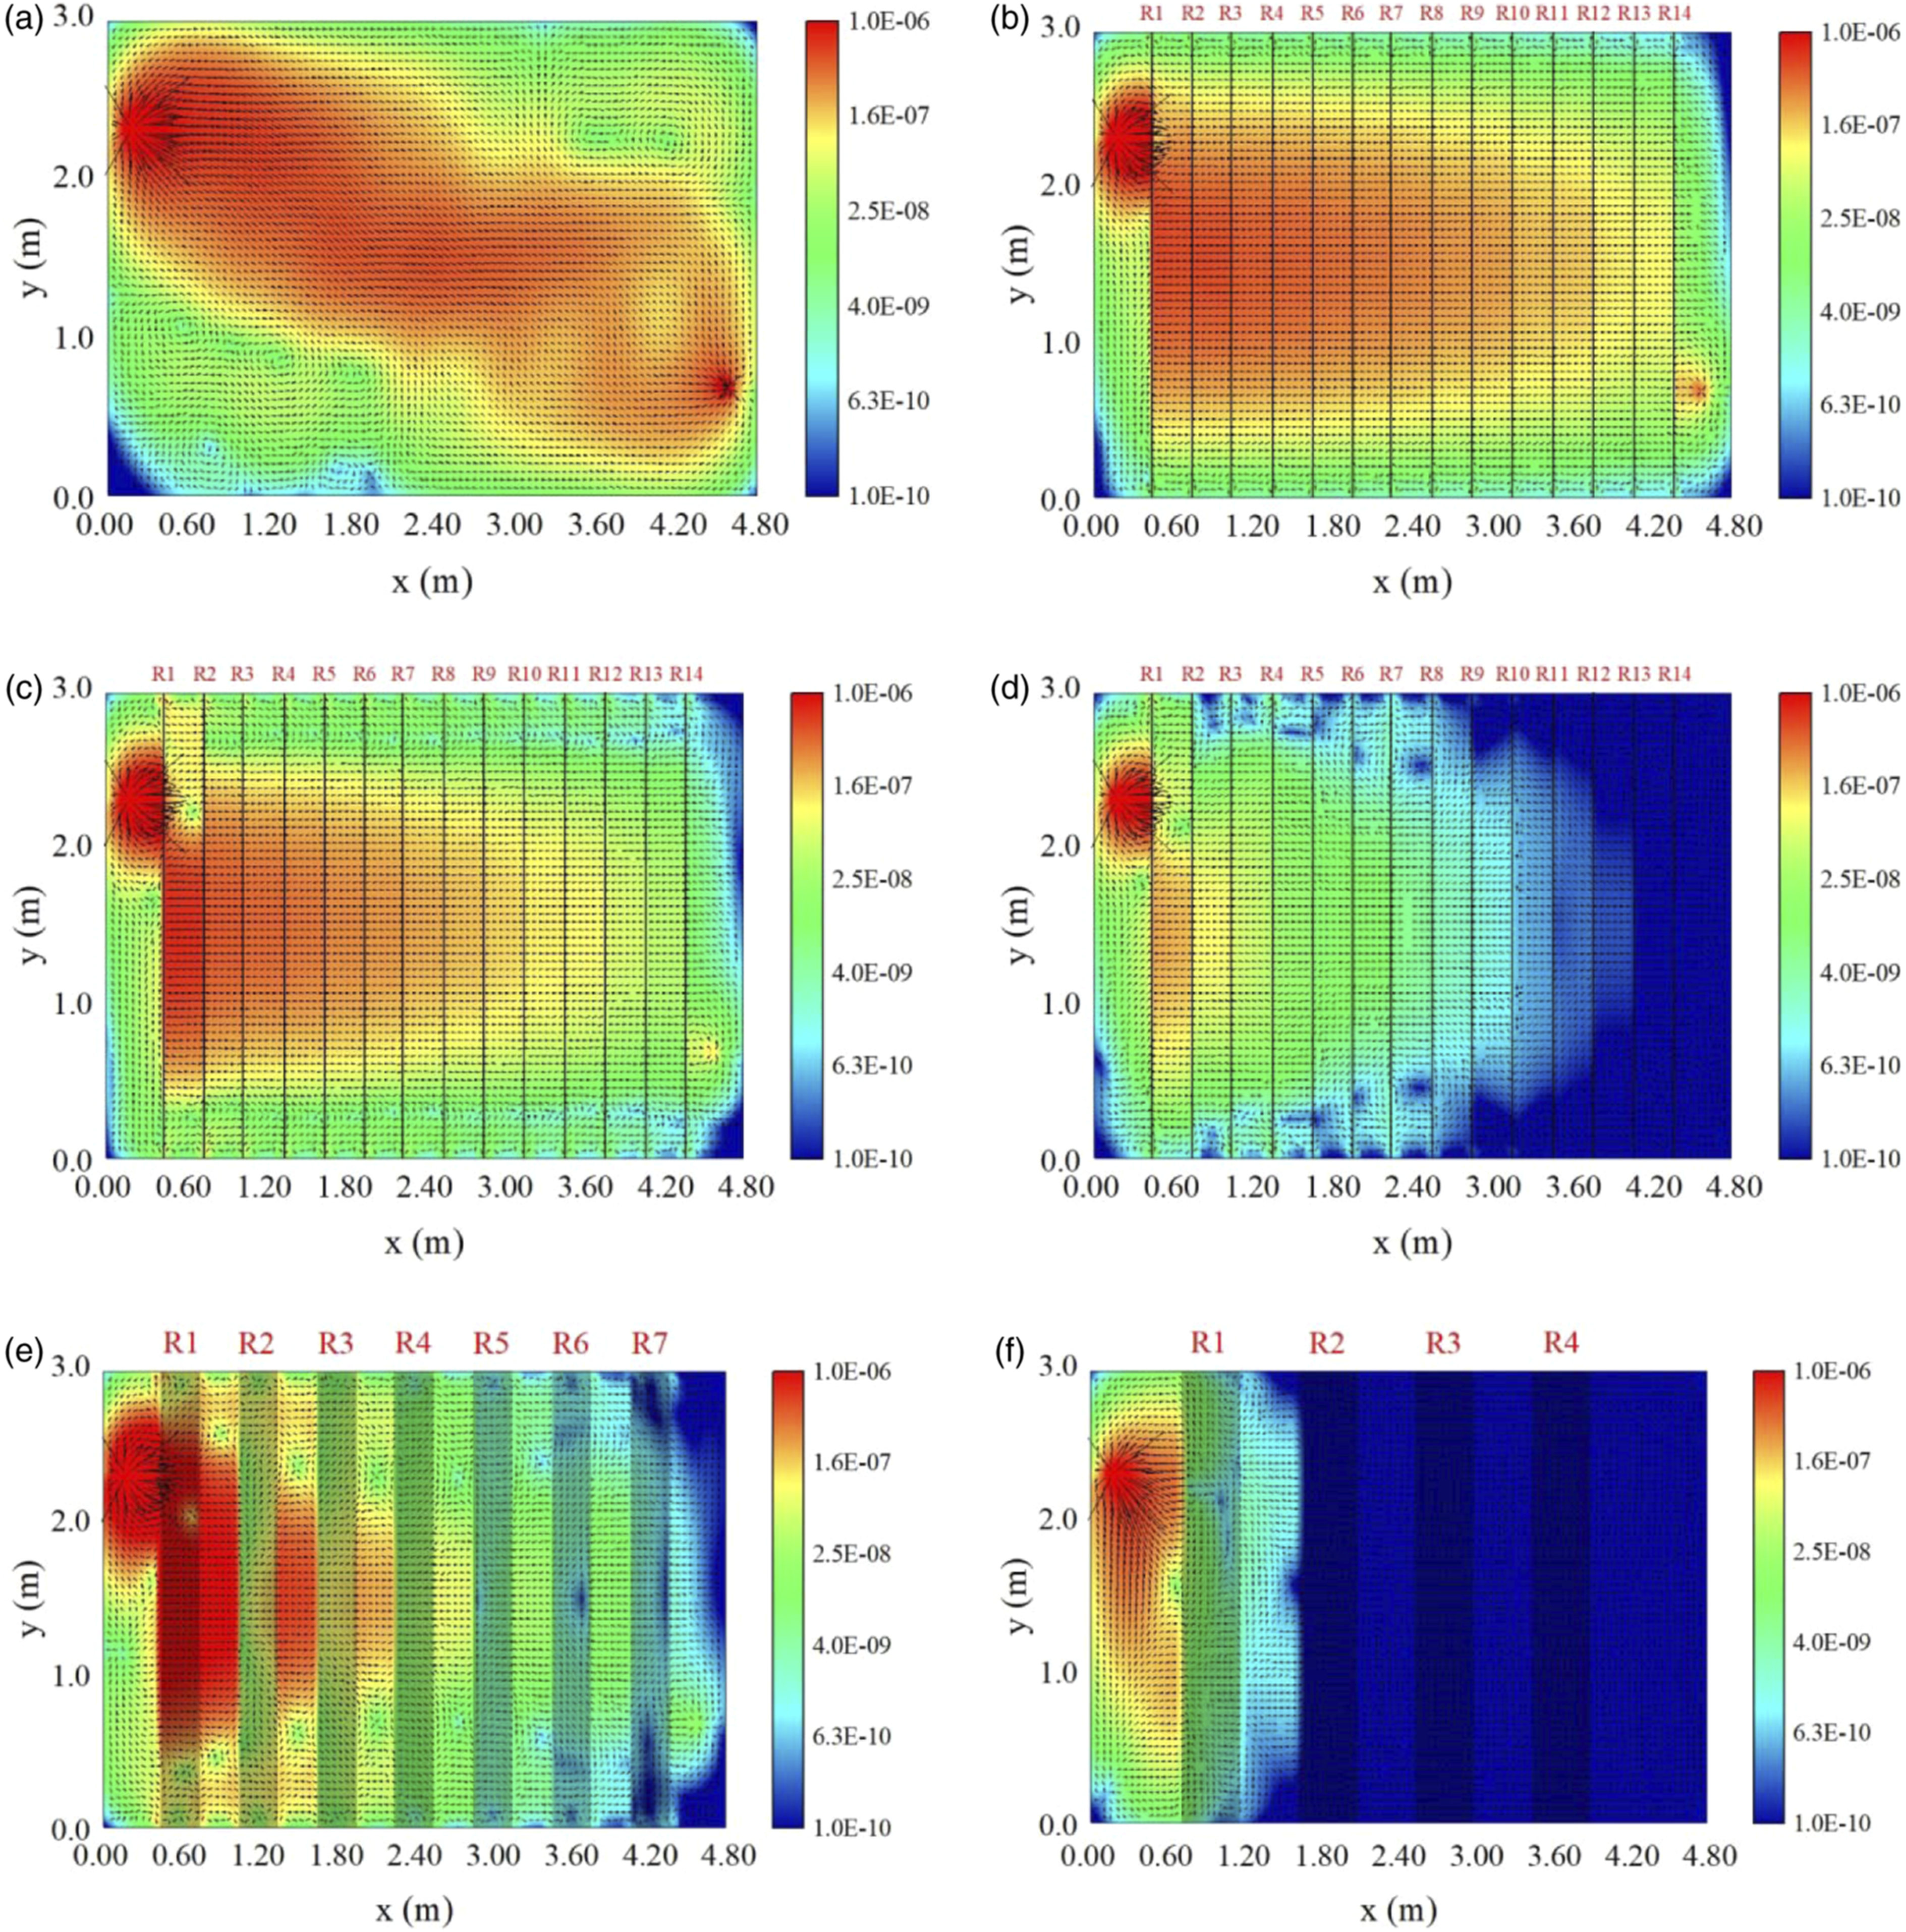
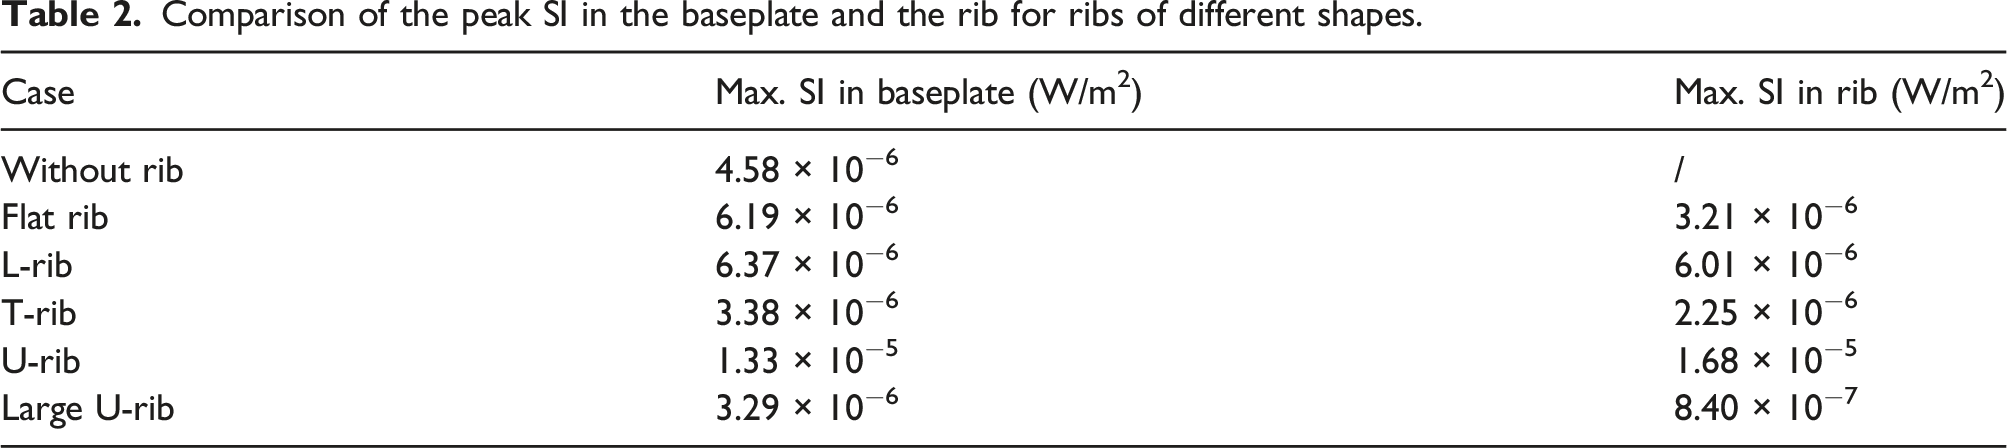
Figure 21 plots the local space of SI vectors for each of the shapes of ribs considered at 93 Hz. In general, energy flow in the stiffening rib exhibited the same trend, spreading from the proximal end of the excitation point, transmitting along the rib to its distal end, and then returning to the baseplate. In comparison with the baseplate, each shape of rib exhibited a larger value of SI. A comparison of the peak SI between the baseplates and the ribs is shown in Table 2. The maximum SI in the ribs was comparable to that in the baseplate. The peak SI for the U-ribs (Case U-rib) was significantly larger because the excitation frequency was close to the natural frequency. Enlarged view of spatial vectors of SI for ribs of different shapes (93 Hz): (a) without rib, (b) flat rib, (c) L-rib, (d) T-rib, (e) U-rib, and (f) large U-rib. Comparison of the peak SI in the baseplate and the rib for ribs of different shapes.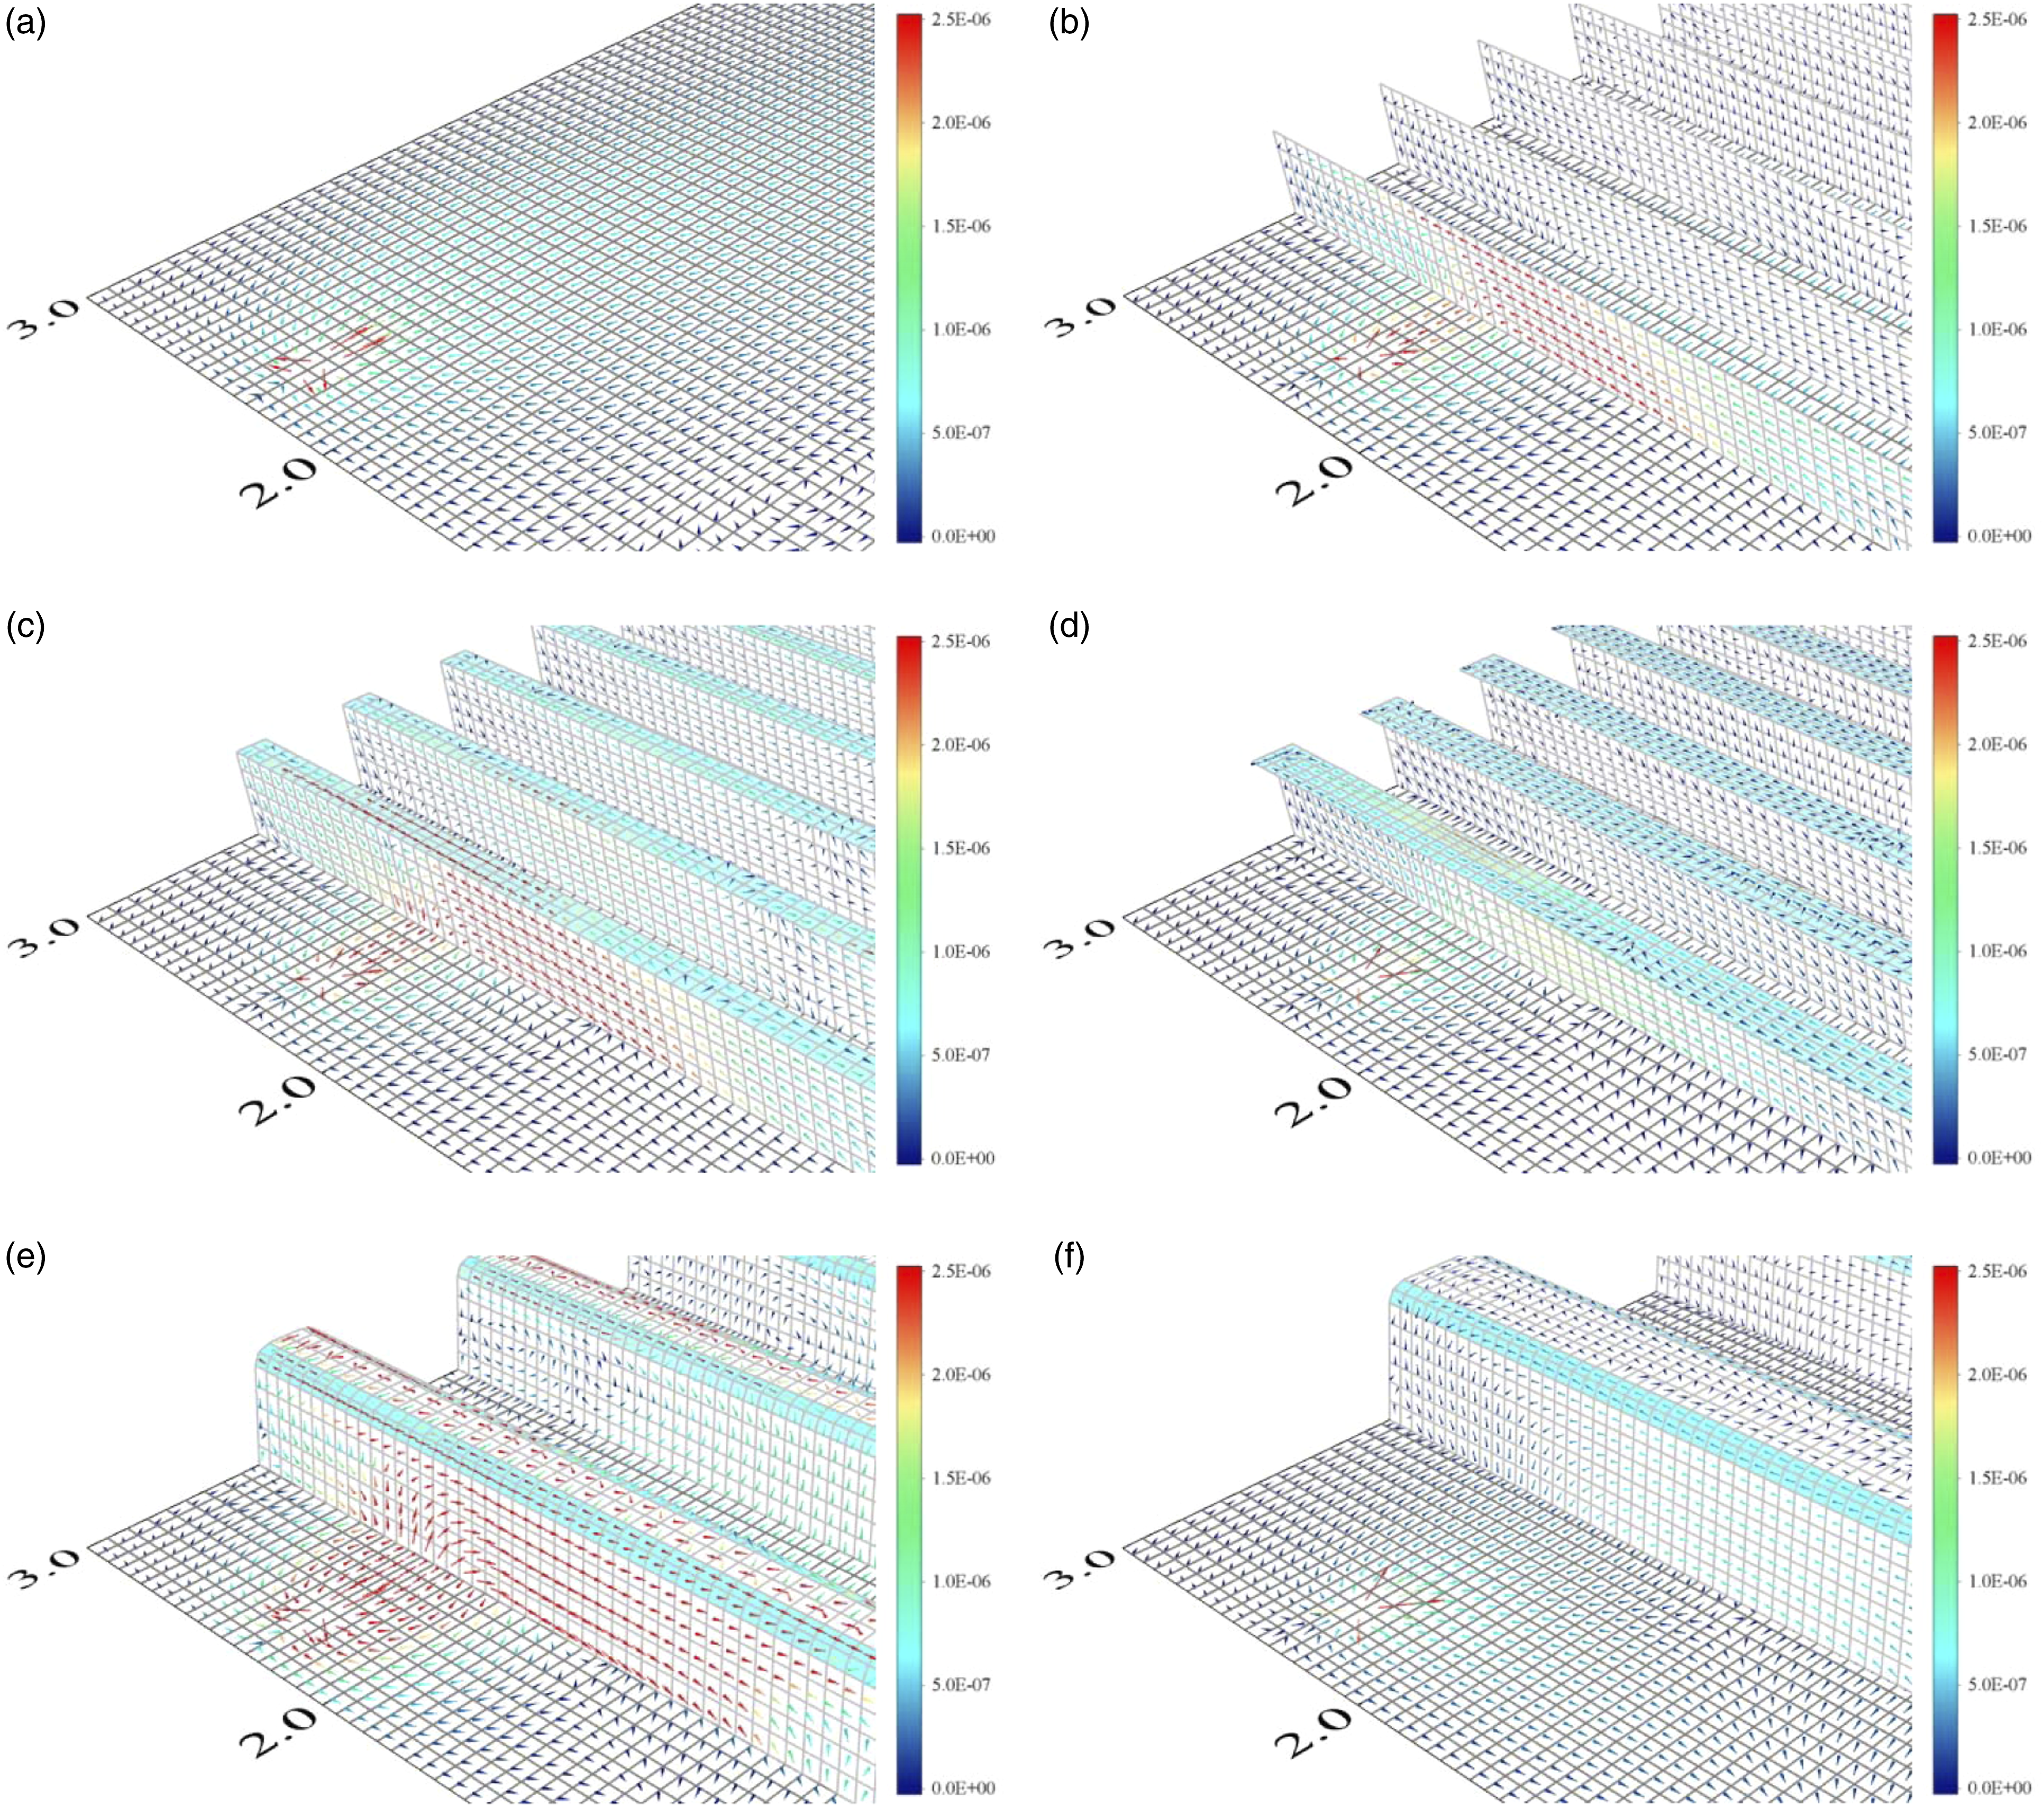
Conclusions
The major conclusions of this study are as follows: The vibrational energy on the baseplate of a stiffened U-rib plate is mostly carried and transmitted by the bending wave. In general, the order of influence of the magnitude of energy transmission is the bending wave > torsional wave > transverse plane wave > longitudinal wave, with peak SI values of 2.15 × 10⁻⁵ W/m2, 9.11 × 10⁻⁷ W/m2, 1.18 × 10⁻⁷ W/m2, and 1.09 × 10⁻⁷ W/m2, respectively. The U-rib hindered the transmission of the vibrational energy of the bending wave to the baseplate, effectively cut-off the transmission of the bending wave, and allowed this energy to be gathered on the baseplate near the U-rib, thus helping with its “redistribution.” The vibrational energy in the U-ribs was not negligibly small. It was mainly carried by the longitudinal and transverse plane waves (max. SI = 9.56 × 10⁻⁶ and 1.35 × 10⁻⁵ W/m2, respectively), and hardly transmitted in the form of bending waves (max. SI = 1.25 × 10⁻⁶ W/m2). The vibrational waves were converted into waveforms at the coupling boundary, and flowed into the U-rib in the order of bending wave → longitudinal wave → transverse plane wave. Energy was subsequently carried by the transverse plane wave transmitted longitudinally along the U-rib. Dissipating the in-plane wave vibrational energy in the U-ribs can thus be used to block energy transfer, and to reduce vibrations and radiation-induced noise. The shape of the rib and the thickness of the plate affected the properties of vibration transmission of the ribbed plate. Vibrations can be controlled by adjusting the ratio of thickness of the baseplate to that of the U-rib, or by selecting ribs of an appropriate shape. The results of this study showed that structural intensity analysis can be used as a criterion when designing bridges. It can also guide structural optimization and the arrangement of measures for vibration reduction.
Footnotes
Declaration of conflicting interests
The author(s) declared no potential conflicts of interest with respect to the research, authorship, and/or publication of this article.
Funding
The author(s) disclosed receipt of the following financial support for the research, authorship, and/or publication of this article: This work was supported by the the National Natural Science Foundation of China (grant number 51978580) and the Sichuan Science and Technology Program (grant number 2020JDJQ0078).