
Abstract
Fast switching valve (FSV) inevitably experiences high-speed impact while obtaining high dynamics, which affects its control accuracy and service life. In this article, the impact characteristics of the FSV during the excitation stage are investigated. Firstly, a nonlinear mathematical model considering the magnetic saturation is established and verified. Then, the influences of three types of driving voltages on the initial impact velocity and the opening time of the FSV are analyzed, which proves that only the driving voltage featured by an interval of negative voltage (−24V) can obtain a good balance between the initial impact velocity and opening time. In addition, finite element simulations of transient impact characteristics show that smaller initial impact velocity is beneficial to reduce the impact displacement, equivalent stress, and wear volume. The influences of impact times on the flow area of the valve seat are quantitatively analyzed under different impact velocities. Theoretical results indicate that, compared to the high driving voltage, the variation of flow area per million impacts is reduced by 27.3% under the presented driving voltage. Finally, experimental results demonstrate that with the presented driving voltage, the average acceleration and the average noise are reduced by 65.7% and 12%, respectively. And the acceleration frequency spectrum and the modal simulation both reveal the composition of impact noise, in which the noise heard by the human ear is mainly impacted noise, not the ringing noise.
Introduction
Traditional fluid transmission systems consisted by several proportional/servo valves are widely used in aerospace, ship, and construction machinery fields due to the advantages of high power density, high dynamic, and high precision.1–4 Compared to the proportional/servo valve, a fast switching valve (FSV) has several advantages, such as possible zero leakage, low cost, and high reliability, which is widely used in the digital hydraulic system5–8 and high-pressure common-rail system. 9 The output flow of the FSV is depending on the ratio of opening time and closed time in a cycle, which is controlled by the duty ratio of the PWM (pulse width modulation).10,11 The switching frequency of the FSV has a significant influence on the output flow characteristics. Therefore, to improve the switching frequency, an intelligent PWM control strategy is usually used in which a boost voltage is optimized to get a faster opening speed of the FSV.12,13
However, the moment when the valve quickly opens or closes is essentially the transient impact contact process between the ball valve and the valve seat. In this process, various forms of energy conversion occur, including mechanical energy, elastic–plastic energy, friction, and sound wave dissipation. 14 Stress concentration, wear, vibration, and noise are likely to occur at the moment of contact due to the high impact velocity, 15 which would seriously affect the output performance and service life of the FSV. Therefore, it is necessary to study the mechanical characteristics and impact mechanism of the valve during the high-speed impact process, because it has an important guiding significance on the structural optimization of FSV.
Nowadays, researchers have carried out some research works on the impact characteristic of the FSV. The research results indicate that soft-landing can reduce the pressure shock and vibration noise of the switching inertial system. Roemer et al. 16 studied the influences of the valve’s material, cone angle, and impact surface on the impact pressure of the valve’s seat. In the research, a brute force strategy with subsequent selection is used to optimize the design points. In ref. [17], changing rules of the coil current under different air gaps are analyzed and the valve’s motion is predicted based on the coil current. The research results are used to design the trajectory of the ball valve to obtain a lower impact velocity. Rudolf et al. 18 analyzed the influence of the trajectory of the FSV on the performance of the switching inertial system. Paloniitty 19 analyzed the wear characteristics of the valve plug and the valve seat through a large number of experiments. The wear profile of the valve seat under different switching numbers is obtained using a microscope, and the relationship between the flow leakage of the on/off valve and the number of switching is obtained. Fang et al. 20 studied the changing rule of the impact displacement and impact velocity of the ball valve in the impact process using finite simulation tool, but ignored the influence of hydraulic pressure and electromagnetic force on the ball valve. In ref [21], some simulations about different forms of the cone valve’s collision are carried out using ANSYS. The simulation results show that the uneven impact is more likely to cause seat fatigue failure than the uniform impact, and the maximum stress increases as the impact velocity increases.
Most of the existing relevant research works focus on the impact characteristics (such as stress, wear, and fatigue) of the FSV using finite element simulation or experiment, but few works concentrate on the influence of driving voltage on the impact characteristics and dynamic performance of the FSV. Therefore, the special viewpoint of initial impact velocity with different driving voltage effects on the FSV is utilized to reveal the interrelation of the driving voltage and impact characteristics, such as impact velocity, impact displacement, stress, and wear.
This paper is organized as follows. Firstly, a nonlinear mathematical model of the FSV considering the material saturation is established and verified by experiments; secondly, initial impact velocity and opening time of the ball valve are analyzed under different driving voltage strategies; moreover, impact characteristics of the FSV are analyzed based on finite element simulation and the theoretical calculation; finally, a test bench of the FSV is established and the experimental results agree well with the simulation results, which reveal the detailed characteristic of the impact acceleration and impact noise.
Mathematical model of FSV
A 2-position and 3-way fast switching valve (FSV) is studied as shown in Figure 1. The valve opens or closes through the alternate contact of the two steel balls and the seat. When the coil is de-energized, the ball valve moves to the right side due to the hydraulic force, due to which port T is blocked, and port P connects to port C; conversely, when the coil is energized, the ball valve moves to the left side due to the electromagnetic force, due to which port C connects to port T, and port P is blocked. Since the electromagnetic force is larger than the hydraulic force when the supply pressure is smaller than 4 MPa, the ball valve and the valve seat on the left side are selected as the study object. Schematic diagram of 2-position and 3-way fast switching valve.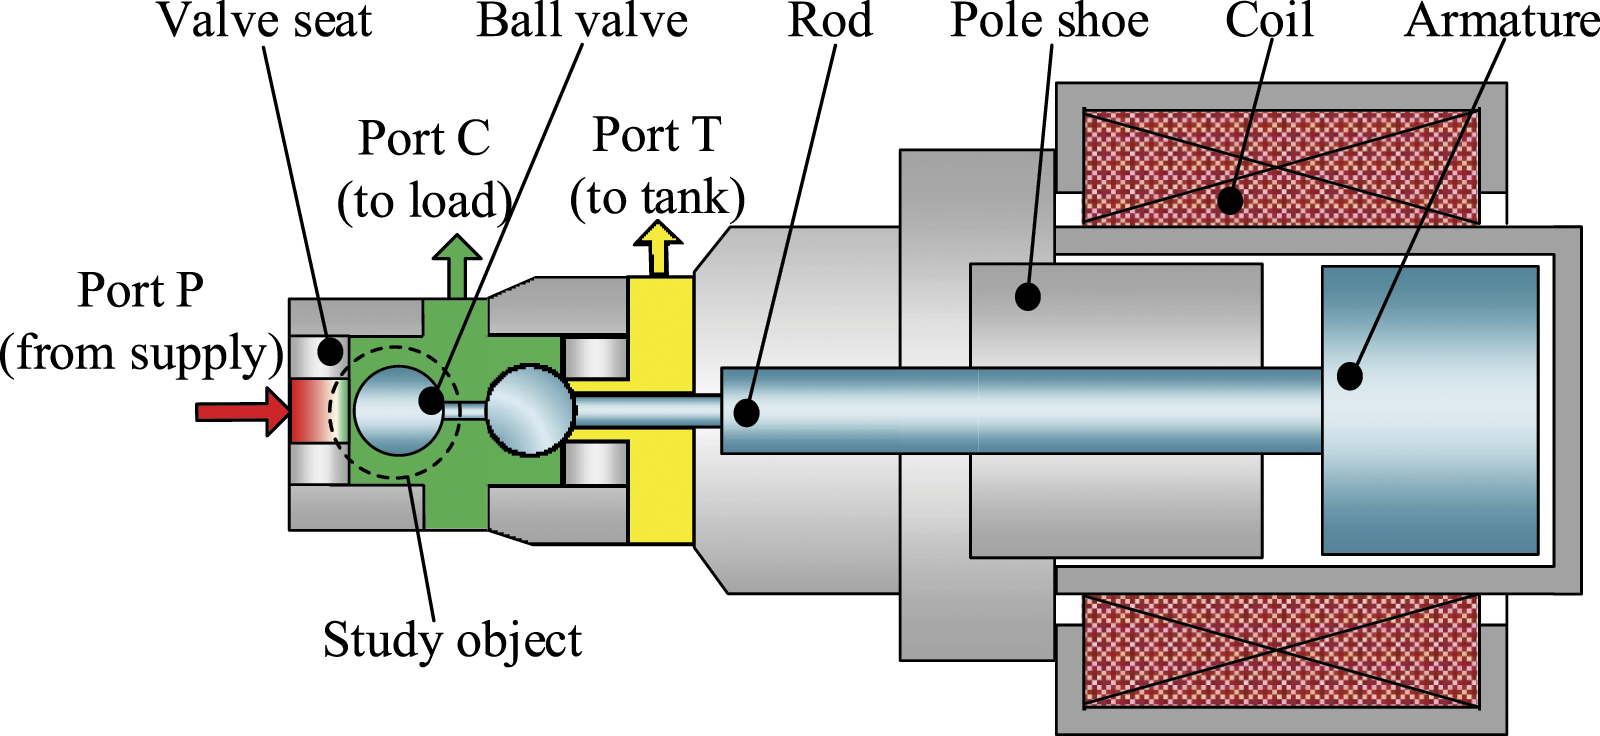
Electrical–magnetic model
Based on Kirchhoff’s law of voltage, the balanced equation of coil voltage is as follows
22

A magnetic circuit equation is as follows
23

The relationship among Hc,


So, equation (2) can be re-written as

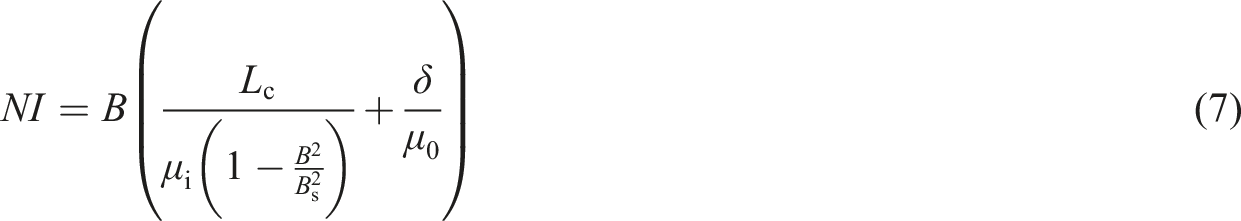
The functional model of the core permeability can be defined as
26

So, by substituting equation (6) into (5), the following equation is obtained


Letting
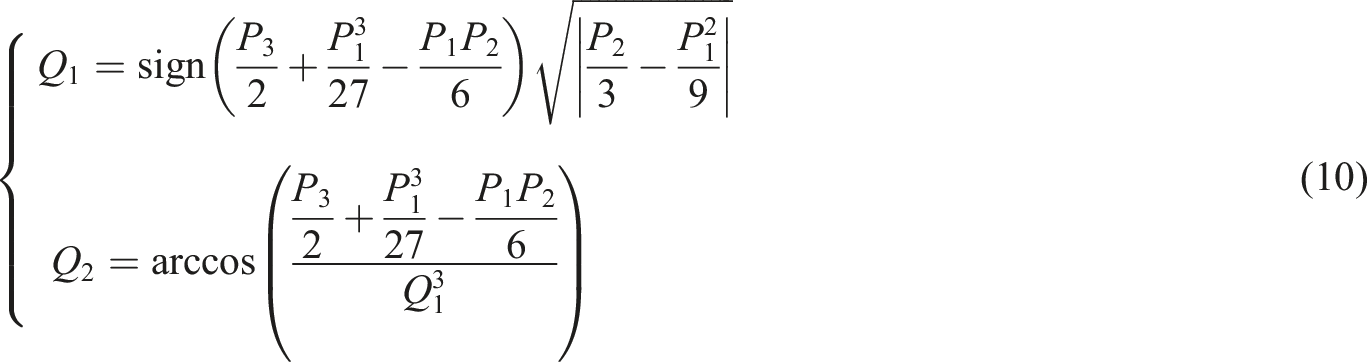
Based on trigonometric function in cubic equations with one unknown, the solution of B is as follows

The electromagnetic force Fm is as follows

Kinetic model before impact
Based on Newton’s laws, the dynamic model of the ball valve is simply defined as

Model verification
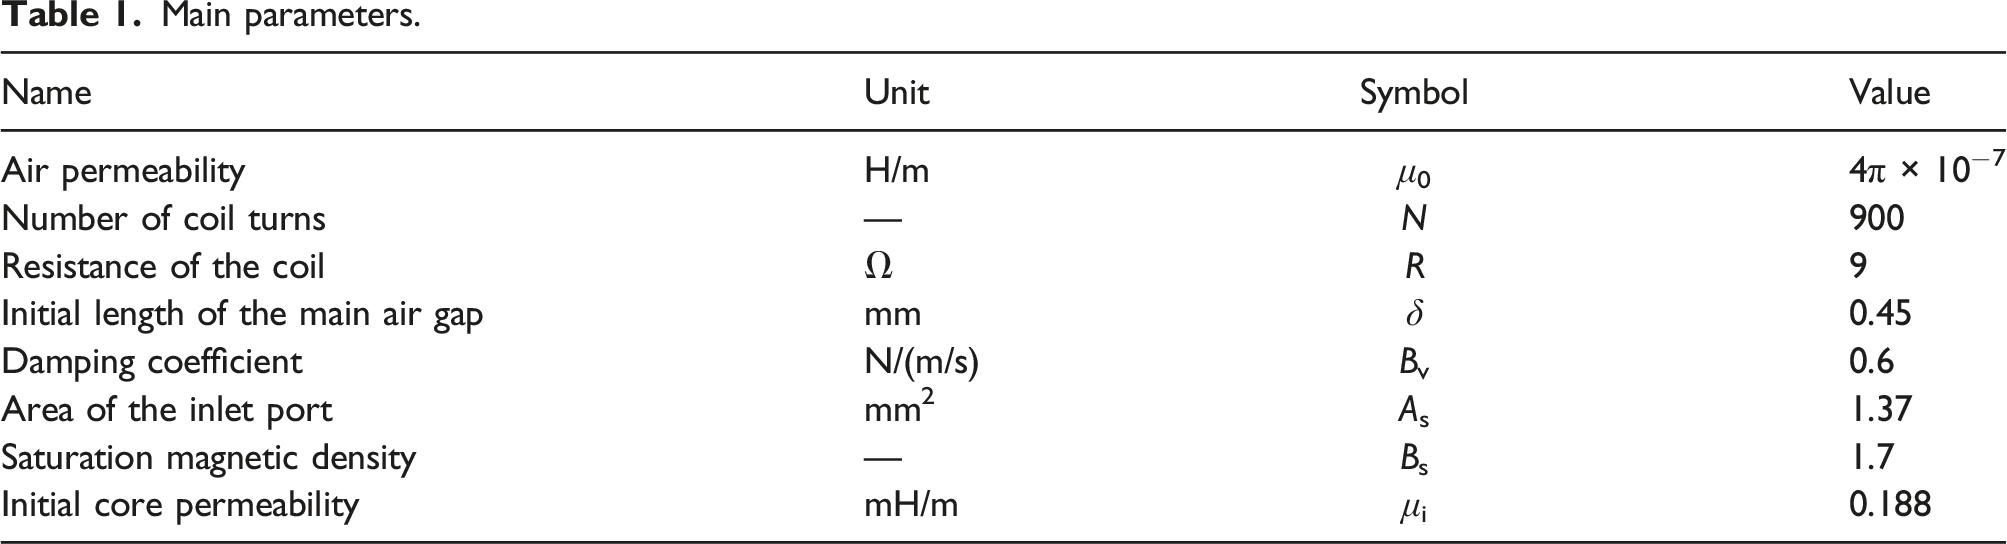
Main parameters.
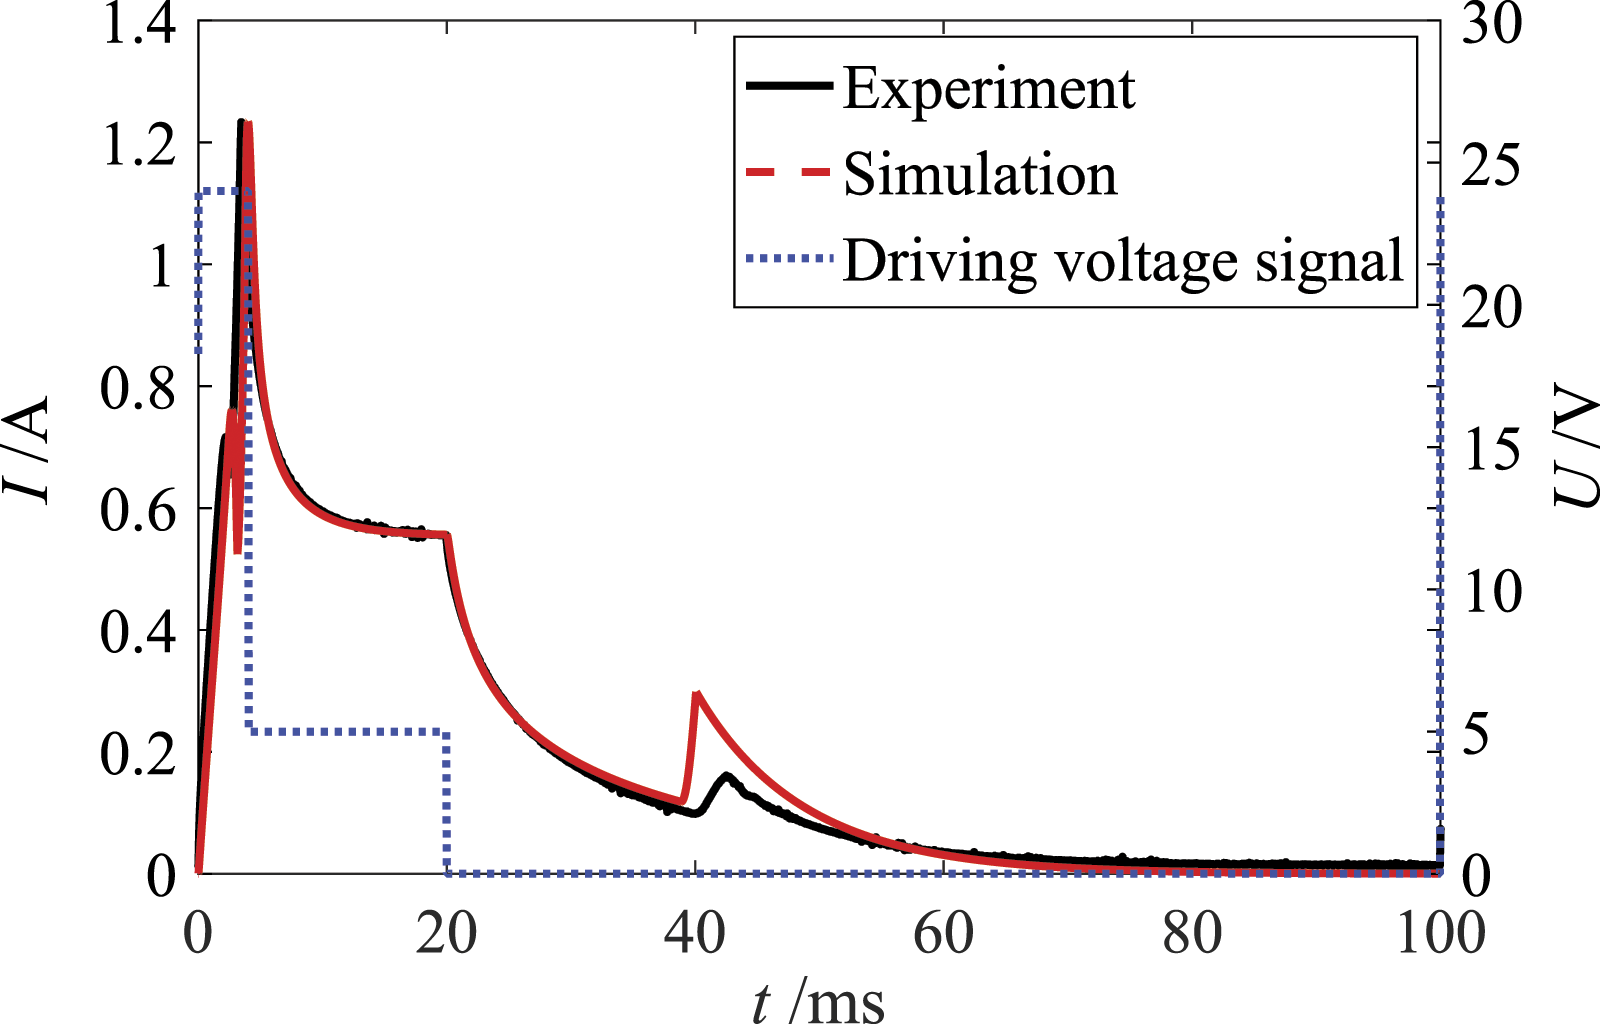
Comparison of coil current at the switching frequency of 10 Hz.
Figure 2 shows that simulation results of coil current at the switching frequency of 10 Hz are basically consistent with the experimental results, which proves the accuracy of the simulation model. However, a small error actually exists especially in the closing stage, due to some nonlinear factors, such as varying resistance caused by temperature, varying flow coefficient and unmodeled remnant magnetic materials.
Analysis of impact between the ball valve and the valve seat under different driving voltages
Initial impact velocity under different driving voltage signals
As the ball valve moves at a high velocity, at the same time it inevitably leads to a high-speed impact between the ball valve and the valve seat, which causes problems, such as vibration, stress, wear, and noise. To analyze the correlation between the impact status and dynamics of the ball valve, the discussion concerned with the initial impact velocity (refers to the movement velocity that arrives at the valve seat originally) and the opening time under the different driving voltage strategies is presented. The three driving voltage strategies are often used, as shown in Figure 3. Different driving voltage signals.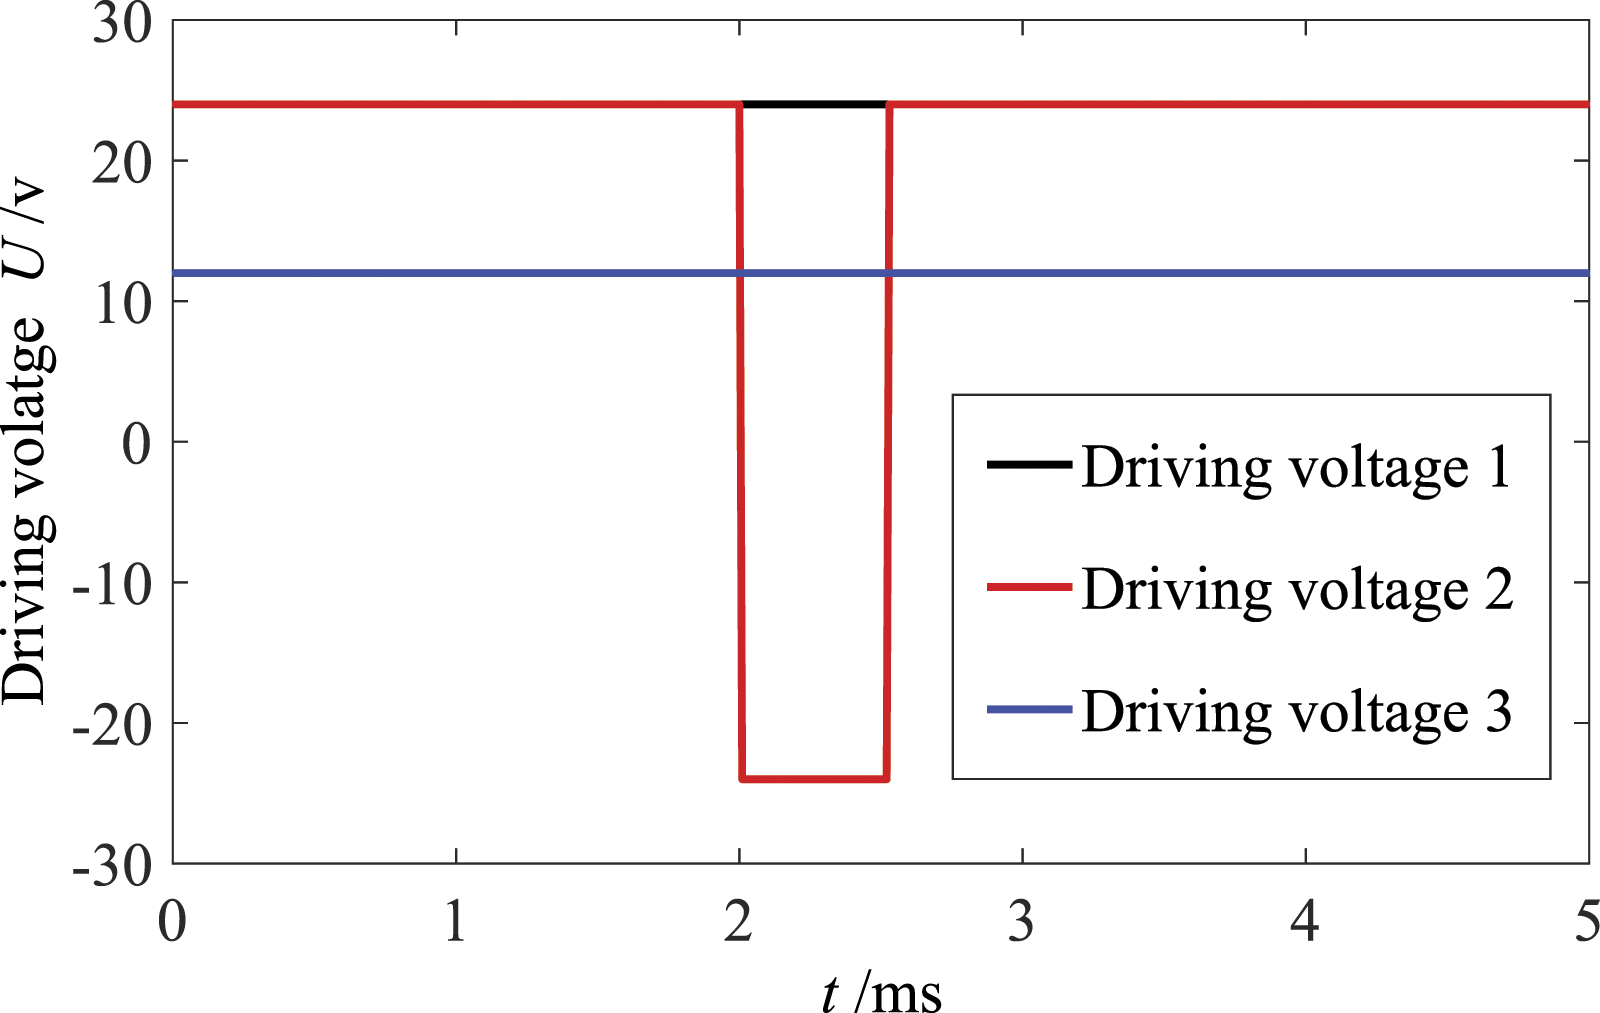
As shown in Figure 3, driving voltages 1 and 3 mean that the FSV is driven by high voltage (24V) and low voltage (12V), respectively. Driving voltage 2 is an improved voltage signal which adds an interval of negative voltage (−24V) in the high voltage signal (24V). The starting time and ending time of the negative voltage are set to be 2 ms and 2.55 ms, respectively.
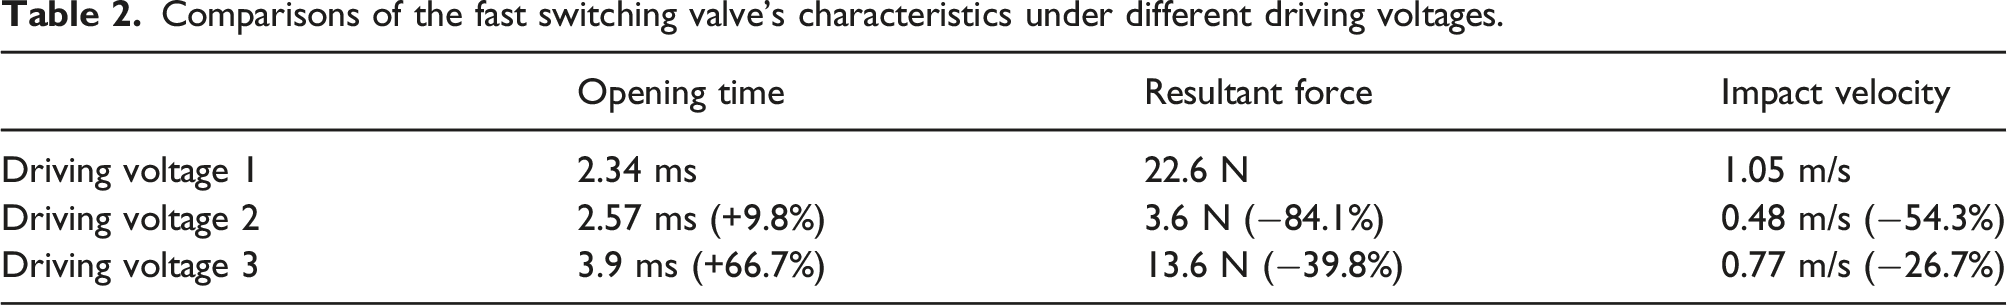
Based on the mathematical model established in the section Mathematical Model of FSV, the quantitative comparisons of initial impact velocity and opening time are conducted in this section. Comparisons of the FSV’s characteristics under different driving voltages are shown in Figure 4. Comparisons of the fast switching valve’s characteristics under different driving voltages.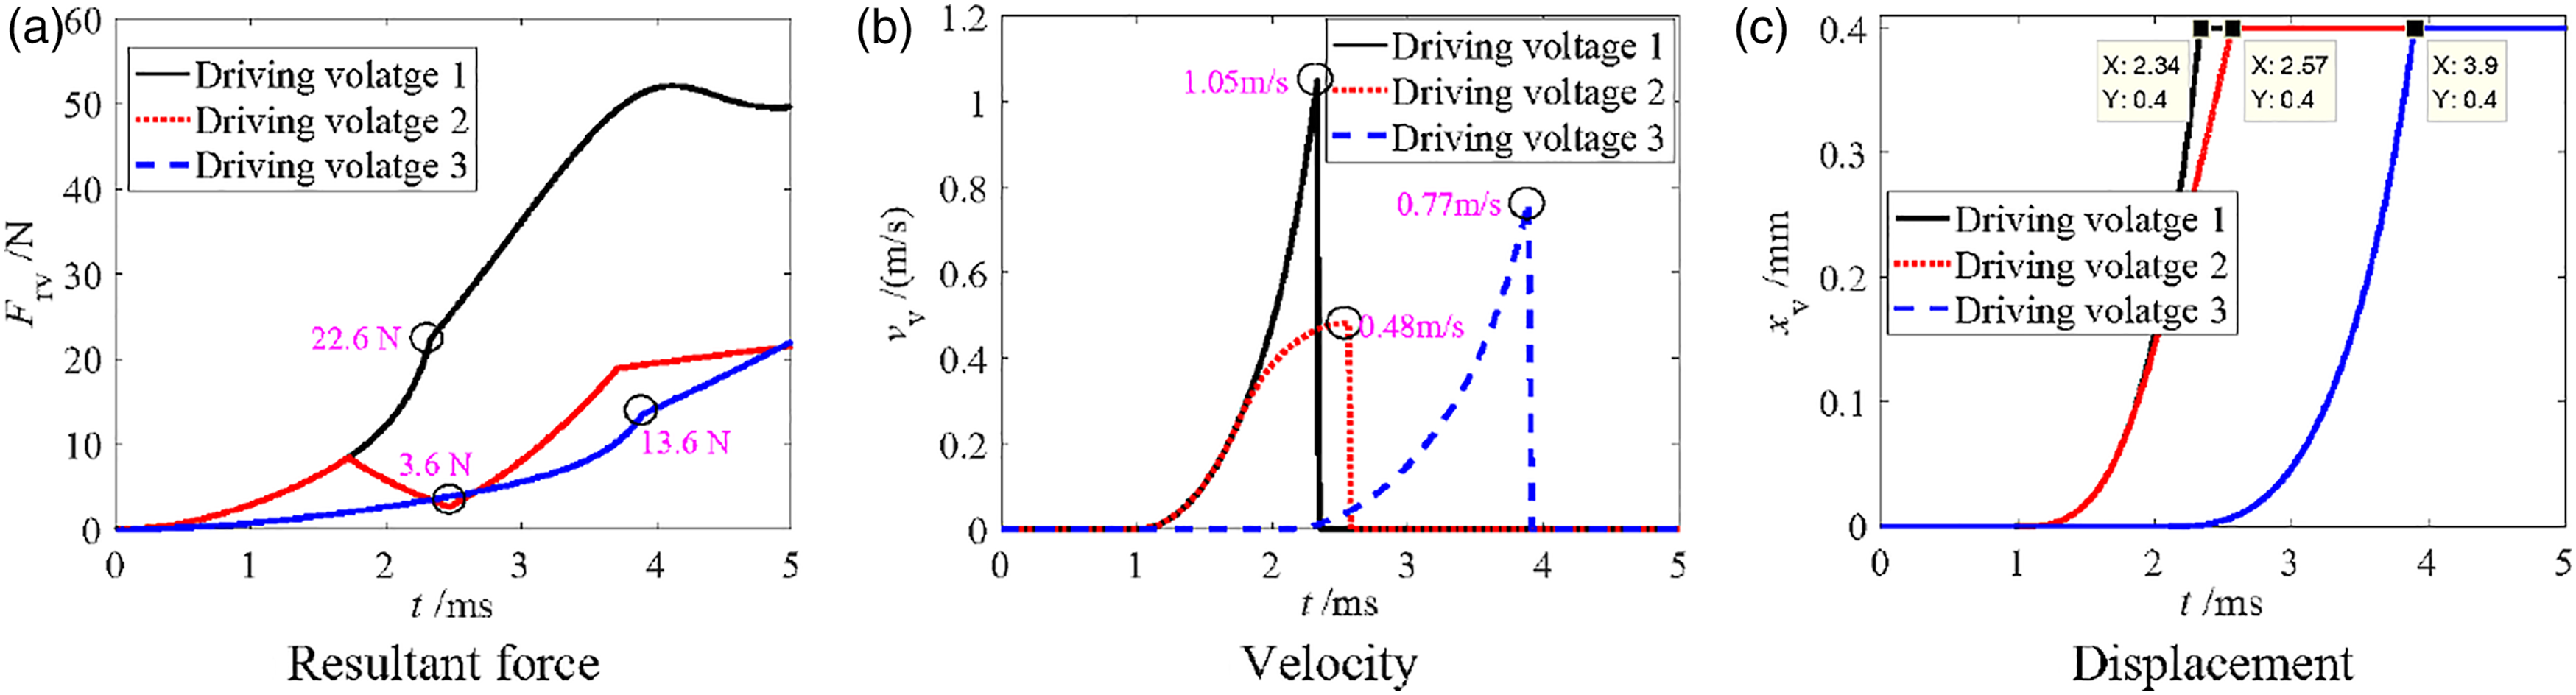
As shown in Figure 4, for the driving voltage 1 (24V), the impact velocity of the ball valve reaches 1.05 m/s and the opening time is only 2.34 ms. When using the driving voltage 3, the impact velocity reduces by 26.7% (0.77 m/s), but the dynamic characteristics are sacrificed (opening time reaches 3.9 ms), which is unacceptable. Conversely, when using the driving voltage 2, the impact velocity reduces by 54.3% (0.48 m/s) and the opening time only increases by 9.8% (2.57 ms), because the added negative voltage can reduce the electromagnetic force.
Comparisons of the fast switching valve’s characteristics under different driving voltages.
Dynamic characteristics of impact process
Actually, the kinetic model of the valve established in the section Mathematical Model of FSV is only used to describe dynamic behavior before impact. And initial impact velocity calculated in the section Initial Impact Velocity Under Different Driving Voltage Signals is the initial condition of the impact model. So, a mathematical model used to describe dynamic behavior after the ball valve hits the valve seat needs to be established. The whole process can be divided into the impact process and recovery process from the perspective of motion characteristics,
27
as shown in Figure 5. Where t0 and tz denote the start time and the ending time of the impact process, respectively, Δt denotes the total time of contact between the ball valve and the seat, and v0 denotes the initial impact velocity calculated in the section Initial Impact Velocity Under Different Driving Voltage Signals. Schematic diagram of the ball valve’s impact process.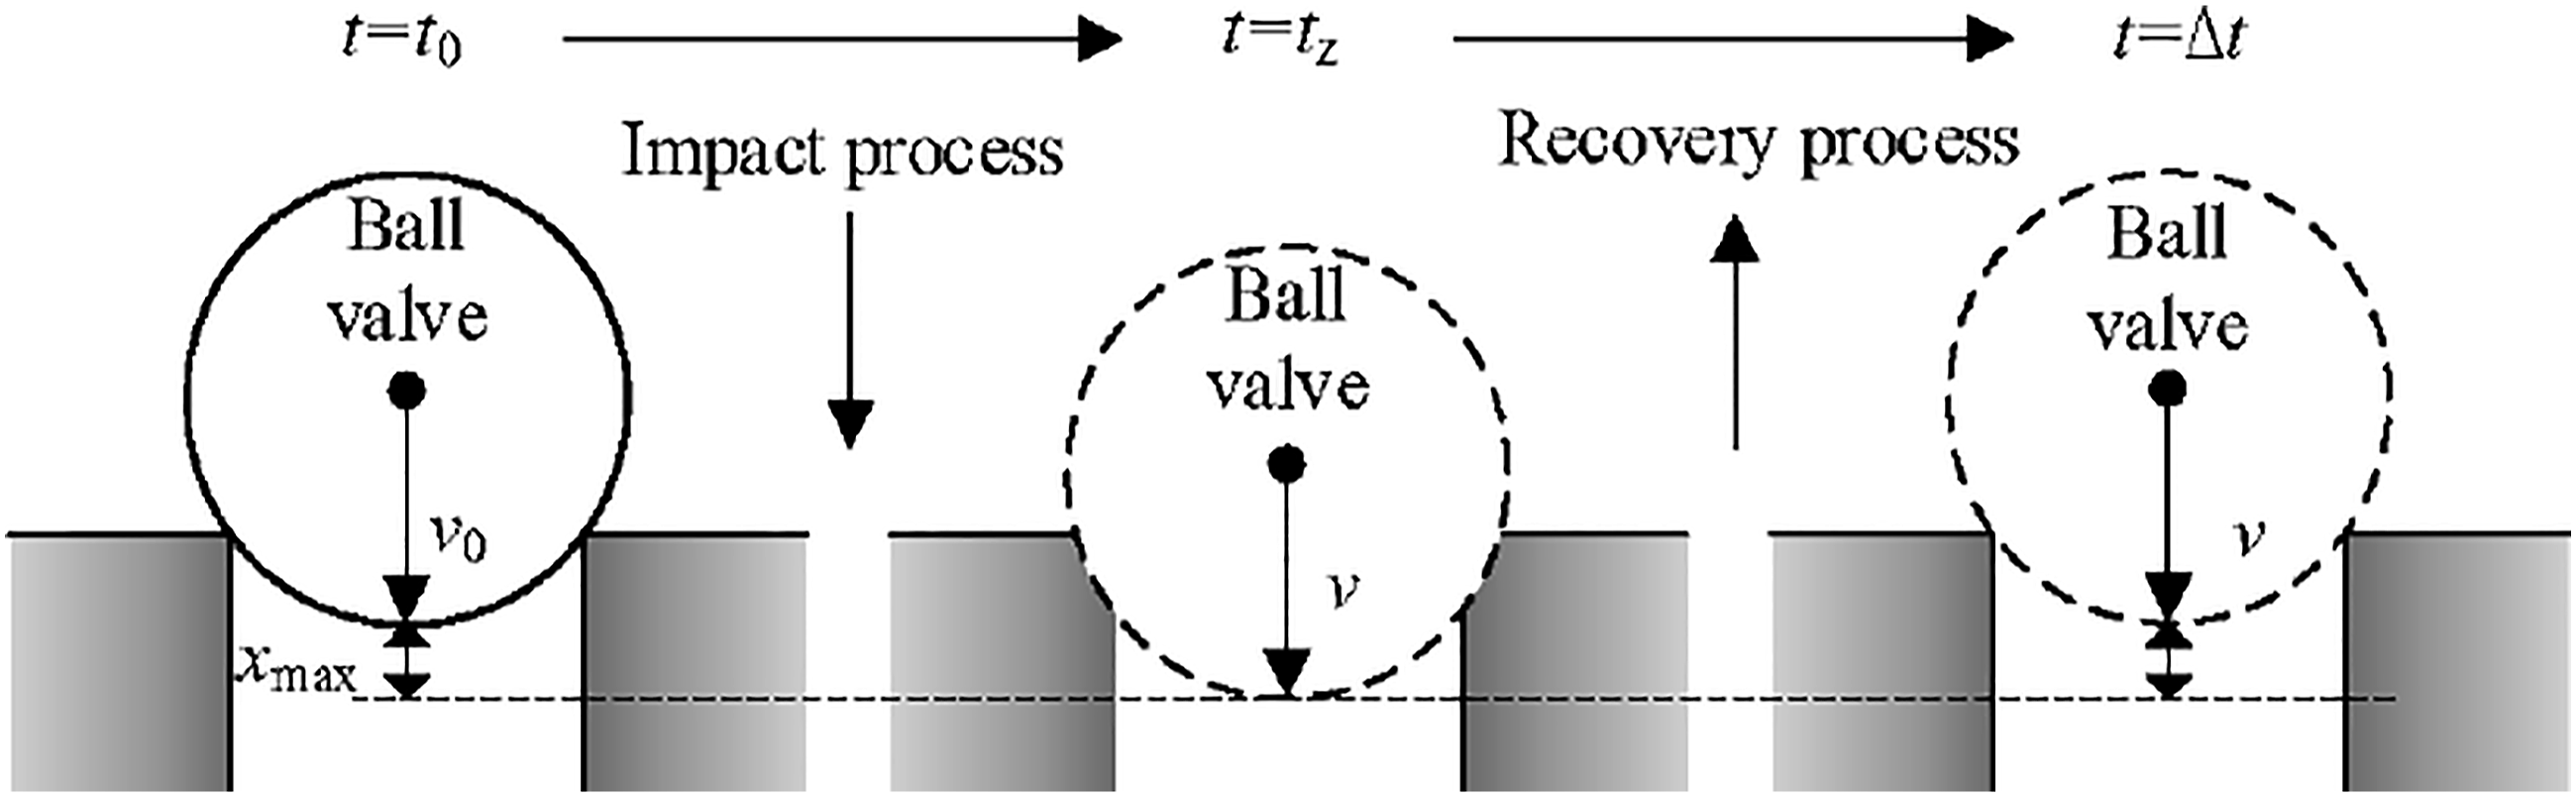
As shown in Figure 5, the kinetic energy of the ball valve is gradually transformed into the deformation energy of the valve seat in the stage t0∼tz. The impact displacement of the ball valve gradually increases and reaches the maximum until the velocity decreases to 0 at time tz. Conversely, the deformation energy of the valve seat converts to the kinetic energy of the ball valve in the stage tz∼Δt. The ball valve begins to rebound due to the reaction force of the valve seat which results in a gradual decrease of the impact displacement and a gradual increase of the impact velocity.
Assuming that the ball valve is rigid, and the valve seat is elastically deformed during the impact process. Based on the mass impact theory, the impact dynamic model of the valve system can be written as
14
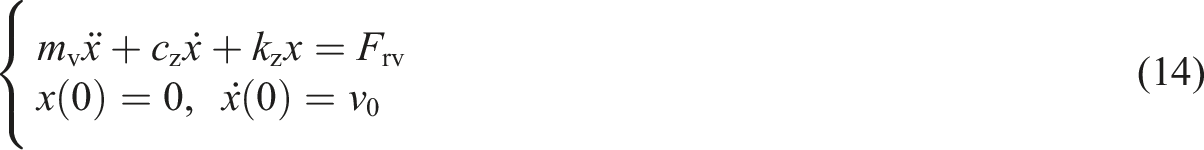
When Frv equals to 0, equation (14) is a homogeneous equation, and the actual performance is that the ball valve freely hits the valve seat; otherwise, equation (14) is a non-homogeneous equation, and the actual performance is that the ball valve hits the valve seat with the constraint of force.
Then, the solution of equation (14) is as follows


Finding the first derivative of equation (15) and substituting the condition 

Substituting the impact time tz into equation (15) to get the maximum impact displacement xmax as follows
Finite element simulation of the impact process
Pre-process of the simulation model
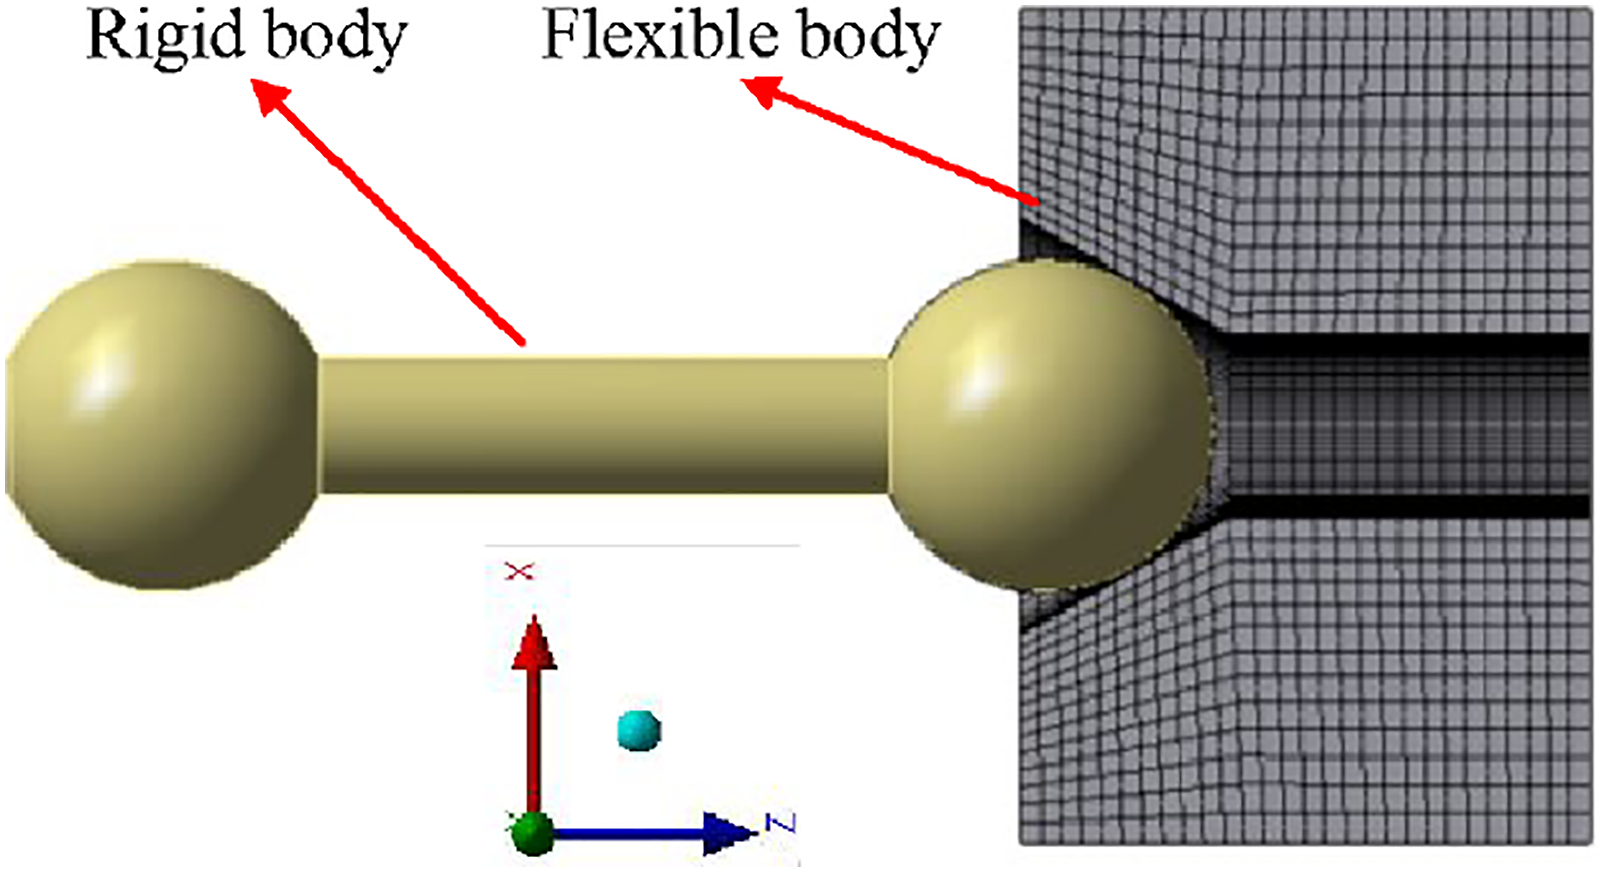
In order to analyze the transient impact characteristic (impact velocity, impact displacement, stress, strain, and wear) between the ball valve and the valve seat under different driving voltage strategies, a numerical simulation of the impact is carried out based on the transient dynamic simulation module of ANSYS. The pre-processing work such as establishing a finite element model, setting material properties, and boundary conditions is as follows: (1) Geometry and meshing: A 3D model of the valve is established by Pro/E and simplified based on the Saint-Venant principle. To shorten the simulation time, the gap between the ball valve and valve seat is set to 25 μm. Moreover, the hexahedral mesh is used to mesh the valve seat (Figure 6) and the mesh quality is checked and optimized continuously. The number of meshes is determined to be 18,832, the node is 82,846, and the average mesh quality is 0.85. (2) Material properties: The material of the ball valve is 40Cr (the elasticity modulus is 206 GPa, the density is 7870 kg/m3, the Poisson’s ratio is 0.28, and the yield stress is 550 MPa); the material of the valve seat is structural steel (the elasticity modulus is 211 GPa, the density is 7850 kg/m3, the Poisson’s ratio is 0.3, and the yield stress is 350 MPa). Since the material of the ball valve has higher yield stress and wear resistance than the valve seat, the ball valve is set as a rigid body, and the valve seat is set as a flexible body. (3) Boundary conditions: The contact stiffness and contact damping between the ball valve and the valve seat are consistent with the theoretical model. Moreover, according to the actual working characteristics of the FSV, a fixed constraint is imposed on the bottom surface and the side surface of the valve seat. The DOF (degrees of freedom) of Z-direction of the ball valve is free and other DOFs are restricted. Finally, the initial Z-direction velocity and external force of the ball valve are same as the calculation presented in the section Initial Impact Velocity Under Different Driving Voltage Signals. 3D computing mesh model.
Finite simulation results of the transient impact characteristics
(1) Simulation results of the impact velocity and impact displacement.
Impact velocity and impact displacement of the ball valve when initial impact velocity is 1.05 m/s are shown in Figure 7. Impact characteristics of the ball valve when initial impact velocity is 1.05 m/s.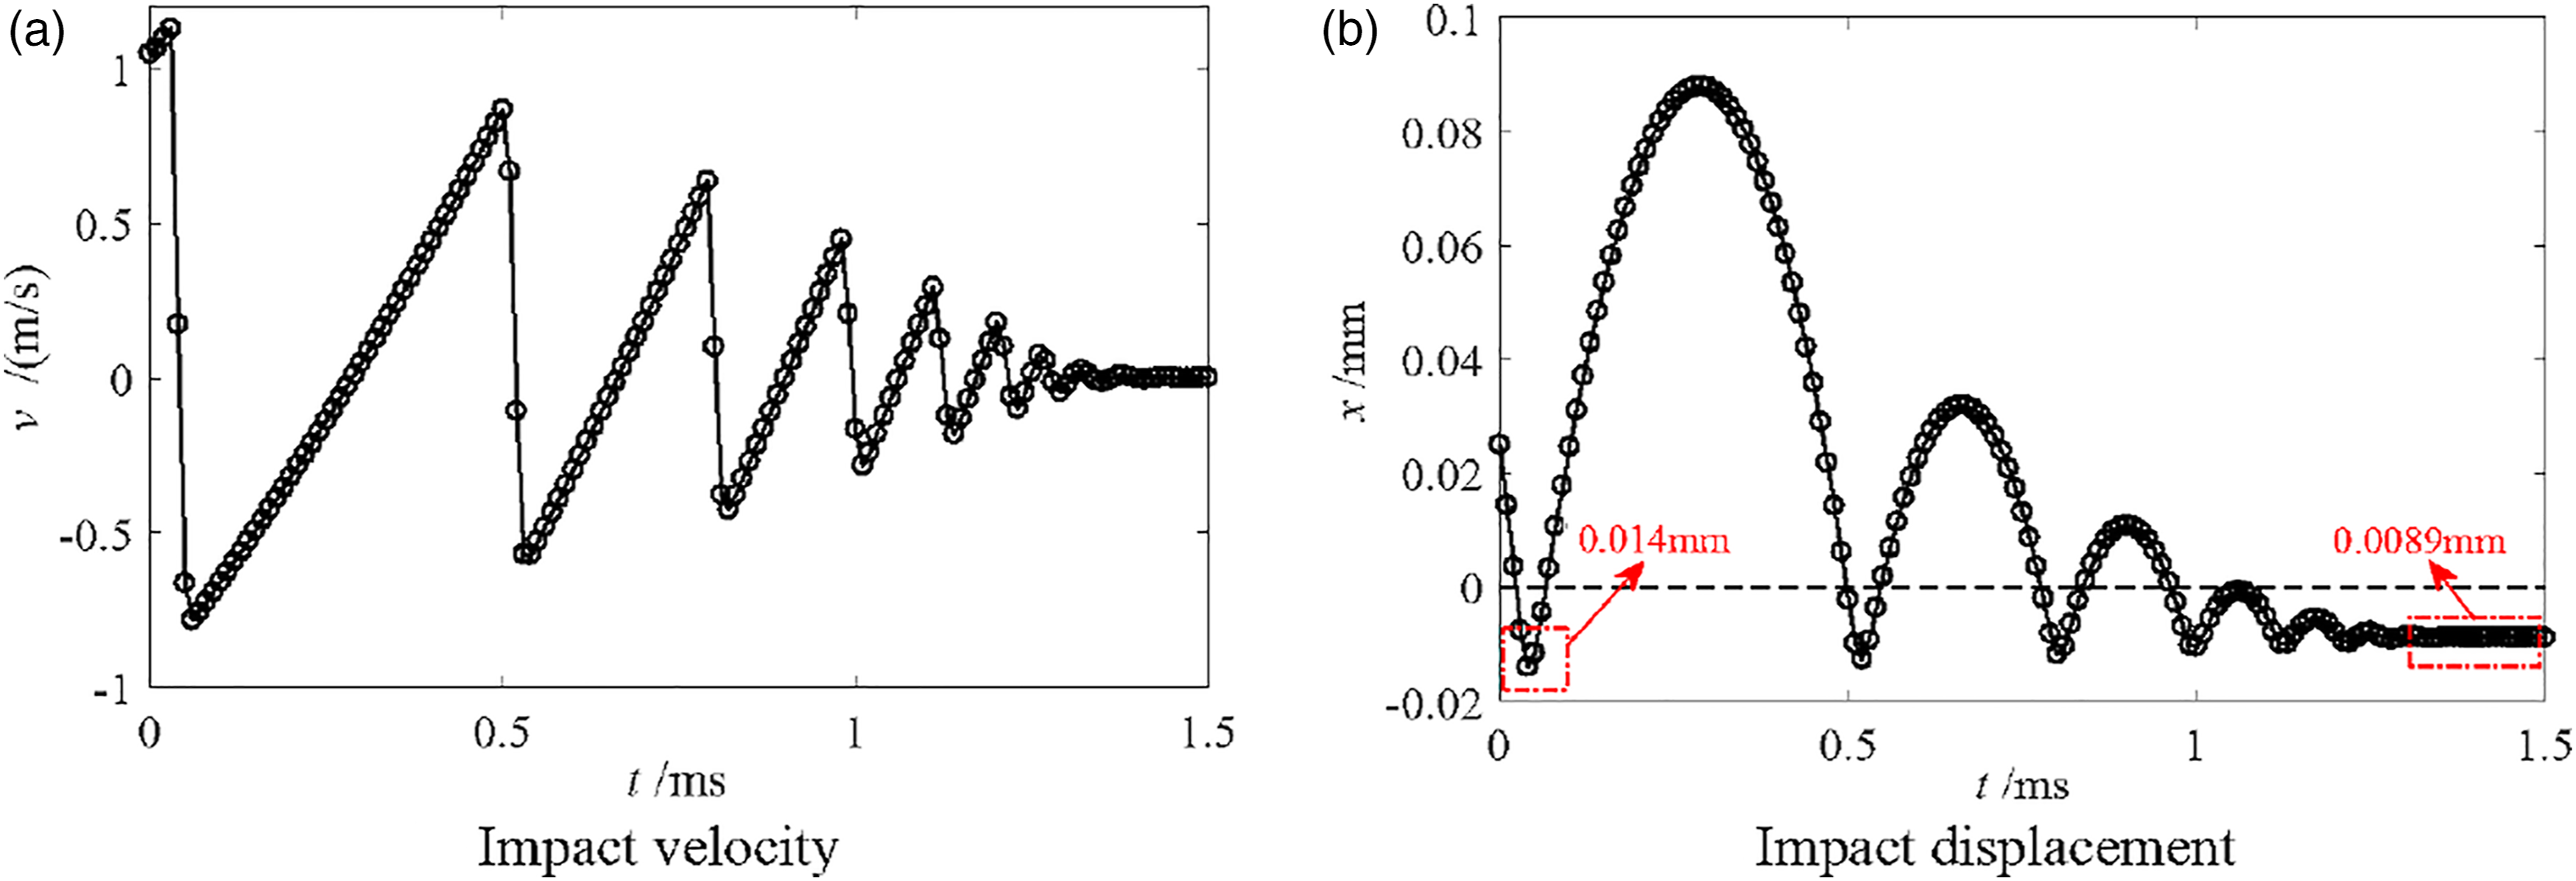
Figure 7 shows that, when the initial impact velocity is 1.05 m/s, the ball valve just contacts the valve seat at 0.023 ms and enters the impact process. The maximum impact displacement that occurred during the first impact process (at 0.04 ms) reaches 0.014 mm, and the time duration of the impact process is about 0.017 ms. After that, the system goes into the recovery process, and the ball valve starts to move in reverse due to the reaction force of the valve seat. At 0.066 ms, the ball valve is separated from the valve seat. Due to the external force, the velocity of the ball valve decreases, and the ball valve impacts the valve seat again. The velocity and displacement of the ball valve attenuate in the form of under-damped oscillation due to the energy loss, such as friction, vibration, and deformation. And the steady-state impact displacement is maintained at 0.0089 mm.
Impact velocity and impact displacement of the ball valve when initial impact velocity is 0.48 m/s are shown in Figure 8. Impact characteristics when initial impact velocity is 0.48 m/s.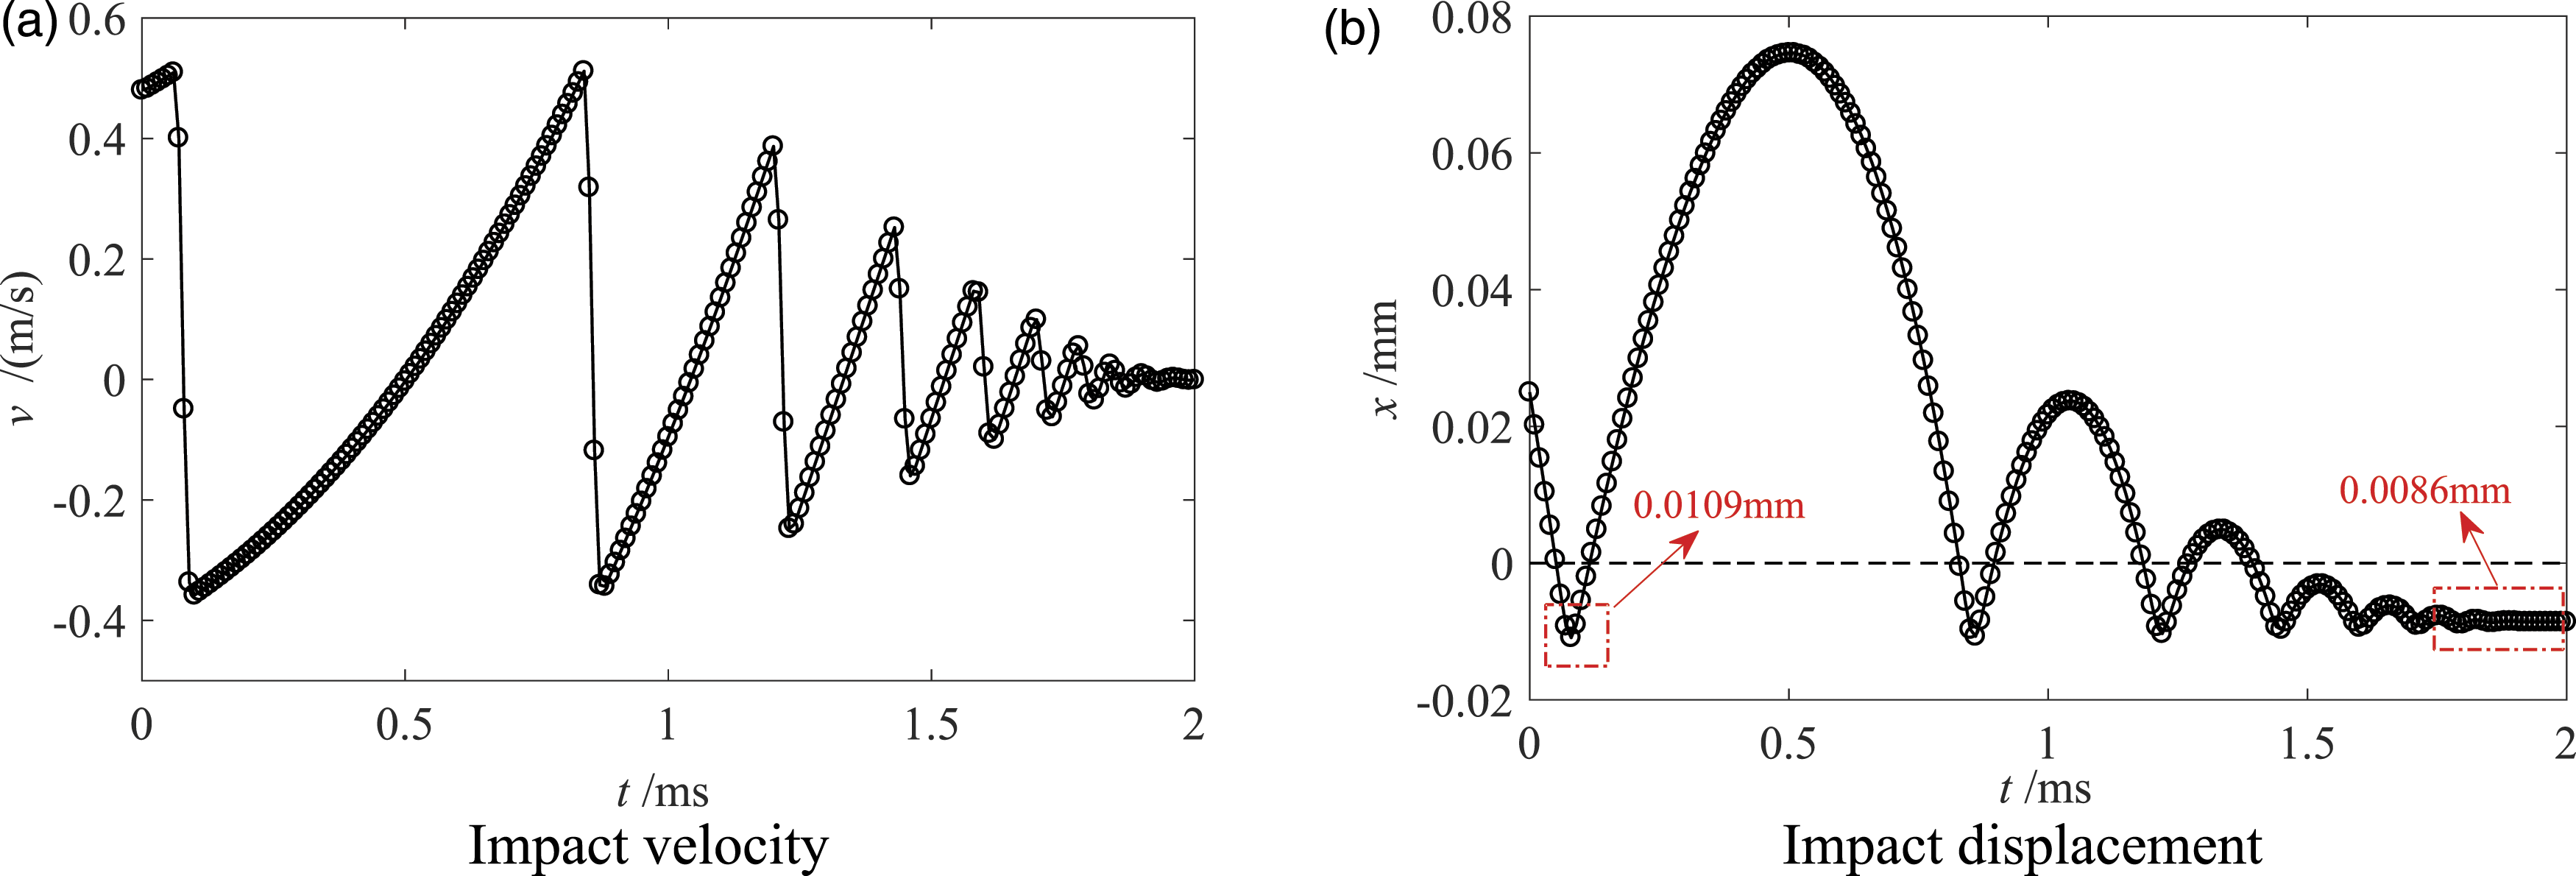
As shown in Figure 8, when the initial impact velocity is 0.48 m/s, the changing rules of the impact velocity and displacement are basically same as that of Figure 7, and both of them exhibit a process of under-damped oscillation. However, due to the added negative voltage, the initial velocity of the ball valve is reduced to 0.48 m/s. This indicates that the maximum impact displacement and steady-state impact displacement are reduced by 22.1% (0.0109 mm) and 3.4% (0.0086 mm), respectively, compared to the initial impact velocity (1.05 m/s). Moreover, the impact velocities in Figure 7 and Figure 8 have the basic properties of a fractal oscillator which can be described using a two-scale fractal theory28,29 in the future.
Comparisons of the maximum impact displacement between finite simulation and theoretical calculation are listed in Table 3. It is easy to get that the maximum error between the theoretical results and the ANSYS simulation results reaches 56%. This is because, in the theoretical calculation, some nonlinear factors such as friction, material failure, and contact are not considered, which can be considered in ANSYS simulation. (2) Simulation results of the stress and strain. Comparisons of the maximum impact displacement between finite simulation and theoretical calculation.
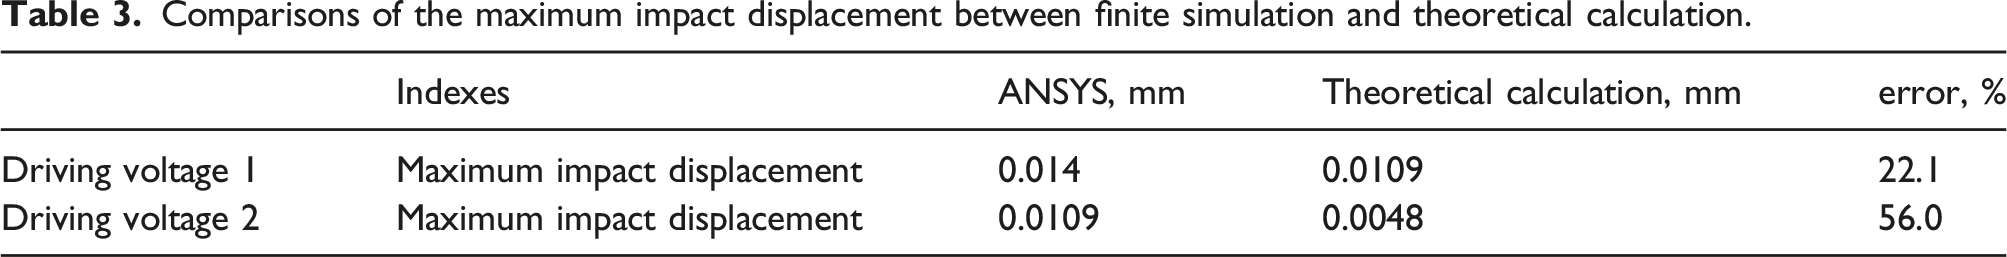
It is necessary to analyze the stress and strain of the valve seat during the transient impact process because the deformation and wear of the valve seat have significant influences on the flow characteristics of the FSV. Figures 9 and 10 show the stress distribution and strain distribution of the valve seat under different impact velocities. Stress and strain distribution of the valve’s seat when initial impact velocity is 1.05 m/s. Stress and strain distribution of the valve’s seat when initial impact velocity is 0.48 m/s.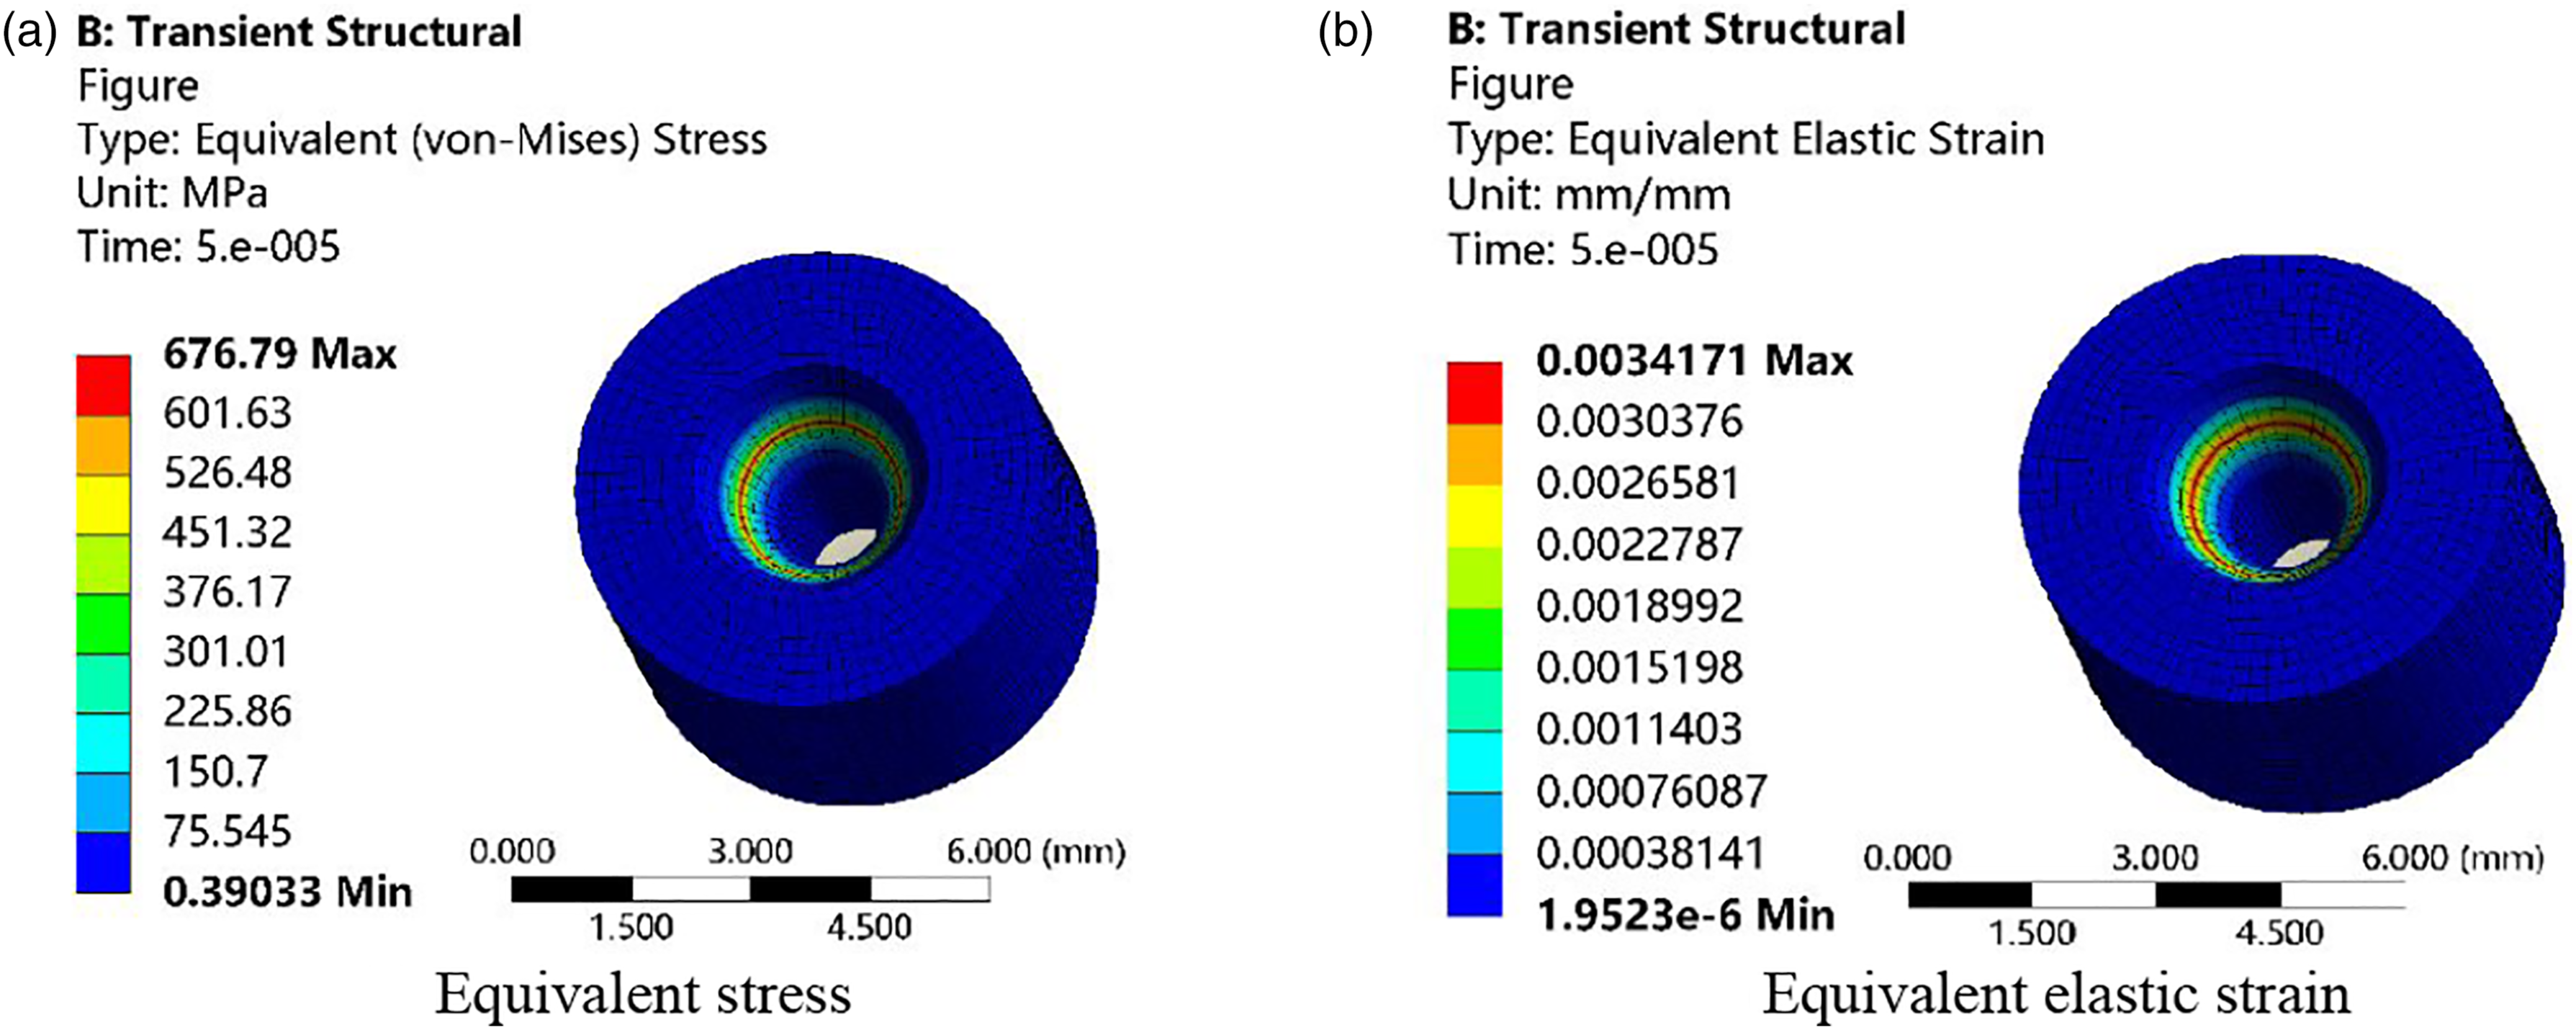
As shown in Figure 9, when impact velocity is 1.05 m/s, the stress and strain of the valve seat are mainly concentrated on the edge of the inner circular hole and are uniformly distributed in a ring shape. The maximum equivalent stress and maximum equivalent strain of the valve seat reach 676.79 MPa and 0.0034, respectively, which occur in the first impact process. This is because the initial kinetic energy is the largest, and more kinetic energy is converted into the strain energy during the first impact process between the ball valve and the valve seat. Moreover, the line contact between the ball valve and the valve seat causes stress concentration which is prone to stress fatigue failure of the valve seat.
Figure 10 shows that, since the impact velocity and the external force are effectively reduced because of using the initial impact velocity of 0.48 m/s, the maximum equivalent stress (291 MPa) and maximum equivalent strain (0.0015) of the valve seat are reduced by 57% and 55.9%, respectively, compared to Figure 9. It can be seen that the stress fatigue can be effectively alleviated and the service life can be improved by reducing the impact velocity. (3) Simulation results of the wear of the valve seat.
During each impact of the ball valve and the valve seat, the loss of material due to large local stress causes a significant effect on the flow characteristics of the valve port. The numerical simulation work on the wear of the valve seat is only concerned in this research because the wear resistance of the ball valve is better than that of the valve seat. In the simulation, an Archard model based on the adhesion wear theory is used,
30
and the approximate calculation is as follows


A comparison of the valve seat’s wear under different impact velocities is shown in Figure 11. Comparison of the wear volume under different impact velocities.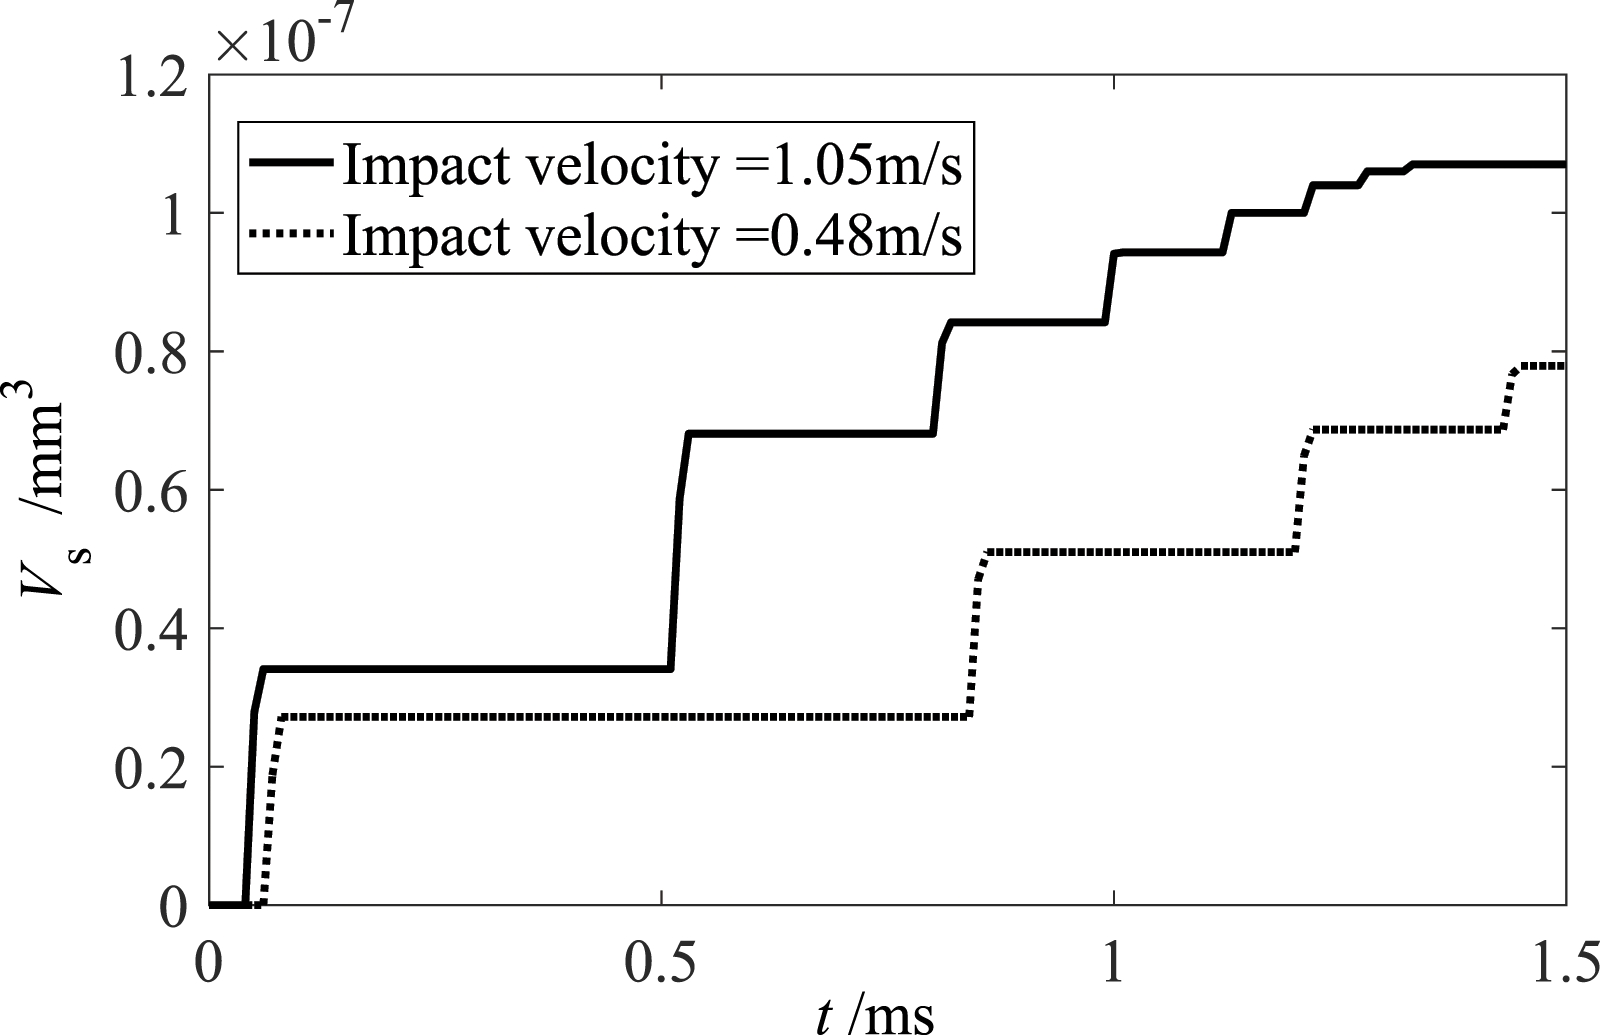
As shown in Figure 11, the volume of wear increases only during the impact process and is consistent with the theoretical analysis. The wear volume of the valve seat maintains the maximum value when the system reaches a steady state. In addition, when the impact velocity is 0.48 m/s, the wear volume of the valve seat is only 0.78×10⁻⁷mm3, which is about 27.1% lower than that (1.07×10⁻⁷mm3) of the impact velocity (1.05 m/s).
It can be seen that the volume of wear caused by the impact is relatively small during one cycle. However, the influence of wear cannot be ignored when the FSV has been working for a long time. For example, the switching number of the FSV reaches 200 during 1s when the PWM carrier frequency is 100 Hz. In addition, the surface material, roughness, and lubrication condition of the FSV are all deteriorated due to the constant wear, which further accelerates wear.
For ease of analysis, we assume that the wear of the valve seat is linear (the wear volume per impact is same), and the relationship between the volume of wear and the number of impacts is shown in Figure 12. Relation between the wear volume and the number of impacts.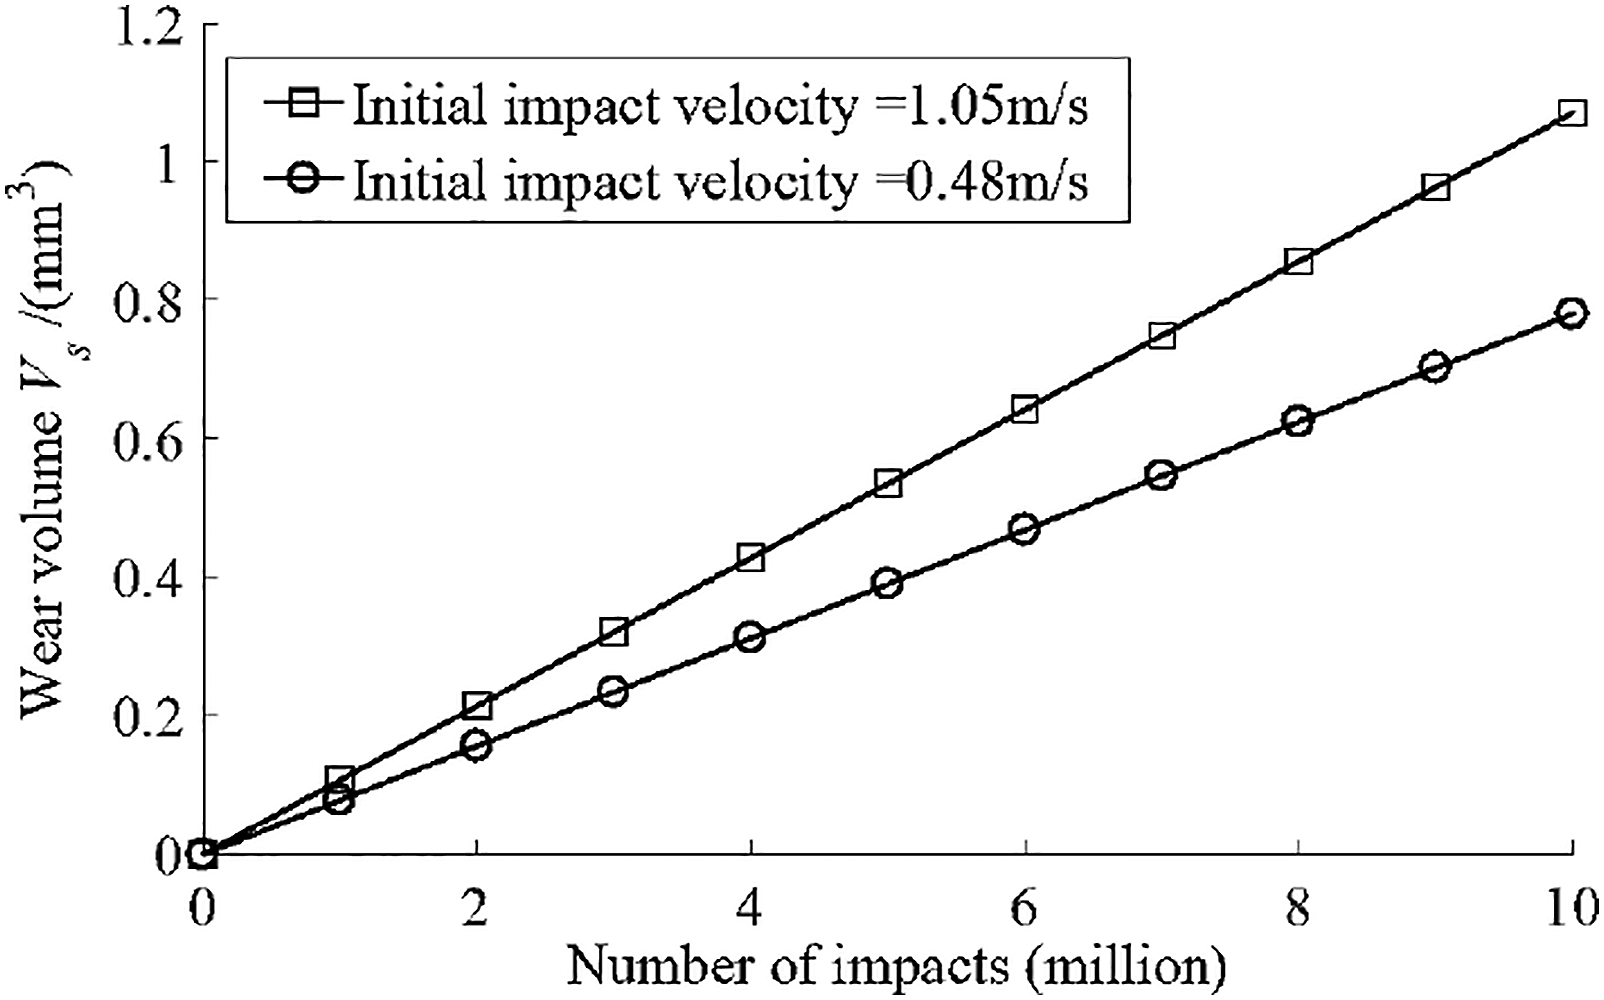
As shown in Figure 12, with the increase of the number of impacts, the wear volume of the valve seat increases linearly. Although the service life of the FSV can reach 100 million times, as the volume of wear increases, it inevitably has a significant influence on the flow characteristics of the valve port.
In order to quantitatively analyze the influence of the wear on the flow area of the valve port, the flow area of the valve port before and after the impact is given, as shown in Figure 13. Variation in the flow area of the valve port caused by the wear.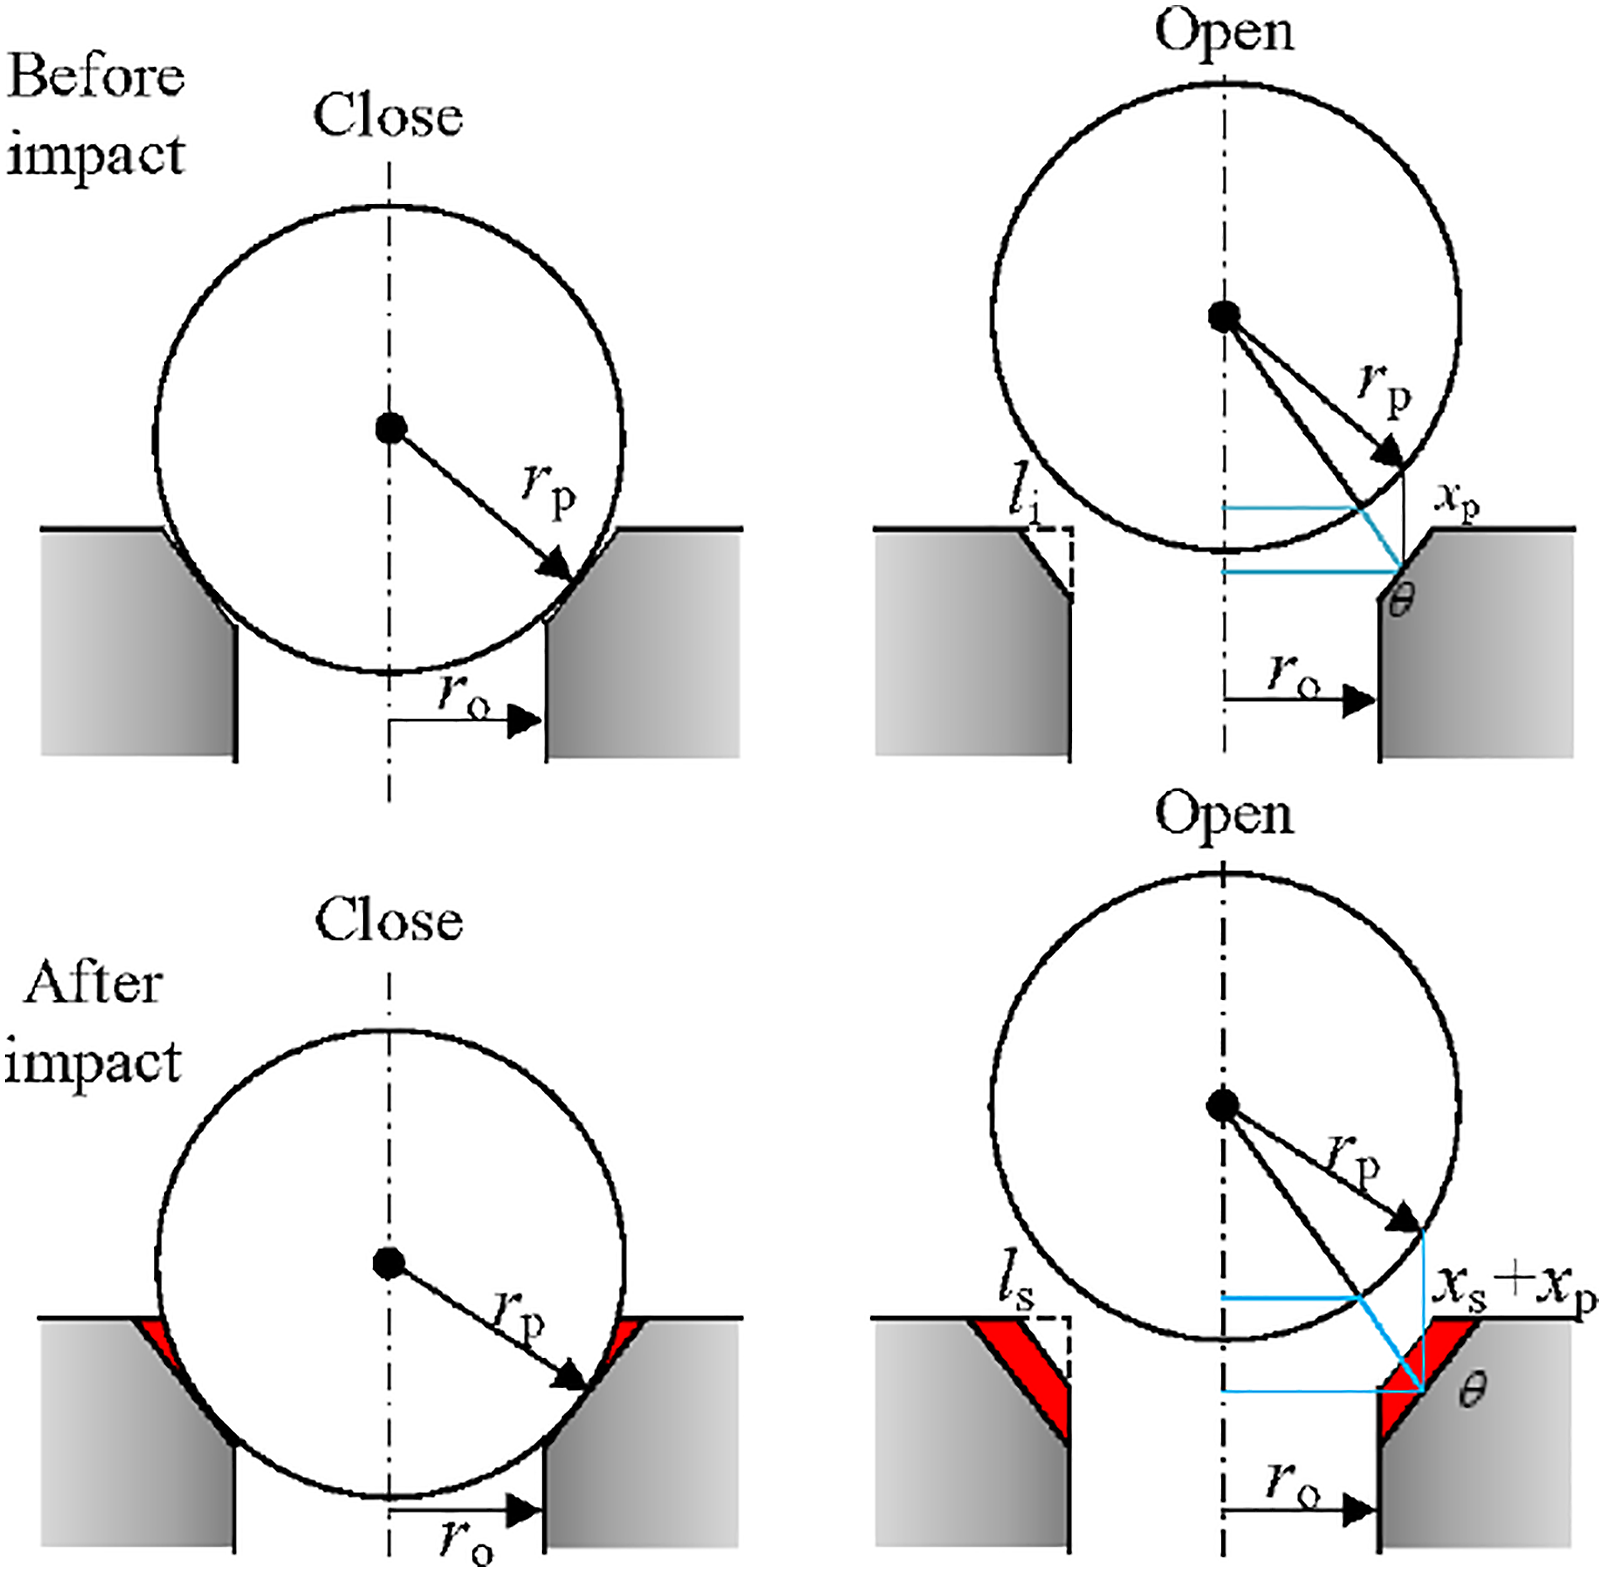
As shown in Figure 13, the flow area of the valve port before impact (initial state) is as follows
The flow area of the valve port after impact can be written as
In order to calculate the value of xs, assuming that the total volume of wear is equally distributed at the valve port, based on the principle of equal volume, the relationship between the volume of wear (Vs) and the length of the wear side (ls) can be obtained
And ls can be written as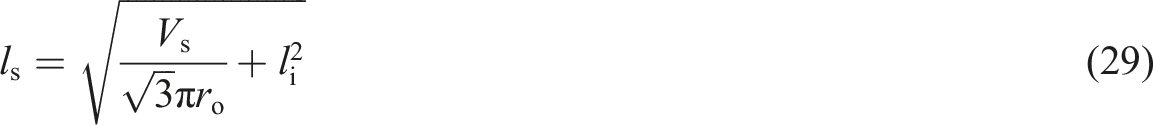
So, the value of xs can be calculated by
According to equations (17)–(21), the relation between the number of impacts and the flow area is shown in Figure 14. Relationship between the wear volume and the flow area.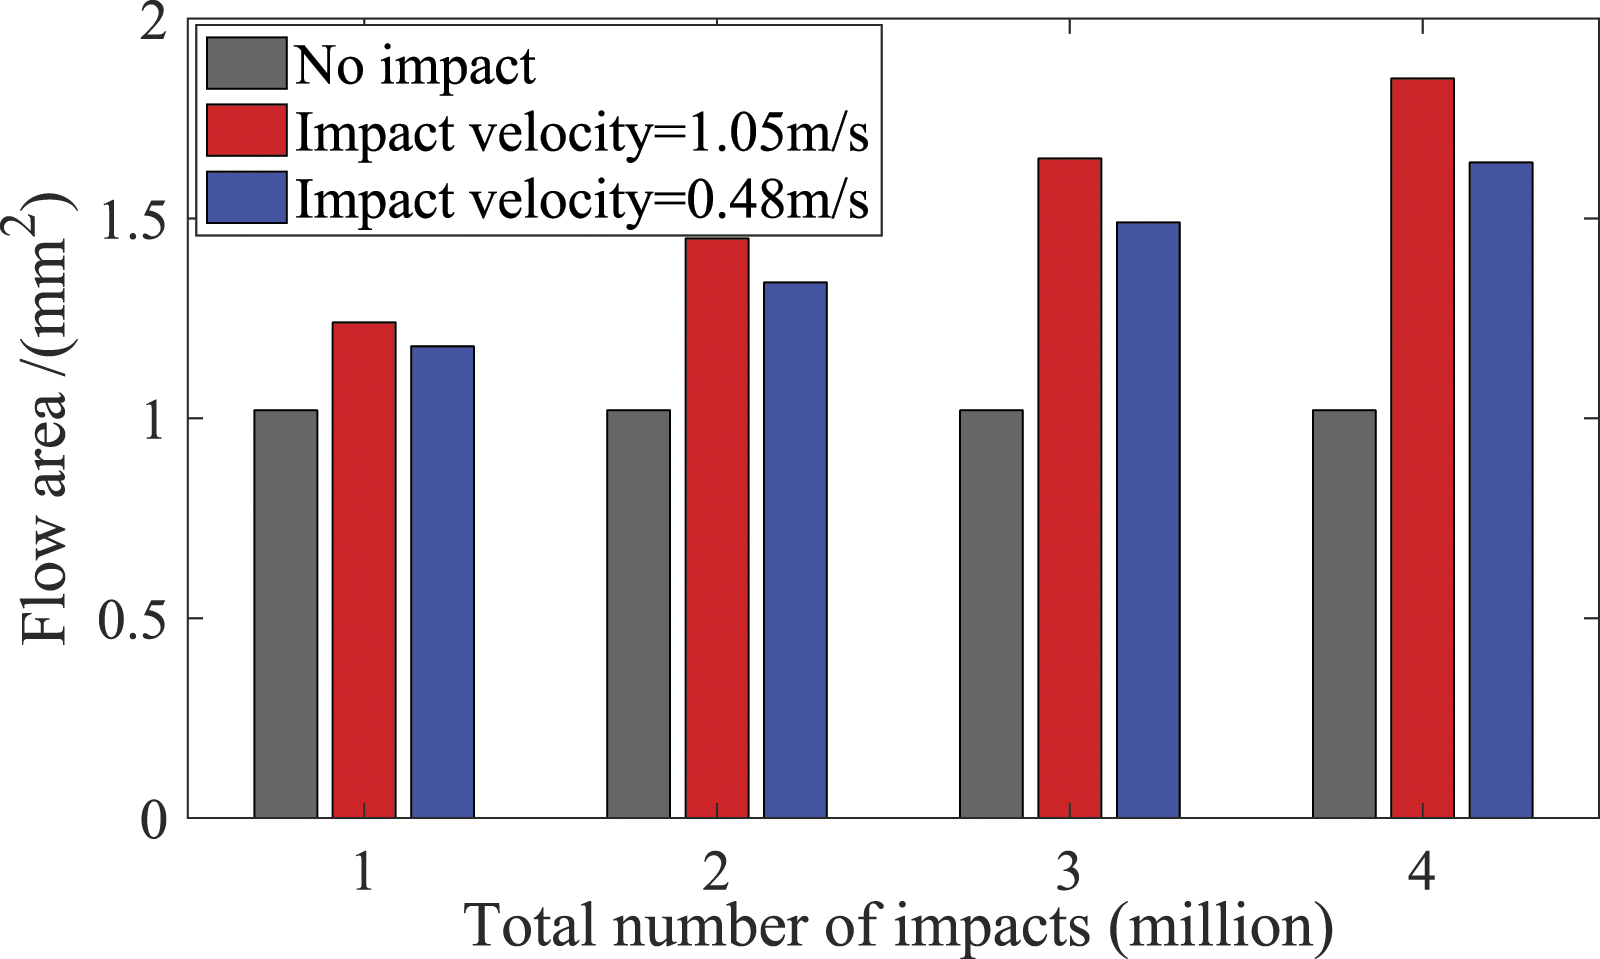
As it can be seen from Figure 14, with the increase of the number of impacts, the flow area of the valve port increases significantly. When the ball valve hits the valve seat with the impact velocity of 1.05 m/s, the flow area increases from 1.024 mm2 to 1.24 mm2 under one million times of impact. Conversely, when the impact velocity is 0.48 m/s, the variation of the flow area reduces by 27.3%.
Comparisons of the impact characteristics under different driving voltages.
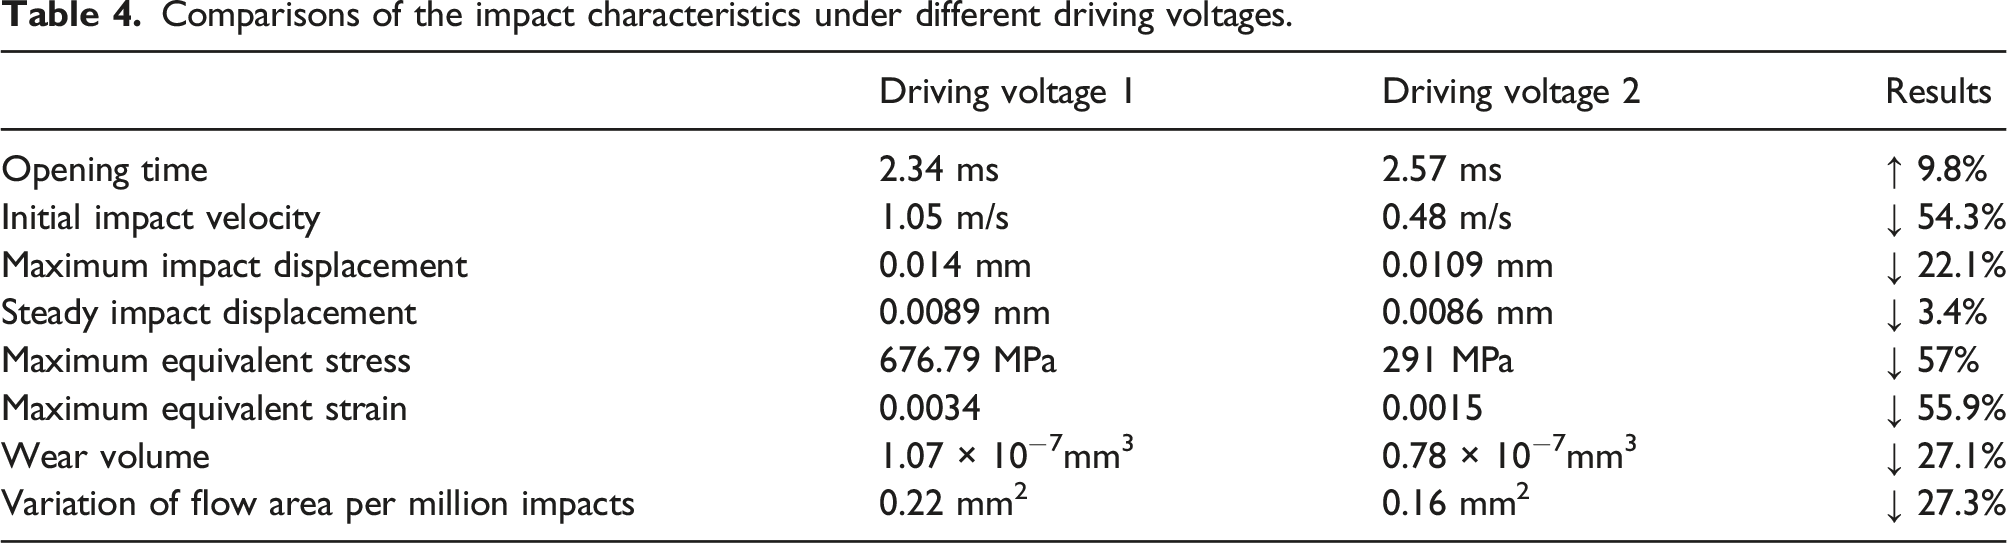
Table 3 indicates that when using the driving voltage 2 although the opening time is only increased by 9.8%, the initial impact velocity is reduced by 54.3% which shows that the impact displacement and the maximum equivalent stress are reduced significantly. Moreover, the wear volume of the valve seat is also reduced significantly. Hence, the driving voltage 2 can effectively reduce the deformation and wear of the valve seat, as well as the vibration of the system.
Comparative experimental results
To further study the influences of the driving voltage strategies on the dynamic performance and the impact characteristics of the fast switching valve (FSV), a test bench for the FSV is established, as shown in Figure 15. The test bench mainly consists of a fast switching valve, a voltage amplifier, xPC target controller (master computer, slave computer, and PCI 6251 control card), and an accumulator designed by our research lab (pre-charge pressure is 2 MPa). The xPC target controller is used to provide different driving voltage signals, and the voltage amplifier (NanTong Longyi LYB-5010, frequency response: 20 kHz) is used to drive the FSV by amplifying voltage. In order to avoid the noise of the pump station, the hydraulic accumulator is used to provide oil for the FSV. In addition, an acceleration sensor (Sinocera piezoelectric CA-YD-181) is used to measure the acceleration of the valve body which is caused by the ball valve’s motion. A sound level meter (Hangzhou Aihua AWA5661, range: 0–140 dB) is used to measure the working noise of the FSV. An oscilloscope is used to capture all signals of the above sensors. Impact test bench of the fast switching valve.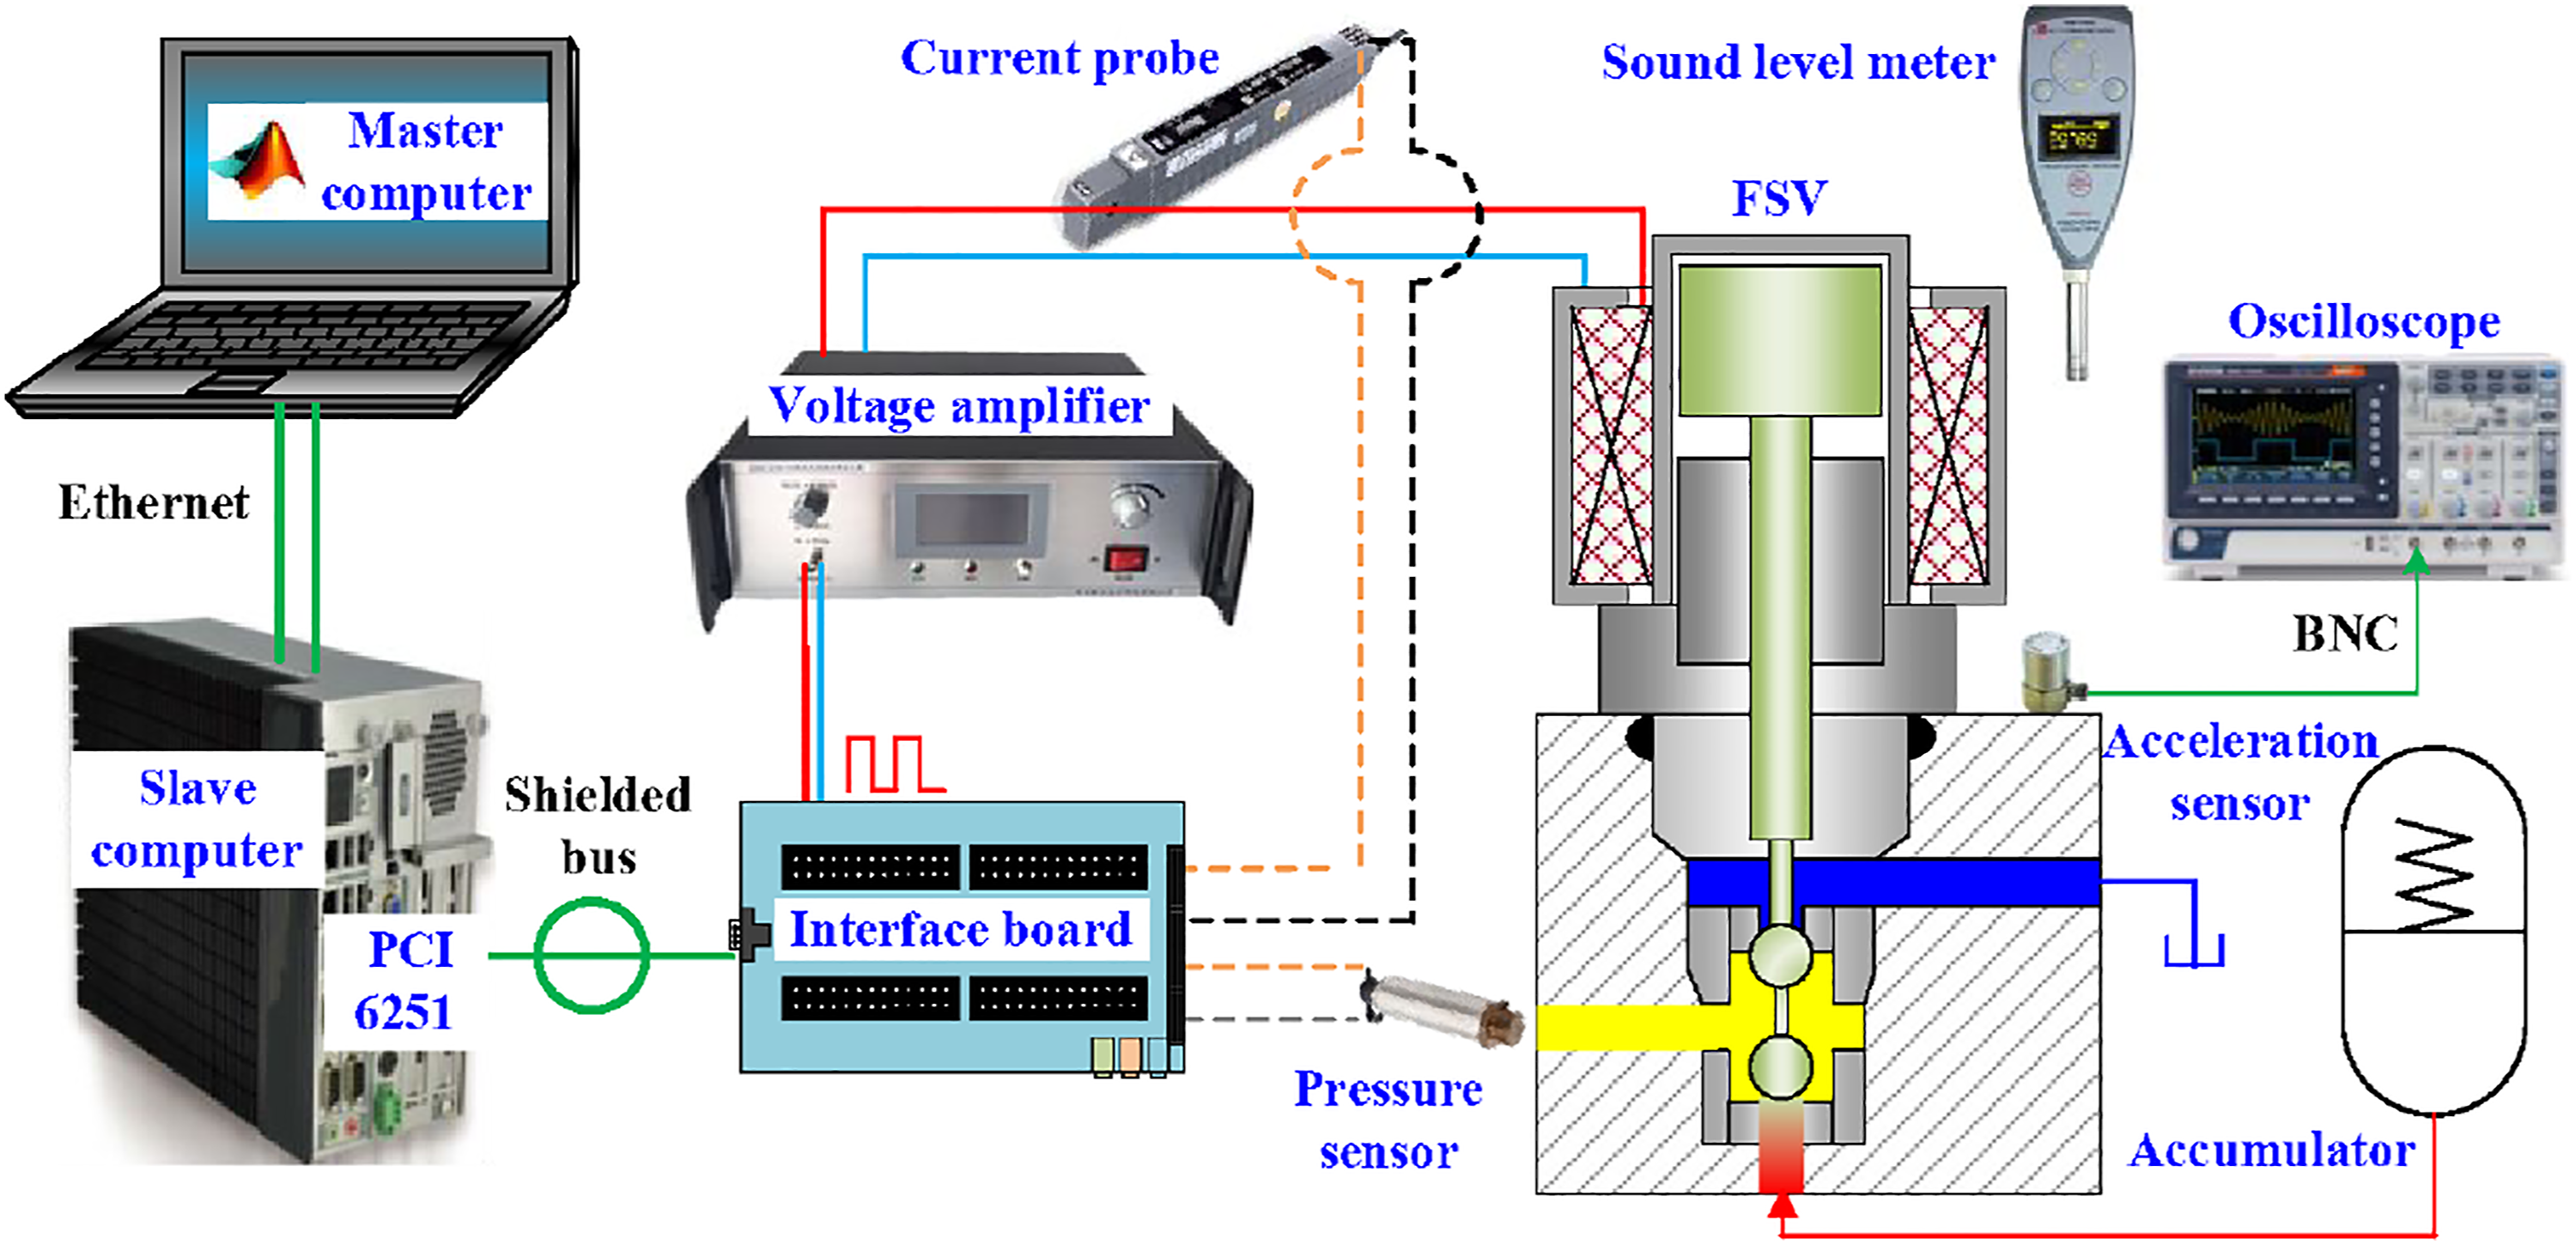
Comparison of dynamic performance
Pressure in port C (control pressure) is often used to assess the dynamic performance of the FSV. Comparisons of the control pressure under different driving voltage strategies are shown in Figure 16. Comparisons of the pressure in port C.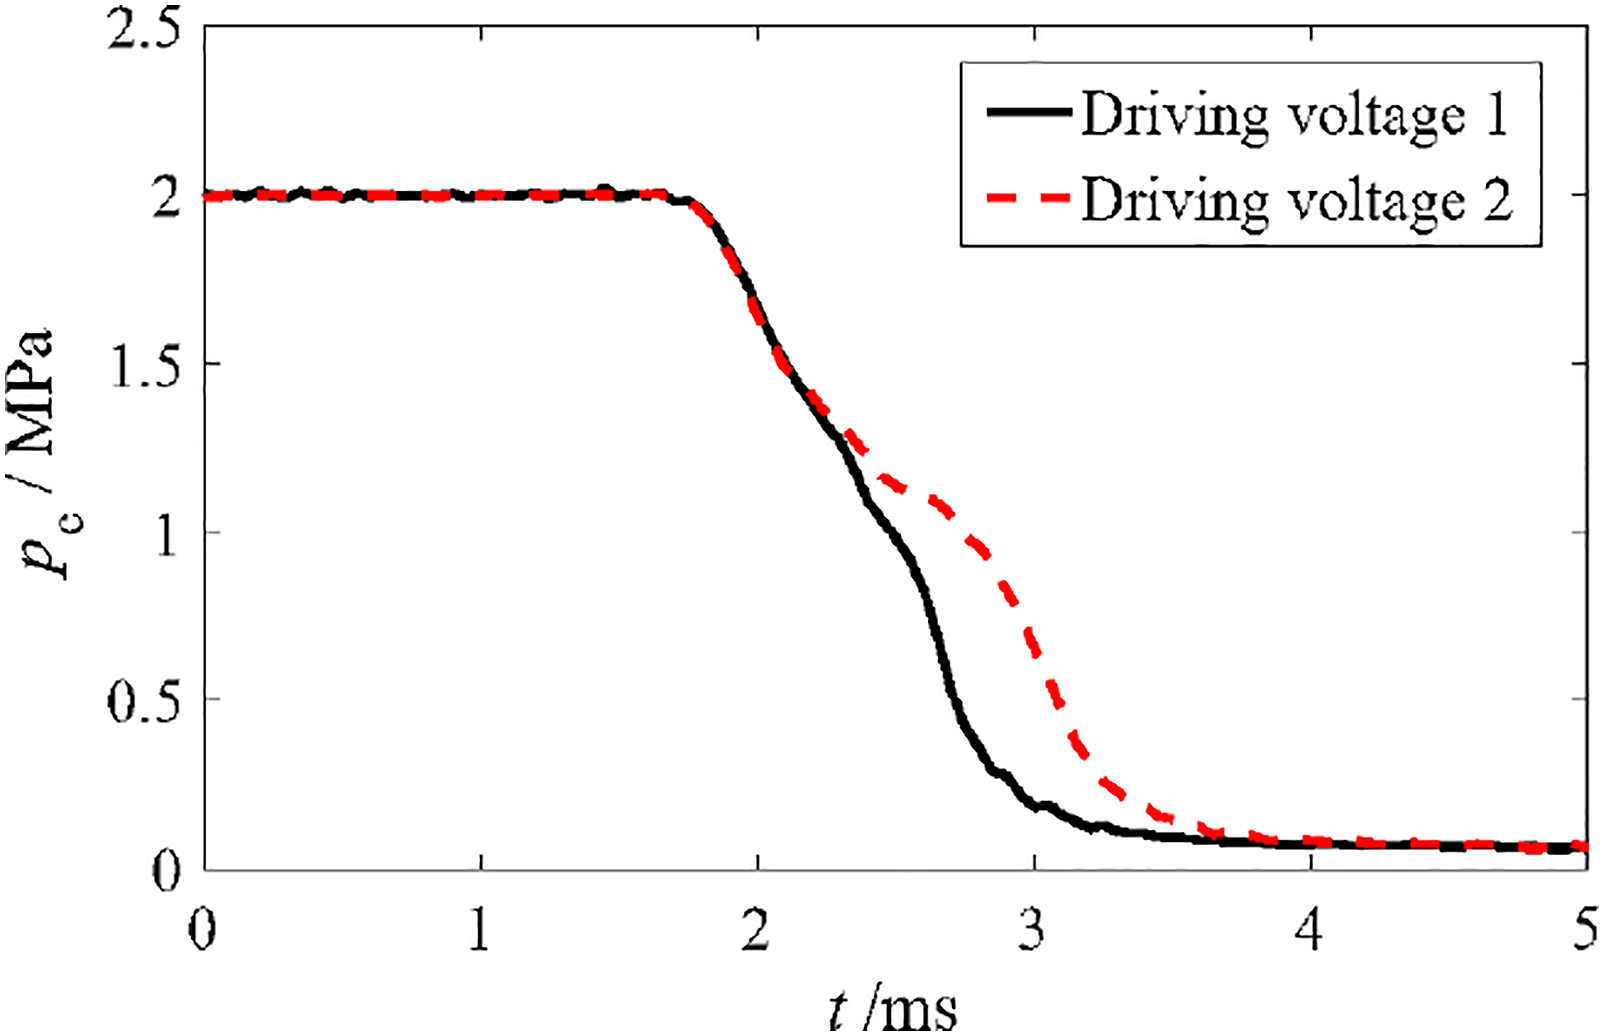
As it can be seen from Figure 16, compared to driving voltage 1, when using driving voltage 2, there exists only a small delay in the control pressure (about 0.2 ms) which is acceptable in many practical applications.
Comparison of acceleration
When the ball valve hits the valve seat, it inevitably leads to the transient vibration of the valve system. An acceleration sensor installed in the valve body is used to collect the acceleration data of the system which relates to the impact velocity.
In order to obtain the detailed characteristics of the changing impact acceleration, the acceleration within 1 ms is captured using an oscilloscope (GWINSTEK, GDS-1104B) to ensure that there are enough acquisition points (100,000 points in 1 ms). To analyze the frequency of the acceleration, FFT (Fast Fourier Transform) method is performed on the experimental results. Comparisons of the impact acceleration spectrum under different driving voltage strategies are shown in Figure 17. Comparisons of the impact acceleration spectrum.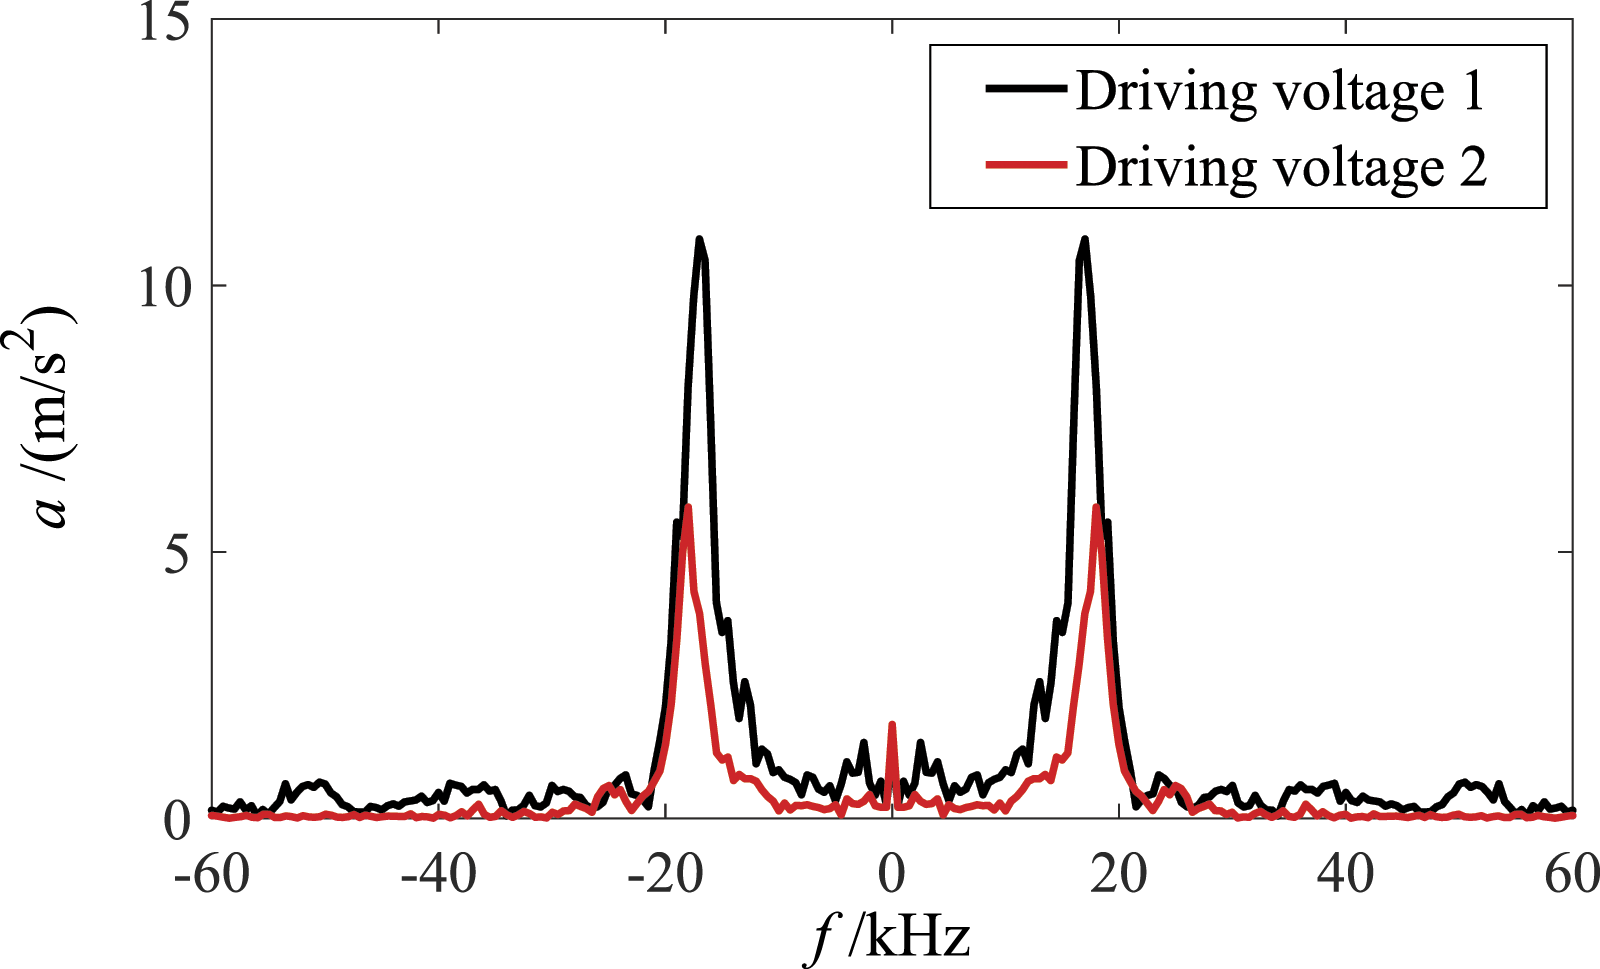
As shown in Figure 17, when driving voltage 2 is used, the maximum amplitude of the acceleration is significantly reduced (65.7%), compared to driving voltage 1. This can reduce the vibration of the valve system and increase its service life. In addition, the peak frequency (18 kHz) is smaller than 20 kHz (the perceptible limit frequency of the human ear).
Comparison of impact noise
Experimental results of impact noise under different driving voltage strategies are shown in Figure 18. During the experiment condition, the ambient noise is around 52 dB which is measured using a sound level meter. Figure 18 indicates that, compared to the driving voltage 1 (75 dB), when using the driving voltage 2, the average amplitude of the impact noise is reduced by 12% (66 dB). Comparison of the impact noise.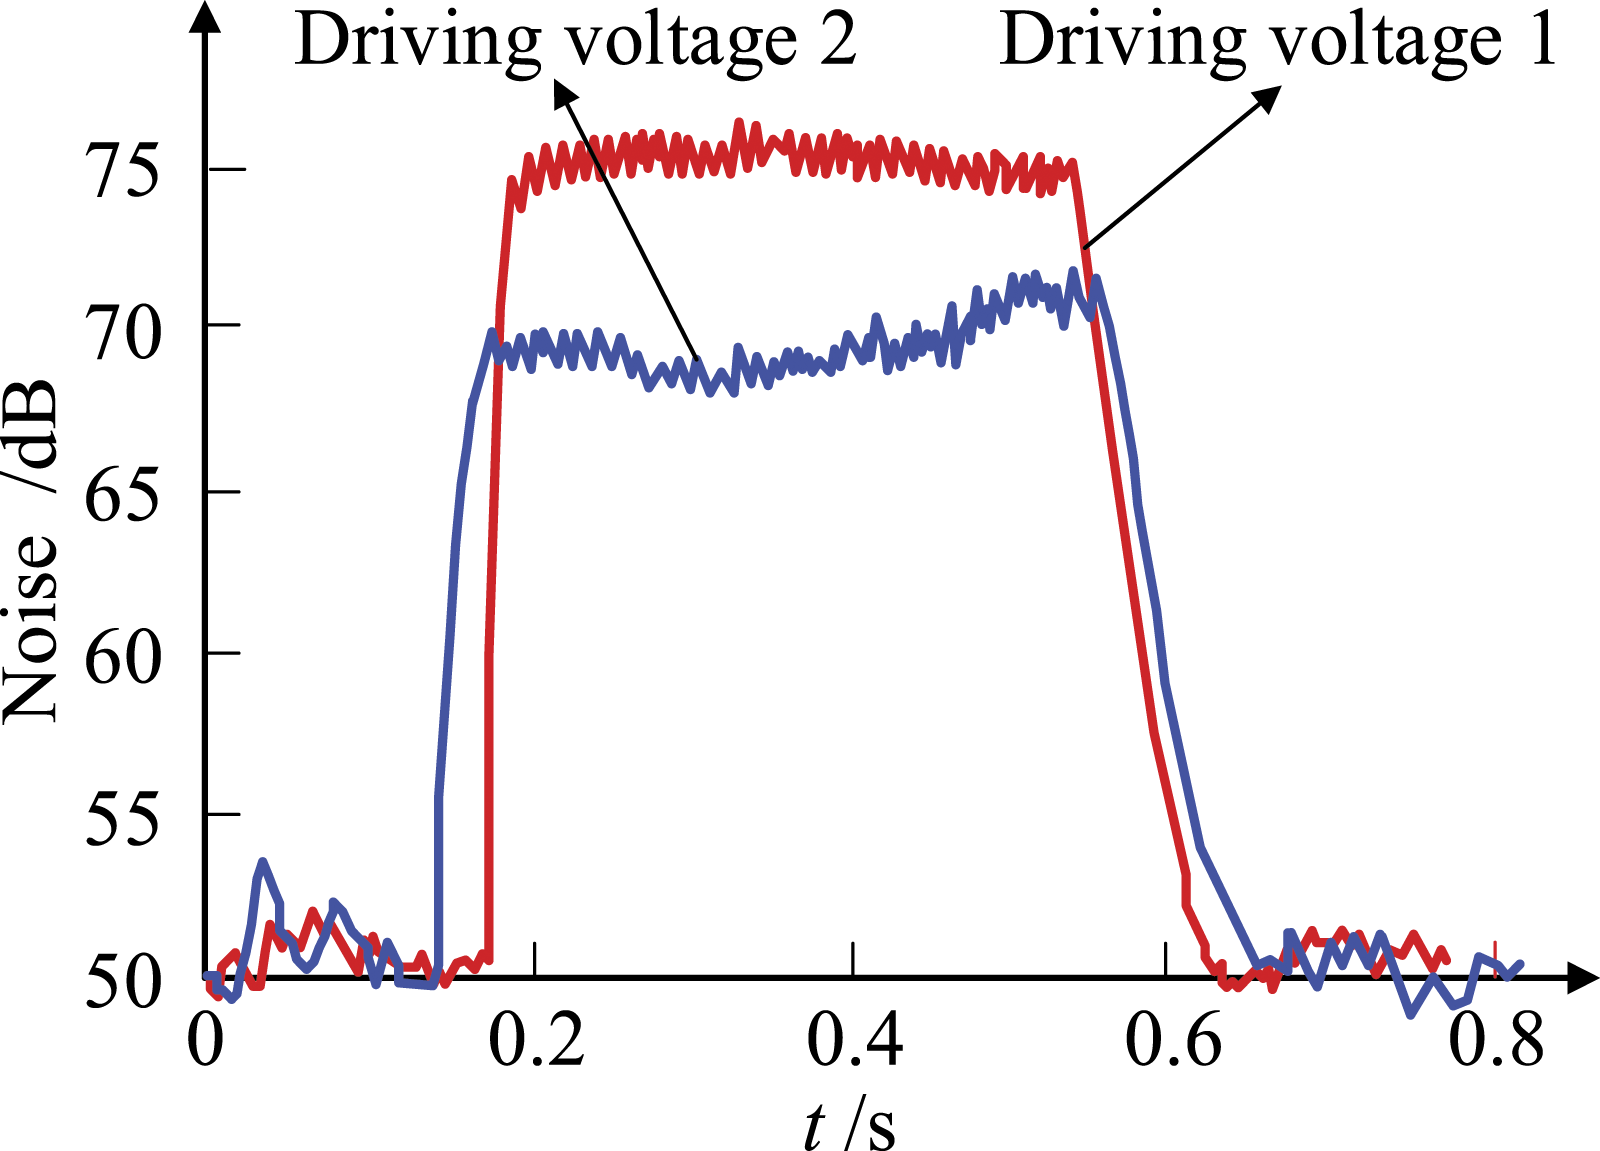
The oscillation area in the middle of the noise curve corresponds to the working process of the fast switching valve (FSV). Specifically, the noise suddenly increases when the valve hits the valve seat, and then decreases. Since the frequency response of the sound level meter is low, it cannot measure the operating frequency of the FSV in real-time and only measures the steady-state noise, thus forming the oscillation process in Figure 18. In the future, we will focus on the fault diagnosis method integrating pressure signal, acceleration signal, and noise signal, which is beneficial to realize real-time prediction of valve stuck, wear and electromagnetic degradation, and other faults.31,32
The impact noise consists of the acceleration noise and the ringing noise. The former is caused by the transient impact between the ball valve and the valve seat, and the latter is caused by the natural motion of the valve system. In order to analyze the mechanism and composition of the impact noise, a modal simulation tool in ANSYS Workbench is used to reveal the natural frequencies of the valve system. In the modal simulation, the first six orders of mode shapes and their frequencies are given as shown in Figure 19. Modal simulation of fast switching valve.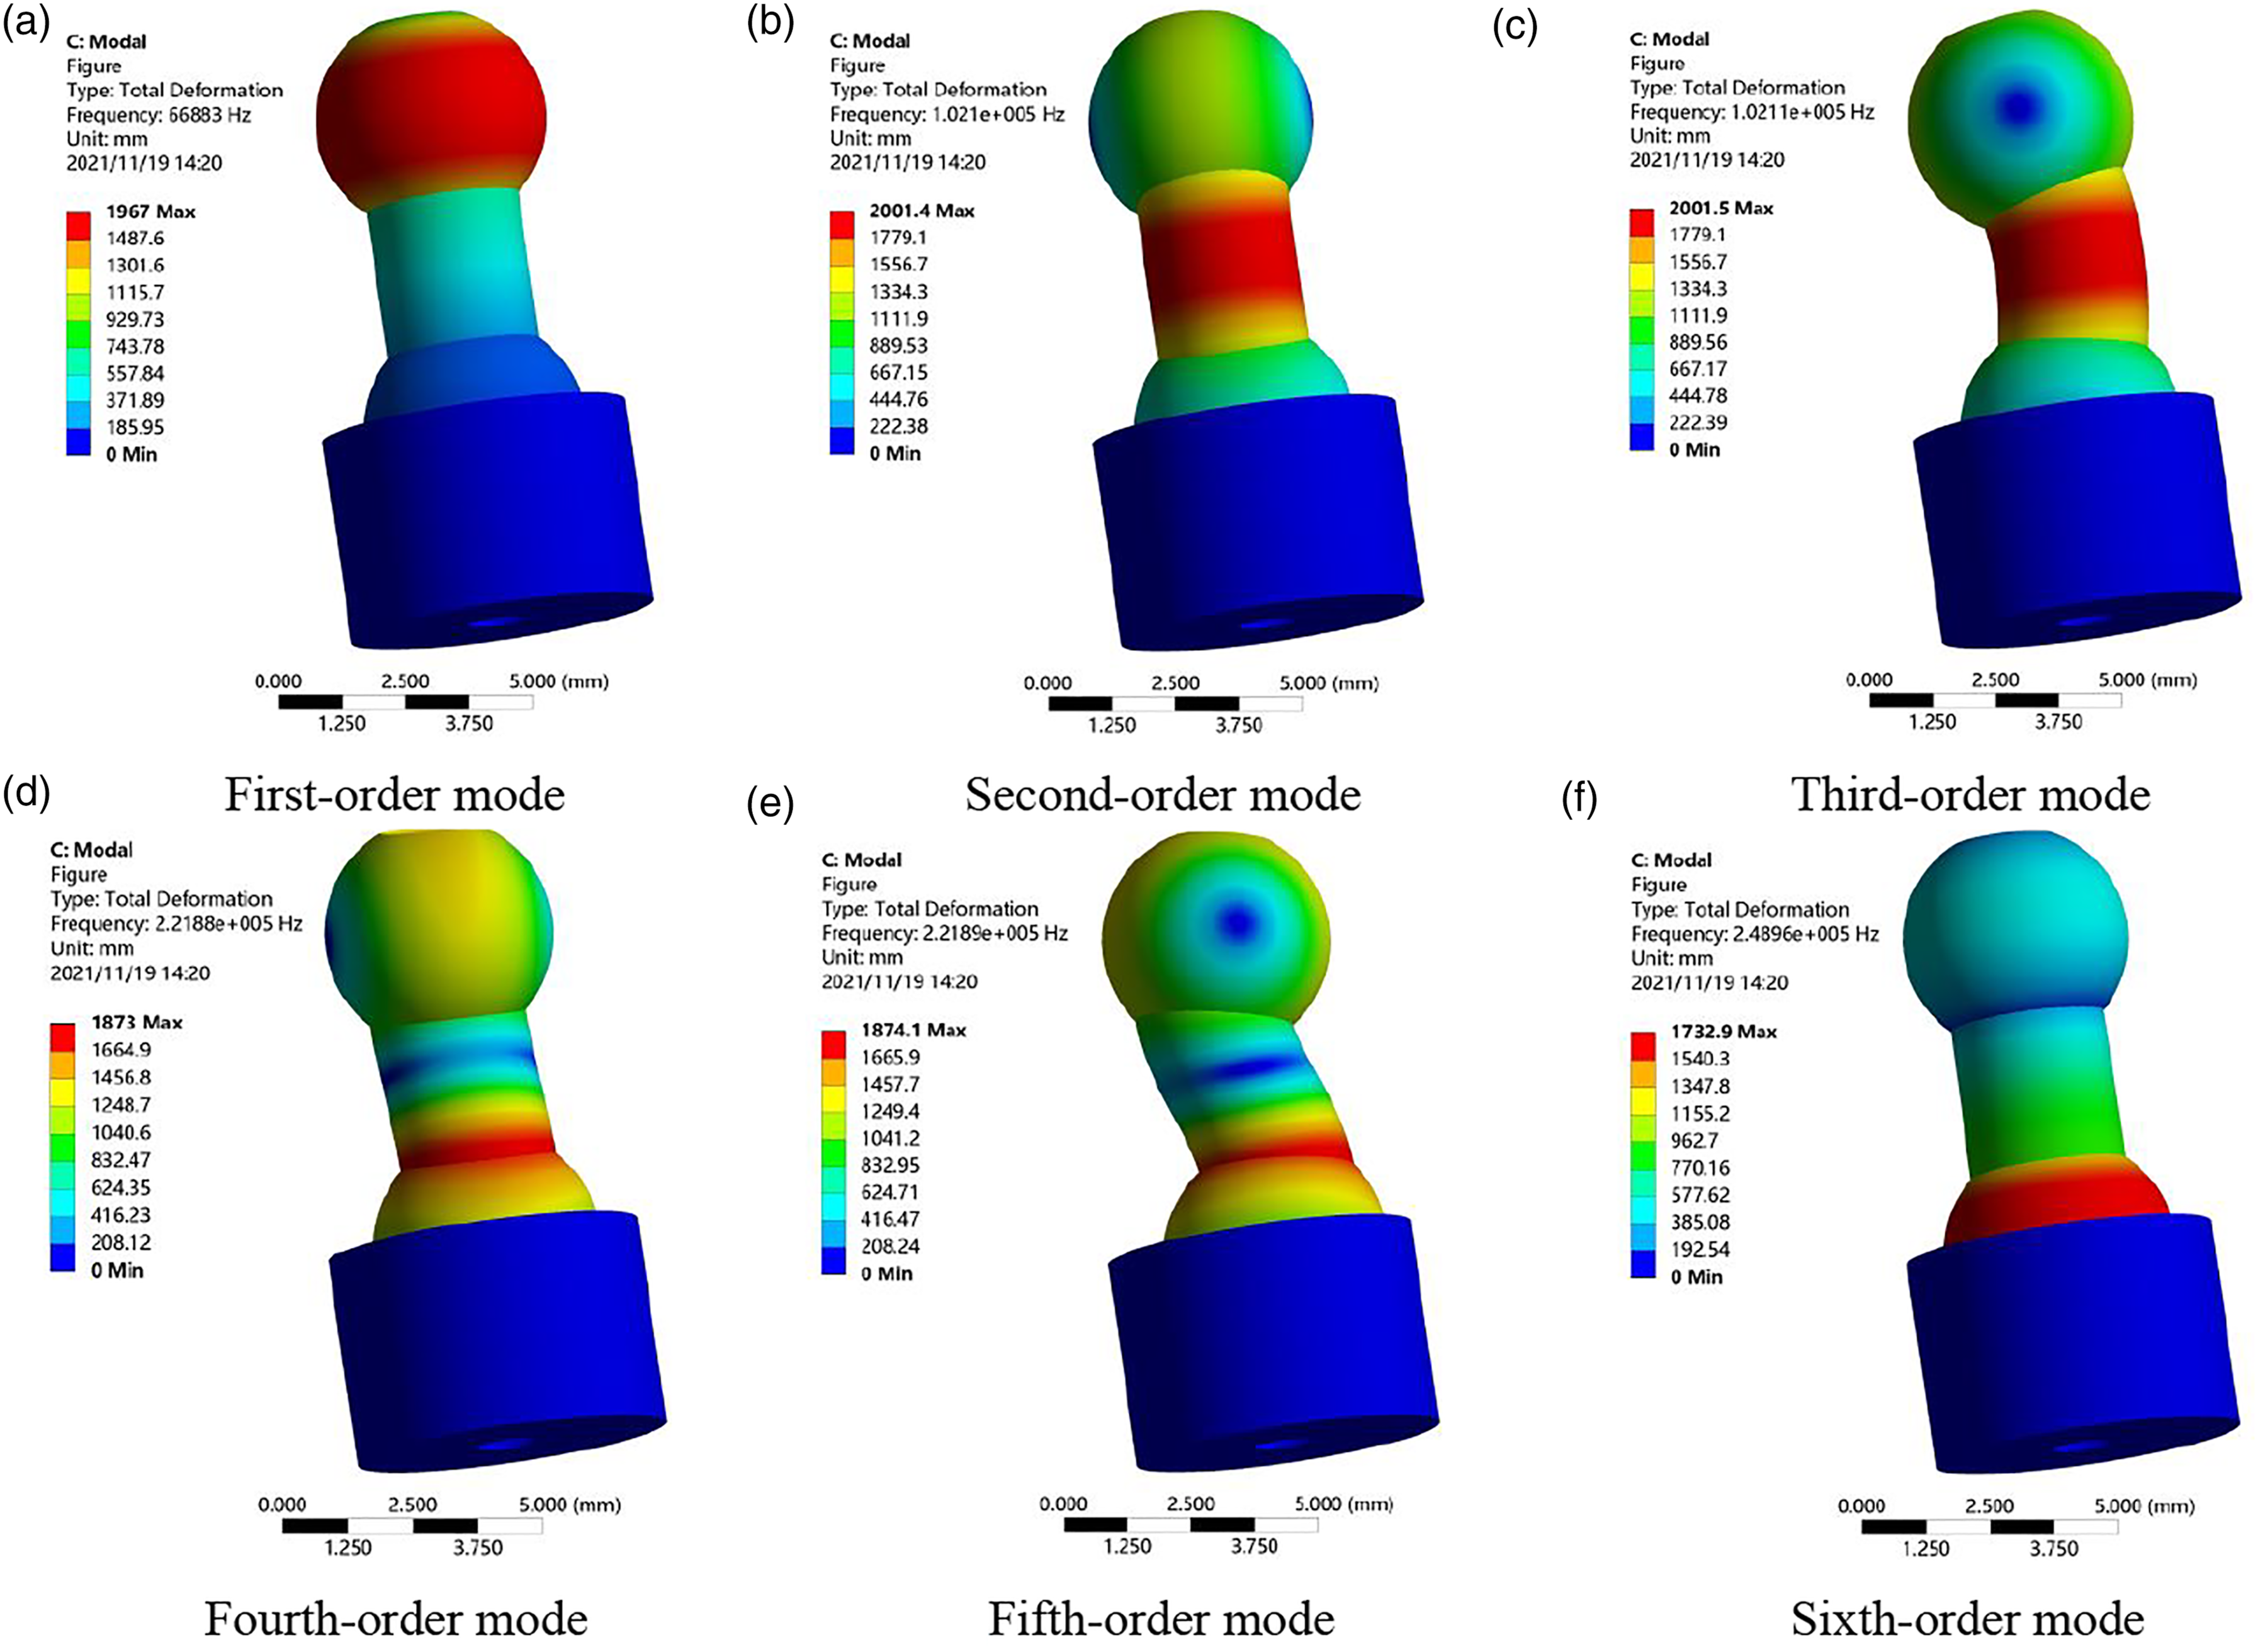
Figure 19 indicates that, the first-order mode natural frequency (66.9 kHz) of the valve system is bigger than the perceptible limit frequency of the human ear (20 kHz), so the frequency of the ringing noise is higher than the perceptible limit frequency of the human ear during the impact process. Therefore, the impact noise perceived by the human ear is the acceleration noise.
Conclusion
In this paper, the nonlinear mathematical model considering the magnetic saturation of the fast switching valve (FSV) is established and verified using experiments. On this basis, impact characteristics of the FSV have been studied using finite element simulation, such as impact velocity, impact displacement, stress, and wear.
The main conclusions are listed in the following: (1) Initial impact velocity and opening time of the FSV are analyzed using the analytical model under three types of driving voltages. The results show that it is not possible to achieve a balance between initial impact velocity and vibration of the FSV by changing the amplitude of the drive voltage. Conversely, only the driving voltage featured by an interval of negative voltage can meet the requirement. (2) Finite element simulation results under different initial impact velocities indicate that smaller initial impact velocity is beneficial to reduce the impact displacement, equivalent stress, and wear volume. Theoretical results indicate that, compared to the high driving voltage, the variation of flow area per million impacts is reduced by 27.3% under the driving voltage featured by an interval of negative voltage. (3) Experiments indicate that compared to the high driving voltage, when using the driving voltage featured by an interval of negative voltage, the average acceleration and the average noise of the FSV are reduced by 65.7% and 12%, respectively. (4) The spectrum analysis of the impact acceleration shows that the peak frequency (18 kHz) is smaller than the perceptible limit frequency of the human ear (20 kHz), while the first-order mode natural frequency (66.9 kHz) of the valve system is bigger than 20 kHz. The research results reveal the noise composition of the FSV, that is, the noise heard by the human ear is impacted noise. The research results also prove that the soft landing control of the FSV is the most effective way to reduce vibration and noise. (5) The issue focuses on the strict optimization of the timing parameters (the time when the negative voltage signal starts and stops) of the driving voltage featured by an interval of negative voltage in future research according to the requirement of the valve-controlled system.
Footnotes
Acknowledgments
This research thanks to experimental support from Nanjing University of Aeronautics and Astronautics.
Declaration of conflicting interests
The author(s) declared no potential conflicts of interest with respect to the research, authorship, and/or publication of this article.
Funding
The author(s) received no financial support for the research, authorship, and/or publication of this article.