
Abstract
Aiming at noise problem of two-stage gearbox, this paper uses the panel acoustic contribution analysis (PACA) and response surface methodology to conduct structural-borne acoustics analysis and multi-objective optimization of gearbox. Using this optimization, optimal layout and parameters of the added ribs can be determined. The dynamic model of a spur gear-shaft-bearing system is built in consideration of the time-varying mesh stiffness, the time-varying bearing stiffness, and the flexibility of the shaft, while dynamic load of the bearing is obtained through solving the model. The dynamic load of bearings is considered as excitation to analyze the vibration and noise radiation characteristics of housing. Furthermore, acoustic transfer vector, modal acoustic contribution and PACA are used to select the region with the most acoustic contribution. The variable ribs structure model (VRSM) is established in this region. Finally, the VRSM are adopted to optimize the housing. The optimization model based on the peak sound pressure level (PSPL) and the ribs mass (Rm) is established by using response surface method. Through multi-objective optimization, the variable in VRSM can be modified or deleted to reduce the radiated noise of the gearbox. The optimization results demonstrate that the PSPL after optimization is decreased by 4.88 dB at frequency of 3130 Hz. At the same mass, the noise reduction effect of VRSM is 12% higher than that of standard rib. Therefore, the optimization effect of the housing structure is obvious. PACA-VRSM-RSM- NSGA-II technology provides a new research scheme for reducing the vibration and noise of the gearbox.
Keywords
Introduction
Gear system was widely used in automotive, aerospace, and power generation industries due to its compact structure and high transmission efficiency. The vibration of gearbox is mostly caused by the meshing action of gear teeth, in which it passes through gears, axles and bearings, and finally transfers to housing, which causing forced vibration of housing and radiating noise into the surrounding environment. The finite element/boundary element method (FEM/BEM) is the prevailing method applied to the numerical analysis for the gearbox vibration and noise.1–3 Kubur et al. 4 proposed a dynamic model of a multi-shaft helical gear reduction unit formed by N flexible shafts, and studied the influence of bearing stiffness, shaft size, and other parameters on the vibration of the gearbox. Later, Wei et al. 5 established the coupled nonlinear dynamics model of a wind turbine planetary gear transmission system, and proposed a lightweight and reliability constrained optimization design method according to the sequential quadratic programming algorithm. Subsequently, Chang et al. 6 proposed a comprehensive coupled gearbox system dynamics model of a gear-shaft-bearing-shell system, which improved the accuracy of bearing response and thus more accurately estimated the radiation noise of the gearbox. In order to solve the noise problem generated by operating gearboxes, Han et al. 7 proposed a computational method for predicting gearbox noise from steady dynamic response to acoustic radiation calculation.
Based on the gear dynamics model, many scholars have provided different schemes to reduce the radiated noise of the gearbox. To reduce the periodic change of meshing stiffness, Dogruer et al. 8 proposed a nonlinear controller which adjusts the torque acting on the driving gear to minimize the adverse effect of time-varying mesh stiffness. And a spur gearbox was designed which does not emit much noise and vibration. Jolivet et al. 9 addressed the issue of the impact tooth flank finishing on noise and vibration. Ghosh et al. 10 used the genetic algorithm to optimize the geometrical shape of the gear, reducing the noise of the tractor gearbox. In addition, the surface ribbing of the shell is one of the main methods of noise reduction. Many of structures contain an important account of ribs. Moyne et al. 11 discussed the influence of adding ribs to an automobile gearbox shell on the radiation noise. The influence of ribs was theoretically discussed and three different physical effects were distinguished: the “vibrating,” the “obstacle,” and the “source” effects. Furthermore, panel acoustic contribution analysis (PACA) is an important method for optimizing the shell structure, which can determine the approximate position of the ribs plate distribution. Based on the dynamics model of a gear system, Zhou et al. 12 added ribs using the acoustic contributions of the surface of the gearbox, and designed two gear stiffness improvement schemes to reduce the radiated noise of the gearbox. Although PACA can identify the panel area of the greatest acoustic contribution, it cannot determine the exact location of the ribs in this area, nor the geometry of the added ribs, which requires further calculations. Wang et al. 13 proposed an optimal ribs layout design method to reduce radiation noise based on topology optimization and acoustic contribution analysis, verified the accuracy of the result by modal test and acoustic measurement. However, the results of topology optimization are complex, diverse and difficult to achieve. Compared to topology optimization, traditional structure optimization is often costly and inefficient. Artificial intelligence algorithms can significantly reduce calculation time and material cost. Wang et al. 14 proposed a multi-objective optimization design based on the response surface method and PACA, and pasted a damping layer on the panel surface to reduce radiation noise. Zhou et al. 15 adopted the free damping structure and new stiffener structure to optimize the rear end cover of a double planetary gear housing. The optimization model based on the vibration acceleration of the rear end cover surface was established by applying K-S function and response surface method.
However, there has been no serious attempt to determine the optimum layout and parameters of ribs. To address this, our investigation adds acoustic transfer vector (ATV) and modal acoustic contribution (MAC) to help identify the regions with the greatest acoustic contribution, enriching the screening process of the PACA method. Based on ATV-MAC-PACA, the variable ribs structure model (VRSM) as design variables in which utilized ribs width, thickness, number, and direction is proposed. Through multi-objective optimization, the variable in VRSM can be modified or deleted to reduce the radiated noise of the housing. PACA-VRSM-RSM- NSGA-II technology provides a new research scheme for the layout of gearbox ribs.
Design methods and processes
This section analyzes the vibration and noise calculation method of a two-stage gearbox system. And the PACA-VRSM-RSM-NSGA-II method for the gearbox structure optimization is as shown in Figure 1. The entire analysis process is composed of five components, namely the (a) gearbox dynamic excitation calculation, (b) gearbox dynamic response analysis, (c) gearbox radiated noise calculation, (d) determine ribs addition area and VRSM, and (e) Multi-objective optimization. Multi-objective optimization calculation process of ribs layout of the two-stage gearbox.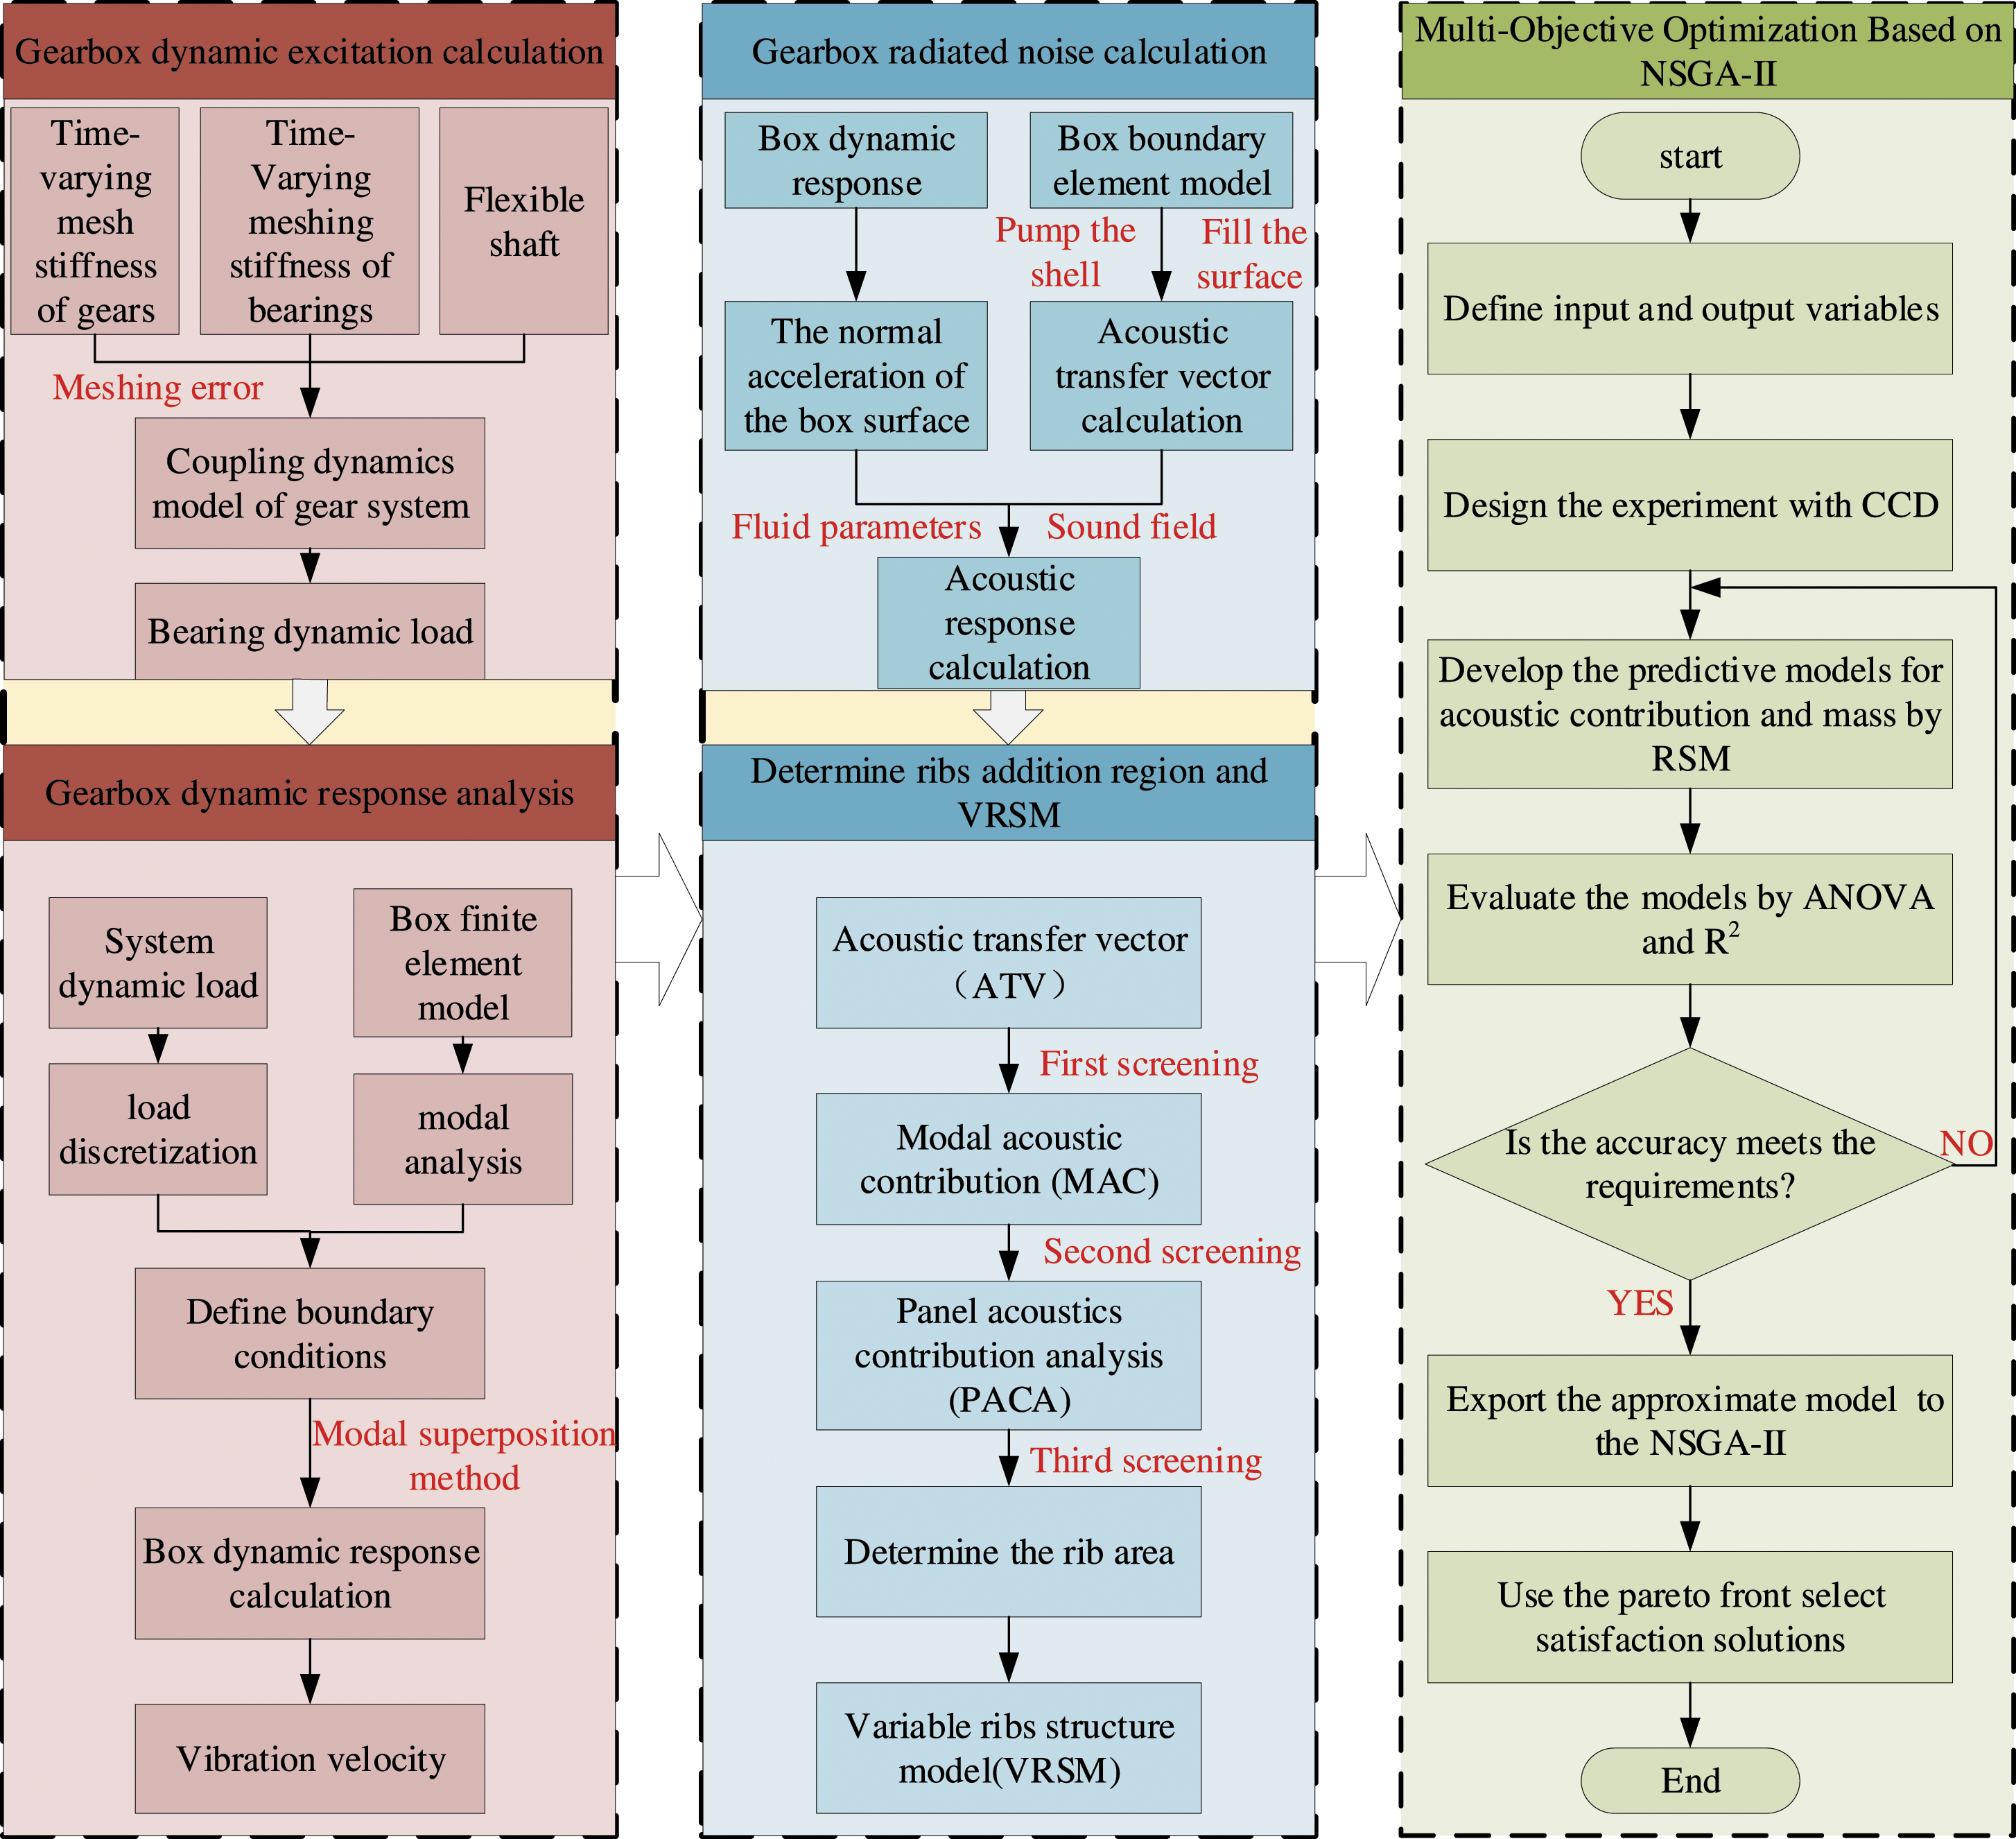
(a) Gearbox dynamic excitation calculation. Analytical model is established by using lumped mass method. In the model, the influence of the TVMS, TVBS, and shaft flexibility is considered. The dynamic load of the bearings is calculated by the Newmark integral method. 16
(b) Gearbox dynamic response analysis. Modal analysis of the shell finite element model with boundary conditions is carried out. The dynamic load of the system is then added to the corresponding position of the shell finite element model. The modal superposition method is used to solve the dynamic response of the gearbox structure, and the vibration response and surface acceleration of the housing are also obtained.
(c) Gearbox radiated noise calculation. The surface element of the finite element model is extracted, and the shell element is used to fill the holes on the surface of the structure. Finally, the gearbox boundary element model is obtained by remeshing the surface elements of gearbox. And the obtained boundary element model and ATV are used to solve the radiated noise of the gearbox.
(d) Determine ribs addition region and VRSM. Three screening methods, ATV, MAC, and PACA, were used to determine the region with the greatest acoustic contribution. And the variable ribs model is added in this region.
(e) Multi-objective optimization. Eleven structural parameters of the VRSM are used as input variables. PSPL and Rm are used as output variables. Response surface models of PSPL and Rm are then constructed by central composite design (CCD), and R2 is used to test the accuracy of the model. When the model accuracy meets the requirements, the obtained response surface objective function obtained is exported to NSGA-II, and the optimal ideal point is determined by analyzing the Pareto solution set. Finally, an experimental comparison is conducted to obtain the ideal VRSM.
Gearbox dynamic excitation calculation
The object of analysis in this paper is a two-stage gear reducer, whose model is as shown in Figure 2, which is a two-stage straight toothed cylinder gear reducer, and the minor chamfering and feature in structure is simplified in the model. (a) 3D model of two-stage gearbox, (b) Internal structure of the gearbox.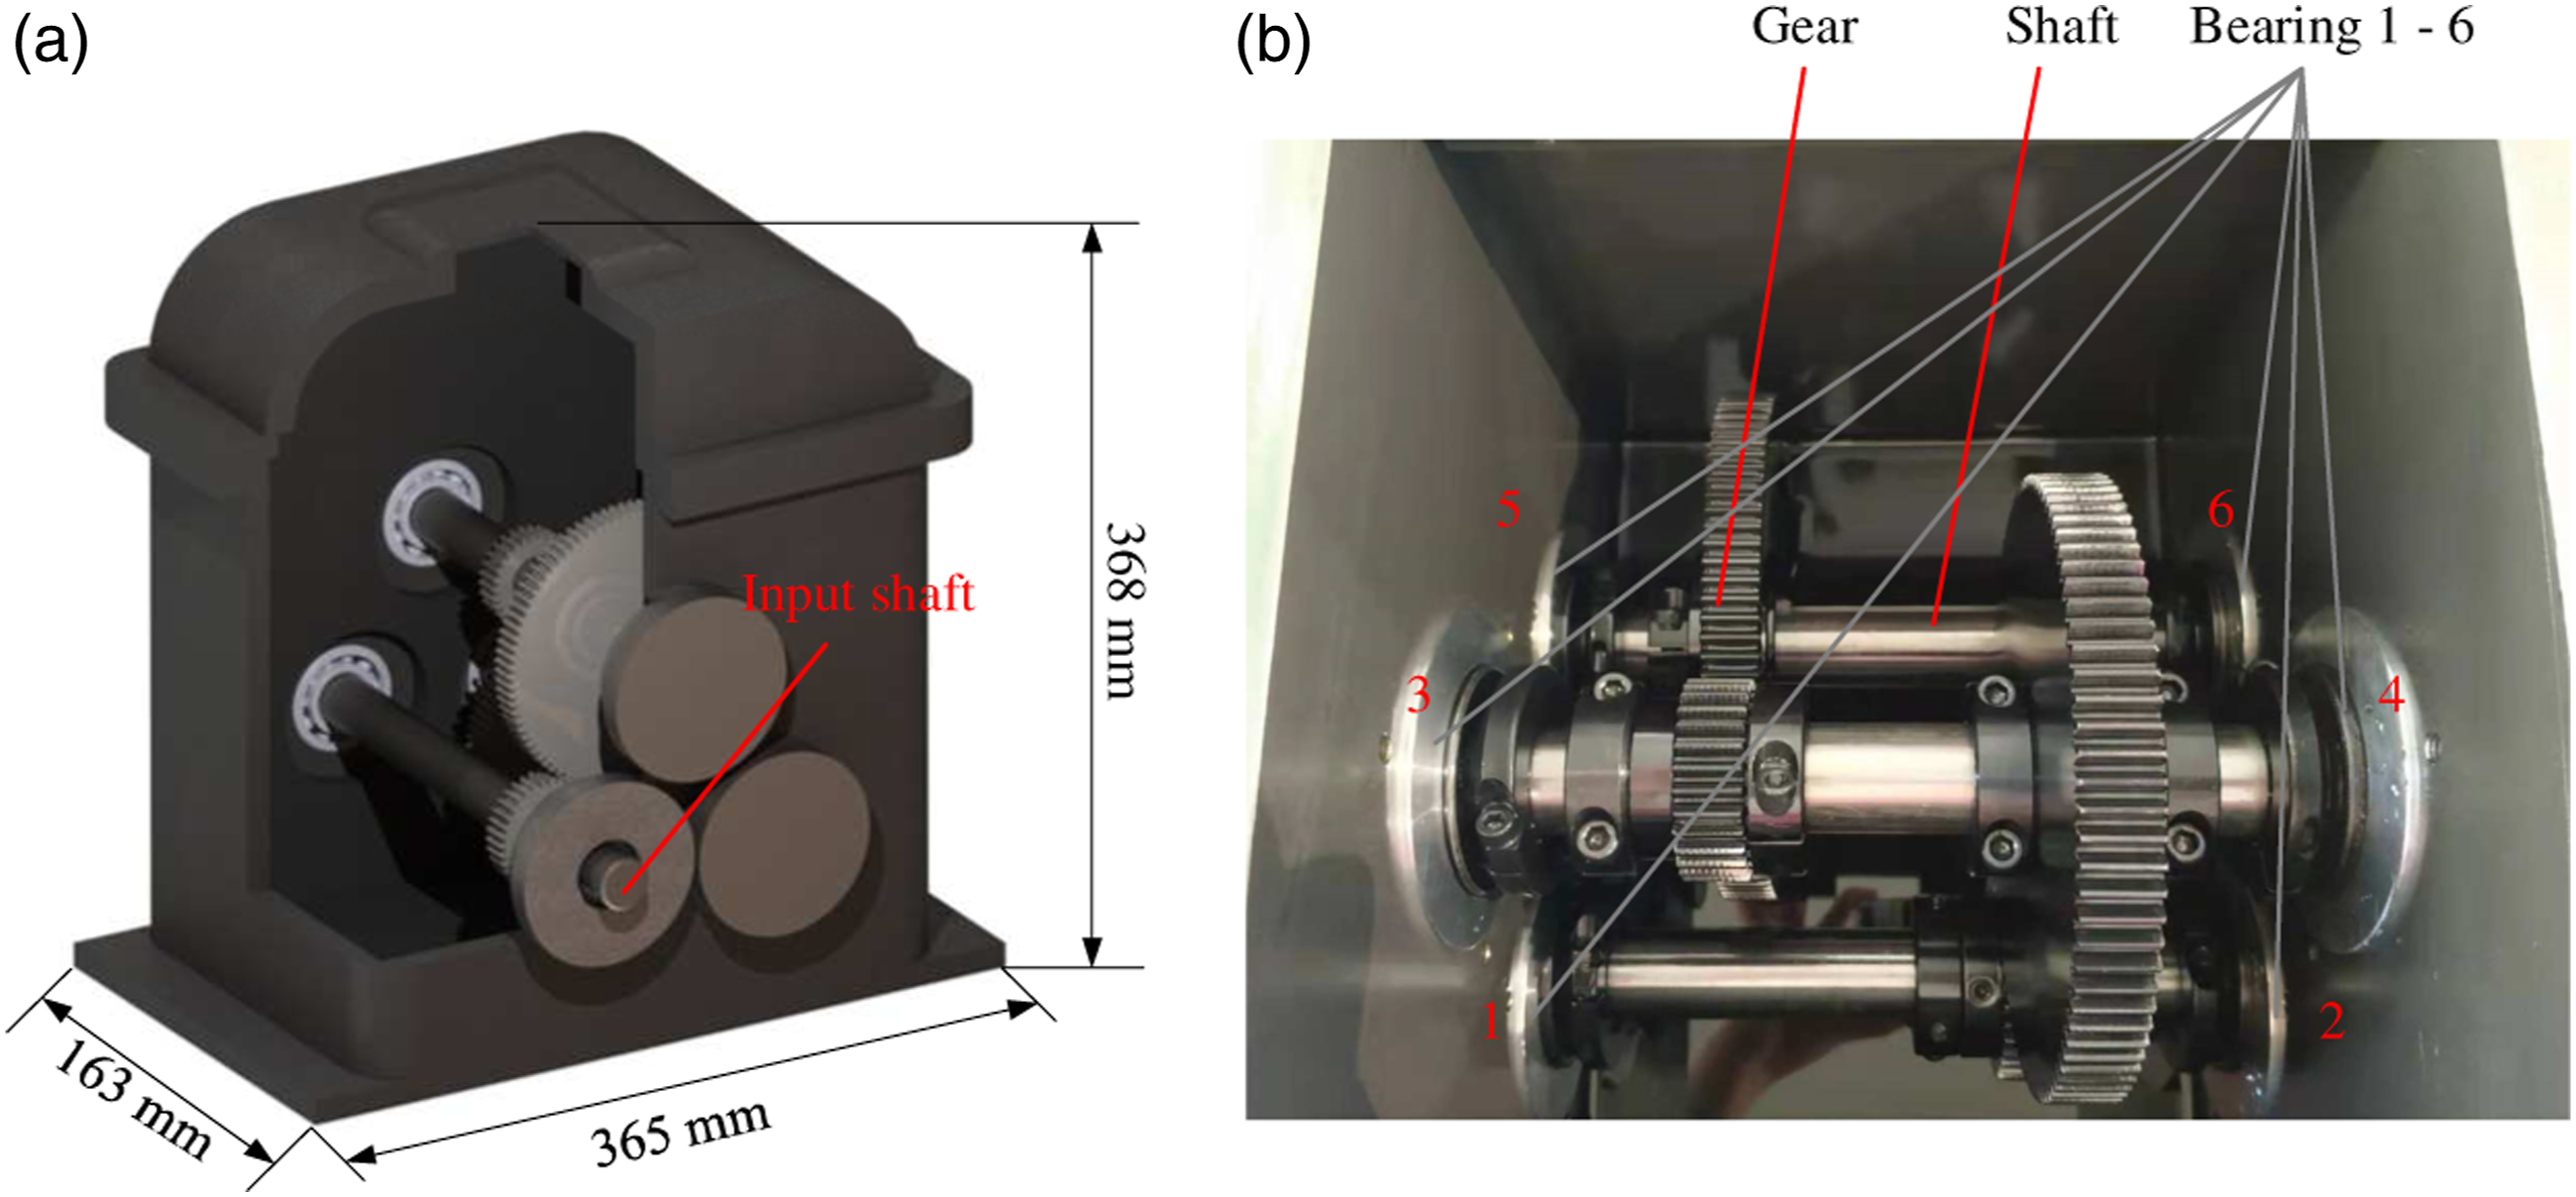
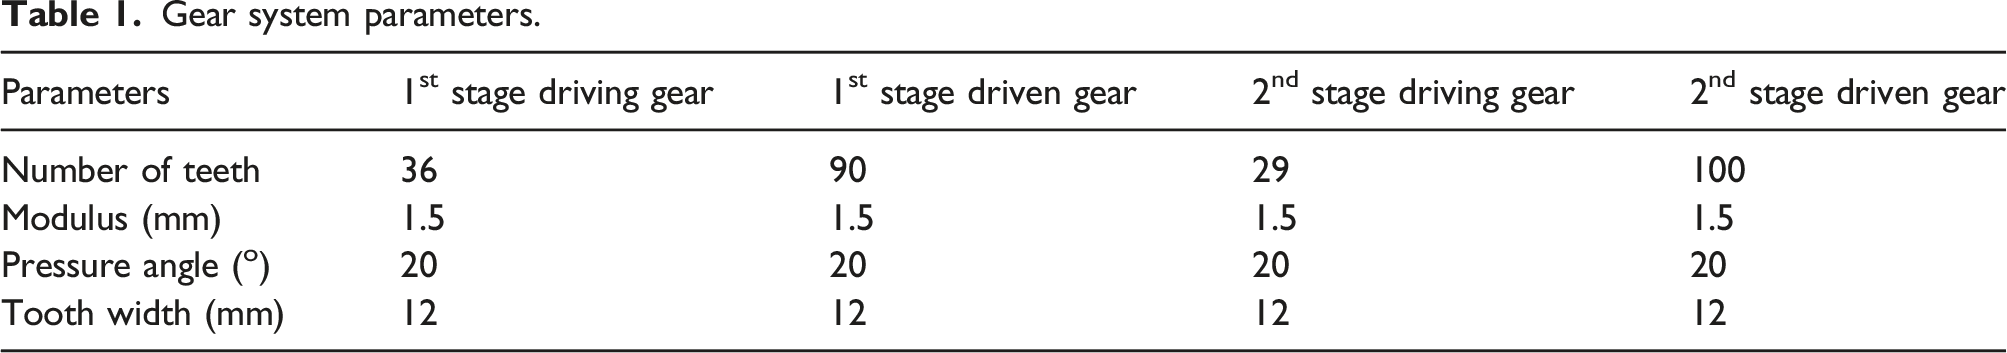
Gear system parameters.
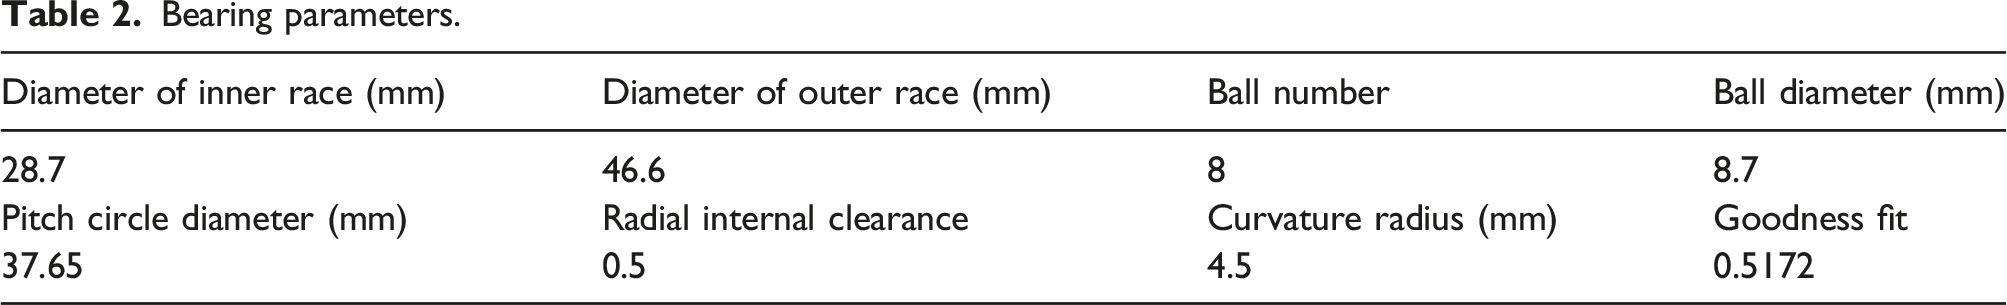
Bearing parameters.
Gear transmission system dynamic model
The spur gear transmission system model has six degrees of freedom (DOF), namely rotation DOF of driving and driven wheels, the translation DOF along x and y directions (see Figure 3). Then the relative total displacement of meshing elements of spur gear pair δ is defined as Dynamics model of gearbox transmission system.
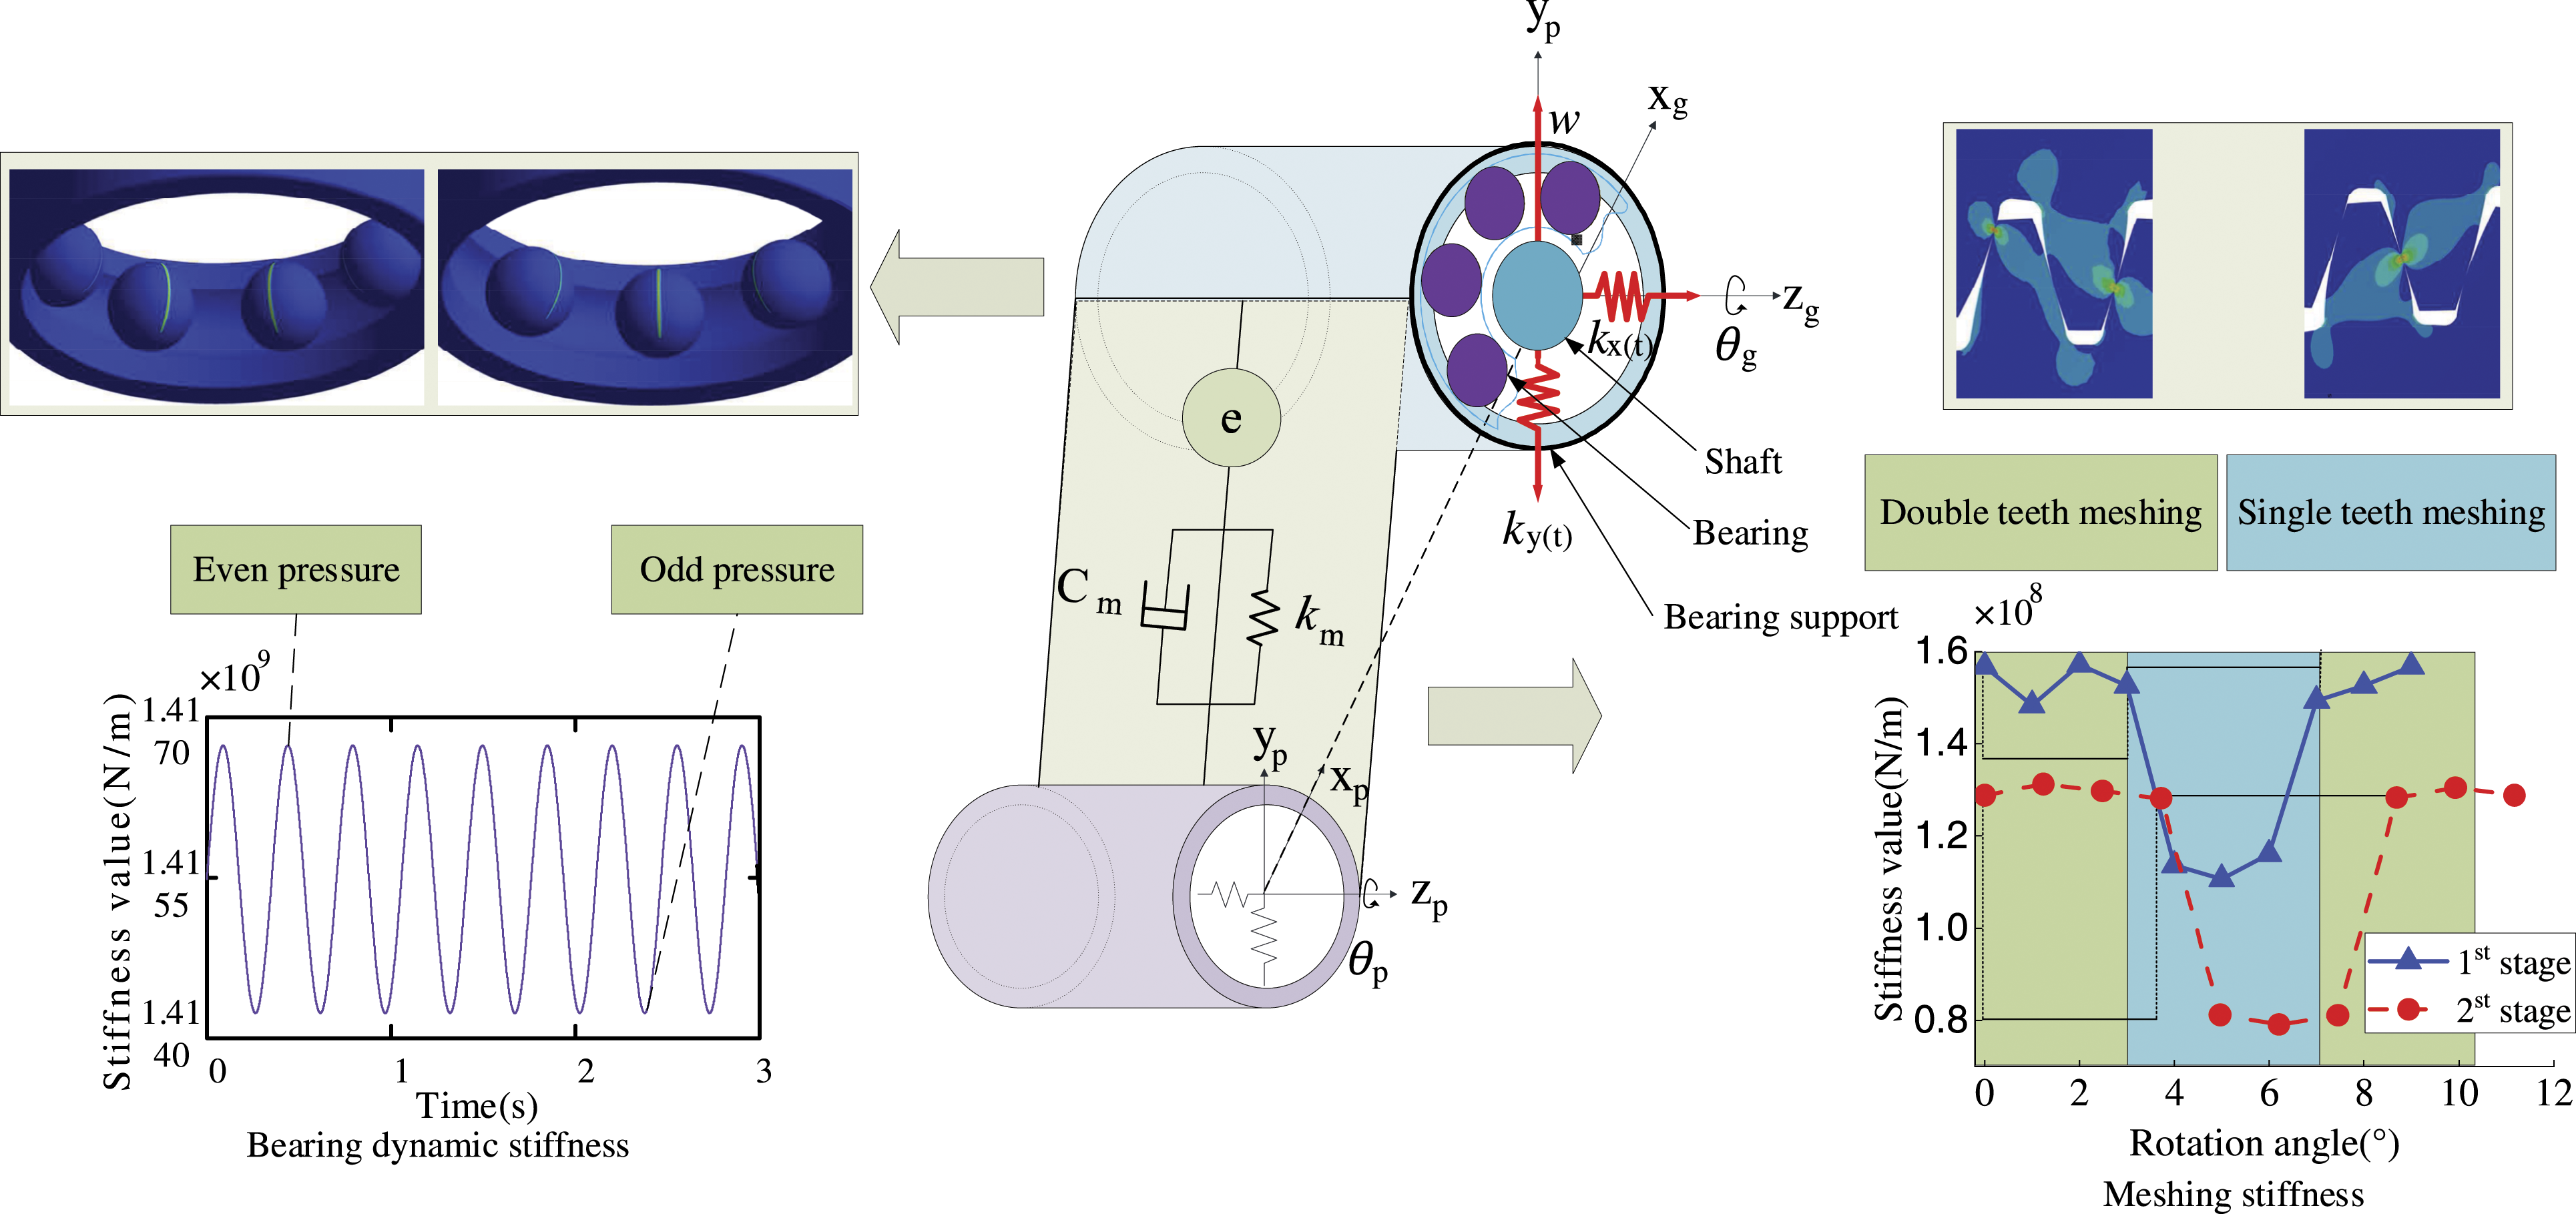
Considering the influence of time-varying meshing stiffness and the gear meshing error, the motion differential equation of the meshing element of the spur gear can be expressed as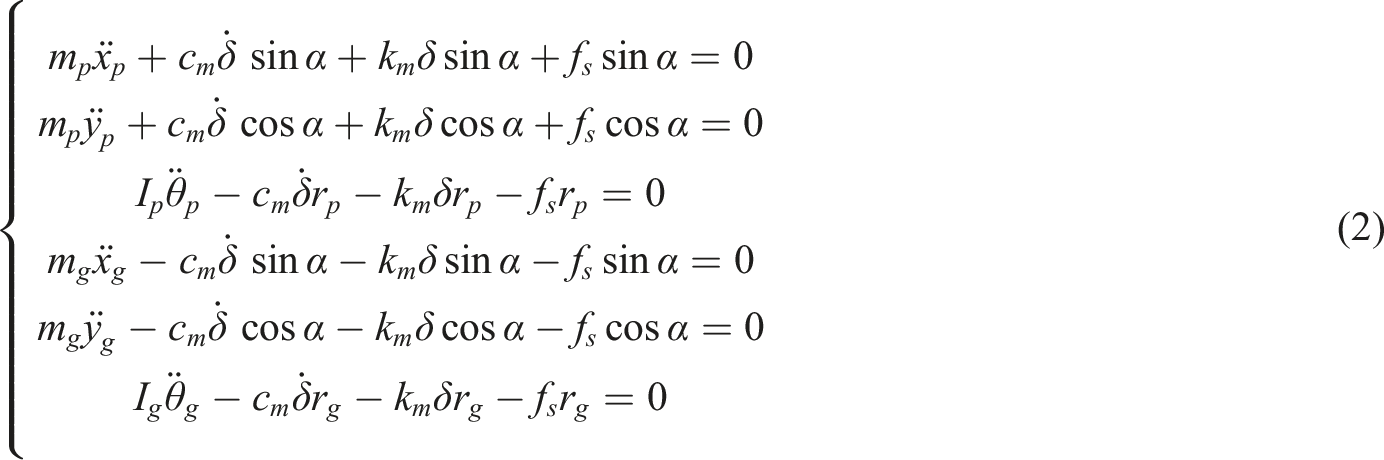
During the operation of the gear transmission system, the bearing supports the shaft system and transmits vibration from the gears to the housing.
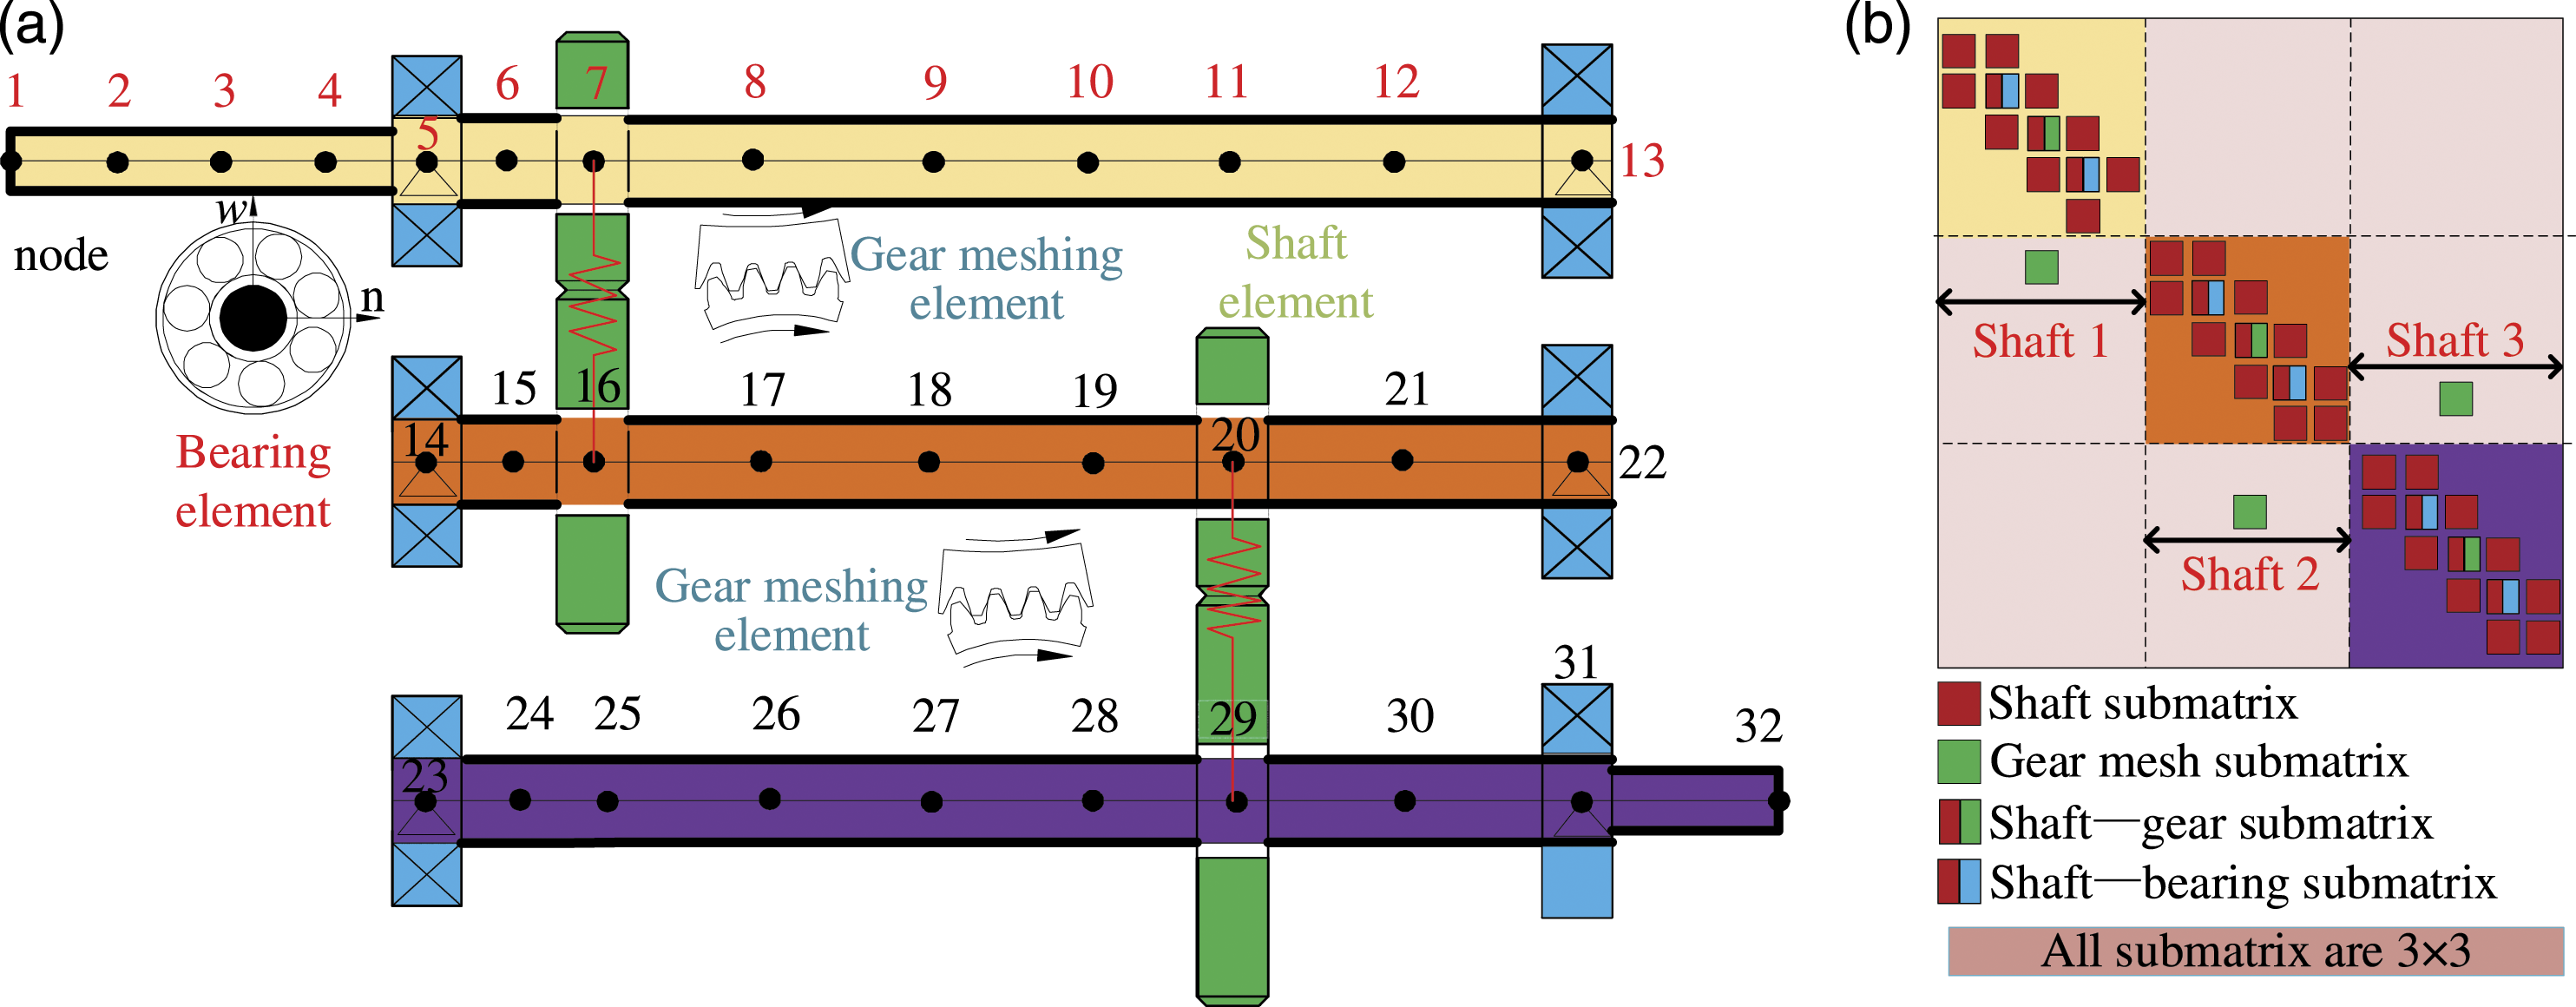
18
The bearing stiffness matrix can be expressed as Solution of overall stiffness of gearbox. (a) Finite element model of gearbox, (b) Overall stiffness matrix of gearbox.

The dynamics equation of the gear system can be expressed as
Bearing dynamic load
The input speed is 5400 r/min, and the output torque is 100 Nm. The time domain and frequency domain diagrams of dynamic loads of each bearing are obtained by Newmark integral method, as shown in Figure 5. where different colors represent different bearings. f
m1
(3240 Hz) and f
m2
(1044 Hz) represent the meshing frequency of the first gear pair and the second gear pair, respectively. The bearing dynamic load of the gear system. (a) Time response of loads from bearing 1 to bearing 6, (b) Spectrum of loads from bearing 1 to bearing 6.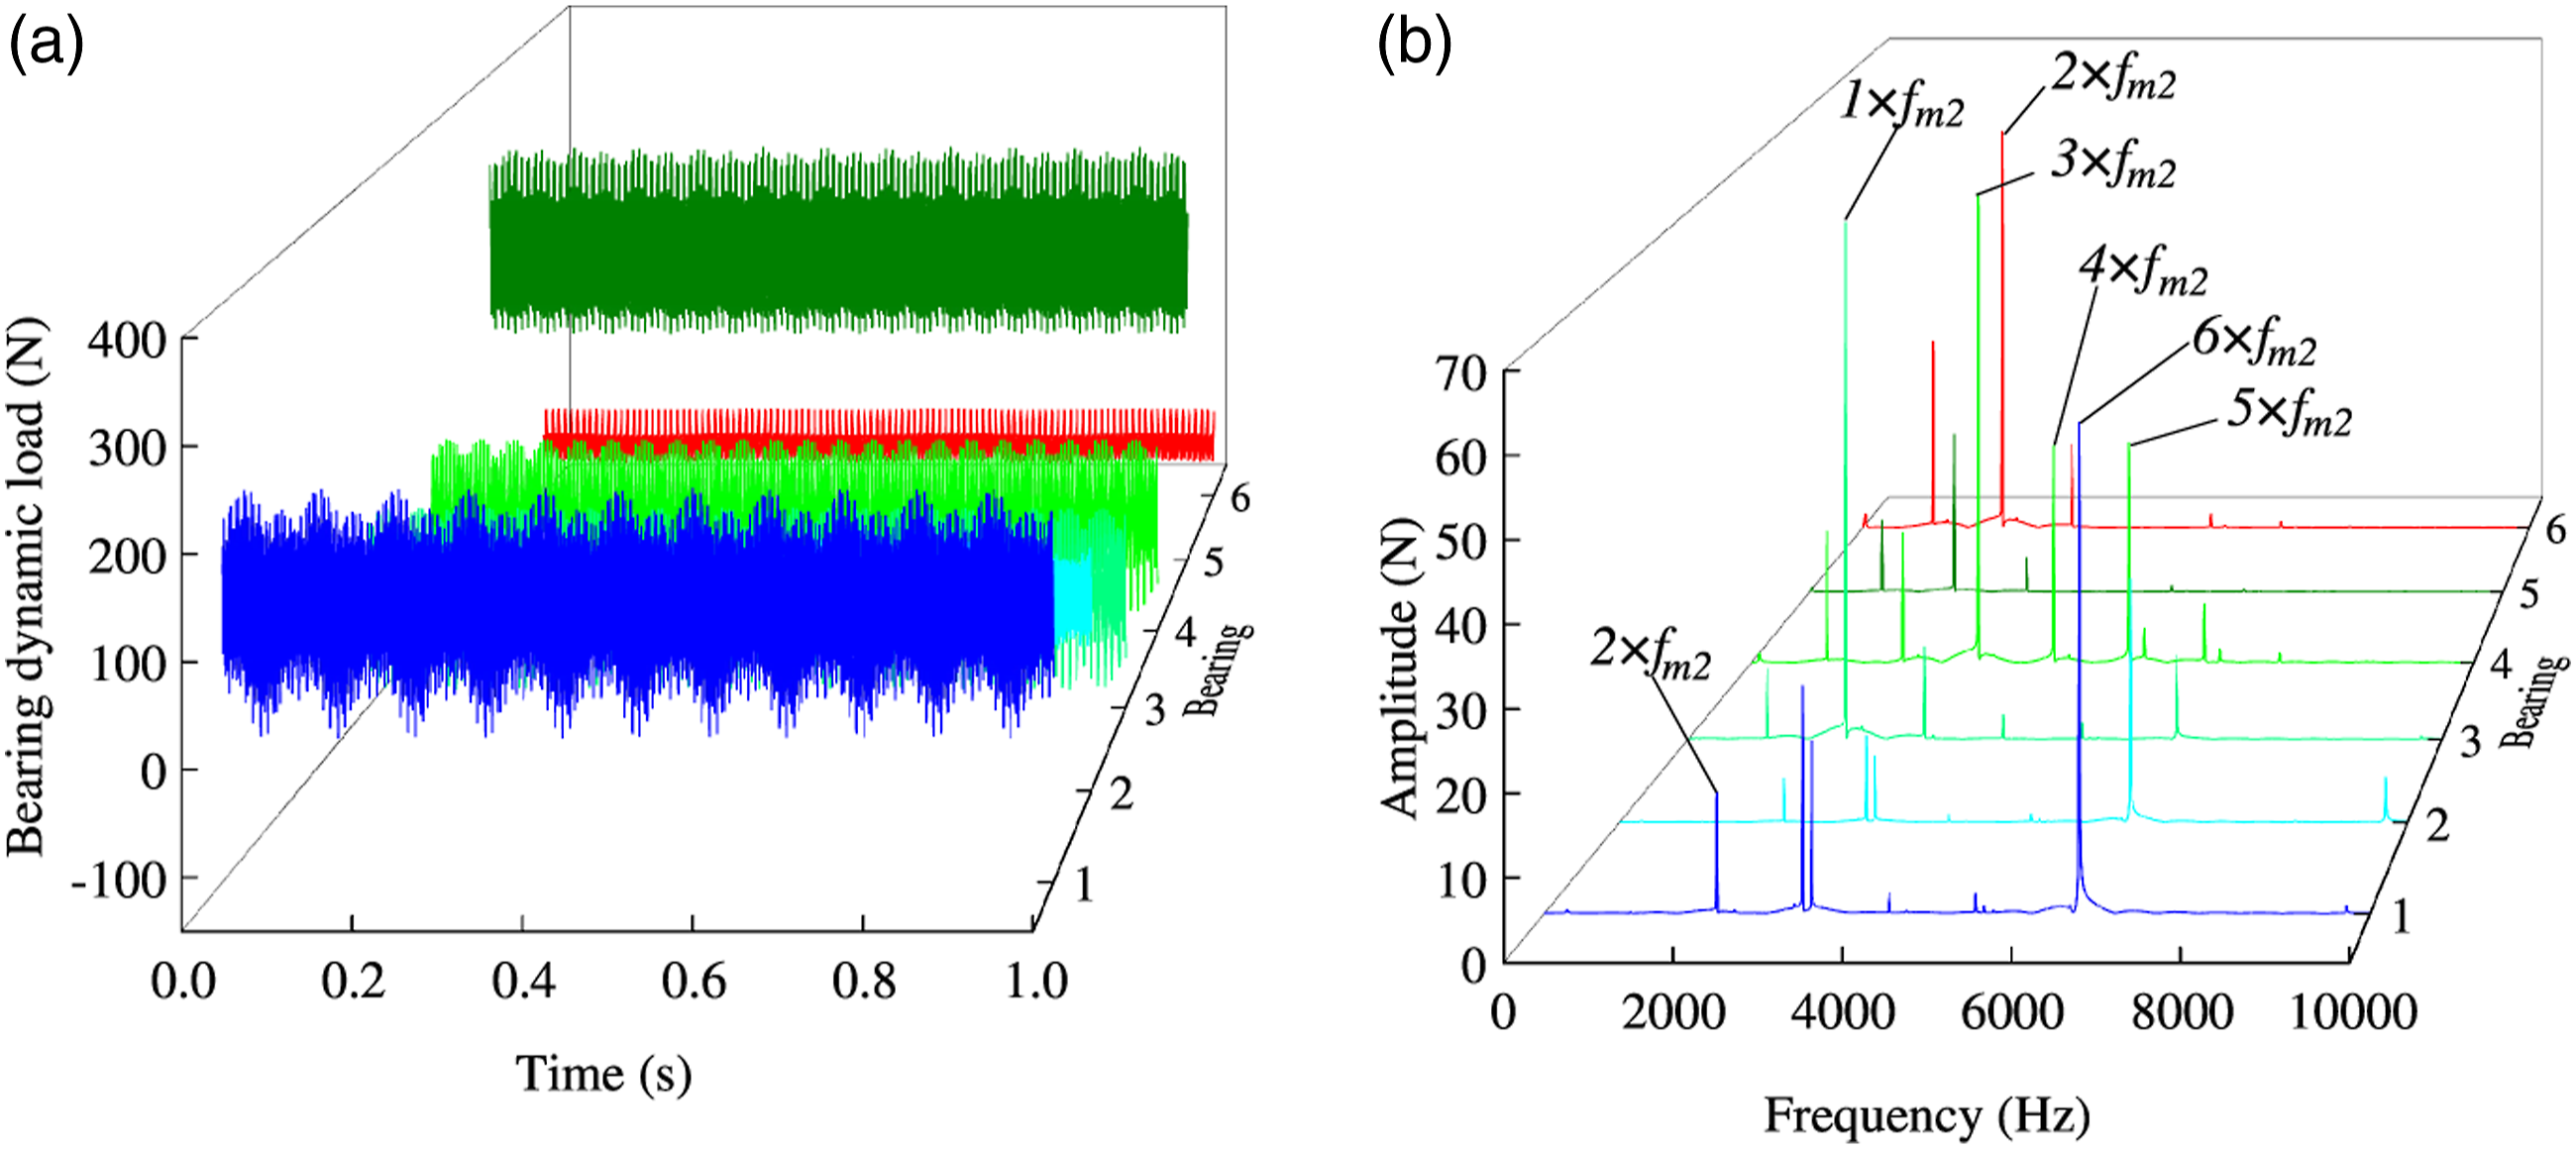
Experimental verification
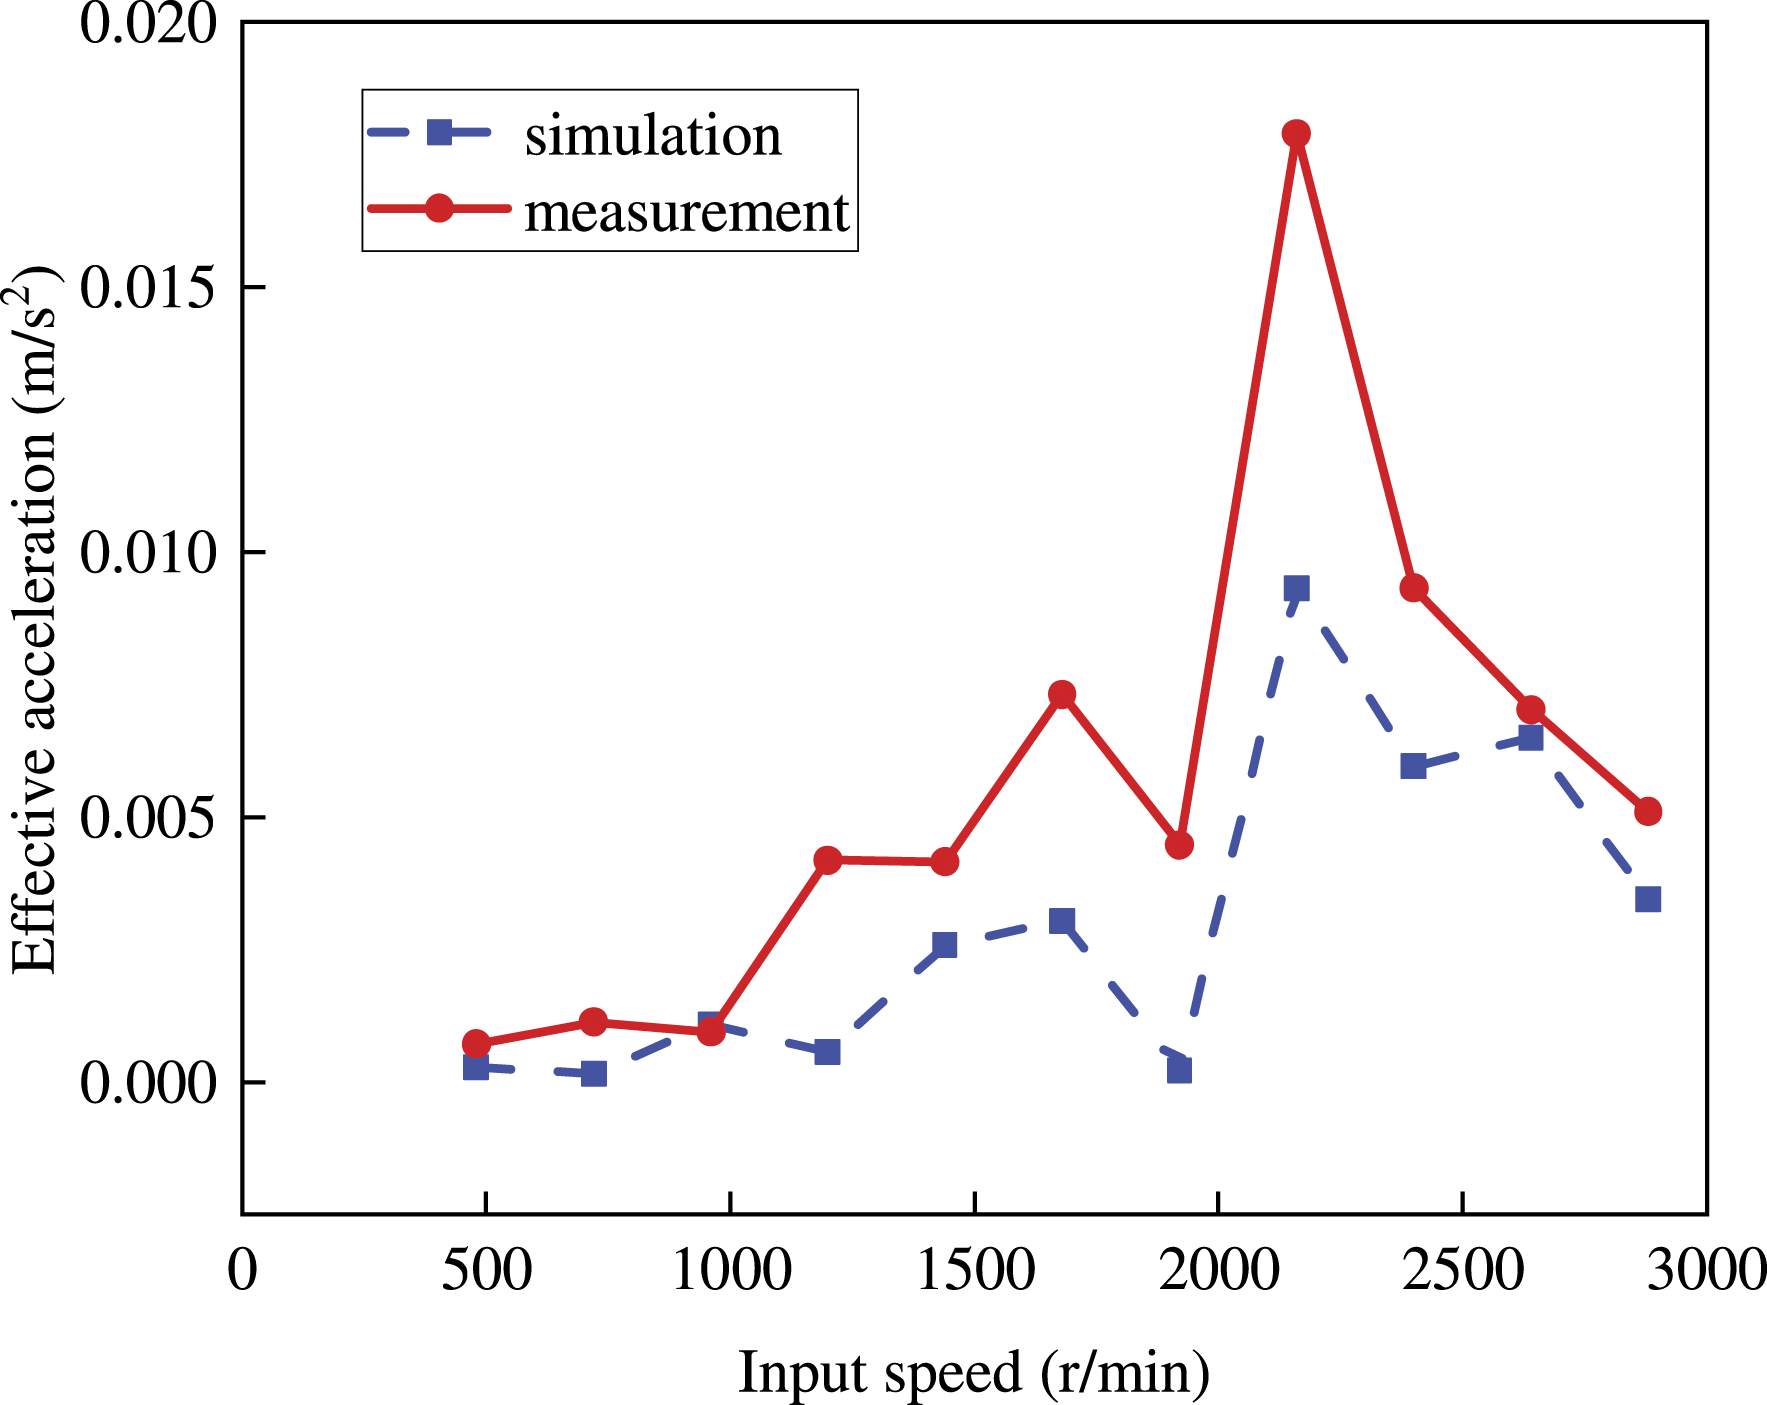
The platform used in this experiment is the SQI Wind turbine transmission system test bench (shown in Figure 6(a)). The main devices include the test bed, drive motor, controller, gearbox, and data collector, which can be used to study the dynamic analysis of the gear transmission in this paper. The driving motor is used to adjust the speed automatically, increasing 240 rpm each time, and the acceleration value after each speed change is recorded by the acceleration sensor (shown in Figure 6(b)). The experimental results are compared with the simulation results (see Figure 7). It can be seen that the simulation results are very close to the trend of the experiment, indicating that the simulation results can replace the experiment. Transmission system test bench. (a) System equipment, (b) Sensor measurement position. Comparison between simulation and experiment.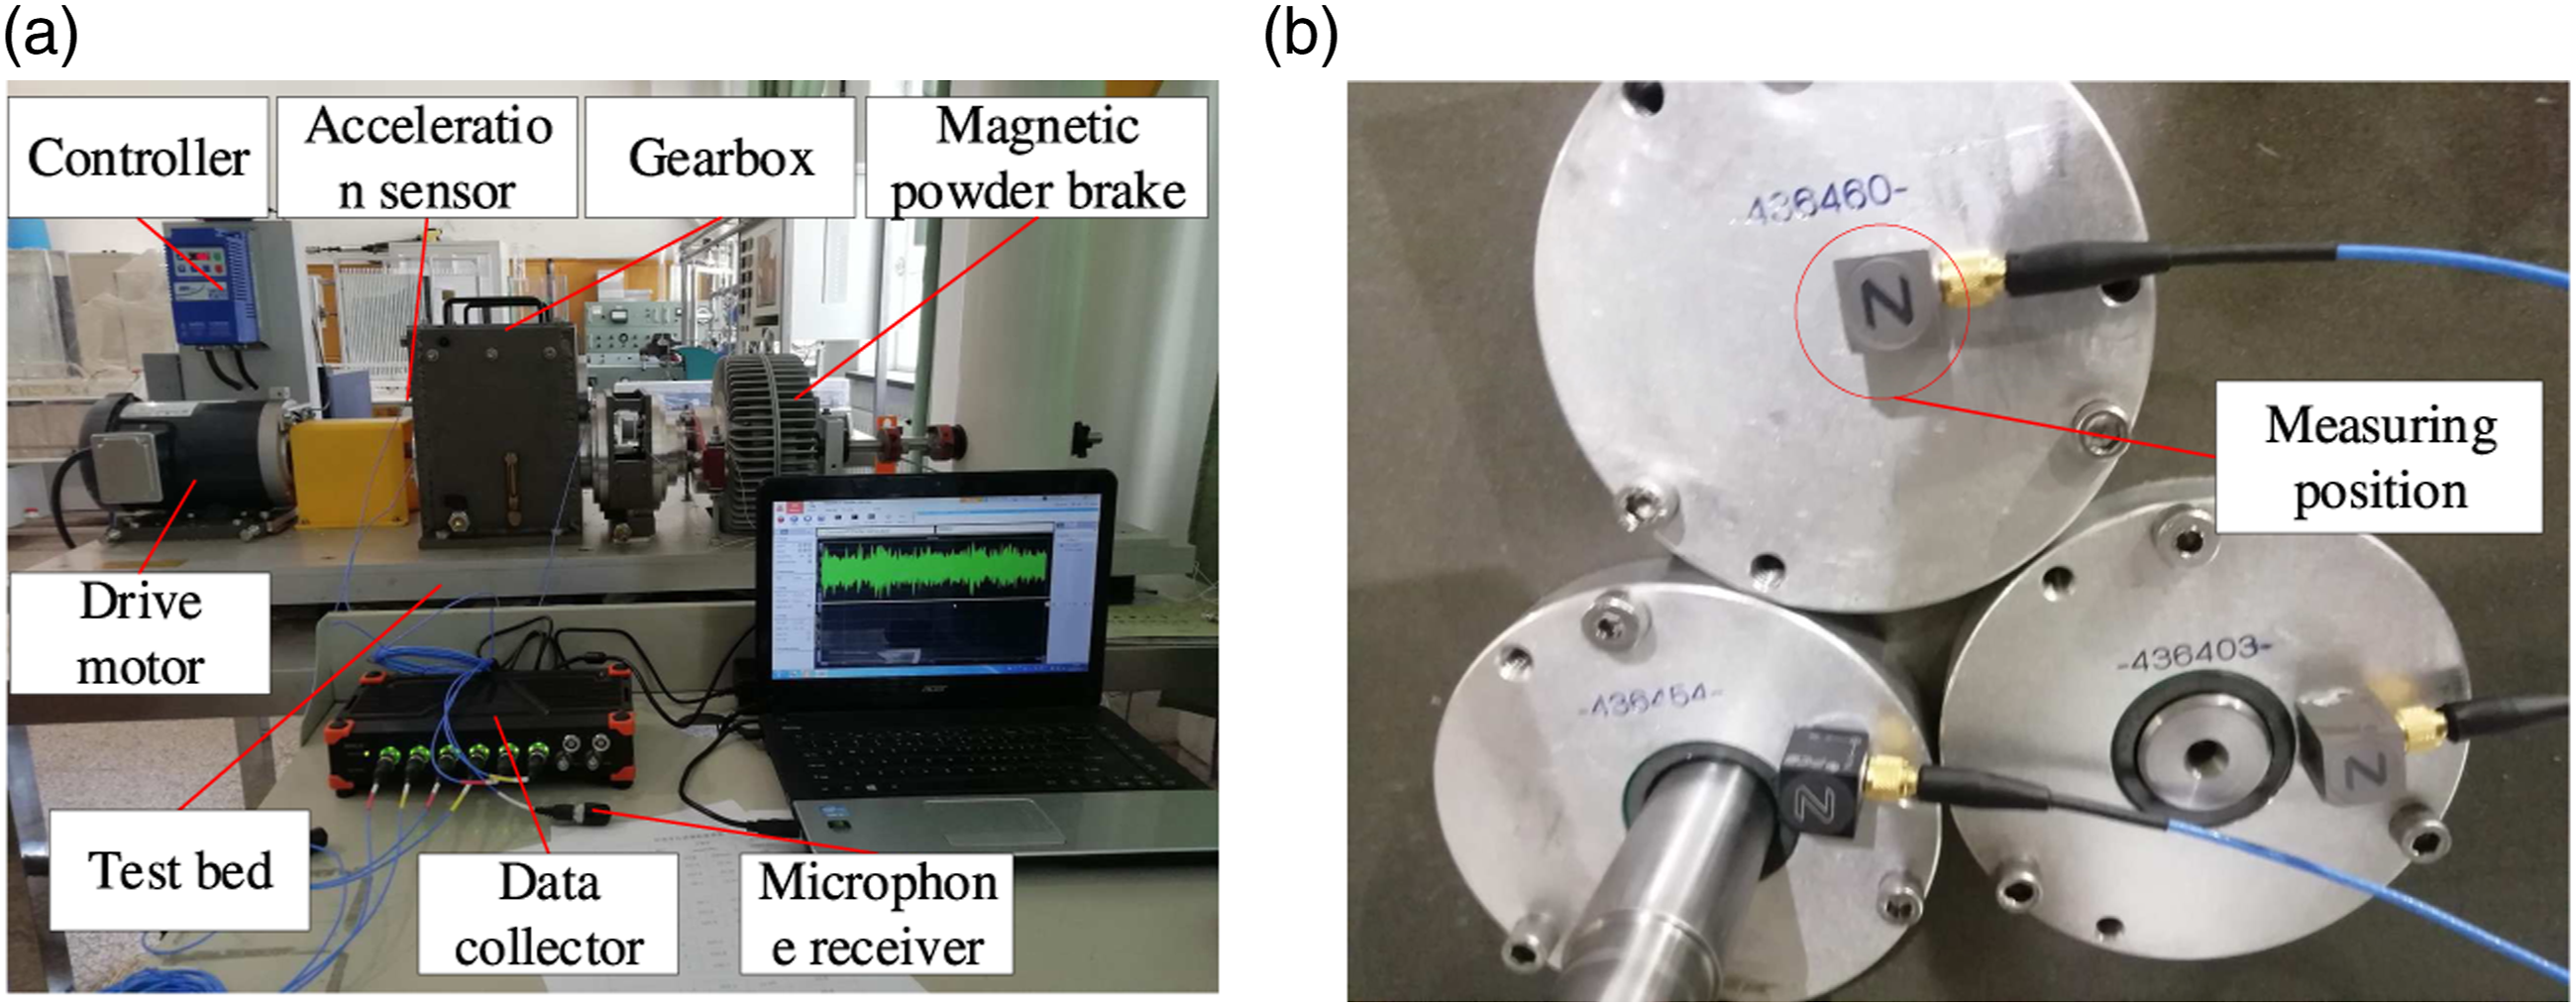
Gearbox dynamic response analysis
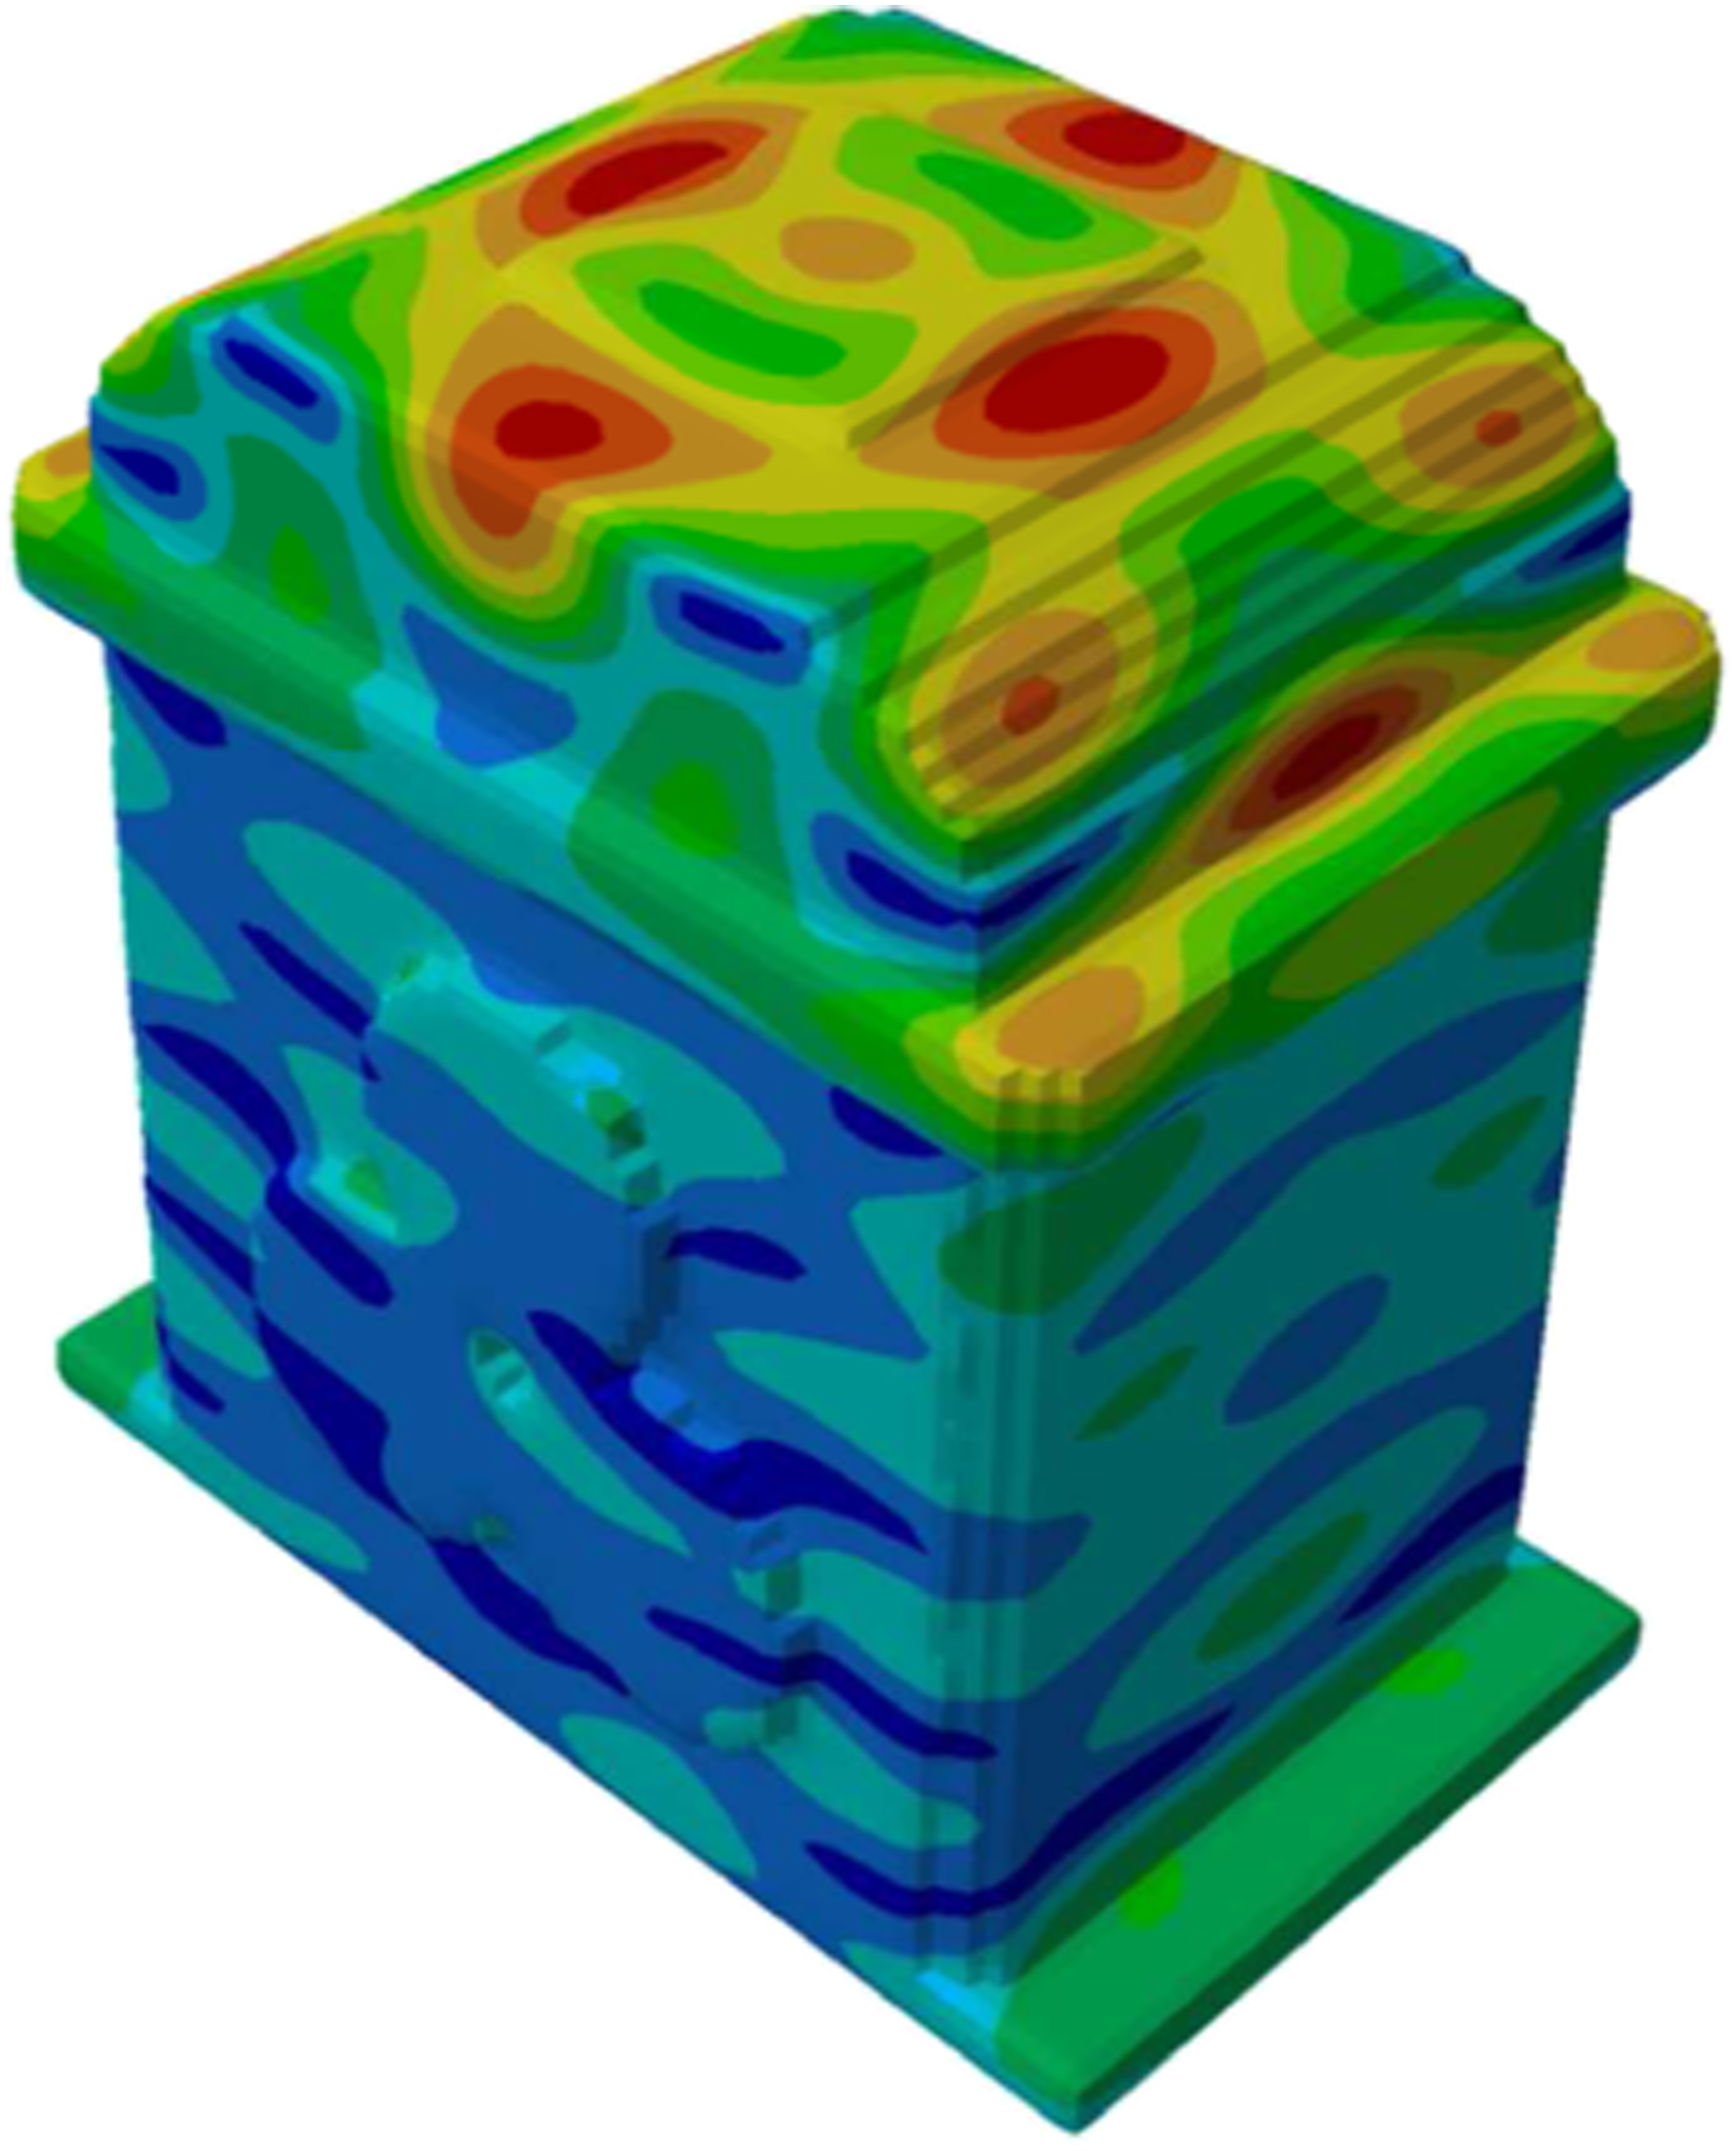
Figure 8 is the finite element model of the gearbox. The material of the plate and ribs are both steels having Young’s modulus E = 2.07 × 10¹¹ Pa, Poisson’s ratio μ = 0.3, and mass density ρ = 7800 kg/m3. In order to apply dynamic load to the gearbox, a mass node is created in the center of the bearing hole and the node is coupled with the node on the inside surface of the bearing hole. Then the dynamic load is applied on the central node. A displacement constraint is applied at the bottom of the gearbox. The finite element model of housing and the first eight natural vibration modes of the gearbox are shown in Figure 8. When the bottom of the gearbox is restrained, the vibration of the lower part of the gearbox is weak, while the vibration amplitude of the top part is obvious. Finite element model of housing, (b) Mode of vibration of gearbox.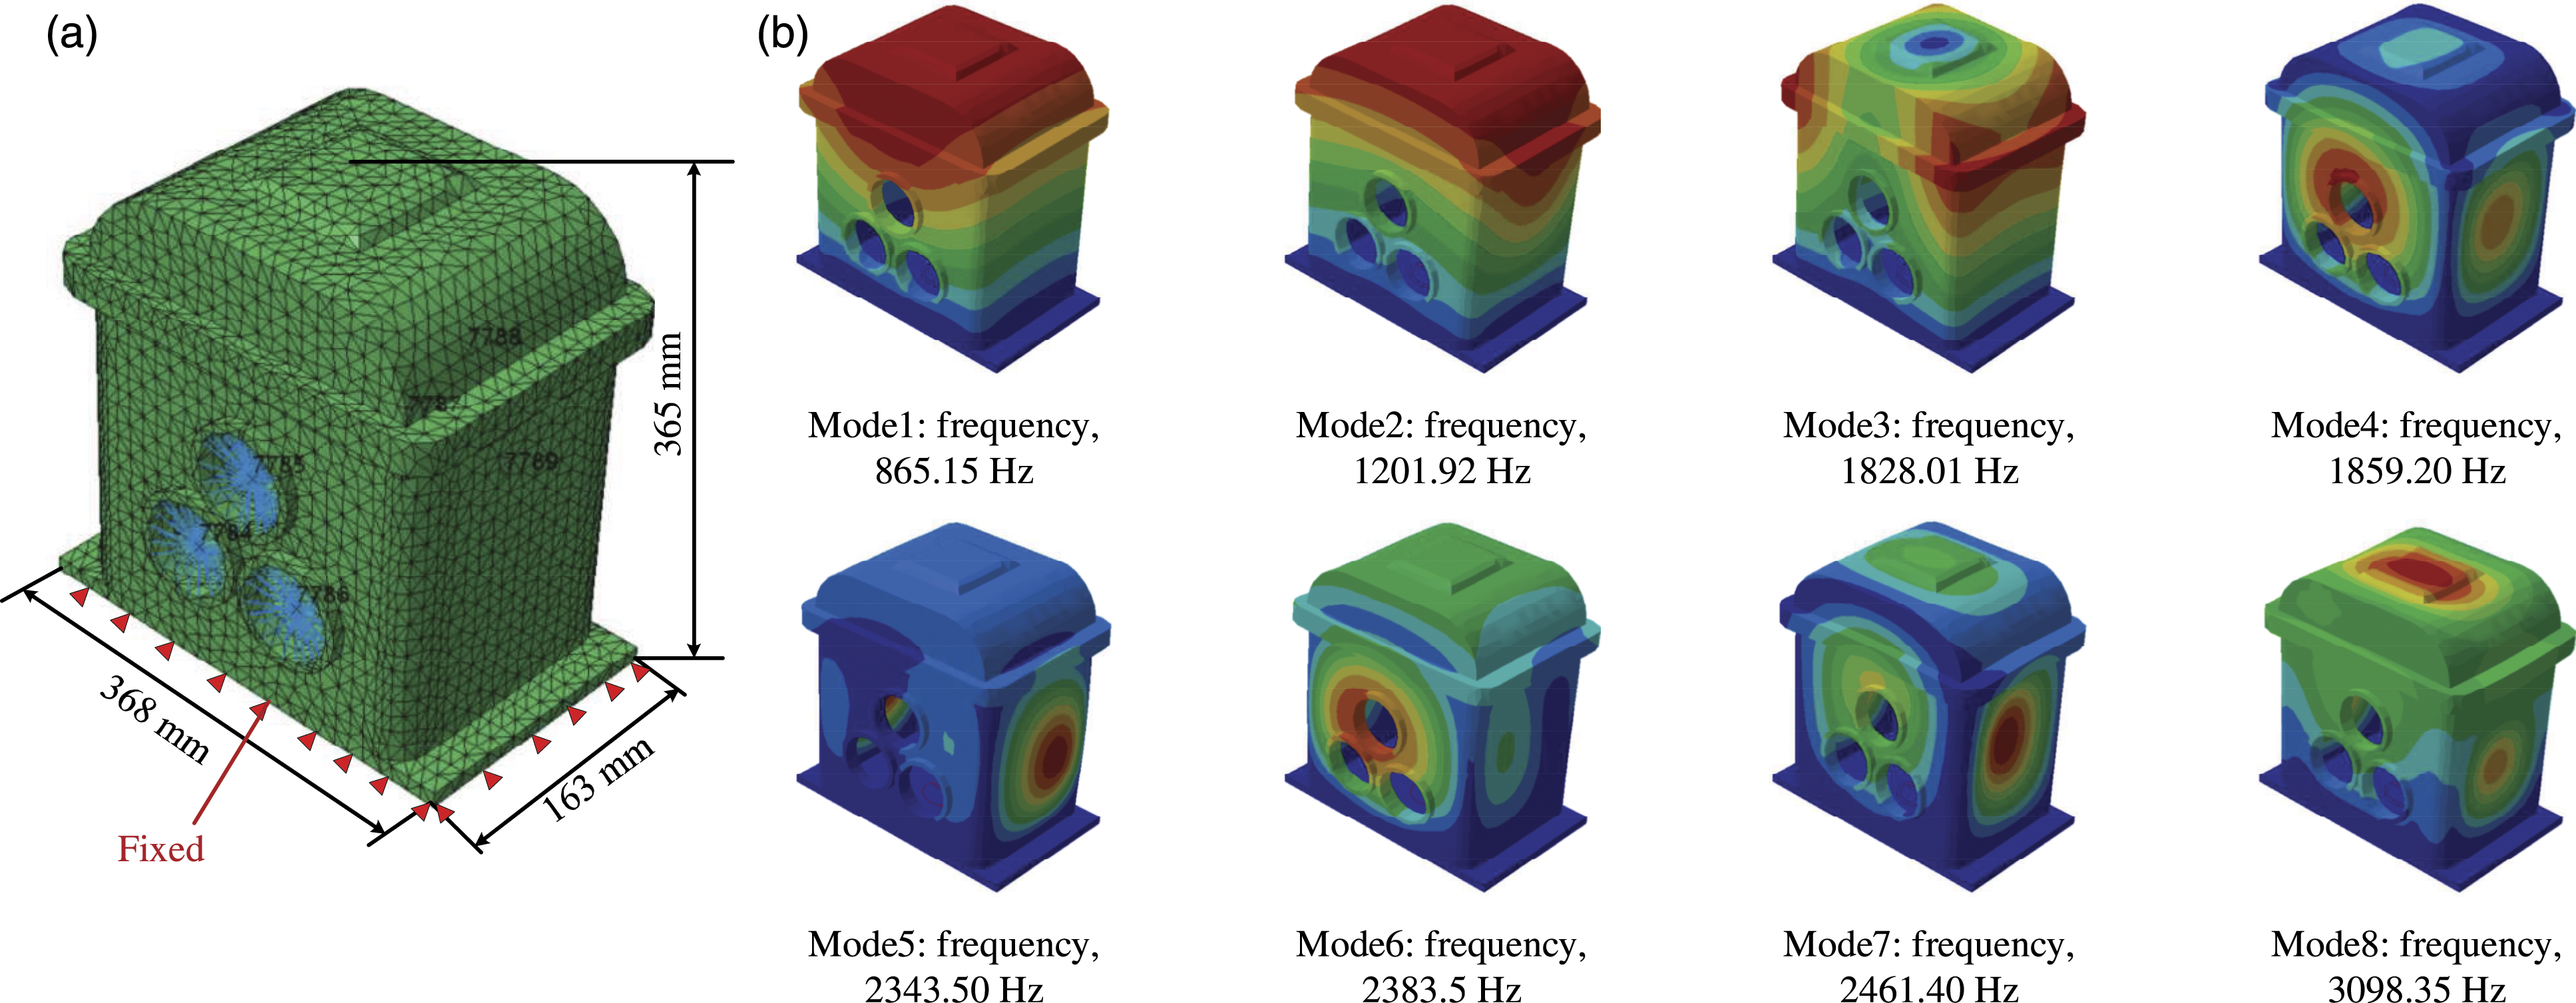
Gearbox radiated noise calculation
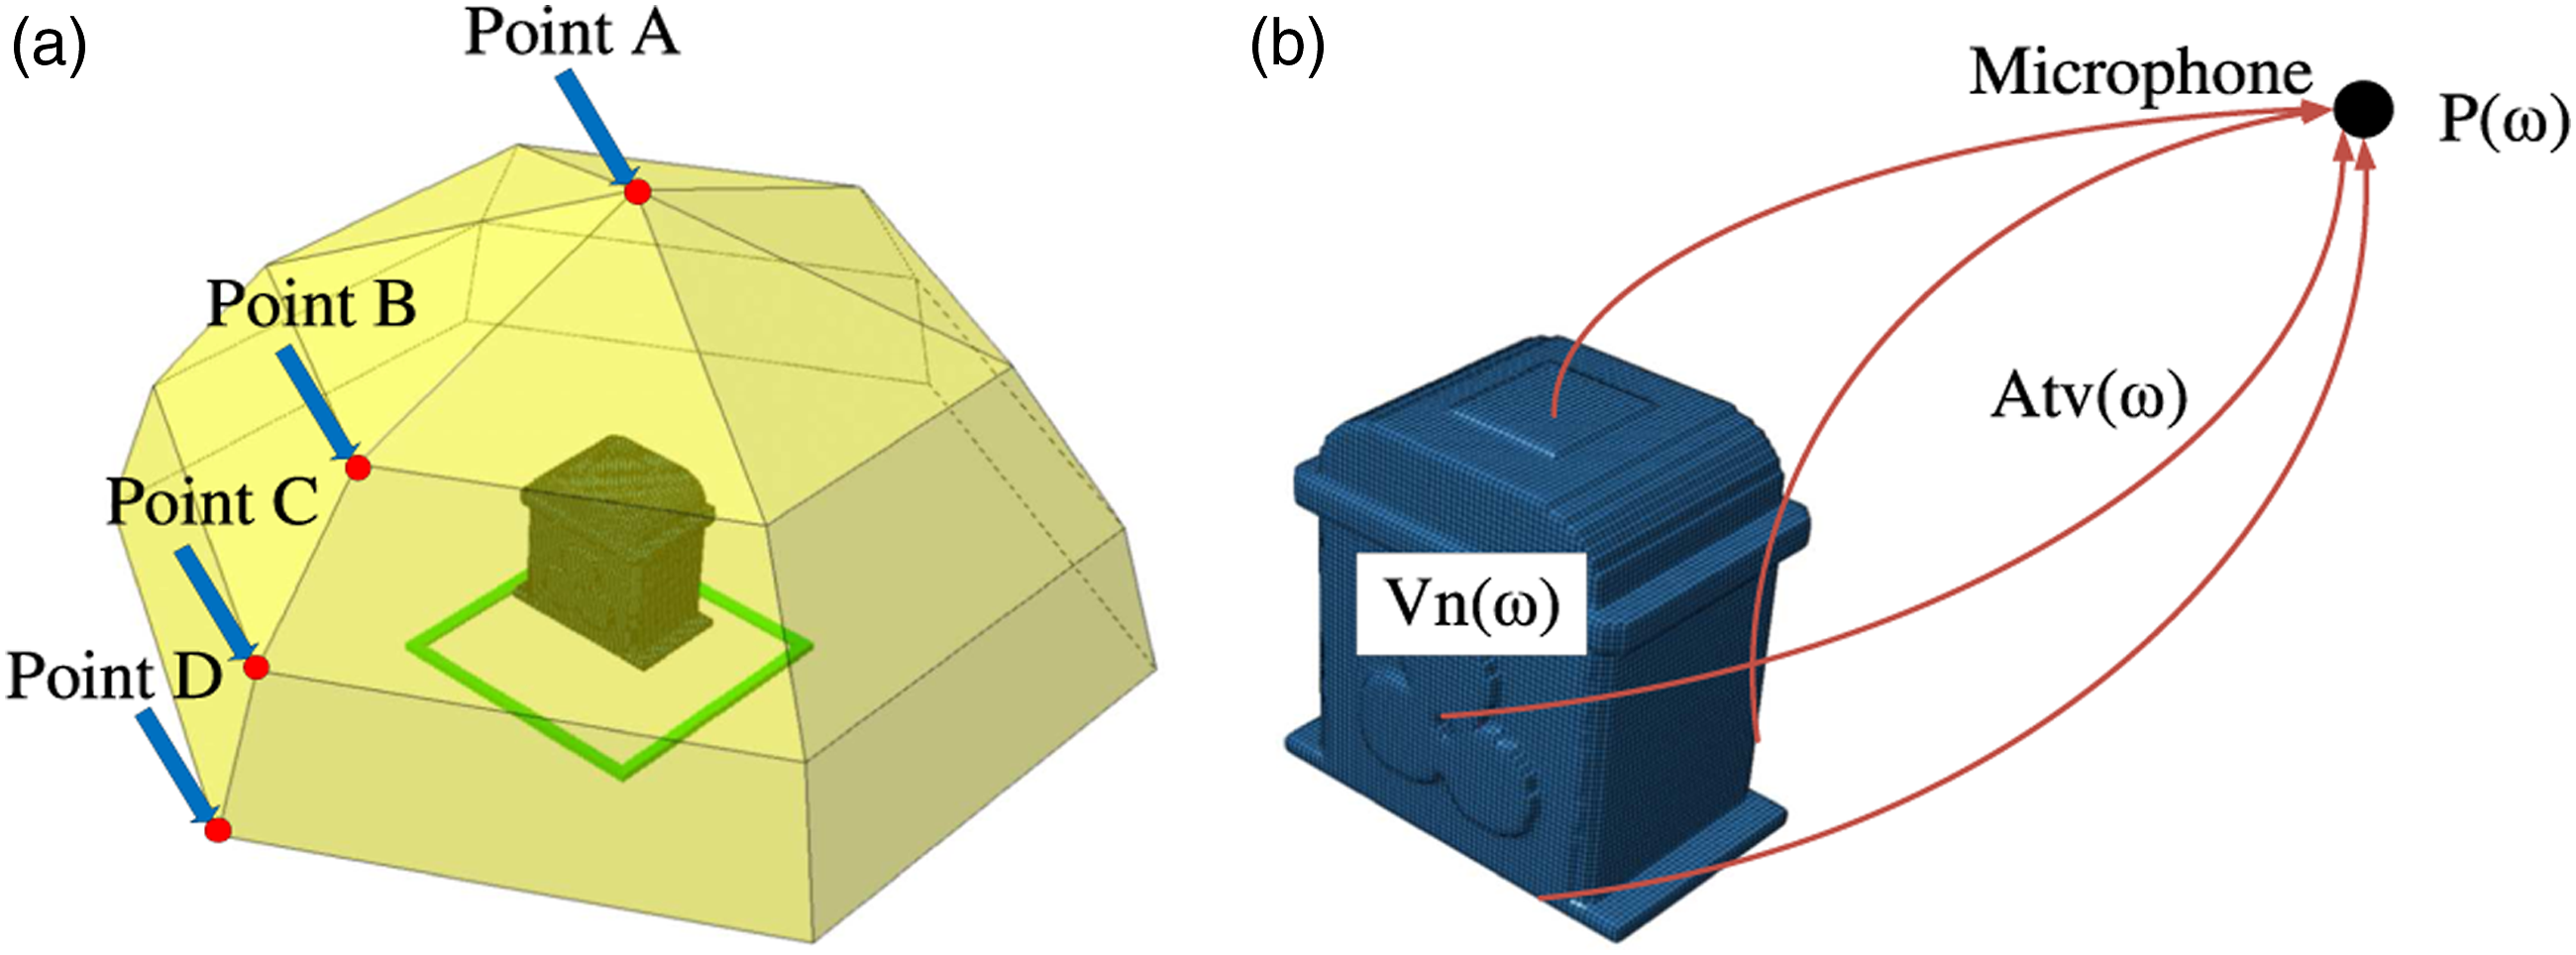
The BEM is obtained by extracting surface elements from the gearbox finite element model and repairing the bearing holes with shell elements. The acoustic fluid is air having mass density ρ0 = 1.2 kg/m3 and sound speed c = 343.4 m/s. Based on the boundary element model, the hemispherical shape acoustic field is established. Four points with the same radius are selected on the acoustic field as the measured field points, namely, field points A, B, C, and D, as shown in Figure 9(a). In the case of small perturbations, the acoustic equation can be considered linear. Thus, a linear relationship can be established between the input (the normal vibration of the structure surface) and the output (the sound pressure at a point in the sound field). According to the relationship shown in Figure 9(b), the sound pressure at a certain field point can be expressed as (a) Gearbox field point distribution, (b) ATV.
The boundary element method is used to solve the noise radiation of the gearbox by taking the normal vibration acceleration of the shell’s outer surface as the boundary condition. Figure 10 shows the noise spectrum when the input speed is 5400 rpm, and the torque is 100 N·m. Due to the consideration of shaft flexibility, the overall noise increases first and then decreases. From the sound pressure level curves, it is well noticed that peak is generated on the position of 3 × fm2. The corresponding frequency of the maximum radiated noise is 3 × f
m2
(3132 Hz), which is close to the eighth order natural frequency of housing (3098.35 Hz). At 3 × f
m2
(3132 Hz), the SPL at field point A is the largest, so field point A is selected as the target field point. The radiated noise at point A can be reduced by suppressing the PSPL at 3 × f
m2
. Noise spectrum of gearbox.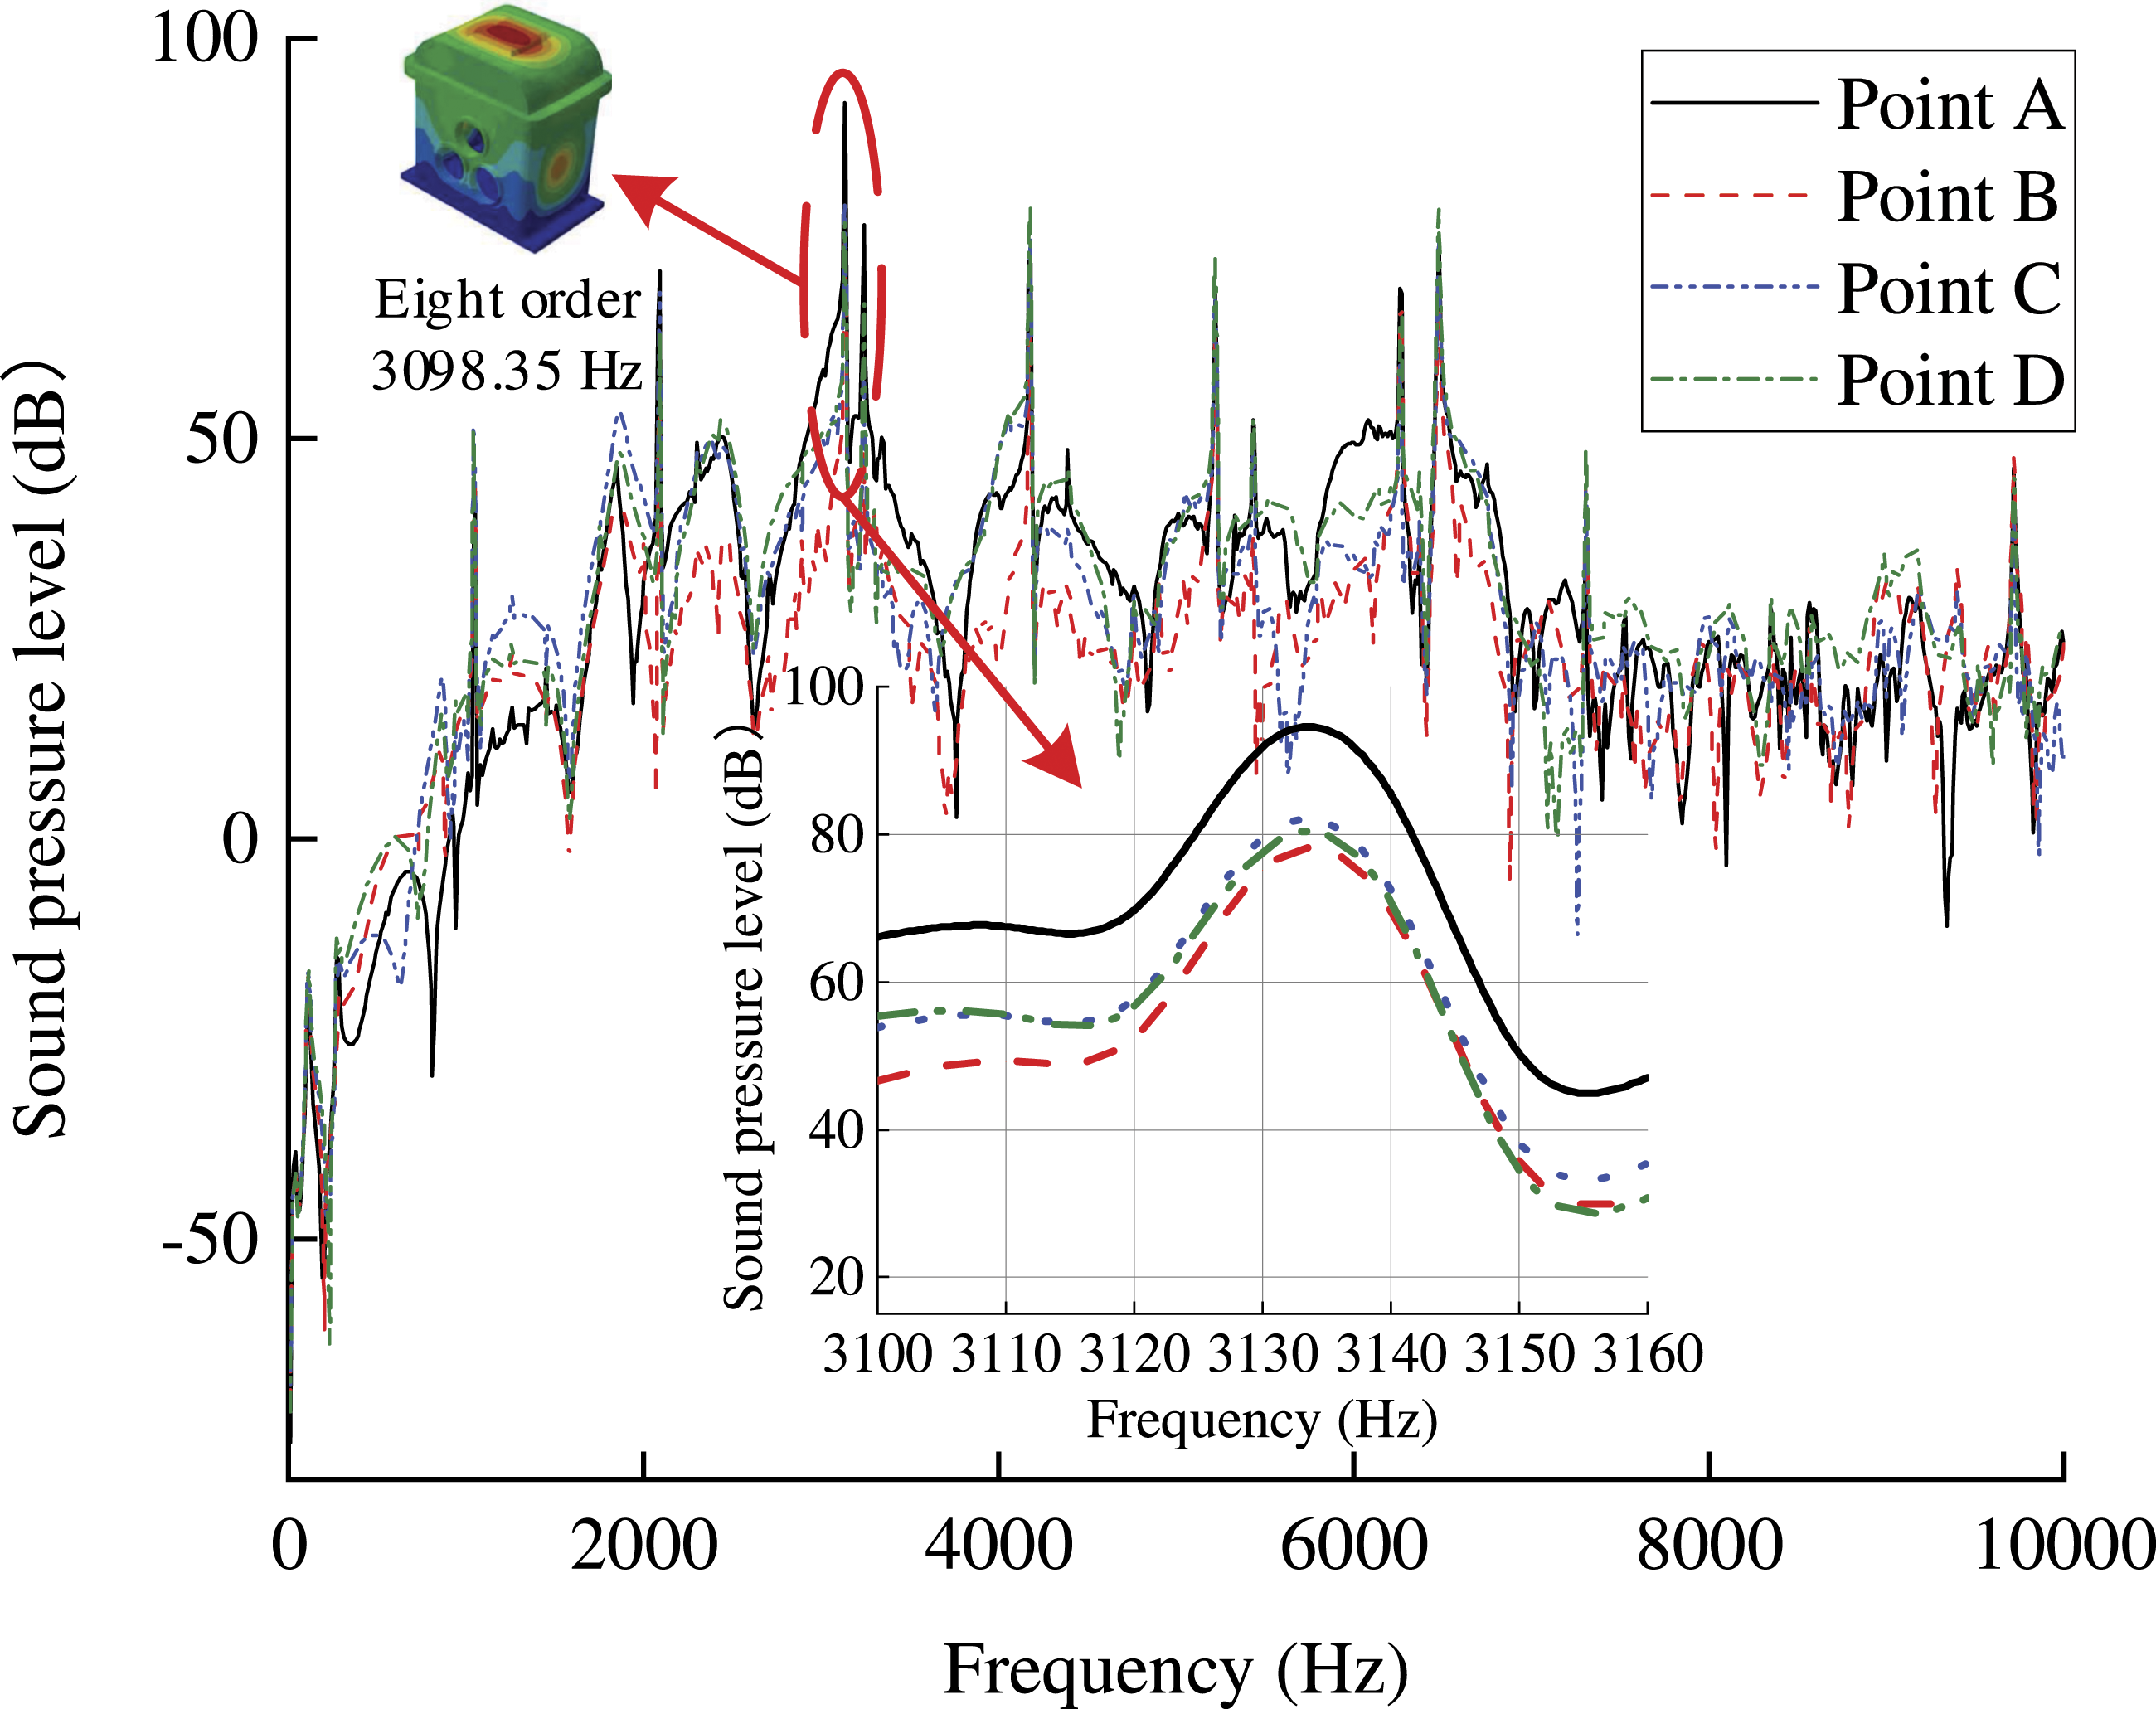
Determine ribs addition region and VRSM
In this study, the regions with larger ATV can be found by the analysis of ATV. Then, the regions with larger MAC can be obtained by MAC. Finally, panels can be divided on the regions with larger MAC and ATV concurrently and the acoustic contribution of each panel can be obtained by PACA. This process can be found the region with maximum acoustic contribution. Based on ATV-MAC-PACA, the VRSM was established.
Acoustic transfer vector (ATV)
Figure 11 demonstrates the amplitude of the acoustic transfer vector at 3 × f
m2
(3132 Hz) to field point A. It can be seen that the amplitude on the upper part of the gearbox is significantly greater than that on the bottom, indicating that the normal vibration on the upper part of the gearbox has a more obvious impact on the PSPL. In summary, the first screening region is the upper part of the gearbox. Amplitude of acoustic transfer vector at field point A at 3 × f
m2
.
Modal acoustic contribution analysis (MACA)
Using the modal superposition method, the displacement response of the multi-free system can be obtained as
By projecting {x(ω)} onto the normal direction of the box surface and taking the derivative, the vibration velocity in the normal direction of the gear box surface can be obtained as
By substituting equations (9) into (10), the sound pressure at any point in the sound field can be obtained as
The acoustic contribution of each mode at field point A is obtained by MACA, as shown in Figure 12. It can be seen that the eighth mode has a large acoustic contribution to the PSPL at field point A. The corresponding main mode shape of this mode is shown in Figure 12. The eighth main mode vibrates obviously at the top of the gearbox. Therefore, the result of the second screening is the top region of the gearbox. The modal acoustic contributions at the field point A at the meshing frequency.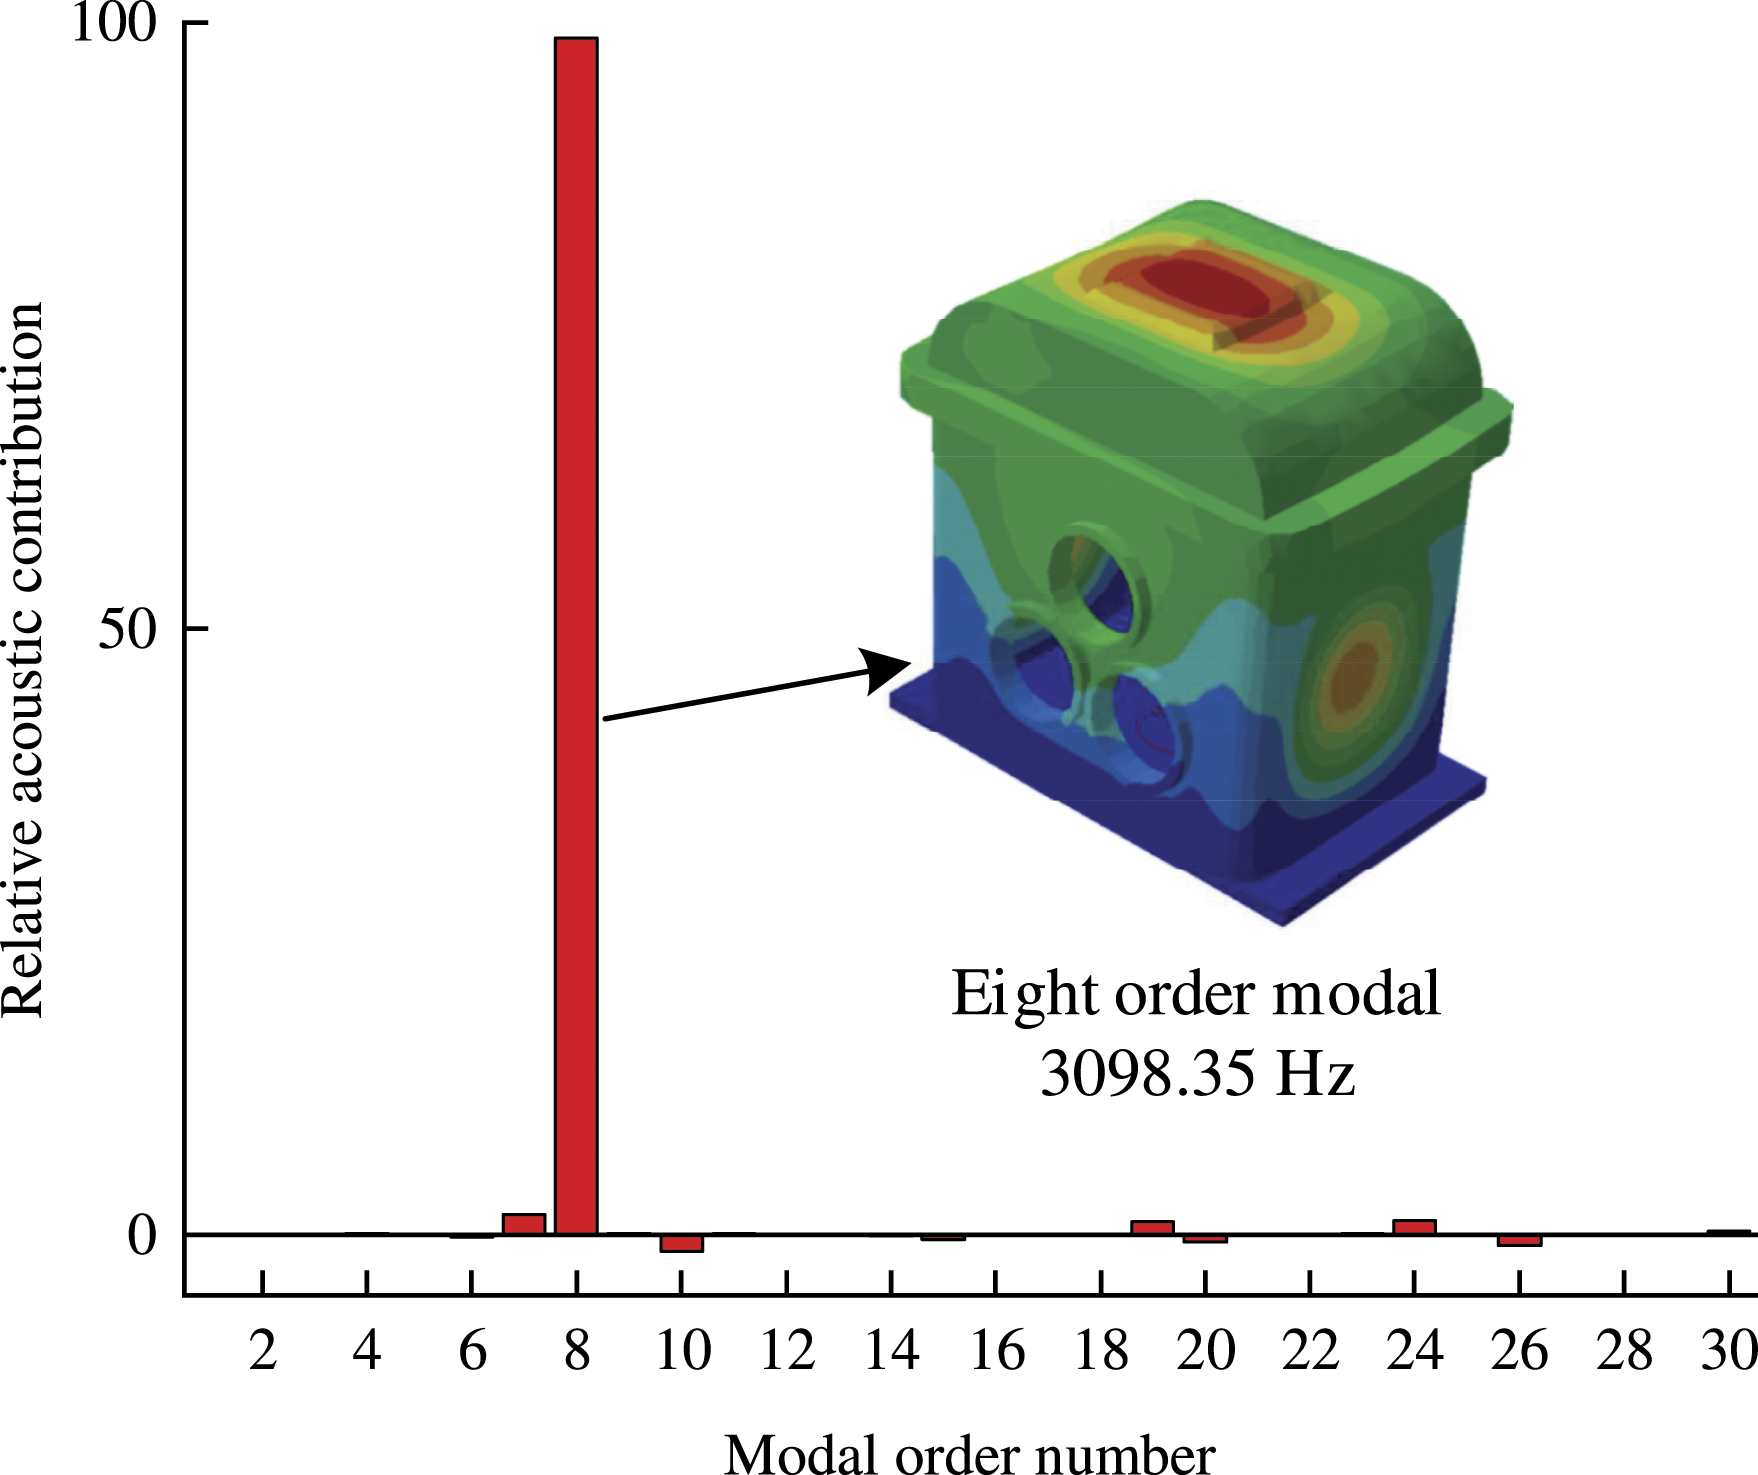
Panel acoustic contribution analysis (PACA)
The main panels corresponding to the first eight modes are divided, and PACA analysis was carried out. The acoustical contribution of each panel to the field point A at 3×f
m2
(3132 Hz) was obtained, as shown in Figure 13. It can be seen from the figure that panel 1 and panel 2 have the largest contribution, more than 25 percent, so the screening results through PACA are panel 1 and panel 2. Analysis results of acoustical contribution of plate surface at meshing frequency.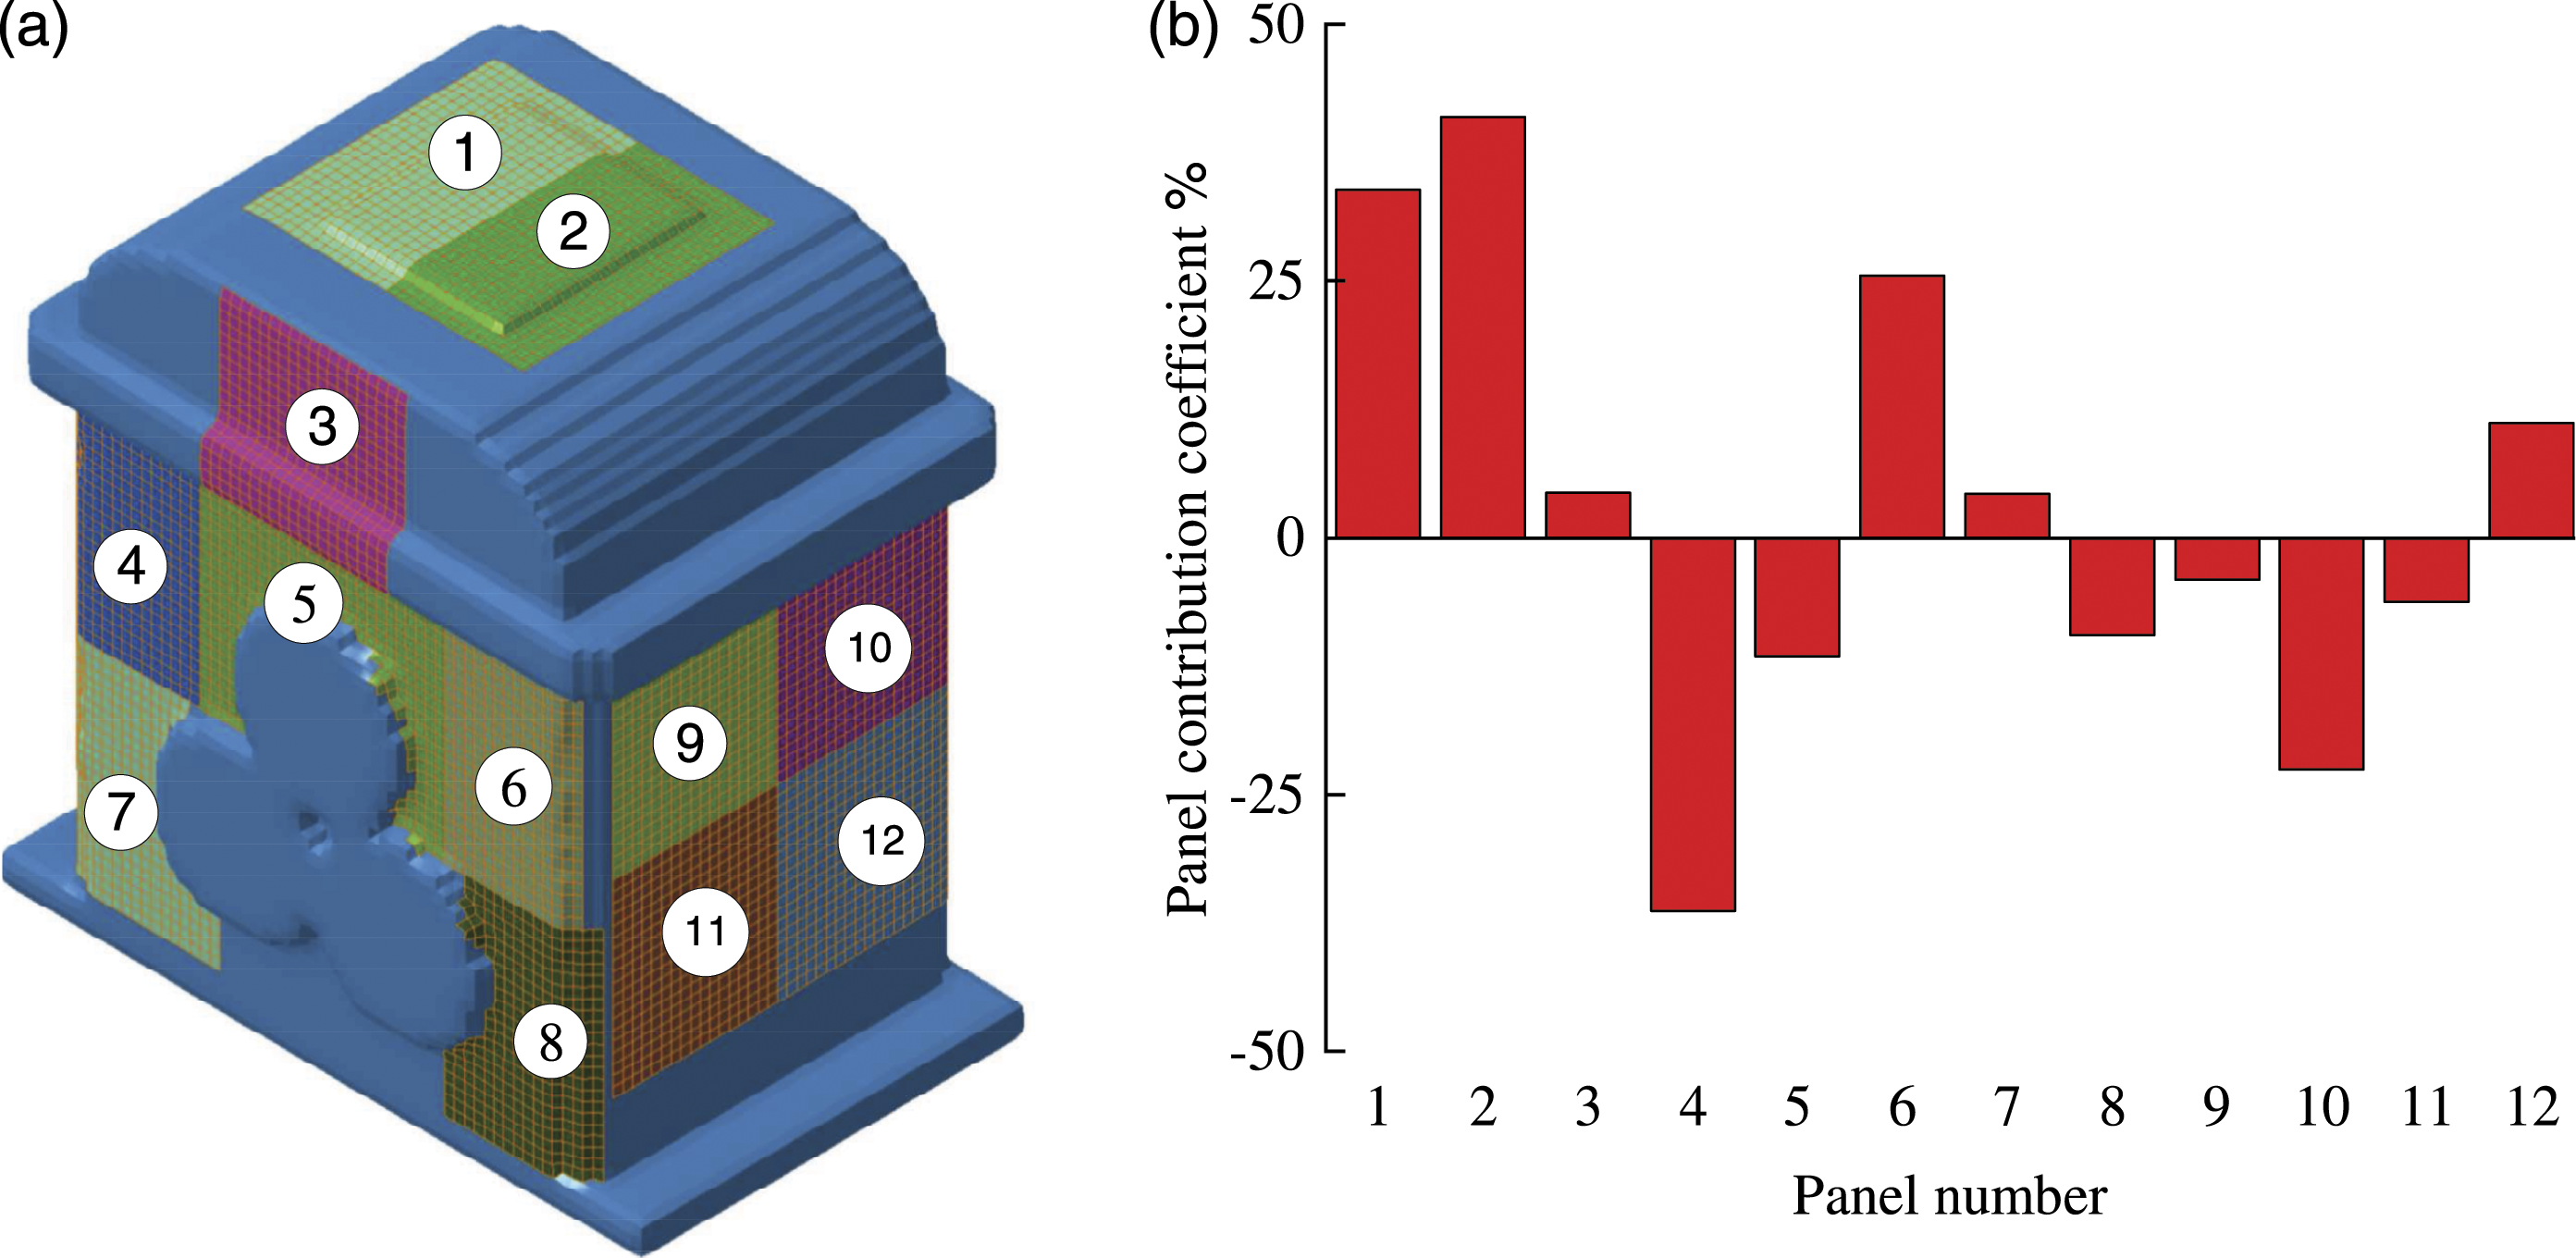
In summary, Using the ATV-MAC-PACA method, the central region of the top of the gearbox has the largest acoustic contribution to the field point A at 3×f m2 (3132 Hz). Therefore, the VRSM can be added at this region to reduce the radiated noise of the gearbox.
Variable ribs structure model (VRSM)
Although the general region of the added ribs can be obtained from the previous screening, the research on the distribution and number of ribs and the specific parameters of each rib requires further design. The ribs layout method adopted in this paper refers to literature. 19
Figure 14(a) is the rectangular region determined according to the screening results. To study the effect of the layout and parameters of the ribs on reducing the radiated noise of the shell, the ribs model is added to the top center of the shell (note: all model ribs are added to the inner surface of the top of the box body to prevent disturbance of the ATV and improve calculation efficiency). The characteristic of VRSM is characterized by the fact that there is no definite ribs layout and size, and variables in the model can be changed as required. Thus, different VRSMs can be realized according to different optimization results. As shown in Figure 14(b), the model contains 11 design variables; namely, the number of horizontal and vertical ribs (n
1
and n
2
), the width of the ribs (d
1
, d
2
, d
3
, and d
4
), and the thickness of the ribs (t
1
, t
2
, t
3
, and t
4
). φ is the rotation angle of the ribs relative to the x-axis (shown in Figure 14(c)). In addition, the spacing y
1
and y
2
between the ribs are determined by the number of horizontal and vertical ribs, respectively; y
1
and y
2
reflect variation the density of rib distribution in the gearbox. It can be seen that through the selection of value range, the rib height and thickness variables can be set to zero, and then the redundant ribs can be deleted in the corresponding optimization. 3D model of ribs layout design. (a) the position where the ribs are added in the gearbox, (b)VRSM, and (c) variable φ: the rotation Angle of the ribs relative to the x-axis.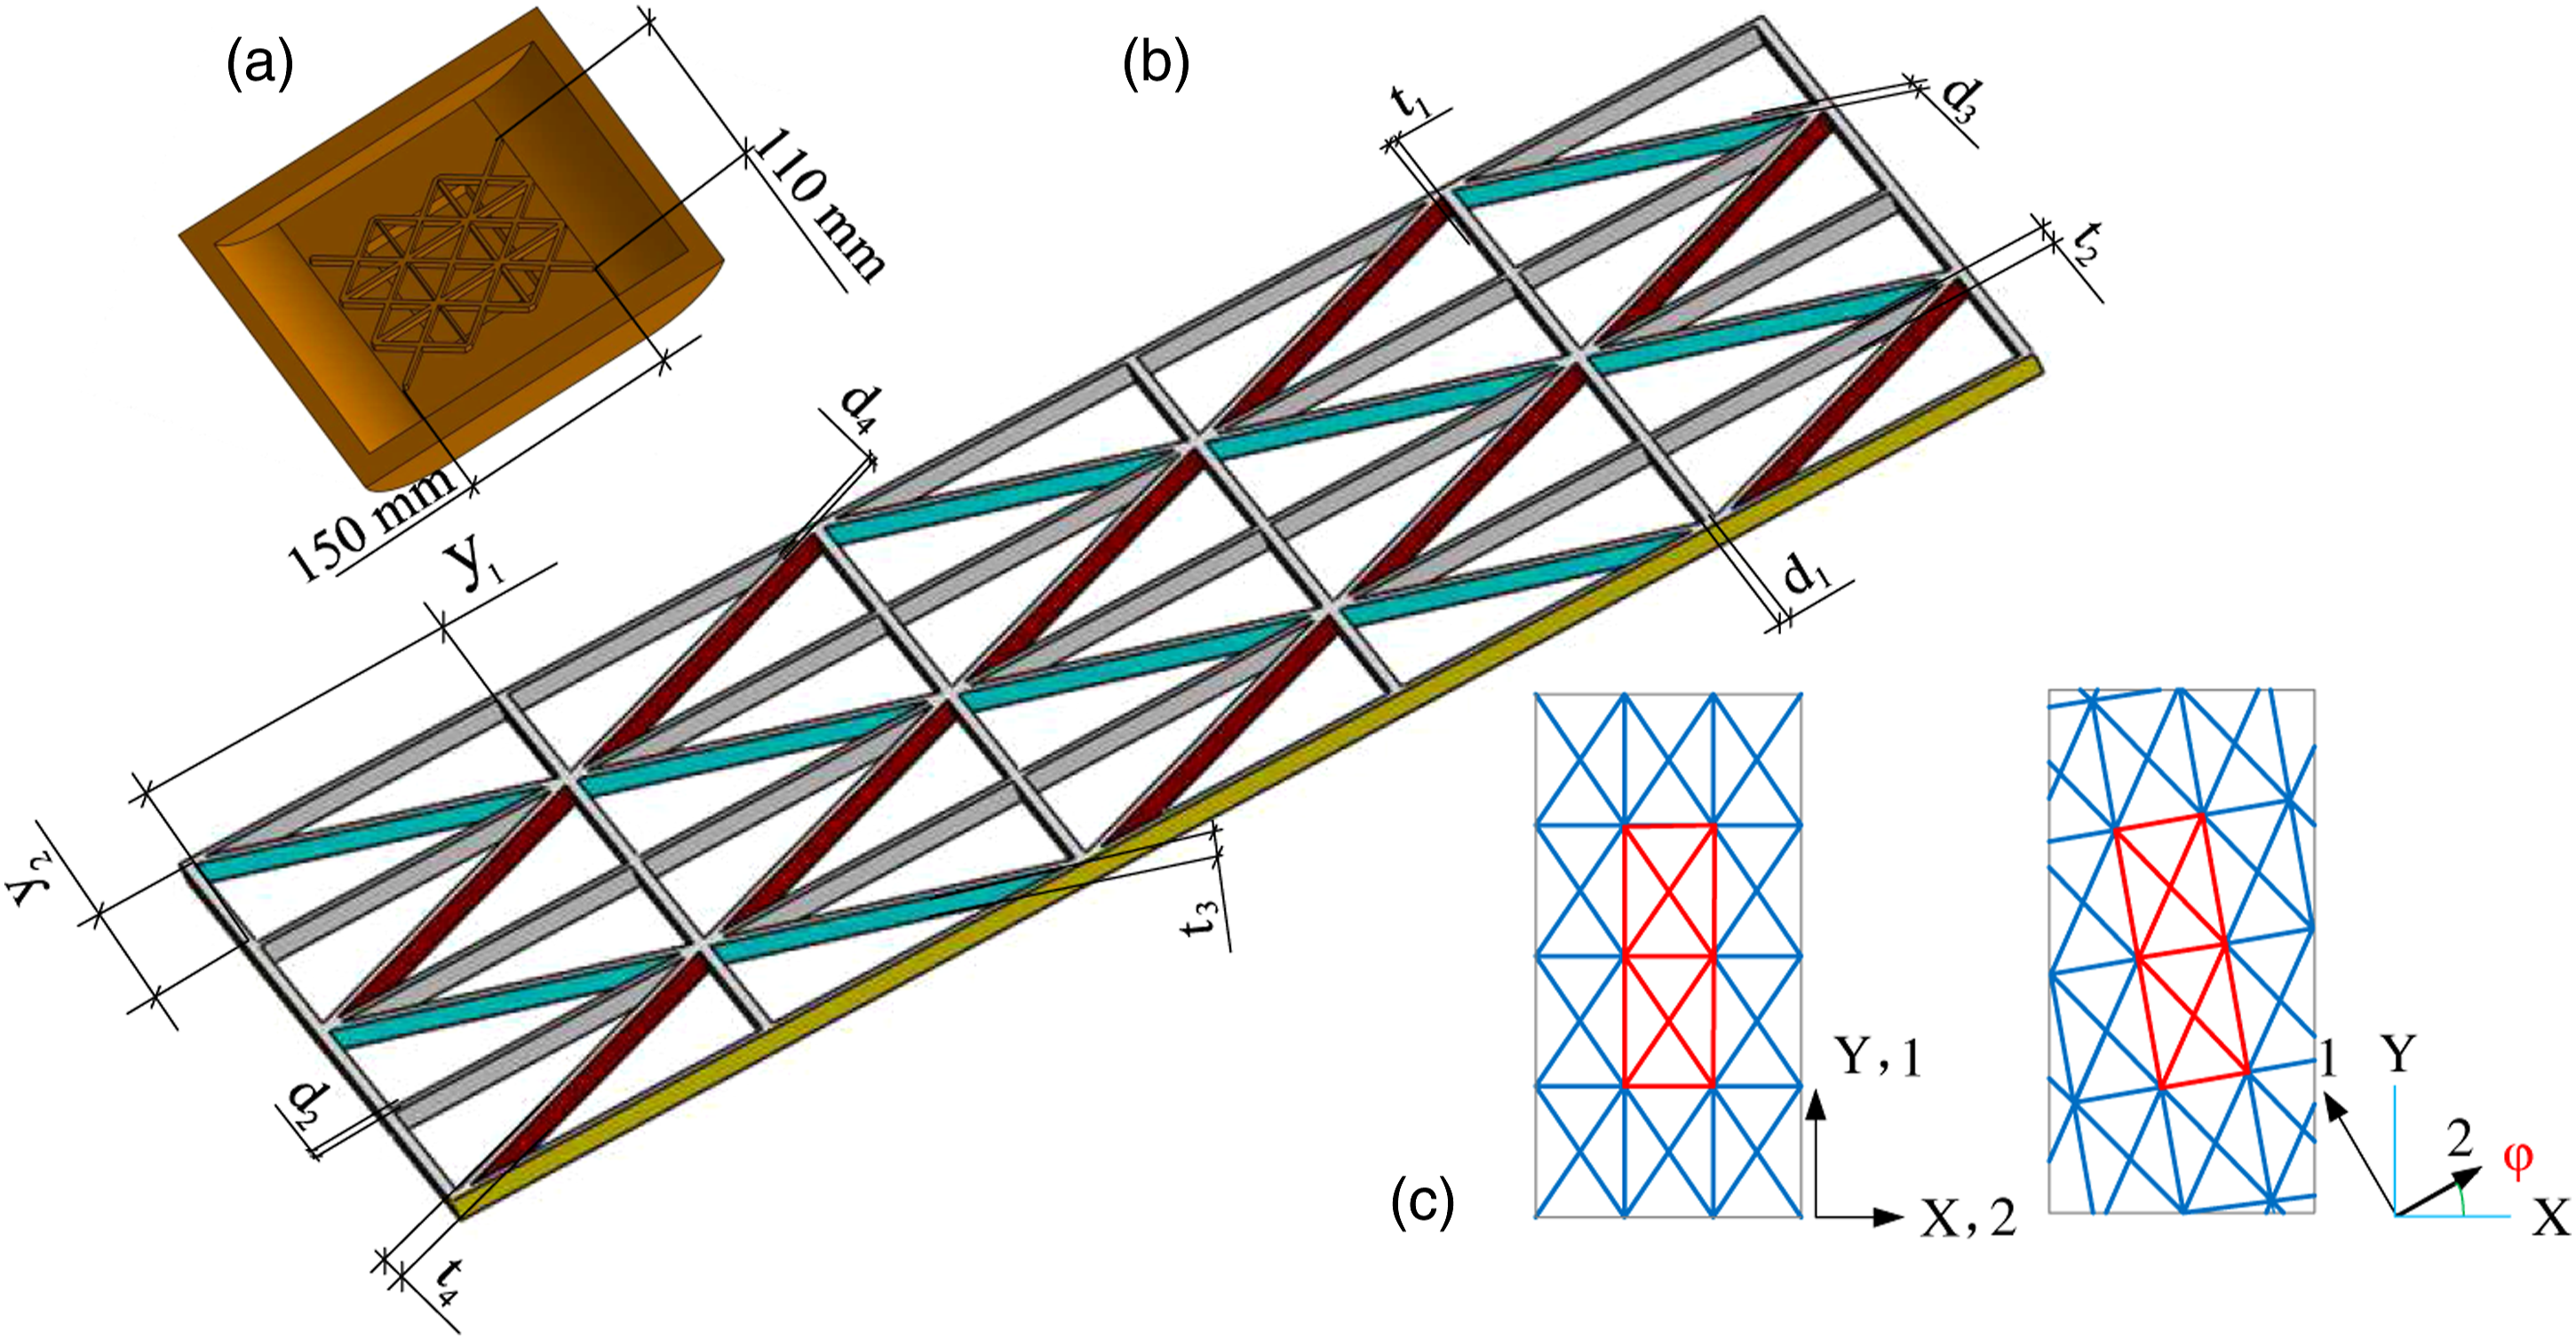
Multi-objective optimization
There is a great relationship between the mass of ribs and peak value of radiated noise of the gearbox, and the two are in conflict in essence, so it is very necessary to establish a multi-objective optimization model.
Response surface model (RSM)
Based on statistical and mathematical methods, RSM can build and evaluate a variety of complex problems. In this method, the output variable (system response) is approximately fitted to the specified design space to replace the real response surface.
18
In order to give consideration to the fitting accuracy and optimization calculation time, the central composite design (CCD) was adopted. In this design, alpha = 0.5, the center point is 1 and the factorial core uses the min-res V method. The relation between the independent variable in the response surface and response Z can be expressed as
RSM usually adopts quadratic polynomial model to fit the parameter model of the response. Its approximate function can be expressed as
Multi-objective genetic algorithm
Genetic Algorithms is a heuristic algorithm developed on the basis of biological evolutionary theory and Genetic thought. Compared with single objective optimization, multi-objective optimization can better solve problems with multiple objective requirements. NSGA-II proposed by Deb et al. 20 is a multi-objective optimization algorithm based on Pareto optimal solution, that is, a fast non-dominated multi-objective optimization algorithm with elite retention strategy. The three major characteristics of NSGA-II are the proposed congestion degree and congestion comparison operator, and the introduction of non-dominated ranking and elite strategy.
In this paper, the optimal VRSM is solved while considering multiple targets. The objective functions of Rm and PSPL are obtained by a large number of experimental data and RSM. The optimization problem model is as follows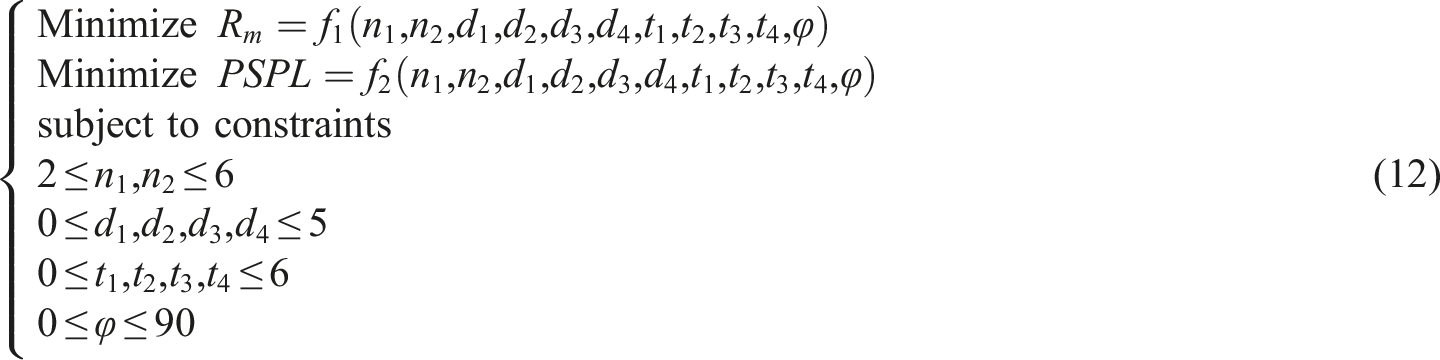
Results and discussion
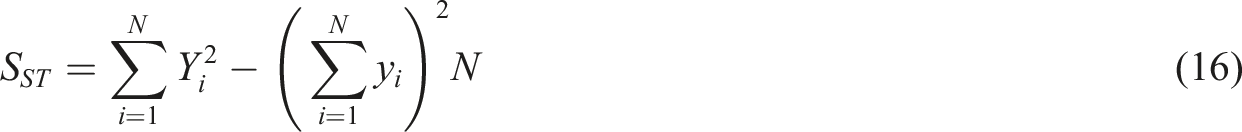
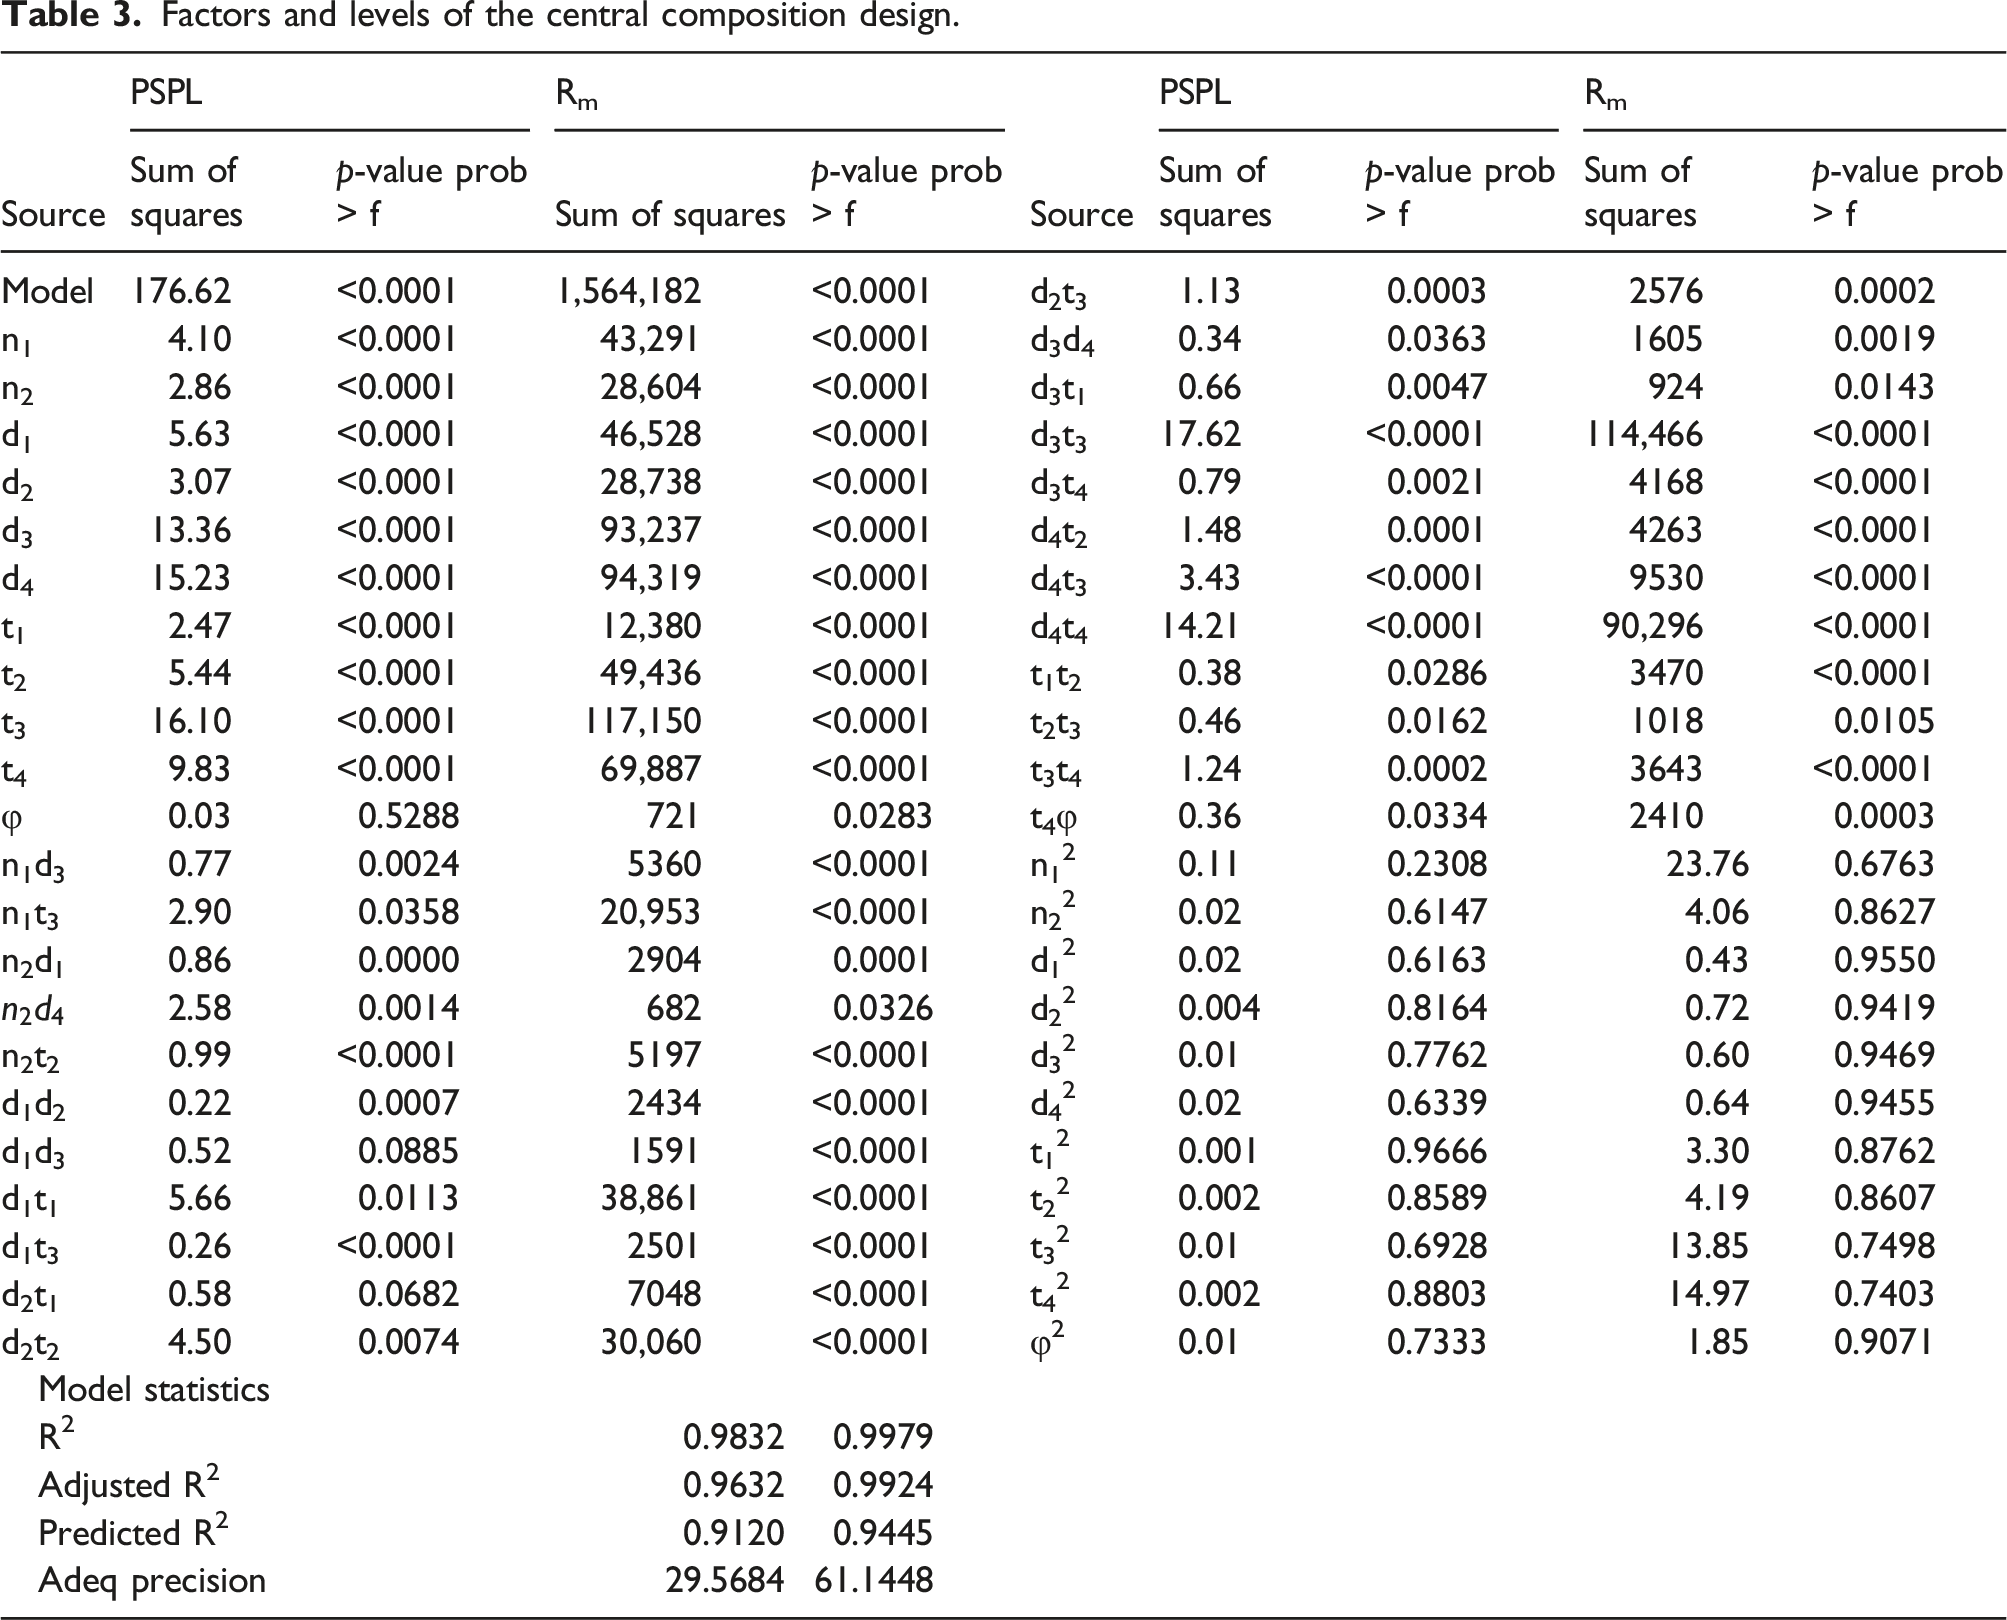
As per CCD design, 91 experiments are performed for VRSM. See Appendix 1 for specific simulation experiment data. The regression analysis is an assessment of the accuracy and predictive power of response surface models. When the response surface model is more accurate, the numerical model will be closer to the physical model, and the predicted value will be more accurate. Generally, R2 and adjusted R2 are used to characterize the accuracy of response surface model, and the mathematical formulations are given by


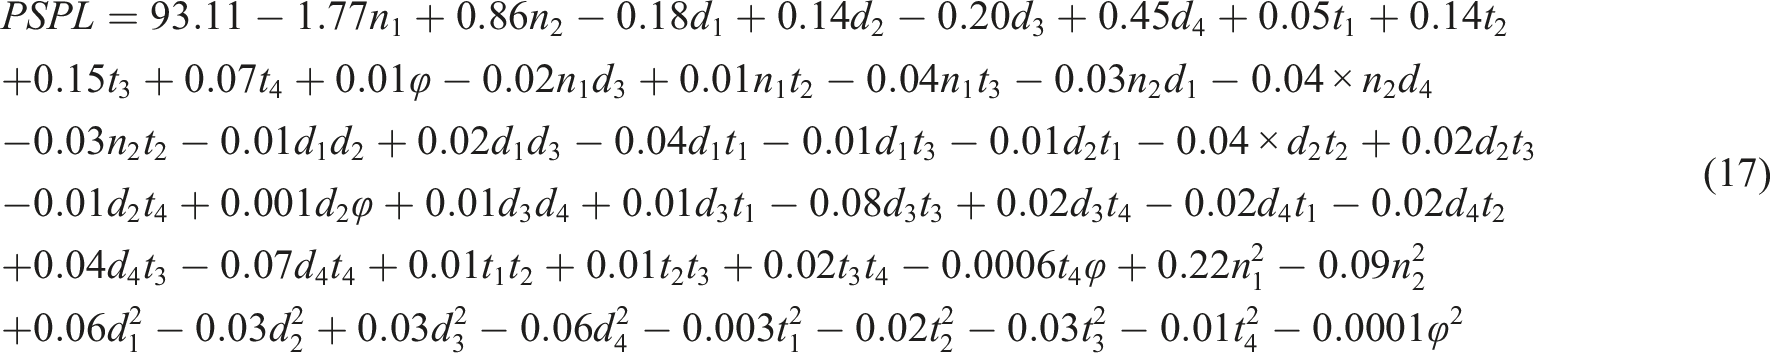
Quadratic equation for PSPL
Factors and levels of the central composition design.
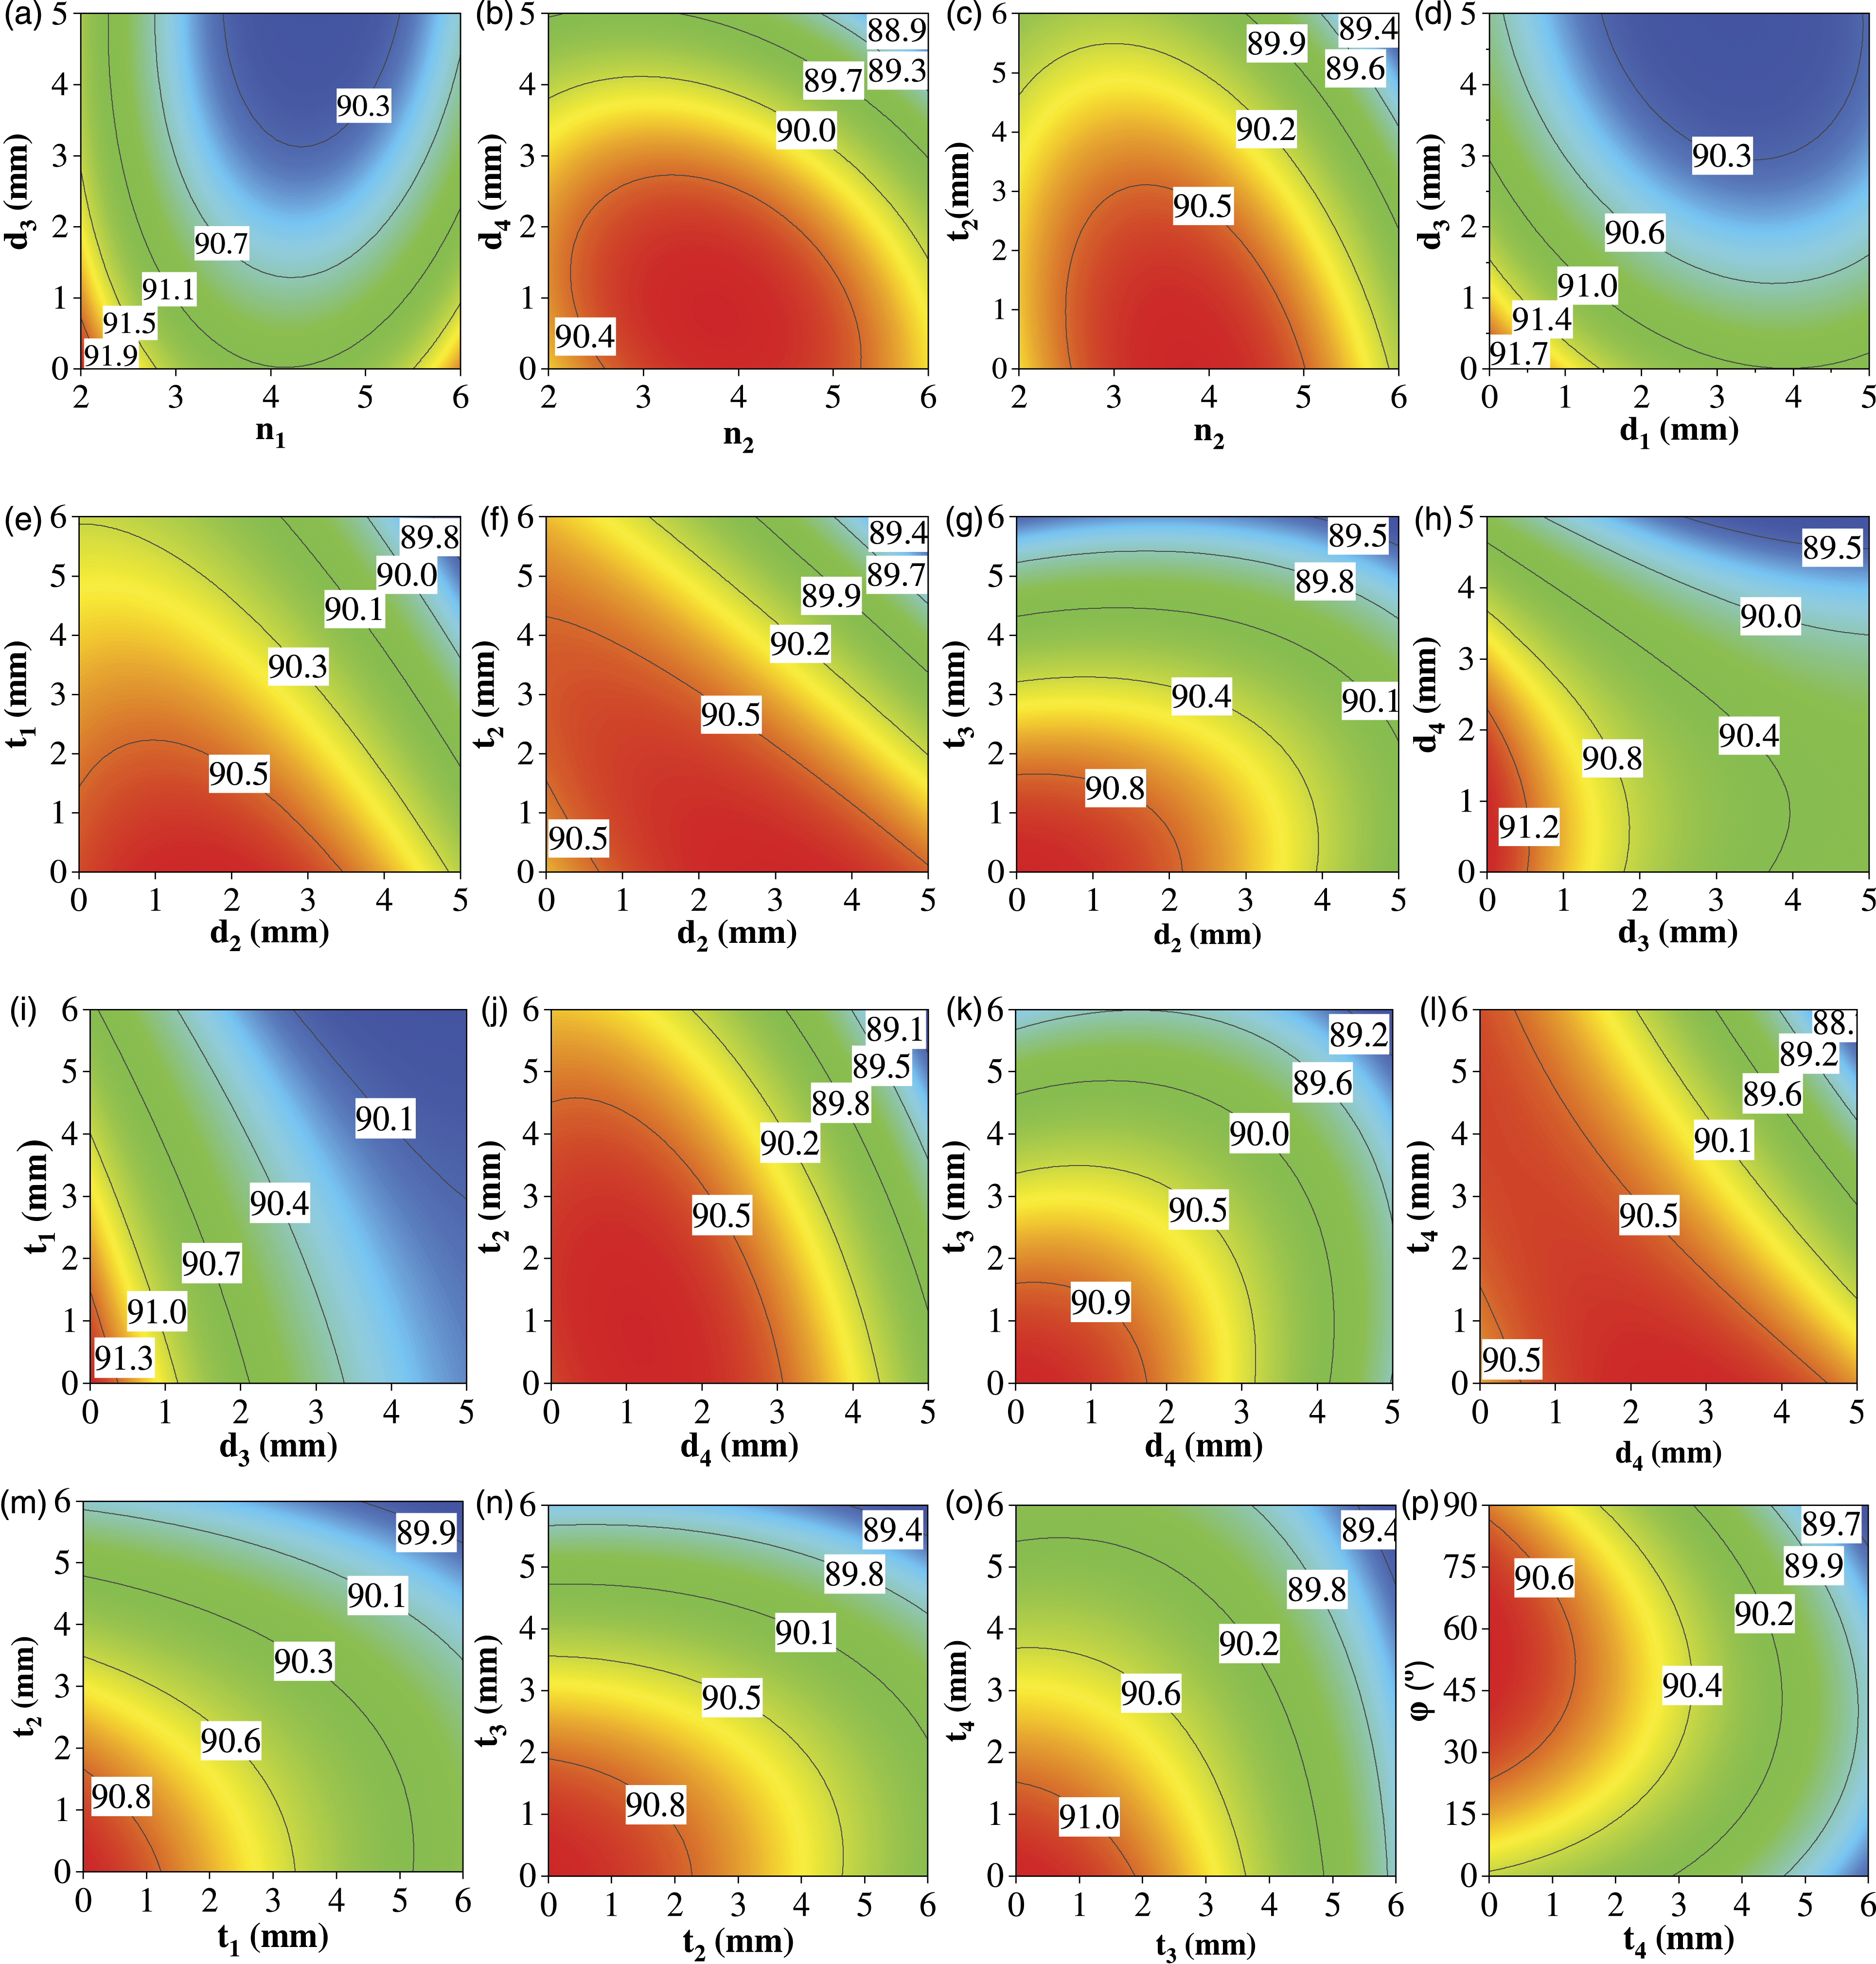
Contour plots for PSPL in terms of (a) n1vs. d3, (b) n2vs. d4, (c) n2vs. t2, (d) d1vs. d3, (e) d2vs. t1, (f) d2vs. t2, (g) d2vs. t3, (h) d3vs. d4, (i) d3vs. t1, (j) d4vs. t2, (k) d4vs. t3, (l) d4vs. t4, (m) t1vs. t2, (n) t2vs. t3, (o) t3vs. t4, and (p) t4vs. φ.
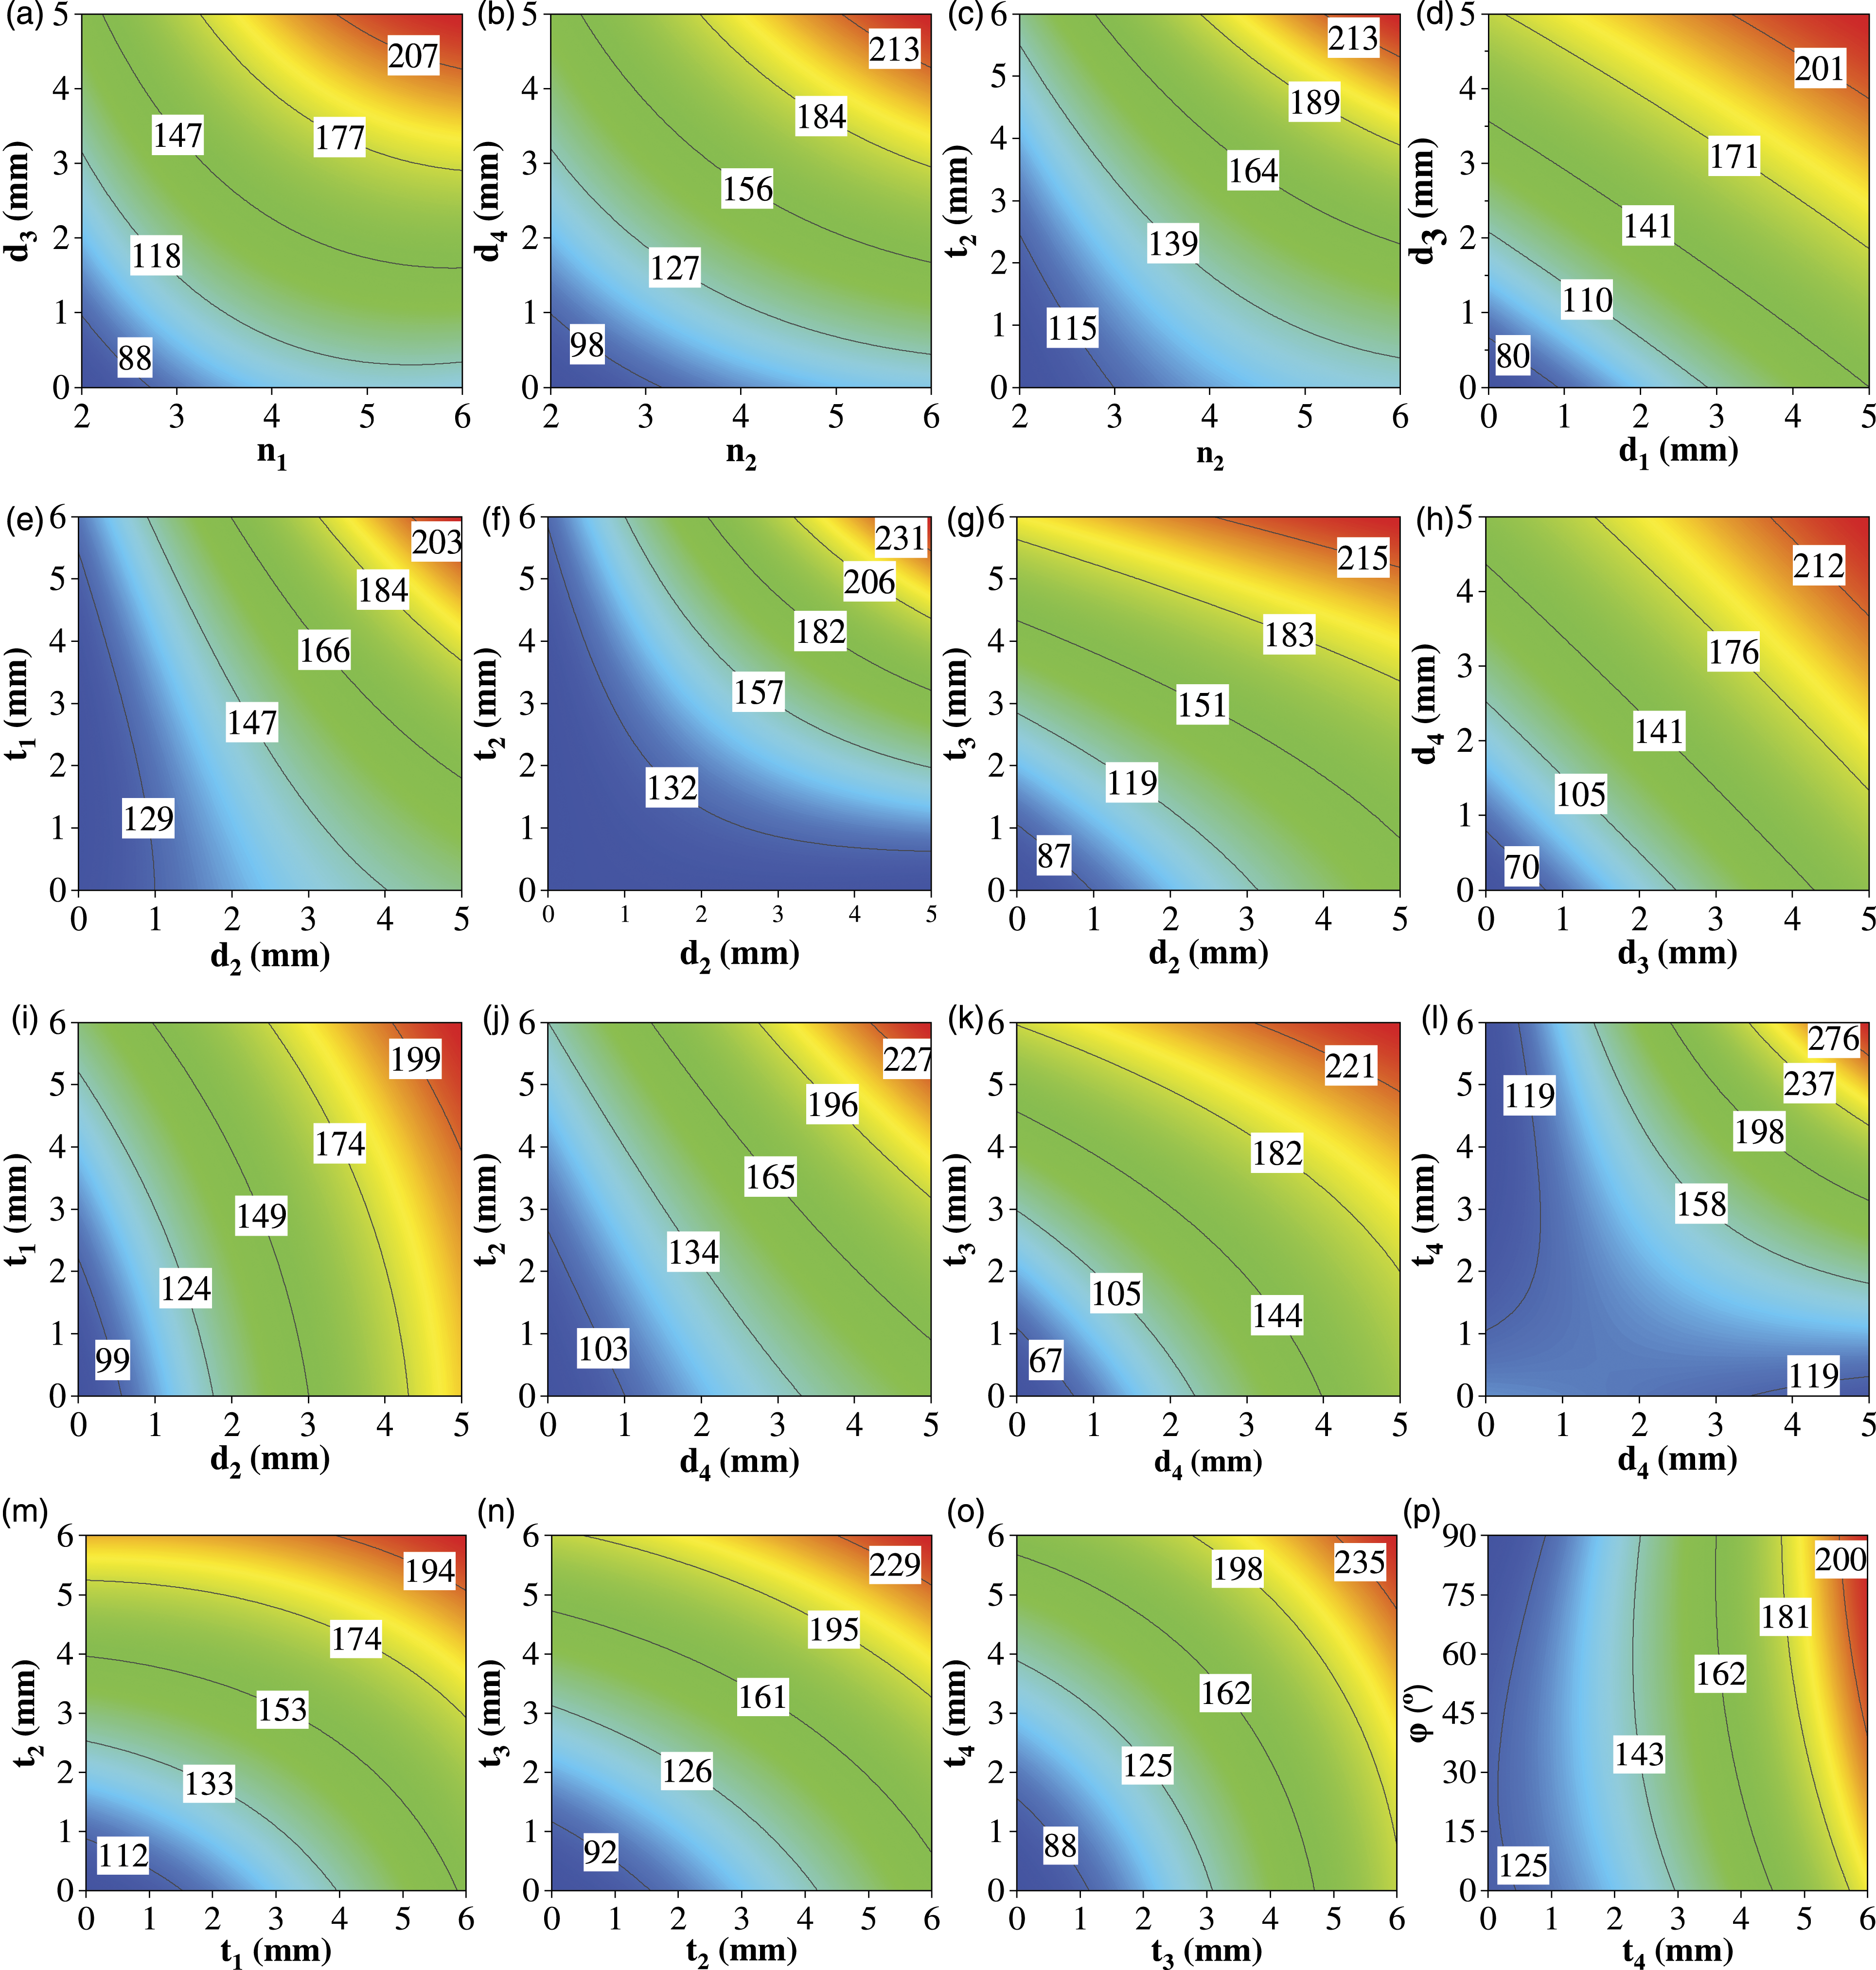
Contour plots for Rm in terms of (a) n1vs. d3, (b) n2vs. d4, (c) n2vs. t2, (d) d1vs. d3, (e) d2vs. t1, (f) d2vs. t2, (g) d2vs. t3, (h) d3vs. d4, (i) d3vs. t1, (j) d4vs. t2, (k) d4vs. t3, (l) d4vs. t4, (m) t1vs. t2, (n) t2vs. t3, (o) t3vs. t4, and (p) t4vs. φ.
Quadratic equations for Rm
Regression function concerning Rm can be expressed as follows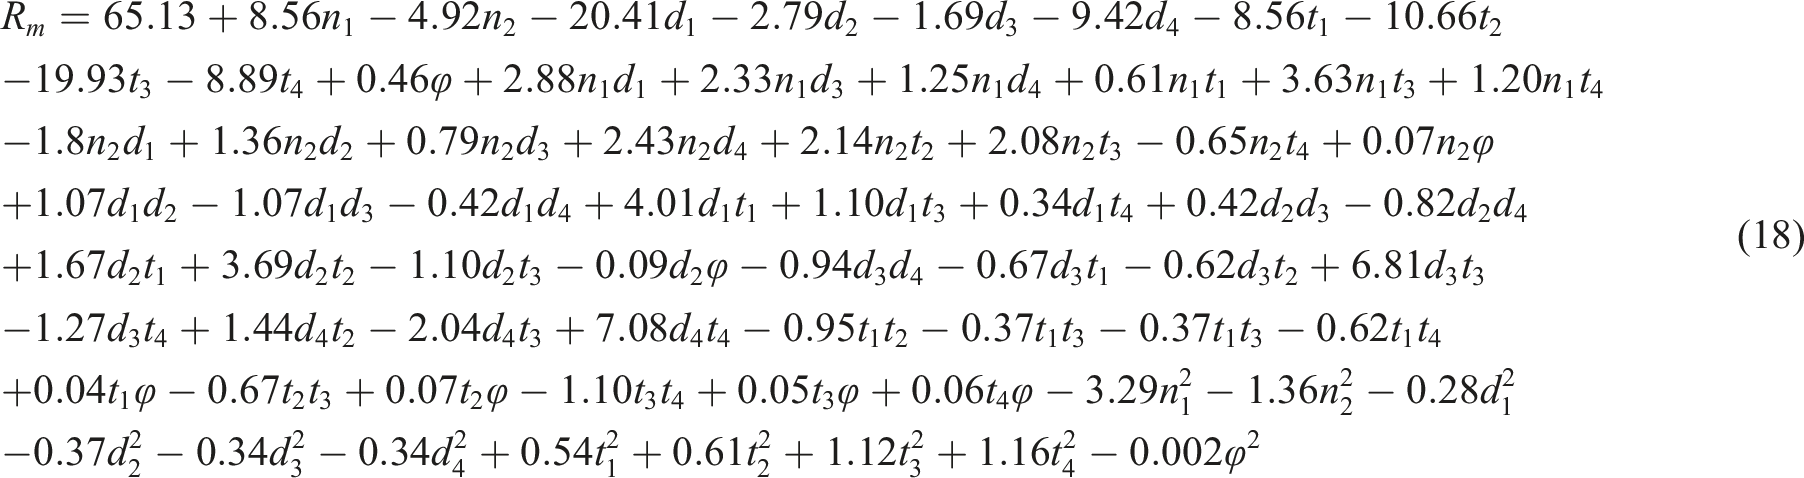
Optimization results
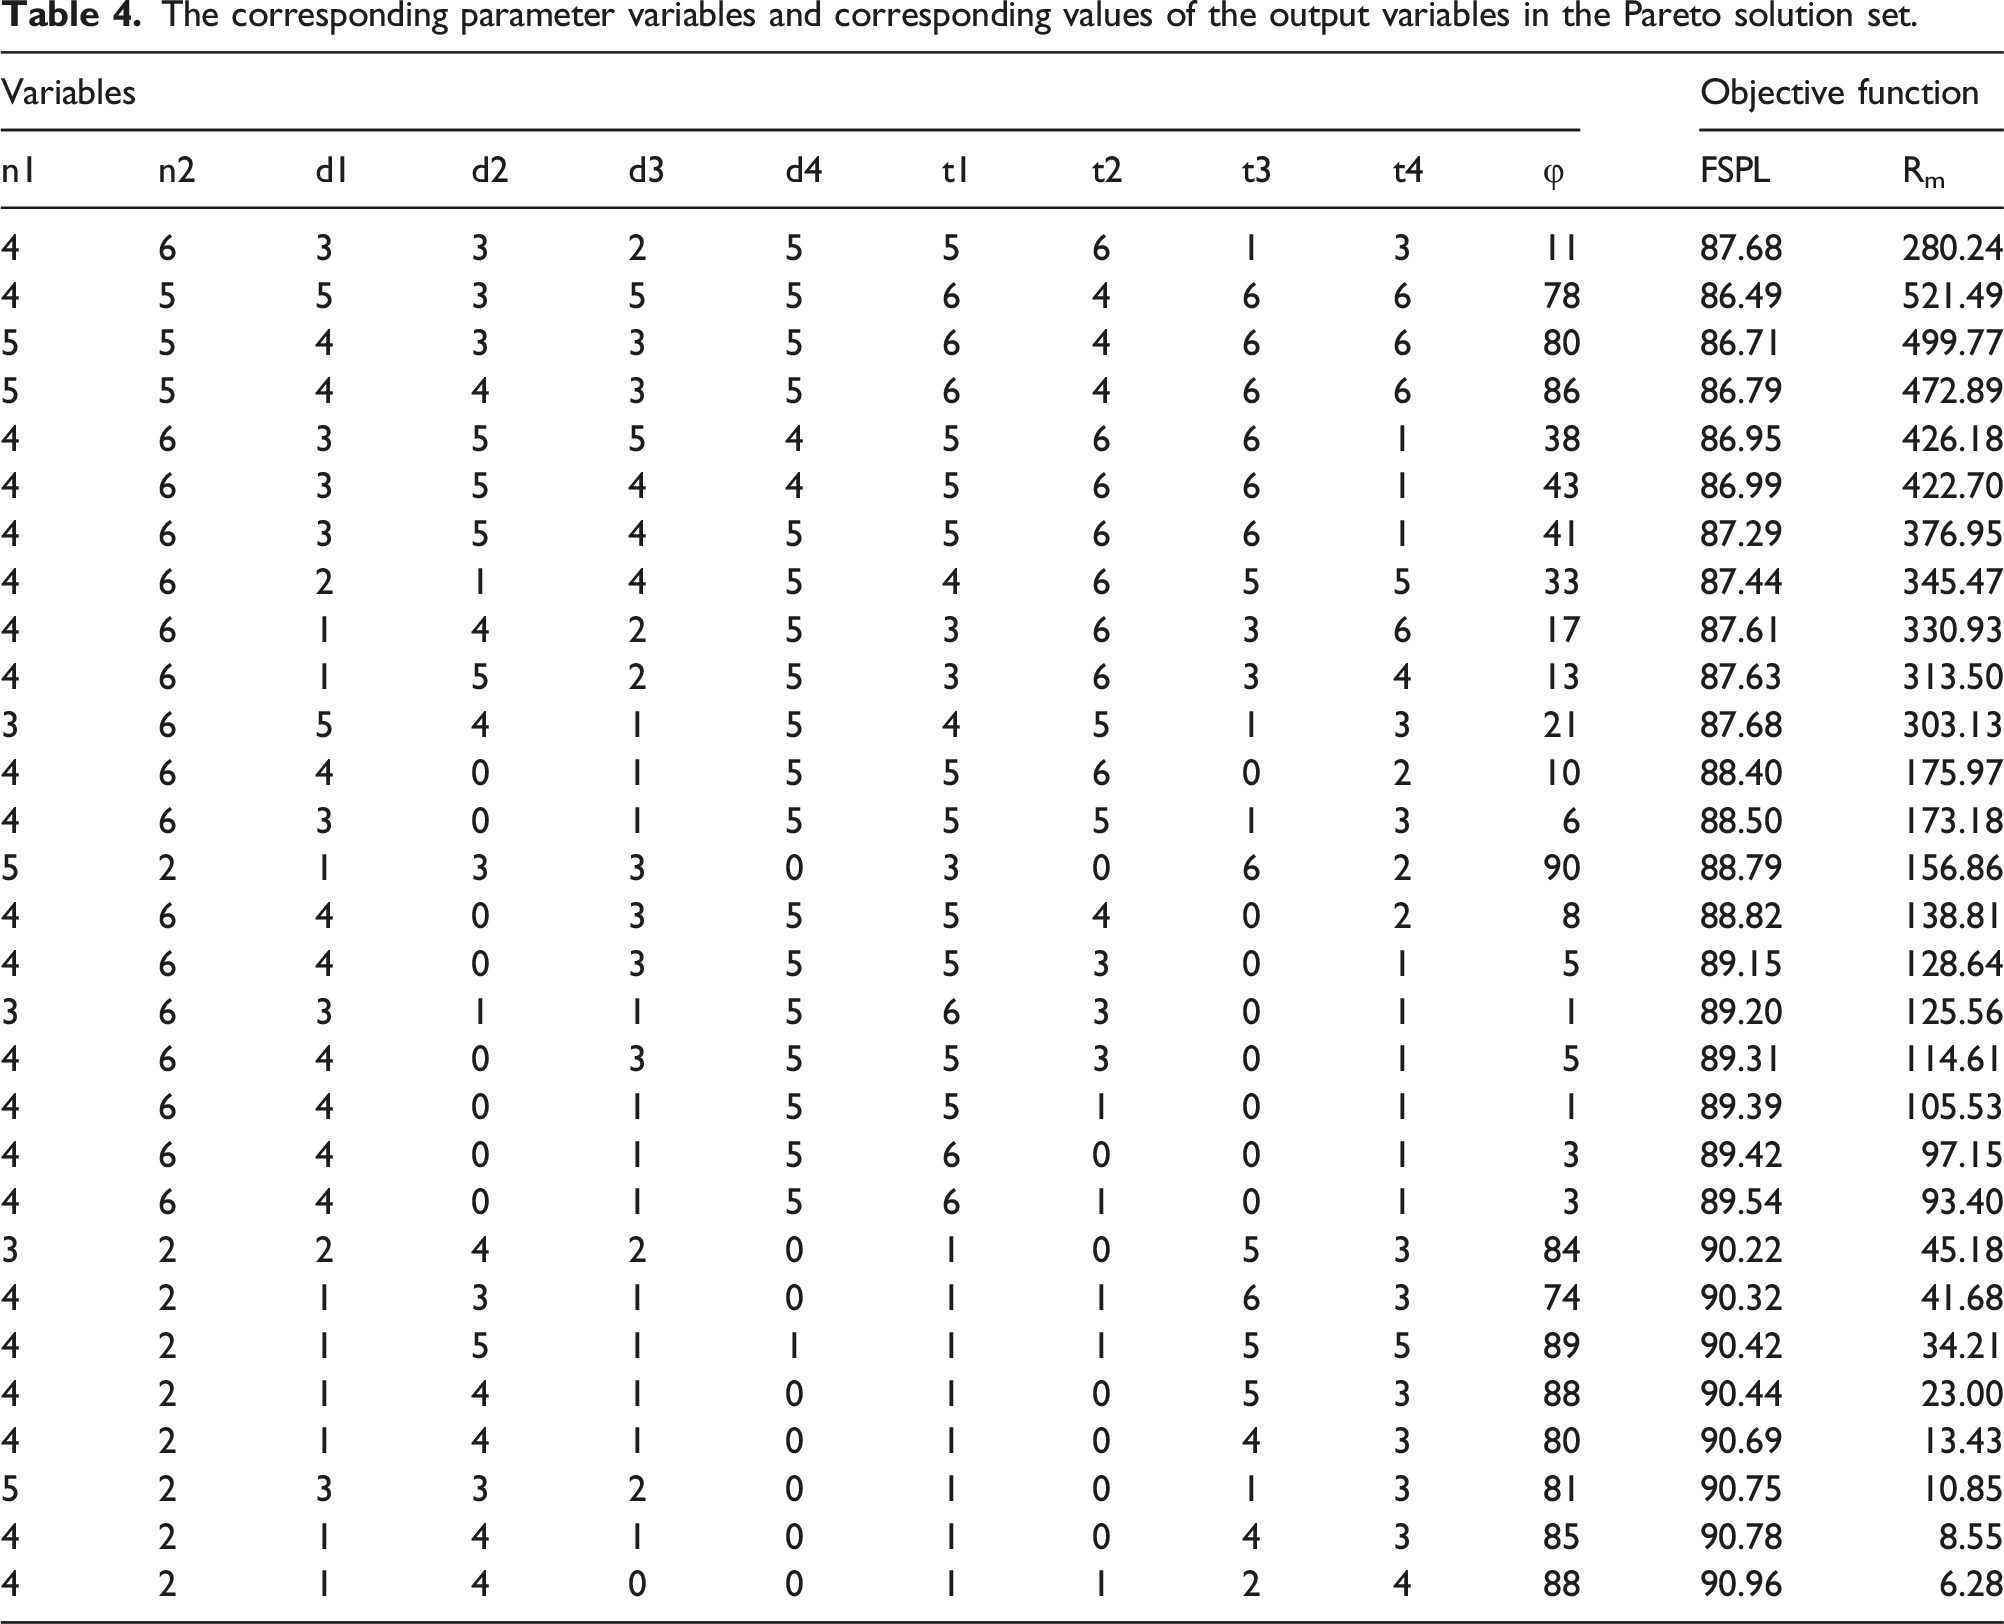
Statistical analysis shows that the results obtained by RSM correspond well with the experimental data. Therefore, the regression equation obtained by the response surface method can be used as the objective function of the subsequent multi-objective algorithm. NSGA-II is used to calculate the optimal solution set of PSPL and Rm. NSGA-II has been implemented in this study for a population size of 50, a crossover fraction of 0.8, a Pareto front population fraction of 0.35. Due to the conflict and competition among optimization objectives, multi-objective optimization has no unique solution, and its solution is a set of optimal non-inferior solutions. It is noteworthy that in the present study, NSGA-II has been run 20 times for the case of optimization, and corresponding first ranked Pareto fronts have been selected. Figure 17 shows the Pareto solution set for PSPL and Rm solved by NSGA-II. The coordinates of the points in the Pareto solution set in the figure are derived from Table 4. Table 4 shows the optimal values of the two objective functions and the corresponding values of the 11 parameters. The values of variables in the table are rounded results. Pareto solution set calculated with NSGA-II. The corresponding parameter variables and corresponding values of the output variables in the Pareto solution set.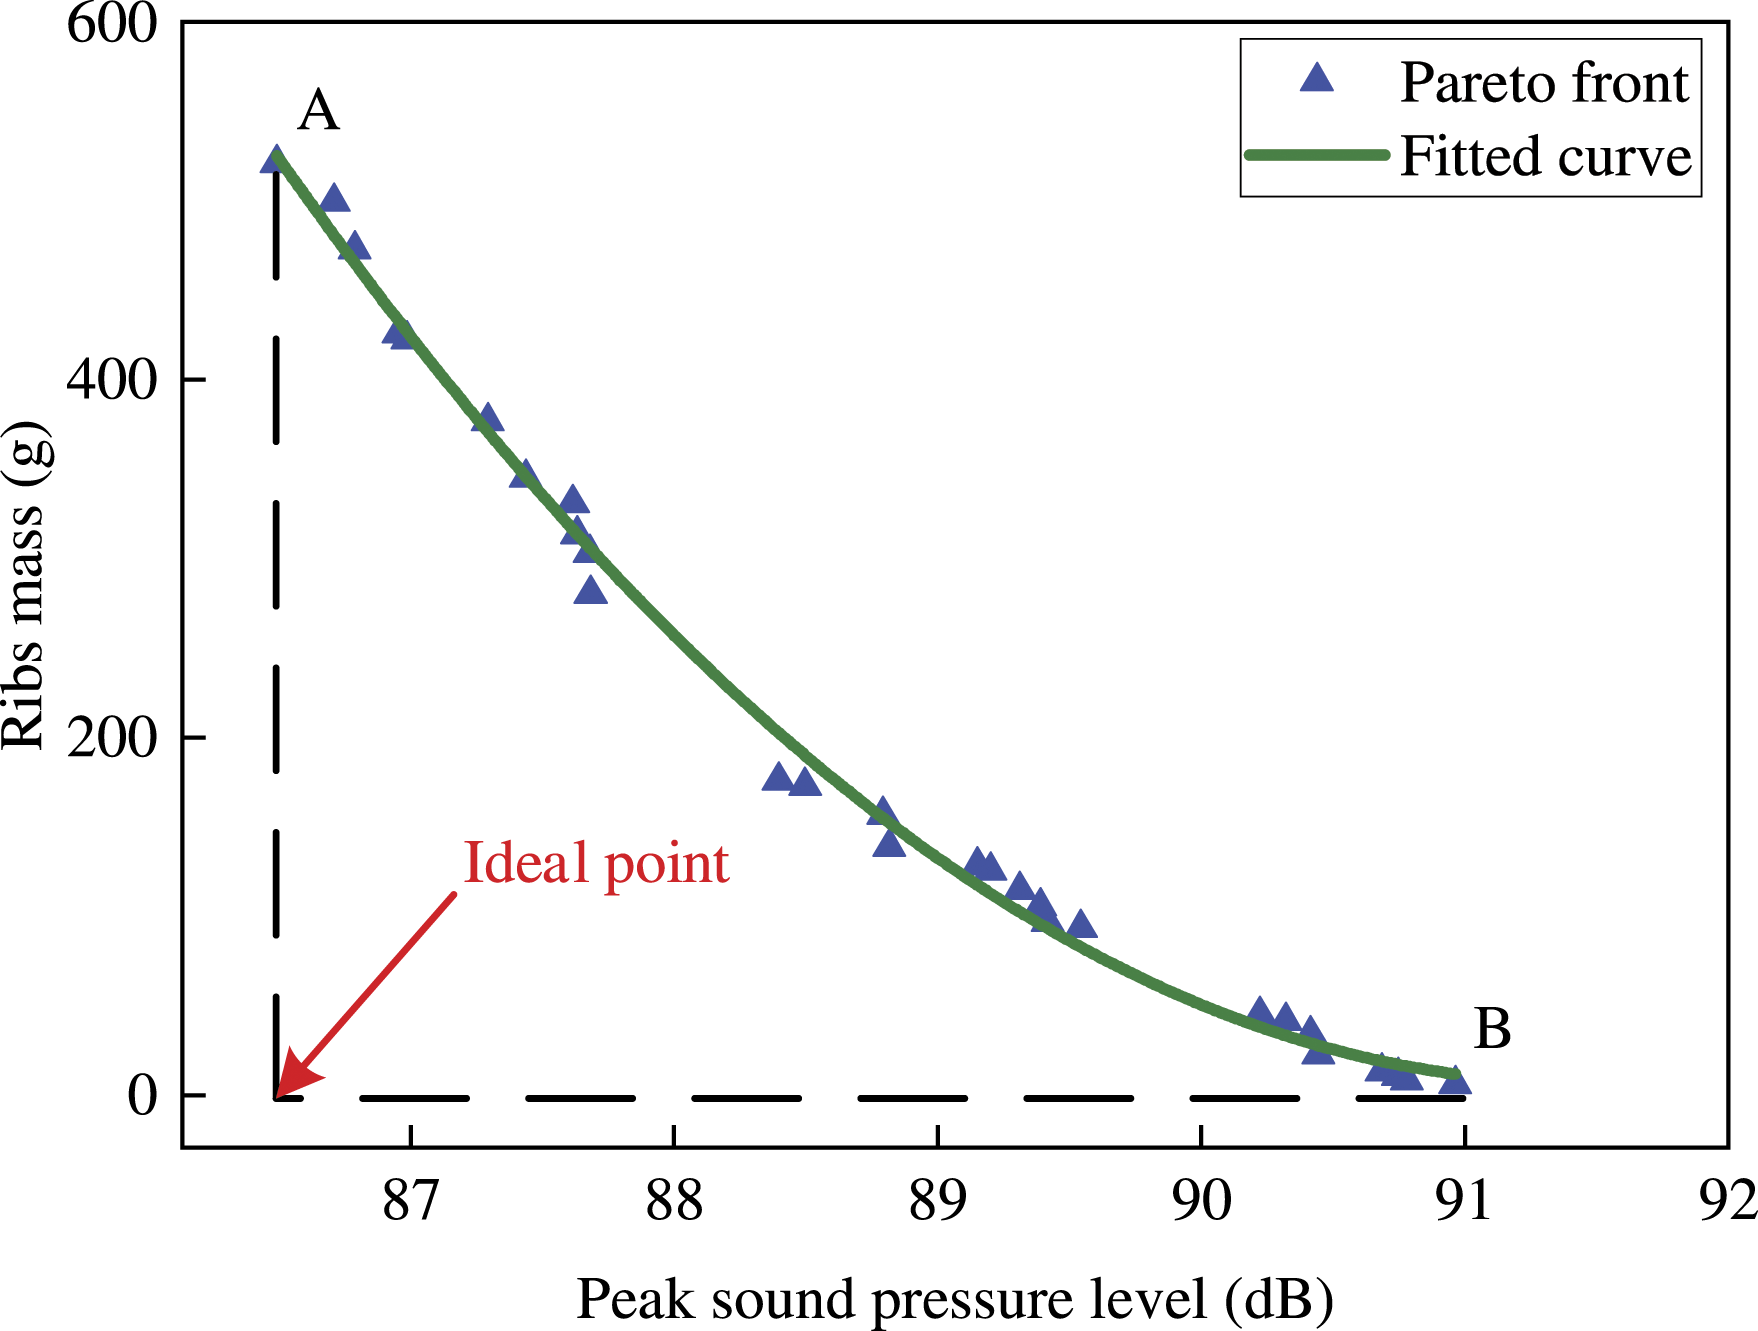

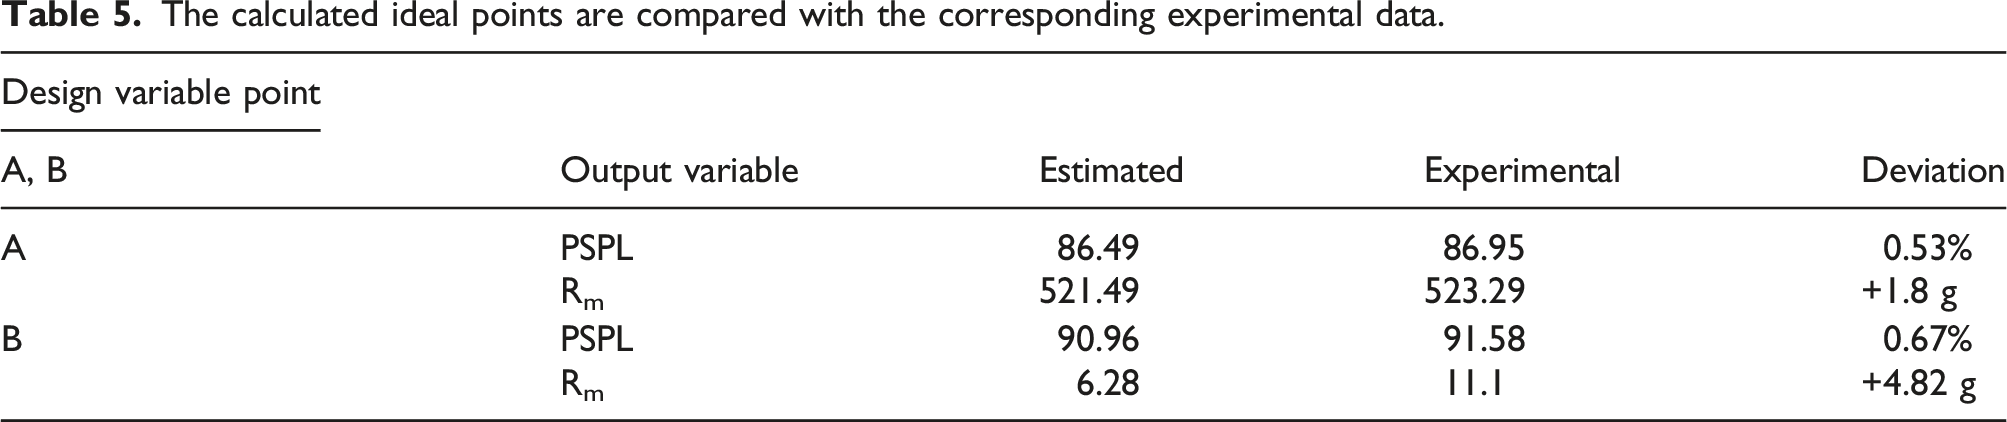
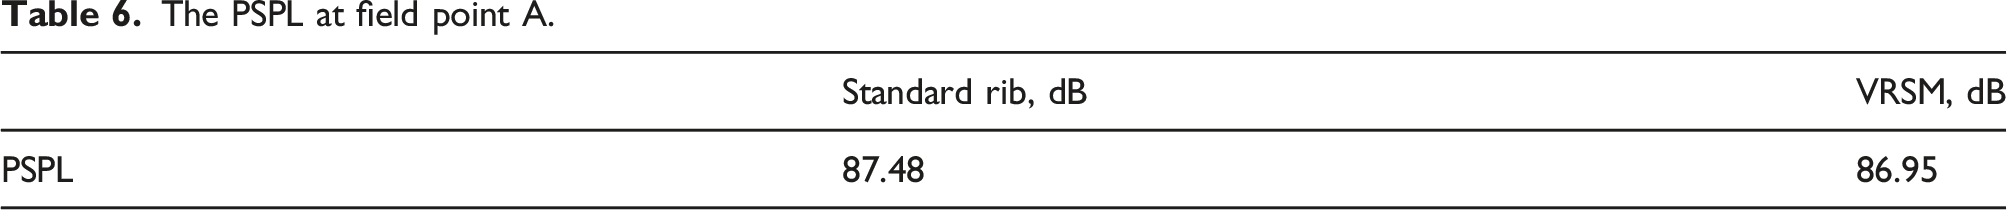
The calculated ideal points are compared with the corresponding experimental data.
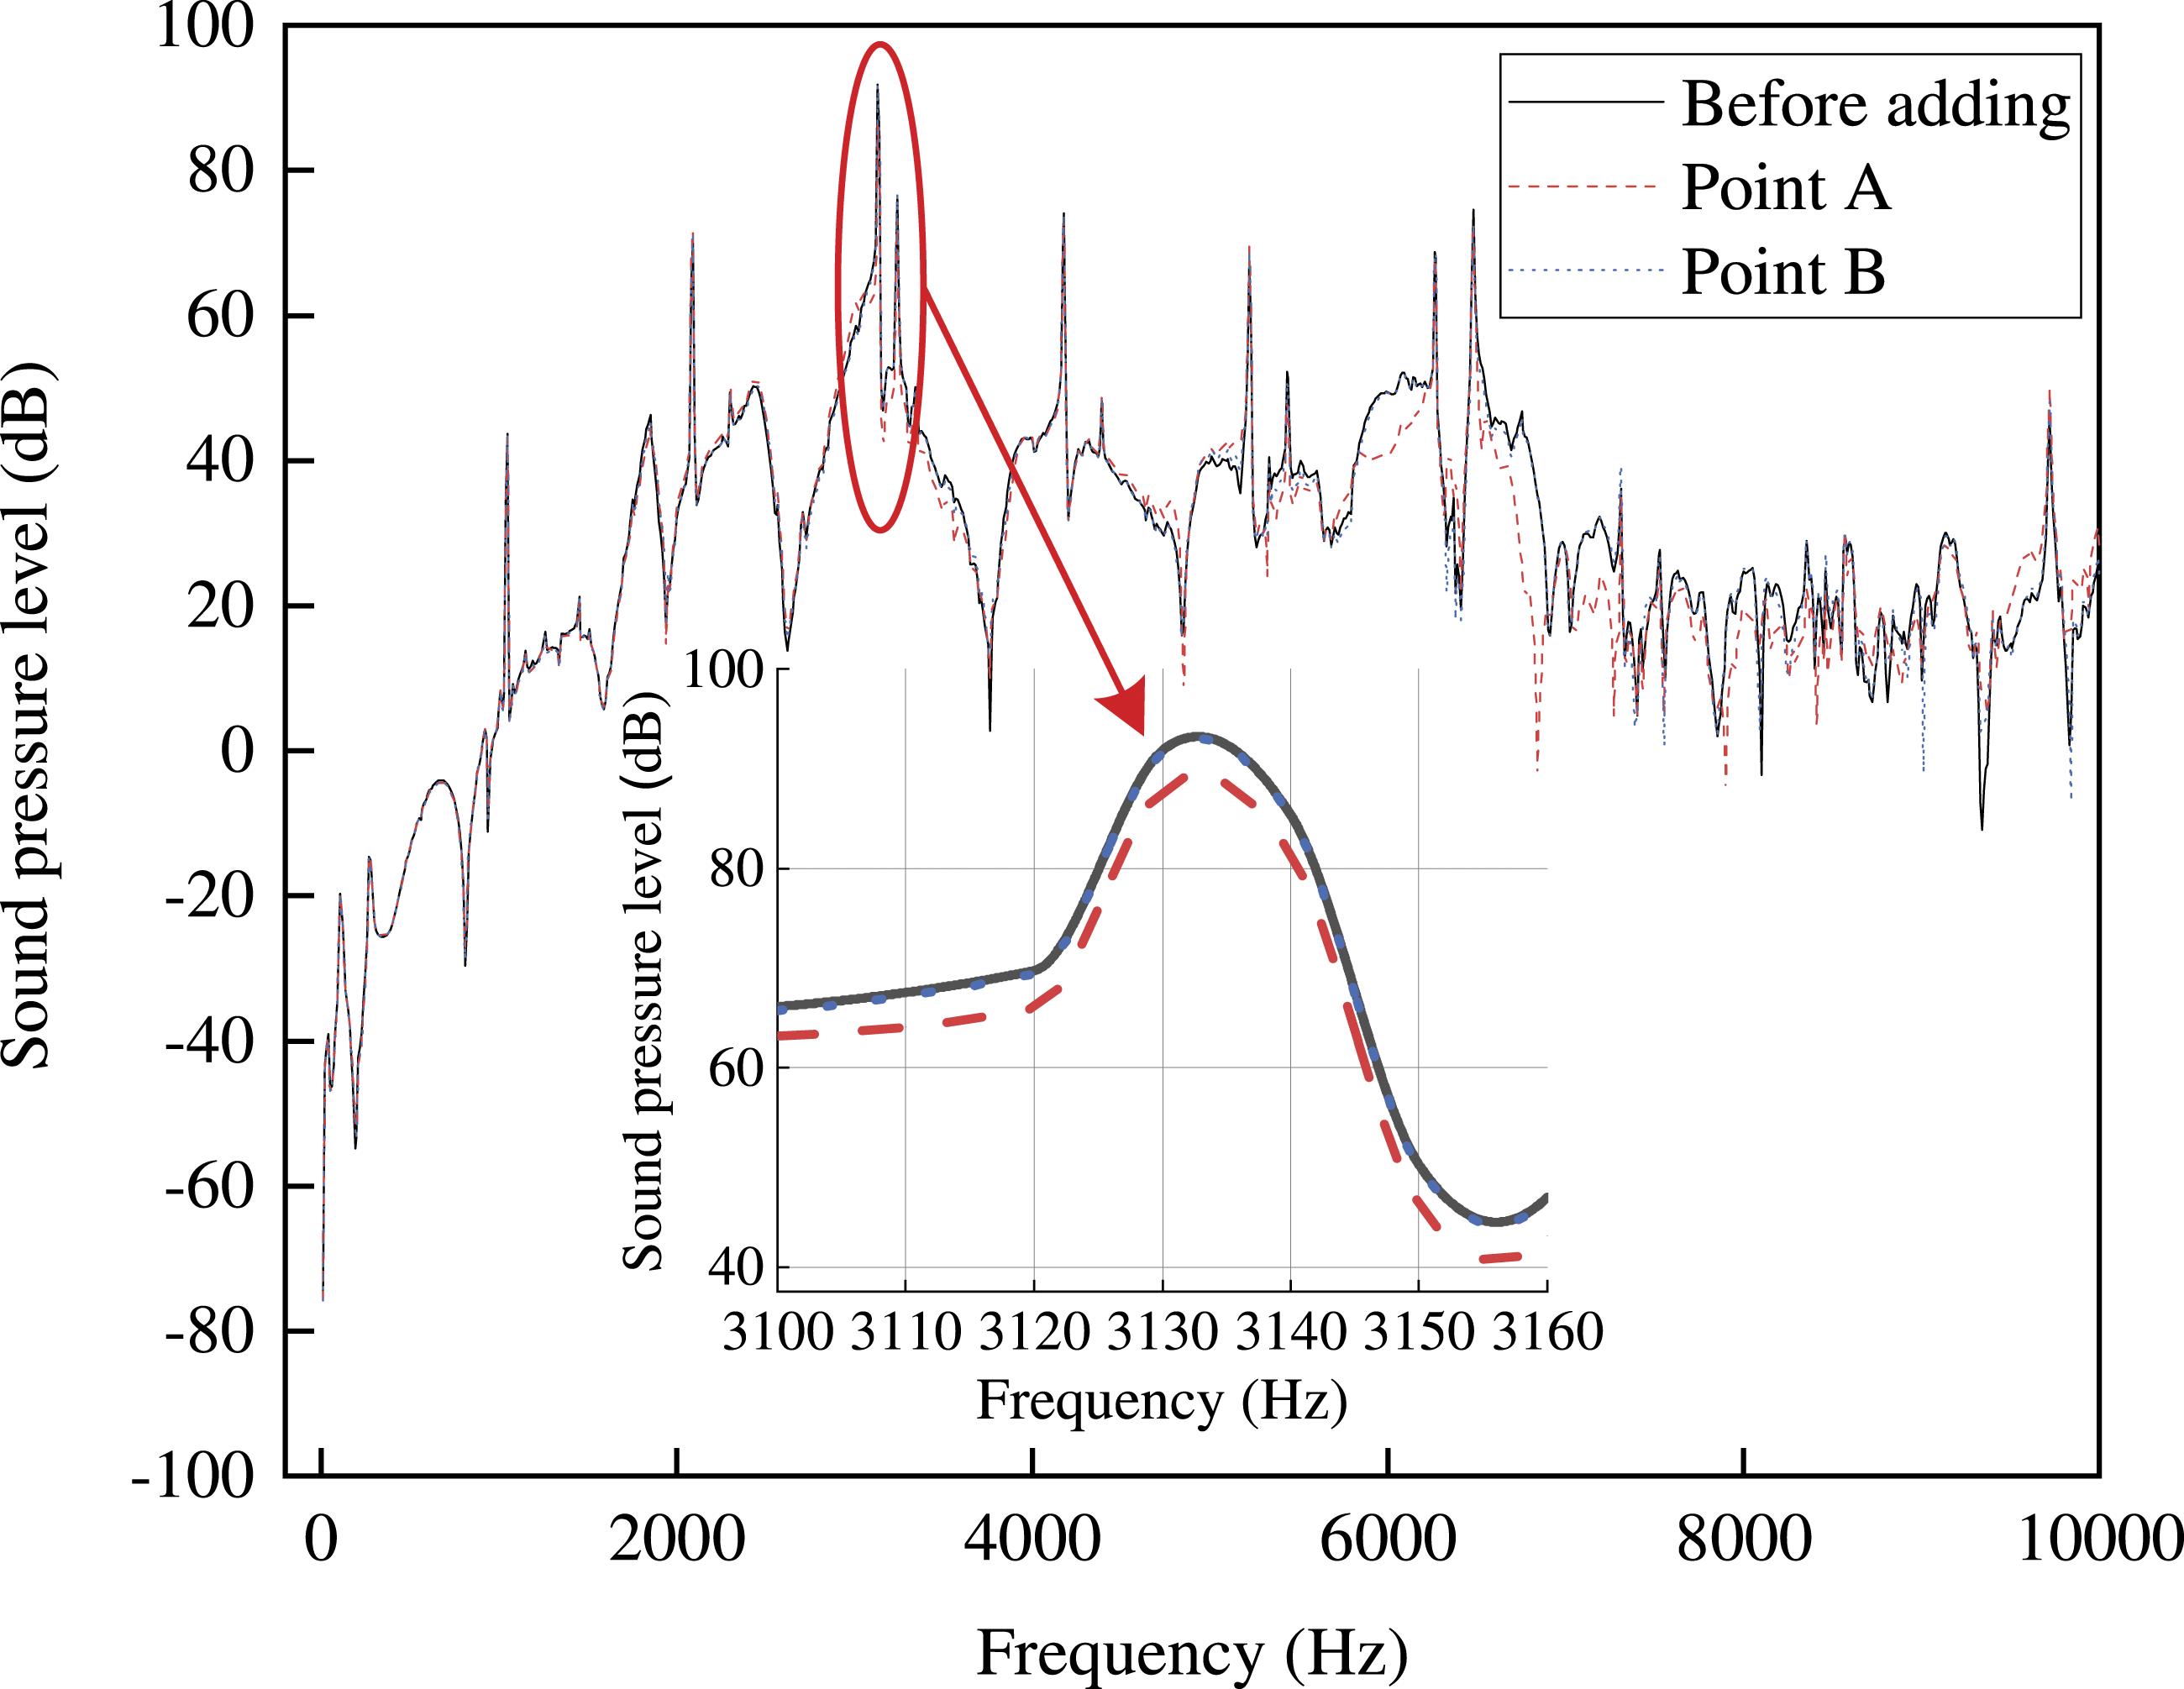
radiation noise spectrum of the original structure and each scheme model at field point A.
The PSPL at field point A.
Conclusions
In this paper, a two-stage gearbox radiated noise model is established, and the response surface method and NSGA-II can modify the variables in the VRSM to reduce the noise of the gearbox. The conclusions of this paper are as follows: 1. ATV and MAC improve the accuracy of the PACA method. The ATV-MAC-PACA method can also be used to add damping materials, shock absorbers, and other mechanisms. 2. The thickness of the ribs is the key variable for noise reduction. The PSPL after optimization is decreased by 4.88 dB at frequency of 3130 Hz. At the same mass, the noise reduction effect of VRSM is 12% higher than that of standard rib. 3. The VRSM should be determined according to different field points and different excitation frequencies. A disadvantage of this method is that acoustic contribution analysis must be performed again after changing the working conditions and considering the field points to achieve a good noise reduction effect.
Footnotes
Declaration of conflicting interests
The author(s) declared no potential conflicts of interest with respect to the research, authorship, and/or publication of this article.
Funding
The author(s) disclosed receipt of the following financial support for the research, authorship, and/or publication of this article: This study was funded by the Chinese National Natural Science Foundation (51665054), Natural Science Foundation of Xinjiang Province (No. 2021D01C050) and Xinjiang Province key research and development (2021B01003-1).
Appendix
Results of faced central composite design for establishing RS functions.
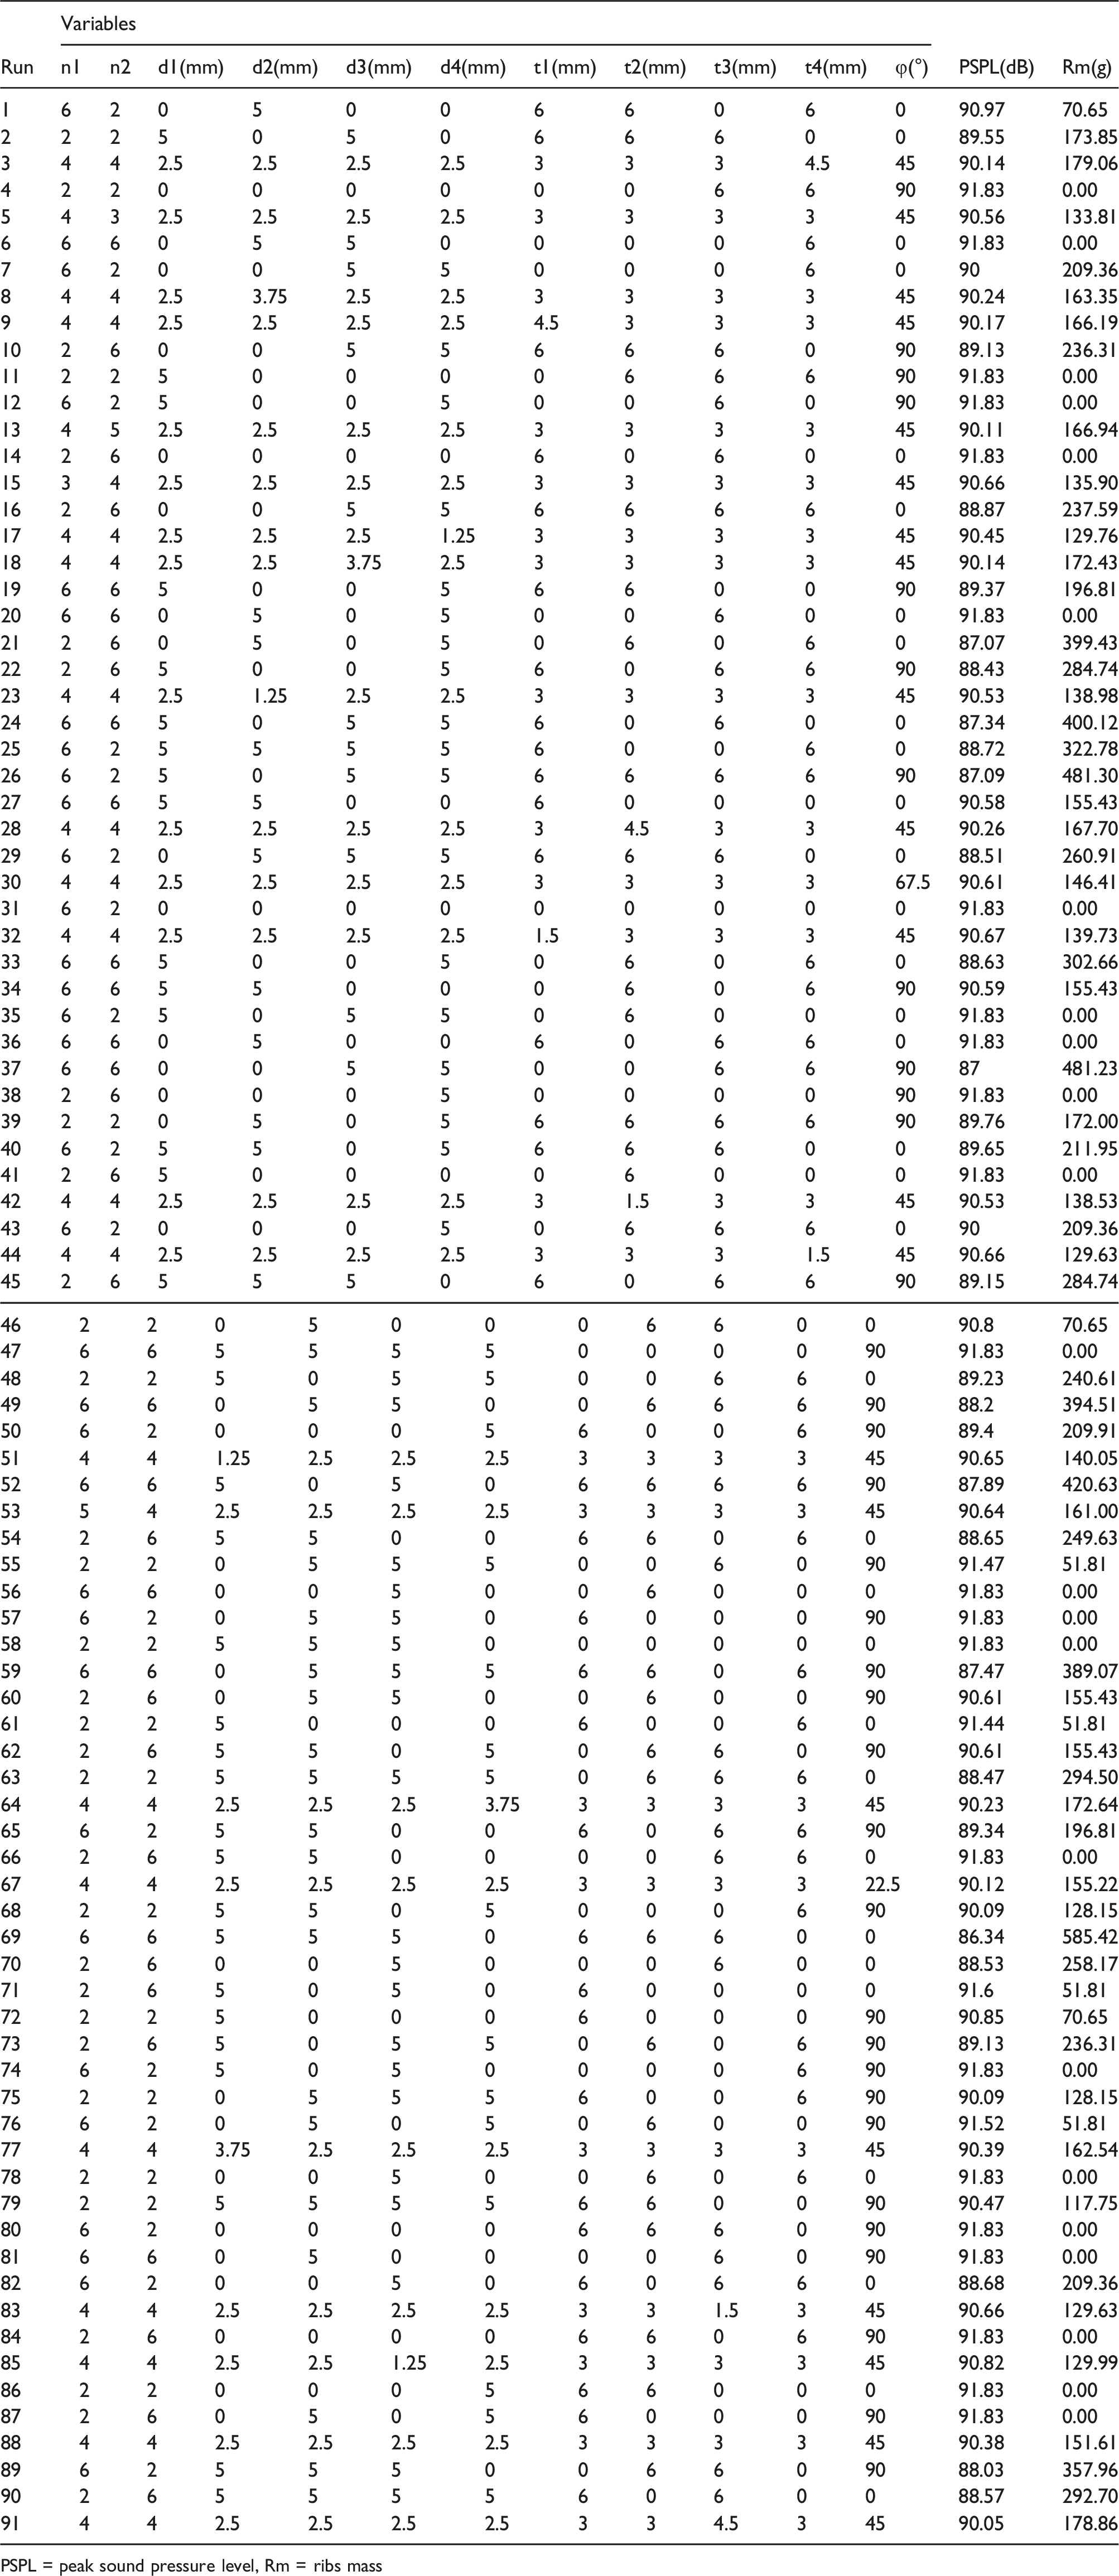
| Run | Variables | PSPL(dB) | Rm(g) | ||||||||||
|---|---|---|---|---|---|---|---|---|---|---|---|---|---|
| n1 | n2 | d1(mm) | d2(mm) | d3(mm) | d4(mm) | t1(mm) | t2(mm) | t3(mm) | t4(mm) | φ(°) | |||
| 1 | 6 | 2 | 0 | 5 | 0 | 0 | 6 | 6 | 0 | 6 | 0 | 90.97 | 70.65 |
| 2 | 2 | 2 | 5 | 0 | 5 | 0 | 6 | 6 | 6 | 0 | 0 | 89.55 | 173.85 |
| 3 | 4 | 4 | 2.5 | 2.5 | 2.5 | 2.5 | 3 | 3 | 3 | 4.5 | 45 | 90.14 | 179.06 |
| 4 | 2 | 2 | 0 | 0 | 0 | 0 | 0 | 0 | 6 | 6 | 90 | 91.83 | 0.00 |
| 5 | 4 | 3 | 2.5 | 2.5 | 2.5 | 2.5 | 3 | 3 | 3 | 3 | 45 | 90.56 | 133.81 |
| 6 | 6 | 6 | 0 | 5 | 5 | 0 | 0 | 0 | 0 | 6 | 0 | 91.83 | 0.00 |
| 7 | 6 | 2 | 0 | 0 | 5 | 5 | 0 | 0 | 0 | 6 | 0 | 90 | 209.36 |
| 8 | 4 | 4 | 2.5 | 3.75 | 2.5 | 2.5 | 3 | 3 | 3 | 3 | 45 | 90.24 | 163.35 |
| 9 | 4 | 4 | 2.5 | 2.5 | 2.5 | 2.5 | 4.5 | 3 | 3 | 3 | 45 | 90.17 | 166.19 |
| 10 | 2 | 6 | 0 | 0 | 5 | 5 | 6 | 6 | 6 | 0 | 90 | 89.13 | 236.31 |
| 11 | 2 | 2 | 5 | 0 | 0 | 0 | 0 | 6 | 6 | 6 | 90 | 91.83 | 0.00 |
| 12 | 6 | 2 | 5 | 0 | 0 | 5 | 0 | 0 | 6 | 0 | 90 | 91.83 | 0.00 |
| 13 | 4 | 5 | 2.5 | 2.5 | 2.5 | 2.5 | 3 | 3 | 3 | 3 | 45 | 90.11 | 166.94 |
| 14 | 2 | 6 | 0 | 0 | 0 | 0 | 6 | 0 | 6 | 0 | 0 | 91.83 | 0.00 |
| 15 | 3 | 4 | 2.5 | 2.5 | 2.5 | 2.5 | 3 | 3 | 3 | 3 | 45 | 90.66 | 135.90 |
| 16 | 2 | 6 | 0 | 0 | 5 | 5 | 6 | 6 | 6 | 6 | 0 | 88.87 | 237.59 |
| 17 | 4 | 4 | 2.5 | 2.5 | 2.5 | 1.25 | 3 | 3 | 3 | 3 | 45 | 90.45 | 129.76 |
| 18 | 4 | 4 | 2.5 | 2.5 | 3.75 | 2.5 | 3 | 3 | 3 | 3 | 45 | 90.14 | 172.43 |
| 19 | 6 | 6 | 5 | 0 | 0 | 5 | 6 | 6 | 0 | 0 | 90 | 89.37 | 196.81 |
| 20 | 6 | 6 | 0 | 5 | 0 | 5 | 0 | 0 | 6 | 0 | 0 | 91.83 | 0.00 |
| 21 | 2 | 6 | 0 | 5 | 0 | 5 | 0 | 6 | 0 | 6 | 0 | 87.07 | 399.43 |
| 22 | 2 | 6 | 5 | 0 | 0 | 5 | 6 | 0 | 6 | 6 | 90 | 88.43 | 284.74 |
| 23 | 4 | 4 | 2.5 | 1.25 | 2.5 | 2.5 | 3 | 3 | 3 | 3 | 45 | 90.53 | 138.98 |
| 24 | 6 | 6 | 5 | 0 | 5 | 5 | 6 | 0 | 6 | 0 | 0 | 87.34 | 400.12 |
| 25 | 6 | 2 | 5 | 5 | 5 | 5 | 6 | 0 | 0 | 6 | 0 | 88.72 | 322.78 |
| 26 | 6 | 2 | 5 | 0 | 5 | 5 | 6 | 6 | 6 | 6 | 90 | 87.09 | 481.30 |
| 27 | 6 | 6 | 5 | 5 | 0 | 0 | 6 | 0 | 0 | 0 | 0 | 90.58 | 155.43 |
| 28 | 4 | 4 | 2.5 | 2.5 | 2.5 | 2.5 | 3 | 4.5 | 3 | 3 | 45 | 90.26 | 167.70 |
| 29 | 6 | 2 | 0 | 5 | 5 | 5 | 6 | 6 | 6 | 0 | 0 | 88.51 | 260.91 |
| 30 | 4 | 4 | 2.5 | 2.5 | 2.5 | 2.5 | 3 | 3 | 3 | 3 | 67.5 | 90.61 | 146.41 |
| 31 | 6 | 2 | 0 | 0 | 0 | 0 | 0 | 0 | 0 | 0 | 0 | 91.83 | 0.00 |
| 32 | 4 | 4 | 2.5 | 2.5 | 2.5 | 2.5 | 1.5 | 3 | 3 | 3 | 45 | 90.67 | 139.73 |
| 33 | 6 | 6 | 5 | 0 | 0 | 5 | 0 | 6 | 0 | 6 | 0 | 88.63 | 302.66 |
| 34 | 6 | 6 | 5 | 5 | 0 | 0 | 0 | 6 | 0 | 6 | 90 | 90.59 | 155.43 |
| 35 | 6 | 2 | 5 | 0 | 5 | 5 | 0 | 6 | 0 | 0 | 0 | 91.83 | 0.00 |
| 36 | 6 | 6 | 0 | 5 | 0 | 0 | 6 | 0 | 6 | 6 | 0 | 91.83 | 0.00 |
| 37 | 6 | 6 | 0 | 0 | 5 | 5 | 0 | 0 | 6 | 6 | 90 | 87 | 481.23 |
| 38 | 2 | 6 | 0 | 0 | 0 | 5 | 0 | 0 | 0 | 0 | 90 | 91.83 | 0.00 |
| 39 | 2 | 2 | 0 | 5 | 0 | 5 | 6 | 6 | 6 | 6 | 90 | 89.76 | 172.00 |
| 40 | 6 | 2 | 5 | 5 | 0 | 5 | 6 | 6 | 6 | 0 | 0 | 89.65 | 211.95 |
| 41 | 2 | 6 | 5 | 0 | 0 | 0 | 0 | 6 | 0 | 0 | 0 | 91.83 | 0.00 |
| 42 | 4 | 4 | 2.5 | 2.5 | 2.5 | 2.5 | 3 | 1.5 | 3 | 3 | 45 | 90.53 | 138.53 |
| 43 | 6 | 2 | 0 | 0 | 0 | 5 | 0 | 6 | 6 | 6 | 0 | 90 | 209.36 |
| 44 | 4 | 4 | 2.5 | 2.5 | 2.5 | 2.5 | 3 | 3 | 3 | 1.5 | 45 | 90.66 | 129.63 |
| 45 | 2 | 6 | 5 | 5 | 5 | 0 | 6 | 0 | 6 | 6 | 90 | 89.15 | 284.74 |
| 46 | 2 | 2 | 0 | 5 | 0 | 0 | 0 | 6 | 6 | 0 | 0 | 90.8 | 70.65 |
| 47 | 6 | 6 | 5 | 5 | 5 | 5 | 0 | 0 | 0 | 0 | 90 | 91.83 | 0.00 |
| 48 | 2 | 2 | 5 | 0 | 5 | 5 | 0 | 0 | 6 | 6 | 0 | 89.23 | 240.61 |
| 49 | 6 | 6 | 0 | 5 | 5 | 0 | 0 | 6 | 6 | 6 | 90 | 88.2 | 394.51 |
| 50 | 6 | 2 | 0 | 0 | 0 | 5 | 6 | 0 | 0 | 6 | 90 | 89.4 | 209.91 |
| 51 | 4 | 4 | 1.25 | 2.5 | 2.5 | 2.5 | 3 | 3 | 3 | 3 | 45 | 90.65 | 140.05 |
| 52 | 6 | 6 | 5 | 0 | 5 | 0 | 6 | 6 | 6 | 6 | 90 | 87.89 | 420.63 |
| 53 | 5 | 4 | 2.5 | 2.5 | 2.5 | 2.5 | 3 | 3 | 3 | 3 | 45 | 90.64 | 161.00 |
| 54 | 2 | 6 | 5 | 5 | 0 | 0 | 6 | 6 | 0 | 6 | 0 | 88.65 | 249.63 |
| 55 | 2 | 2 | 0 | 5 | 5 | 5 | 0 | 0 | 6 | 0 | 90 | 91.47 | 51.81 |
| 56 | 6 | 6 | 0 | 0 | 5 | 0 | 0 | 6 | 0 | 0 | 0 | 91.83 | 0.00 |
| 57 | 6 | 2 | 0 | 5 | 5 | 0 | 6 | 0 | 0 | 0 | 90 | 91.83 | 0.00 |
| 58 | 2 | 2 | 5 | 5 | 5 | 0 | 0 | 0 | 0 | 0 | 0 | 91.83 | 0.00 |
| 59 | 6 | 6 | 0 | 5 | 5 | 5 | 6 | 6 | 0 | 6 | 90 | 87.47 | 389.07 |
| 60 | 2 | 6 | 0 | 5 | 5 | 0 | 0 | 6 | 0 | 0 | 90 | 90.61 | 155.43 |
| 61 | 2 | 2 | 5 | 0 | 0 | 0 | 6 | 0 | 0 | 6 | 0 | 91.44 | 51.81 |
| 62 | 2 | 6 | 5 | 5 | 0 | 5 | 0 | 6 | 6 | 0 | 90 | 90.61 | 155.43 |
| 63 | 2 | 2 | 5 | 5 | 5 | 5 | 0 | 6 | 6 | 6 | 0 | 88.47 | 294.50 |
| 64 | 4 | 4 | 2.5 | 2.5 | 2.5 | 3.75 | 3 | 3 | 3 | 3 | 45 | 90.23 | 172.64 |
| 65 | 6 | 2 | 5 | 5 | 0 | 0 | 6 | 0 | 6 | 6 | 90 | 89.34 | 196.81 |
| 66 | 2 | 6 | 5 | 5 | 0 | 0 | 0 | 0 | 6 | 6 | 0 | 91.83 | 0.00 |
| 67 | 4 | 4 | 2.5 | 2.5 | 2.5 | 2.5 | 3 | 3 | 3 | 3 | 22.5 | 90.12 | 155.22 |
| 68 | 2 | 2 | 5 | 5 | 0 | 5 | 0 | 0 | 0 | 6 | 90 | 90.09 | 128.15 |
| 69 | 6 | 6 | 5 | 5 | 5 | 0 | 6 | 6 | 6 | 0 | 0 | 86.34 | 585.42 |
| 70 | 2 | 6 | 0 | 0 | 5 | 0 | 0 | 0 | 6 | 0 | 0 | 88.53 | 258.17 |
| 71 | 2 | 6 | 5 | 0 | 5 | 0 | 6 | 0 | 0 | 0 | 0 | 91.6 | 51.81 |
| 72 | 2 | 2 | 5 | 0 | 0 | 0 | 6 | 0 | 0 | 0 | 90 | 90.85 | 70.65 |
| 73 | 2 | 6 | 5 | 0 | 5 | 5 | 0 | 6 | 0 | 6 | 90 | 89.13 | 236.31 |
| 74 | 6 | 2 | 5 | 0 | 5 | 0 | 0 | 0 | 0 | 6 | 90 | 91.83 | 0.00 |
| 75 | 2 | 2 | 0 | 5 | 5 | 5 | 6 | 0 | 0 | 6 | 90 | 90.09 | 128.15 |
| 76 | 6 | 2 | 0 | 5 | 0 | 5 | 0 | 6 | 0 | 0 | 90 | 91.52 | 51.81 |
| 77 | 4 | 4 | 3.75 | 2.5 | 2.5 | 2.5 | 3 | 3 | 3 | 3 | 45 | 90.39 | 162.54 |
| 78 | 2 | 2 | 0 | 0 | 5 | 0 | 0 | 6 | 0 | 6 | 0 | 91.83 | 0.00 |
| 79 | 2 | 2 | 5 | 5 | 5 | 5 | 6 | 6 | 0 | 0 | 90 | 90.47 | 117.75 |
| 80 | 6 | 2 | 0 | 0 | 0 | 0 | 6 | 6 | 6 | 0 | 90 | 91.83 | 0.00 |
| 81 | 6 | 6 | 0 | 5 | 0 | 0 | 0 | 0 | 6 | 0 | 90 | 91.83 | 0.00 |
| 82 | 6 | 2 | 0 | 0 | 5 | 0 | 6 | 0 | 6 | 6 | 0 | 88.68 | 209.36 |
| 83 | 4 | 4 | 2.5 | 2.5 | 2.5 | 2.5 | 3 | 3 | 1.5 | 3 | 45 | 90.66 | 129.63 |
| 84 | 2 | 6 | 0 | 0 | 0 | 0 | 6 | 6 | 0 | 6 | 90 | 91.83 | 0.00 |
| 85 | 4 | 4 | 2.5 | 2.5 | 1.25 | 2.5 | 3 | 3 | 3 | 3 | 45 | 90.82 | 129.99 |
| 86 | 2 | 2 | 0 | 0 | 0 | 5 | 6 | 6 | 0 | 0 | 0 | 91.83 | 0.00 |
| 87 | 2 | 6 | 0 | 5 | 0 | 5 | 6 | 0 | 0 | 0 | 90 | 91.83 | 0.00 |
| 88 | 4 | 4 | 2.5 | 2.5 | 2.5 | 2.5 | 3 | 3 | 3 | 3 | 45 | 90.38 | 151.61 |
| 89 | 6 | 2 | 5 | 5 | 5 | 0 | 0 | 6 | 6 | 0 | 90 | 88.03 | 357.96 |
| 90 | 2 | 6 | 5 | 5 | 5 | 5 | 6 | 0 | 6 | 0 | 0 | 88.57 | 292.70 |
| 91 | 4 | 4 | 2.5 | 2.5 | 2.5 | 2.5 | 3 | 3 | 4.5 | 3 | 45 | 90.05 | 178.86 |
PSPL = peak sound pressure level, Rm = ribs mass