
Abstract
The selection of optimal welding parameters in any welding process significantly improves the quality, production rate, and cost of a component. The weld bead characteristics such as bead width, depth of penetration, and heat-affected zone are the prominent factors for evaluating the performance of a welded joint. The work presents a novel evolutionary multi-objective optimization approach to derive the optimal laser welding conditions for the weld bead geometrical parameters. The welding experiments were conducted with the consideration of pulse frequency, pulse width, welding speed, and pulse energy as the process-control variables to evaluate the weld bead characteristics. Empirical models for the bead characteristics were developed in terms of the input variables using response surface methodology. The individual and interactive effects of the variables on the responses were also analyzed. As the influence of control variables on the bead characteristics is conflicting in nature, the problem is formulated as a multi-objective optimization problem to simultaneously optimize the output parameters. The aim is to simultaneously minimize the bead width, maximize the depth of penetration, and minimize the heat-affected zone. An efficient evolutionary algorithm called non-dominated sorting genetic algorithm-II was applied to derive the set of Pareto-optimal solutions. The derived optimal process responses were confirmed with the experimental values. The proposed integrated methodology can be applied to any welding process to automate the process conditions in computer-integrated manufacturing environment.
Keywords
Introduction
Laser beam welding (LBW) is now gaining much attention in joining variety of materials in the aerospace, naval, and automobile industries. It has the special advantages of high speed, precision, and low heat distortion when compared to the conventional welding processes. 1
The principle of LBW is schematically shown in Figure 1, in which a high energy laser beam is used to melt and vaporize material. The weld gets formed as the concentrated beam rapidly generates the heat required for the coalescence of the surfaces of the material to be welded.
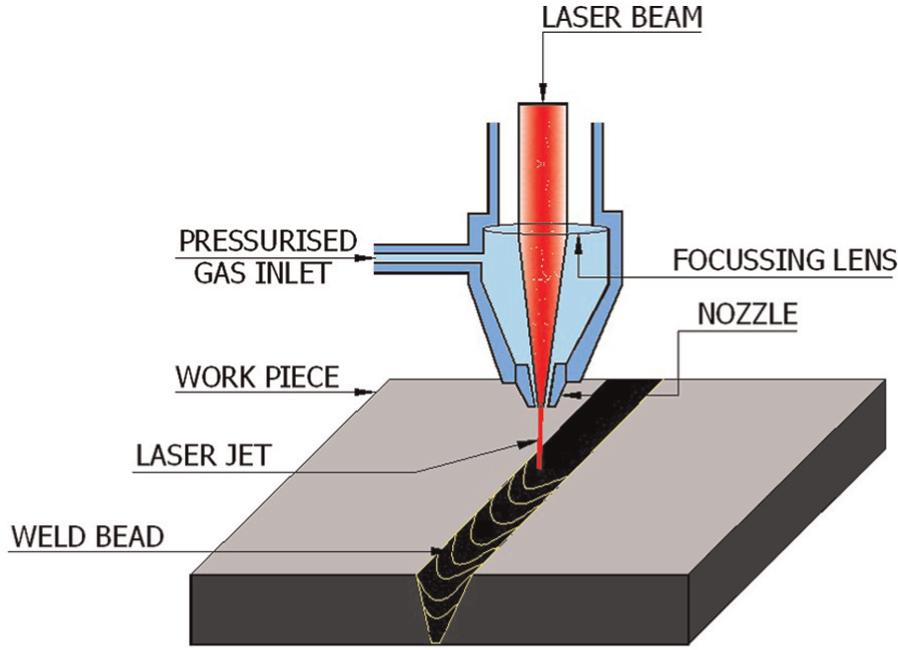
Principle of laser welding.
The Nd:YAG lasers in today’s modern manufacturing industries have the flexibility to control the thermal input which facilitates controlling of various weld parameters such as bead penetration, melt pool shape and size, keyhole formation, and explosion ejection. 2 Owing to the better energy controlling, Nd:YAG laser welding is a complex process controlled by a large number of process parameters such as pulse shaping, pulse energy, pulse duration, pulse frequency, peak power, focusing position, gas flow rate, and welding speed.
In a welding process, the selection of process variables is traditionally carried out by process planners either on the basis of their experience on the shop floor or trial-and-error approach. However, the parameters selected by such practice may not produce the optimal bead size. Therefore, determining optimal welding variables based on mathematical models has been given importance.
In any welding process, bead geometrical parameters play a vital role in deciding the mechanical properties, residual stresses, and distortions of a welded joint. The bead cross-sectional area together with its height and width affects the total shrinkage, which determines largely the residual stresses and thus the distortion. 3 Weld cracking is also related to the profile of the bead. Moreover, a considerable amount of micro-structural change occurs in the welded zone. The size of the grains in the welded zone is generally found to be larger than that of the base metal. Owing to the above factors, the mechanical properties of welded structure are dependent on the size and shape of the weldment. 4
In this work, the three prominent bead geometrical parameters such as bead width, bead penetration, and heat-affected zone (HAZ) have been considered for investigation and are depicted in Figure 2. As these parameters are affected by the process-control variables, the mathematical models for the chosen bead geometrical parameters are developed in terms of the welding control variables.
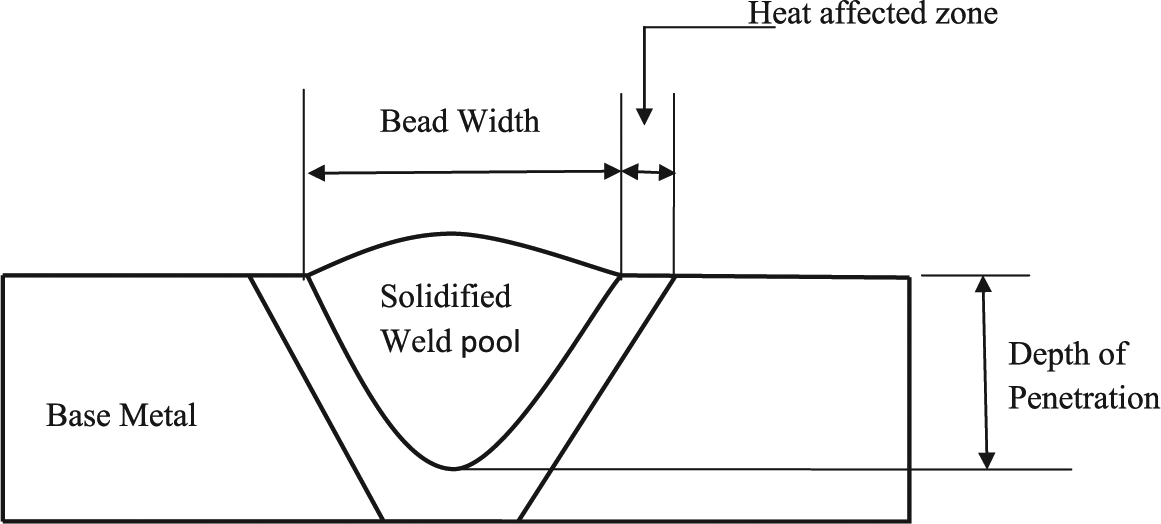
Schematic diagram of bead geometrical parameters.
The relationship between the welding variables and the bead geometry in a welding process is complex because of the number of variables involved and the non-linear interrelationships among the variables. Some of the prominent works found in the literature are as follows.
Kim et al. 5 developed an intelligent system for gas metal arc (GMA) welding processes using MATLAB/Simulink software. The mathematical models were derived based on multiple regressions and a neural network. In the work done by Gunaraj and Murugan, 6 the main and interaction effects of the process-control variables on the bead geometry were determined quantitatively and represented graphically for submerged arc welding of structural steel (IS: 2062). Casalino and Memola Capece Minutolo 7 predicted the welding efficiency and the weld quality by means of an artificial neural network coupled with fuzzy logic in which weld quality was specified in terms of weld crown and depth. In the work carried out by Datta et al., 8 an attempt was made to solve the correlated multiple criteria optimization problem of submerged arc welding. The target was to search for an optimal process environment, capable of producing desired bead geometry parameters of the weldment. Lee and Rhee 9 ascertained the optimal process parameters of GMA welding for getting the desired back-bead in butt welding by constructing a regression equation. In the work done by Dey et al., 4 the bead-on-plate welds were carried out on austenitic stainless steel plates using an electron beam welding machine. Weldment area was minimized after satisfying the condition of maximum bead penetration. Genetic algorithm (GA) was applied to determine optimal weld bead geometry and the required process parameters. Korra et al. 10 found the optimal process parameters for activated tungsten inert gas (TIG) welding using the desirability approach in which the depth of penetration was maximized. The experiments were conducted based on the central composite design of response surface methodology (RSM). Zhao et al. 11 investigated the effect of the laser welding parameters, namely, laser power, welding speed, gap between the workpieces, and focal position on the weld bead geometrical parameters of weld depth, weld width, and surface concave of galvanized SAE1004 steel in a lap joint configuration. The RSM was used to develop models to predict the relationship between the processing parameters and the laser weld bead profile and identify the correct and optimal combination of the laser welding input variables to obtain superior weld joint. Kim and Lee 12 applied grey relational analysis to determine the optimal process conditions for ultimate tensile strength of the 6061-T6 Al weld joint in Nd:YAG laser–GMA hybrid welding. The Taguchi method of parameter design was used by Acherjee et al. 13 to find the optimal process parameters for maximum weld strength in laser transmission welding of acrylics. Tanco et al. 14 applied design of experiments (DOEs) to reduce the number of pores in a laser welding process. The shape geometry of the pulsed-laser powder deposit process was predicted by Mahapatra and Li 15 using artificial neural network.
The main findings of literature survey are as follows:
Although many works could be found on modeling of weld bead geometry, only a few works are on the optimization of bead geometry of a welding process.
Efforts were mainly focused on optimization of only single performance characteristic of weld bead geometry.
In the most of the works carried on the multi-response optimization, either the given objective functions were transformed into a single composite objective function or one bead characteristic was taken as the objective function and the remaining as the constraints.
To the best of the knowledge of the authors, no published work has been available in the literature on simultaneous multi-objective optimization of the bead geometrical parameters using the proposed methodology.
Methodology
The methodology adopted in this work is shown in Figure 3, in which RSM is integrated with an evolutionary multi-objective optimization algorithm. Since there is a large number of control parameters in the Nd:YAG laser welding process, evaluation of their effects based on the conventional single factor experiments on the weld bead geometry is highly expensive and time-consuming. Therefore, the plan of experimentation in this investigation is designed based on the DOEs to conduct the experiments systematically and economically. The most significant weld bead control variables of the Nd:YAG laser welding process such as pulse frequency, pulse width, welding speed, and pulse energy are taken into the consideration to predict the aforesaid weld bead characteristics. The empirical models for each response in terms of the process variables, based on the empirical data obtained using DOE, were developed using the RSM. Consequently, these models were used for optimization.
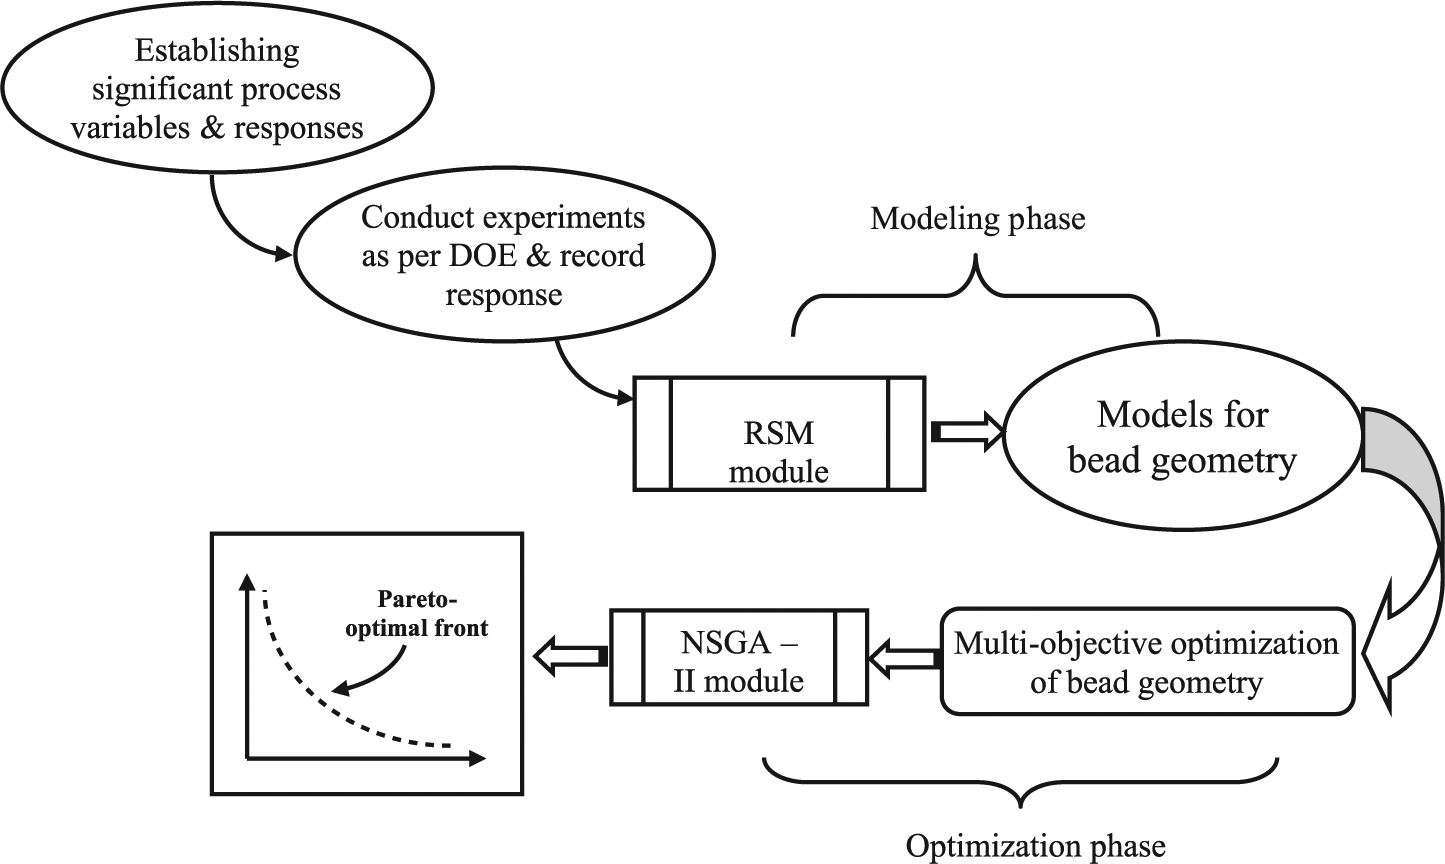
Proposed methodology.
Since the chosen weld bead characteristics are conflicting, the optimization problem was formulated as a multi-objective optimization problem with the objective of simultaneously maximizing depth of penetration, minimizing bead width, and minimizing HAZ simultaneously. An efficient multi-objective optimization algorithm, non-dominated sorting genetic algorithm-II (NSGA-II) was then simulated to derive the optimal sets of solutions. Although the proposed approach has been used for laser welding, it could be extended to any welding process and for any material.
With regard to the RSM, it is a collection of statistical and mathematical techniques used for a wide variety of modeling applications. RSM facilitates to design the experimental plan, to develop the mathematical models with best fits, to find the optimal set of experimental factors, and to represent the individual and interactive affects of the process variables on the responses which are under interest through two-dimensional (2D) and three-dimensional (3D) graphs.16,17 In the present investigation, the mathematical modeling and parametric analysis of the experimentally measured responses have been done using RSM. In general, most of the experimental data fit to quadratic models. The second-order model is used in this work to consider the non-linearity and the interactive effects of the variables. The model is represented by the following equation
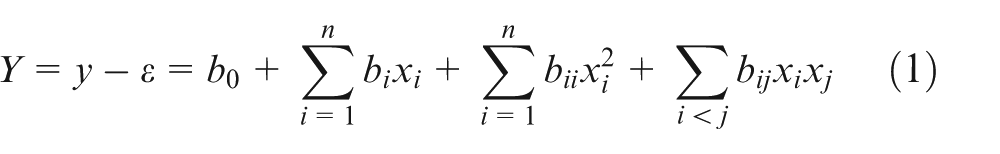
where Y and y are the estimated and measured responses, respectively, on the logarithmic scale; xi is the coded variable on the logarithmic scale of ith variable; n represents the number of variables; ε is a term of error; and b0, bi, bii, and bij are the parameters to be estimated using the method of least squares.
In this work, RSM was applied to the experimental data using the statistical software, Design-Expert Software®, 18 to develop the mathematical models and analyze the welding parameters for the responses and optimization was done by an efficient evolutionary algorithm.
Evolutionary algorithms have an excellent competency in exploring Pareto-optimal front for multi-objective optimization problems. This work involves the application of a fast and elitist multi-objective GA: NSGA-II proposed by Deb et al. 19 It is an efficient algorithm for generating the set of Pareto-optimal solutions for a wide search spaces. Basically, it works on GA operators of reproduction, crossover, and mutation. It has its superiority with non-dominance and elitism which reduces the computational complexity while exploring the Pareto-optimal set over its earlier version, NSGA, proposed by Deb. 20
The main framework of the algorithm is depicted in Figure 4. Its simulation begins with the creation of a parent population P of size N randomly. A child population Q of size N is created using the genetic operators. New population R of size 2N is formed by joining the elements of populations P and Q. Non-dominated sorting procedure is then applied on the newly created population R to sort and get the set of non-dominated individuals called non-dominated fronts. These fronts are ranked based on their non-dominance level. The elements in the non-dominated fronts are diverged with the operation of crowded comparison. A full iteration constitutes implementation of the three phases: reproduction, crossover, and mutation in the sequential order.
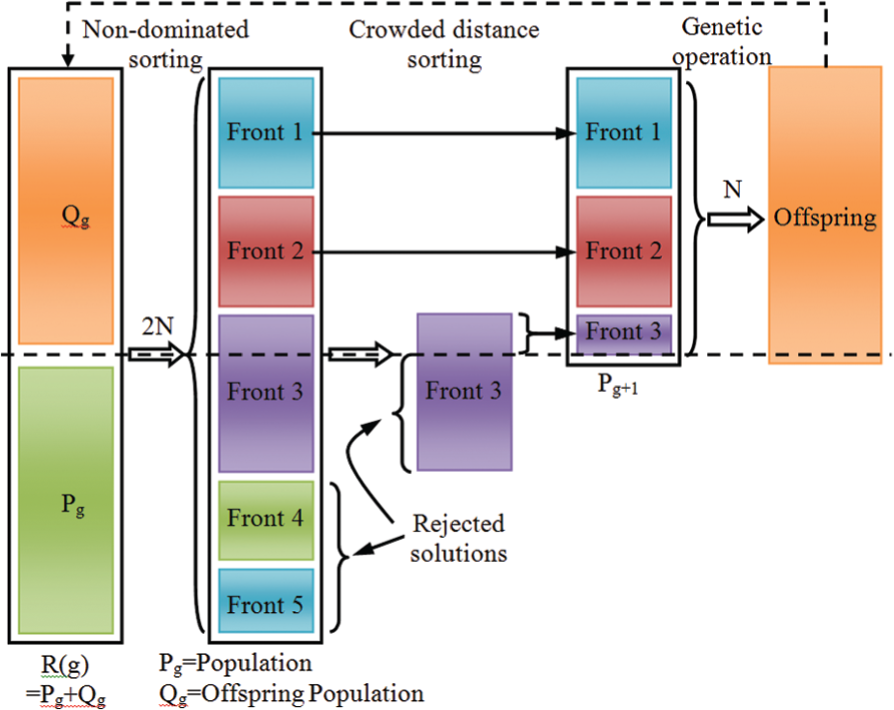
Main framework of NSGA-II algorithm.
Experimental methods and materials
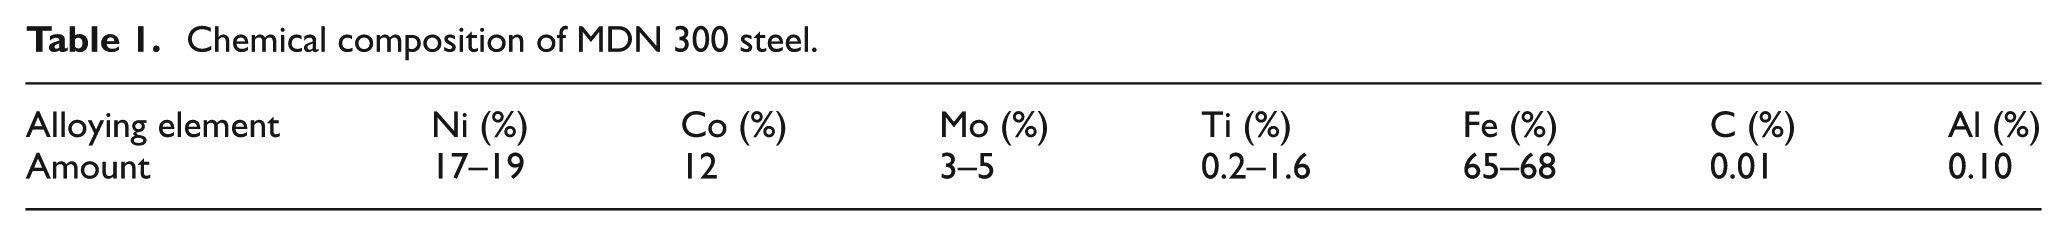
The experiment was carried out on MDN 300 maraging steel which is a widely used material for aerospace and tooling applications because of its mechanical properties like high strength, high fracture toughness, good weldability, and dimensional stability. Maraging steels differ from high-strength conventional steels in terms of the hardening mechanism. The hardening in Maraging steel does not involve carbon, but is achieved by a metallurgical reaction. The relatively soft body centered cubic martensite, which is formed upon cooling, is hardened by the precipitation of intermetallic compounds at temperatures of about 480 °C. 21 In this work, maraging steel grade 300 containing 18 wt% of Ni was used, whose composition is shown in Table 1.
Chemical composition of MDN 300 steel.
The experimentation was performed with an optic fiber delivered pulsed Nd:YAG laser beam system (Model: JK300D) made by GSI Lumonics. The peak power delivered at laser was 16 kW. The laser beam was transferred via 300-µm-diameter step-indexed optical fiber to the welding head, which was mounted over a six-axis robot (Model: IRB1410) manufactured by ABB. The laser mode and wavelength were TEM00 mode and 1064 nm, respectively. The output laser beam was focused by a BK7 plano-convex lens whose focal distance was 200 mm and the focal spot size on the surface was approximately 0.5 mm.
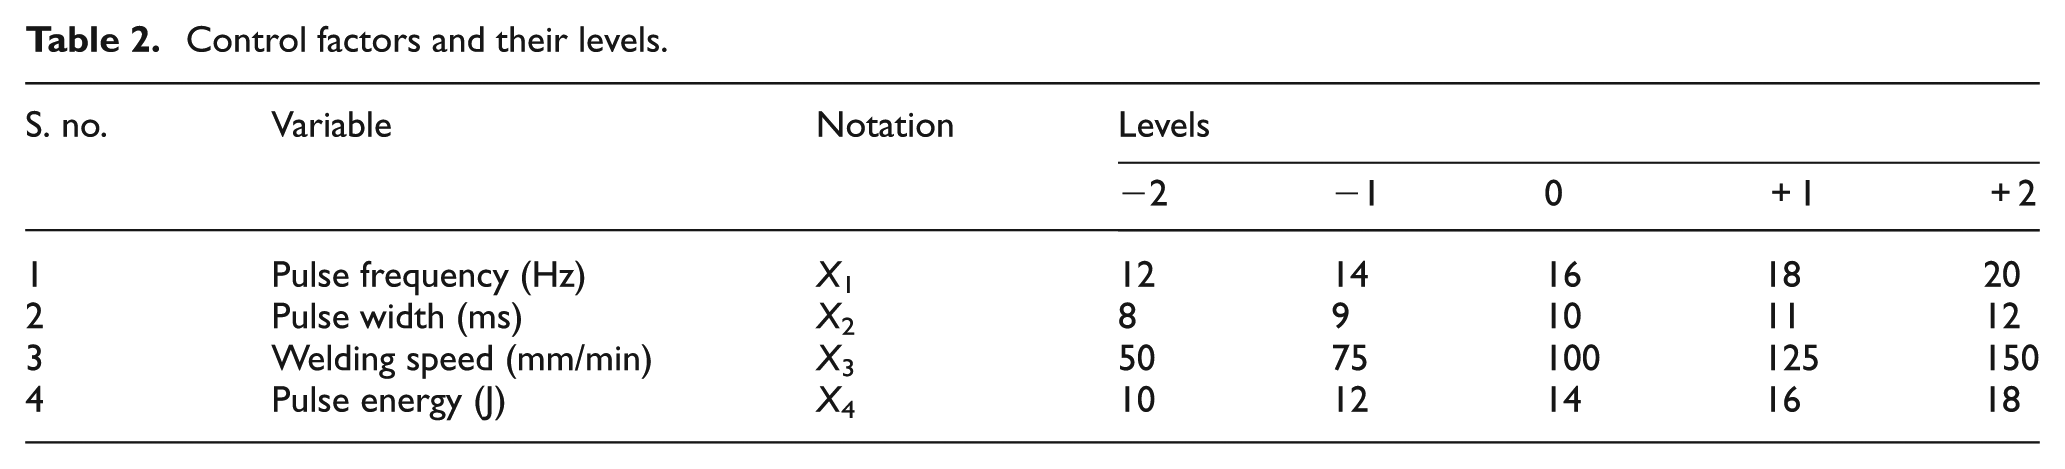
A photograph of the experimental set-up used is displayed in Figure 5. The workpieces having the dimensions of 20 mm (length) × 20 mm (width) × 3 mm (thickness) were taken for experimentation and the surfaces of the specimens were fully cleaned with acetone prior to welding. It is identified through the pilot experimentation that the welding variables, namely, pulse frequency, pulse width, welding speed, and pulse energy, have profound effect on the weld bead quality characteristics. The corresponding levels of the variables fixed through trial experiments are listed in Table 2. The experimentation was planned based on full factorial central composite rotatable design (CCRD). CCRD gives almost as much information as a three-level factorial, which requires many fewer tests than the full factorial design. 16 Therefore, CCRD was considered for experimentation in this work and is shown in Table 3.
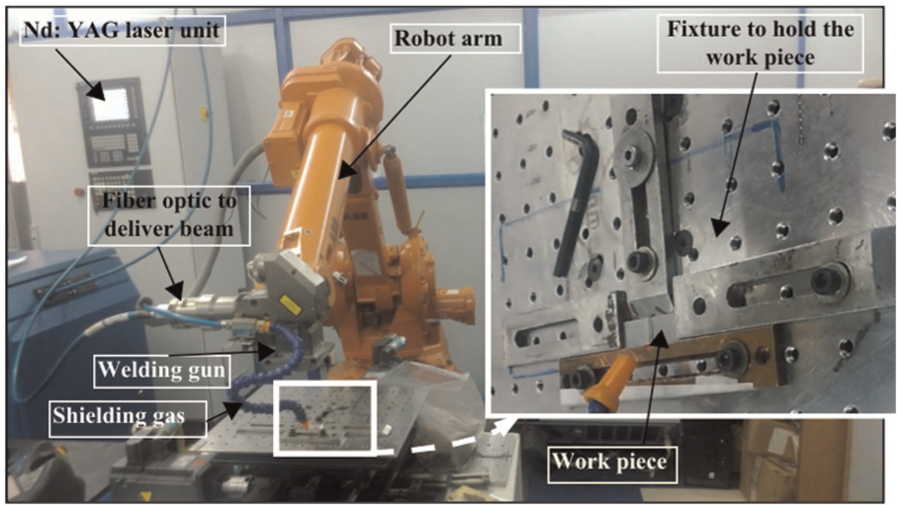
Photograph of experimental set-up.
Control factors and their levels.
Full factor central composite rotatable design matrix.
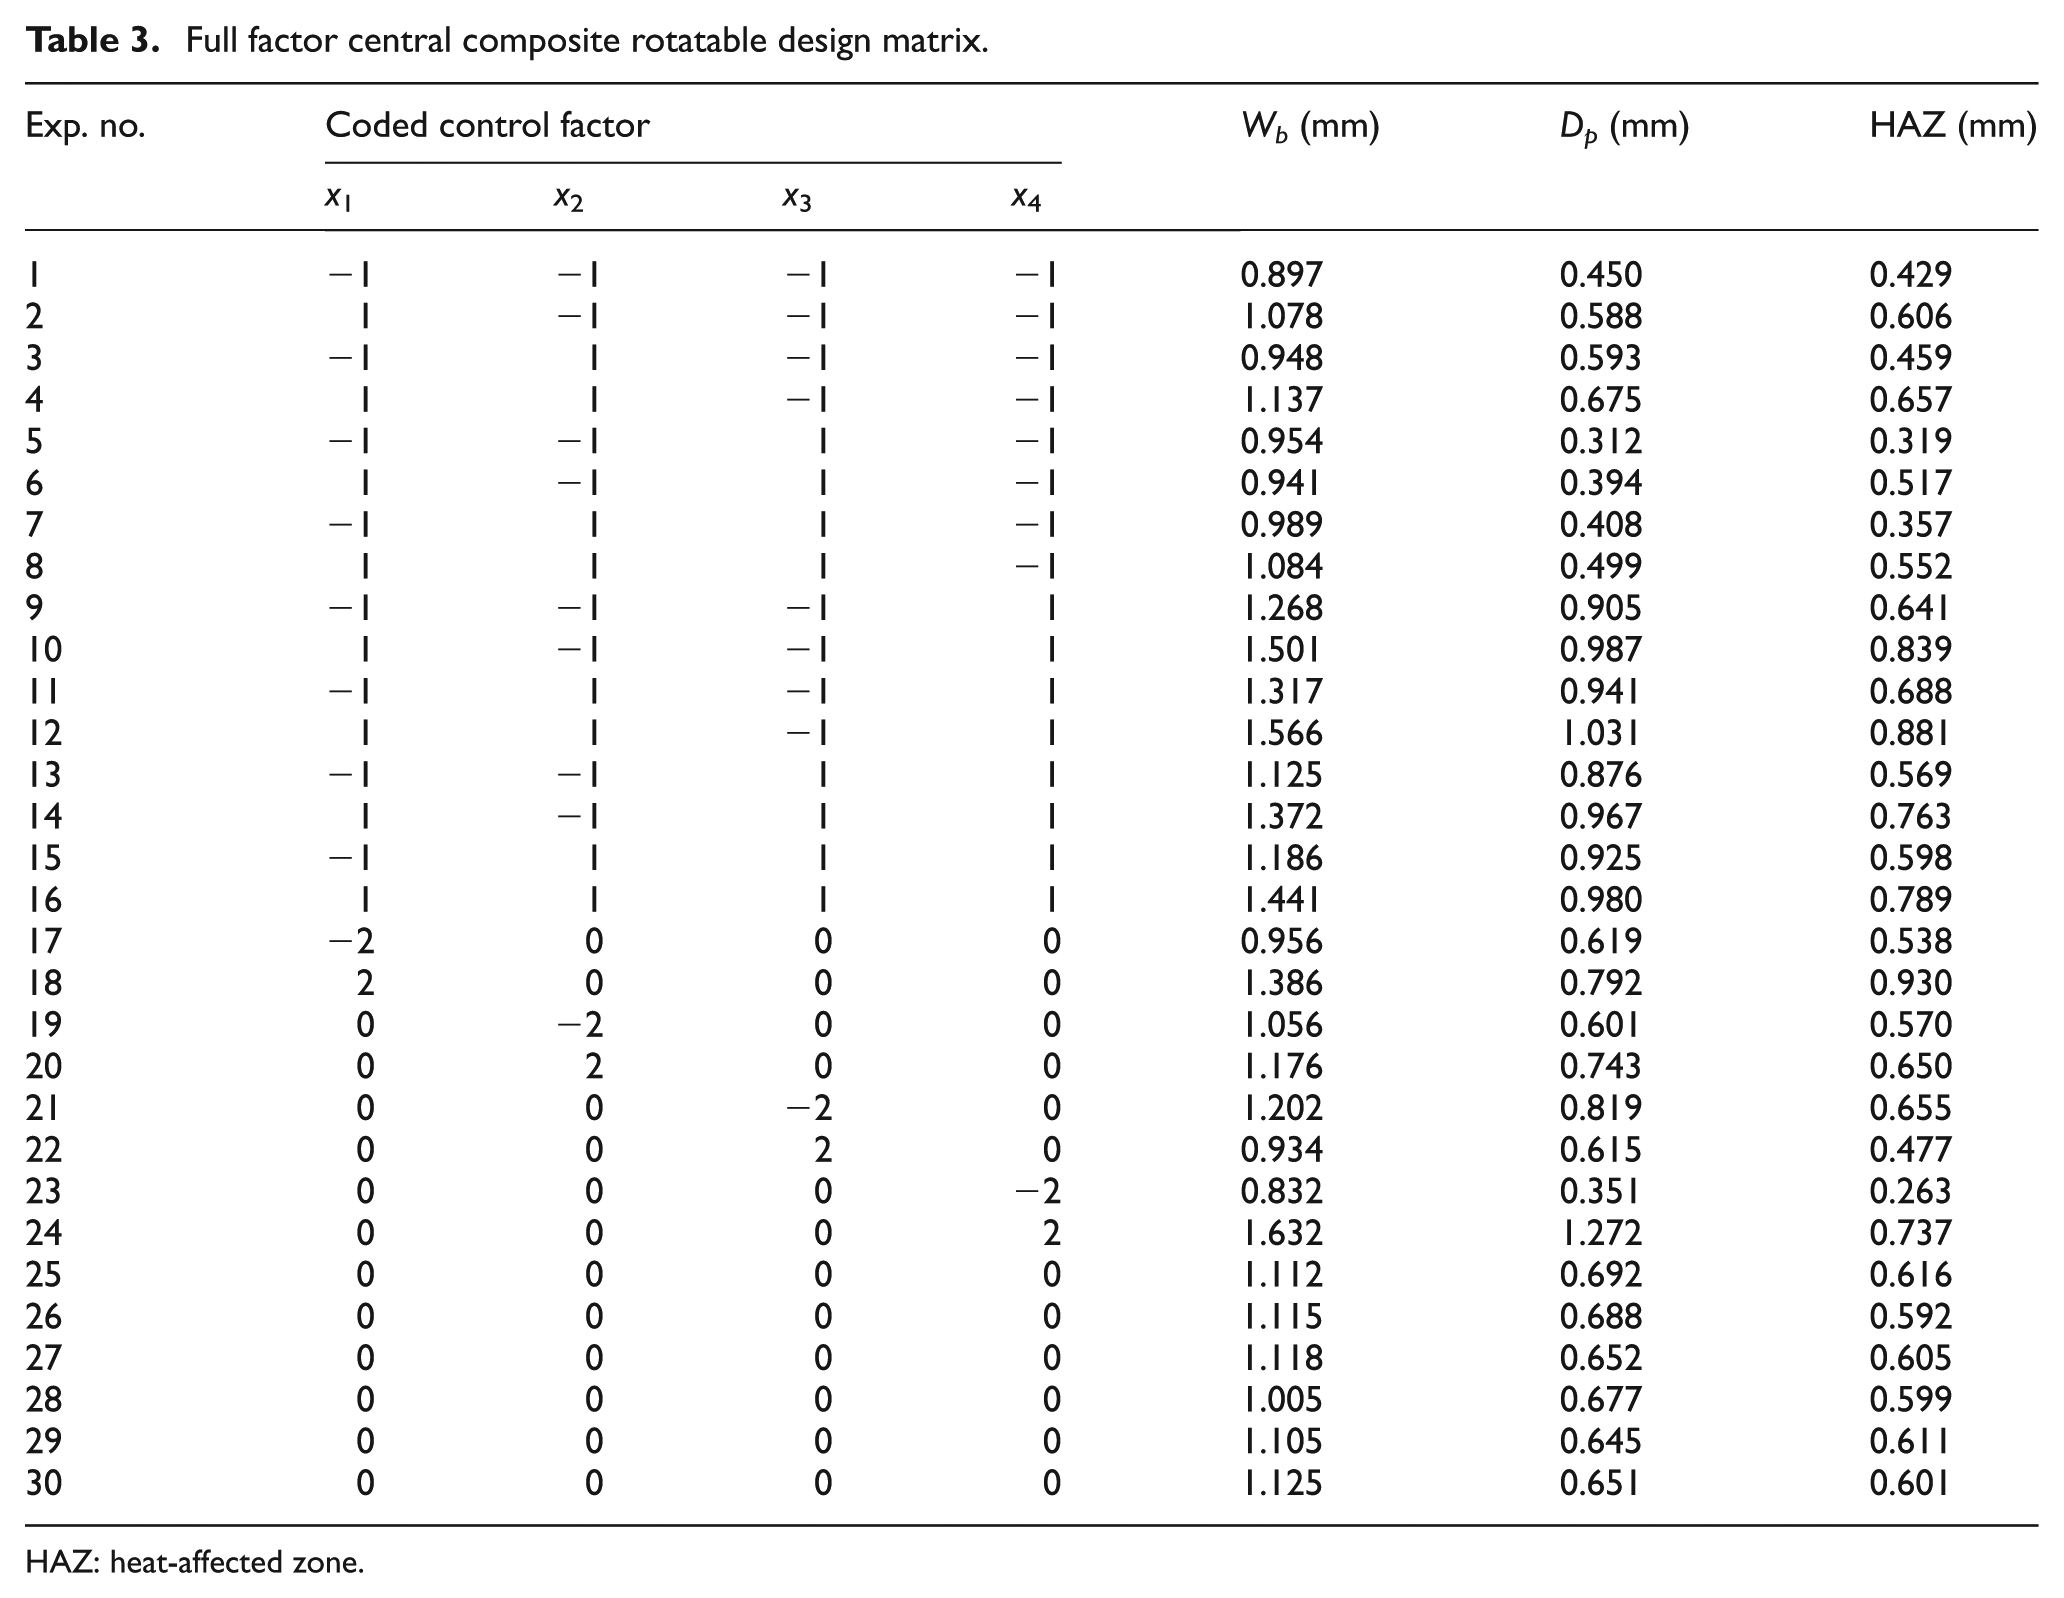
HAZ: heat-affected zone.
All the welding experiments were conducted under the protection of argon shielding gas. The welded samples were subjected to standard metallurgical procedure. However, to get clearly the microstructure for the chosen maraging steel, a mixture of 15 mL H2O, 15 mL acetic acid, 60 mL HCl, and 10 mL HNO3 22 was used to etch the samples.
Bead width, depth of penetration, and HAZ of the welded samples were measured by inverted microscope made by Olympus Corporation with the magnification range of 100 µm and the measured responses are listed in Table 3.
Modeling and analysis of the responses
The empirical models are developed using the RSM to relate the process-control variables and the responses. The second-order quadratic models were postulated for the process responses. The adequacy of the developed models was assessed by adopting the analysis of variance (ANOVA) approach. Tables 4–6 represent the ANOVA for the bead width, the depth of penetration, and the HAZ, respectively. The p-value in these tables is less than 0.05, which indicates that the developed models for the responses are statistically significant at 95% confidence level 23 and the multiple regression coefficients (R2) state that the second-order models can explain the variation in the measure responses up to the extent of 97.29%, 99.78%, and 98.94%, respectively.
ANOVA for the response: bead width.
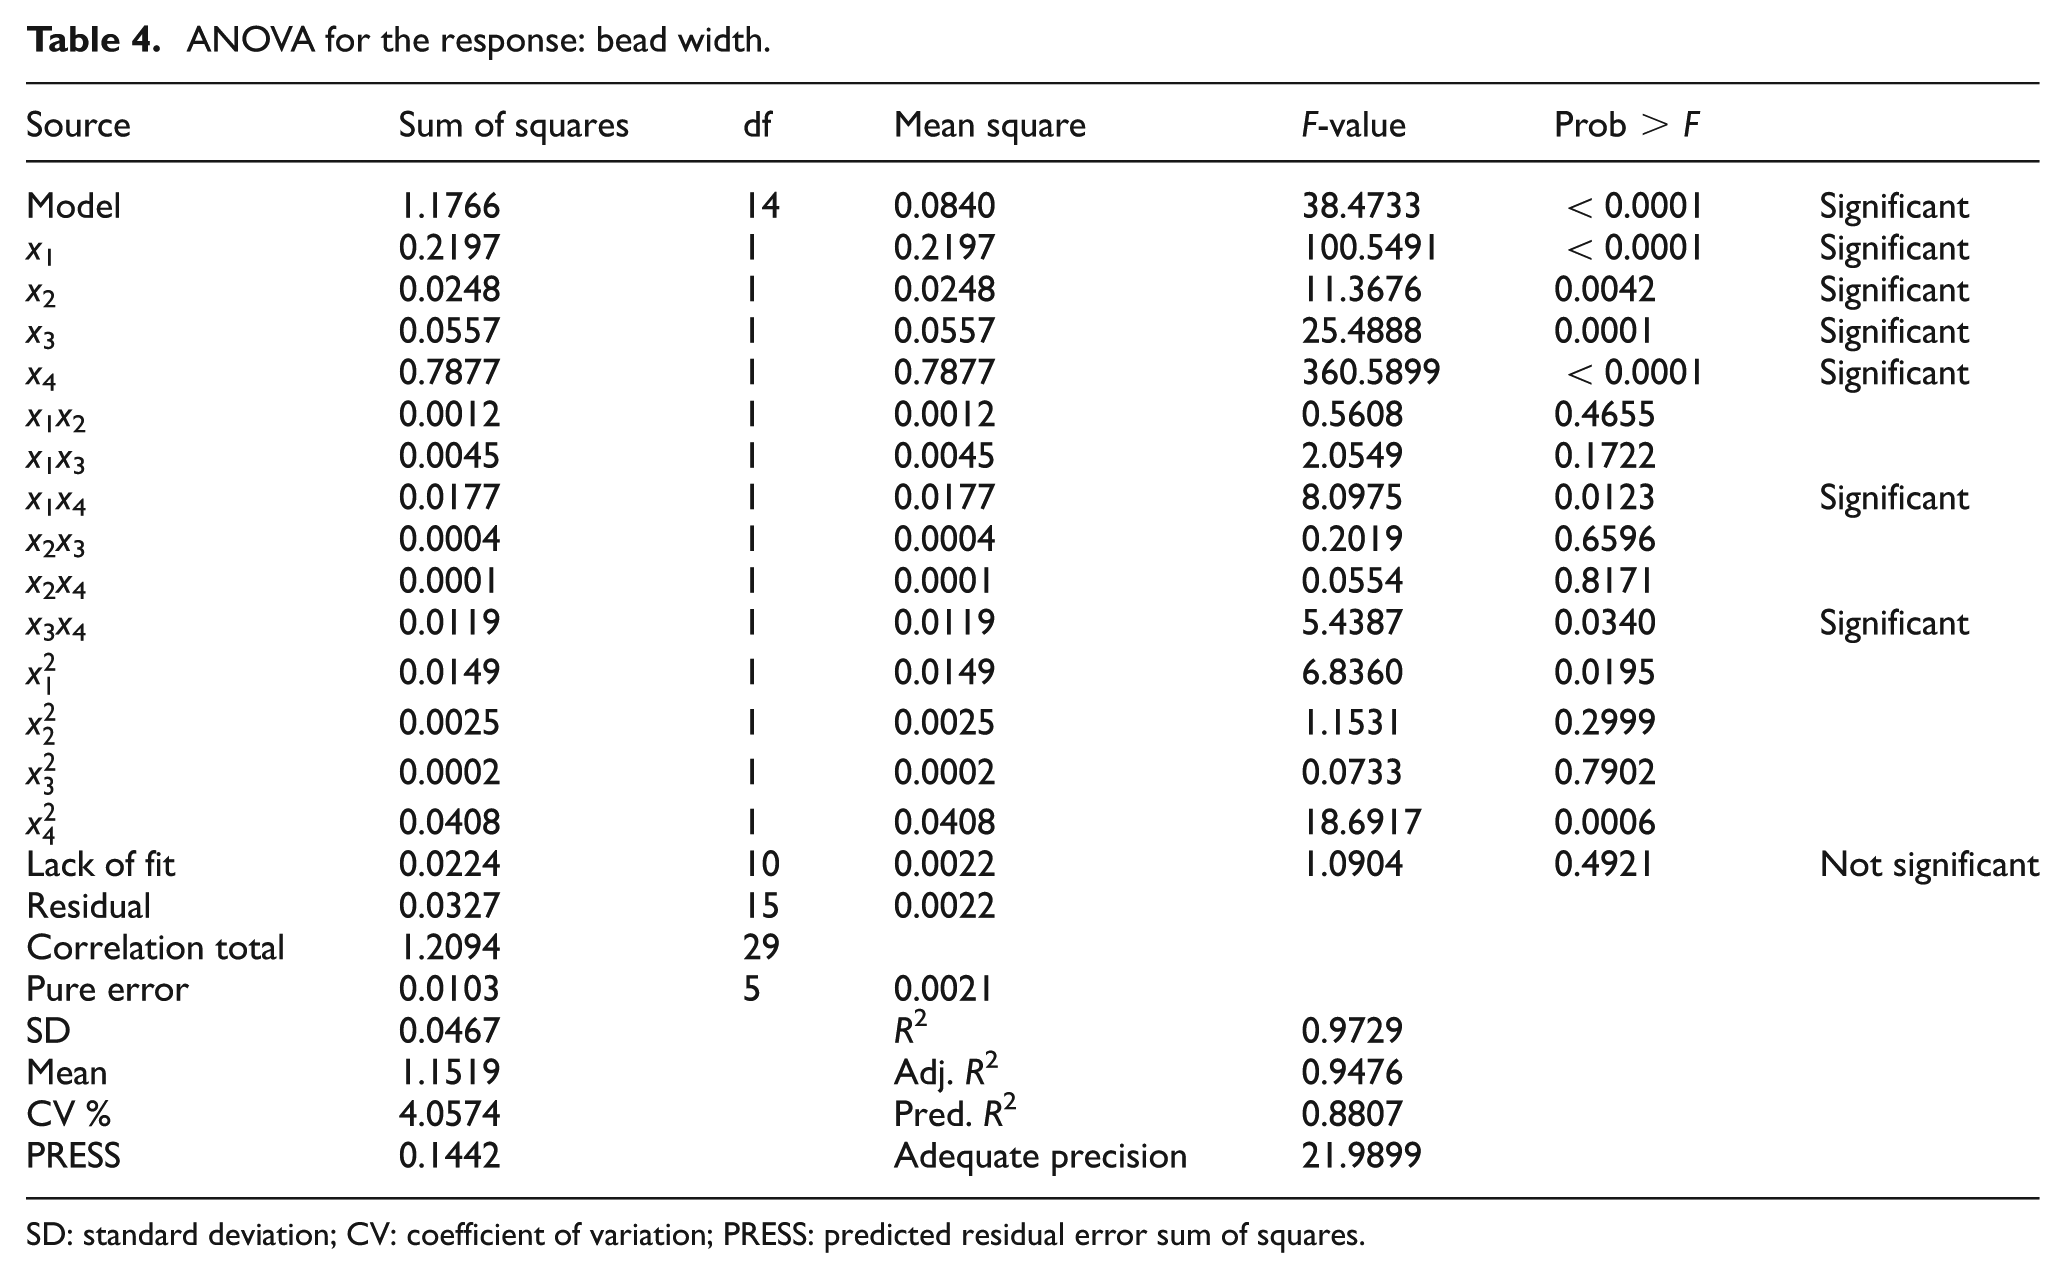
SD: standard deviation; CV: coefficient of variation; PRESS: predicted residual error sum of squares.
ANOVA for the response: depth of penetration.
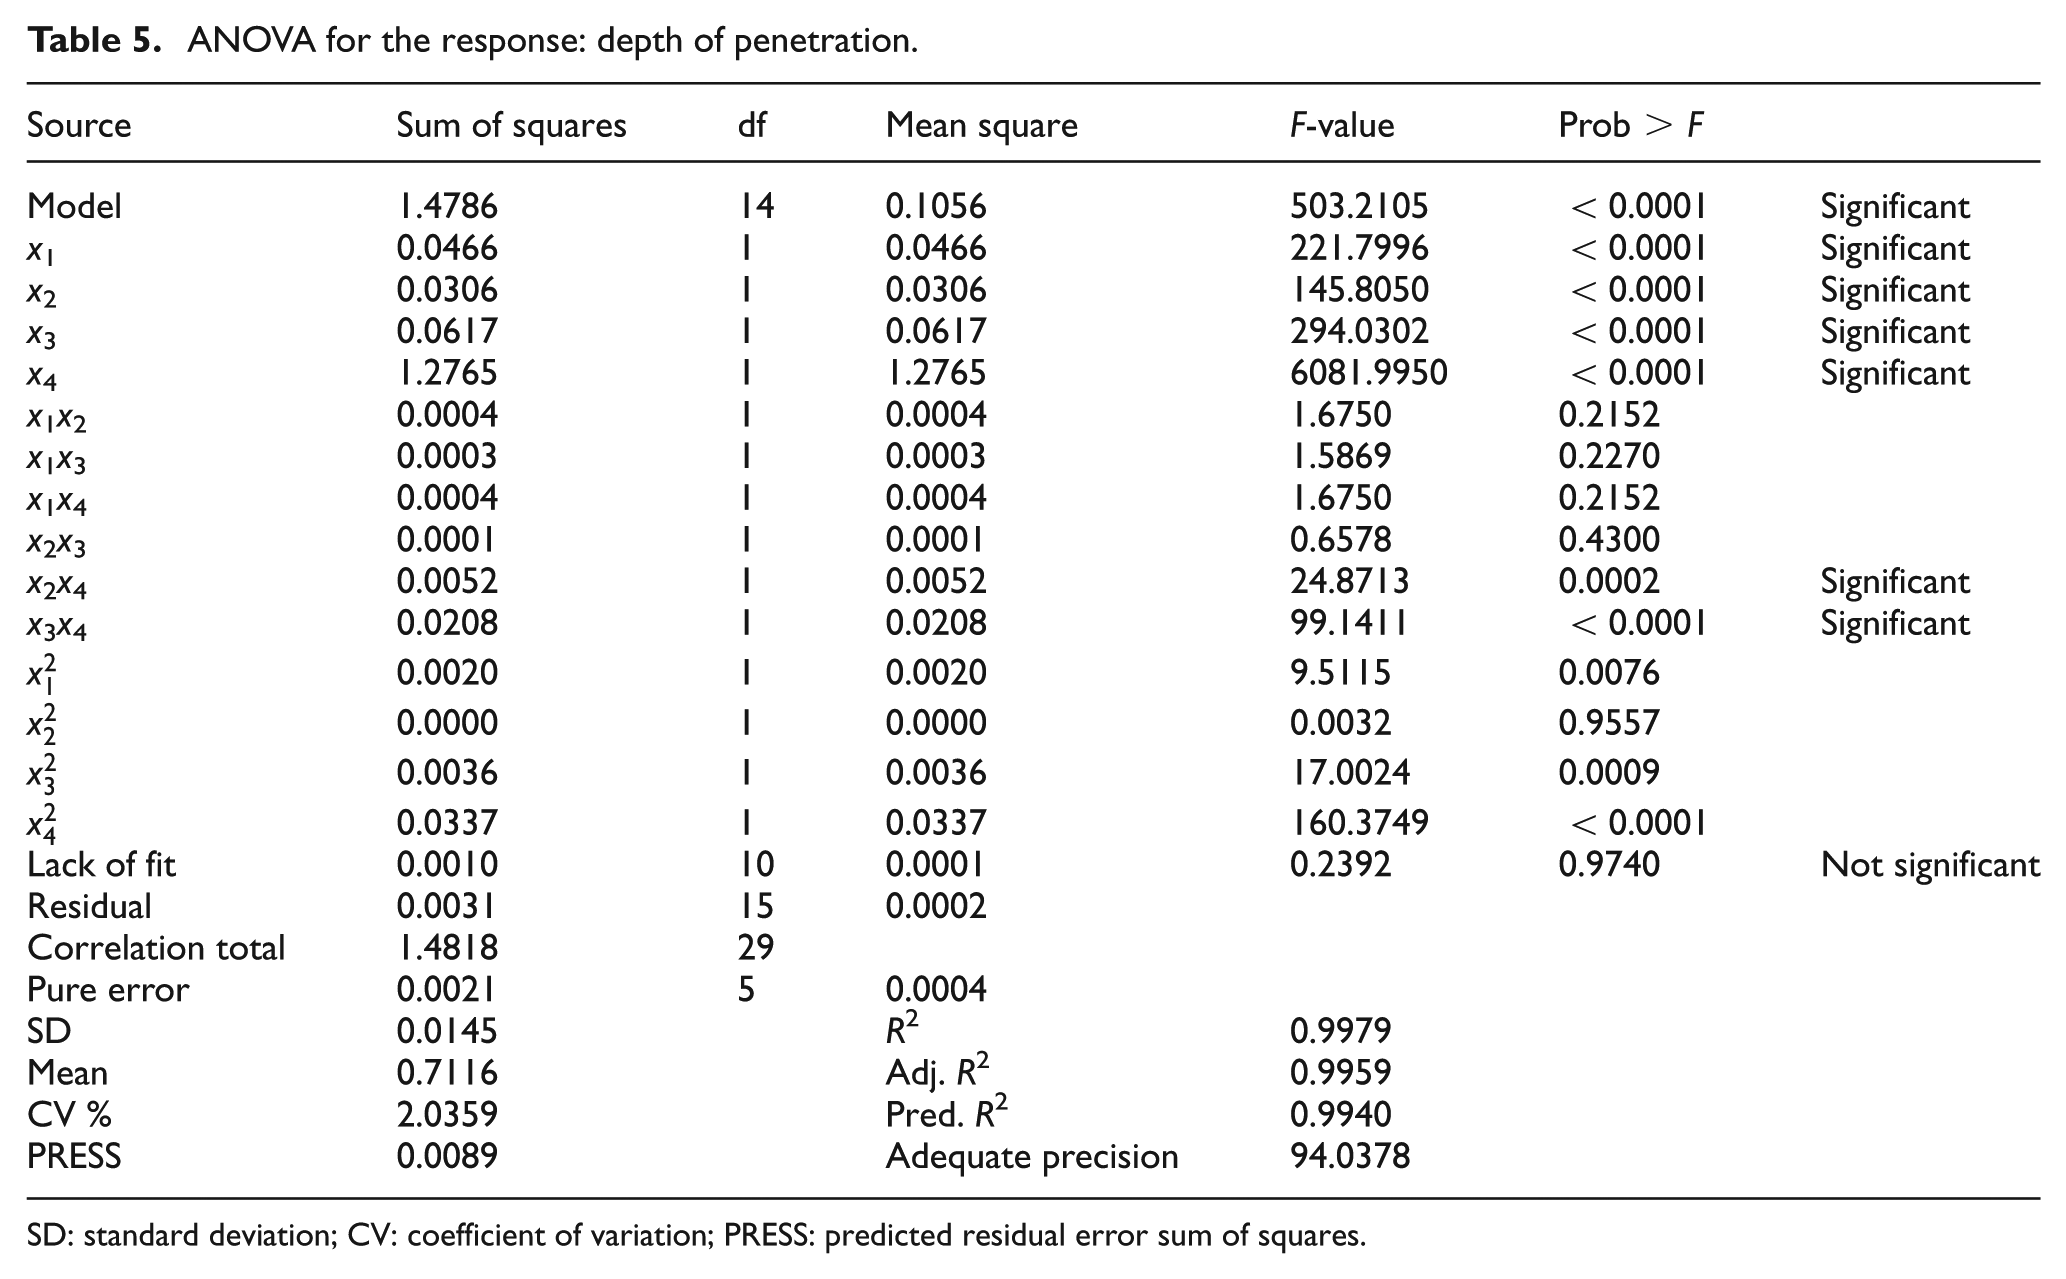
SD: standard deviation; CV: coefficient of variation; PRESS: predicted residual error sum of squares.
ANOVA for the response: heat-affected zone.
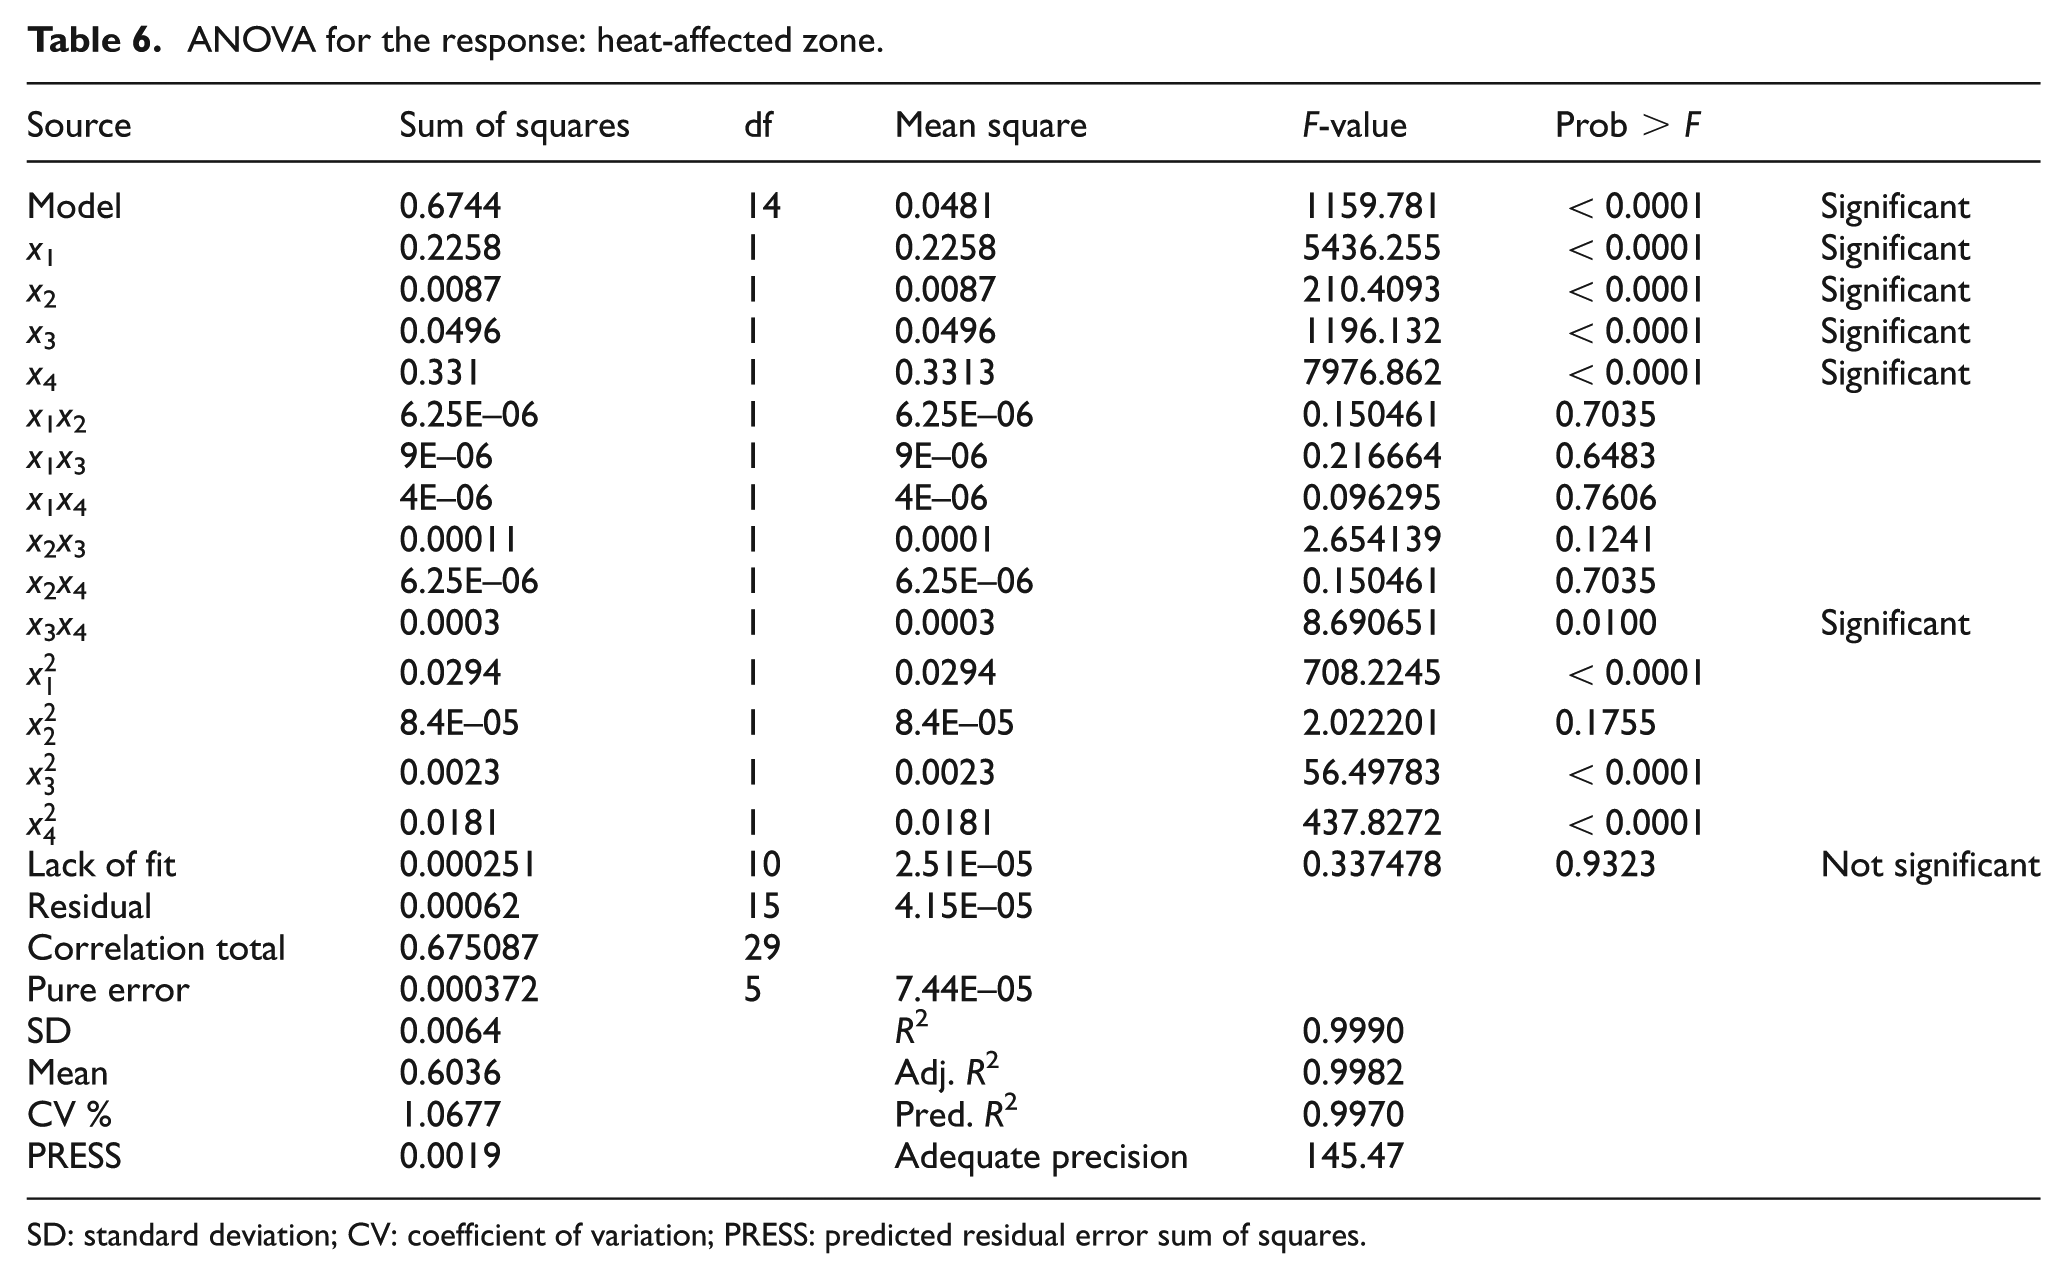
SD: standard deviation; CV: coefficient of variation; PRESS: predicted residual error sum of squares.
The normal probability plots of the residuals versus predicted response are presented in Figures 6–8. A check on these plots reveals that the residuals are located on a straight line, which means the errors are distributed normally and hence the developed models are considered to be fairly fitted with the observed values. Therefore, the developed second-order empirical models are reasonably adequate in representing the process.
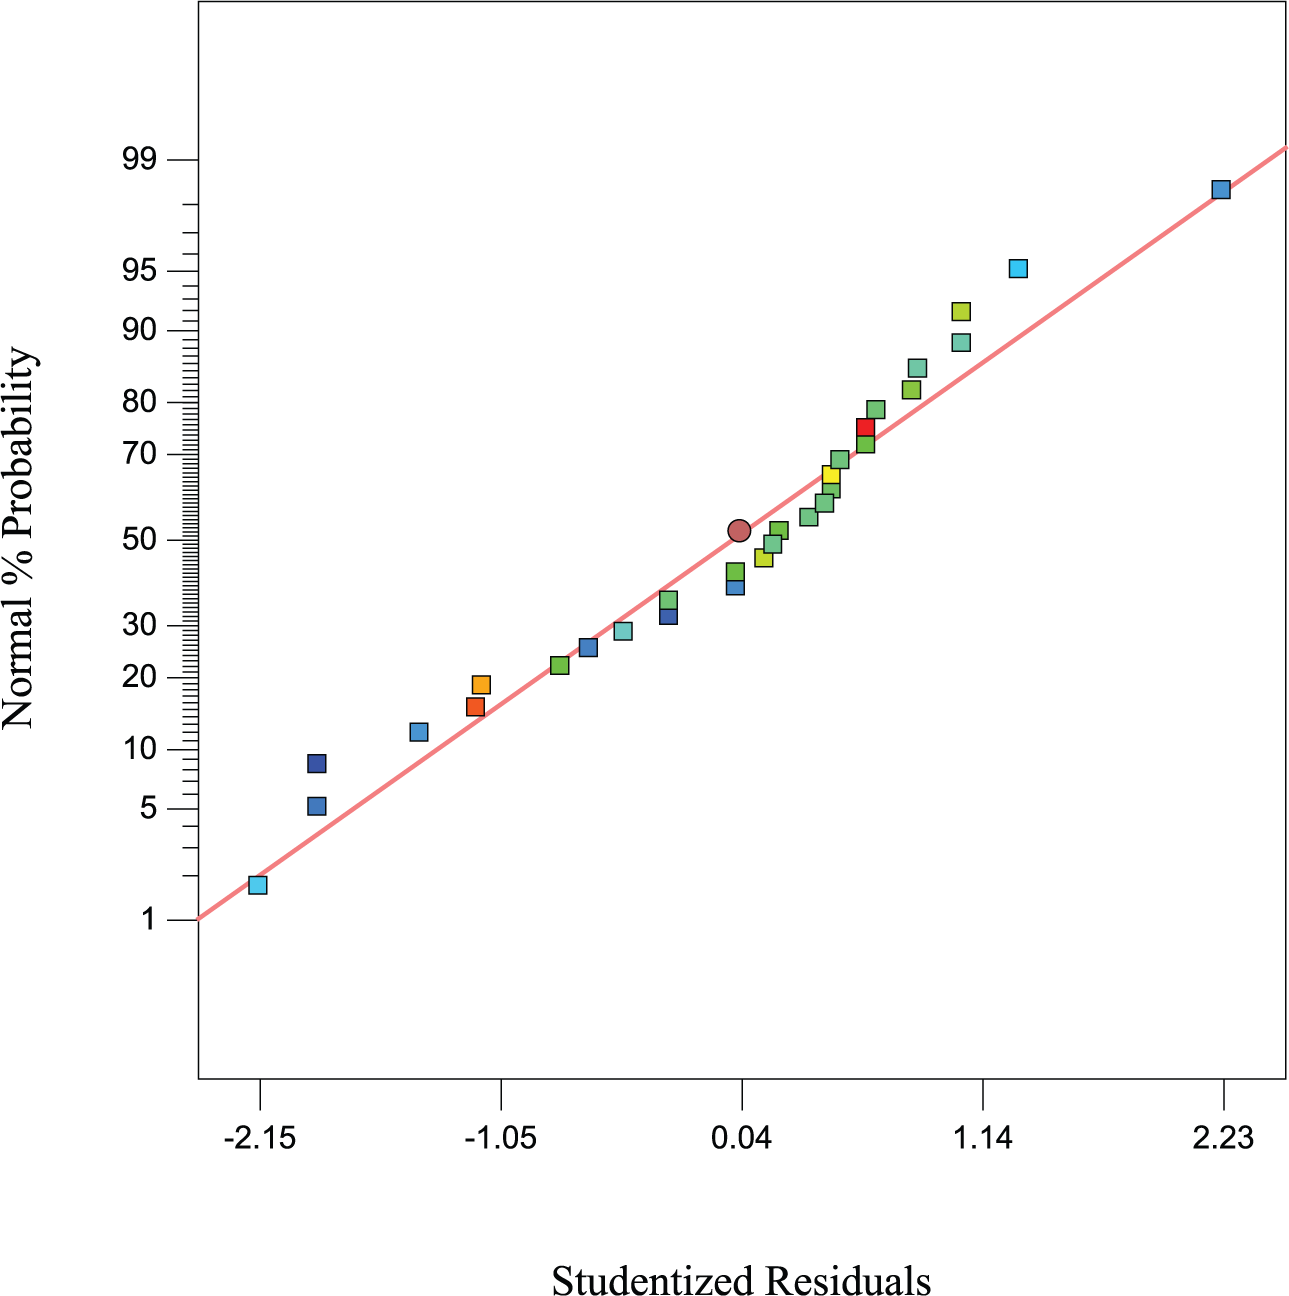
Normal probability plot of residuals for bead width.
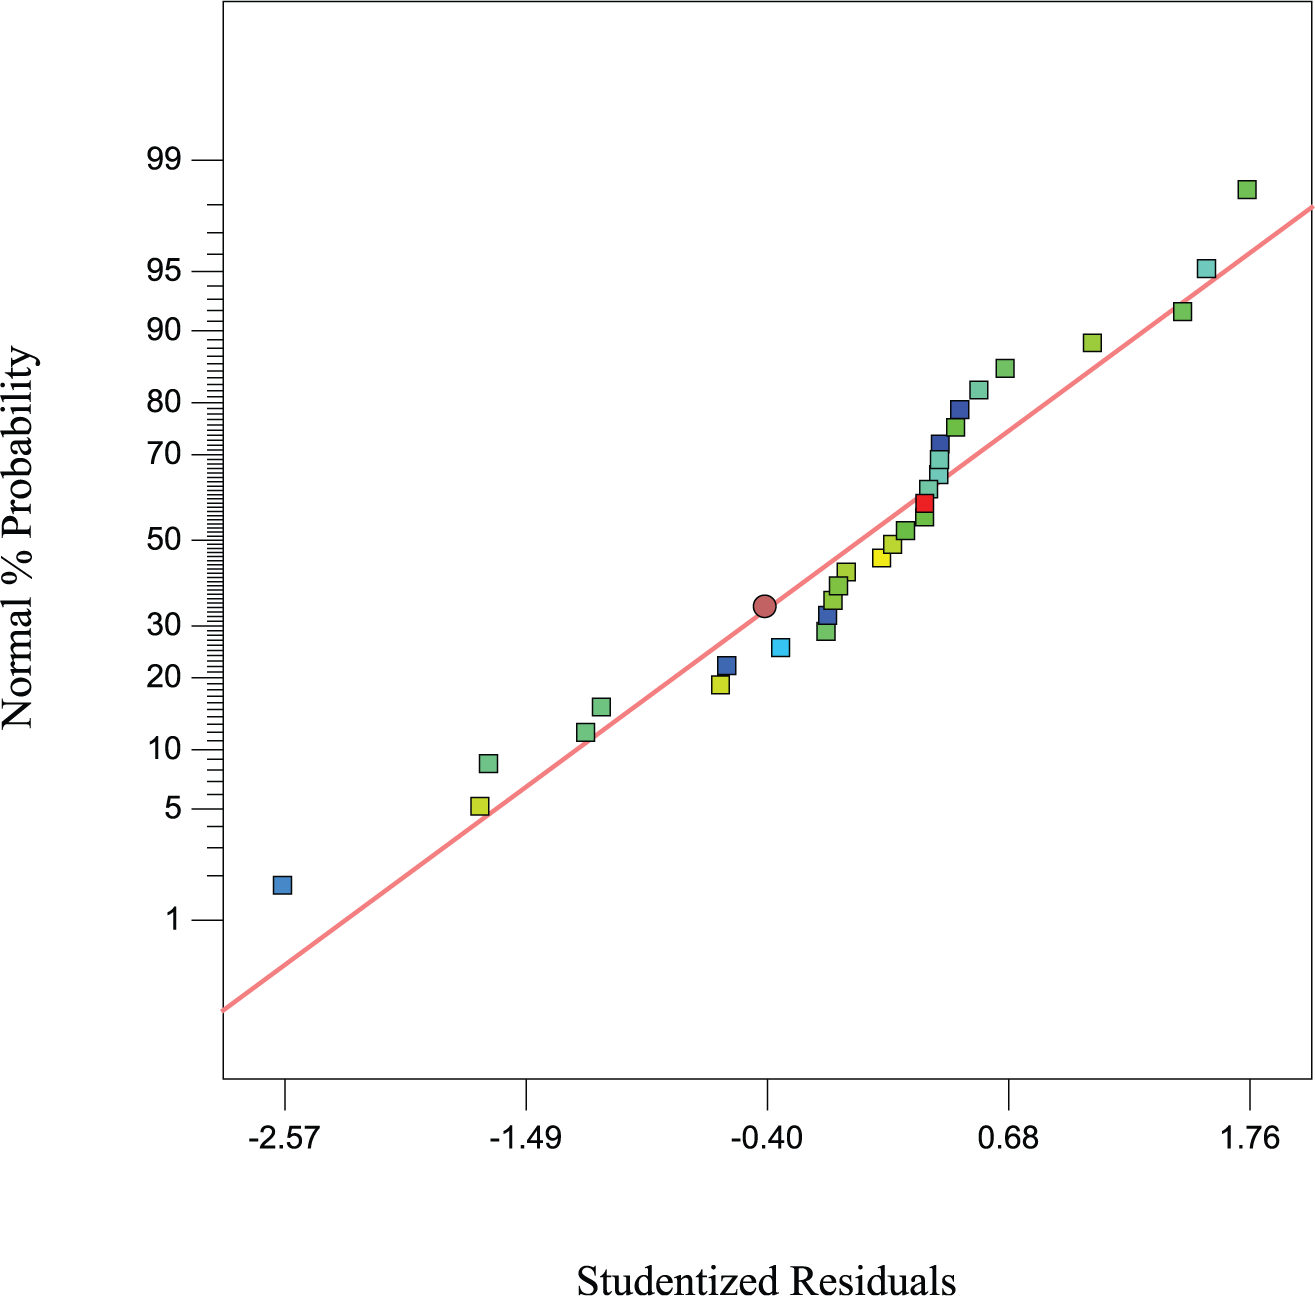
Normal probability plot of residuals for penetration depth.
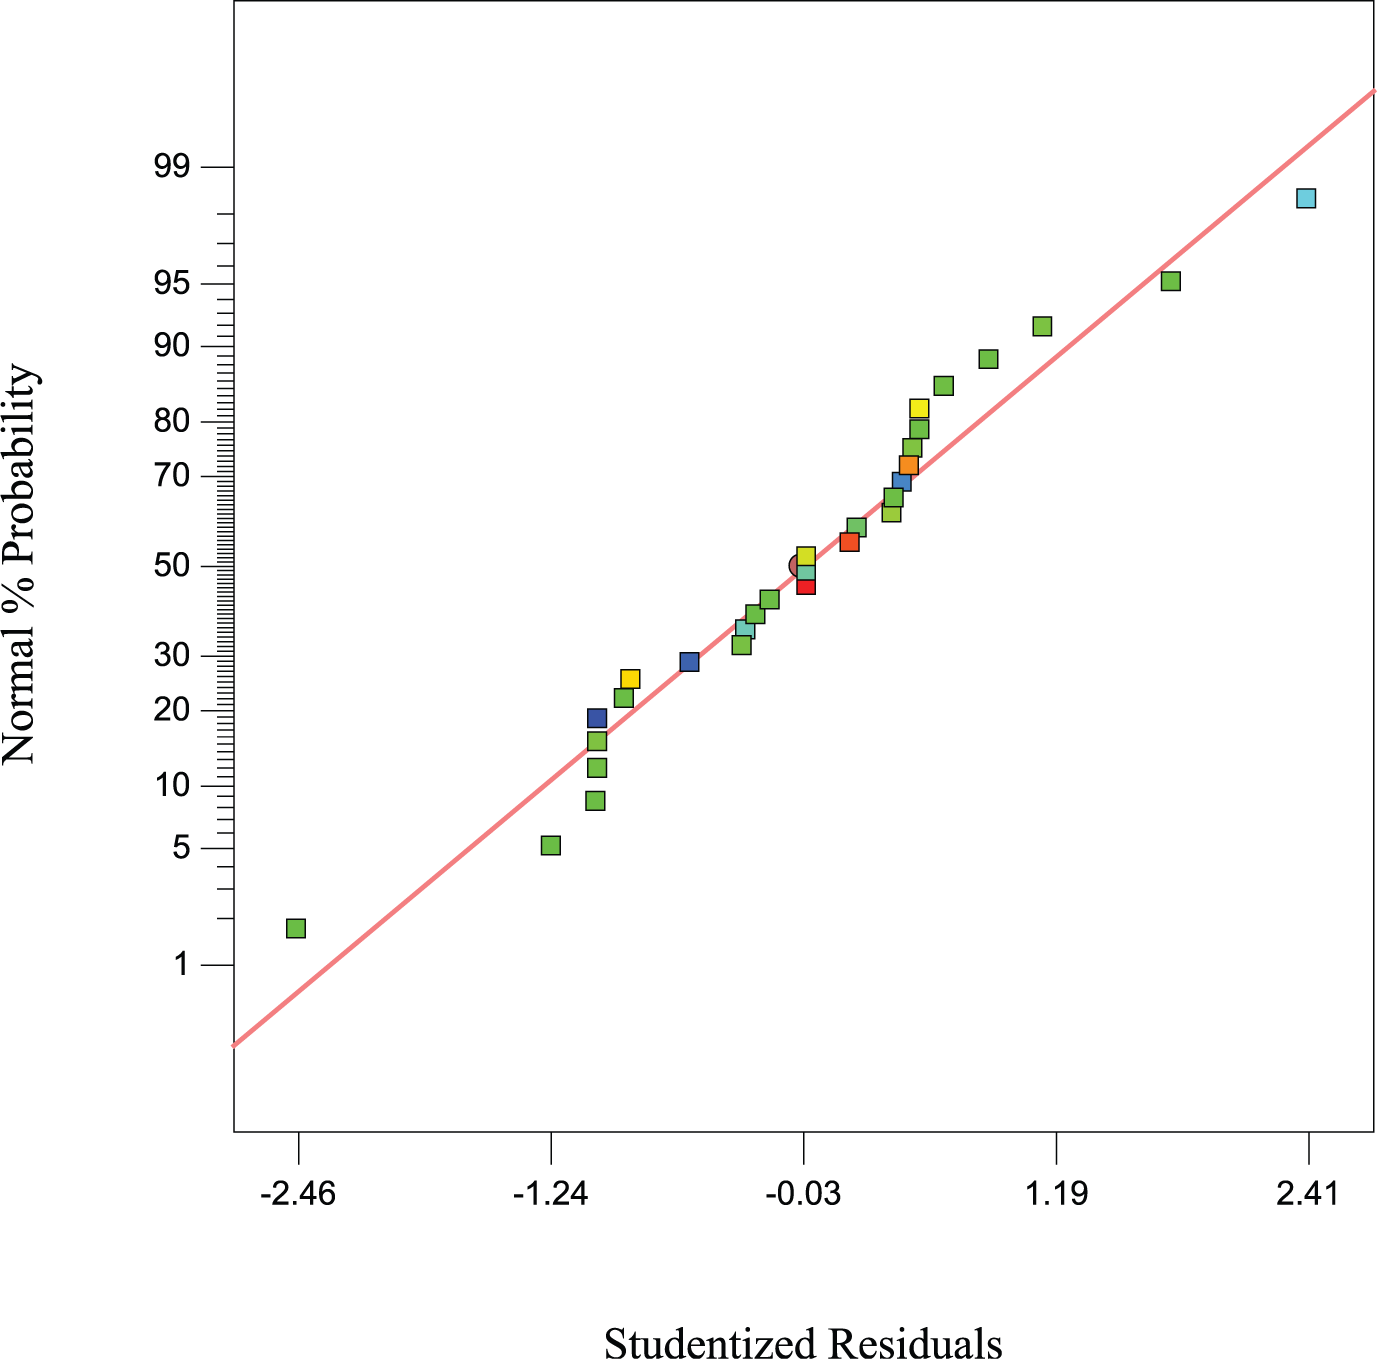
Normal probability plot of residuals for heat-affected zone.
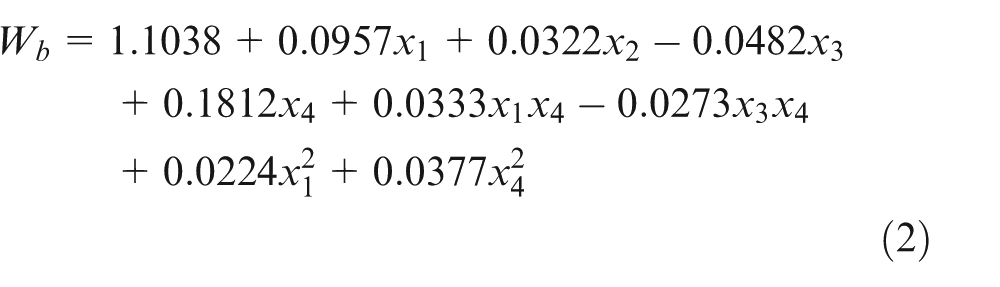
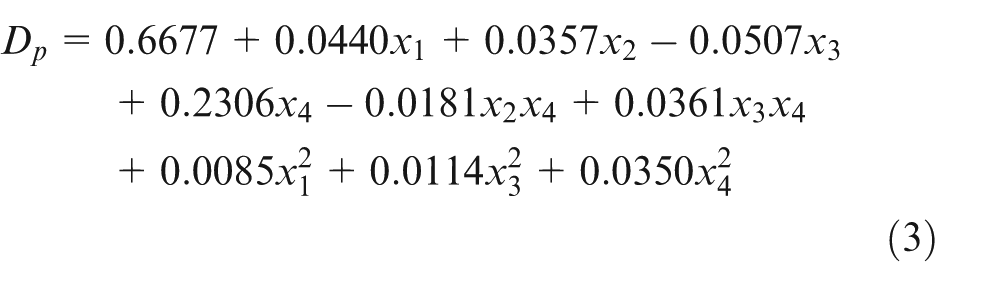
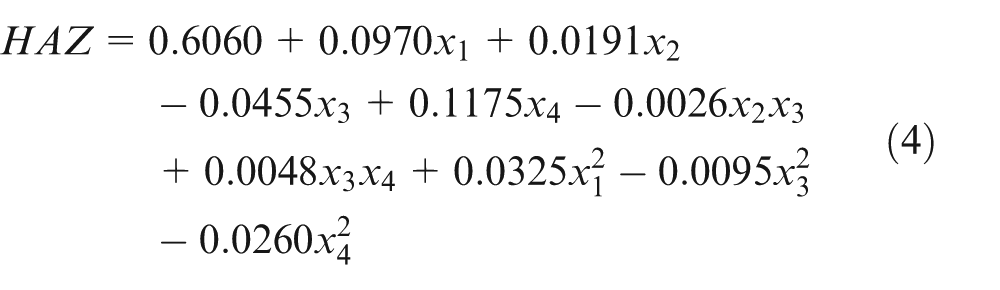
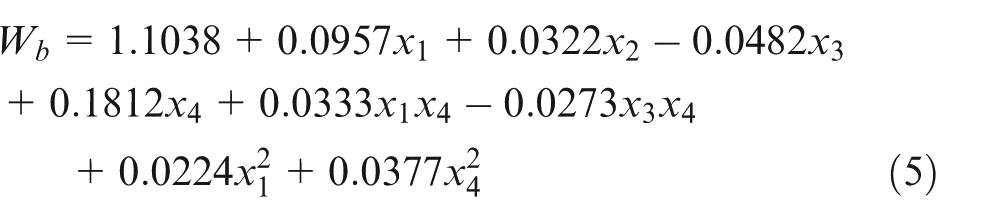
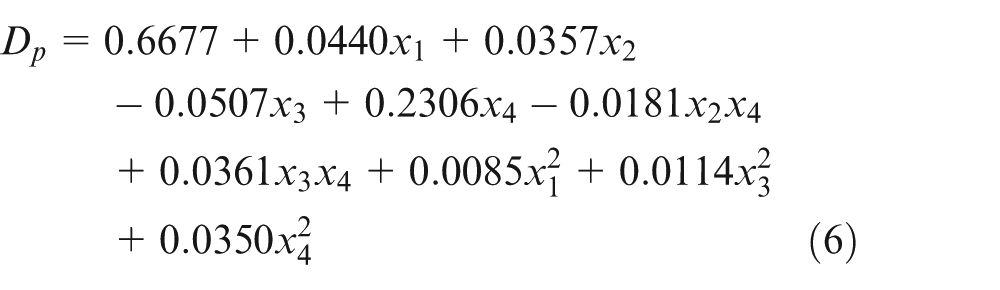
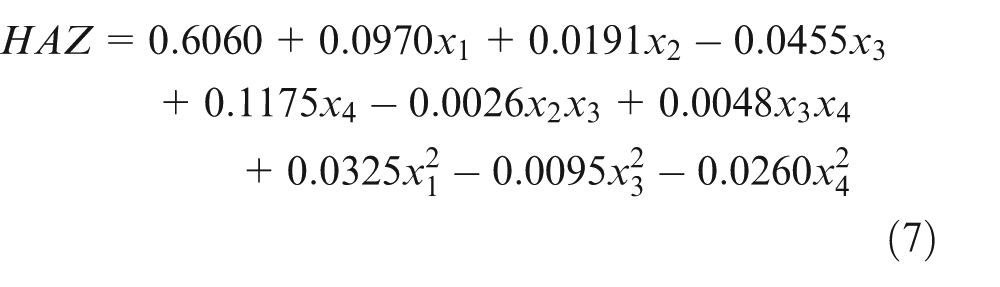
The second-order models for bead width (Wb), depth of penetration (Dp), and HAZ were established based on the equation (1). By considering the backward elimination procedure, the insignificant terms in the models were eliminated, so that the complexities in the models were nearly reduced. The final equations obtained after eliminating the insignificant terms using RSM are as follows
Based on the ANOVA tables, the estimated individual and interaction effects of the process parameters on the individual responses are analyzed in the following section.
Bead width
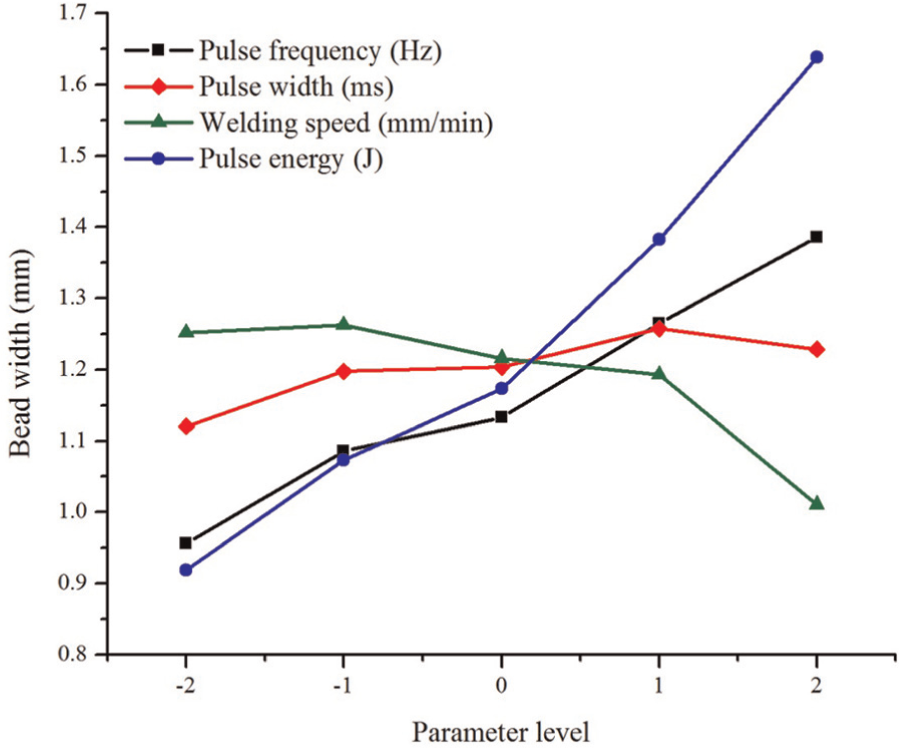
From Table 4, it is observed that the pulse frequency, pulse width, welding speed, and pulse energy are the significant variables on the bead width. The individual effects of these variables on the bead width are graphically drawn in Figure 9 and the figure indicates that the pulse frequency, pulse width, and pulse energy have direct proportion on the bead width while it is not the case with welding speed. When any of the first three variables is increased, it leads to increased energy density over the focused area and hence the increased bead width. When the welding speed is increased, the bead width gets reduced as it causes less heat input per unit area causing melting of lesser volume of material. This eventually leads to reduced bead width. It is also noted from Table 4 that the interaction effects of pulse frequency and pulse width and welding speed and pulse energy are significant. These plots are drawn in Figures 10 and 11. Figure 10 represents that the minimum bead width is possible at the lower levels of the both pulse frequency and pulse width. Also, the lower values of pulse energy at the higher levels of weld speed could minimize the bead width as depicted in Figure 11.
Main effect of process parameters on bead width.
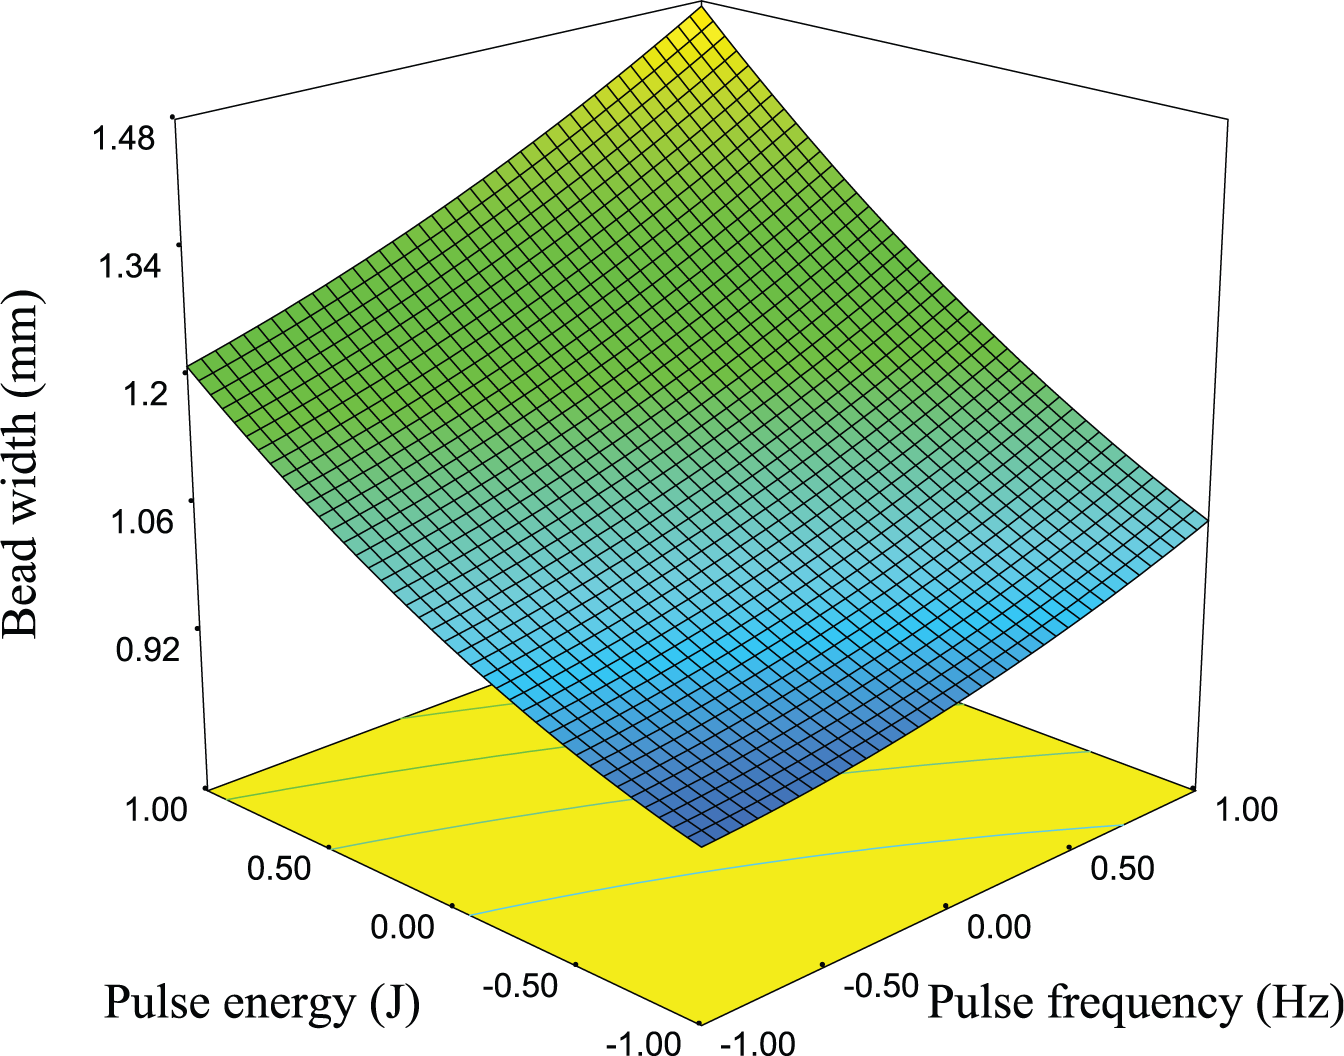
Interaction effect of pulse frequency and pulse energy on bead width.
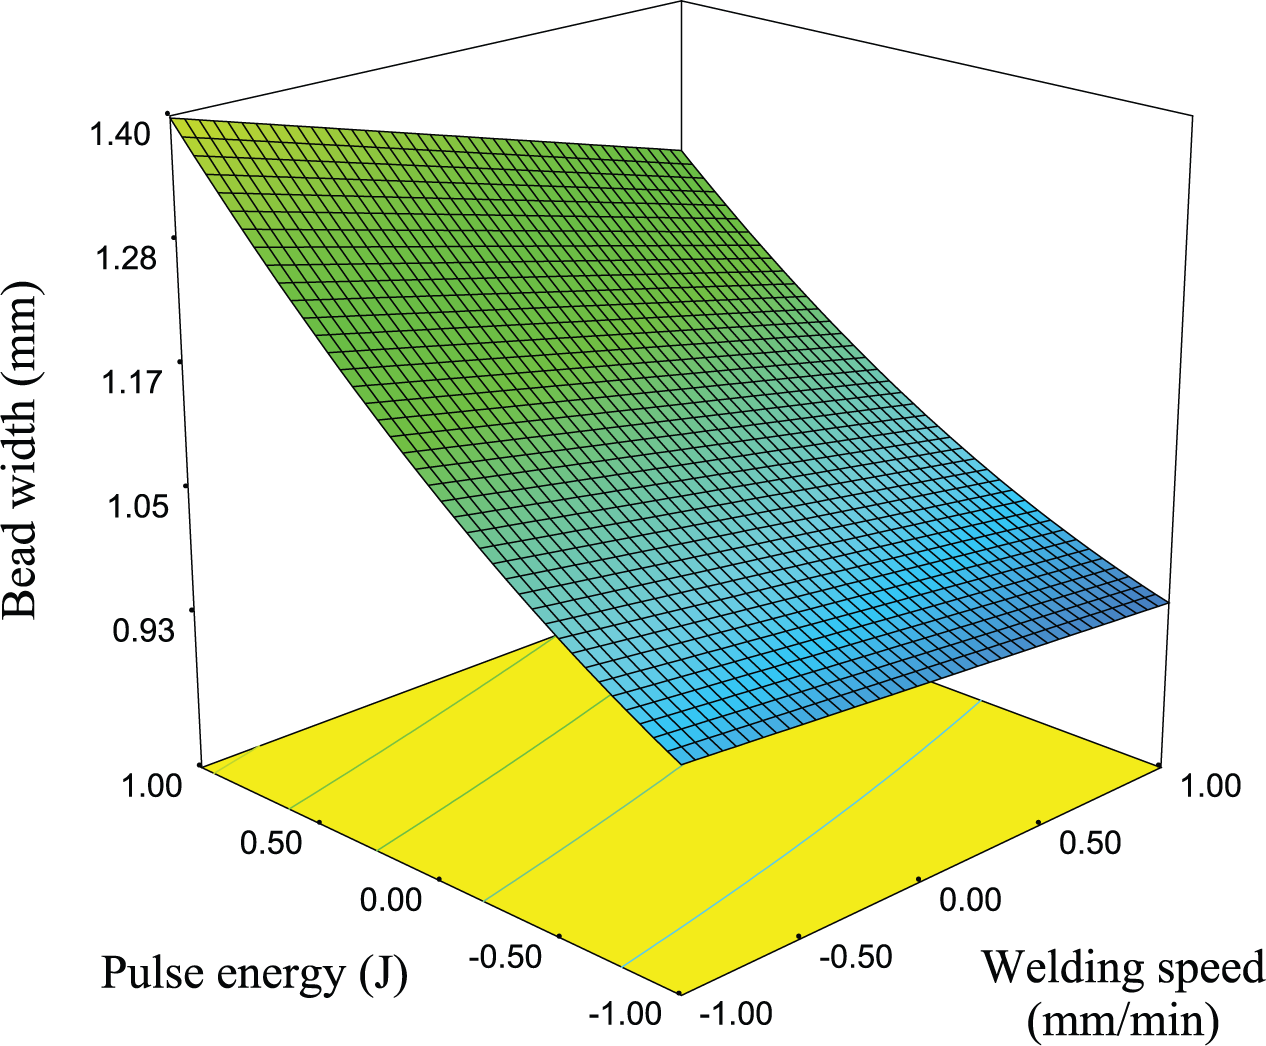
Interaction effect of welding speed and pulse energy on bead width.
Depth of penetration
Table 5 represents that the direct effects of all the chosen variables are significant. As it can be seen in Figure 12, increasing any of the variables, namely, pulse frequency, pulse width, and pulse energy, results in increased depth of penetration as they lead to more power density, while the increased values of welding speed cause reduced depth of penetration as higher laser speeds along the weld line lead to lesser melting of base metal.
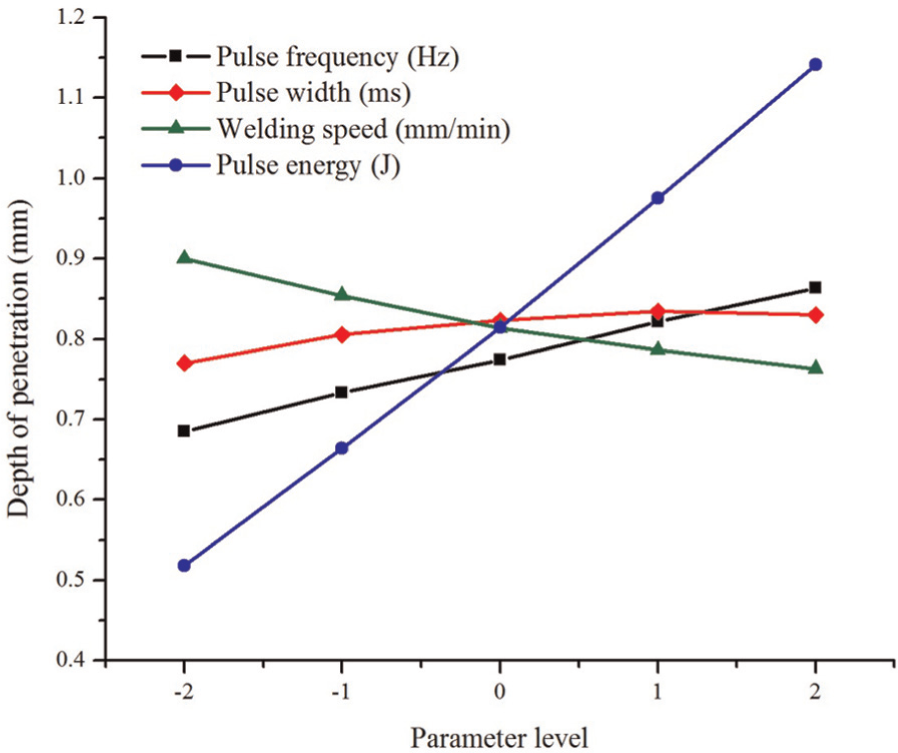
Main effect of process parameters on penetration depth.
The interaction effects which are observed to be significant from Table 5 on depth of penetration are drawn in Figures 13 and 14. Figure 13 shows the estimated response surface for the parameter depth of penetration, according to the design parameters of pulse width and pulse energy, while the other factors remain constant at their central values. The depth of penetration could be maximized by increasing the pulse width and pulse energy to their maximum levels. It also represents that the influence of pulse width on depth of penetration is more at the lower pulse energy levels. Figure 14 shows the interactive effects for penetration depth, which indicates that the depth of penetration could be maximized by increasing the pulse energy and decreasing the welding speed simultaneously. It is also observed that the depth of penetration increases more significantly by decreasing the welding speed at the lower levels of pulse energy.
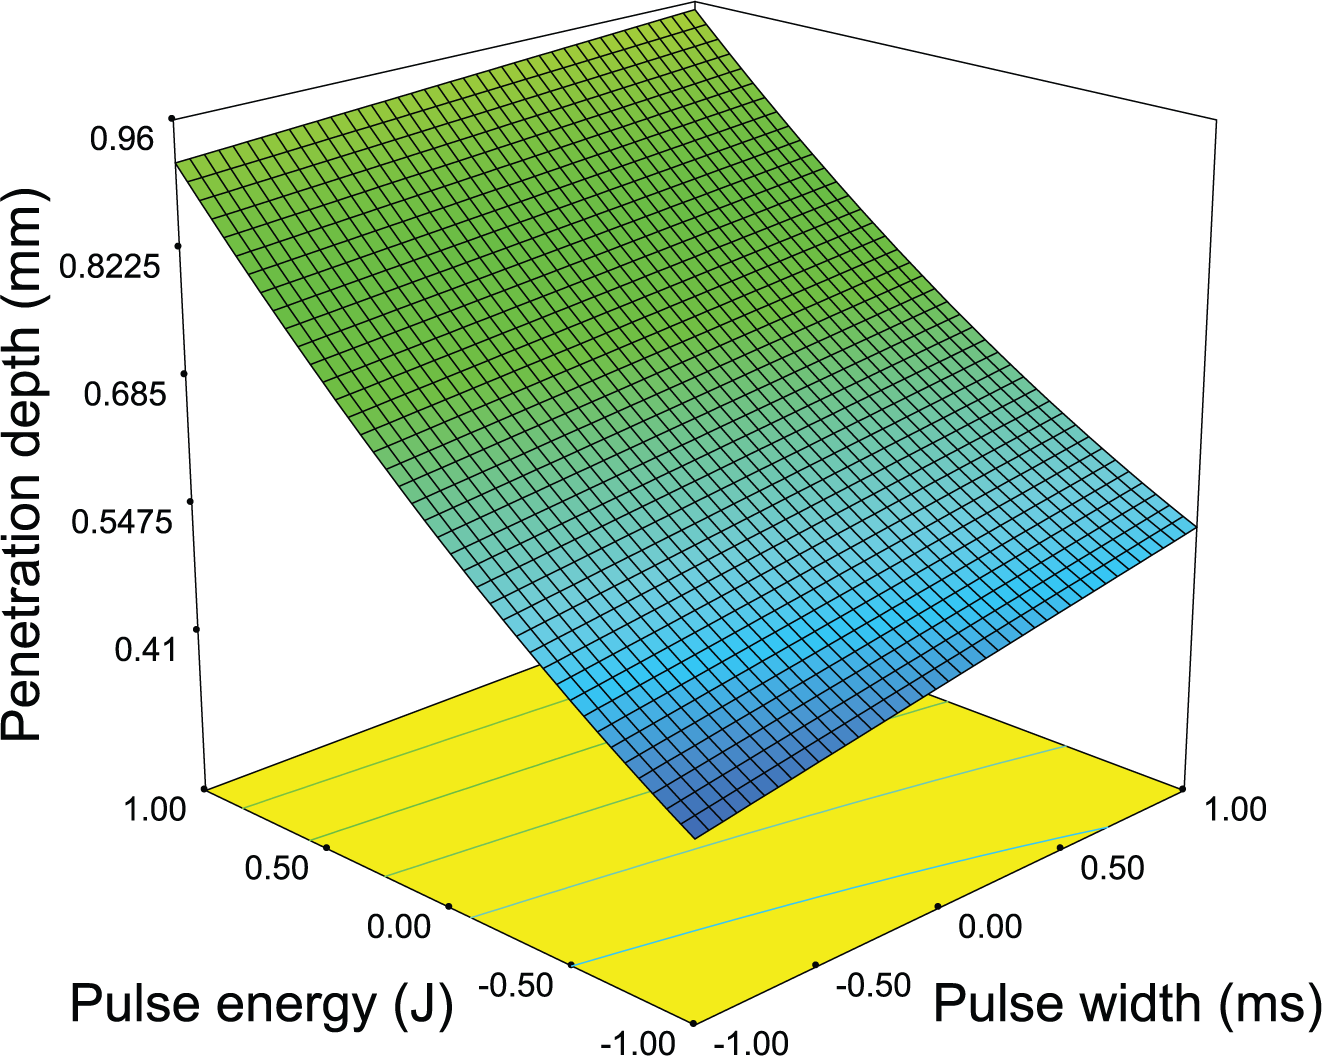
Interaction effect of pulse width and pulse energy on penetration depth.
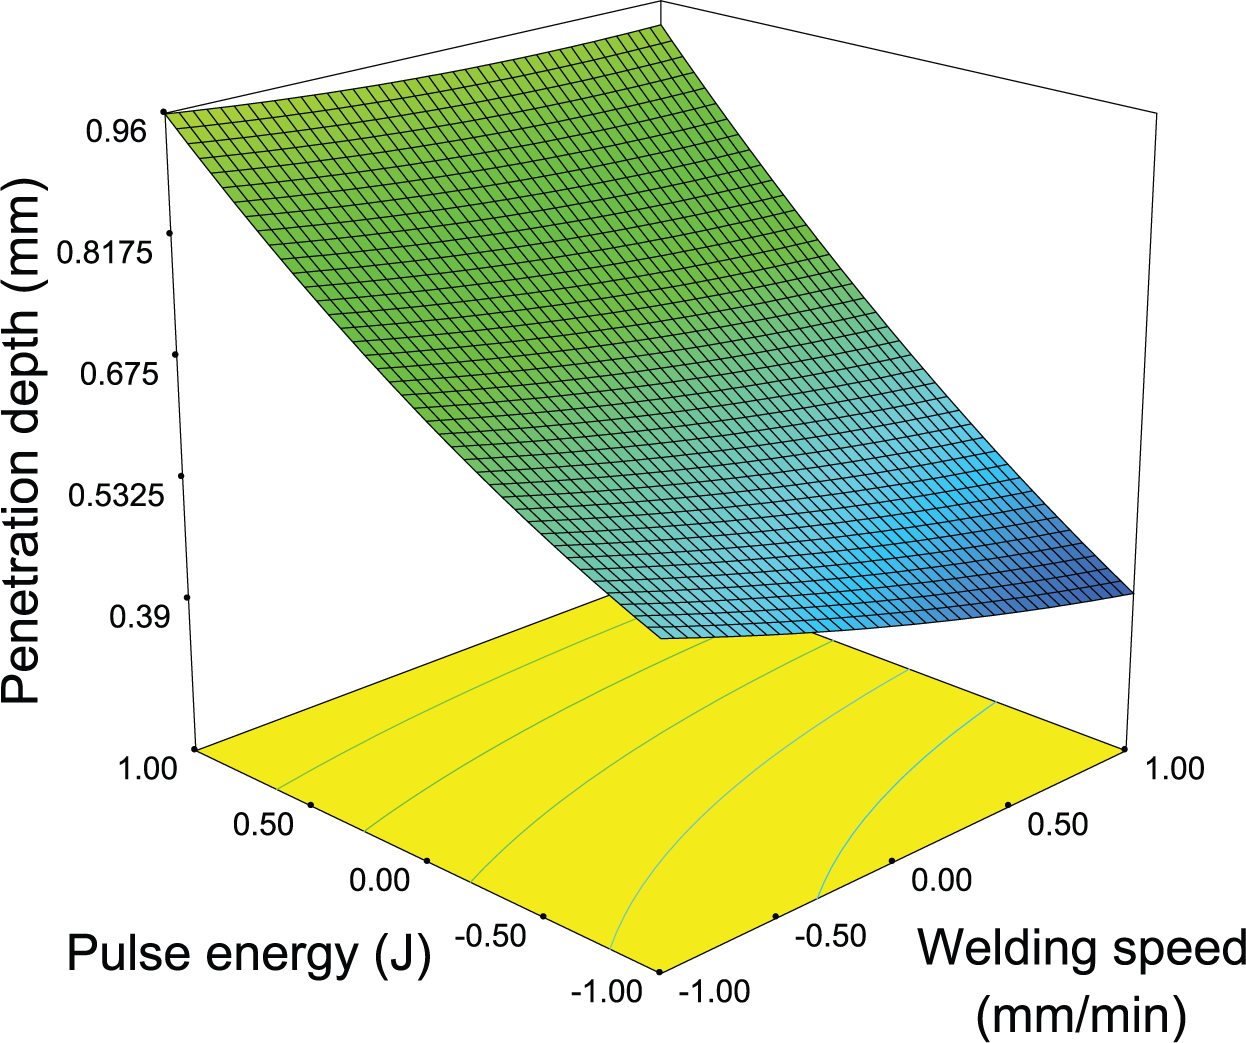
Interaction effect of pulse energy and welding speed on penetration depth.
HAZ
Table 6 shows that the chosen variables are significant besides the interaction effects of pulse width and welding speed and pulse energy and welding speed on HAZ. From Figure 15, it can be noted that higher welding speed leads to reduced HAZ as the input power density has opposite relationship with welding speed. When welding speed increases, heat input decreases per unit length which subsequently results in reduced HAZ. The other variables make the HAZ wider as heat input is greater.
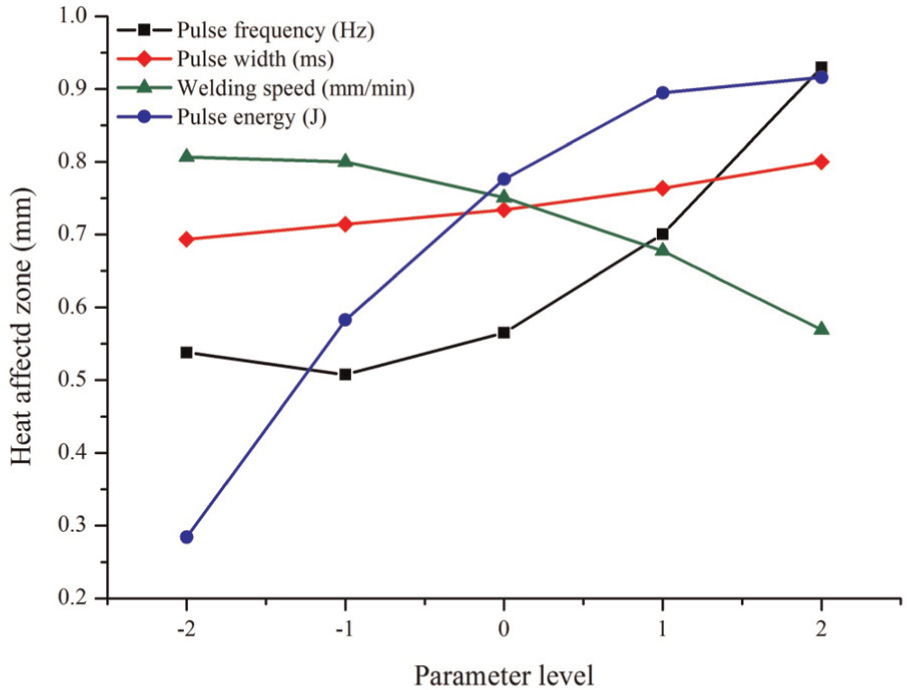
Main effect of process parameters on heat-affected zone.
From Figure 16, it can be noted that the HAZ can be minimized by decreasing the pulse width and increasing the welding speed values. It also represents that the significance of welding speed is more predominant at the higher values of the pulse width. Figure 17 shows that the minimum HAZ could be obtained at lower values of pulse energy and higher values of the welding speed.
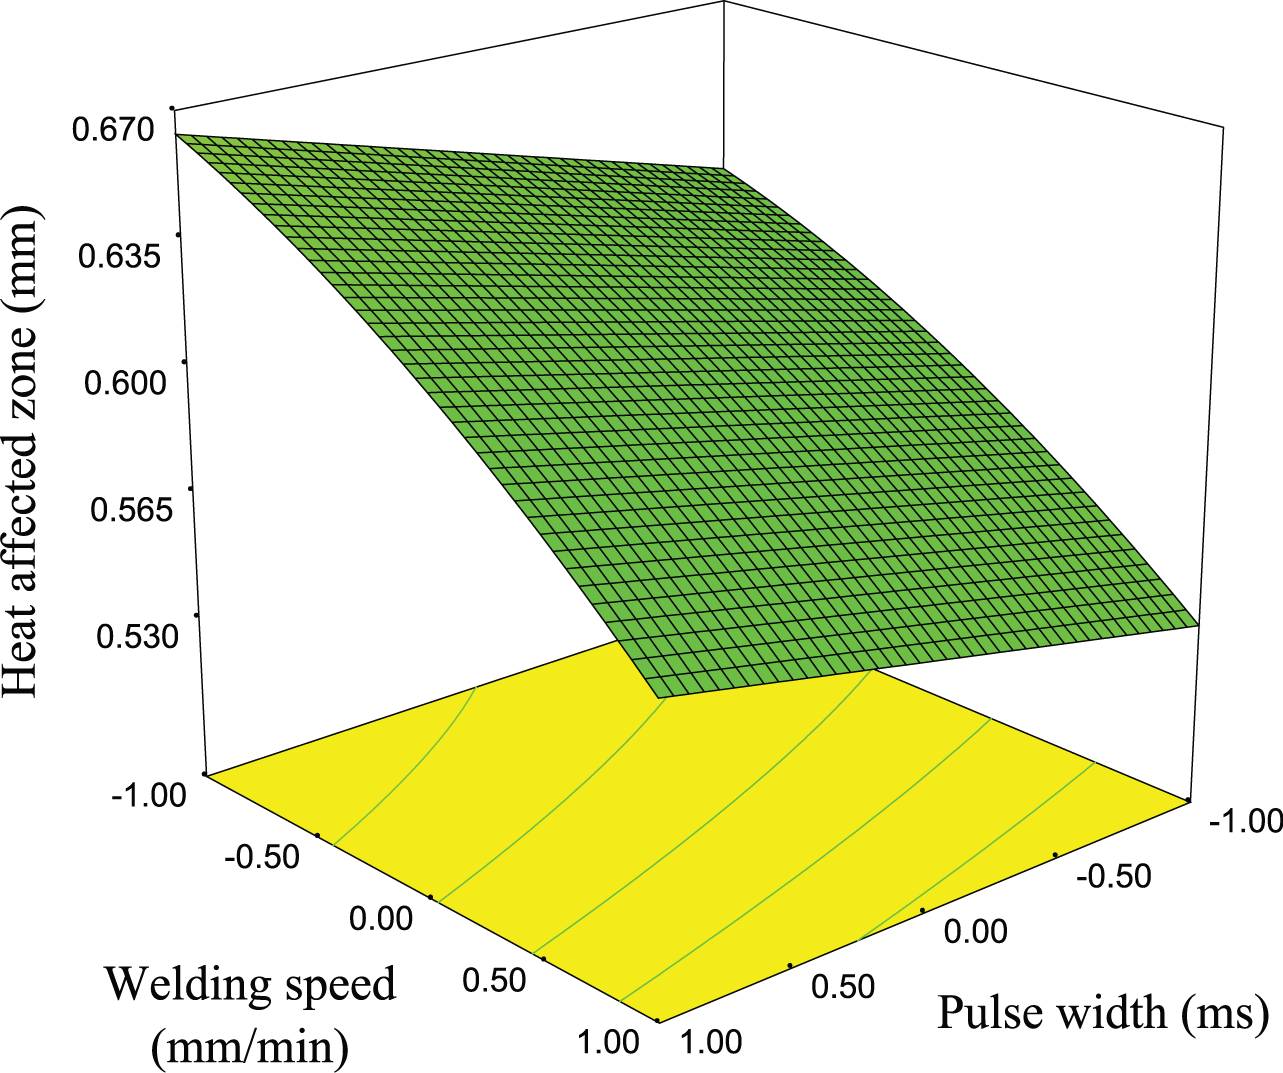
Interaction effect of pulse width and welding speed on heat-affected zone.
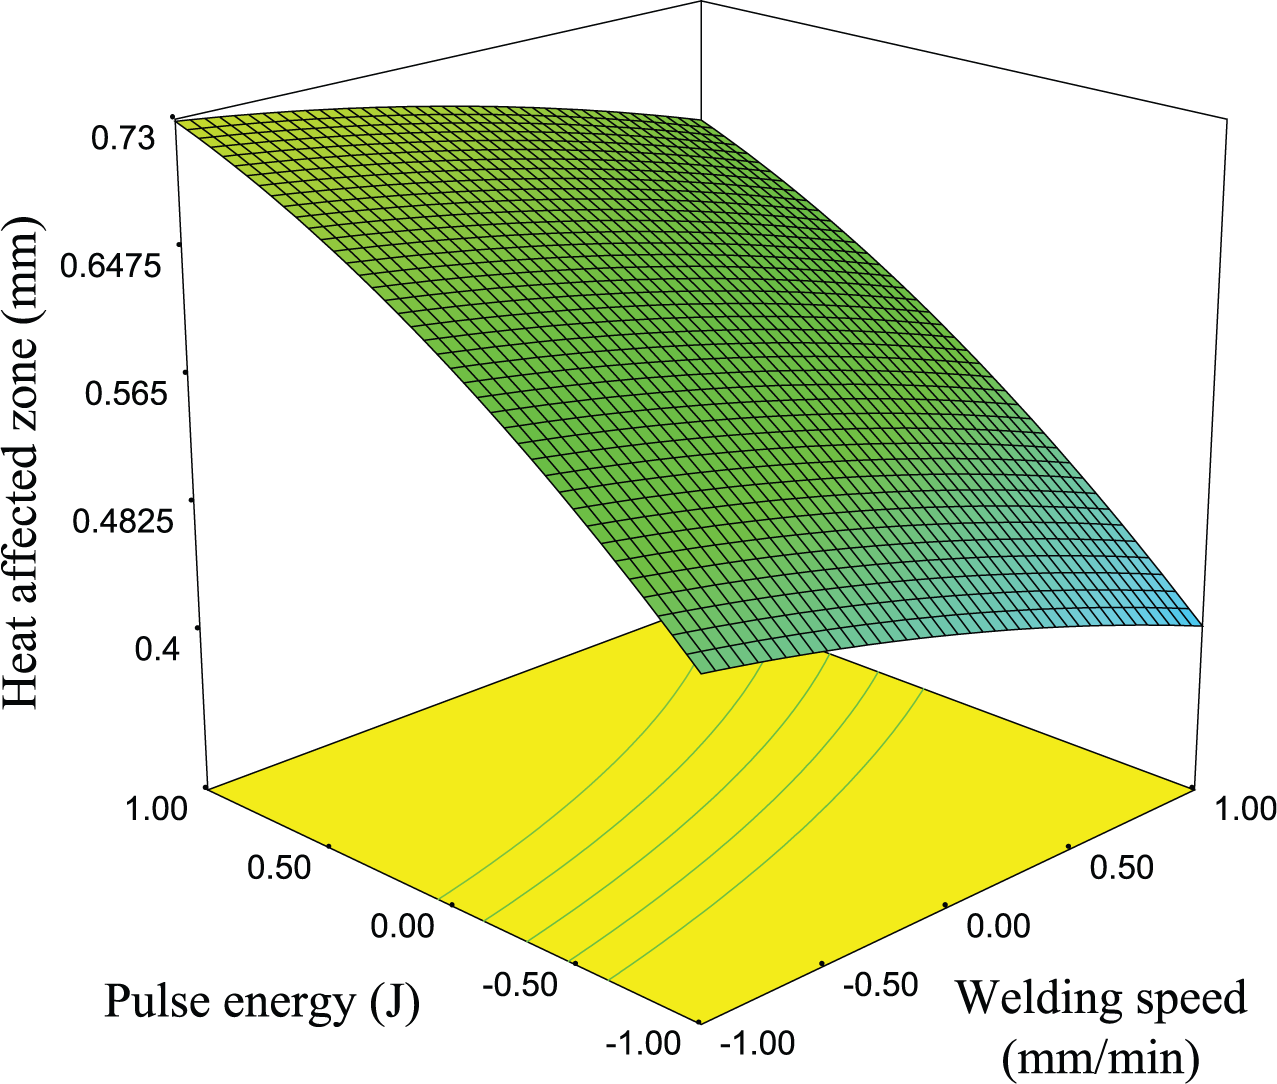
Interaction effect of welding speed and pulse energy on heat-affected zone.
Formulation of optimization problem
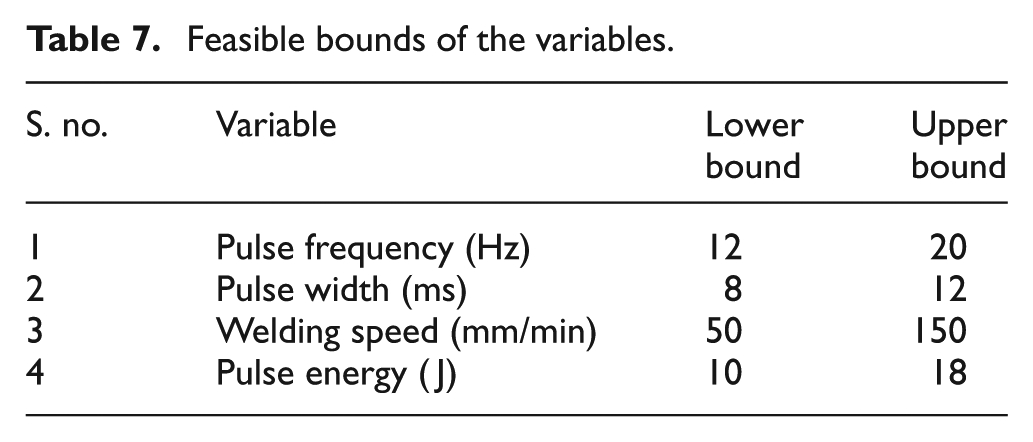
The selection of the set of welding parameters is the most important step to obtain the proper size of bead width, depth of penetration, and HAZ as these are the key parameters in deciding the weld quality. A quality weld joint requires the maximum depth of penetration, the minimum bead width, and the minimum HAZ. However, practically higher depth of penetration is possible at the expense of bead width and HAZ, meaning that higher depth of penetration is achieved at higher values of bead width and HAZ. This correlation between the bead geometry characteristics made the process more complex while selecting the set control variables for desired responses. Therefore, to deal with such complex optimization problem with multiple conflicting weld bead geometrical characteristics, in this work, the problem is formulated as a multi-objective optimization problem with the objective of simultaneously minimizing the bead width (Wb), maximizing the depth of penetration (Dp), and minimizing the HAZ. The models developed by RSM are treated as the objective functions and are optimized subject to the feasible bounds of the variables as listed in Table 7.
In the above equations, x1, x2, x3, and x4 represent the logarithmic transformations of pulse frequency, pulse width, welding speed, and pulse energy, respectively, and are given below:
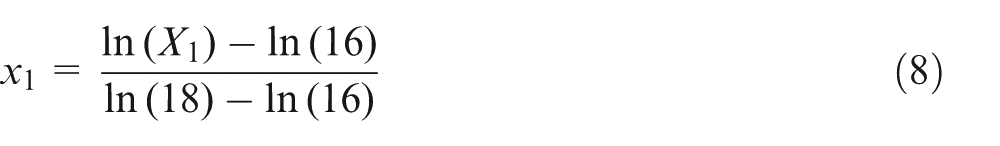
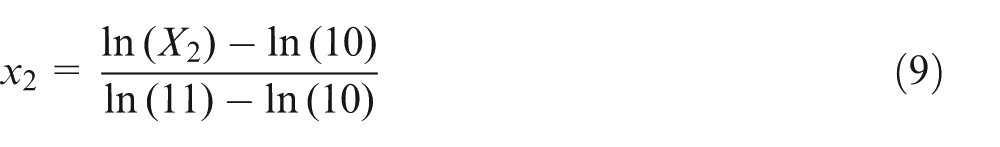
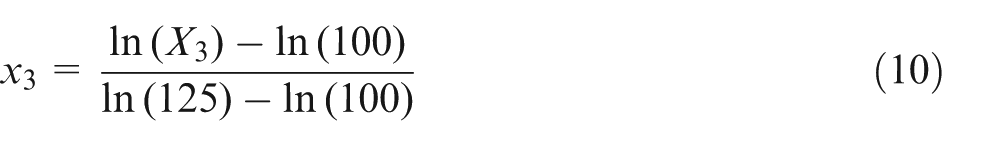
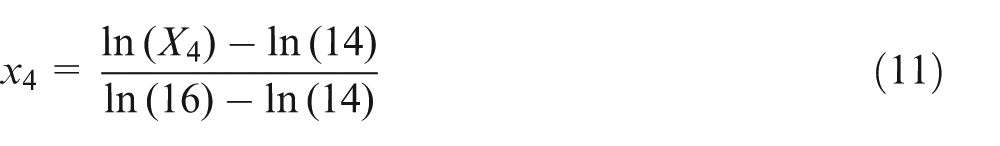
The above relations were obtained from the following transformation equation
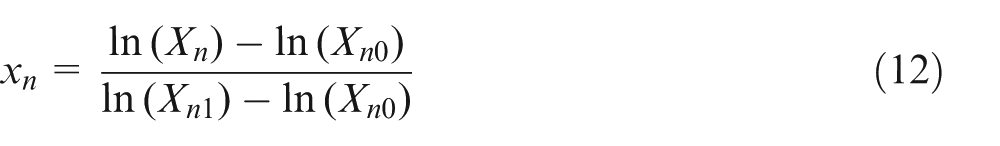
where xn is the coded value of any factor corresponding to its natural value Xn, Xn1 is the natural value of the factor at the +1 level, and Xn0 is the natural value of the factor corresponding to the base level or zero level.
Feasible bounds of the variables.
Results and discussion
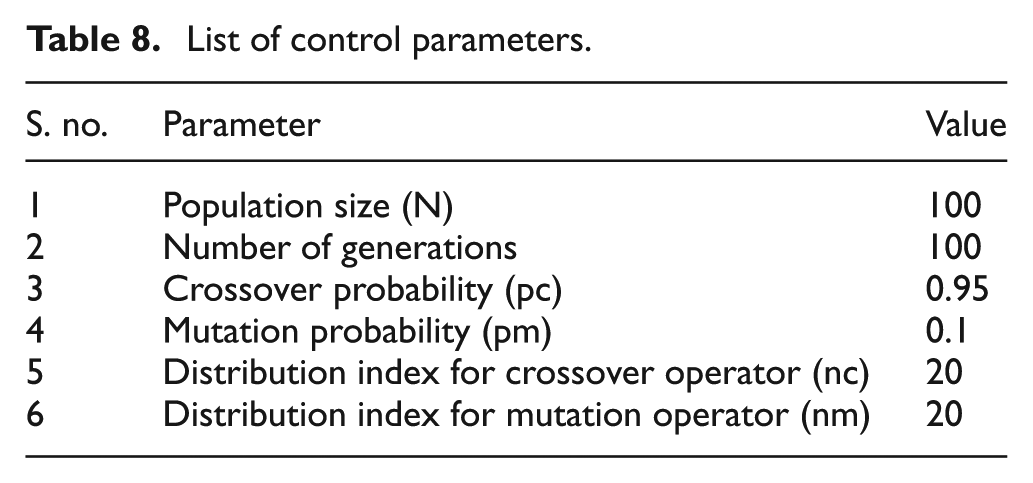
The source code of the proposed optimization algorithm NSGA-II was implemented using VC++ and run on a Core 2 Duo processor system. Table 8 lists the set of control parameters which was used to implement the algorithm. A few trials were made to find the set of control parameters that could achieve better convergence. The algorithm was repeated for 10 times to get more number of points in the Pareto-optimal front and the obtained front is shown in Figure 18. Some of the optimal values of the input variables and their corresponding process response values are listed in Table 9. In the Pareto-optimal front, all the solutions are equally good as they are the non-dominated solutions. The choice of a particular solution among the derived front has to be made based on the pre-fixed welding quality characteristic.
List of control parameters.
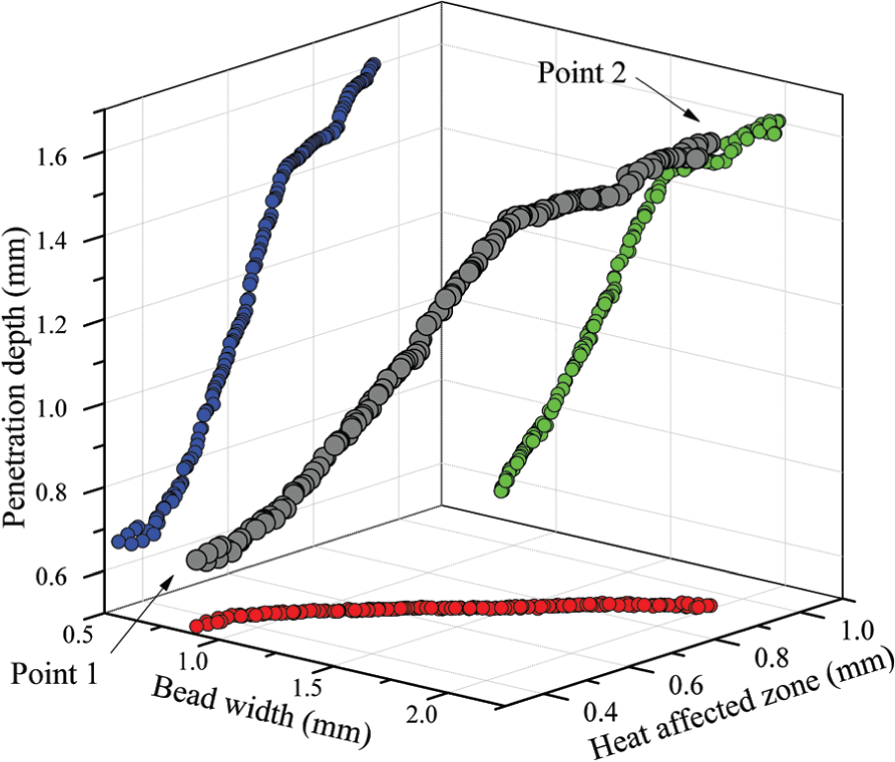
Pareto-optimal front.
Optimum welding conditions.
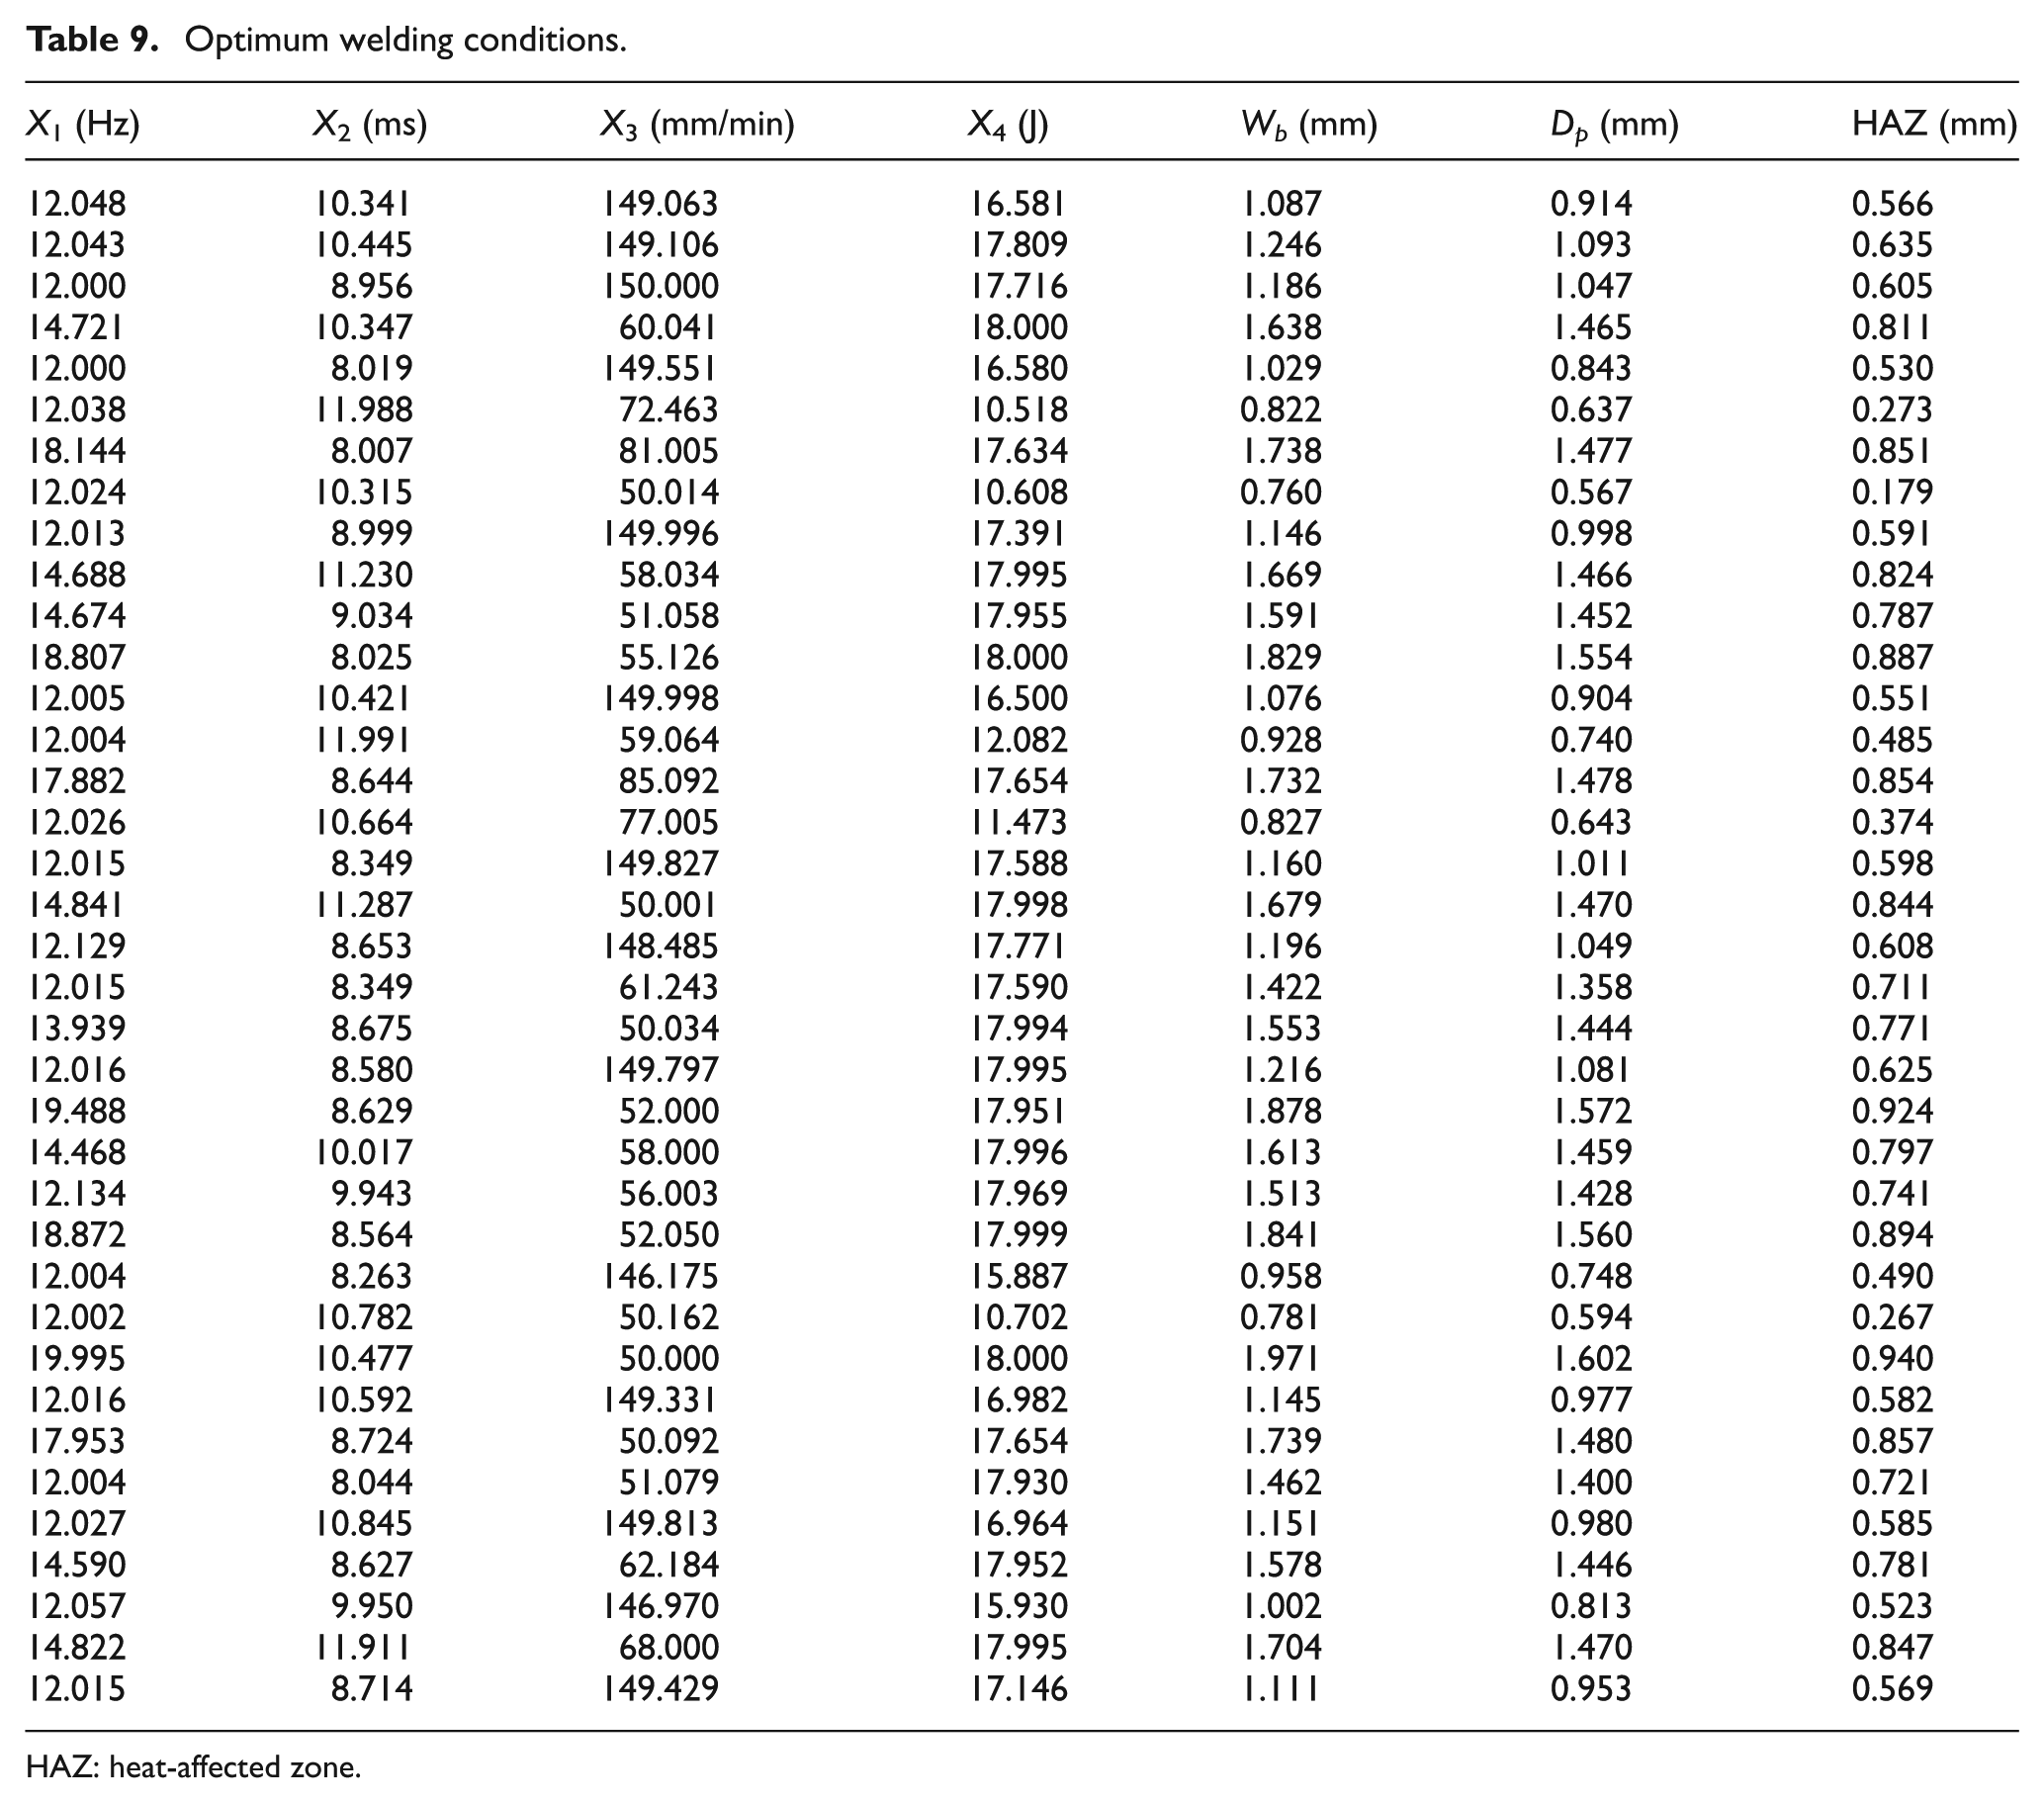
HAZ: heat-affected zone.
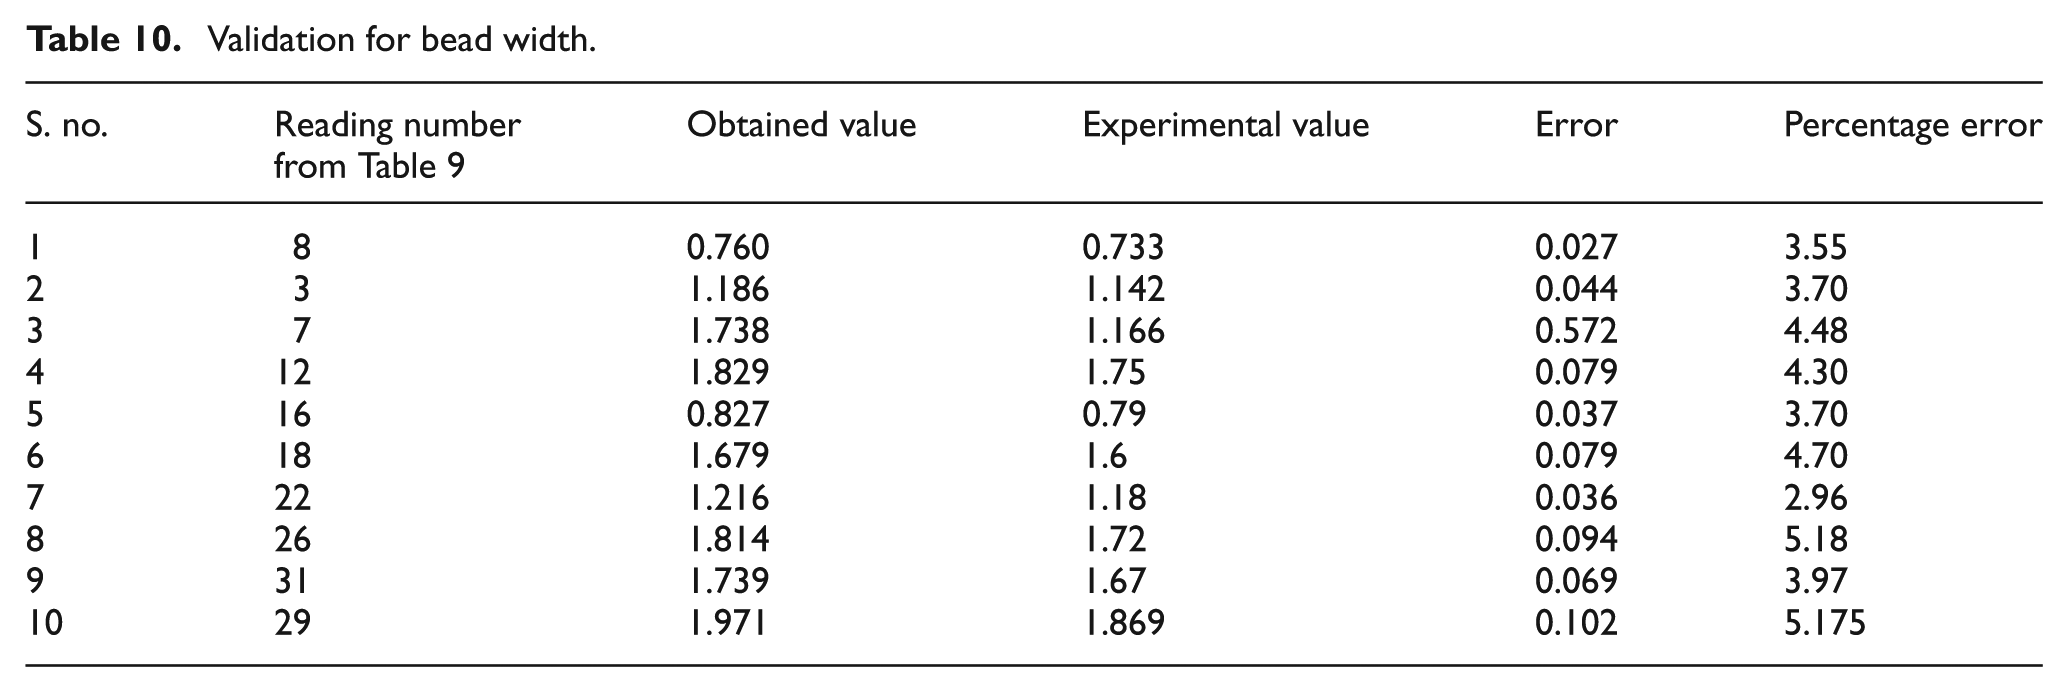
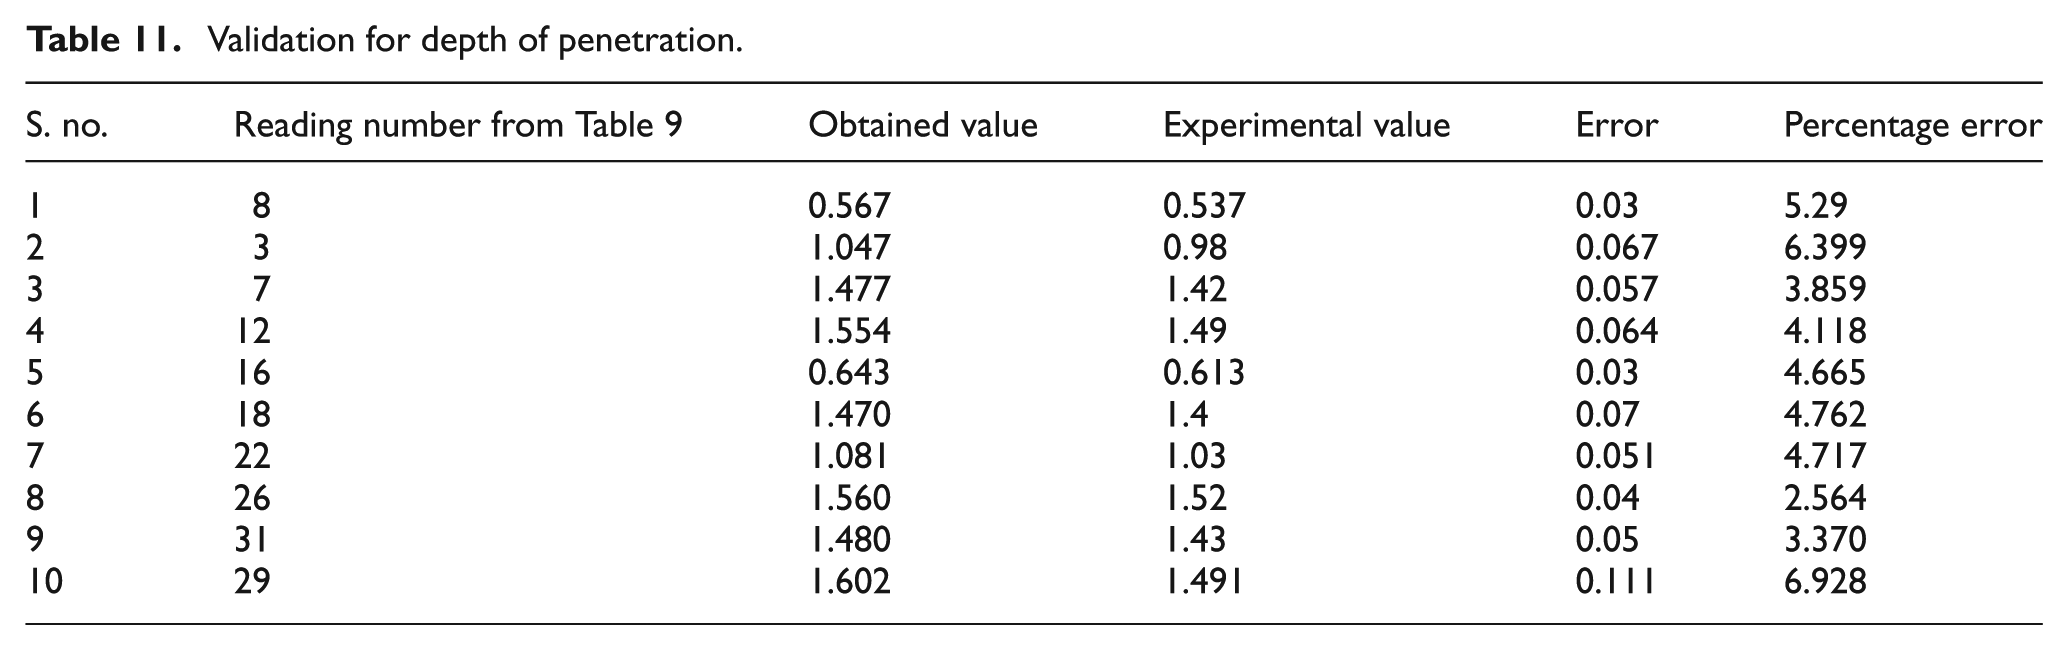
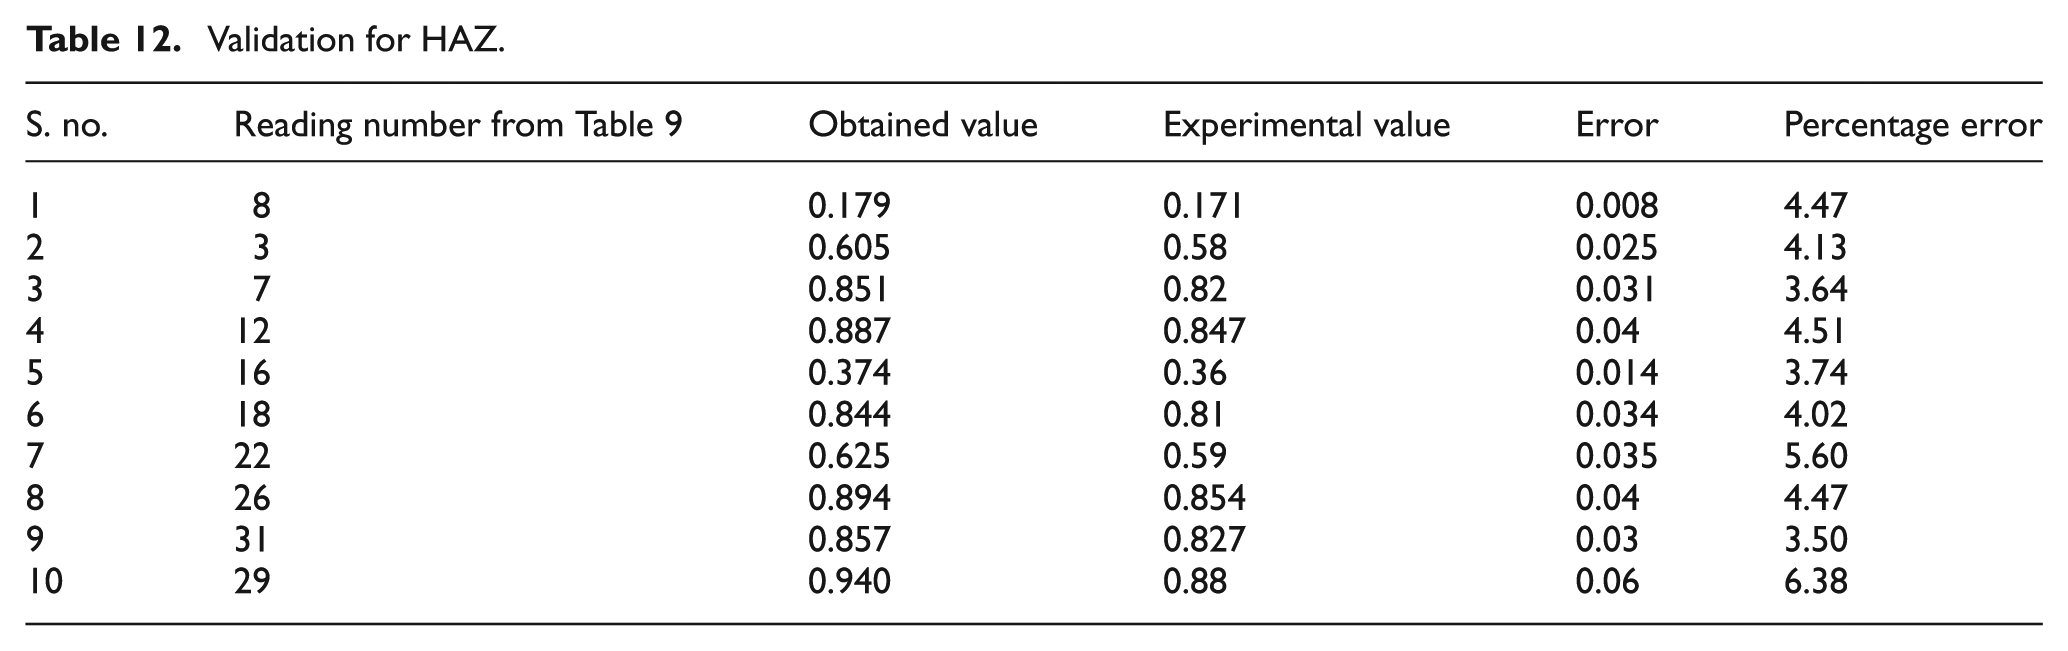
To validate the optimal values obtained by the proposed approach, 10 points on the Pareto-optimal front from Table 9 are considered as listed in Tables 10–12. For the 10 points chosen, the corresponding welding parameters were taken from Table 9 and welding was carried out at the respective process conditions. Tables 10–12 exhibit a comparison of the values obtained by the proposed approach and the experimentation. The model error for each response is calculated, and it is found that the average error has not exceeded 5% for any response. As there is a close correlation between the obtained values and the experimental values, the proposed approach could be used as an effective tool for getting the optimal solutions.
Validation for bead width.
Validation for depth of penetration.
Validation for HAZ.
Conclusion
The order of the day in industries is full automation. Welding is one process which inevitably requires automation. To automate a process, there is a need to find the optimal set of process variables. This work deals with an approach that can find all the Pareto-optimal set of solutions for weld bead characteristics. The specific conclusions drawn from this work are summarized below:
The effects of various parameters such as pulse frequency, pulse width, welding speed, and pulse energy were studied in Nd:YAG laser welding process.
An efficient methodology was proposed to predict the weld bead parameters when welding MDN 300 maraging steel.
The optimal welding conditions were obtained for the minimum bead width, maximum depth of penetration, and minimum HAZ within the feasible boundaries of the welding parameters.
The obtained solutions were validated with the experimental values, and it shows that the proposed approach integrating RSM and NSGA-II is suitable to identify optimum process settings.
The proposed methodology facilitates automated optimal settings for the Nd:YAG laser welding process to operate in computer-integrated manufacturing (CIM) system.
Future scope
In addition to the chosen input control variables, the other variables such as laser beam angle, spot diameter, and focal distance may be considered depending on the capacity of the machine used. In the output responses, total volume of the bead may be considered in order to reduce the welding cost. The proposed methodology could be extended to any welding process as it has no limitations with regard to processes and materials.
Footnotes
Declaration of conflicting interests
The author(s) declared no potential conflicts of interest with respect to the research, authorship, and/or publication of this article.
Funding
The author(s) received no financial support for the research, authorship, and/or publication of this article.