
Abstract
In this study, a new methodology, hybrid NSGA-III with SPEA/R (HNSGA-III&SPEA/R), has been developed to design and achieve cost optimization of powertrain mount system stiffness parameters. This problem is formalized as a multi-objective optimization problem involving six optimization objectives: mean square acceleration and mean square displacement of the powertrain mount system. A hybrid HNSGA-III&SPEA/R is proposed with the integration of Strength Pareto evolutionary algorithm based on reference direction for Multi-objective (SPEA/R) and Many-objective optimization genetic algorithm (NSGA-III). Several benchmark functions are tested, and results reveal that the HNSGA-III&SPEA/R is more efficient than the typical SPEA/R, NSGA-III. Powertrain mount system stiffness parameters optimization with HNSGA-III&SPEA/R is simulated respectively. It proved the potential of the HNSGA-III&SPEA/R for powertrain mount system stiffness parameter optimization problem.
Introduction
The vehicle’s power source system, including engines, transmission, and clutches, is the source of energy for vehicles and is also one of the main sources of vibration in the vehicle. Therefore, the engine mount is usually installed between the power source system and the car body to isolate the vibration transmitted from the power source system to the body as Yu and Naganathan. 1 The system consists of mounts, and power source system is powertrain mount system. In a full-car dynamics system, the mounts play an important role, and the principle diagram of a full-car dynamic model with a power source system mounting system is shown in Figure 1. Good powertrain system mounts will improve the performance of vibration and noise and harshness (NVH) of the vehicle while extending the life of the engine and related parts which is pointed out as Adiguna et al. 2 Engine mounts can be categorized according to the characteristics of the ability to control of mounts as passive mounts (rubber mounts and hydraulic mounts are the most popular), active mounts, and semi-active mounts. Typically, rubber mounts include a metal frame where the rubber is bonded through adhesives or during vulcanization. Rubber mounts are the most widely used engine mounts for their low cost and simple structure. In order to design high-quality mounts as required, the parameters of the mounts must match their stiffnesses. Mounts with good stiffnesses not only reduce the vibration of the engine transmitting to the elastic substrate (such as frame and body) but also reduce the undesirable effect of stimuli from the road and the wheel impacting on the body car. Therefore, an important task in designing the power source system mounting system is to calculate the optimal stiffness parameters for the power source system mounting system. This is a multi-object optimization issue. Figure 1 shows the specific model of the motor bearing system.
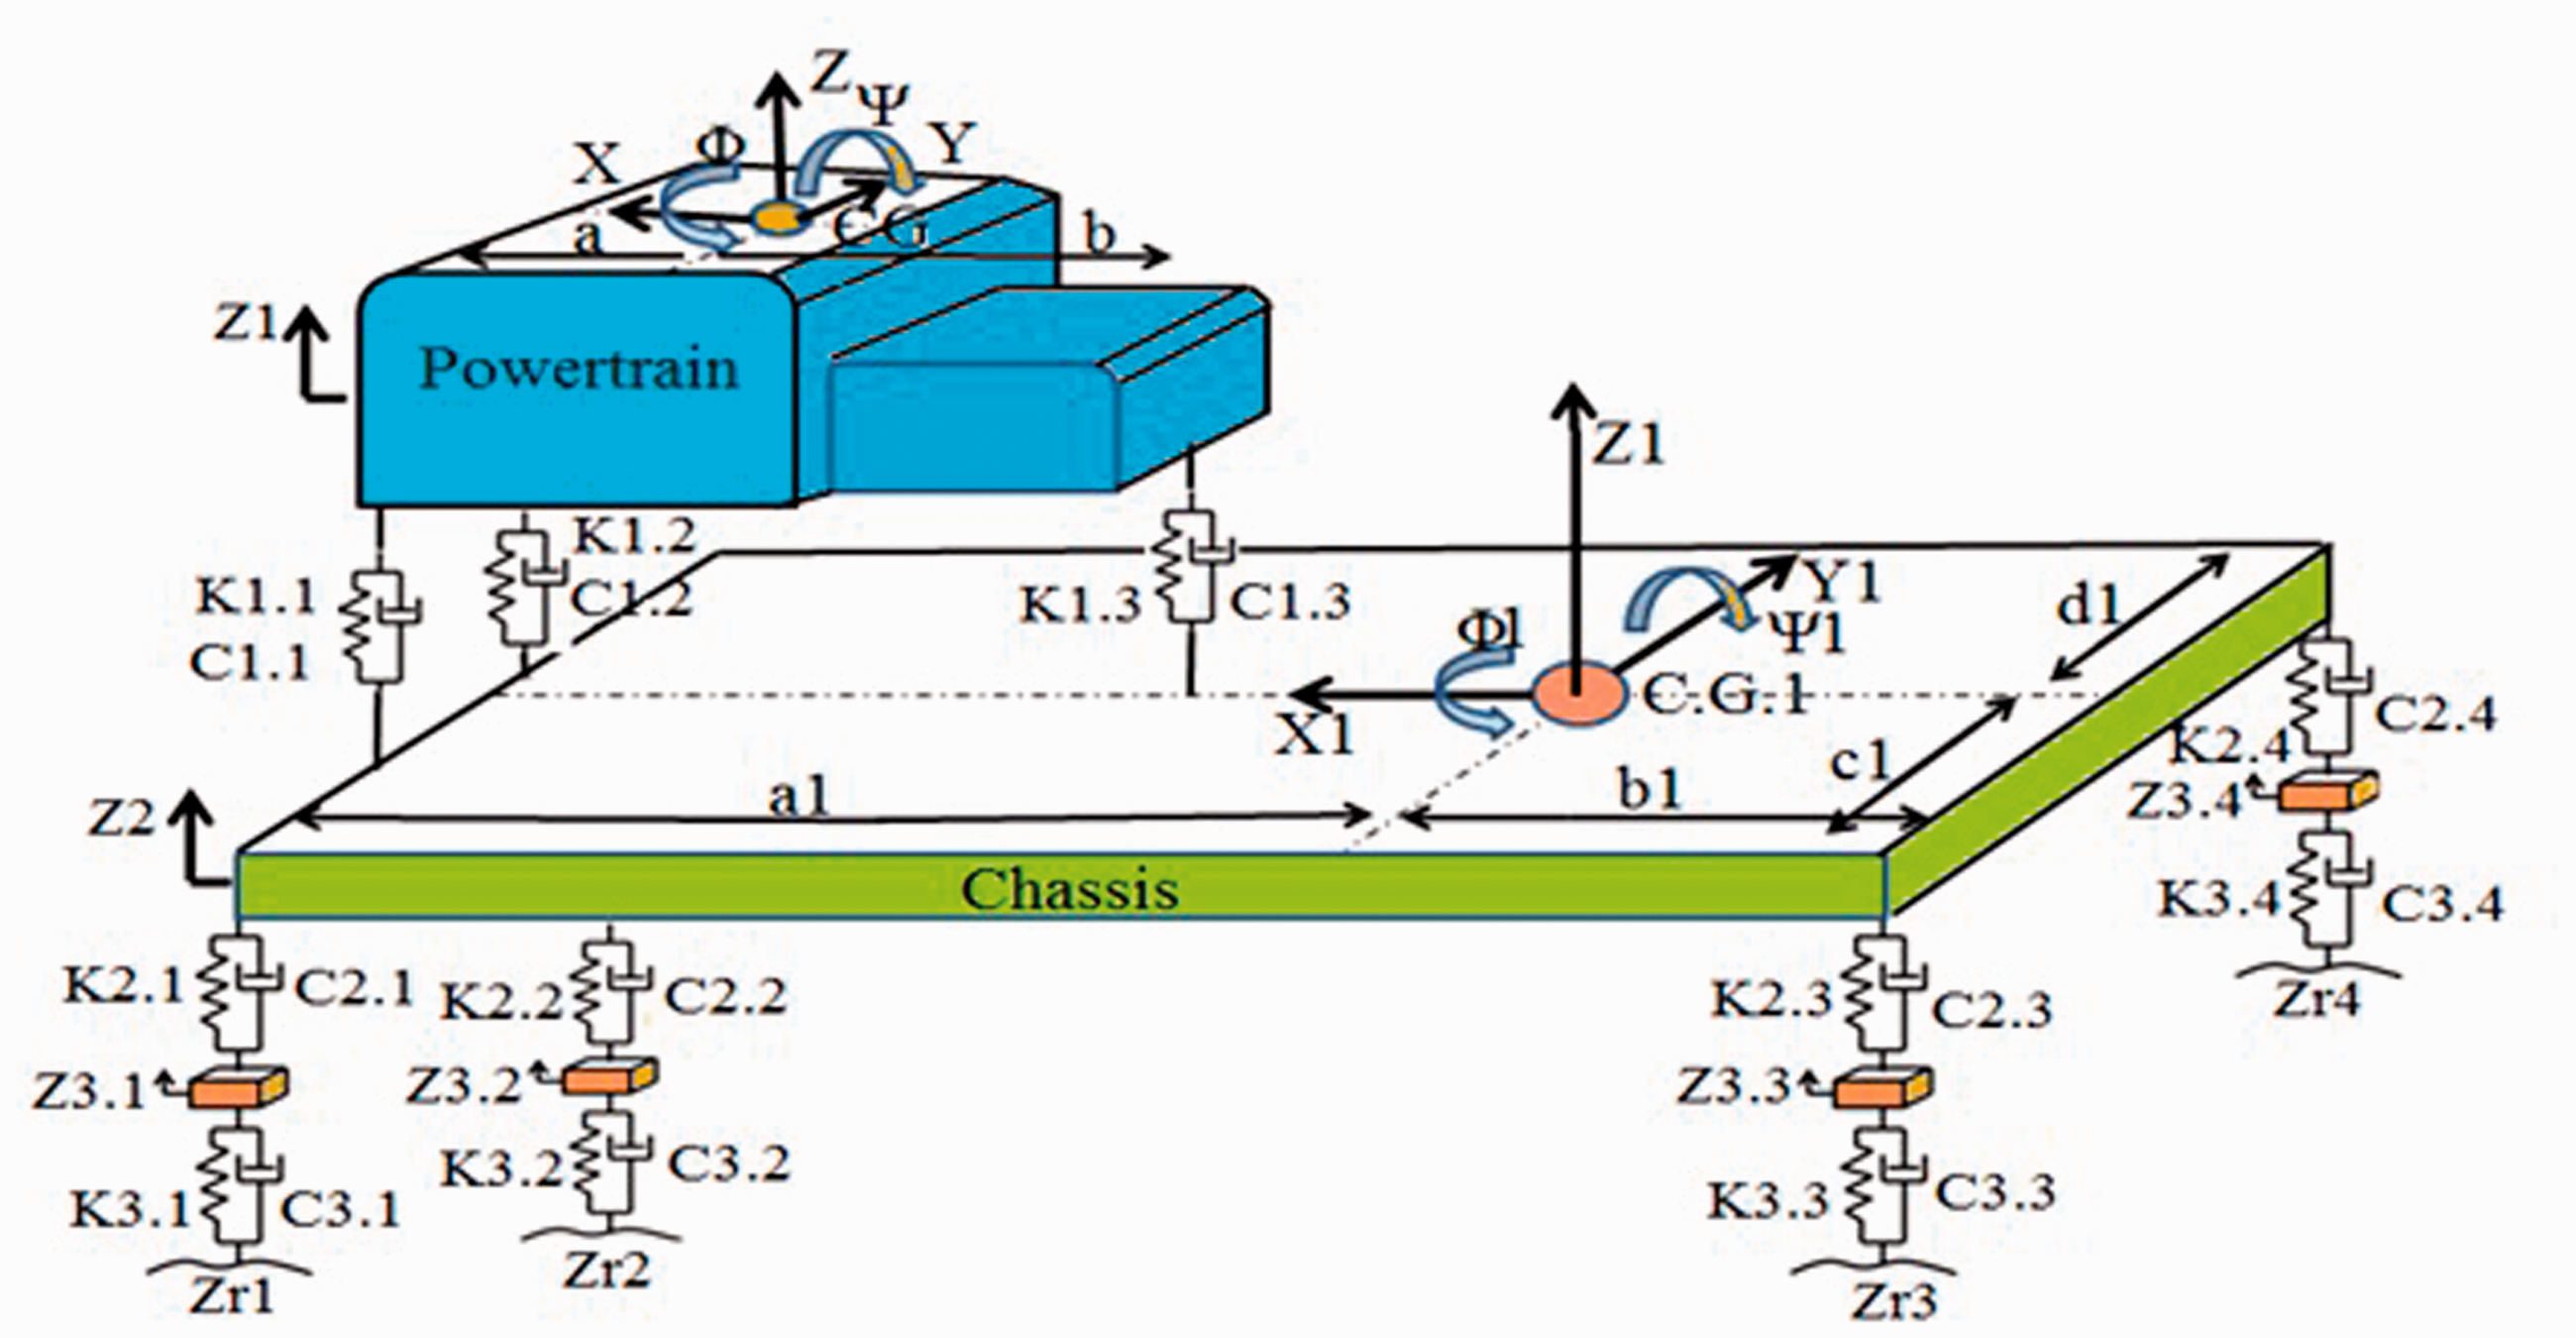
The principle diagram of a full-car dynamic model with a power source system mounting system.
In recent years, several researchers have been studying in this field, and different methods with different capabilities were developing that many of them were presented in an overview and tutorial. 3 NSGA-II was developed by Deb et al., 4 and till date, several variants and applications for NSGA II have been developed by Chang and Chang.35 Ishibuchi et al. 6 and Malekmohammadi et al., 7 and Kalyanmoy 8 proposed applying MONGA-II to a number of many-objective test problems. NSGA-III is designed to face multiple goals at once (more than two). This algorithm is proposed by Deb and Jain 9 to change some selection mechanisms. Here, they proposed a Multi-objective evolution algorithm based on the reference point according to the NSGA-II framework, emphasizing that the population is not common, but close to a set of reference points provided. The proposed NSGA-III is applied to a number of multi-objective testing issues with 3–15 goals.
In addition, the Pareto 2 strong evolutionary algorithm (SPEA2) is an extended version of SPEA’s multi-objective evolution optimization algorithm. This algorithm uses a mechanism such as k-Recent Neighbor (kNN) and a specialized ranking system to align members of the population and choose the next generation of population from the combination of the current population in and out of the stream created by genetic operators (mutations and crossover). SPEA2 is one of the most well-known and most useful multi-objective optimization algorithms and is widely used and applied to handle real-world scientific and technical applications. There are some researchers on this algorithm as well. Kim et al. 10 propose two new mechanisms to be added to SPEA2 to improve its searchability for a more efficient cross-mechanism and storage mechanism to maintain the diversity of solutions in the target space and transform. Zitzler et al. 11 proposed an SPEA2: Improving the Pareto evolution algorithm to power multi-objective optimization. Borisevic and Bartlett 12 proposed a design optimization scheme using multi-objective genetic algorithms applied to offshore platform processes. Optimization criteria relate to unavailability, cost, fake trip, and maintenance downtime to obtain an optimal safety system design. Hiroyuki and Hiroki 13 proposed a new method to assess the probability reliability with multi-target super therapy (MOMH) in the smart grid. It is very useful to evaluate a set of Pareto solutions in a systematic way. Inside, SPEA2 (Intensity 2 Evolutionary Algorithm) is used to evaluate the Pareto solution due to the good performance of a variety of solutions different from normal multi-objective reliability assessment. De Tommasi et al. 14 have proposed a multi-objective optimization for radio-frequency circuit blocks through replacement models and NBI and SPEA2 methods. Sokratis and George 15 proposed a model-based machine translation system using large monolithic blocks in the target language from which statistical information was extracted. This study reported using a specific machine translation to represent the test that SPEA2 was chosen as the optimization method. Zhao et al. 16 proposed an SPEA2 algorithm based on adaptive selection evolutionary operators. The proposed algorithm can selectively adapt simulated binary interference, polynomial mutations, and differential evolutionary operators in their evolution according to their contribution to the external repository. Imen et al. 17 proposed SPEA2 for the Economic/Environmental Power Distribution problem. In the past, minimizing fuel costs is the only objective function of economic power coordination. Due to the modification of clean air, behavior has been applied to reduce emissions of polluting emissions from power plants, and utilities have also changed strategies to reduce pollution and atmospheric emissions, minimizing generation waste when other target functions turn economic capacity into versatile-objective problem with conflicting goals. Jiang and Yang 18 published a new SPEA based on the reference direction, denoted SPEA/R, to optimize multiple goals. A significant extension of the early SPEA algorithms is SPEA/R. It applies to the advantage of SPEA2’s physical assignment in quantifying solutions diversity and convergence in one method. It is appropriate to replace the most time-consuming density estimator with an algorithm based on the reference direction. Their proposed exercise duties also take into account the convergence both local and global.
Recently, there are a number of multi-objective optimization algorithms that have been proposed. Some of these new studies include the Multi-objective gray wolf optimizer 19 and Optimizing multi-target cats. 20 Velazquez et al. 21 proposed Multi-objective differential evolution, Hemmatian 22 proposed Multi-objective gravitational search algorithm, Shi and Kong 23 proposed a Multi-objective ant colony optimization algorithm based on elitist selection strategy, Hancer et al. 24 proposed a multi-objective artificial bee colony approach to feature selection using fuzzy mutual information, and Lin et al. 25 proposed the Multi-objective teaching-learning-based optimization algorithm. Because they cannot solve all optimization problems correctly even though all algorithms can approximate the true Pareto optimal front of a given problem. Therefore, new hybrid algorithms need to be proposed to be able to solve new problems that have not been resolved before and/or to have better accuracy than existing techniques.
Some methods of hybridization of optimal algorithms have been developed recently: Jeong et al. 26 proposed the development and investigation of Efficient GA/PSO-hybrid algorithm applicable to real-world design optimization; Premalatha et al. 20 proposed Hybrid PSO and GA for global maximization; Bai 27 proposed a way to optimize multi-target particles based on extreme optimization with variable and inertial inertia mutations to improve the performance of the algorithm while solving some problems in multi-target particle optimization. A new hybrid heuristic optimization method is published in the current work for multi-purpose issues. A hybrid method is proposed to combine the simple method of Nelder–Mead with the non-dominance sequencing method (NSGA II) to find the best global point. In order to evaluate the performance of the new proposed method, it has been shown through some complex standard functions of Zandavi. 28 Yang et al. 29 proposed a Generate-first-choose-later algorithm to solve multivariate technical optimization problems so that Pareto solutions can be set and optimize multiple times until satisfactory results are obtained. An effective method consists of independent parallel genetic algorithms by dividing the entire population into multiple populations by Rashidi et al. 30 Each population group is assigned to different weights to search for optimal solutions in different directions. Thus, most published hybrid algorithms have more advantages. This hybridization has overcome the limitations of each optimization algorithm. This proves that this is one of the methods that need to be studied in multi-objective optimization.
In this article, a new hybrid optimization method is proposed in the current work for multi-objective problems. This is the hybrid between the Strength Pareto evolutionary algorithm based on reference direction for Multi-objective (SPEA/R) and Many-objective optimization genetic algorithm (NSGA-III) to find the best of the Pareto-optimal front. The performance of the new algorithm is demonstrated via some complex benchmark functions and for powertrain mount system stiffness parameter optimization problem with six-objective optimization in model 3D.
The organization of this paper is as follows: “Structure” section describes the proposed hybrid HNSGA-III&SPEA/R method and computational experimentation with several benchmark functions. “Vibration characteristic of the powertrain mount system” section describes the vibration characteristic of the powertrain mount system and simulation results of application HNSGA-III&SPEA/R method to optimization of the powertrain mount system stiffness parameter. Finally, a conclusion is given.
Structure
Many-objective optimization Genetic Algorithm NSGA-III
Deb and Jain 9 improved the NSGA-II gene algorithm into NSGA-III. The NSGA-III algorithm is based on the steps described in flowchart of NSGA-III as shown in Figure 2.
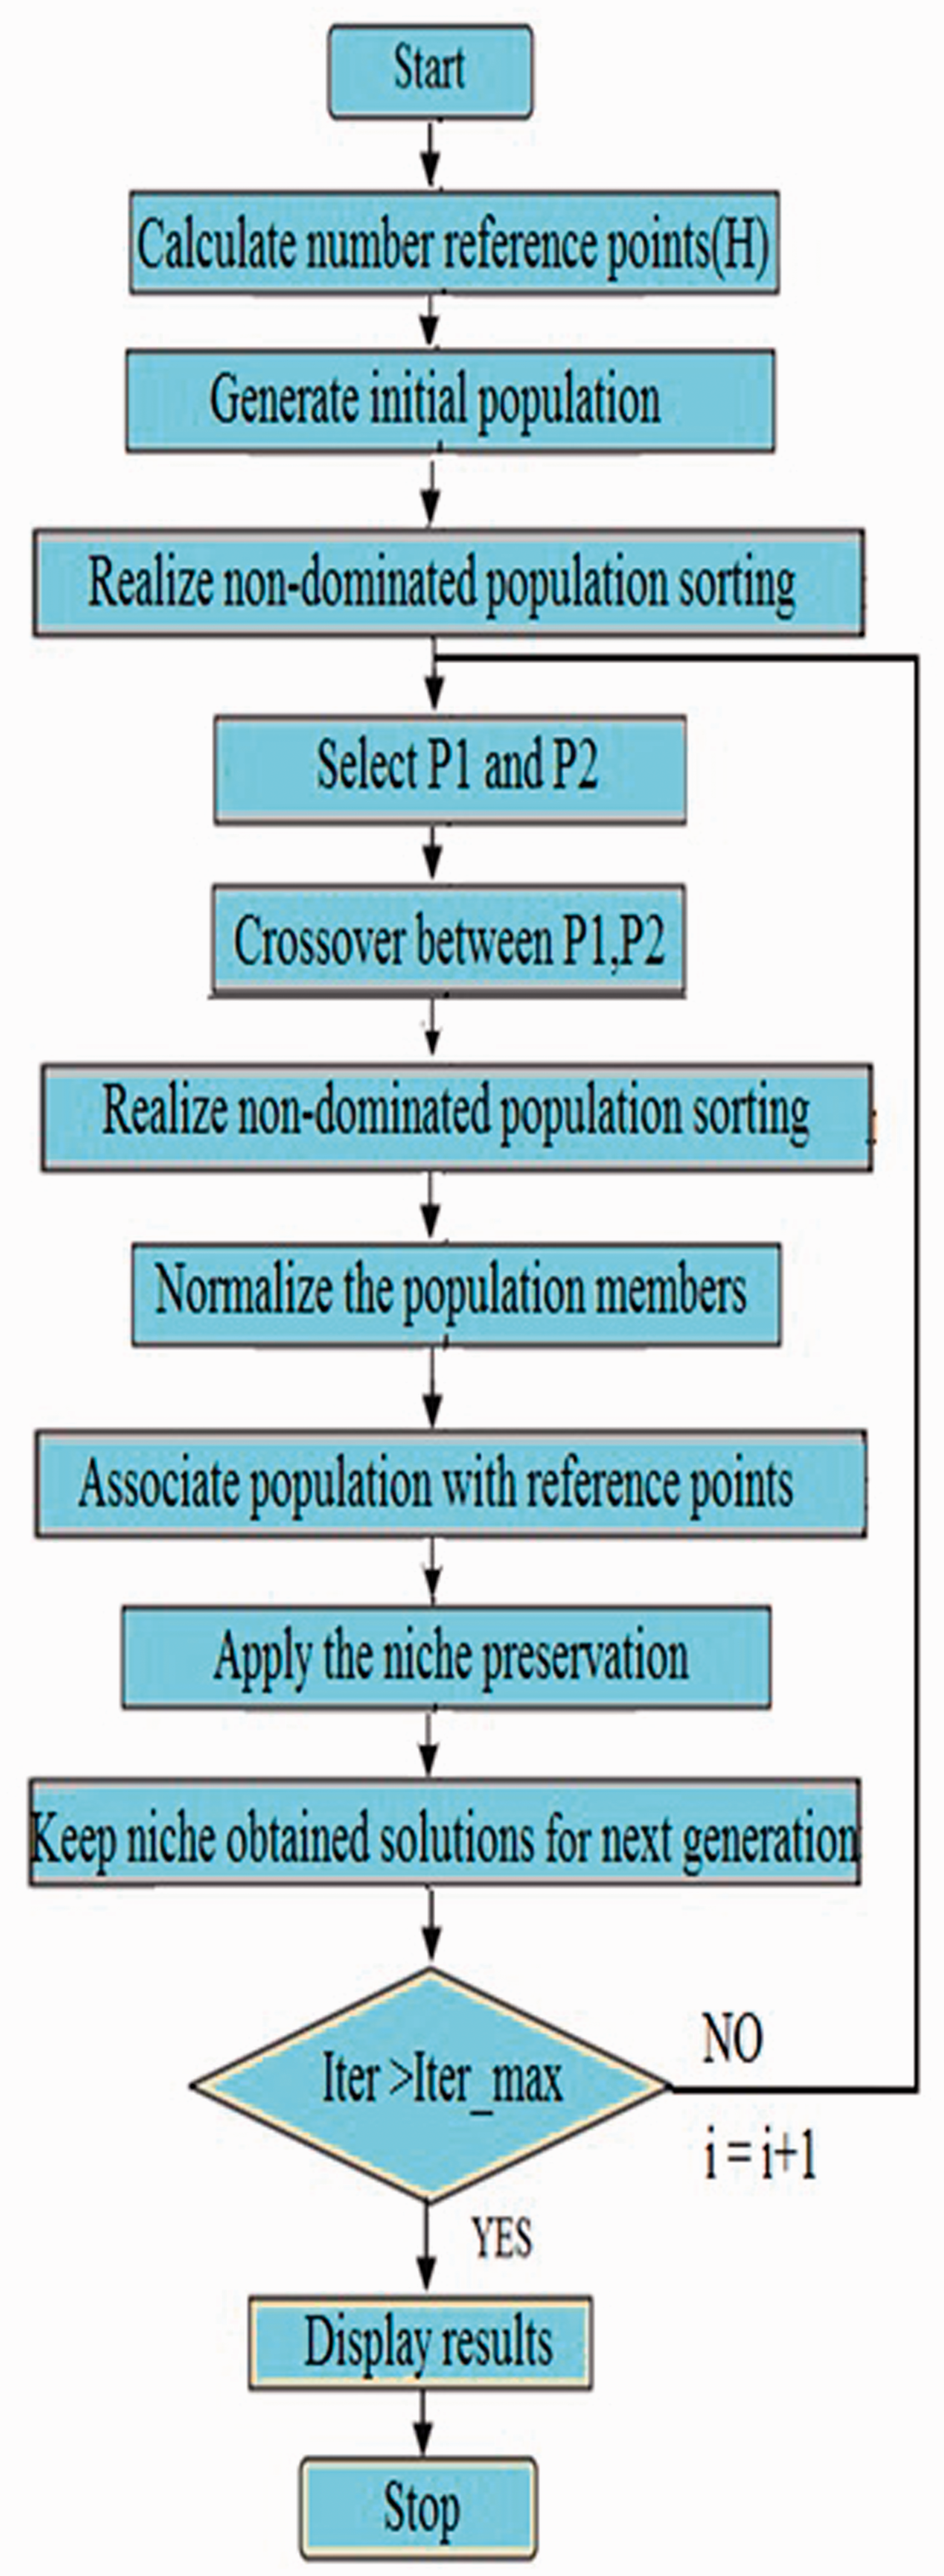
Flowchart of of NSGA-III.
SPEA/R algorithm
Jiang and Yang 18 proposed SPEA/R algorithm, and it is presented in the flowchart of SPEA/R as shown in Figure 3.
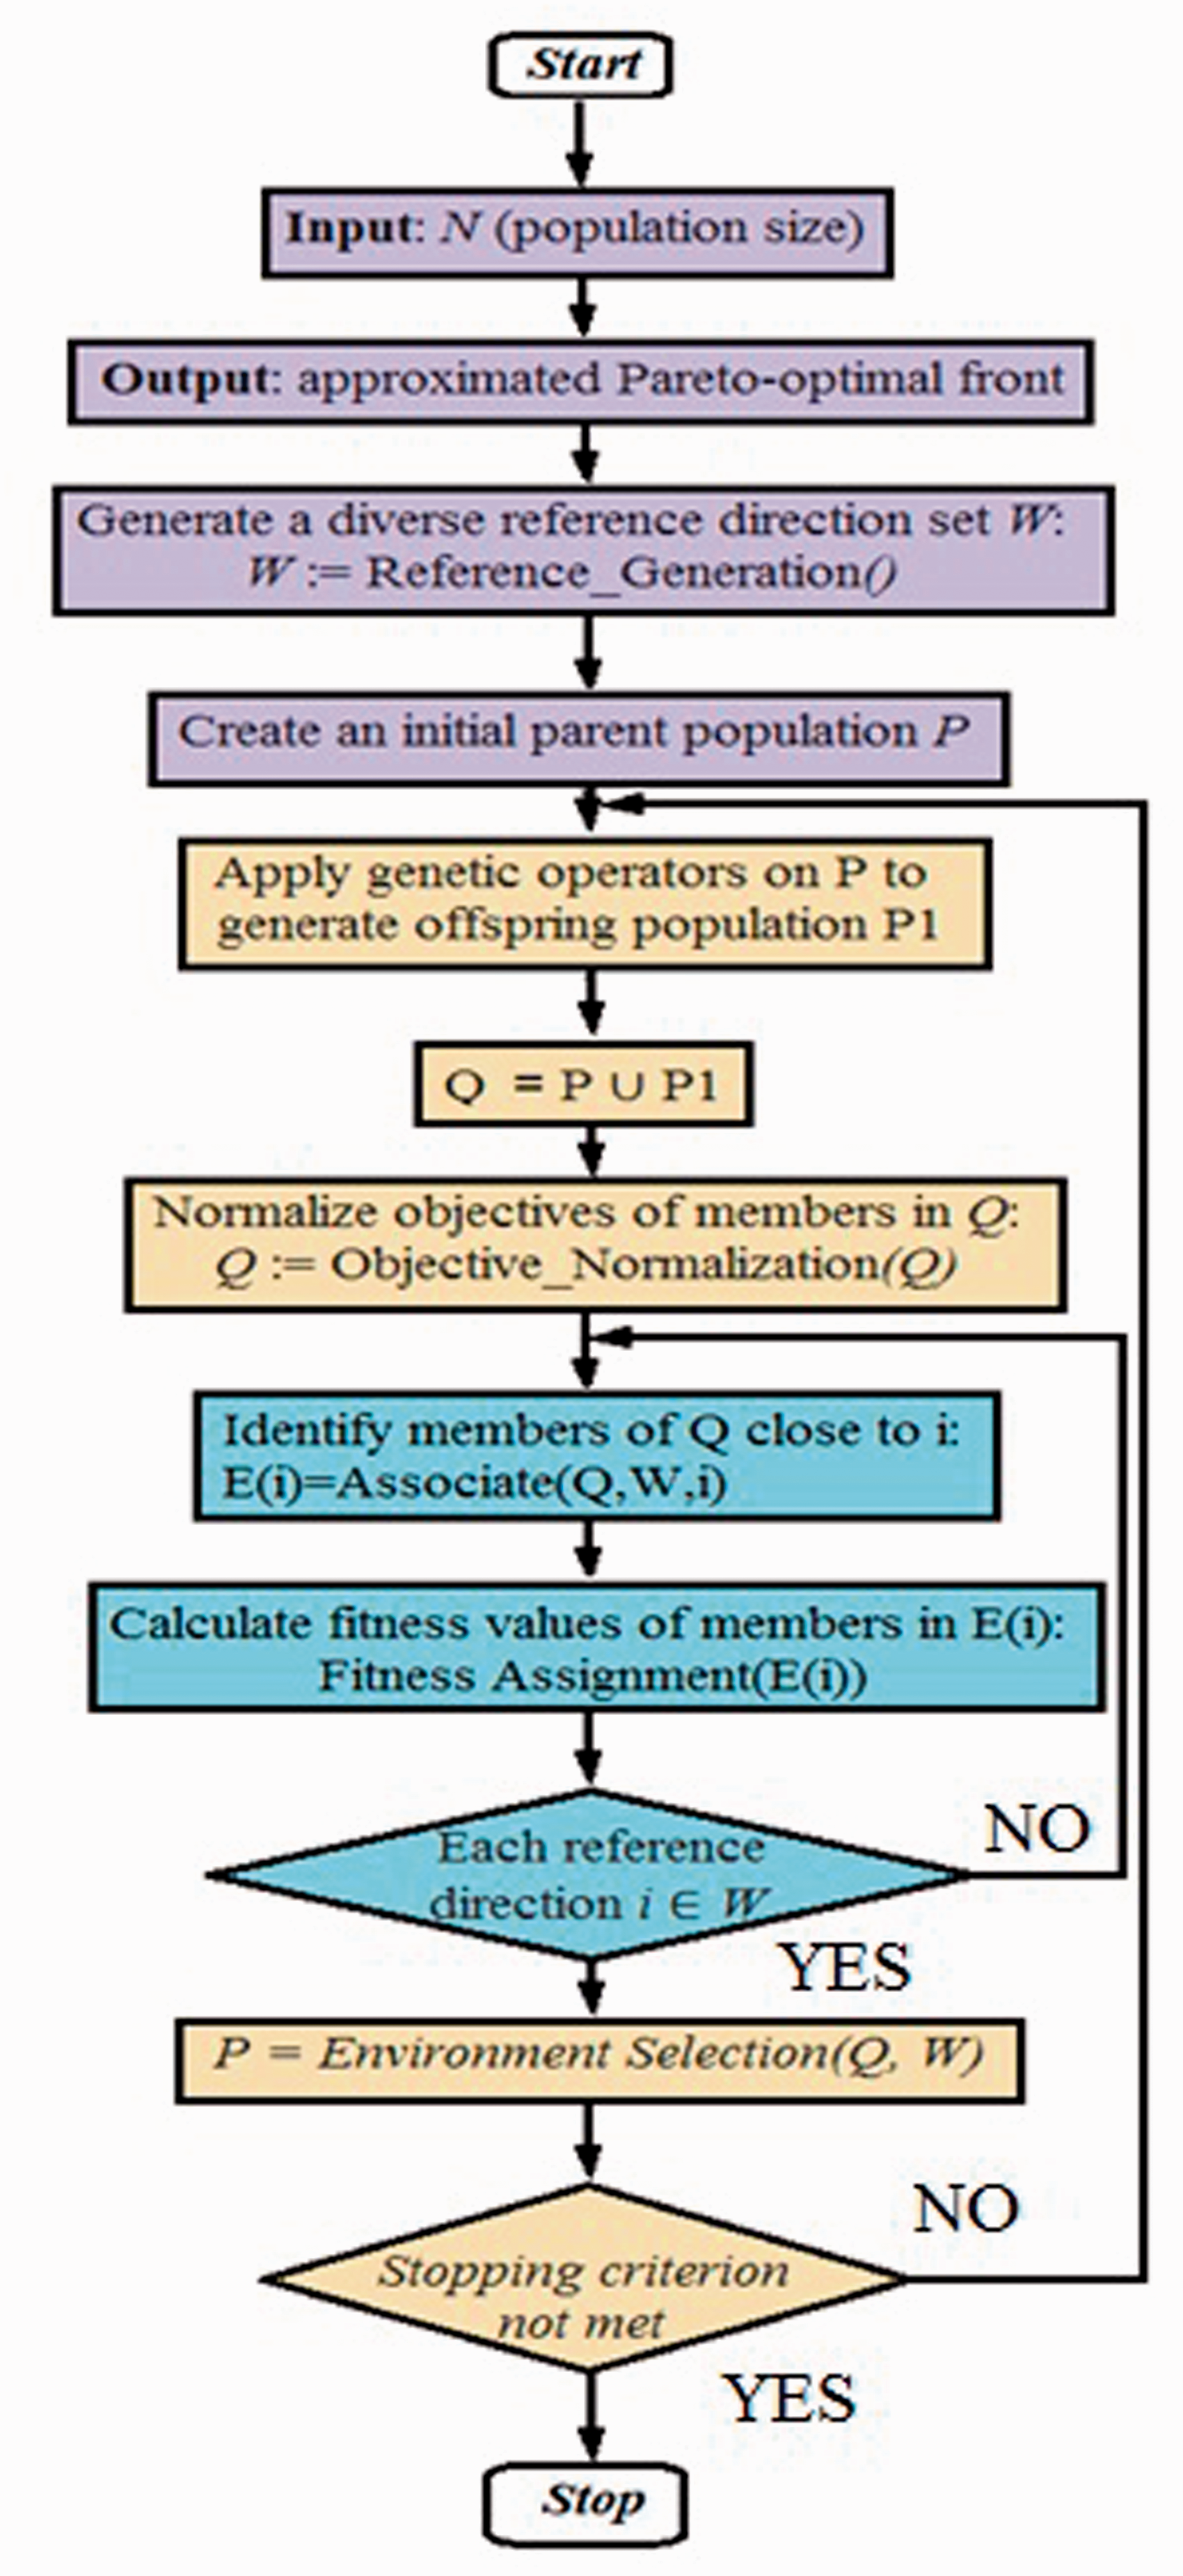
Flowchart of SPEA/R.
Hybrid NSGA-III and SPEA/R (HNSGA-III&SPEA/R)
Evolutionary algorithms have different strengths and weaknesses. They can handle complex problems. We often think of integrating different algorithms. In the field of research, they consolidate different methods of evolution or optimization algorithms into a single algorithm. More efficient hybrid algorithms can exchange each other’s strengths; all shown in the results indicate that. It can be processed in parallel, can improve exploration and exploitation, and can yield more favorable performance than any single algorithm. These population-based approaches use different techniques to explore the search space, and when they are combined, it will improve the trade-off between exploration and exploitation tasks to converge solutions. The best solution possible. This hybrid has acquired the strengths of both algorithms, which are fast convergence capabilities in NSGA-III and SPEA/R diverse search capabilities, thus reducing the computation time, and Pareto front is more accurate than the above two methods.
HNSGA-III&SPEA/R hybrid approach
HNSGA-III&SPEA/R is implemented in parallel hybridization. That is, the original population will be both NSGA-III and SPEA/R simultaneously generated. After that, two separate populations will be mixed together. The new population after the mix will be both algorithms used as their own population to perform evaluation fitness function calculations for the evolution of each algorithm. To the next generation, the new population that is created by the two algorithms is mixed together to form a common population. The process repeats until the evolutionary termination condition is complete.
The pseudo code of the proposed algorithm
Initialize parameters for NSGA-III and SPEA/R.
SPEA/R: Swarm population initialization.
NSGA-III: GA population initialization.
While travel not completed.
Mix the two populations.
Call SPEA/R algorithm.
While stopping criterion not met do
Use genetic elements on P to produce the female population P
Q = P ∪ P
Normalize the members’ goals in Q: Q = Objective_Normalization(Q)
For each reference direction i ∈ W do Assign members of Q close to i: E(i) = Associate(Q, W, i)
Determine the physical value of members in E(i):Fitness_Assignment(E(i))
End for
P = Environment_Selection(Q, W)
End while.
Call NSGA-III algorithm.
While evolution not completed.
Assign two parents P1 and P2 using the tournament method.
Assign the crossover between P1 and P2 with a probability Pc.
Realize the non-dominated population sorting.
Normalize the population members.
Associate the population member with the reference Points.
Assign the niche preservation (counter).
Keep the niche obtained solutions for the next generation.
End while.
End while.
A flowchart of HNSGA-III&SPEA/R is shown in Figure 4.
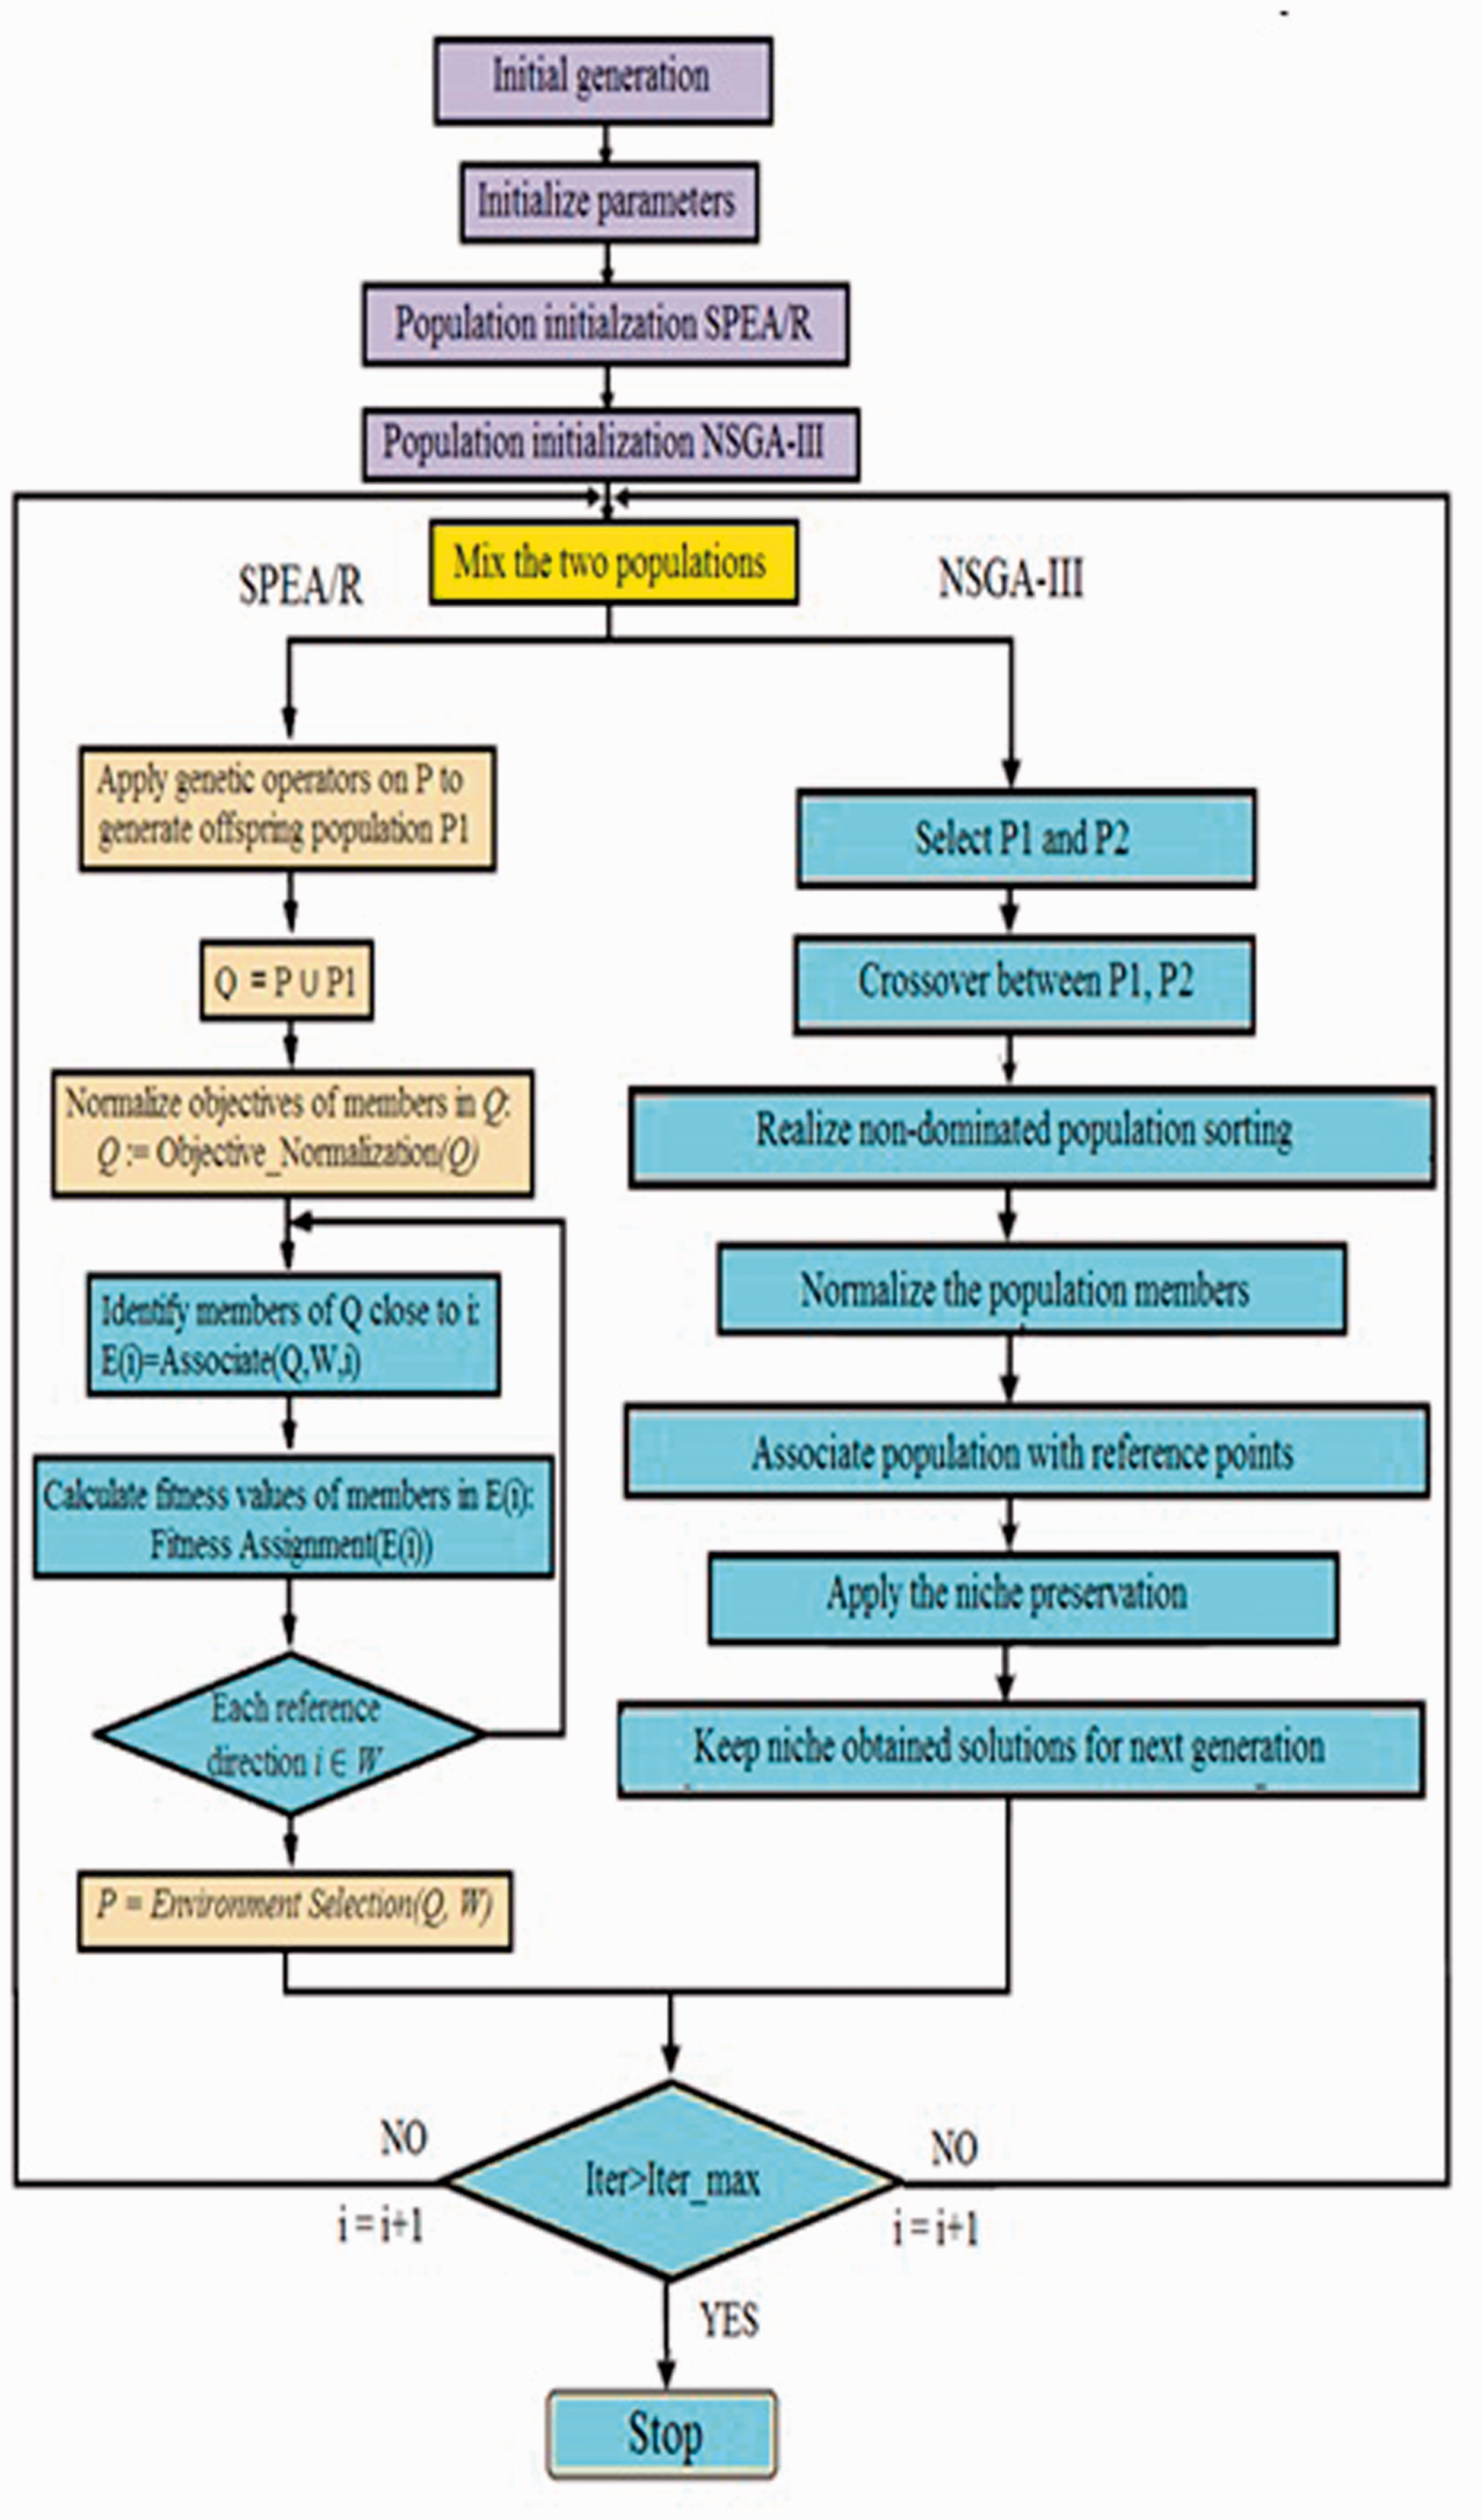
Flowchart of HNSGA-III&SPEA/R.
Computational experimentation with several benchmark functions
Numerical results
In this section, the performance of HNSGA-III&SPEA/R is proved by the five standard functions proposed in CEC 2009,
31
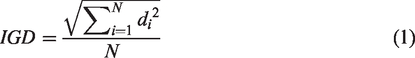
listed in Table 1. The results are compared to the methods of NSGA-III and Multi-objective SPEA/R. Inverted generational distance (IGD) of Schott criteria are employed to measure convergence, quantity, and coverage, respectively. The mathematical formulation of IGD is as follows
Benchmark functions for test multi-objective optimization.
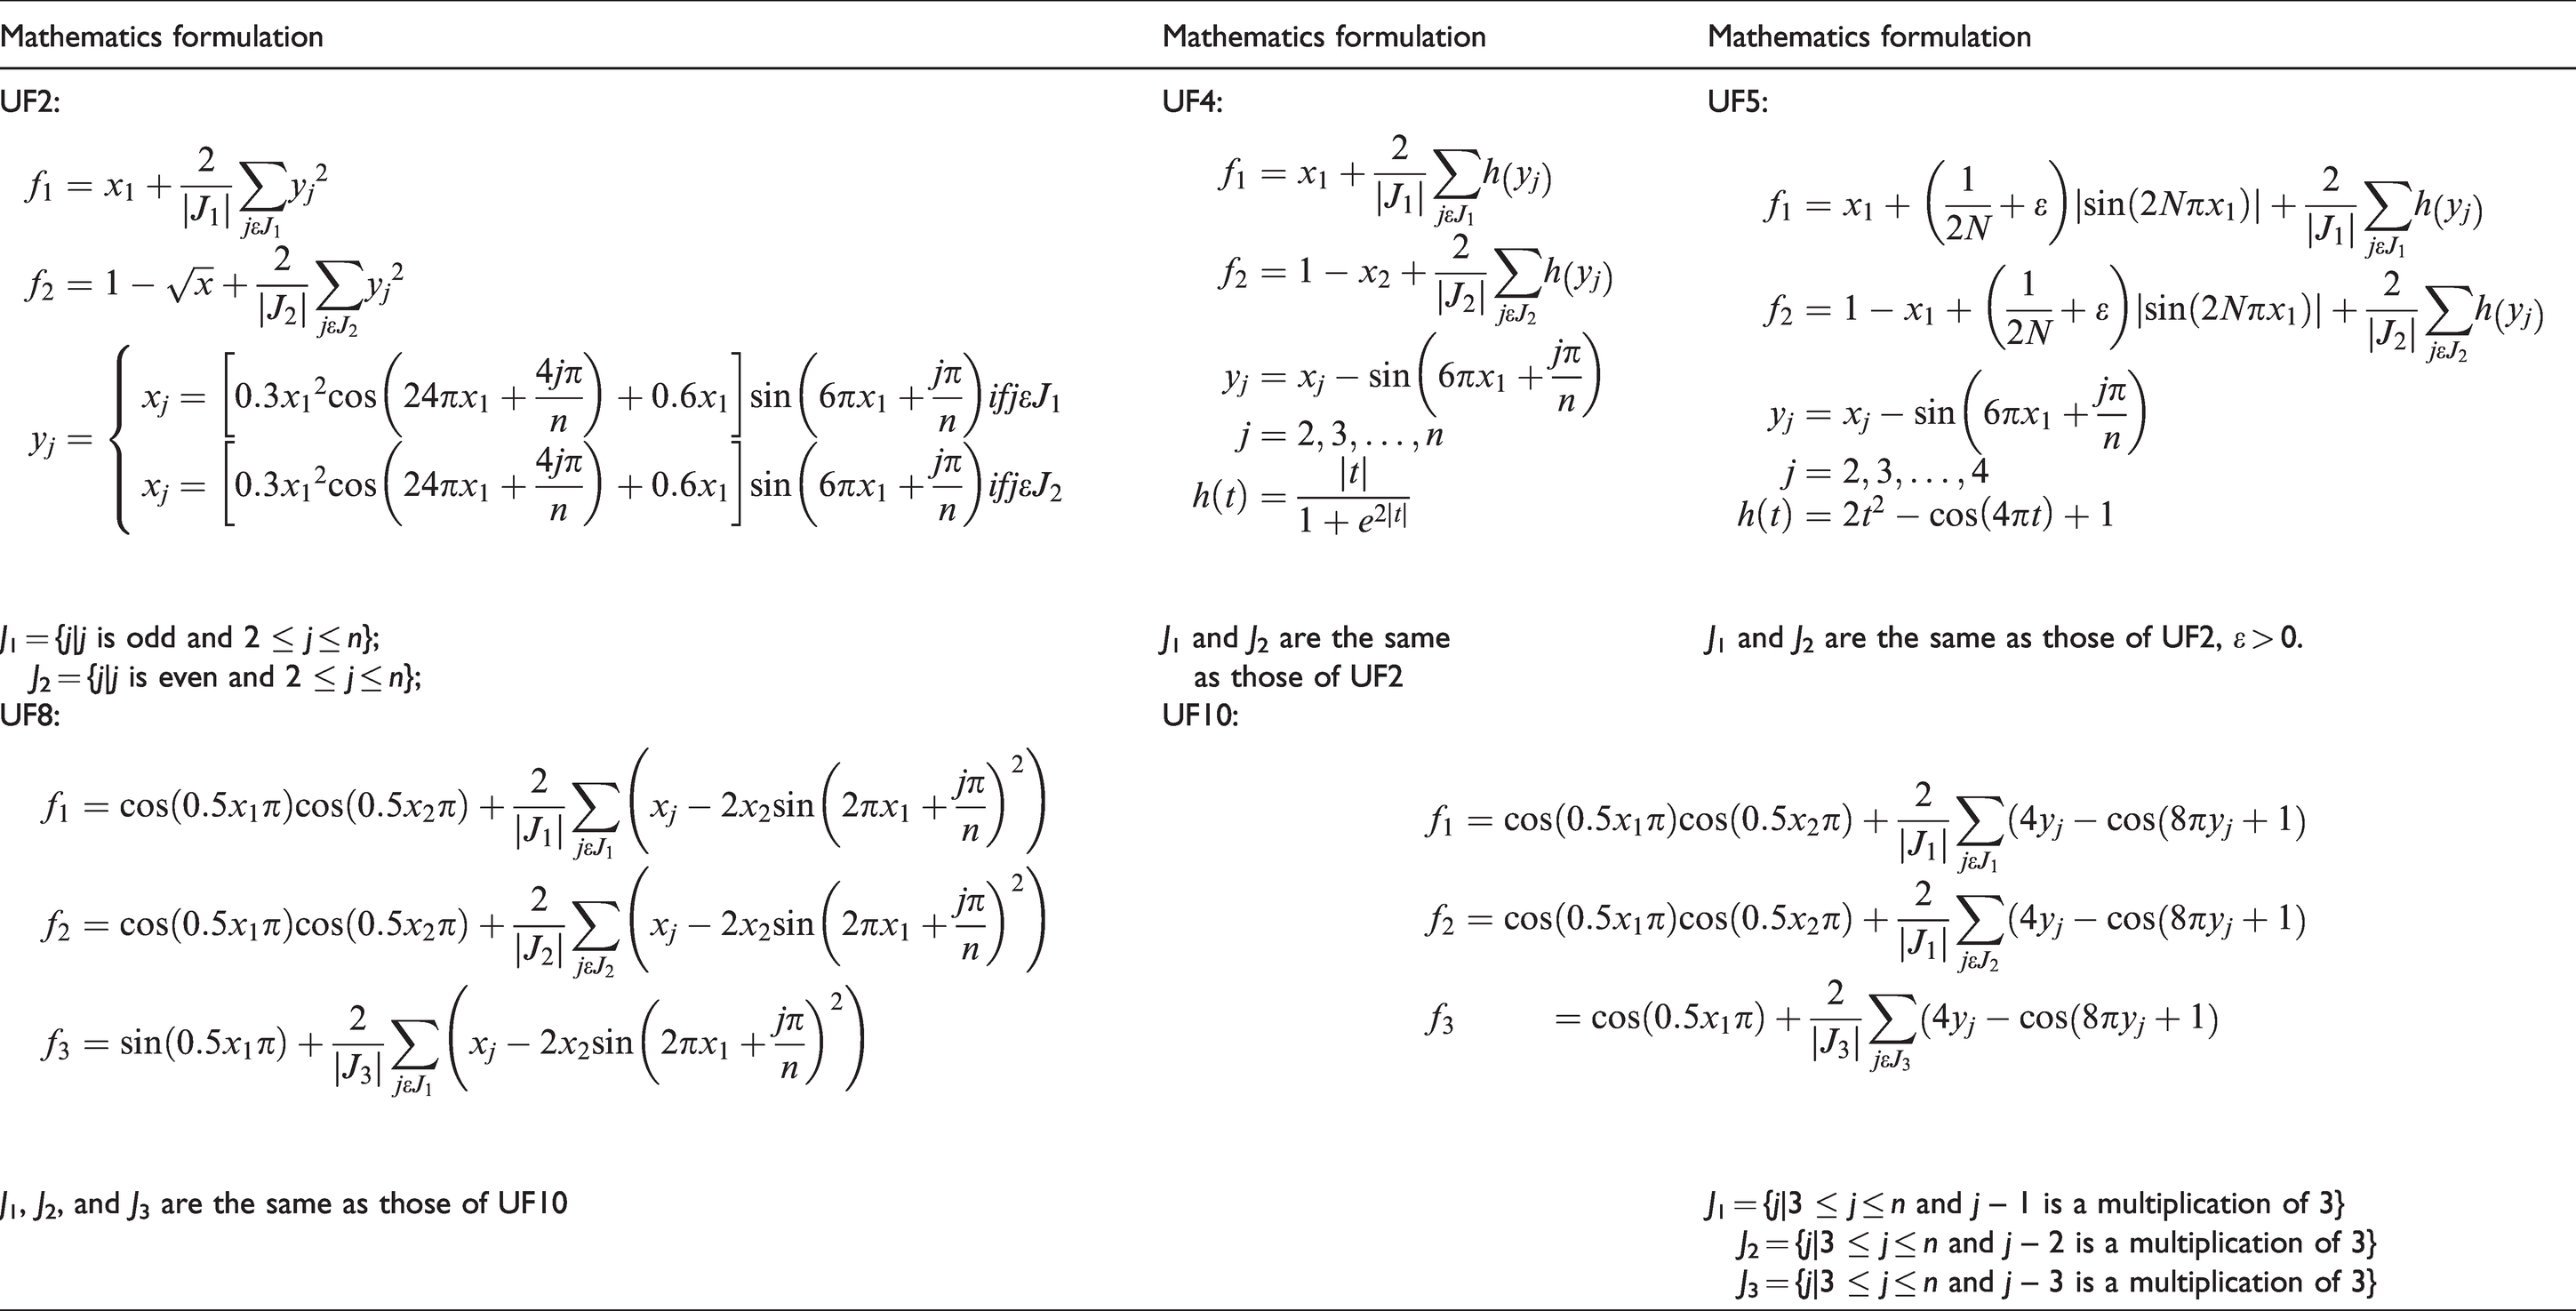
where N is the number of real Pareto optimal solutions and di shows the Euclidean distance between the correct ith Pareto optimal solution and the cabinet to obtain Pareto optimal solutions in the reference set. It should be noted that IGD = 0 indicates that all members of non-dominant solutions are in the real Pareto Front.
In addition to using performance data, the best Pareto optimization solution set by HNSGA-III&SPEA/R on both parameter space and search space is shown in Figure 5 (UF1, UF4, and UF5). These figures clearly show the performance of HNSGA-III&SPEA/R compared to the true Pareto front. For comparison and evaluation, these methods were run 20 times for test problems. The statistical results of 20 runs and parameters of the methods are shown in Tables 2 to 4.
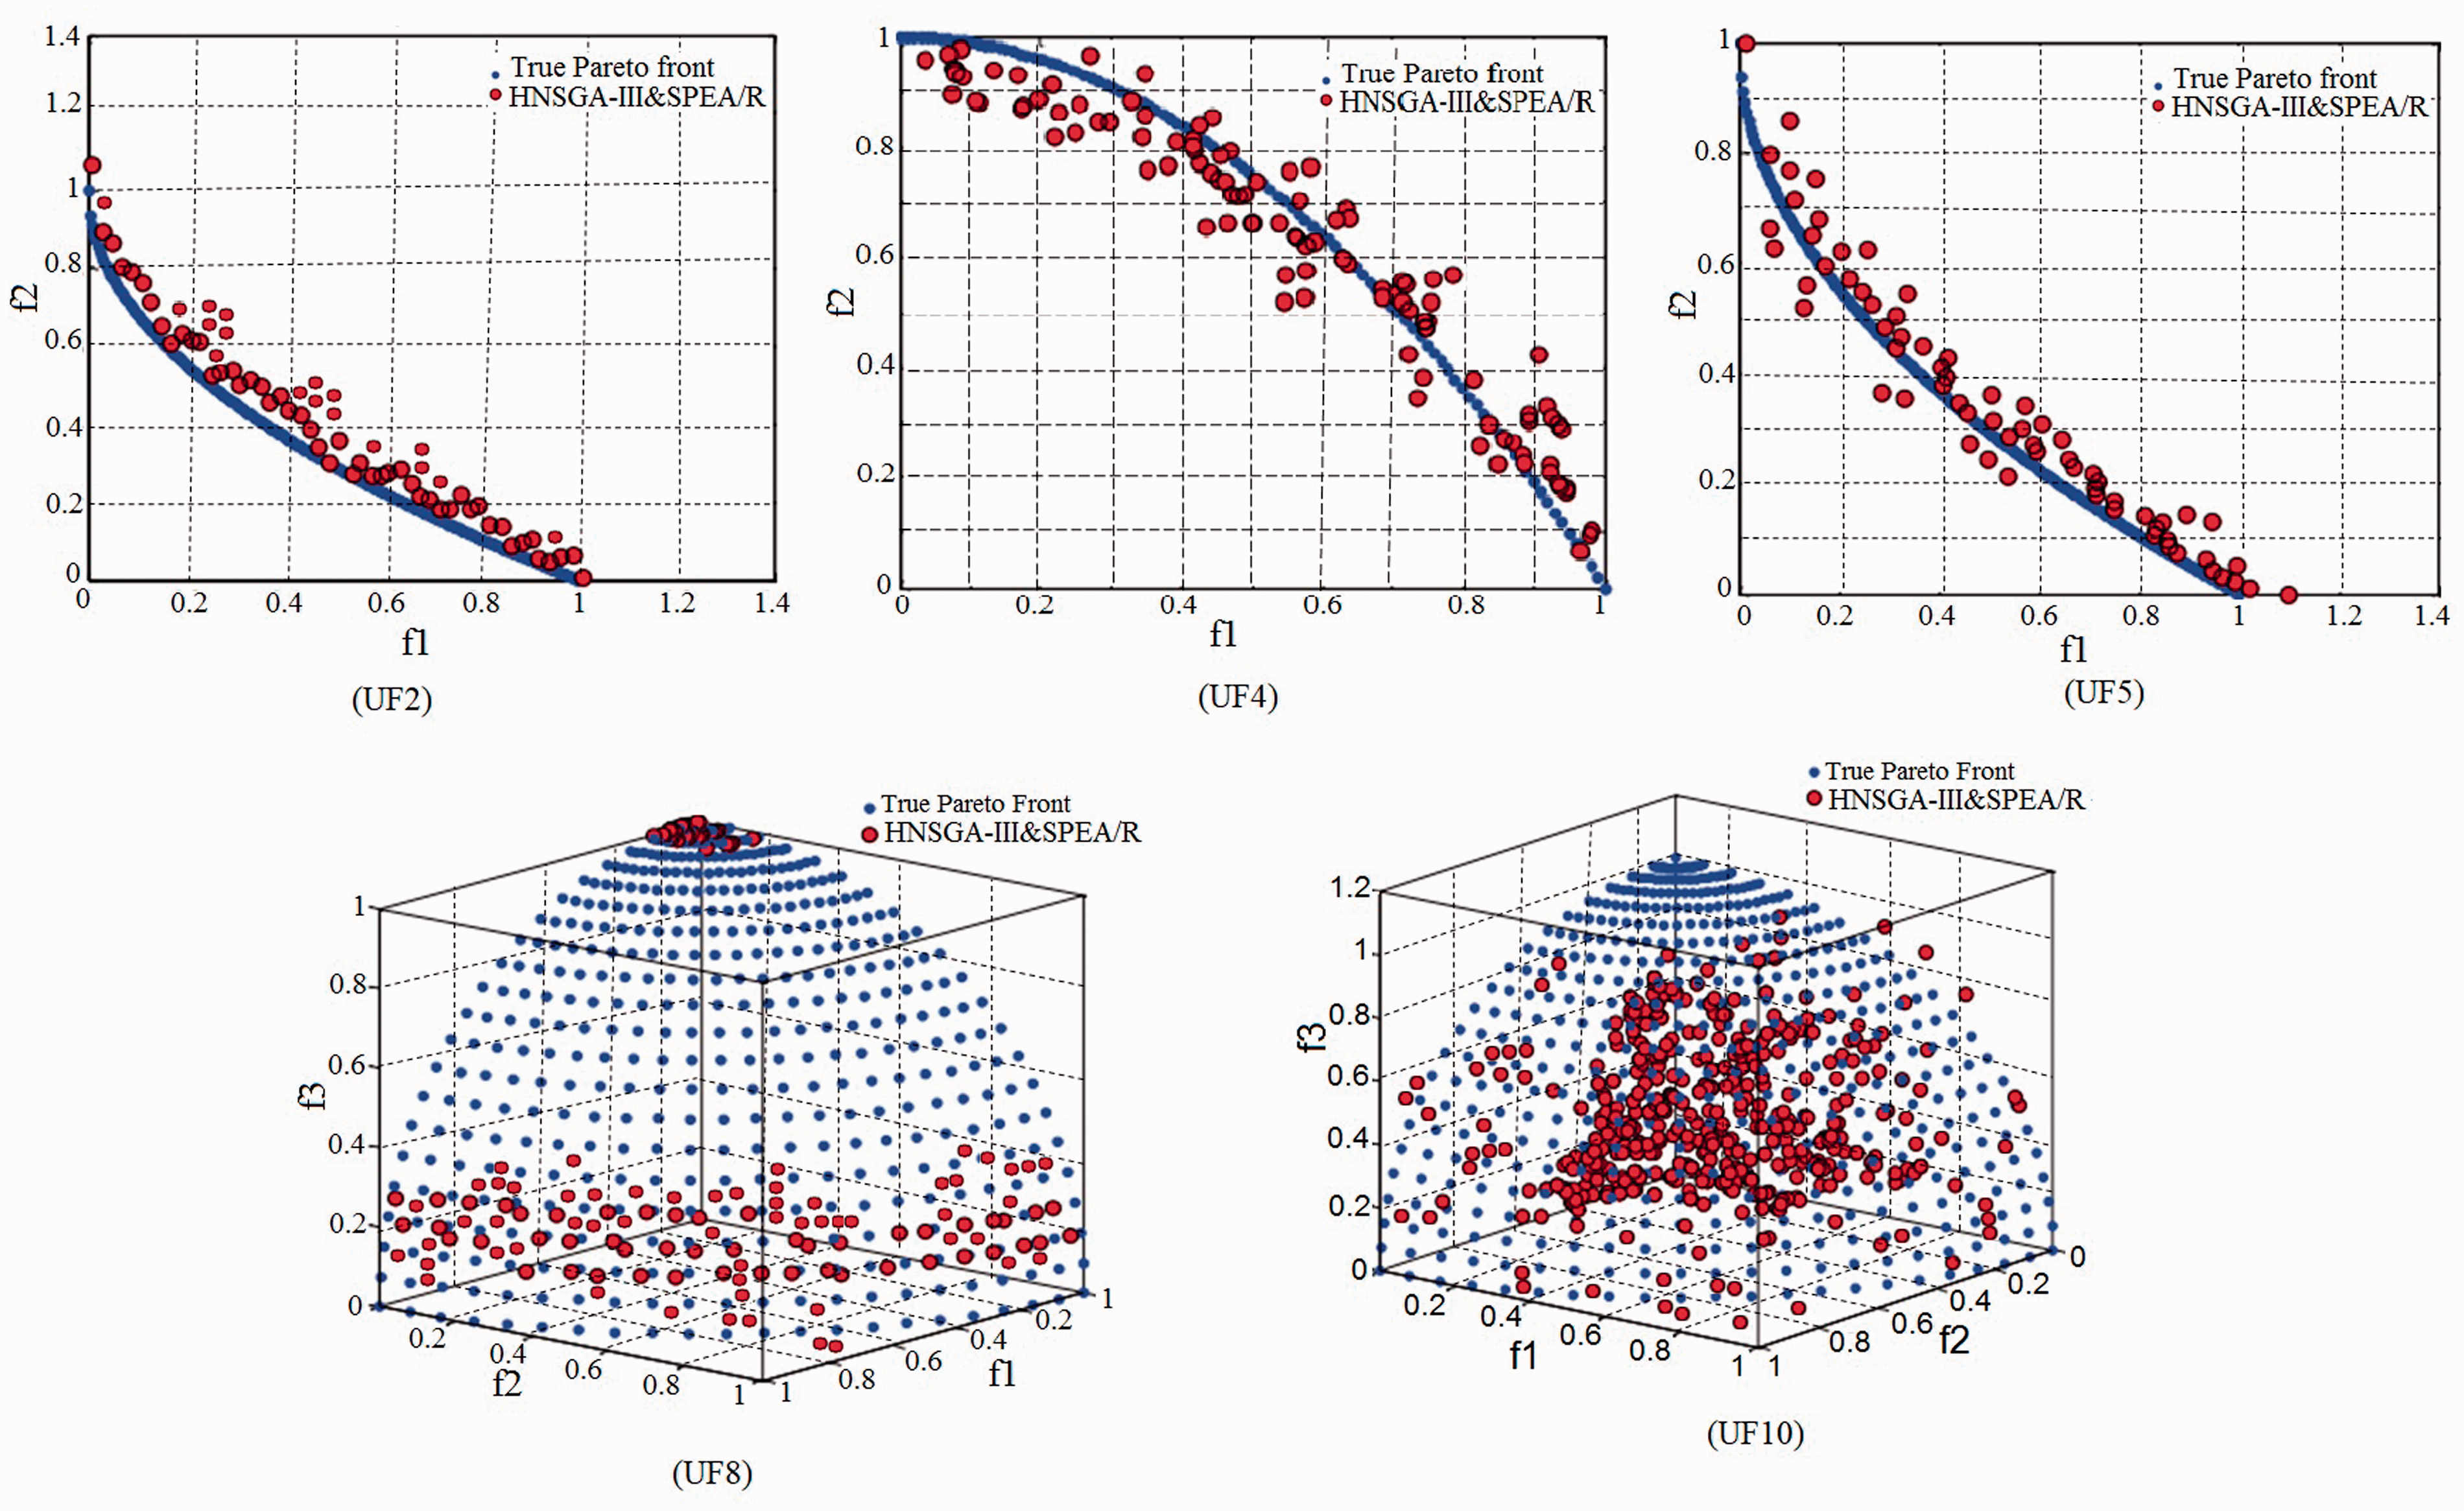
The resulting Pareto optimal solution of HNSGA-III&SPEA/R on each benchmark functions.
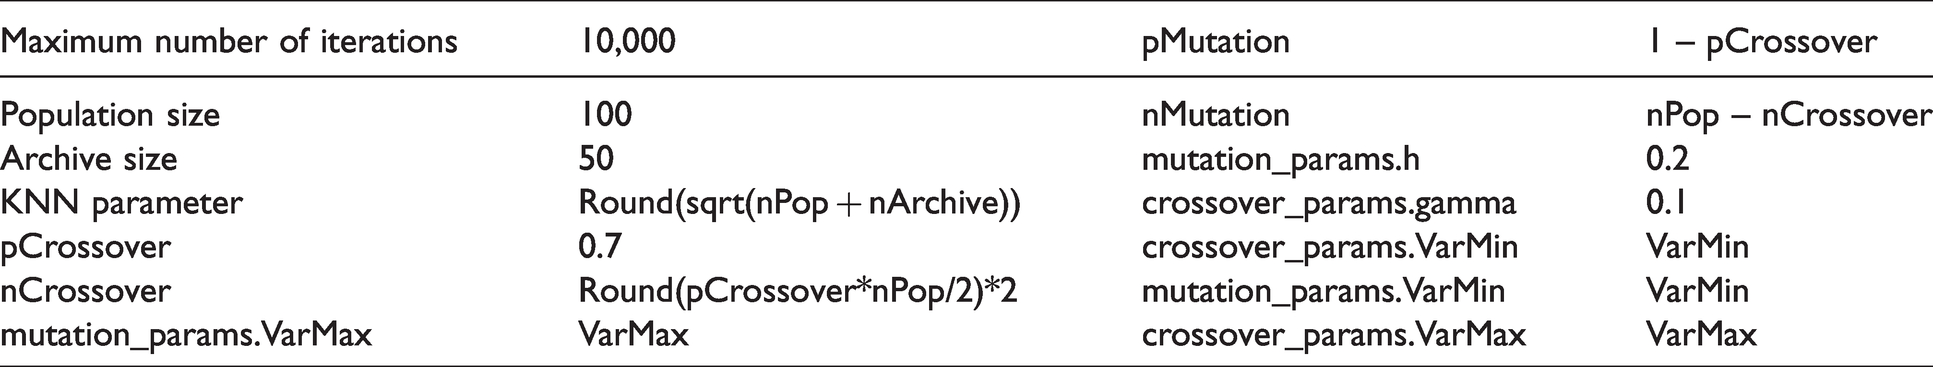
NSGA-III algorithm parameters.
SPEA/R algorithm parameters.
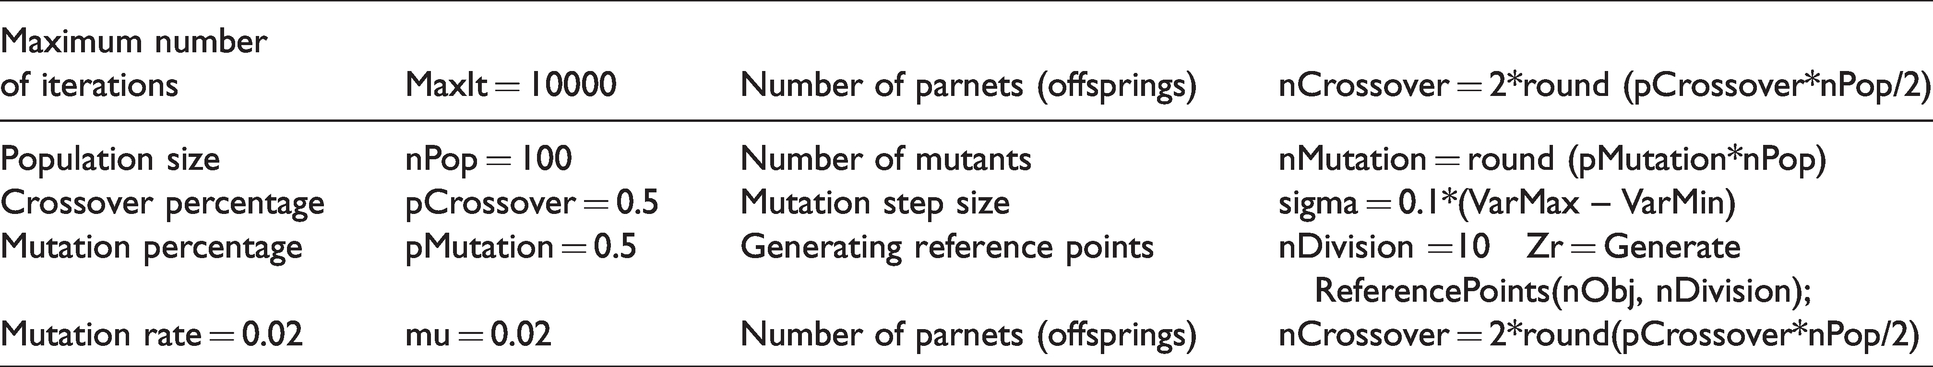
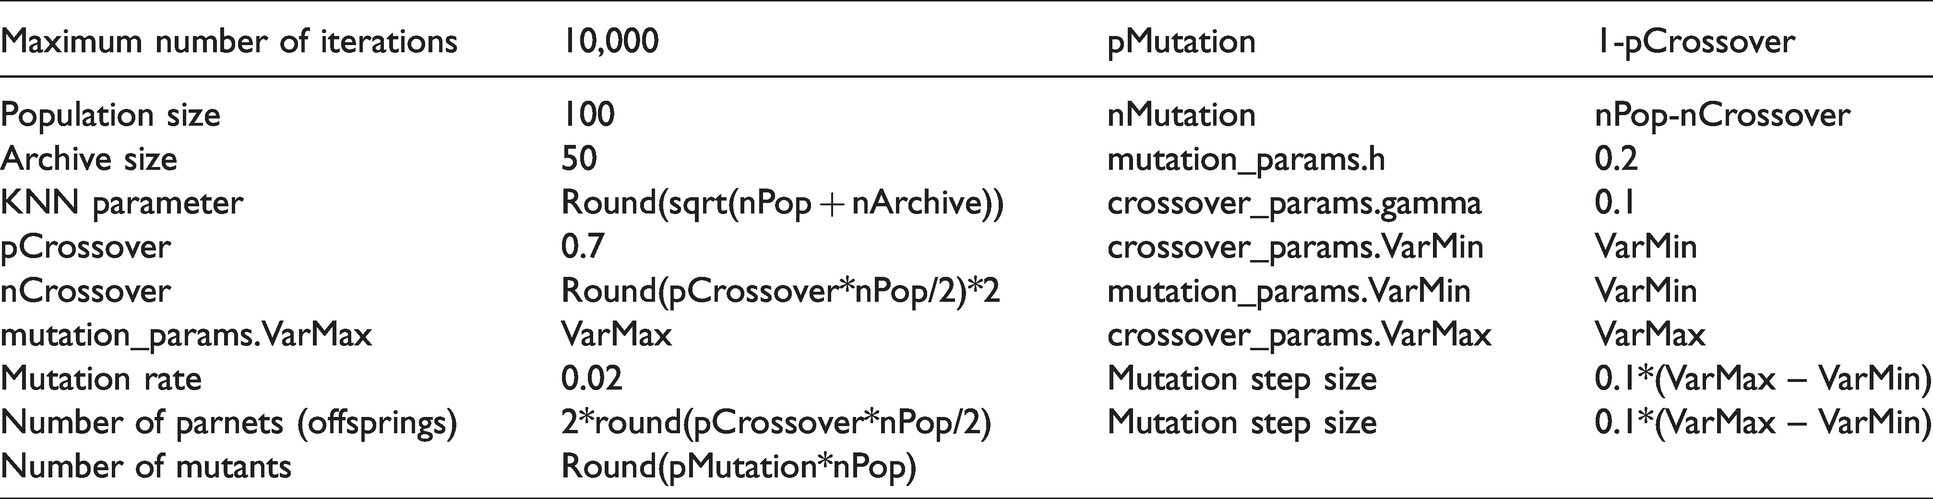
HNSGA-III&SPEA/R algorithm parameters.
The statistical results of the method for IGD are presented in Table 5. Hybrid methods (HNSGA-III&SPEA/R) have been demonstrated on all statistics for two-goal test problems that are expressed through the IGD parameter. The performance of the accuracy and convergence of the method is reflected in the IGD index.
Results for IGD.
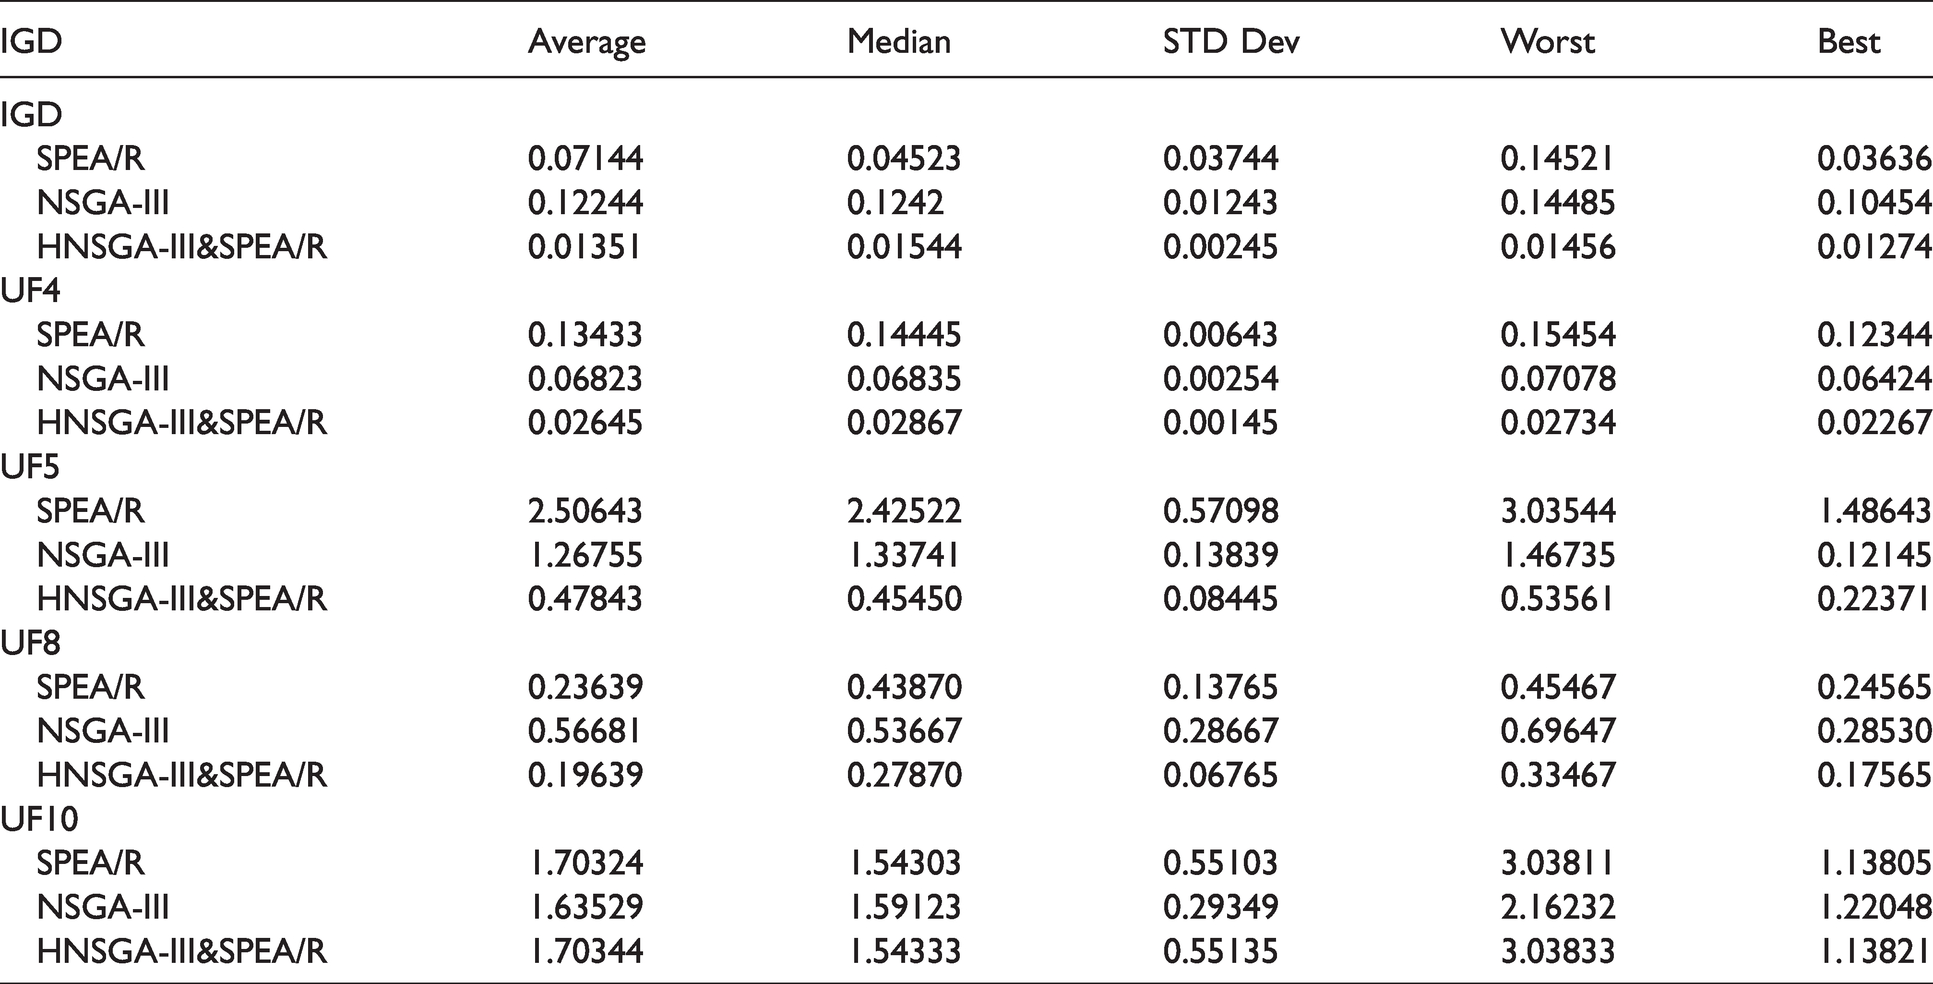
Therefore, it has been shown that the proposed HNSGA-III&SPEA/R method can provide outstanding convergence on the two target benchmarks. Pareto optimal solution of HNSGA-III&SPEA/R on each benchmark is also described in Figure 5 (UF8, UF10).
The Pareto front result is shown in Figure 5. Numerical results have shown that the HNSGA-III&SPEA/R method has higher accuracy for benchmarking functions with two objectives related to convergence and coverage. However, for some tri-objective functions, the three targets are standard; although the proposed method shows high convergence, it has low coverage. Therefore, we can confirm that the HNSGA-III&SPEA/R method has advantages over the NSGA-III and SPEA/R methods, which are the higher convergence and coverage characteristics. In addition, in most cases, the results of HNSGA-III&SPEA/R are better than that of NSGA-III and SPEA/R. Therefore, the HNSGA-III&SPEA/R method has better results and more accurate than the other two methods because it uses simple operators to create a new population derived from a non-dominant solution.
In addition, density estimation tool based on effective reference direction has been used in SPEA/R algorithm, new physical assignment diagram, and new environment selection. The individuals of HNSGA-III&SPEA/R are updated for each generation, thus supporting search agents to explore the search space more widely.
Vibration characteristic of the powertrain mount system
Mathematical model
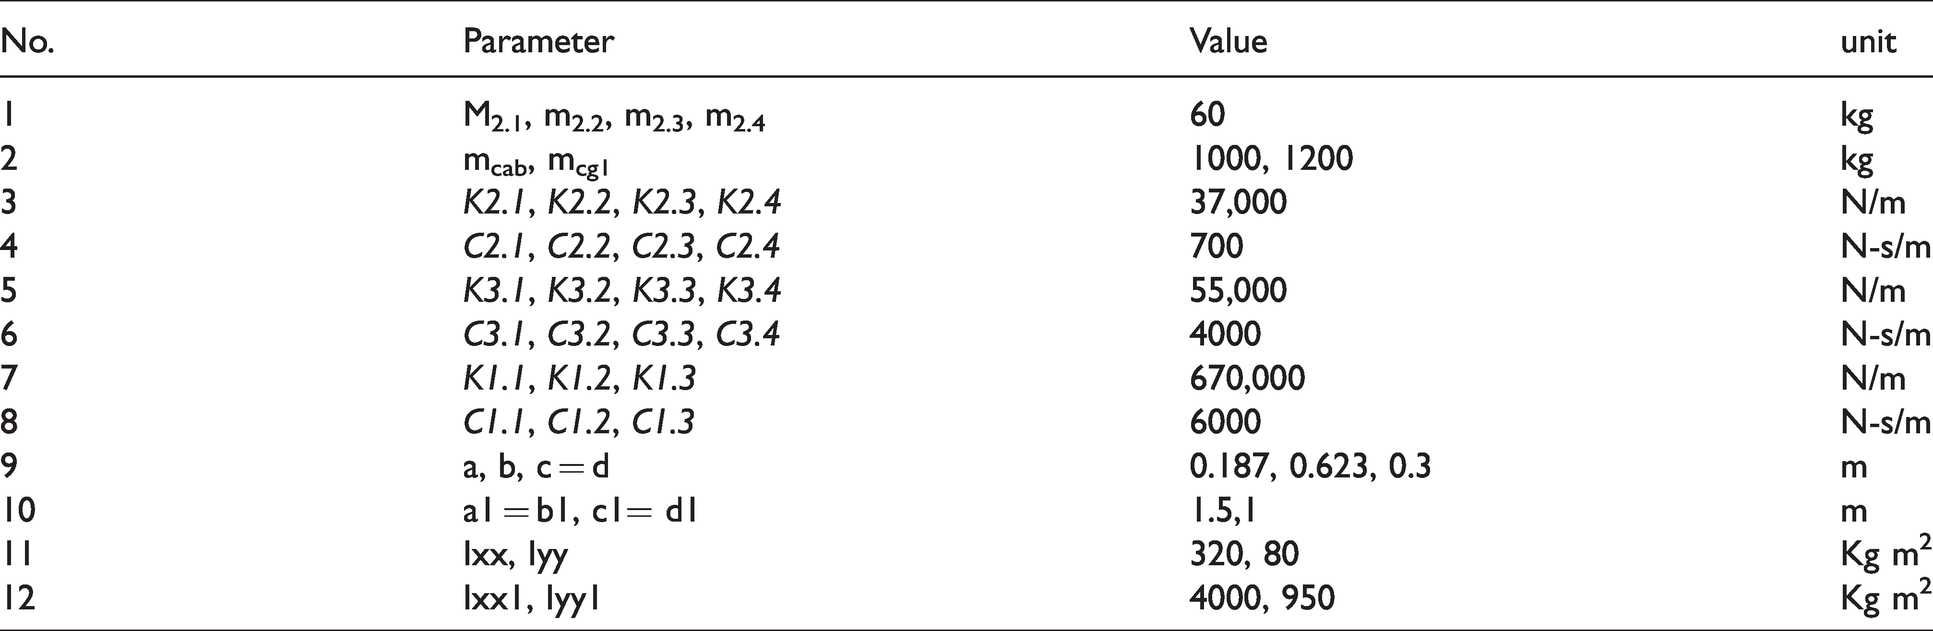
Full car model with 10 degrees of freedom is shown in Figure 1. Suspension and tires are considered spring and damping systems. Where the masses m2.1, m2.2, m2.3, and m2.4 denote the weight of four wheels (the mass does not burst). The masses mcg1 and mcab represent the mass (unburnt mass) of the frame and engine, respectively. Z3.1, Z3.2, Z3.3, and Z3.4 are the vertical displacements of the wheel, and Z1 and Z2 are, respectively, the vertical displacement of the frame and the transmission system. And (Roll and Altitude) are vibrations that rotate around the corresponding X and Y axes. Next, the symbols Φ and Ψ represent the pitch and roll of the frame. The inertia of the transmission system on the y-axis and the x-axis is Iyy and Ixx, respectively, and the inertial moment for the chassis on axes X1 and Y1 is Iyy1 and Ixx1, respectively. The stiffness and damping parameters of the wheels are K3.1, K3.2, K3.3, and K3.4 and C3.1, C3.2, C3.3, and C3.4, respectively. Similarly, the hardness and damping parameters of primary suspension are K2.1, K2.2, K2.3, and K2.4 and C2.1, C2.2, C2.3, and C2.4, respectively, while the hardness and damping parameters of the drive system are K1.1, K1.2, and K1.3 and C1.1, C1.2, and C1.3, respectively. The distance of the front and rear support from the center (CG) of the transmission system is a and b, respectively, and the right and left mounting distances from the CG of the transmission system are c and d, respectively. a1, b1, and c1, d1.
By using Newton’s law, the mathematical model of Figure 1 can be written as given below
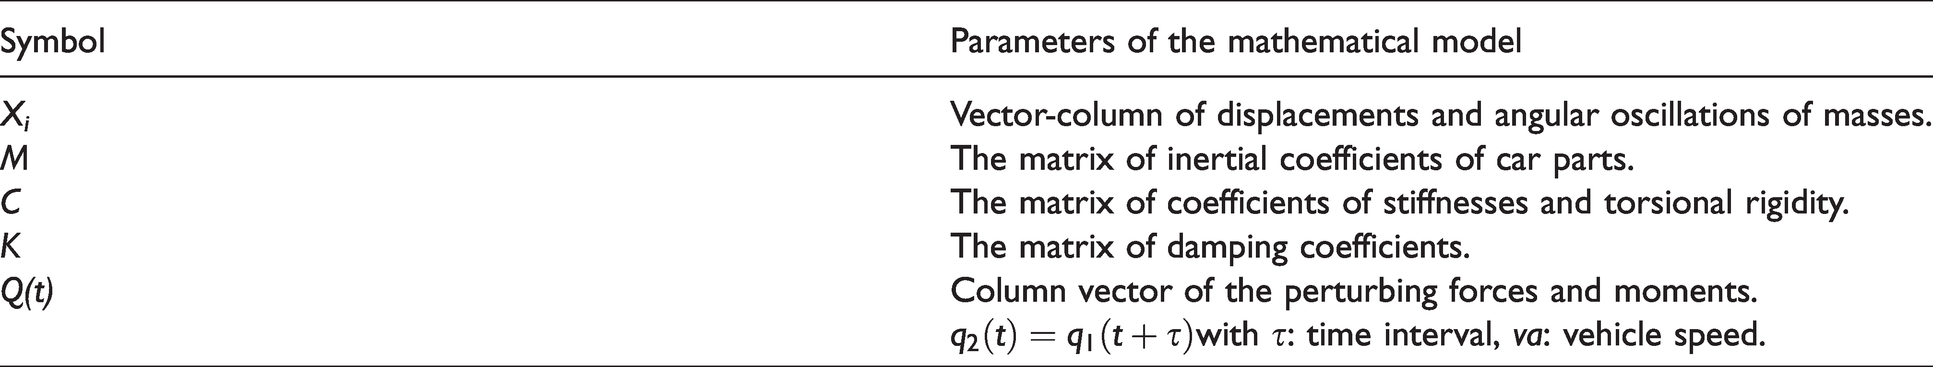
where the symbols are shown in Table 6.
Parameters of the mathematical model.
The multi-object optimization function of the engine mount system
There are many indicators to evaluate the vibration of the powertrain. In particular, mean square acceleration oscillates at the front and rear, right and left of the engine mount system, the mean square displacement difference between the engine and vehicle chassis at the front and rear, and right and left engine mount system. These are two important parameters that determine the decisive influence of powertrain vibration on chassis. In order to optimally reduce the vibration of the powertrain, we need to simultaneously optimize the parameters of mean square acceleration and mean square displacement at the front and rear, right and left of the engine mounts.
The average square value of the vibration acceleration of any points can be determined by the formulas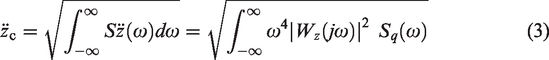
Wz(jω): squared modulus of amplitude and phase characteristics;
Sq(ω): spectral density of exposure.
The modules of the amplitude and phase characteristics of the vibratory displacement of the powertrain and the car body in the place of the front mount are

W0(jω): module amplitude-phase characteristics in the center of the car body;
W0φ(jω): module amplitude-phase characteristics of the longitudinal-angular body of the car;
WkO1(jω): module of the amplitude and phase characteristics of the body in place of the front mount of the powertrain;
Wca(jω): module amplitude-phase characteristics in the center of the powertrain of the car;
Wcaφ(jω): module amplitude-phase characteristics of the longitudinal-angular powertrain of the car;
WcaO1(jω): modulus of amplitude and phase characteristics in place of the front mount of the powertrain.
The modules of the amplitude and phase characteristics of the vibration displacement of the powertrain and the car body in the place of the rear mount are

WkO2(jω): the module of the amplitude-phase characteristics of the body in the place of the rear mount of the powertrain;
WcaO2(jω): the module of amplitude and phase characteristics in the place of the rear mount of the powertrain.
The difference of the module frequency response of the vibration of the powertrain and the car body in place of the front mount of the powertrain
The difference of the frequency response module of the vibration displacement of the powertrain and the car body at the rear mount
Simulated input parameters
Road surface profiles
When the vehicle moves, there are many factors that cause the vibration. The factors are: the internal force in the car; external forces appear in the process of using acceleration, braking, revolving; exterior conditions such as wind and storm; boring face street. Among the factors on the bumpy side of the road is the oscillation cause of the vehicle. To simulate the most general calculation, we use the road surface profile as a random function as shown in Figure 6, and simulated parameters are shown in Table 7.
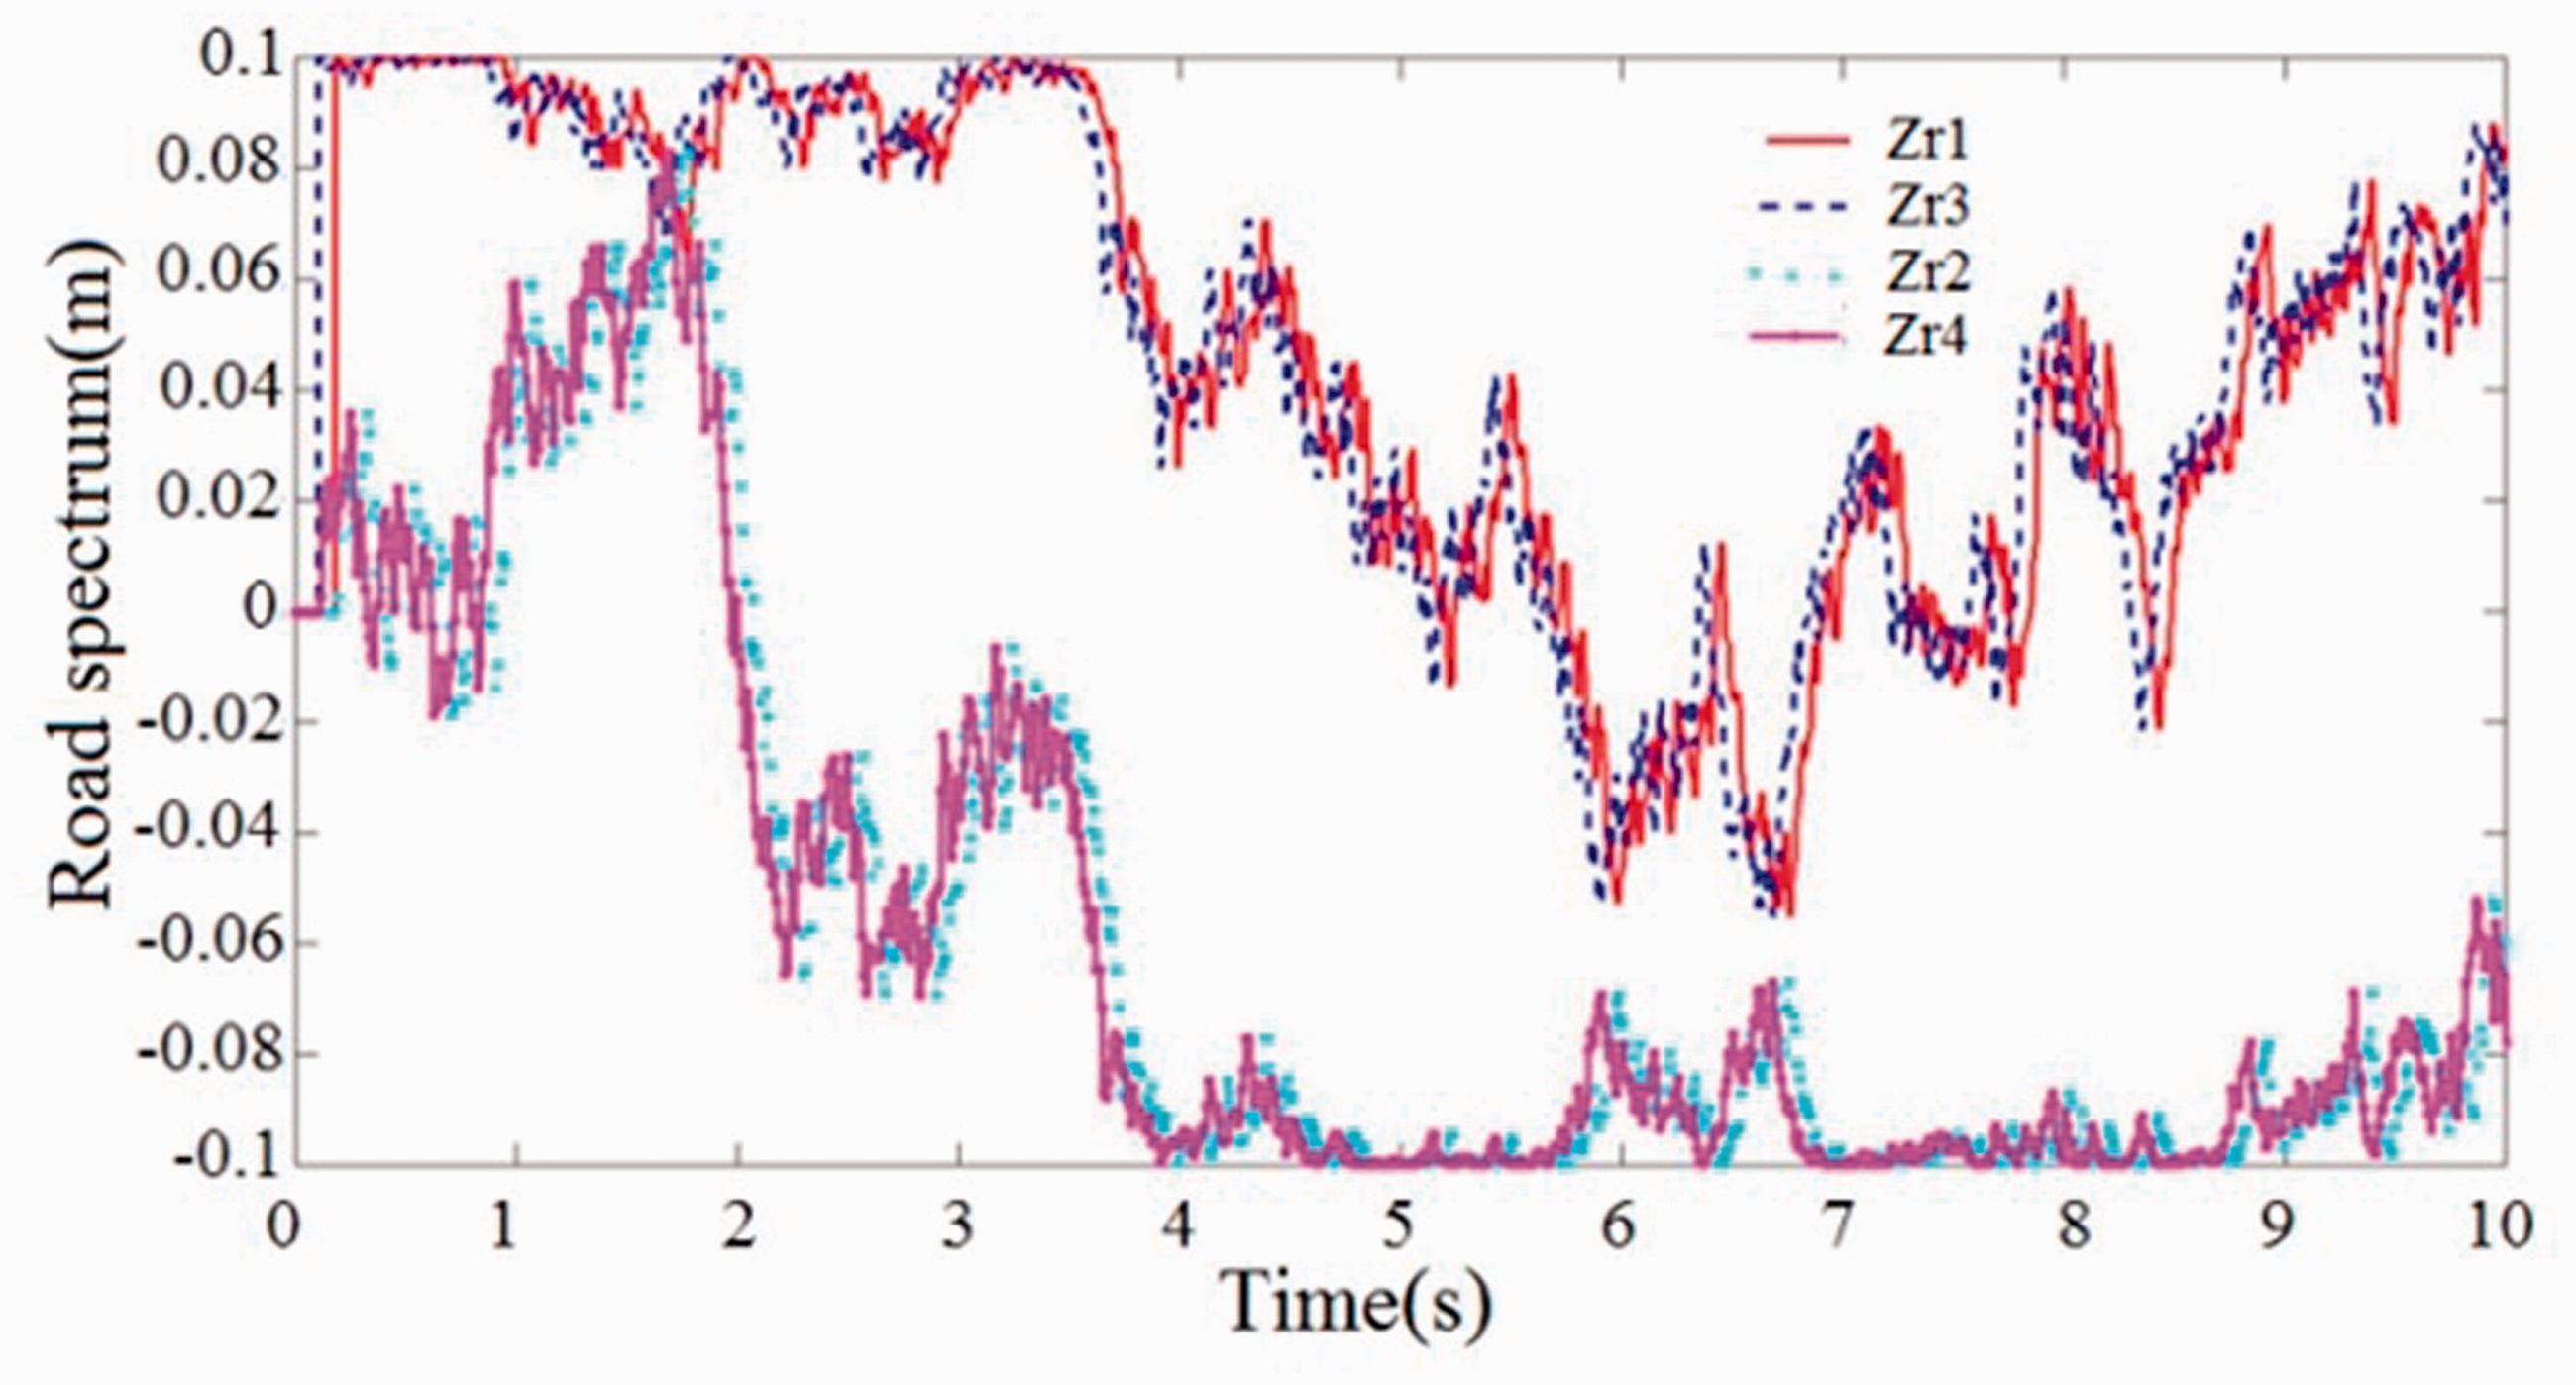
Road surface profiles. Zr1 and Zr3 correspond to the right front and rear wheel. Zr2 and Zr4 correspond to the left front and rear wheel.
Model parameters.
Simulation results of application HNSGA-III&SPEA/R method to optimization of the powertrain mount system stiffness parameter
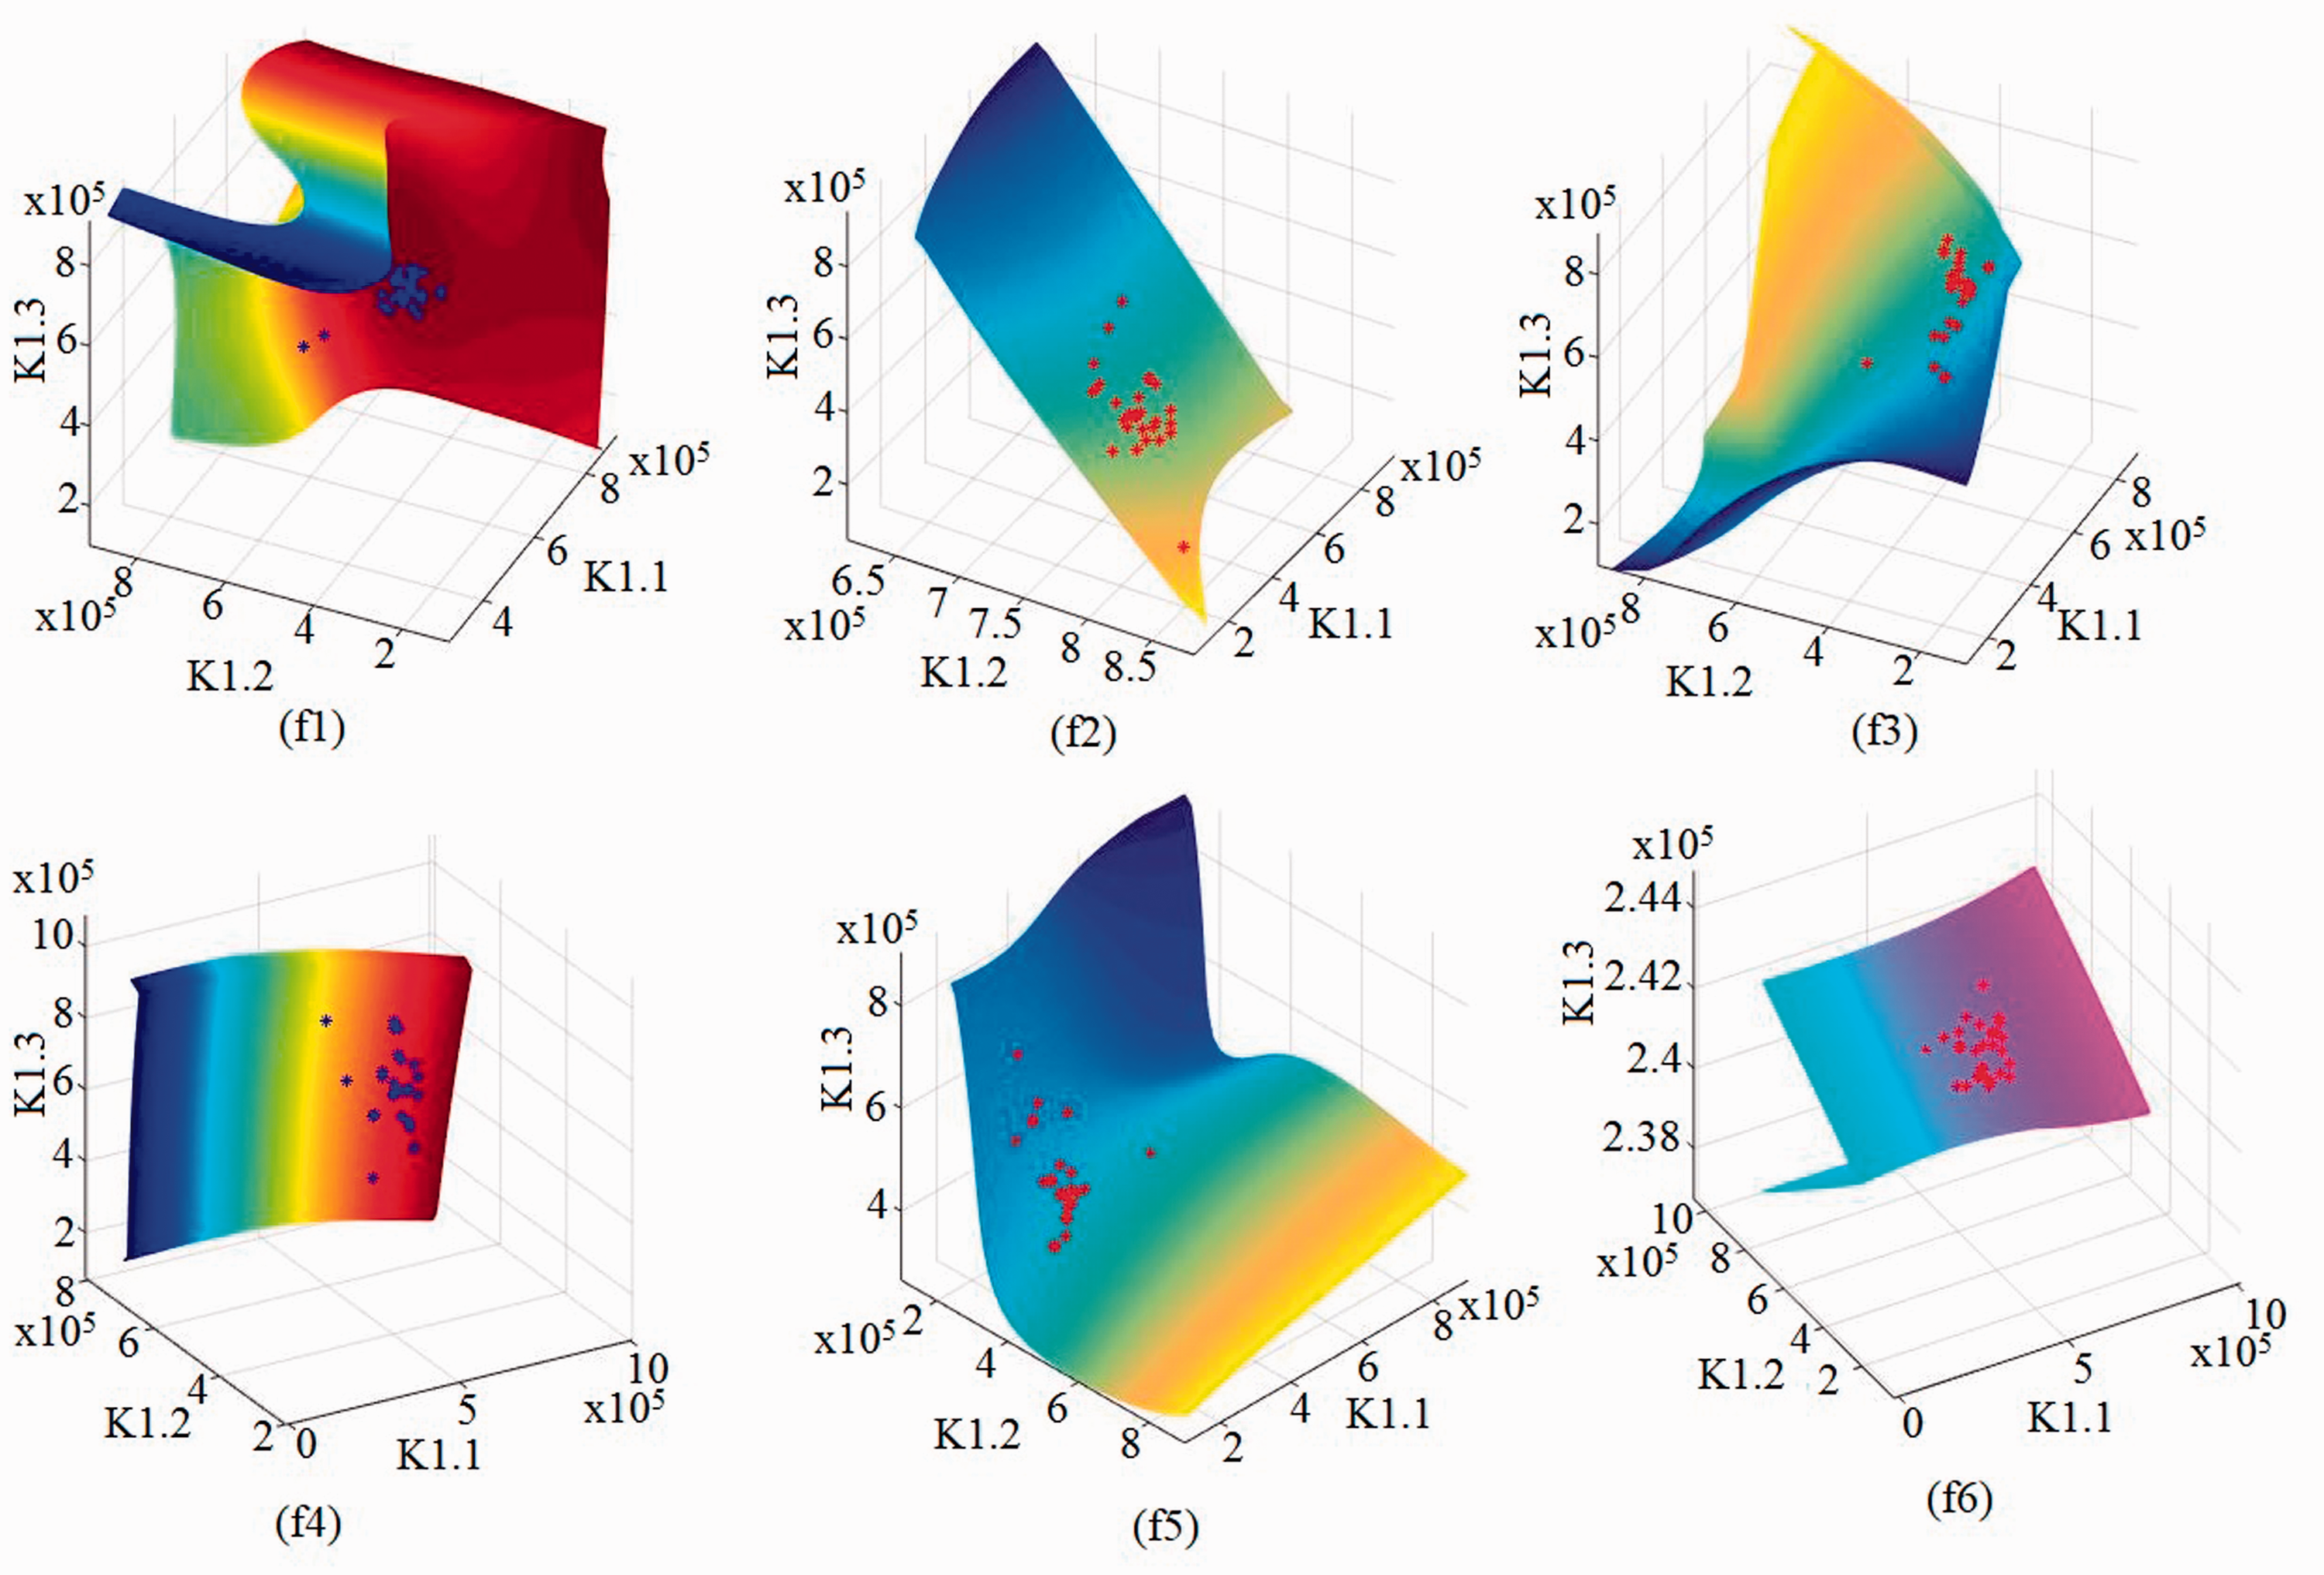
Through Matlab, we calculated six functions of acceleration and displacement according to the stiffnesses of the front left, front right, and rear engine mount (K1.1, K1.2, and K1.3) value as shown in Figure 7 (Figures 7 and 8 show the results in the form of 4D space via the isosurface function in Matlab).
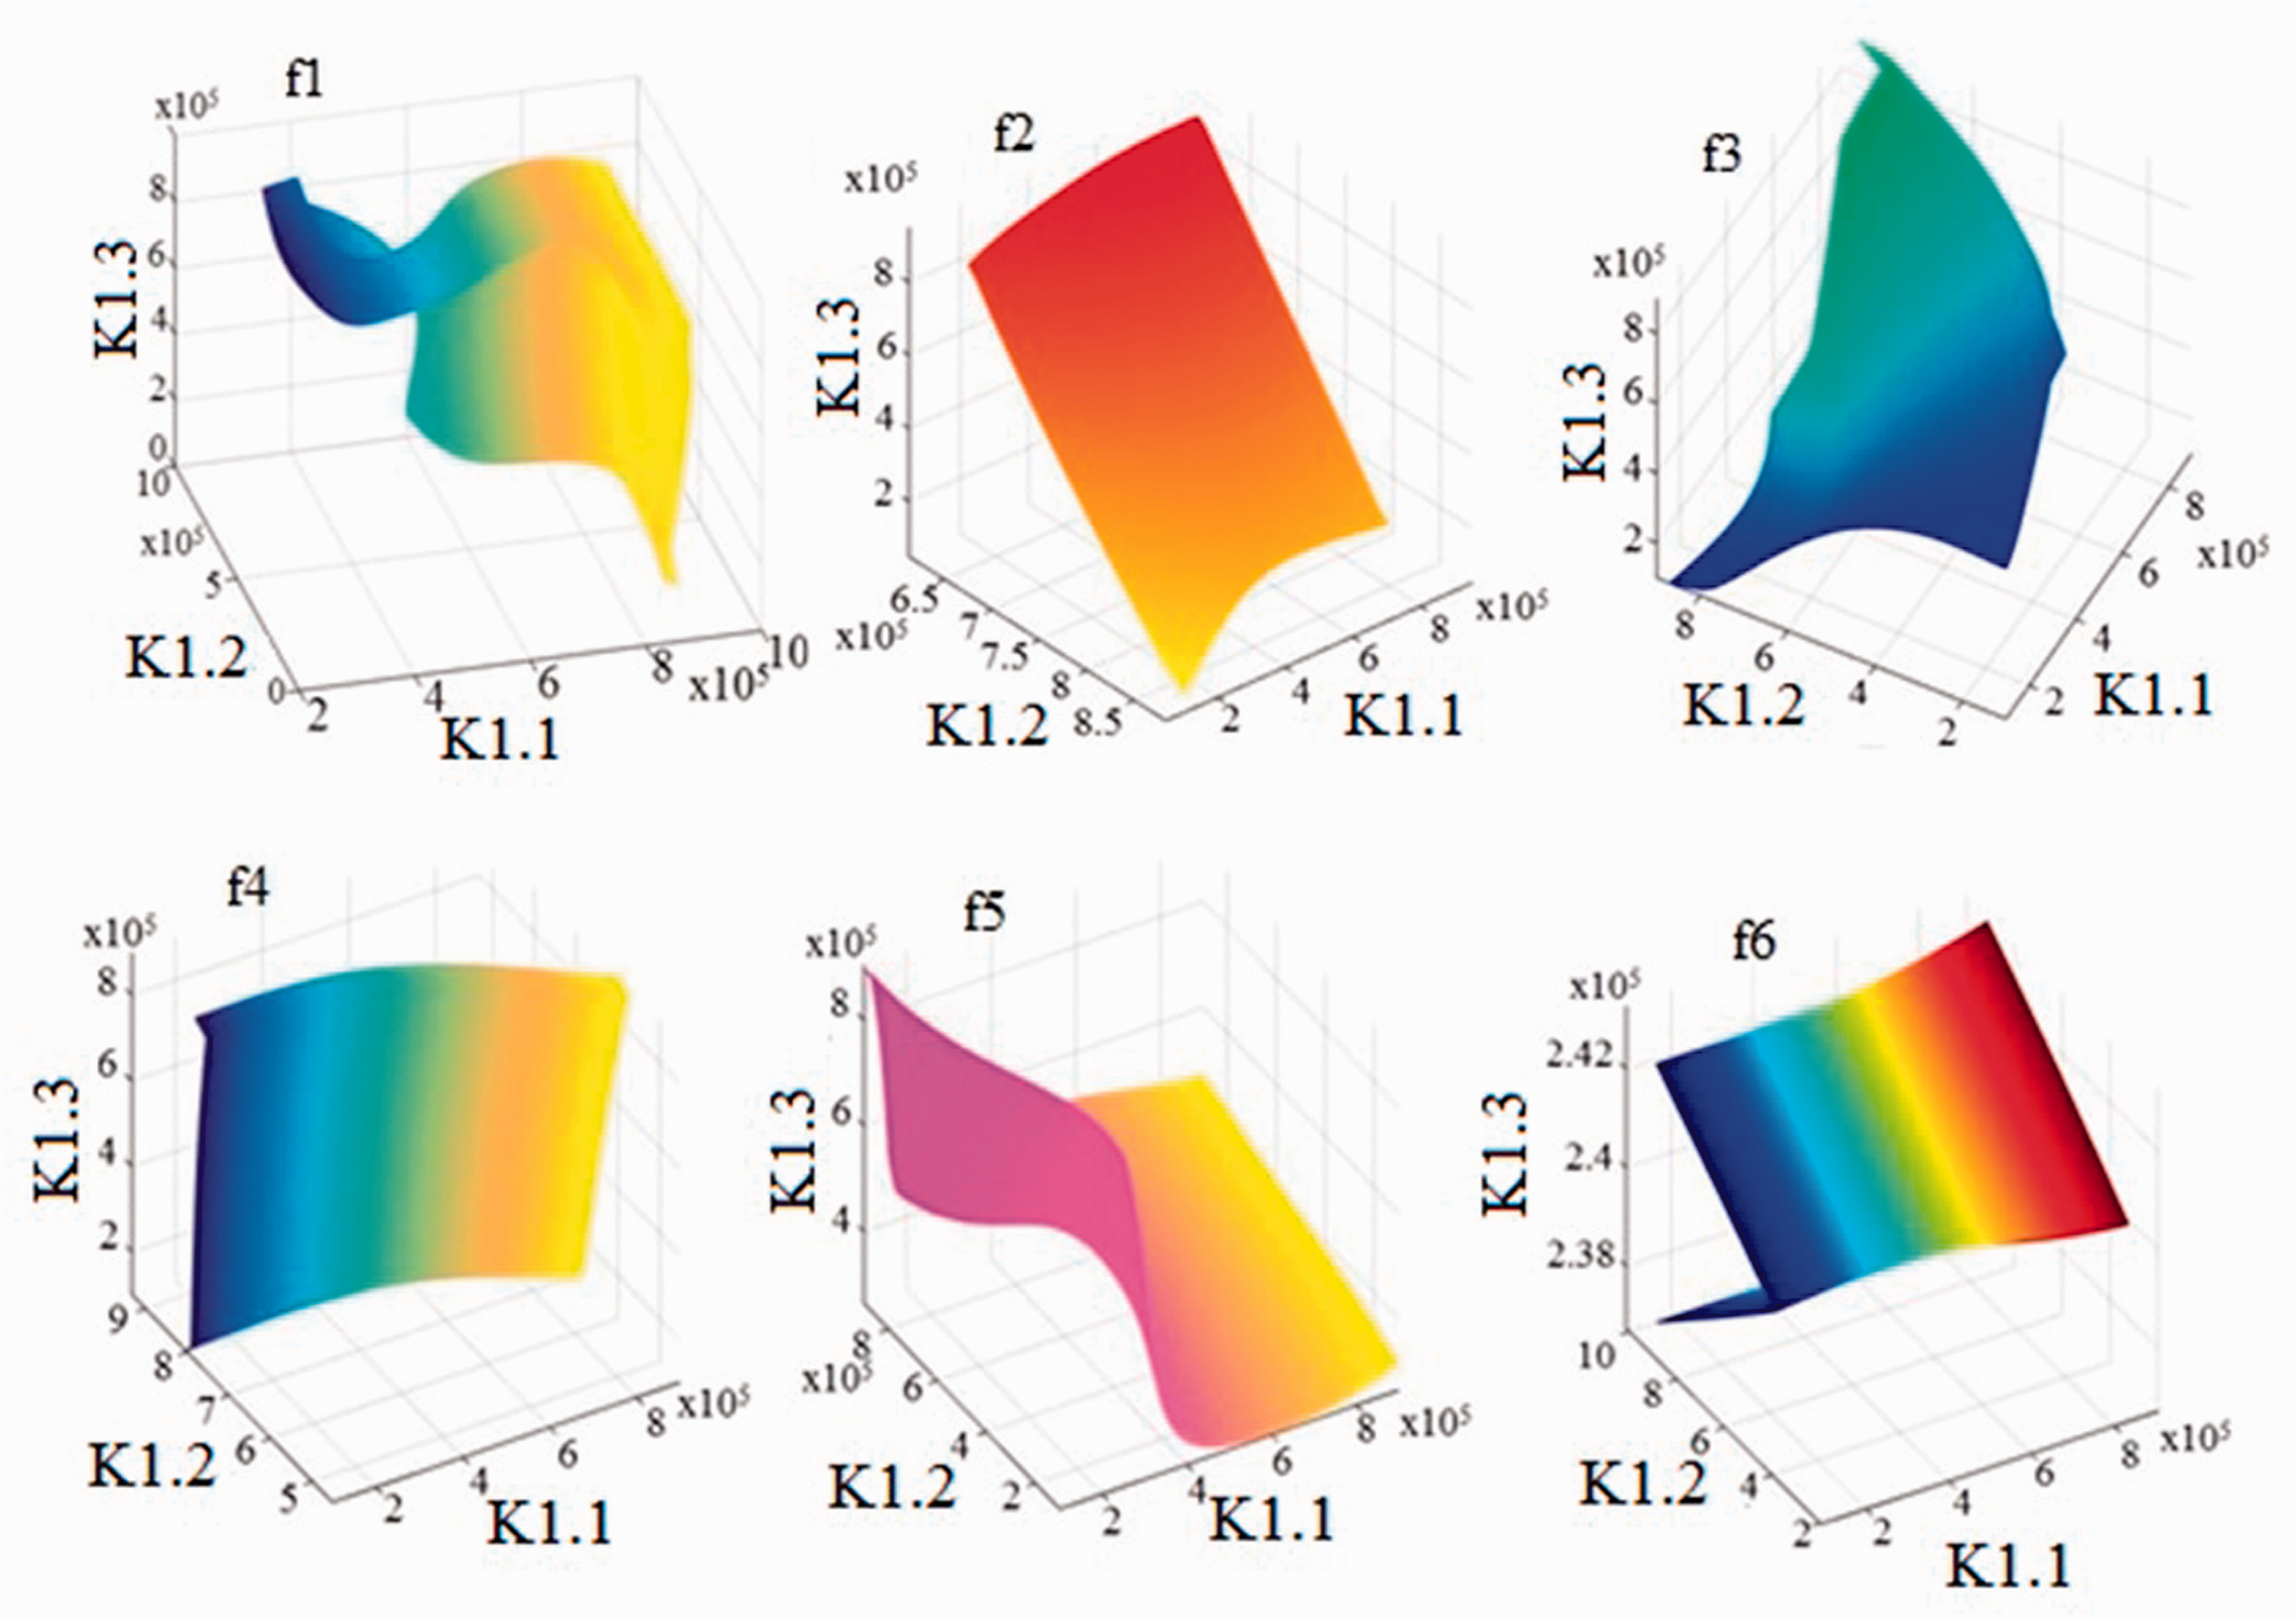
Values of six-objective optimization functions.
Pareto front set of six-optimization objective.
Values of six-objective functions according to the stiffnesses (K1.1, K1.2, and K1.3). f1 is mean square displacement (MSD) at the front left engine mount, f2 is mean square acceleration (MSA) at the front left engine mount, f3 is MSD at the front right engine mount, f4 is MSA at the front right engine mount, f5 is MSD at the rear engine mount, and f6 is MSA at the rear engine mount.
It is well known that the results of multi-objective optimization would be a set of non-dominated optimized points, called Pareto set. These points offer a wide range of parameters to the designer to choose the optimum point depending on his designing conditions. There are always conflicting objective functions in vehicle designing which improvement in one function may have an unfavorable influence on other functions. In this article, multi-objective optimization for all six-objective functions is done simultaneously. While applying the HNSGA-III&SPEA/R optimization algorithm, we obtain results as shown in Figure 8.
The average square of the Pareto front of MSD at the front left engine mount: f1 = 4.1318e-05 (m).
The average square of the Pareto front of MSA at the front left engine mount: f2 = 1.4942 (m/s2).
The average square of the Pareto front of MSD at the front right engine mount: f3 = 5.2547e-05 (m).
The average square of the Pareto front of MSA at the front right engine mount: f4 = 1.7114 (m/s2).
The average square of the Pareto front of MSD at the front right engine mount: f5 = 2.3641e-05 (m).
The average square of the Pareto front of MSA at the front right engine mount: f6 = 1.4004 (m/s2).
where f1: Pareto front of MSD at the front left engine mount; f2: Pareto front of MSA at the front left engine mount. f3: Pareto front of MSD at the front right engine mount; f4: Pareto front of MSA at the front right engine mount; f5: Pareto front of MSD at the rear engine mount; f6: Pareto front of MSA at the rear engine mount.
Application of HNSGA-III&SPEA/R optimization algorithm with six-objective functions (f1, f2, f3, f4, f5, and f6): the red dots on f2, f3, f5, and f6 and the blue dots on f1 and f4 are the result set of the Pareto front that the HNSGA-III&SPEA/R algorithm has found.
Conclusion
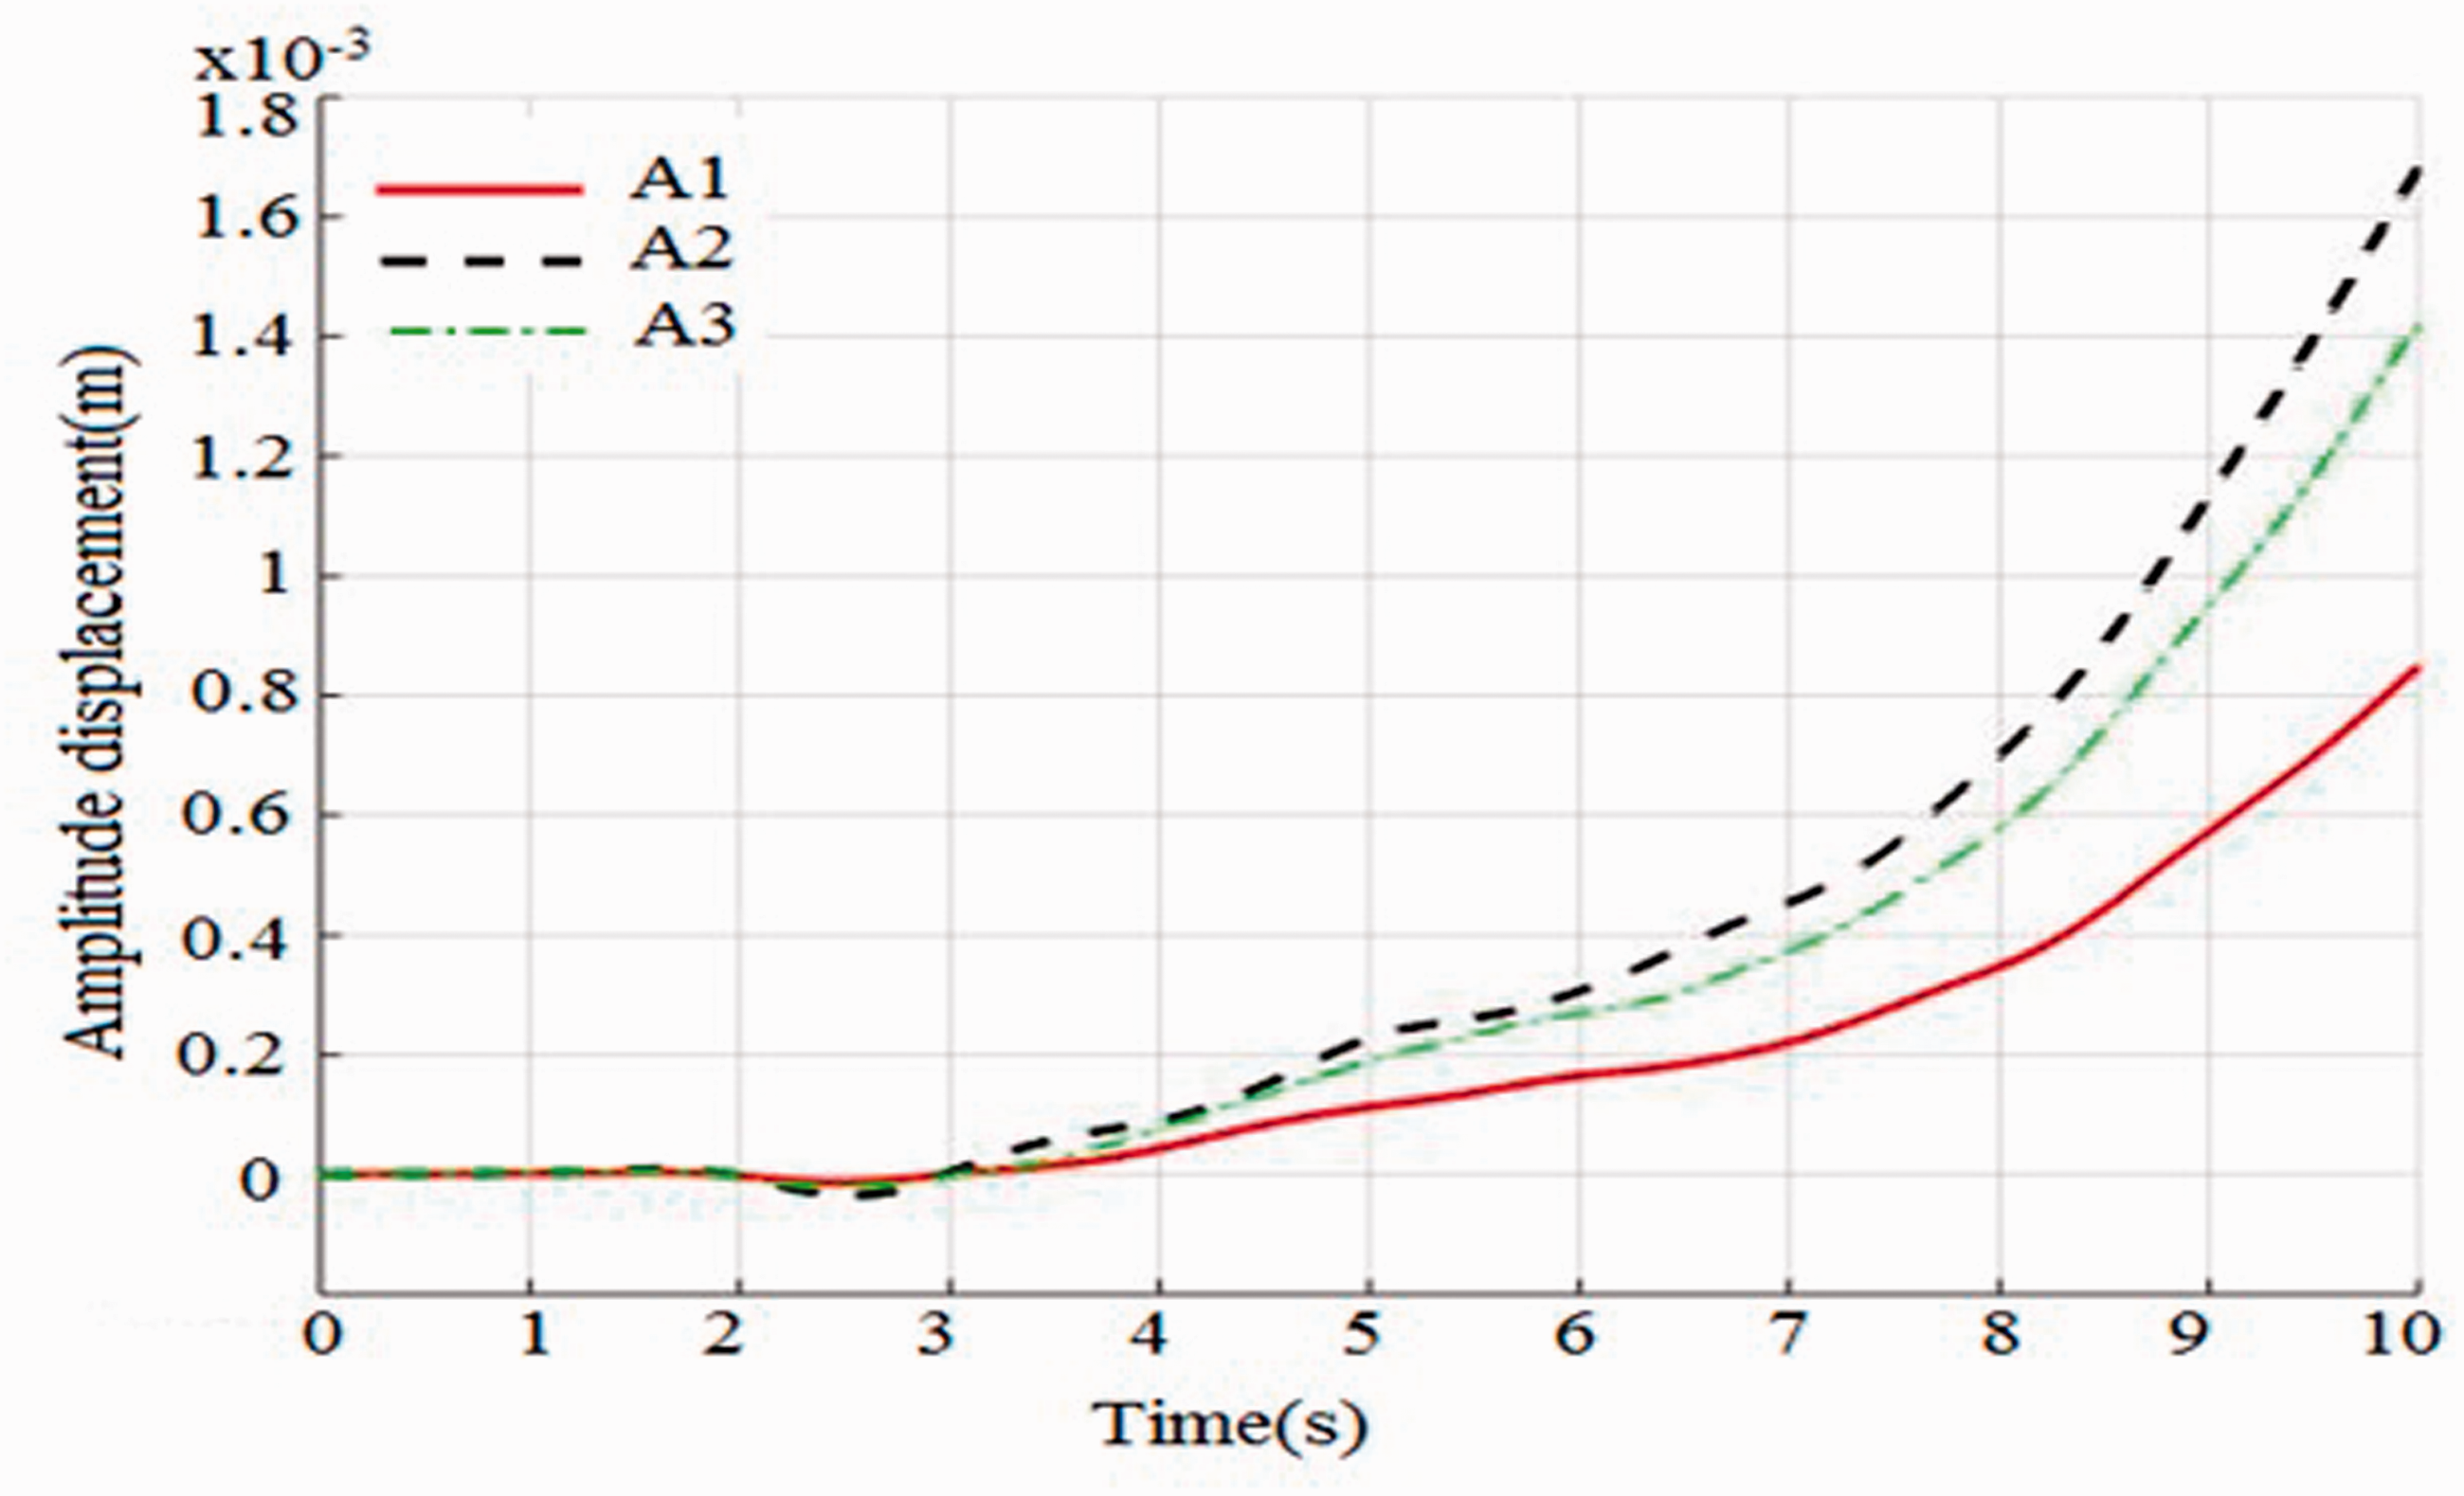
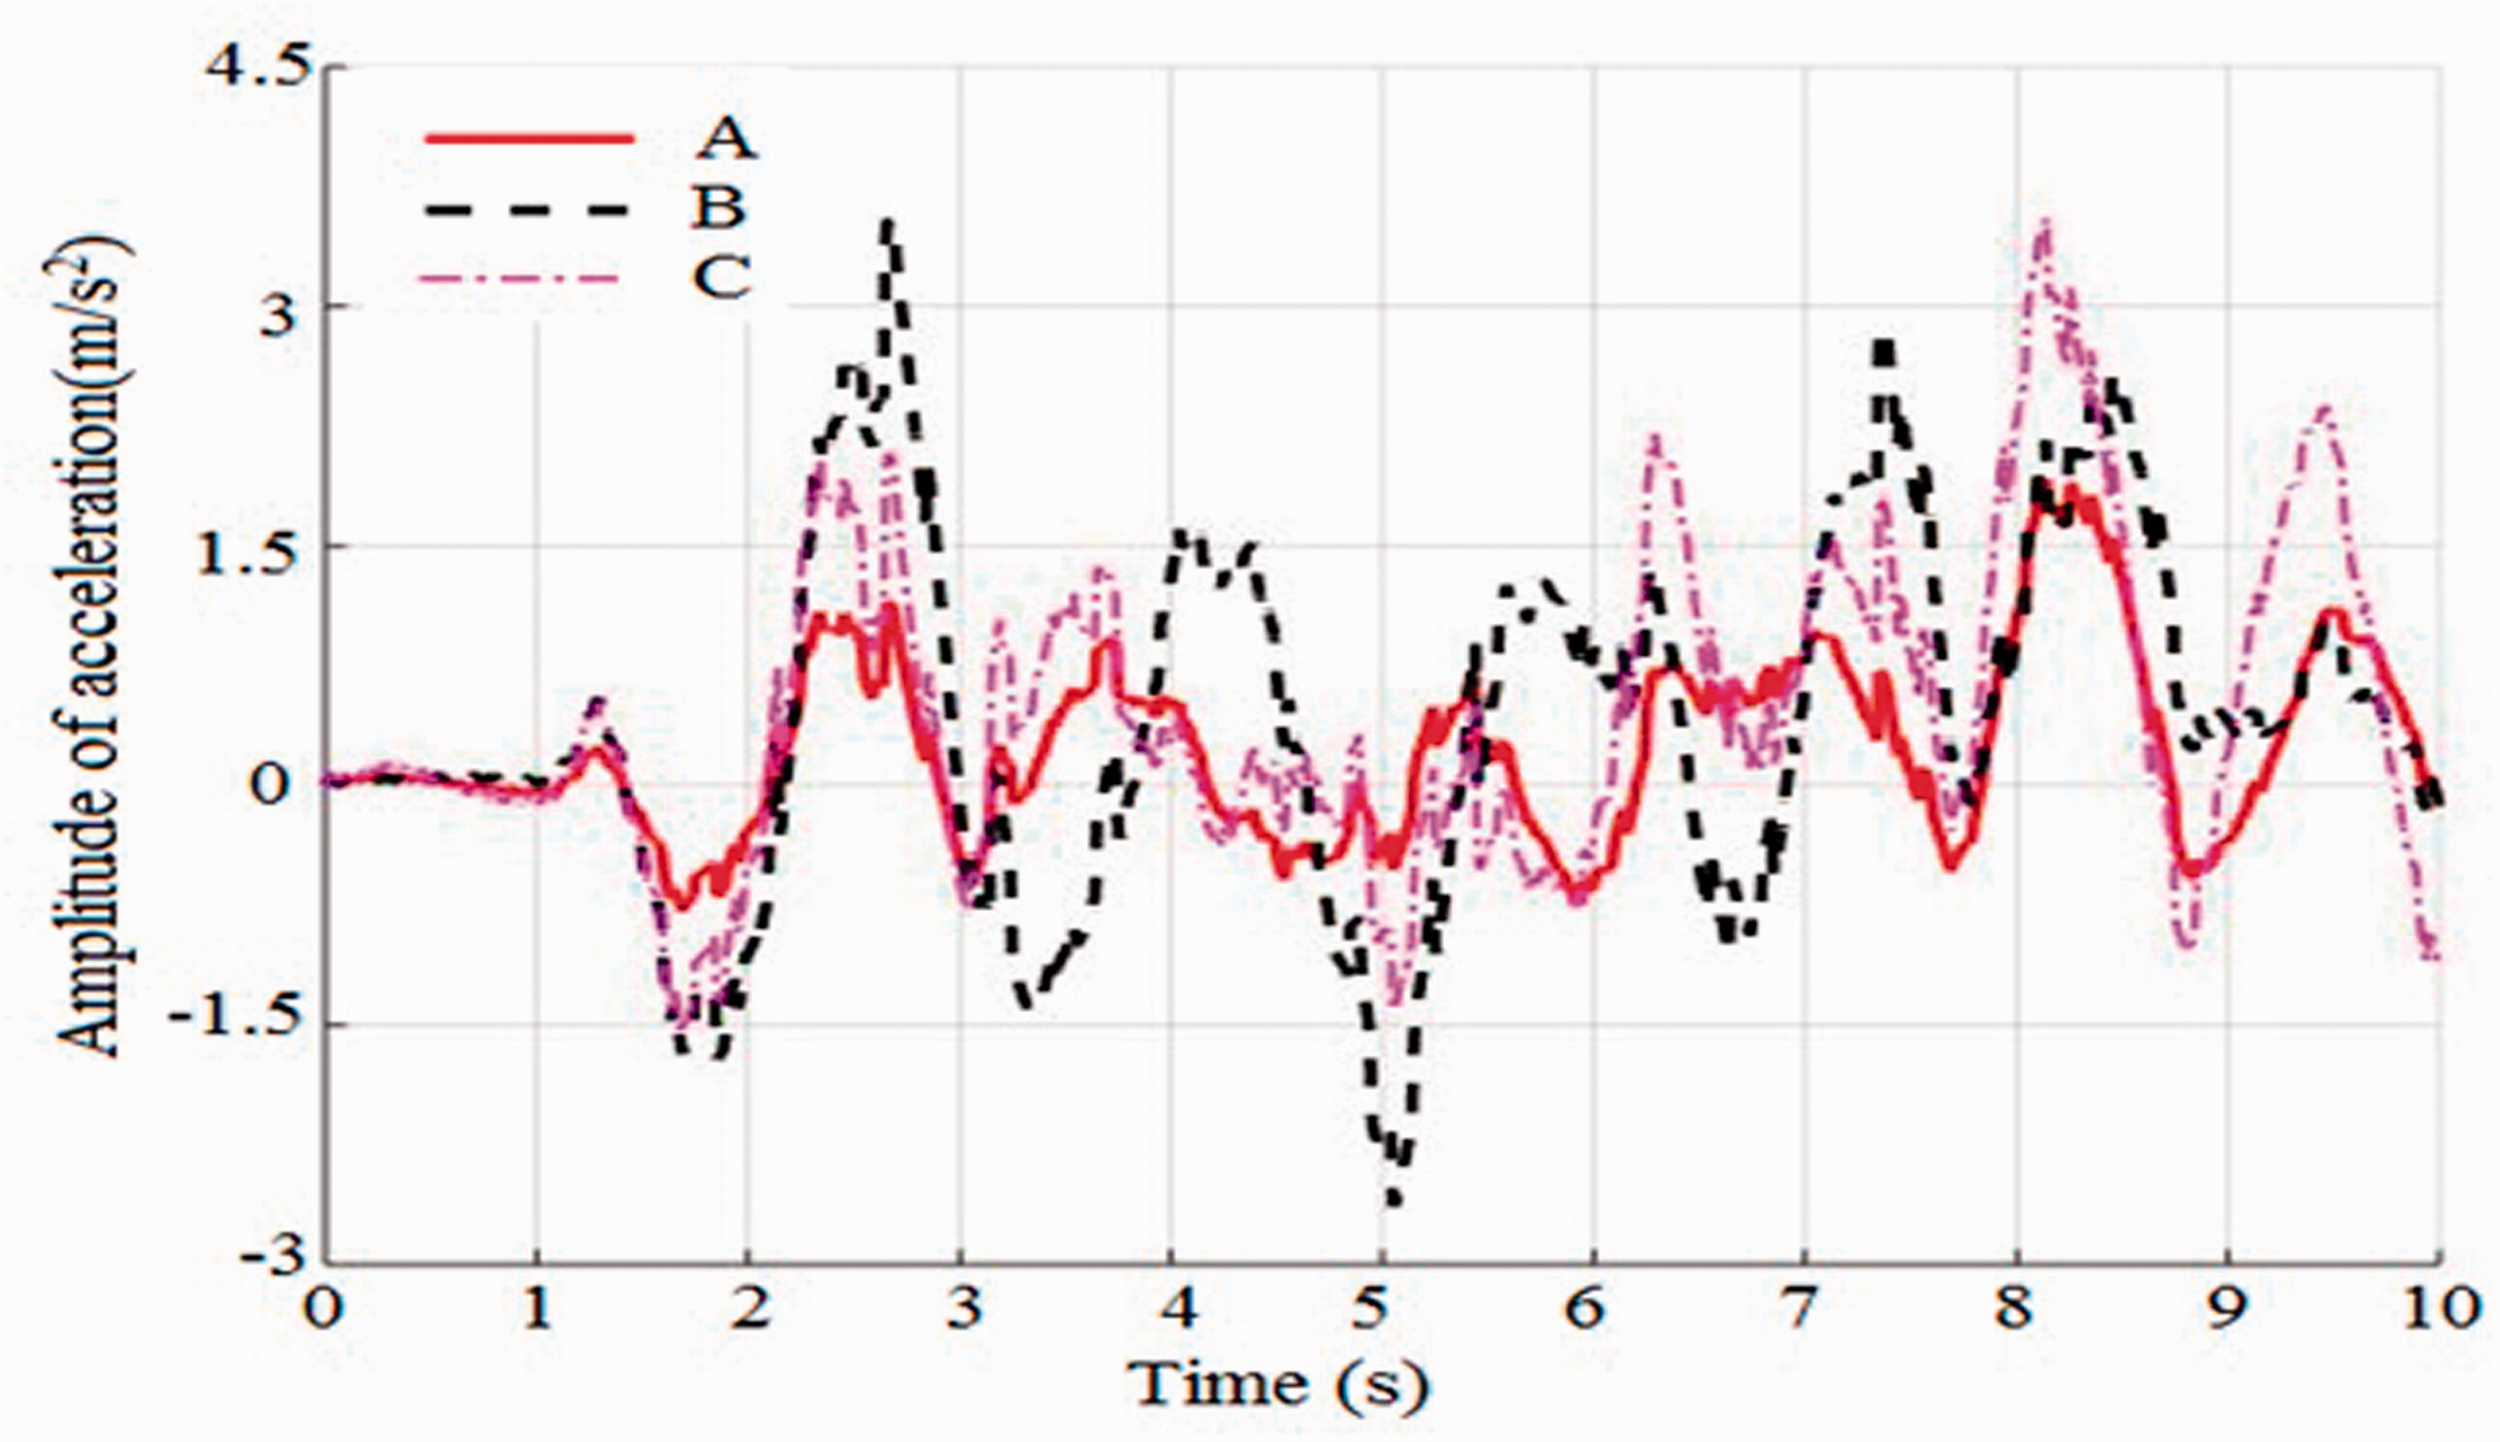
A new hybrid optimization method has been proposed to address the multi-objective optimization issues. Optimization through the random search method is at the heart of this new hybrid method. The new hybrid method based on Pareto Strength evolution algorithm (SPEA/R) and NSGA-III genetic algorithm developed to find global optimization. The efficient HNSGA-III&SPEA/R hybrid method is evaluated through the use of a variety of benchmarking functions for two objectives and three goals. The results are compared with other multi-purpose optimization methods such as SPEA/R and NSGA-III. The numerical results have shown that the proposed hybrid method has a higher efficiency in solving multi-objective optimization problems with much better convergence and coverage. HNSGA-III&SPEA/R has been applied in the problem of Powertrain mount system stiffness parameters optimization. Simulation results comparing one of the results in the set of the Pareto front from the HNSGA-III&SPEA/R algorithm with different stiffness values (K1.1, K1.2, and K1.3) are shown in Figures 9 and 10.
Acceleration of the vehicle frame.
Displacement of the vehicle frame.
Figure 9 shows the acceleration of the vehicle frame corresponding to the different stiffness values. Symbol A corresponds to the optimal stiffness value in a set of the Pareto front. Symbol B corresponds to K1.1 = 270,000; K1.2 = 380,000; K1.3 = 550,000. Symbol C corresponds to K1.1 = 780,000; K1.2 =750,000; K1.3 = 340,000. From the graph, we see that the smallest acceleration is at the optimal stiffness value. Similarly, Figure 10 shows the displacement of the vehicle frame corresponding to the different stiffness values. Symbol A1 corresponds to the optimal stiffness value in a set of the Pareto front. Symbol A2 corresponds to K1.1 = 280,000; K1.2 = 350,000; K1.3 = 750,000. Symbol A3 corresponds to K1.1 = 780,000; K1.2 = 740,000; K1.3 = 660,000. From the graph, we see that the smallest displacement is at the optimal stiffness value in a set of the Pareto front.
Thus, this paper has presented a new hybrid algorithm to calculate the optimal parameters simultaneously. This algorithm gives relatively accurate results, and this has been evaluated through the standard functions. Next, this algorithm is used to calculate six optimal stiffness parameters simultaneously for the engine mount system. The results of the algorithm have found out the optimal parameters of the engine mount, which makes the mount system eliminate unwanted vibrations to the chassis better than the previous methods.
Footnotes
Declaration of conflicting interests
The author(s) declared no potential conflicts of interest with respect to the research, authorship, and/or publication of this article.
Funding
The author(s) disclosed receipt of the following financial support for the research, authorship, and/or publication of this article: This work was supported by the National Natural Science Foundation of China (51875096, 51275082).