
Abstract
In China, noise pollution from substations in urban areas is becoming more and more serious. An annoyance evaluation of the noise emitted by urban substations is presented. First, the subjective evaluation is conducted on the noise samples from urban substations via the semantic differential method. Subsequently, according to the typical characteristics of urban substation noise, 14 acoustical metrics are used to describe the noise samples for objective evaluation. Then the correlation analysis and regression analysis between the objective and subjective evaluation results are carried out. Finally, a regression model for urban substation noise evaluation is established. Practical application shows that the regression model can correctly predict the subjective annoyance of urban substation noise.
Introduction
With the continuous and rapid progress of urbanization in China, more and more substations are being built in or near urban residential areas. The problem of substation noise disturbing residents has attracted more and more attention. The urban substation noise is usually composed of low-frequency harmonic noise caused by electrical equipment (such as transformers and reactors) and mid-high frequency noise generated by the transformer cooling system, and the former is usually significantly stronger than the latter.1–3 The noise, especially its low-frequency harmonic component, easily disturbs the lives of residents around the substation.
The noise exposure and noise annoyance4–6 related to substation can be evaluated scientifically and reasonably using the sound quality assessment method. Sound quality analysis requires people to participate in auditory events and make judgments based on subjective psychological expectations. At present, the research of sound quality is mainly concentrated in automobile, aircraft, train, and household appliance industries,7–10 while the research on substation noise is relatively less. Chen et al. 11 conducted multiple linear regression analysis on substation noise samples based on currently widely used psychoacoustic metrics. They established an annoyance prediction model and pointed out that the subjective annoyance mainly depends on the A-weighted sound pressure level (AWSPL). Liu 12 introduced the acoustical metrics such as psychoacoustics metrics and the sound pressure level (SPL) of each octave band to establish the mean annoyance (MA) and percentage of highly annoyed (%HA) prediction model of substation noise based on logical regression and stepwise regression analysis. They concluded that loudness level, loudness, and AWSPL are relatively suitable evaluation indicators for substation noise annoyance. However, the typical feature of urban substation noise is that 100 Hz and its harmonic frequencies are prominent,13,14 and the above literatures do not highlight this feature. Therefore, in this paper, the influence of this feature of urban substation noise on annoyance evaluation is considered.
In this paper, the next section presents the subjective evaluation of the noise samples of an urban substation. The subsequent sections investigate the main objective metrics of substation noise and establish the regression model. The last section summarizes the paper.
Subjective evaluation
Recording noise samples
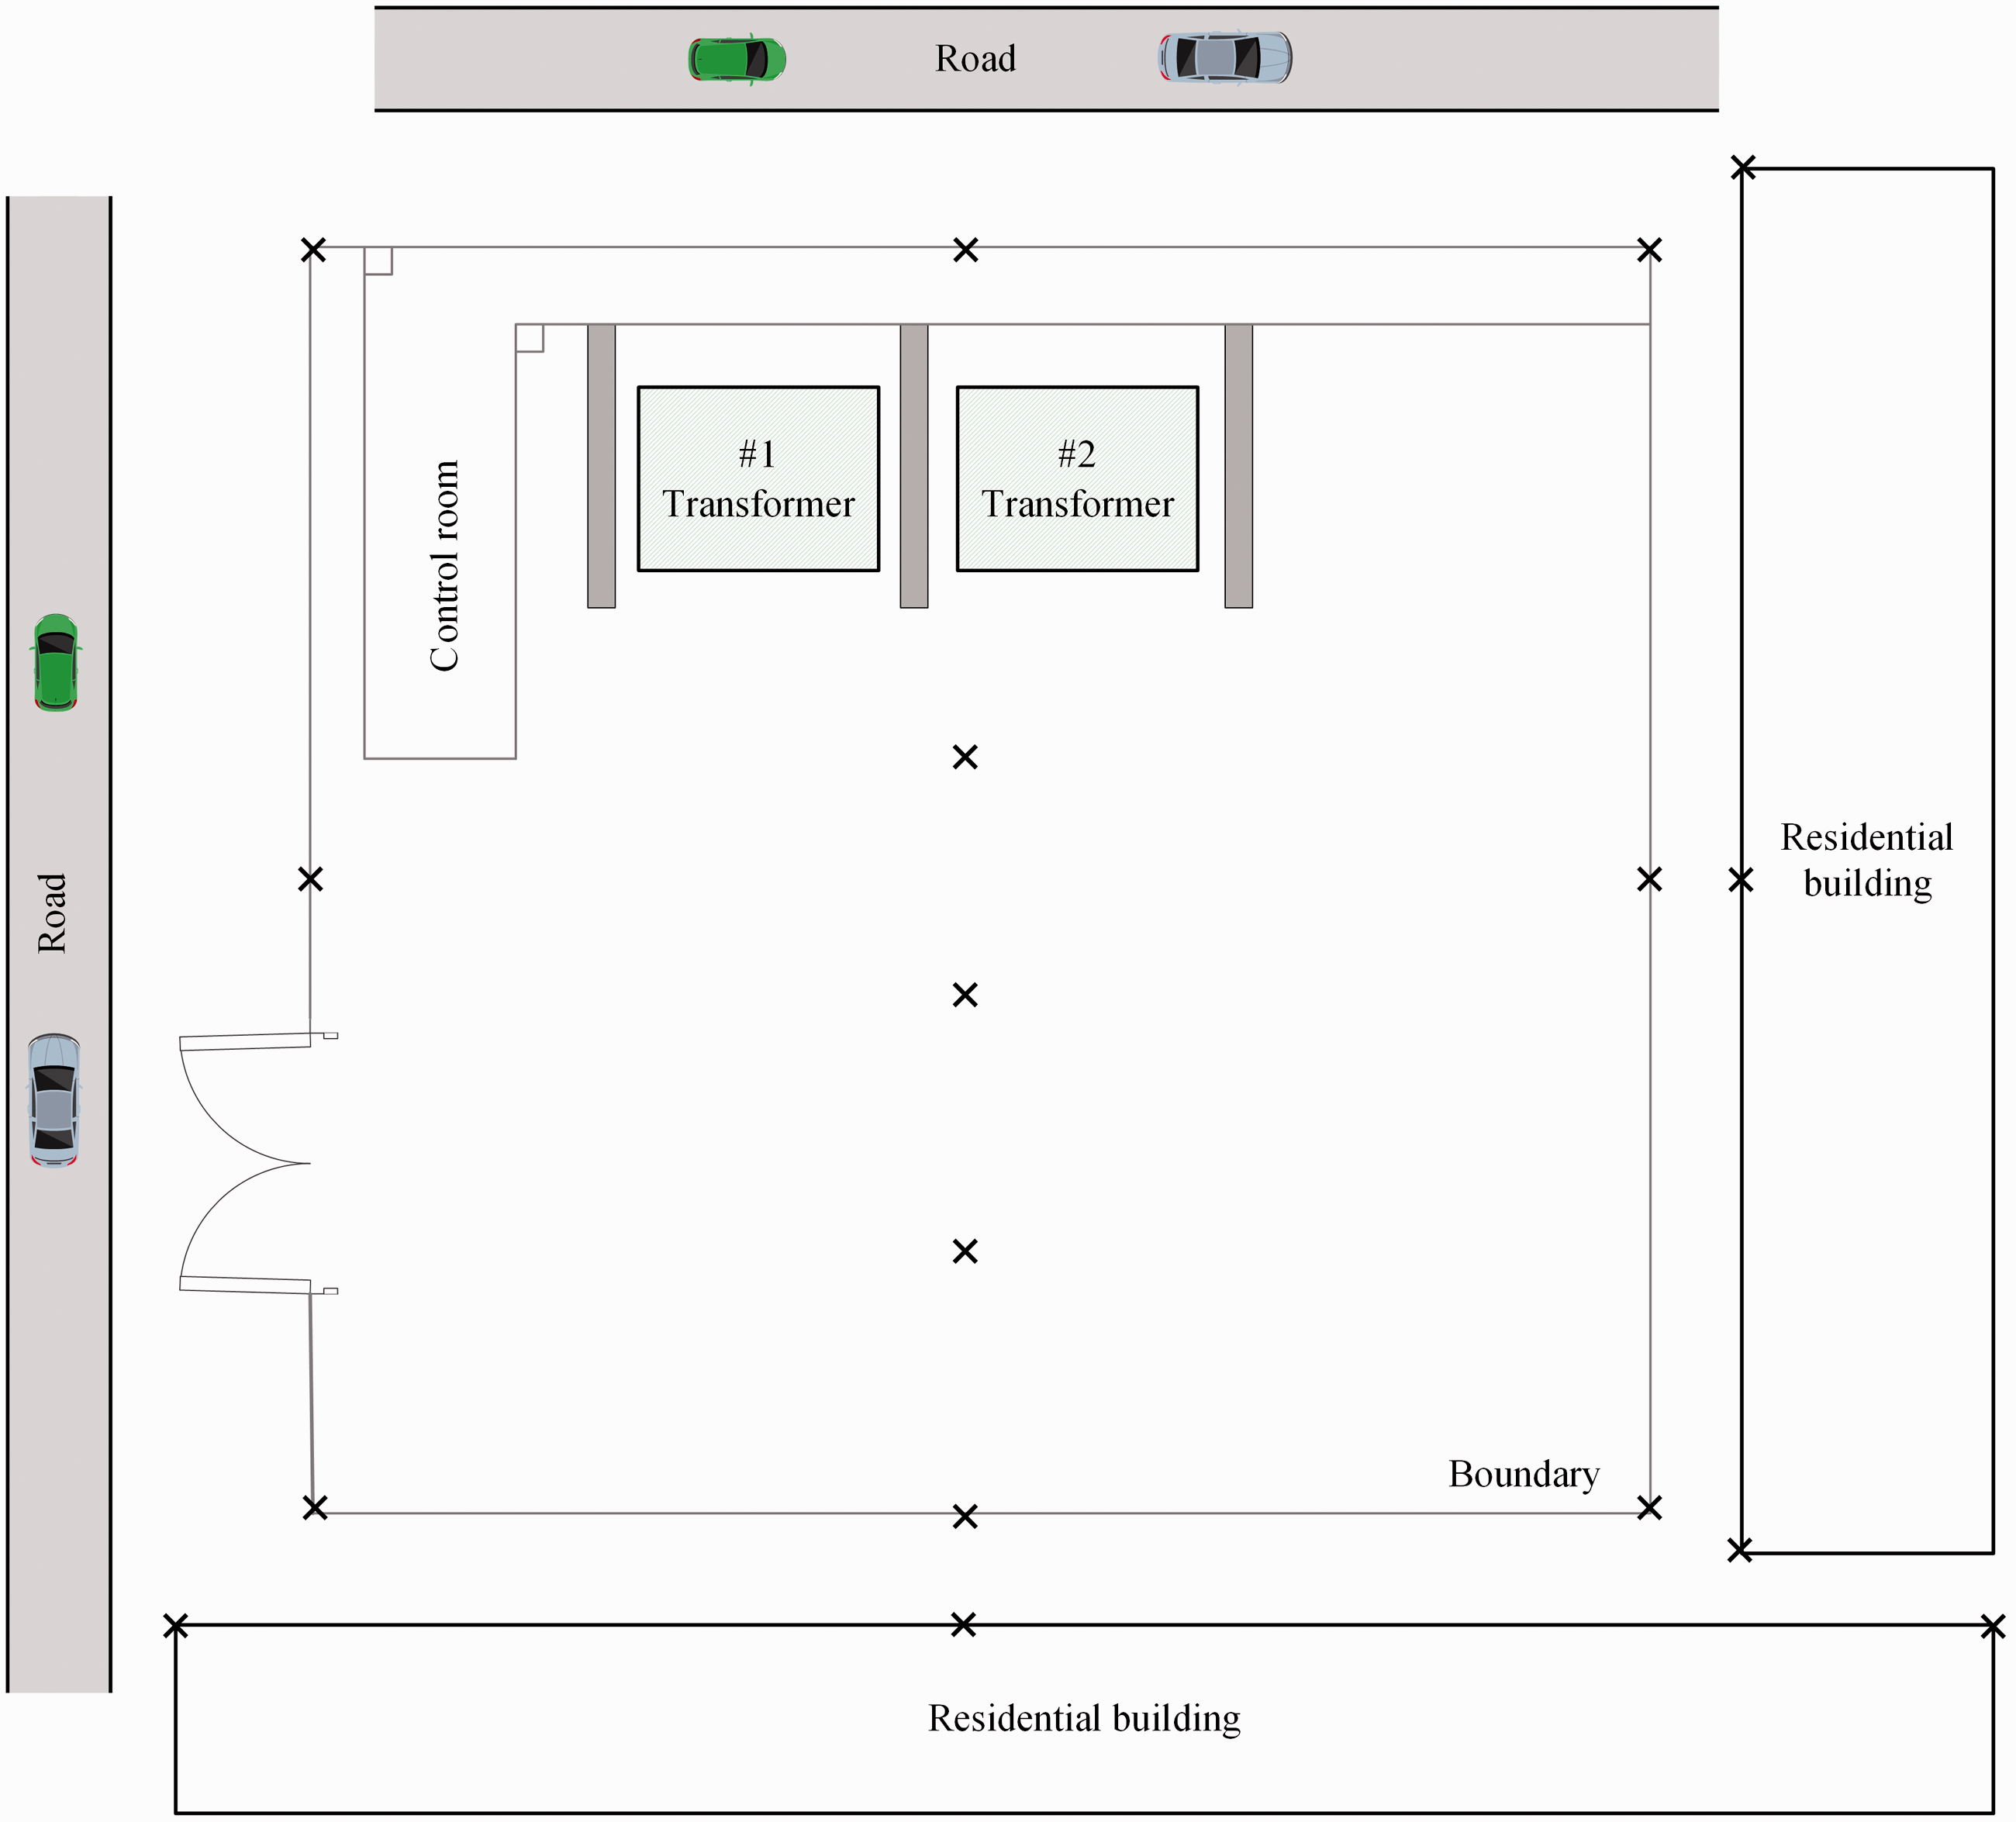
The PULSE data acquisition system (Bruel & Kjaer type 3050-A-060, Nærum, Denmark) and microphones (Bruel & Kjaer type 4189-A-021, Nærum, Denmark) were used to record noise of an urban substation. The layout diagram of substation and noise measurement points is shown in Figure 1. The two transformers installed outdoors are the main equipment that emits noise to the surrounding environment. The reactors are installed in the control room. Due to the sound insulation effect of the control room wall, the reactors emit very little noise to the surrounding environment. Noise measurement points are mainly located near the factory boundary and residential buildings to reflect the impact on travelers and residents. In order to make the data more diversified and reflect the impact on staffs, a small number of measurement points were arranged in the factory area. A total of 17 measurement points were set up. Three time periods were selected for the test: 2:00–3:00, 9:00–10:00, and 20:00–22:00. Considering the number of measurement points and time periods, 51 noise samples were collected. Noise samples with a duration of 5 s and less interference were extracted from the initial records for analysis. Among them, 43 samples were used for testing, and the remaining 8 samples were used for verification.
Figure1. The substation plane diagram. “×” denotes the noise measurement point.
Jury test
To subjectively quantify the annoyance level of substation noise, we conducted a jury test. The five-level semantic differential method shown in Table 1 was used. In other words, the subject utilized five levels of adjectives to judge the noise samples based on subjective feelings. 15 This method is suitable for people with insufficient experience, weak professional knowledge, and consistent with the actual audience of substation noise.
The scale of annoyance subjective evaluation.

In most psychoacoustics evaluation tests, 20 subjects are sufficient to obtain accurate results. In this test, 22 evaluation subjects including 11 males and 11 females were invited to participate in the jury test. They were all graduate students and teachers at Chongqing University with normal hearing conditions and aging from 22 to 50. Before the jury test, the evaluation subjects received standardized training. First, the test purposes, the evaluation method, and the descriptions of the sounds were explained. Then the evaluation subjects were asked to put on the headphone and trained with the sounds played back randomly. During the subjective evaluation, the subjects were provided with a semantic differential evaluation questionnaire to assess the samples based on their judgment.
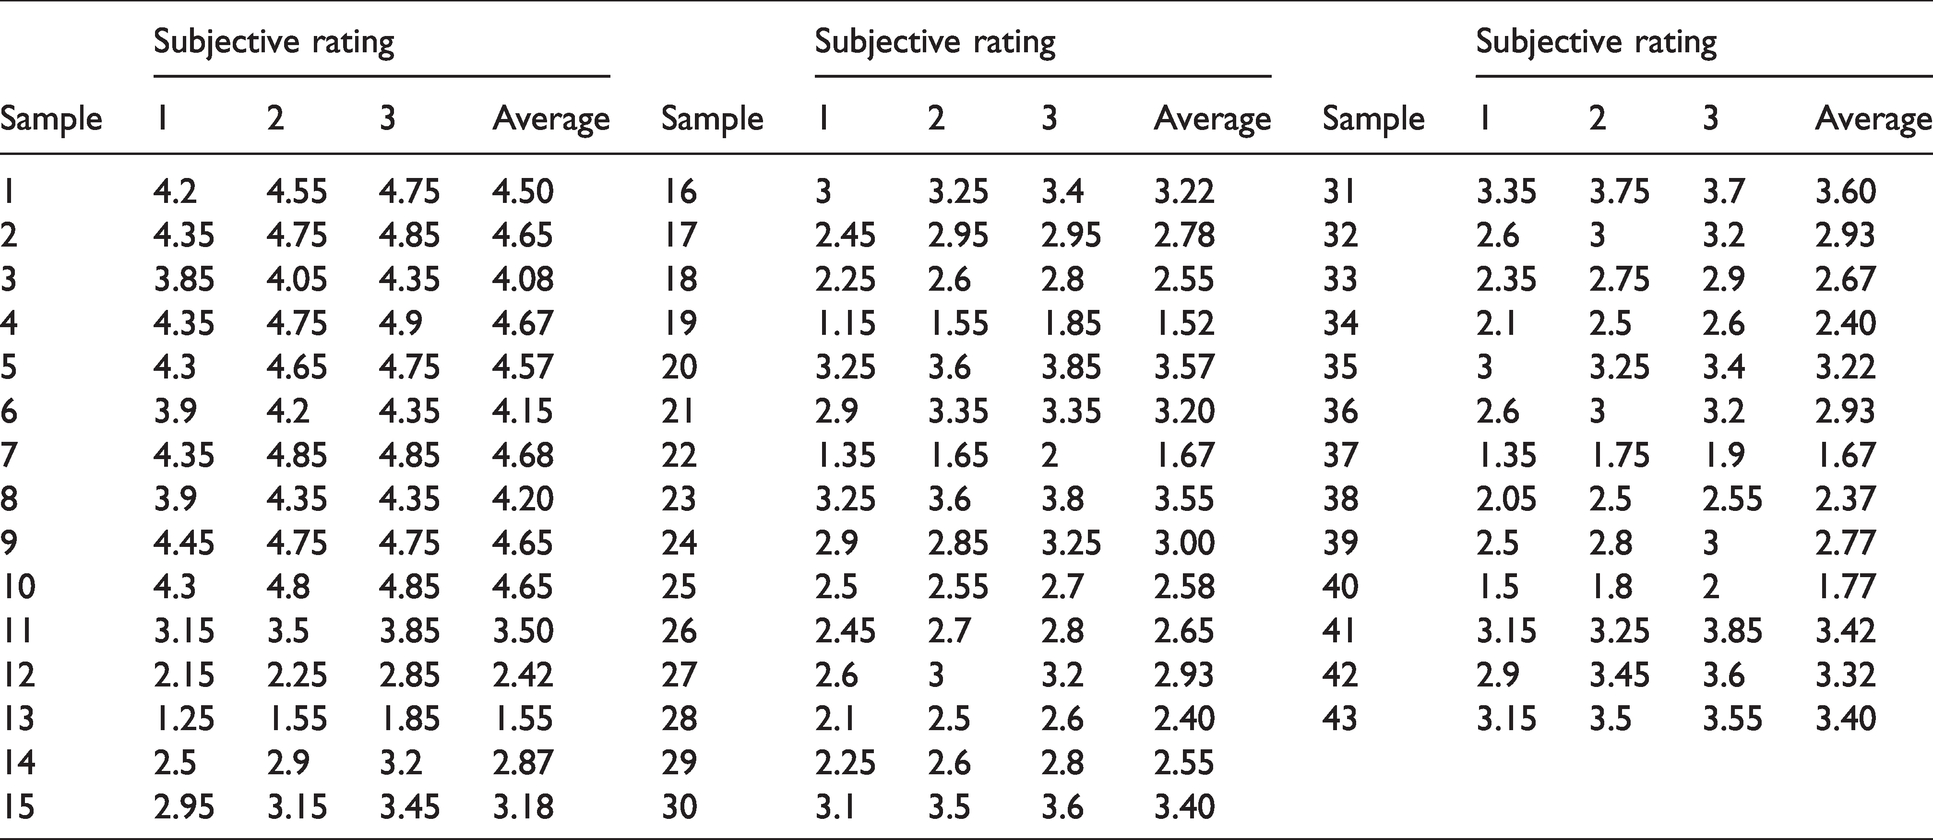
In this study, in order to eliminate the influence of the masking effect between samples, all samples were randomly sorted three times to form three groups. Therefore, each evaluation subject gives three evaluation scores for each sample. The evaluation score of the same sample from the same subject is allowed to be at most two adjacent levels; otherwise, the corresponding evaluation result would be deleted. The evaluation scores from two subjects were deleted because their correlation with the evaluation scores from other subjects was less than 0.6. The percentage of data deletion was about 10%, meeting the requirements of sound quality evaluation. 16 After eliminating invalid data, the average score of the same noise sample from all evaluation subjects is taken as the subjective rating of this sample. The results of three subjective ratings are shown in Table 2. Figure 2 presents the mean and the standard deviation of evaluation scores of each noise sample. The mean corresponds to the subjective annoyance level of each sample. The standard deviation was relatively low, which means that the evaluation scores of noise samples were concentrated.
The result of three subjective ratings.
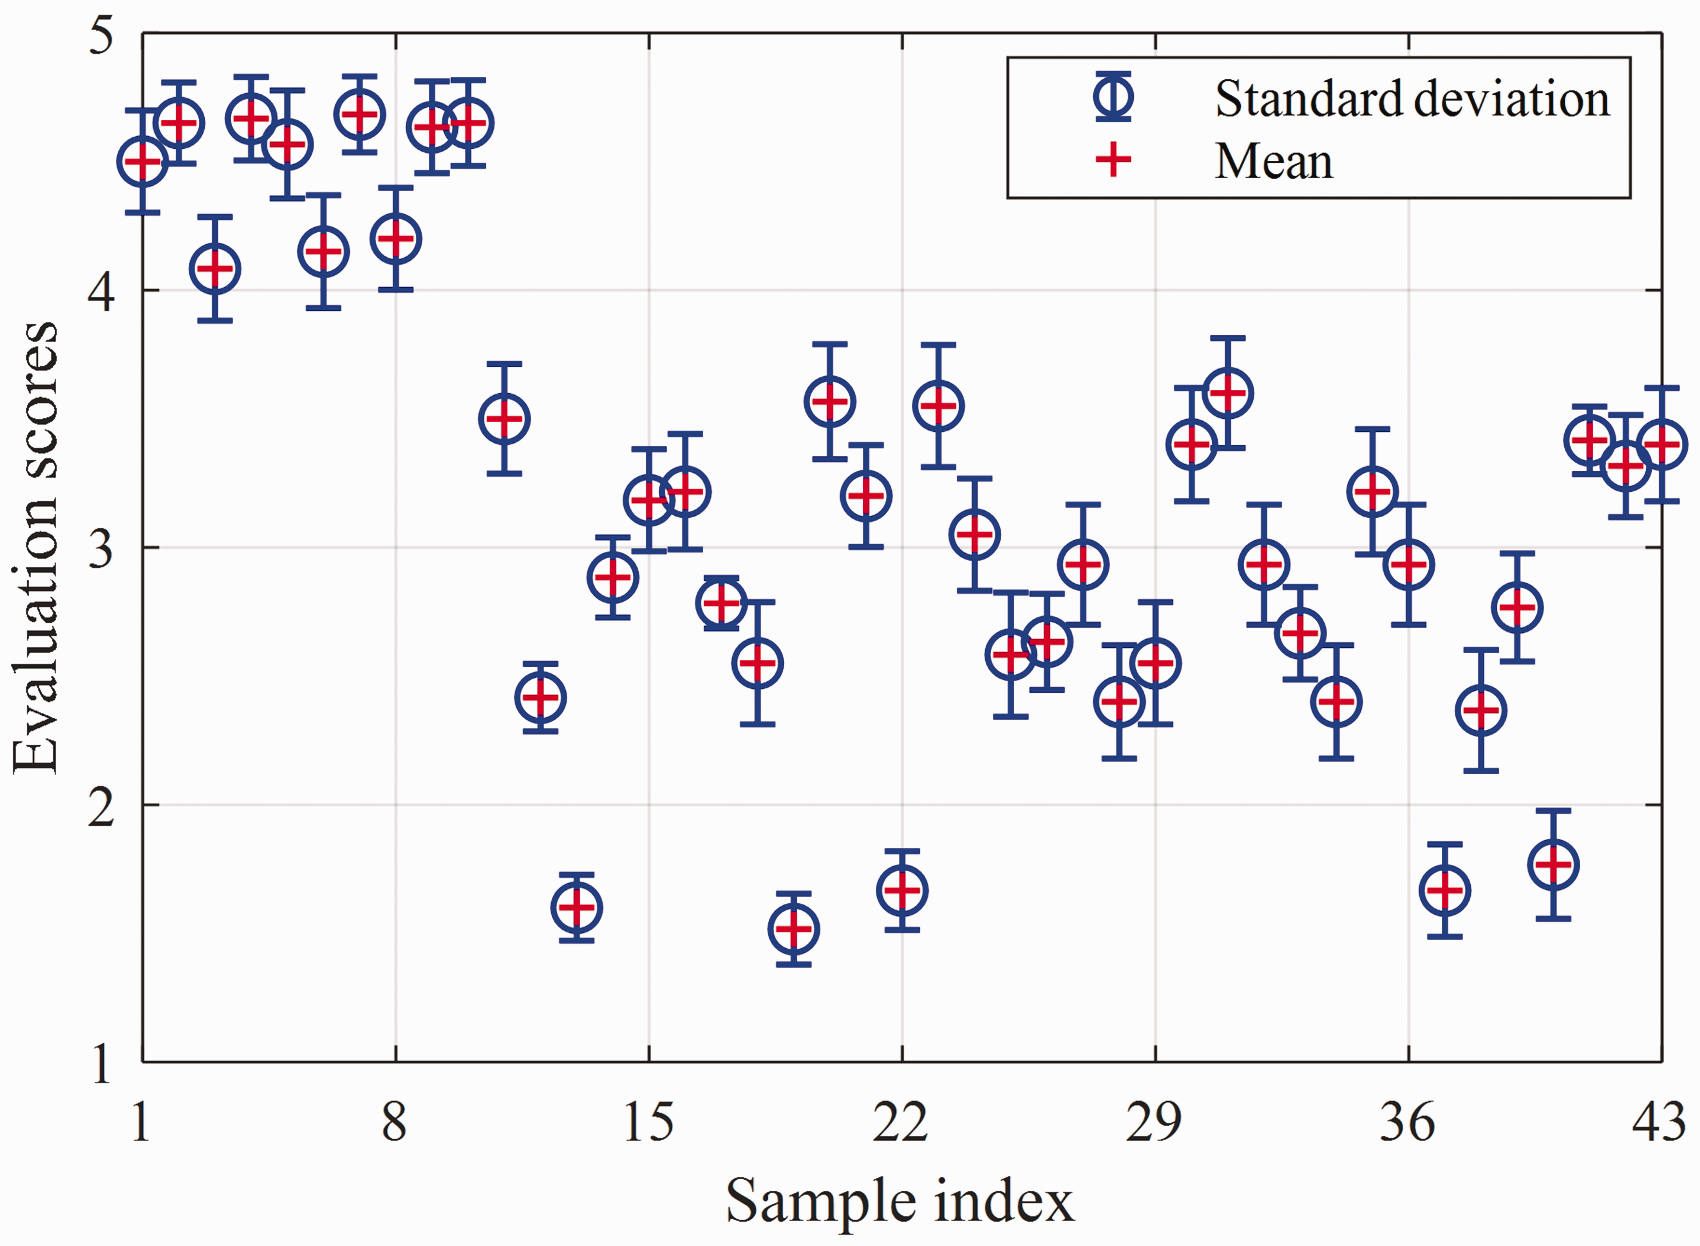
The mean and the standard deviation of evaluation scores of each noise sample.
Objective evaluation
Selection of objective parameters
Figure 3(a) shows the frequency spectrum of all substation noise samples. Figure 3(b) is an enlarged view of Figure 3(a) corresponding to the frequency band below 1000 Hz. It can be seen from Figure 3 that the main noise energy of all samples is concentrated within 1000 Hz; there are significant peaks in the first 10 integer multiples of 100 Hz. Therefore, extract the AWSPLs of the first 10 integer multiples of 100 Hz and the total SPL and AWSPL for subsequent analysis.
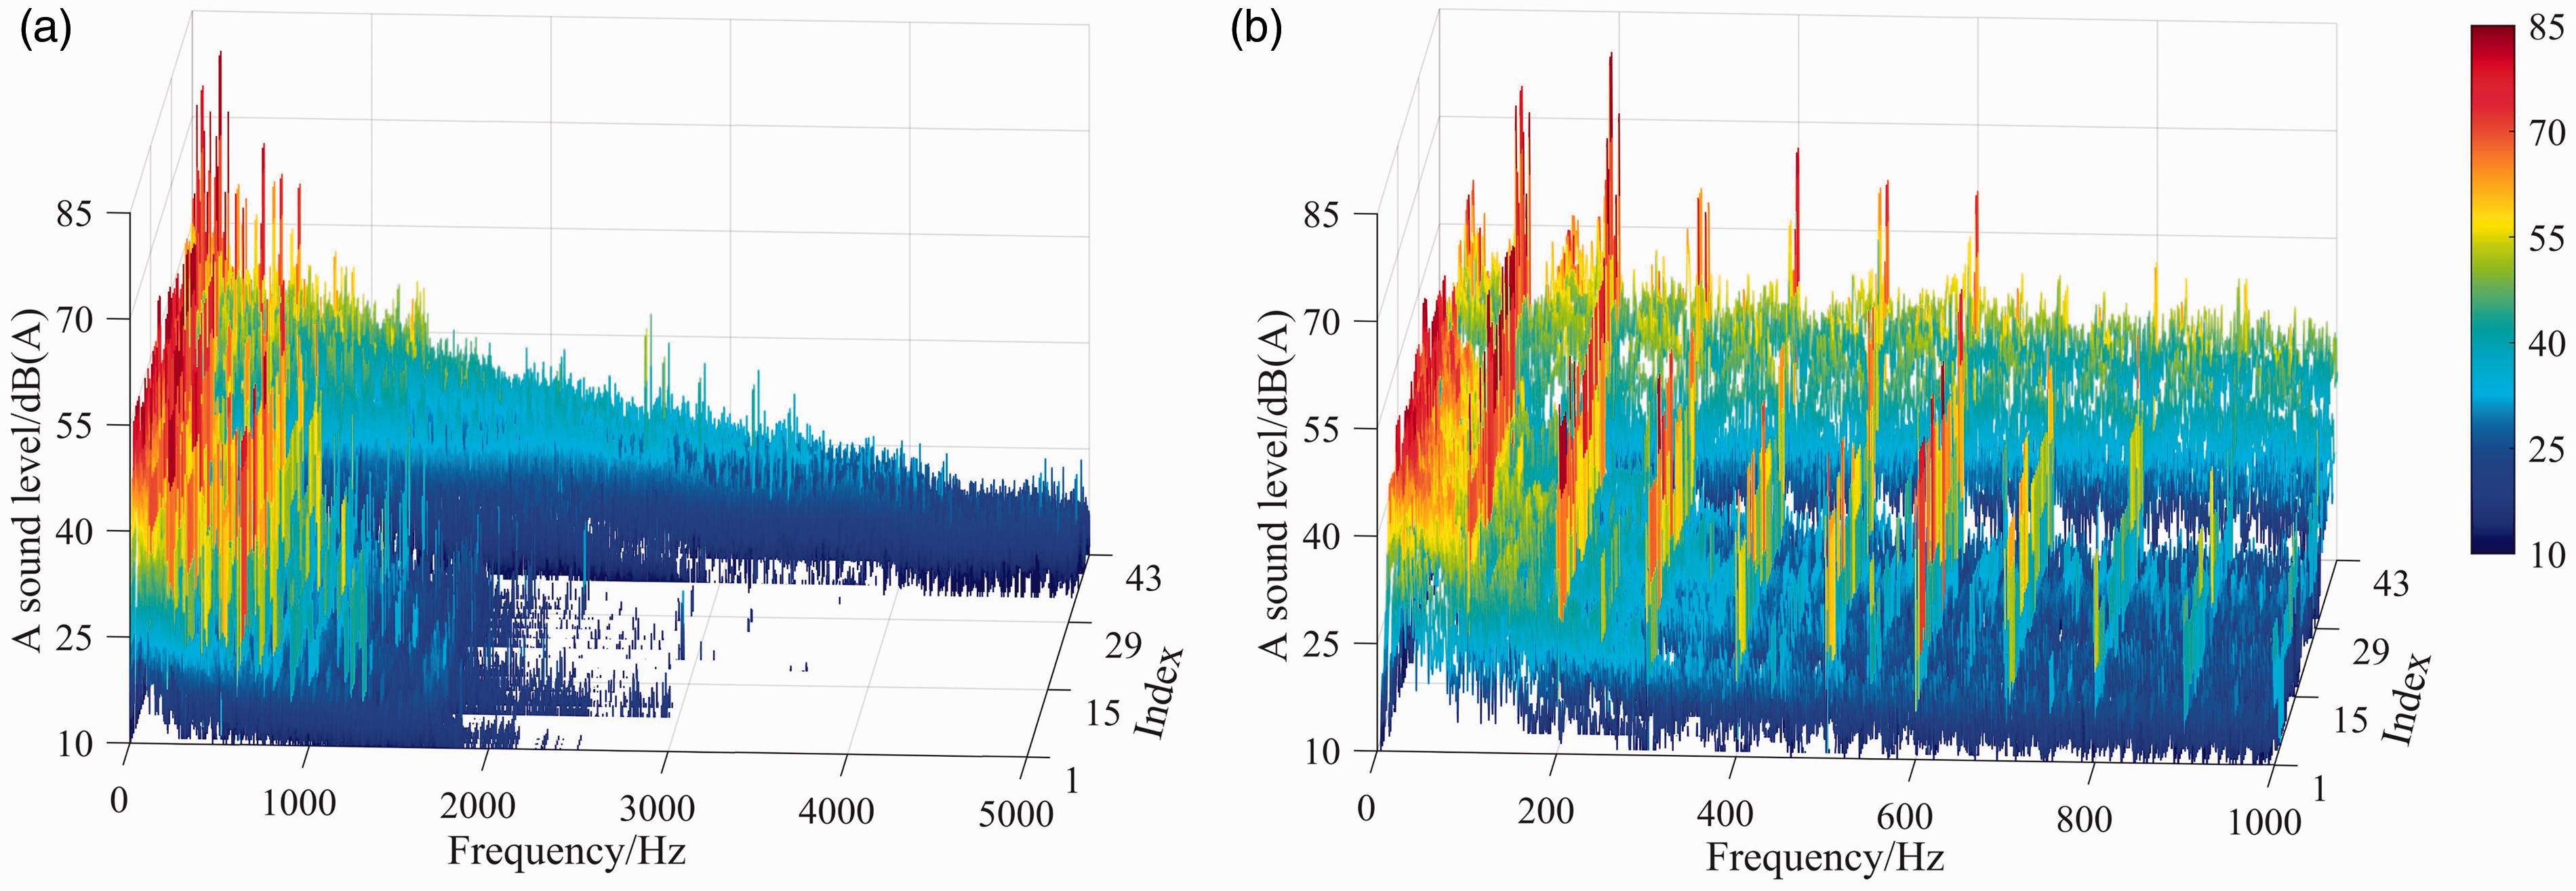
Frequency spectrum of substation noise: (a) 0–5000 Hz and (b) 0–1000 Hz.
In addition to SPL, widely used psychoacoustic metrics of sound quality include loudness, tonality, sharpness, fluctuation strength, and roughness. Among them, loudness (N) is the most basic parameter in the psychoacoustic model and represents sound strength. Tonality (T) describes the pure tone components of a sound. Studies have shown that noises with tonal components tend to make people more annoyed. 17 Sharpness (S) reflects the high-frequency components of the noise, while the noise of this urban substation is mainly low frequency as shown in Figure 3, which does not bring an obvious sense of sharpness to people. Fluctuation strength (F) and roughness (R) measure the modulation characteristics of the sound. The substation noise is a typical low-frequency steady noise, and there is no obvious modulation component. Taking these factors into account, this paper only extracts loudness and tonality, while ignoring sharpness, roughness, and fluctuation strength.
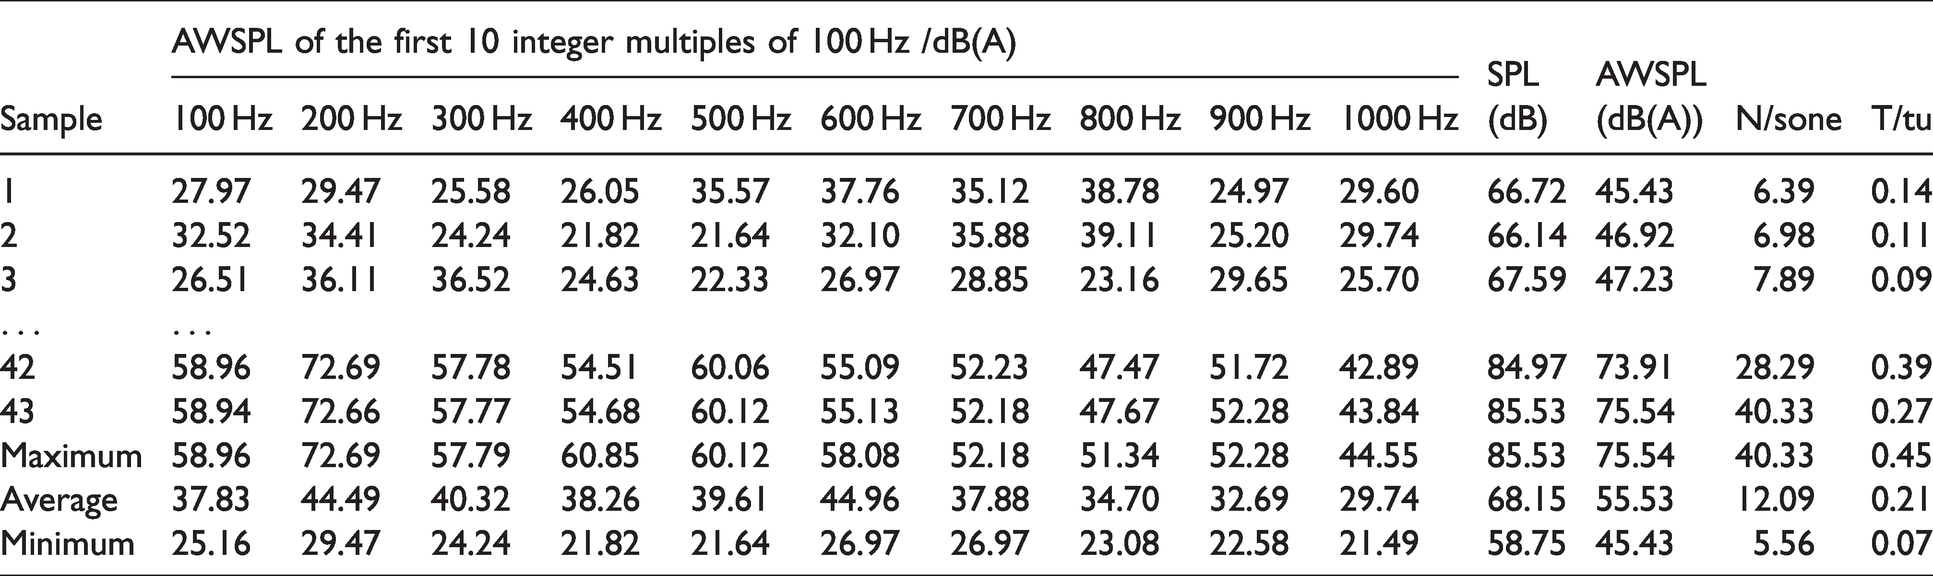
The above-mentioned objective parameters of 43 noise samples, and their maximum, average, and minimum are listed in Table 3. These parameters are calculated utilizing BK Connect software (Bruel & Kjaer type 8404, Nærum, Denmark). The AWSPLs of the first 10 integer multiples of 100 Hz and the total SPL and AWSPL are obtained through the FFT analyzer module. The FFT parameters are set as: the analysis frequency is 1000 Hz, the frequency resolution is 2.5 Hz, the time weighting is Hanning window, and the overlap is 66.7%. SPL and AWSPL refer to the total SPL and the total AWSPL corresponding to the frequency range of 20–1000 Hz, respectively. Loudness N and tonality T are calculated through the sound quality module according to the standards DIN 45631/A1(2010) and ANSI S1.13(2005), respectively.
The objective metrics of partial samples.
Redundant metric elimination
The above 14 objective metrics have overlapping information, leading to parameter redundancy of the sound quality prediction model. In this subsection, the correlation between the above objective metrics is investigated, and redundant metrics with high correlation are identified and deleted. Pearson correlation analysis is performed by SPSS software on the above objective metrics. The matrix of correlation coefficients (absolute value) between any two objective metrics is shown in Figure 4, where indexes 1–14 represent the AWSPLs of the integer multiples of 100 Hz within 1000 Hz, total SPL, total AWSPL, loudness, and tonality. Figure 4 shows that the correlations between tonality and other metrics are weak. The correlations between the total AWSPL and most of the other metrics are strong, indicating that there is a serious overlap of information between these metrics. In order to eliminate redundant metrics, dimensionality reduction processing is required.
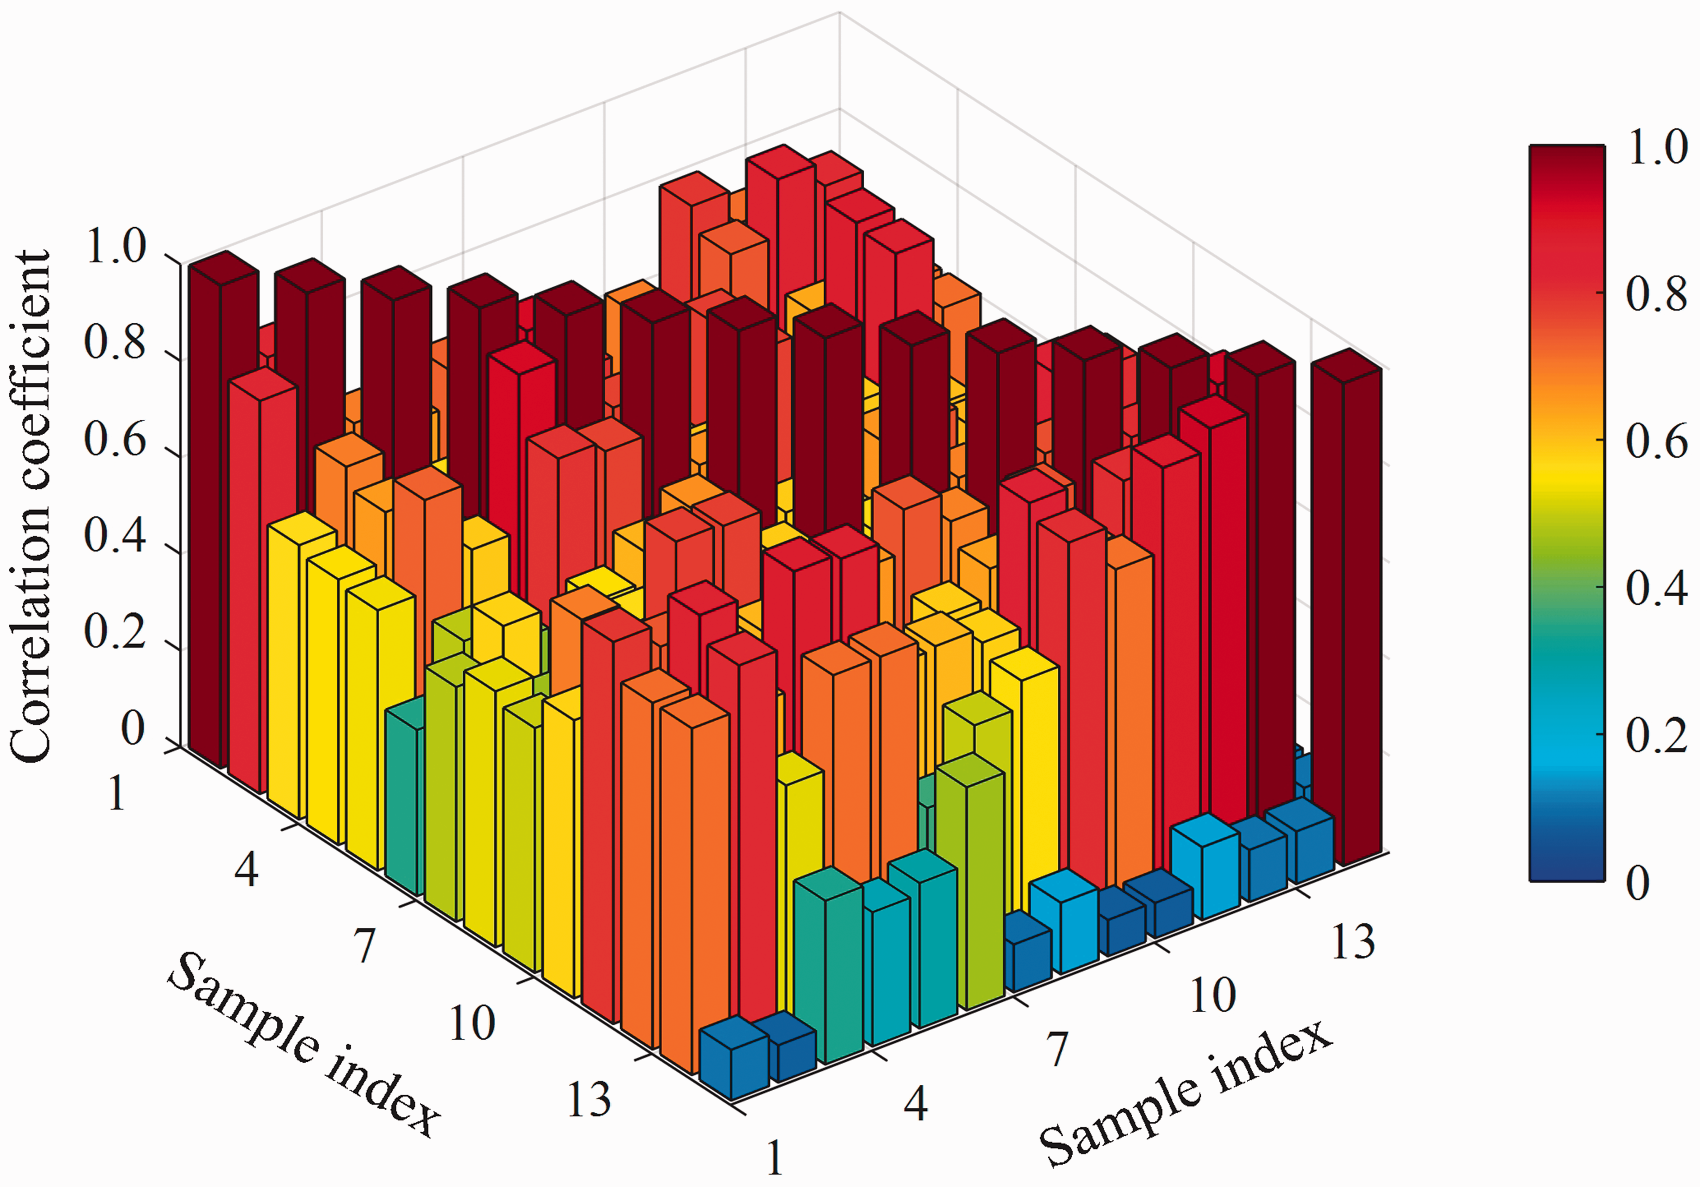
The correlation coefficient (absolute value) matrix of objective metrics.
The principal component analysis 18 is a widely used method of dimensionality reduction. This method can convert multiple parameters into a few uncorrelated comprehensive parameters (principal components) under the premise of less information loss to achieve the purpose of simplification. The eigenvalues of principal components and their cumulative contribution rate are shown in Figure 5. The principal component eigenvalues with a large contribution rate were extracted and listed in Table 4. It can be seen from Figure 5 and Table 4 that the cumulative contribution rates of the first two principal components have reached 74%.
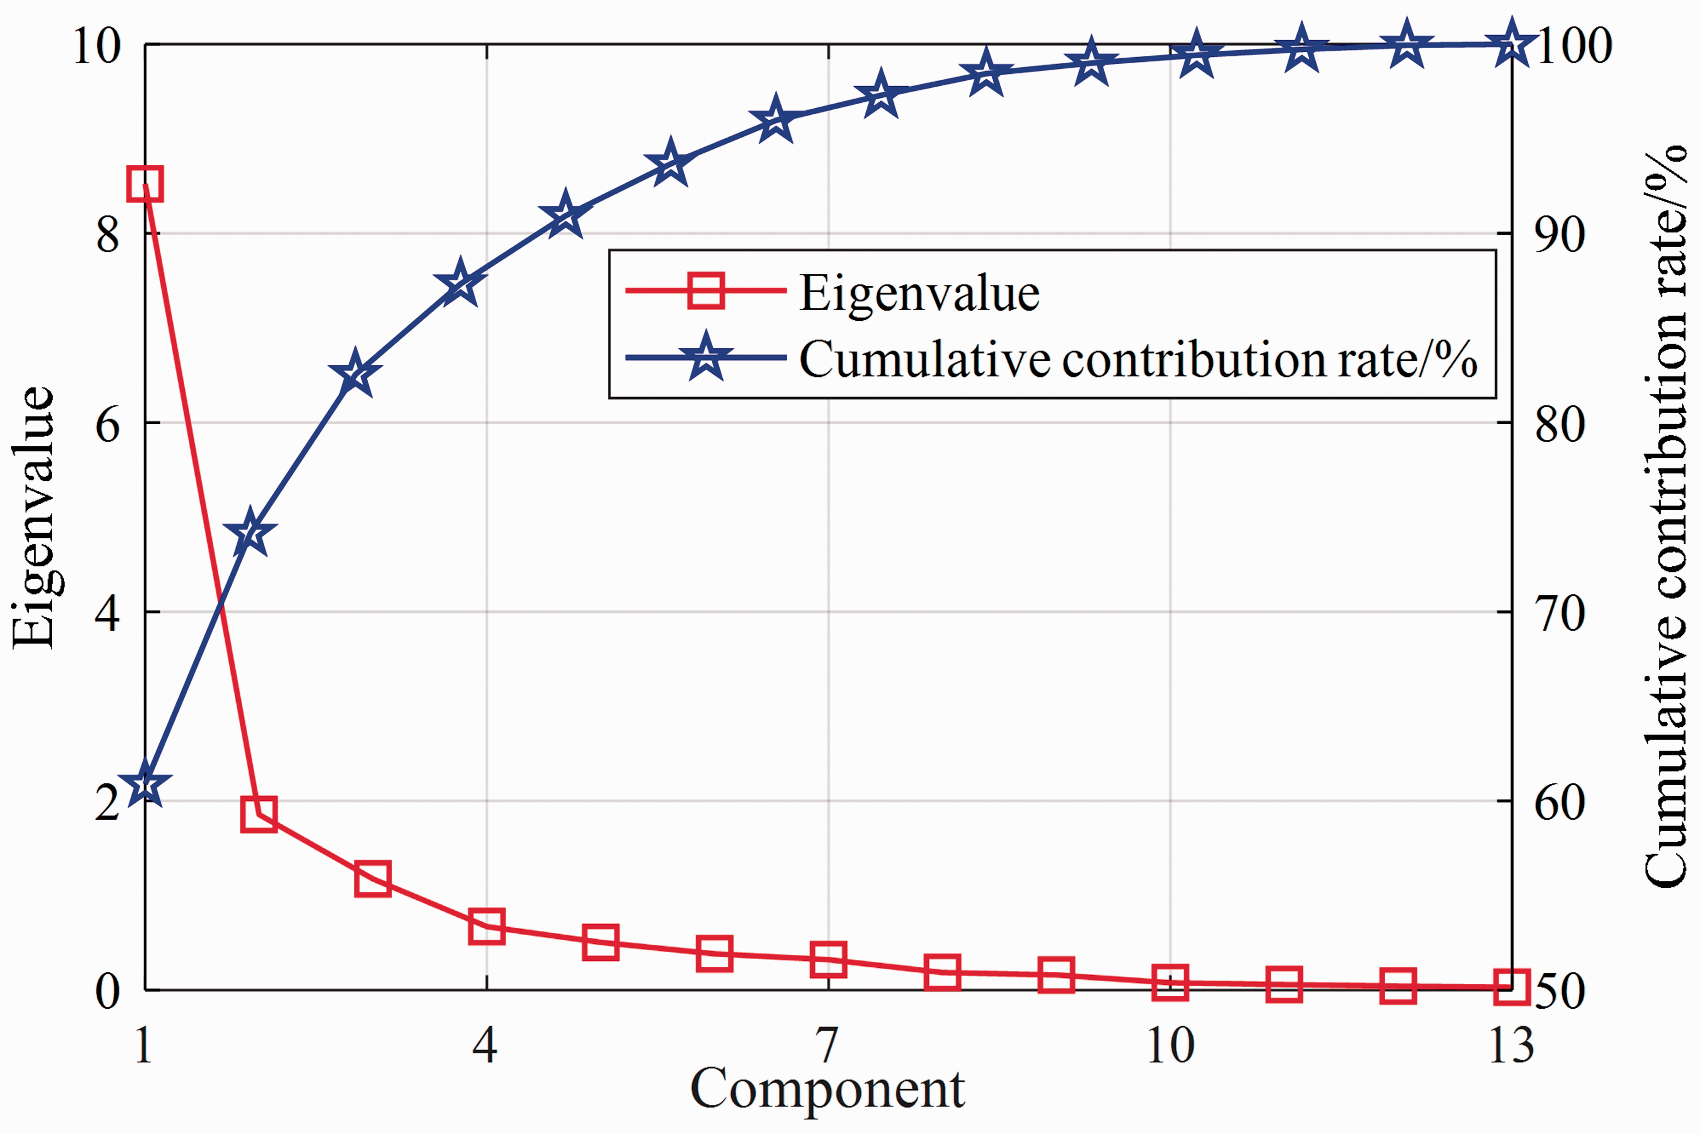
Principal component eigenvalues and cumulative contribution rate.
The eigenvalues and contribution rate of the extracted principal component.
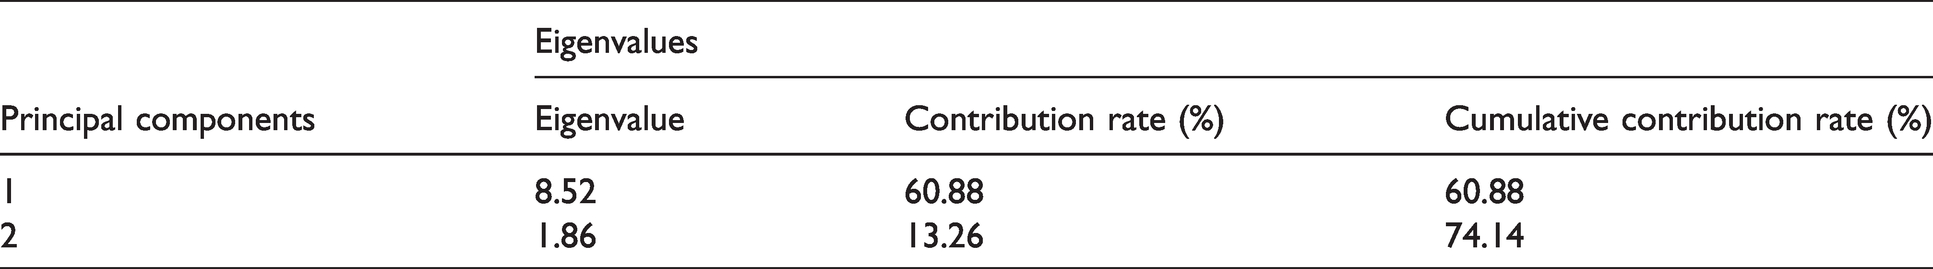
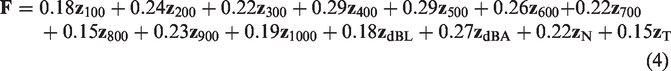
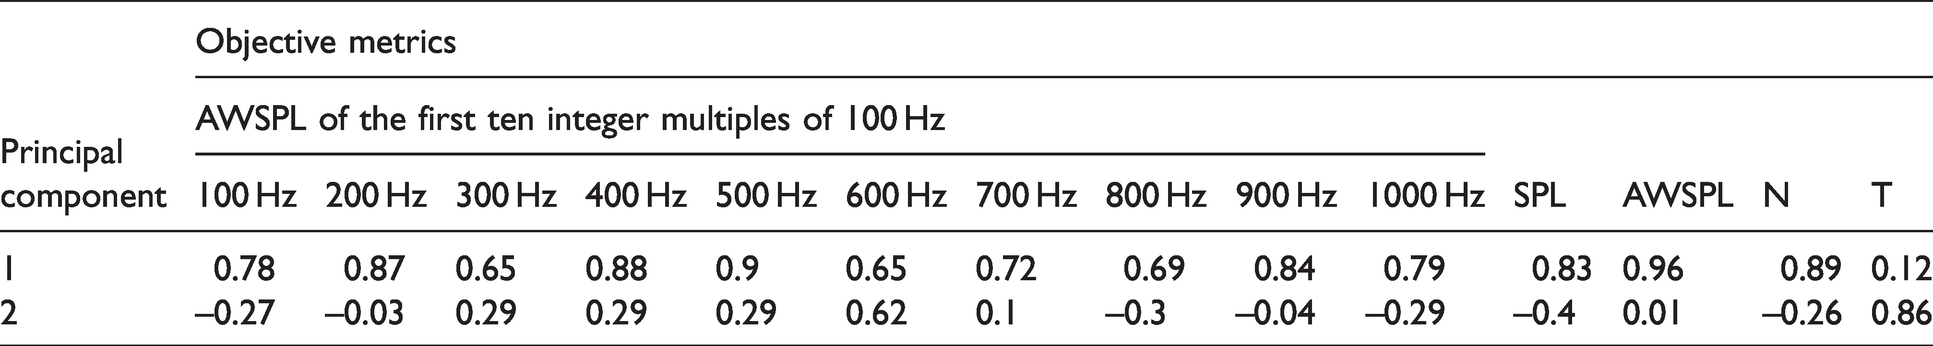
Table 5 shows the load matrix of the first two principal components. It can be seen from Table 5 that the first-order principal component mainly corresponds to the comprehensive influence of 100 Hz integer harmonics AWSPLs, total SPL and AWSPL, and loudness. The second-order principal component mainly focuses on the influence of 600 Hz AWSPL and tonality. The principal component expressions reflected by all metrics are


Principal component load matrix.
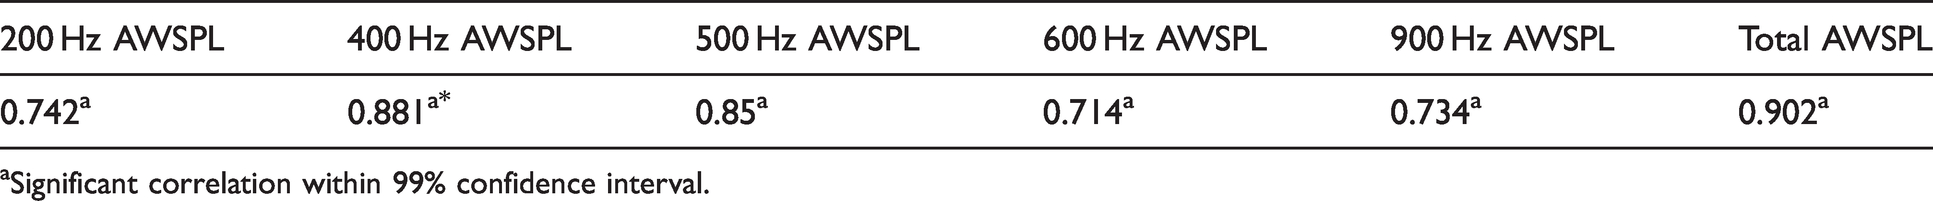
It can be seen from equation (4) that the major contributors include AWSPLs of 200, 400, 500, 600, 900, and total AWSPL, which are the main metrics affecting the annoyance. The contribution of other metrics to the principal component is relatively low and should be eliminated. The Pearson correlation coefficients between the above reserved metrics and the subjective evaluation result are shown in Table 6.
The correlation coefficients between subjective evaluation and objective metrics.
aSignificant correlation within 99% confidence interval.
Table 6 shows that the subjective evaluation result is highly correlated with AWSPLs of 200, 400, 500, 600, and 900 Hz as well as total AWSPL. This result further illustrates that the above low frequency band 100 Hz integer harmonics have a significant influence on its annoyance.
Establishment and verification of evaluation model
The significance of sound quality model prediction lies in that it can accurately reflect the noise annoyance degree through objective parameters,
19
so that simple objective evaluation can be used to predict the noise annoyance degree of similar urban substations instead of laborious and tedious subjective evaluation. In order to establish the quantitative relationship between the subjective annoyance and the objective metrics highly related to the annoyance, regression analysis based on least square is carried out with these objective parameters as independent variables and the subjective annoyance as dependent variable. Due to the large number of independent variables, multiple linear stepwise regression is adopted in this paper. Its basic idea is to introduce independent variables into the regression model one by one according to their significant degree of influence on dependent variables and delete the existing independent variables that become irrelevant to the model due to the introduction of new variables. Therefore, the final regression model only includes variables that have a significant impact on the dependent variables. The regression model of substation noise annoyance is obtained as
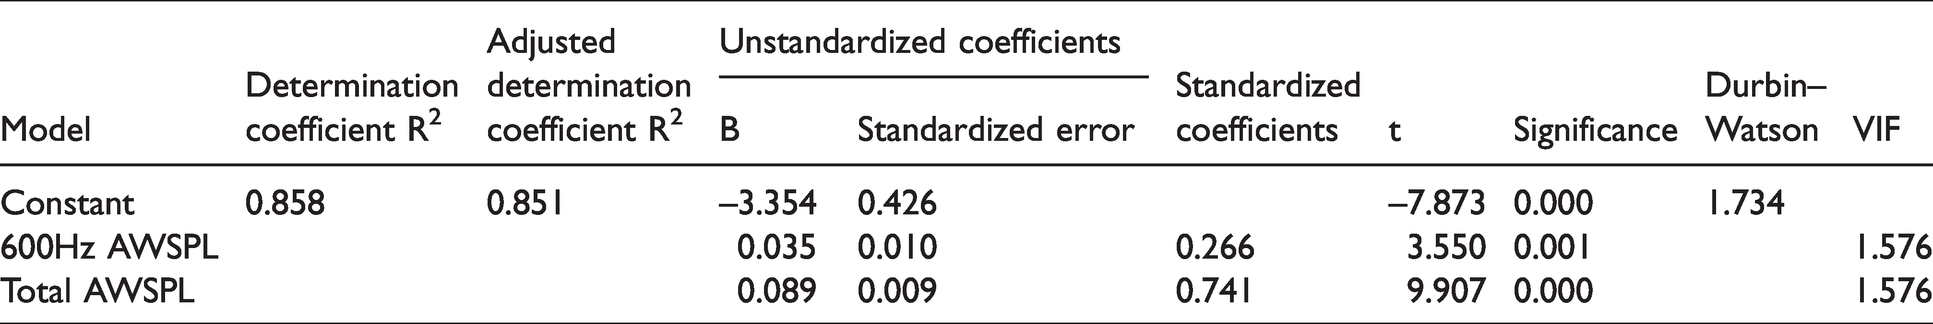
The regression model coefficients and the corresponding tests.
The variance analysis results of the regression model.
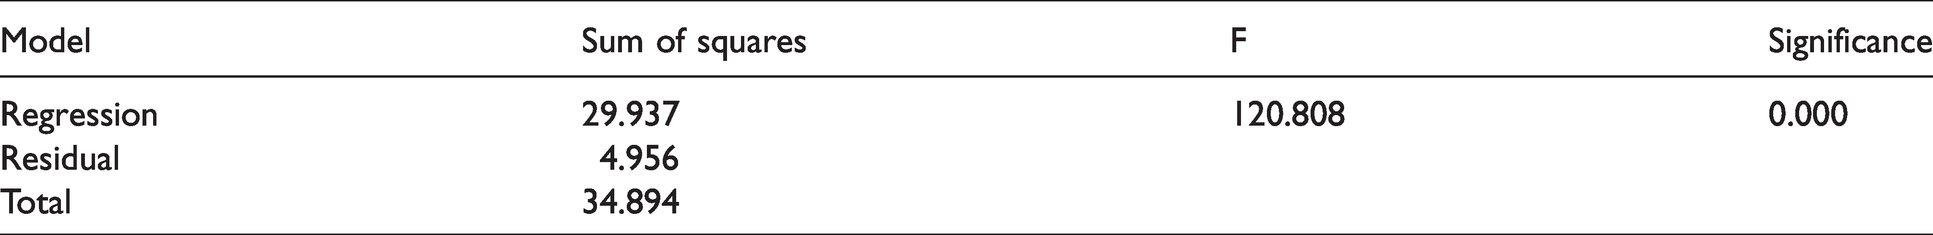
Table 7 shows that the significance levels of the t-test of the equation coefficients are 0.000, 0.001, and 0.000 (also less than 0.05), indicating that the t-test of the regression coefficients is valid. The determination coefficient R2 between the prediction results and the subjective evaluation results reaches 0.858, indicating that the linear relationship between the independent variables and the dependent variable holds. The Durbin–Watson test value of the regression equation is 1.734, indicating that the residuals are independent of each other. In addition, the standardized residual analysis shows that the residuals conform to the normal distribution. The variance inflation factor is 1.576 less than 5, meeting the collinearity diagnosis. Table 8 shows that the significance level of the equation is 0 (less than 0.05), indicating that the F test of the regression equation is valid. Therefore, the established regression equation can correctly reflect the annoyance of substation noise.
To verify the accuracy of the annoyance evaluation model corresponding to equation (5), eight additional noise samples that do not participate in the modeling are selected to perform the objective metrics calculation and the annoyance subjective evaluation. Further, the annoyance is predicted using this model. The subjective evaluation result, the predicted result, and their relative error are plotted in Figure 6. The relative error is defined as the ratio of the absolute value of the difference between the measured result and the predicted result to the measured result. It can be seen from Figure 6 that the established regression model correctly predicts the eight verification samples and obtains relatively ideal results. The maximum relative error between the predicted value and the corresponding subjective evaluation value is better than 9%, indicating that the model can be used as a reference for evaluating noise annoyance of the similar urban substations.
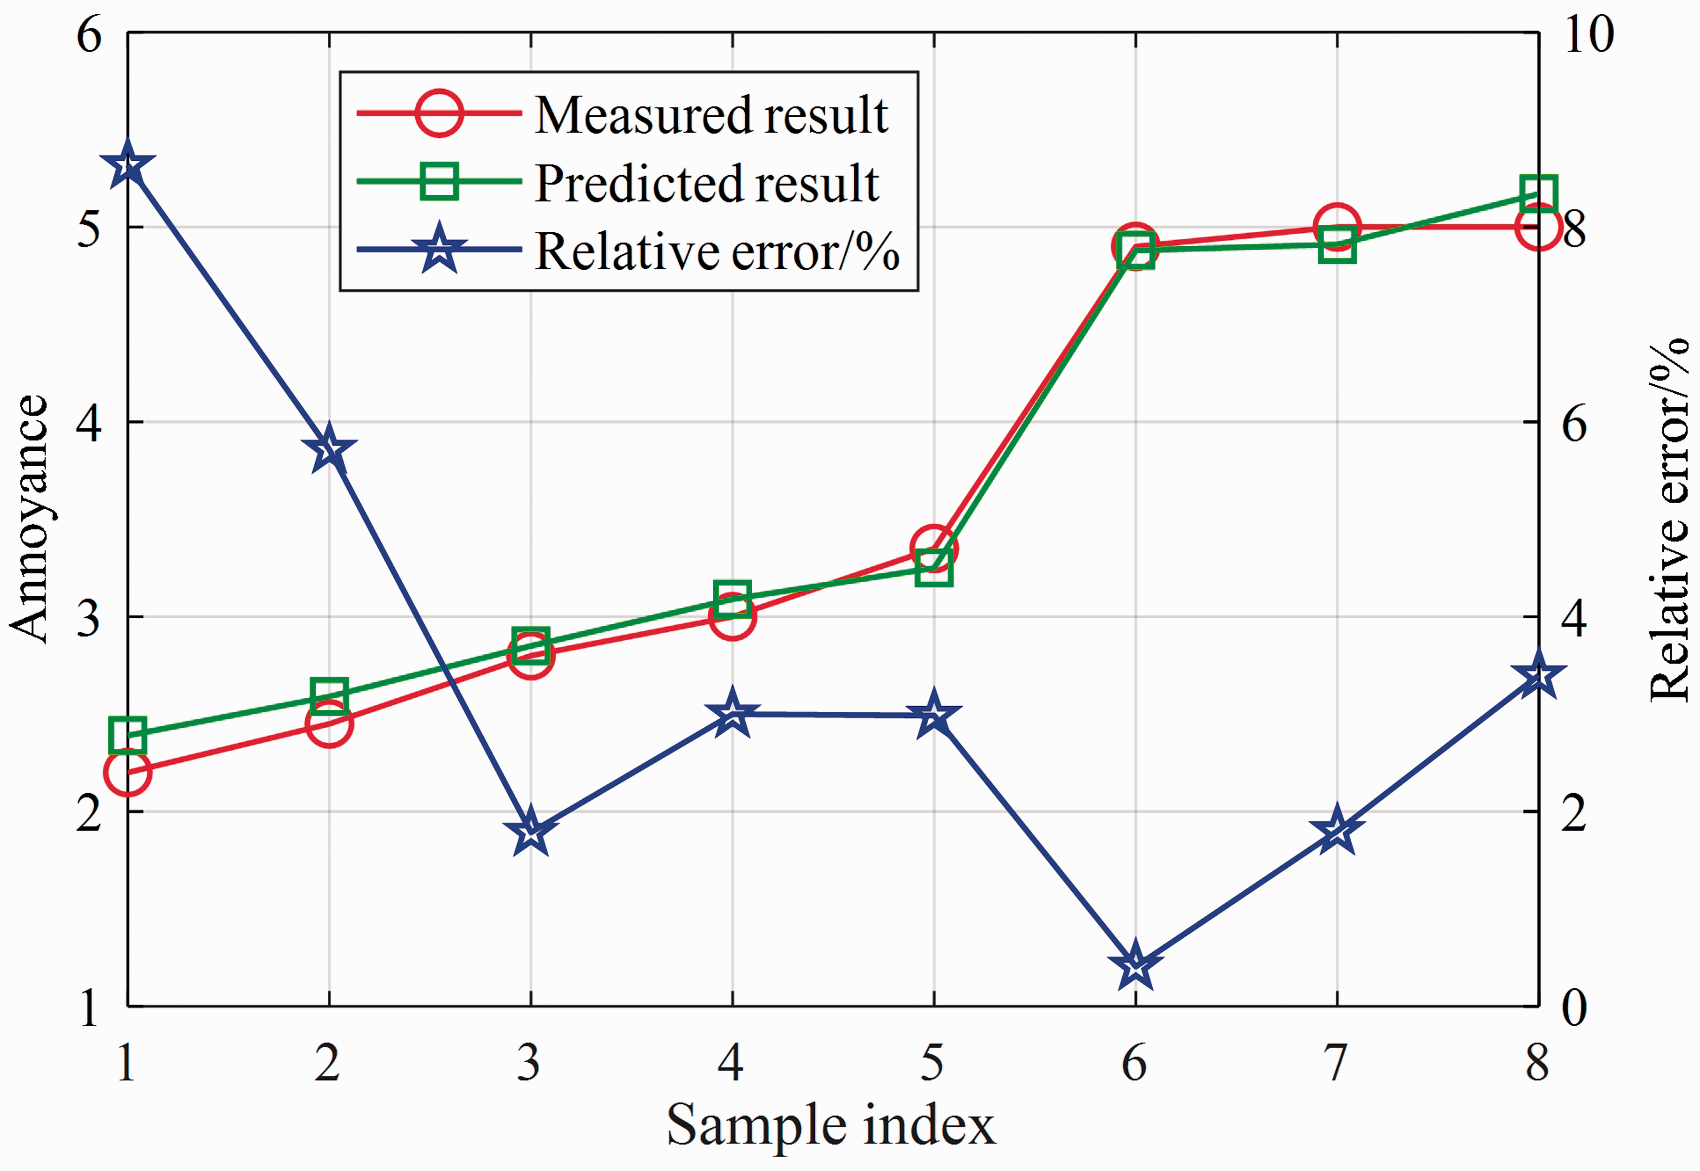
Annoyance evaluation value and relative error.
Conclusion
In this paper, the sound quality assessment method is used to scientifically and reasonably investigate the annoyance of the noise emitted by an urban substation in China. First, the subjective evaluation is carried out based on the five-level semantic differential method. Second, according to the steady-state and low-frequency harmonic characteristics of the noise, the 14 acoustical metrics are selected for objective evaluation. Third, the correlation between the subjective and objective evaluation results is analyzed. Finally, a regression model is established to predict the subjective annoyance. In addition, the principal component analysis is used for dimensionality reduction of objective metrics. The following conclusions are drawn for such urban substation noise: (1) the AWSPLs of 200, 400, 500, 600, 900 Hz, and total AWSPL are the main metrics affecting annoyance; (2) the 600 Hz AWSPL and total AWSPL are the key objective metrics that constitutes the regression model of annoyance; (3) the regression model can correctly reflect the subjective noise annoyance. This research provides a useful reference for developing noise control measures of the urban substations and evaluating the noise annoyance of similar urban substations in China.
Footnotes
Declaration of conflicting interests
The author(s) declared no potential conflicts of interest with respect to the research, authorship, and/or publication of this article.
Funding
The author(s) disclosed receipt of the following financial support for the research, authorship, and/or publication of this article: This work is supported by the Science and Technology Project of China Southern Power Grid (GDKJXM20180152).