
Abstract
This study established the transfer laws of vibration waves in a linear system under simple harmonic loading. Then, a method based on multipoint delivery in the frequency domain was proposed to predict the vibrations of historical timber buildings induced by traffic loads, in which the transfer function between two delivery points of different single frequencies is obtained. Finally, the vibration responses of the Feiyun pavilion induced by traffic loads were predicted and compared with experimental field test results. The results indicate that the predicted vibration responses and experimental field tests at the measurement point in the Feiyun pavilion correspond well in the concerned frequency bands and that the proposed prediction method can be used to predict the structural vibration responses under the influence of complex traffic loads.
Introduction
Timber structures were widely used in ancient China, and wooden structures played a vital role in the structural construction history of China. Ancient architecture is an important aspect of Chinese culture. Wooden structures are common in the history of Chinese architecture, embodying the core meaning of ancient Chinese architecture. However, due to the rapid increase in the attenuation of the structural performance of historical timber buildings with increases in people loads and surrounding traffic loads, it is important to provide an effective prediction method, by which structural vibrations can be rapidly and precisely predicted. Based on the prediction results, maintenance and protection research on wooden buildings should be conducted in advance. The goals of this study are to provide a method for predicting the vibrations induced in historical timber buildings by traffic loads and to provide scientific and technical support for corresponding research.
The model for predicting the structural vibrations can be divided into three parts: the simulation of the vibrations sources, the transfer function in the free field, and the vibration of the target structure. Many studies have presented methods for predicting the structural vibrations based on these three parts.1–4 Because the coupling vibrations of train–bridge/train–track system are complex, many researchers have focused on the simulation of the vibrations sources and have studied their frequency characteristics. Xu et al. 5 established a mixed 2D and 3D model to simulate the dynamic track–tunnel–soil interaction in an underground railway. Zhou et al. 6 investigated the dominant frequency-dependent attenuation mechanism of blast-induced vibration. Santos et al.7,8 presented a comprehensive experimental campaign developed on a segment of the Portuguese railway network, and proposed a 3D numerical model to predict track-ground vibrations induced by railway traffic and validated it by field experiment. Several researchers have studied soil dynamics based on the study of the vibrations sources and have proposed various free field vibration prediction methods. Barbosa and Kausel 9 and Barbosa et al. 10 presented a generalization of the thin-layer method to three dimensions and formulated the boundary element (BE) method in the wavenumber–frequency domain based on the thin layer method. Hazirbaba and and Tezcan 11 described a nonparametric approach for modeling and predicting nonstationary ground motions. Kouroussis et al.12–15 established a finite element (FE) model to recreate the complex ground topology, and developed a prediction model involving a compound vehicle/track/soil system to predict the free-field vibrations induced by running trains. Nielsen et al. 16 developed a hybrid model for predicting ground-borne vibrations due to discrete wheel and rail irregularities. Kuo et al. 17 used a combination of field measurements and a numerical method to predict railway-induced ground vibrations. Galvı et al. 18 proposed a novel 2.5D methodology in which the FE method was combined with a BE method for the prediction of railway induced vibrations. Ruiz et al. 19 formulated a FE method in the time domain with an implicit scheme of integration.
The purpose of the prediction model is to estimate the vibrations of the target structure, 20 and the vibrations of the building as well as the interaction between the soil and structure were studied. François et al. 21 discussed the coupling of the FE and BE methods to obtain solutions for transient dynamic soil–structure interaction problems in the time domain. Hesami et al. 22 studied the vibration of a building near a train line using a numerical model. Prediction models were established based on the three parts, and 2D and 3D FE models are the main prediction model types.23–27 The 2.5D coupled FE–BE model has also been widely used and reduces the computation scale dramatically. Regarding the estimation of the vibrations of the target structure, measures were taken to reduce the target structural vibrations and noise28,29 induced by traffic loads. Ulgen et al. 30 studied the foundation design and vibration isolation of a high-precision instrument subjected to ground-borne vibrations. Thompson et al. 31 discussed reducing railway-induced ground-borne vibration by using open trenches and soft-filled barriers.
Several of the aforementioned prediction methods were verified with field tests; however, detailed soil parameters were needed, and a powerful computer was required, along with extensive calculating time. Therefore, many studies focused on the transfer functions to characterize ground vibration and regarding the effects of ground vibrations induced by urban conditions. Kouroussis et al. 32 presented a hybrid experimental–numerical approach that can predict ground-borne vibration levels in the presence of a variety of railroad artifacts such as transition zones, switches, crossings, and rail joints on existing networks. Mouzakis and Vogiatzis 33 studied the transmission of ground-borne vibrations from subway rail transit systems in a building including the soil–foundation interaction, the reduction in vibration level between floors, and the amplification of vibrations due to building resonances. Verbraken et al. 34 proposed an empirical prediction method for railway-induced vibrations, and validated it using numerical simulations. Considering the disadvantage of the previously mentioned prediction methods, this study proposed a new prediction method. Extensive computational resources, detailed soil parameters, and the precise FE model of the target structure are not required; only the transfer function from the point nearest to the vibration sources to the predicted point is needed, which can be obtained by field tests. In addition, field tests may cause artificial damage to the structure if they are performed too often, particularly for ancient buildings. An effective prediction method could largely reduce the potential harm to ancient buildings.
In this paper, a prediction method based on multipoint delivery in the frequency domain is proposed to predict the vibrations of historical timber buildings induced by traffic loads without detailed soil parameters or an FE model of the target structure. In this method, the transfer path from the point near the vibration sources to the prediction point is divided into several parts, with the goal of decreasing the interference of the environmental vibrations. The vibrations of key points in the structure can be obtained by combining data on the vibrations of the points near the vibrations sources with the transfer functions between different points on the transfer path. A field experiment is performed at the Feiyun pavilion to verify the accuracy of the prediction method; the transfer functions between different points are obtained, and the vibration of the target structure induced by a free-falling stone is obtained and compared with the test results. Finally, a prediction method of the vibrations of historical timber buildings induced by traffic loads based on the multipoint transfer function in the frequency domain is proposed and verified.
Prediction method
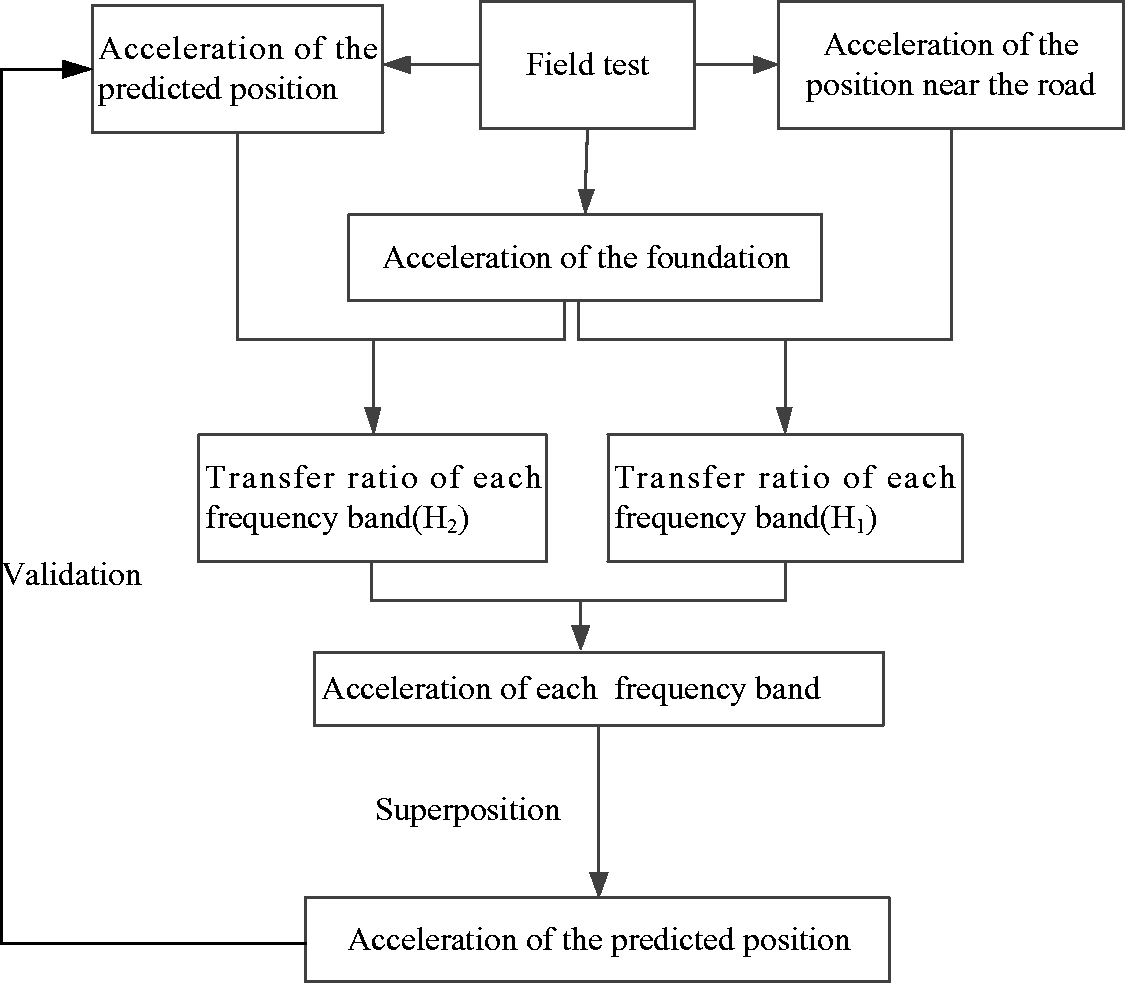
The prediction method in this paper can be divided into several parts, as follows: (1) the vibrations induced by the same vehicle are measured at position A near the road, at position B at the structural foundation and position C in the structure, as shown in Figure 1; (2) the transfer ratio H1 of each frequency band between point A near the vibrations sources and point B at the foundation of the structure is obtained; (3) the transfer ratio H2 of each frequency band between point B at the foundation of the structure and the prediction point C in the structure is obtained; and (4) the vibration of the prediction position C in the structure is calculated, as shown in Figure 2.
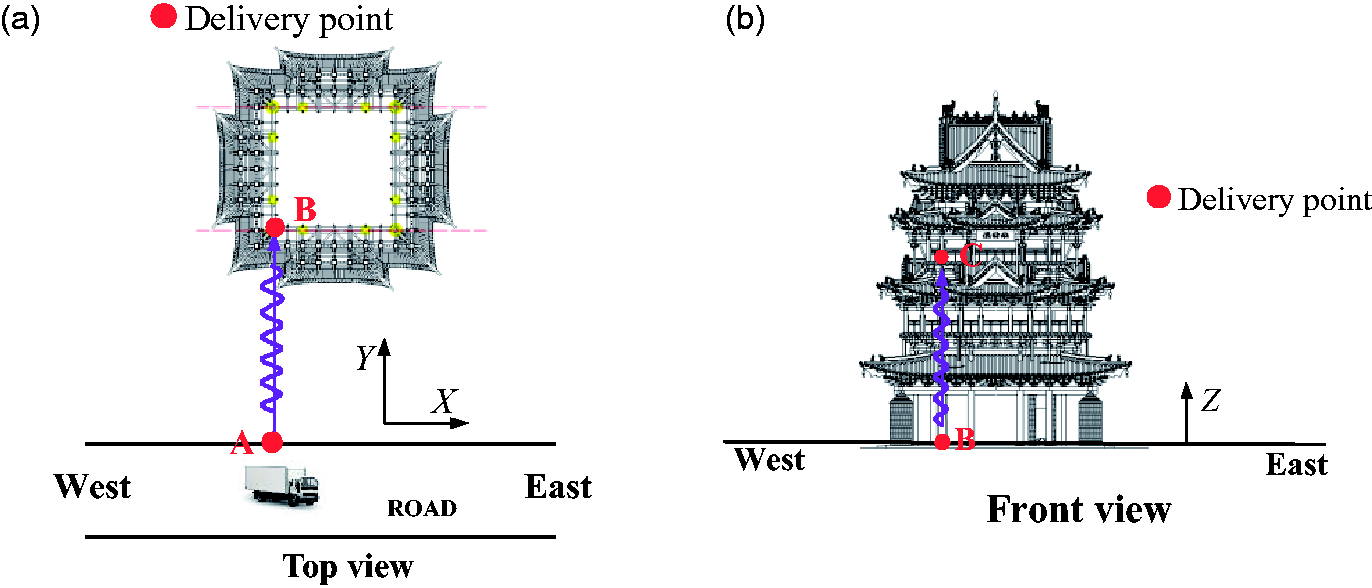
Layout of the measurement points. (a) Top view. (b) Front view.
Schematic of the prediction model.
Transfer function in the frequency domain
Based on the theory introduced in the dynamics of the structures,
35
for a series of delivery points on the transferring path, as shown in Figure 3, there is a harmonic load Fsinωt acting on the load point, and the transfer ratio between delivery point P
n
and point P
n
−1 is defined as the amplitude ratio between delivery point P
n
and point P
n
−1, which is expressed as H
n
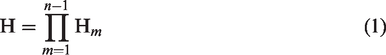
−1; then, the transfer ratio H between P1 (the point near the road) and Pn (the predicted point) can be expressed as
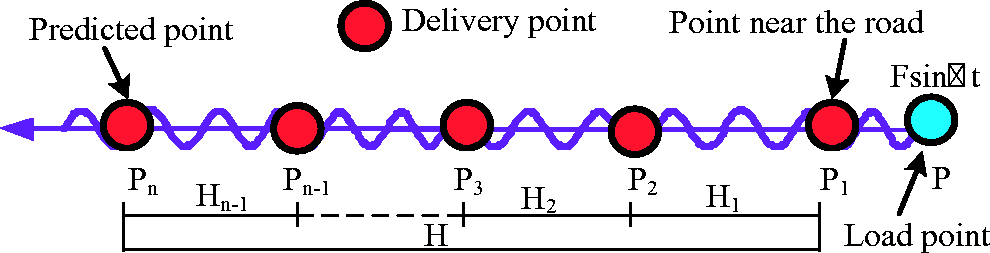
Delivery of the vibration signal.
Division and superposition of the vibration signal
According to classical structural dynamics, the vibration signal at any time can be written as the superposition a series of frequency bands
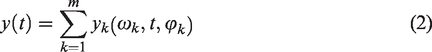
When the vibrations of the point near the vibrations sources were obtained, the vibration of the prediction point can be calculated as follows:
Process the vibration signals of the delivery point on the transfer path: x1(t) at point P1, x2(t) at point P2,…, and xn(t) at point Pn that are induced by the same vehicle using the one-third octave processing, and the time history Y(ωm,t)of each frequency band ωm can be obtained. Calculate the transfer function Ht(ω) between two adjacent points on the transfer path shown in Figure 3
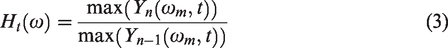
where n is the number of delivery points on the transfer path.
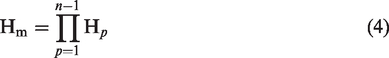
The transfer ratio H
m
of each frequency band between P1 (the point near the road) and P
n
(the predicted point) can be expressed as follows
3. With another vibration signal y1(t) at point P1, the time history y1(t) of each frequency band ωm of y1(t) is y1(ω
m
,t), and the acceleration history yn(t) at point P
n
can be calculated as follows
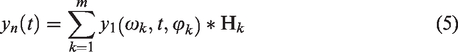
where m is the number of frequency bands in the one-third octave spectrum.
Introduction of the test
The Feiyun pavilion is located in Dongyue Temple, which is in the city of Wanrong in Shanxi province, as shown in Figure 4. The Feiyun pavilion is a historical timber building and is considered “China’s first wooden building.” The connection method between the beam and column is the Tenon-and-Mortise system. The structural style of the Feiyun pavilion is the Yuan-Ming building style, and it has a height of 23.19 m. When viewing the pavilion from the outside, there appear to be only three floors, even though there are actually five floors inside the pavilion. There are four tall columns between the foundation and the roof of the structure around the center of the building; the column height is 15.45 m, and these columns support the majority of the building. There are also 32 smaller wooden columns, which make up a Chinese checkerboard. The volume of the Feiyun pavilion is small, but there are 4 eaves, 12 triangular side roofs, and 345 groups of brackets; these various aspects of construction create a unique and beautiful structure.

Photograph of the Feiyun pavilion.
The side and top views of the Feiyun pavilion are shown in Figures 5 and 6, respectively.
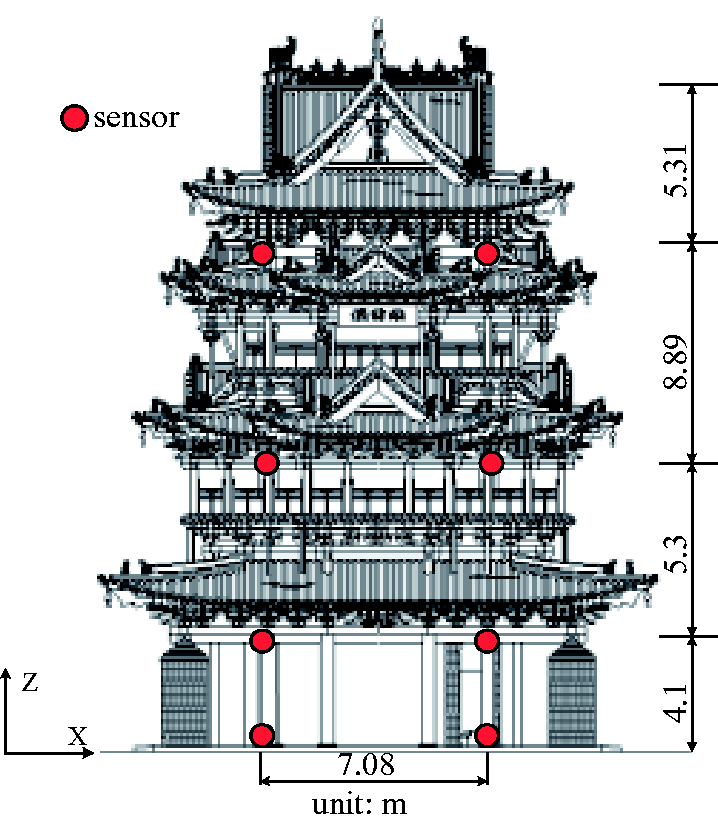
Side view of the Feiyun pavilion.
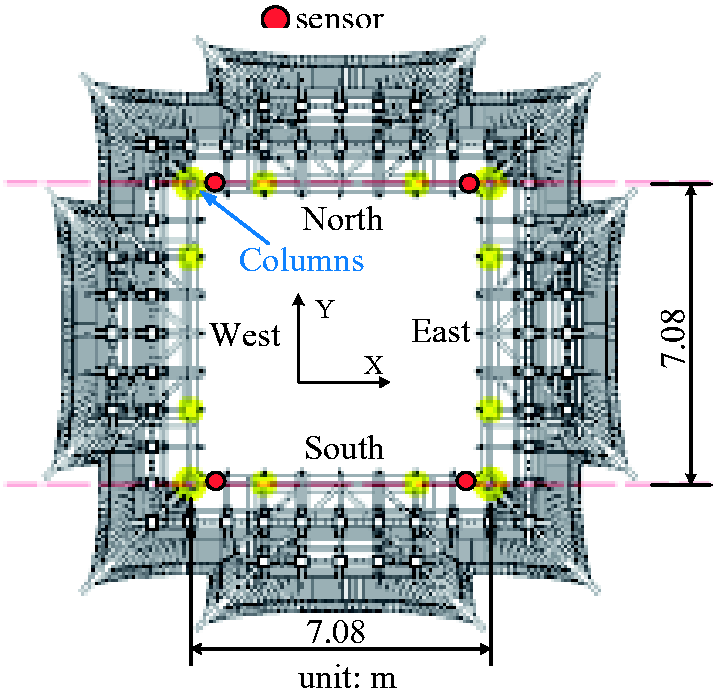
Top view of the Feiyun pavilion.
Test of the Feiyun pavilion
The structural vibrations analysis can be divided into three parts: the two horizontal vibrations, the vertical vibrations, and the torsion of the structure. The structural horizontal vibrations are referred to as the general vibration of the structure in the horizontal direction to distinguish them from the torsional vibration. The sensors are typically placed in the rigid center of the building to measure the structural horizontal vibrations; this arrangement allows the sensor to receive horizontal vibration signals without interference from the torsional vibration signals such that it is easy to identify the horizontal vibration signals when analyzing the vibration signal data. The sensors typically cannot be placed at the rigid center of the building due to the limitations of the field test conditions; instead, the sensors should be placed as close to the rigid center of the building as possible. Additionally, it is important to consider the transfer path of the vibration signals (vibration source → free field → building foundation → prediction point of the building). There is no partial deformation in the corner of the building; thus, the sensors are arranged in the corner of the building, where it is easier to monitor the total movement of the building.
Based on the above analysis, the measurement points on the first floor were arranged on the field near the pillars, and the measurement points on the second and fourth floors were arranged on the beam or Fang, which is combined with the four major columns. Here, the height of the measurement points is defined as a floor of the building. The specific arrangement of the measurement points is shown in Figure 7.
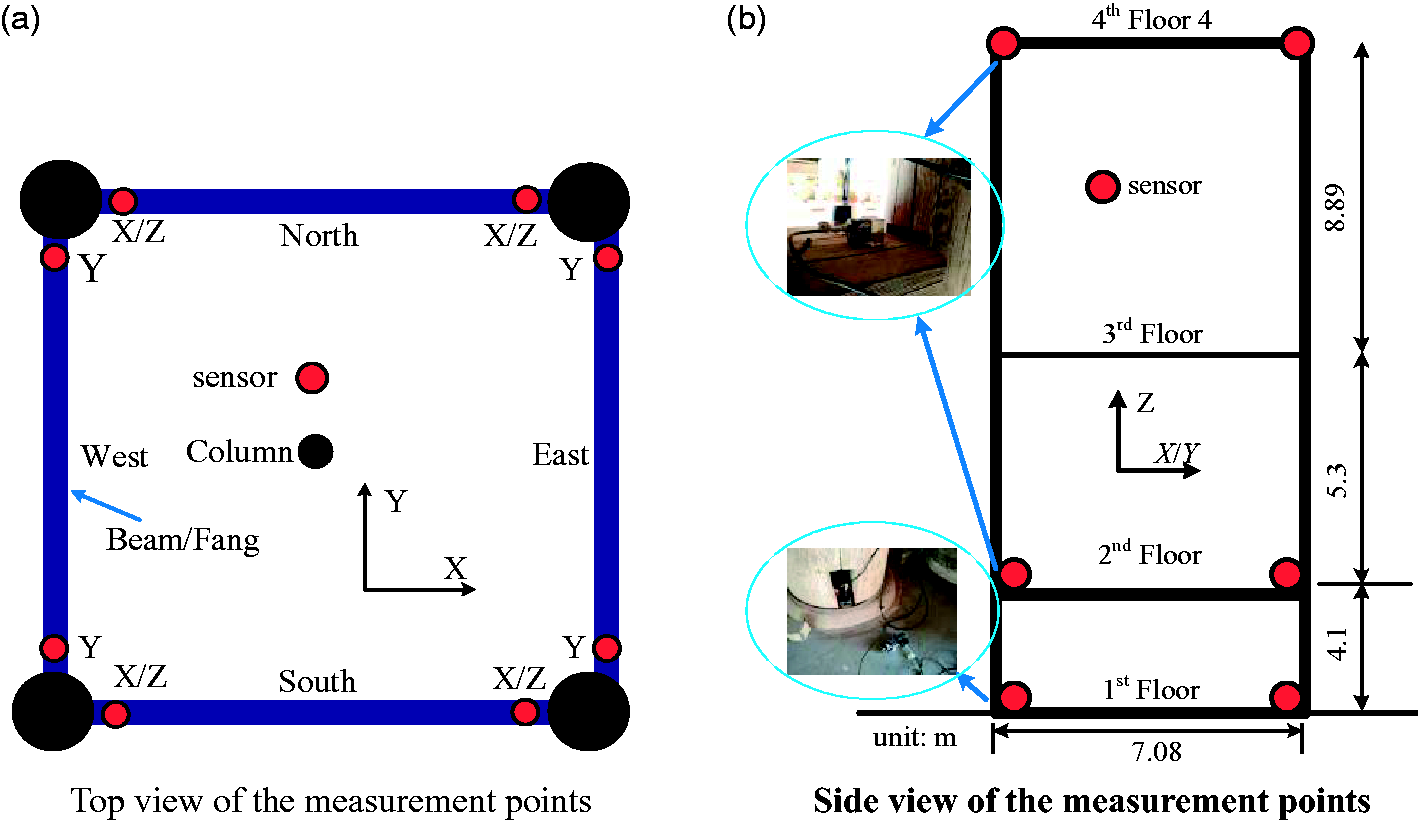
Layout of the measurement points. (a) Top view of the measurement points. (b) Side view of the measurement points.
According to the vibration characteristics of the building, the structural vibration signals induced by the traffic loads are mainly composed of low-frequency signals; thus, 941B sensors (Institute of Engineering Mechanics, CEA, Harbin, China) were used to measure the ground and the structure vibrations due to the micro tremors and general structural vibration, and the accelerometer sensitivity meets the required test precision. The test period was divided into three parts according to the traffic flow on the road in front of the Feiyun pavilion during a single day: 6:30–9:30, 17:00–20:00, and 23:00–1:00 so that the rush hours are included. The sampling frequency of the test was 512 Hz, and the sampling time of each group was 1,200 s.
Vibration in the time domain
According to the relevant specification, 36 an estimation of the vibrations of a historical timber building depends on the structural vibrations in the horizontal direction. A typical group of the measured acceleration histories in the horizontal direction on the fourth floor is shown in Figure 8.
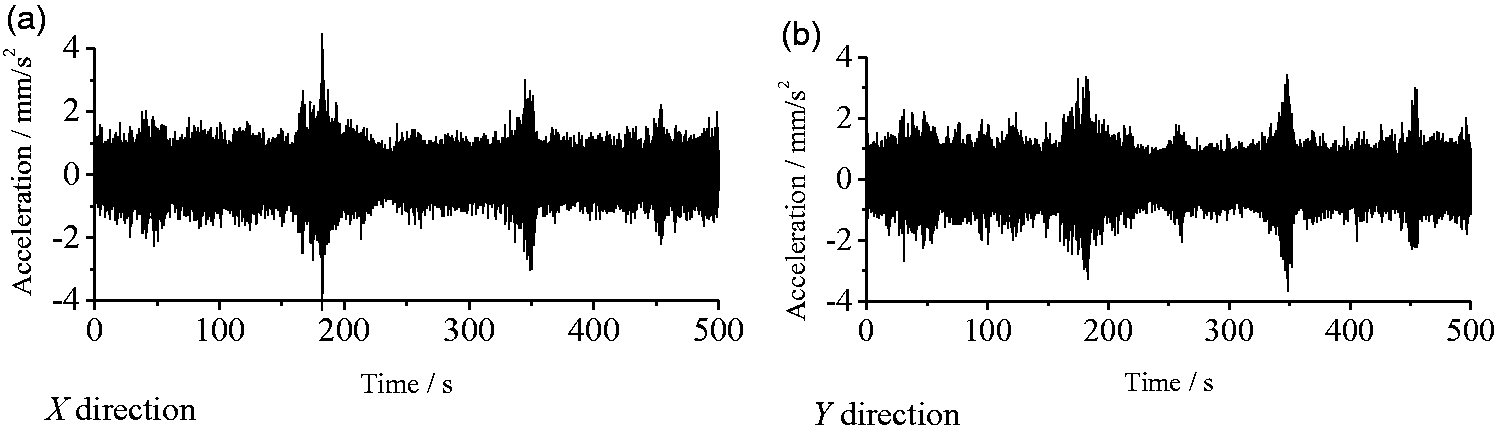
Acceleration histories of the fourth floor. (a) X direction. (b) Y direction.
A total of 41 groups of effective data were obtained, including the acceleration and velocity, and these test data were used for the statistical analysis. According to the relevant specification, 36 the horizontal velocity of the highest floor is deemed as the standard to evaluate the vibrations of the structure; thus, the horizontal velocity of the top floor in the time domain is evaluated. The following method was used to process the velocity in the time domain: (1) the peak velocity within 1 s was obtained, and a total of 13,200 values of 11 groups of velocity data were obtained; (2) the highest 5% of the peak velocity was deemed as invalid and excluded to eliminate the interference of the ambient vibration, and the maximum value of the residual data was deemed as the representative velocity value; and (3) the maximum velocity of each measurement point of the top floor was obtained, as shown in Table 1.
Maximum velocity of the top floor.
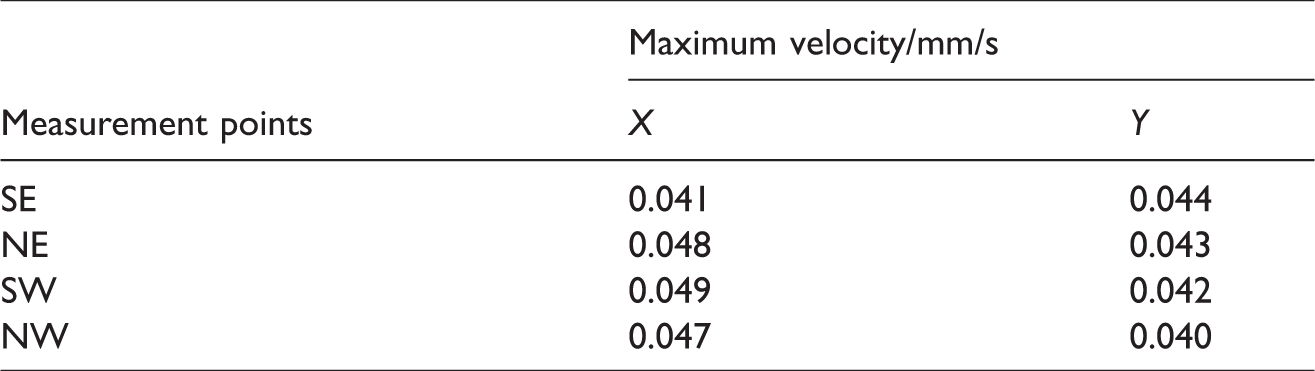
Table 1 illustrates that the velocity in the X-direction is greater than that in the Y-direction on the same floor. The maximum velocities in the X- and Y-directions, were 0.049 and 0.044 mm/s, respectively, which are below the limit of 0.18 mm/s.
Vibration in the frequency domain
The accelerations (shown in Figure 8) from 215 s to 245 s induced by a running vehicle were analyzed using spectrum analysis, and the dominant frequency bands are shown in Figure 9.
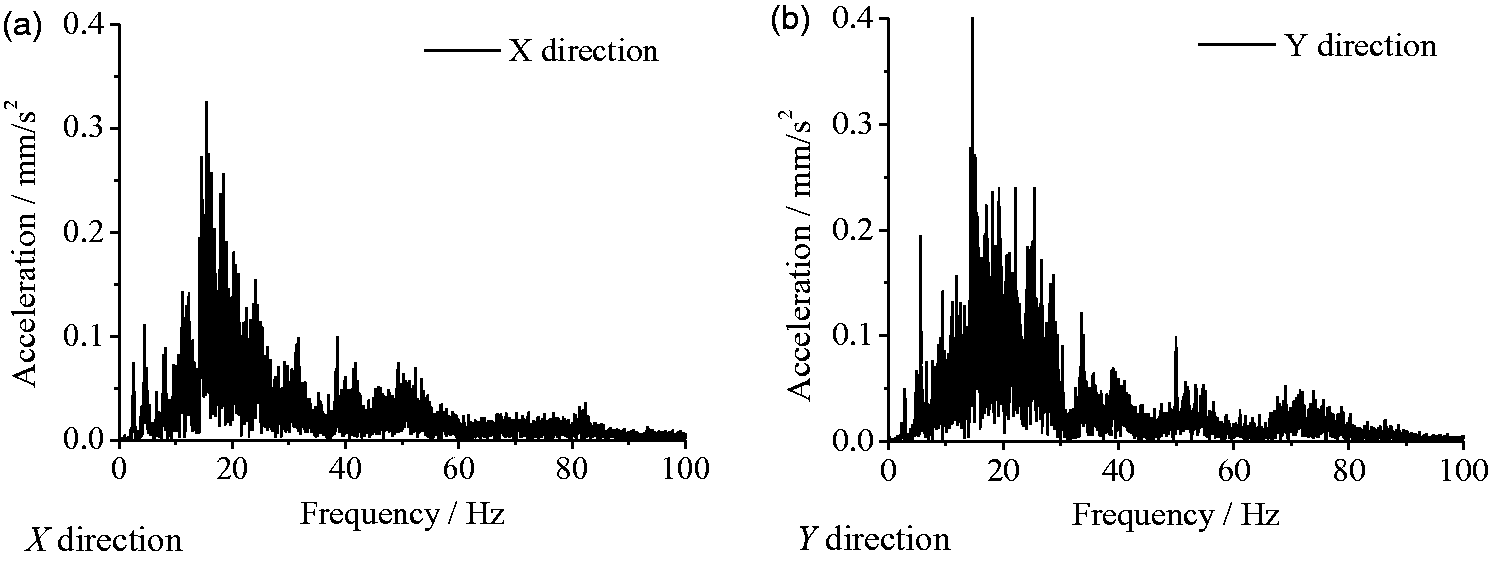
Spectra of the vibration signals of the second floor. (a) X direction. (b) Y direction.
The dominant frequency band of the structural vibrations induced by the typical running vehicle was 5–30 Hz, and the dominant frequency bands in the horizontal directions were the same at a given measurement point.
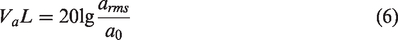
The acceleration vibration level is typically used to estimate the scale of the vibration, and the acceleration vibration level can be obtained by the following equation
The acceleration vibration level in each frequency band in the one-third octave spectrum on each floor can be calculated by an equation combined with the one-third octave processing, as shown in Figure 10.
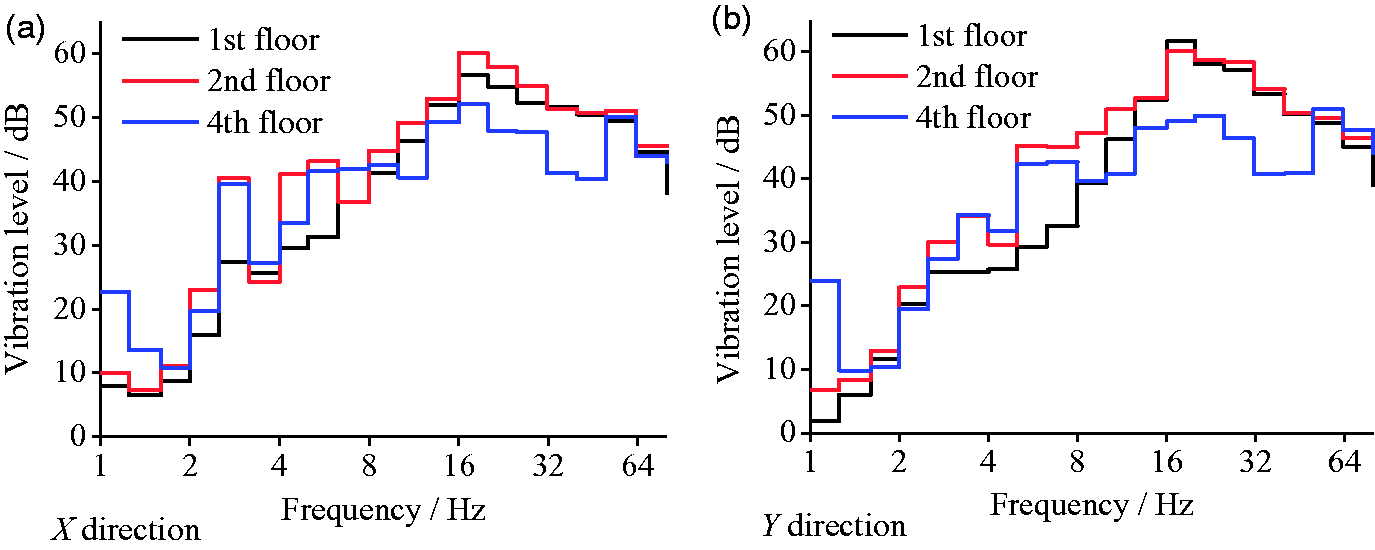
One-third octave spectra of the acceleration vibration level. (a) X direction. (b) Y direction.
Figure 10 illustrates that the maximum vibration level corresponding to the central frequencies in the X-direction was 60 dB on the second floor, and the corresponding frequency was 16 Hz; the maximum vibration level corresponding to the central frequencies in the Y-direction was 62 dB on the first floor, and the corresponding frequency was 16 Hz.
Prediction of the vibration responses and its validation
Transfer function based on a field test
According to the method proposed in Prediction method section, the key step is to obtain the transfer ratio of each frequency between the point near the vibration source and the prediction point in the building, and the goal of multipoint delivery is to minimize the interference of the environmental vibrations and improve the prediction accuracy of the prediction method.
For the track–ground–building system, the amplitude of the ground vibrations induced by the running trains is small, so it can be assumed that the track–ground–building system is a linearly elastic system, and this theory was based on the analysis of the multiple-degree-of-freedom (MDOF) theory in vibration analysis for a linear elasticity system, and the model can be adopted for the track–ground–building system.
A free-falling stone experiment was done to obtain the transfer ratio of each frequency band, and the arrangement of the measurement points is shown in Figure 11.
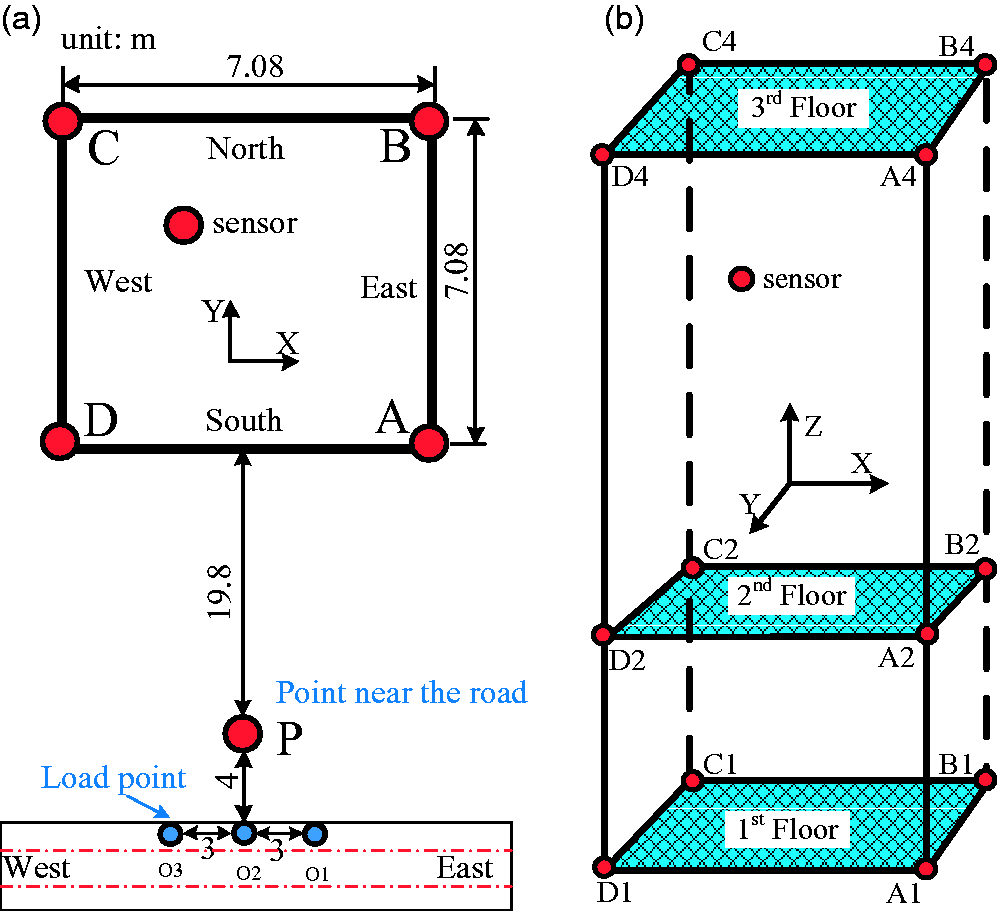
Layout of the measurement points.
The acceleration at each measurement point was collected at the instant the stone contacted the ground at the load point. Because the signal-to-noise ratio was larger in the Z-direction, the acceleration in the Z-direction induced by the free falling stone on load point O1 was analyzed to obtain the transfer ratio. The acceleration of point P induced by the free-falling stone is shown in Figure 12.
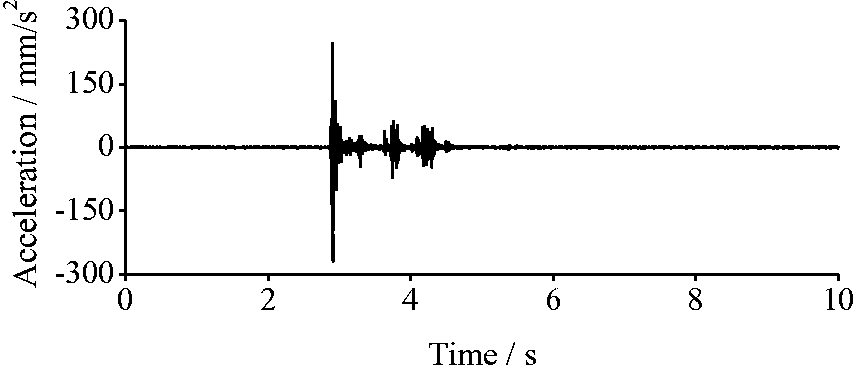
Acceleration time history of point P in the Z-direction.
The vibration signals in the dominant frequency band are the main components of the vibration signals; therefore, this study focuses on the vibration signals in the dominant frequency band. An acceleration frequency spectrum analysis must be performed to obtain the domain frequency band of the acceleration induced by the free-falling stone, and the frequency spectrum of the acceleration of point P is shown in Figure 13.
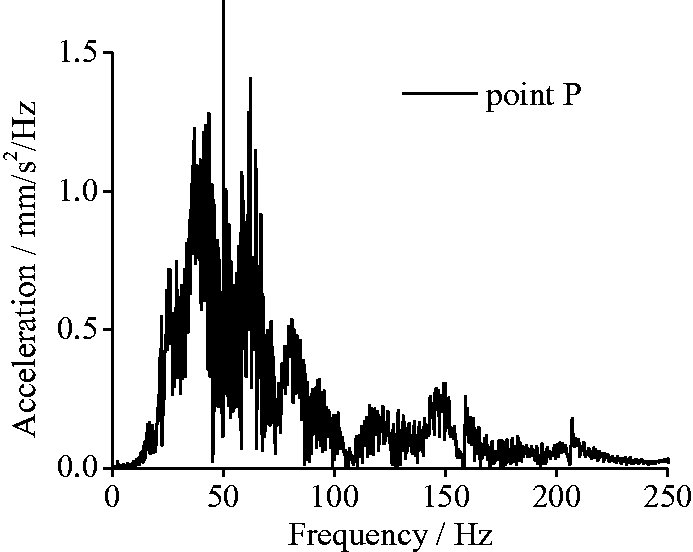
Spectra of the acceleration of point P induced by the free-falling stone.
According to Figure 13 and with reference to the parameters of the accelerometer, the dominant frequency band of the acceleration of point P in the Z-direction induced by the free-falling stone is 5–80 Hz.
The accelerations of points P, D1, and D4 on the wave transfer path shown in Figure 11 induced by the free-falling stone in a certain time were processed. Then, the time histories of each frequency band in the one-third octave processing spectrum were obtained, as shown in Figure 14. The transfer ratio is defined as the ratio of the maximum acceleration between two adjacent delivery points for the same frequency band. Due to the limited length of this paper, only the acceleration time history of each delivery point on the transfer path for the frequency band of 28.2–35.5 Hz is shown in Figure 14.
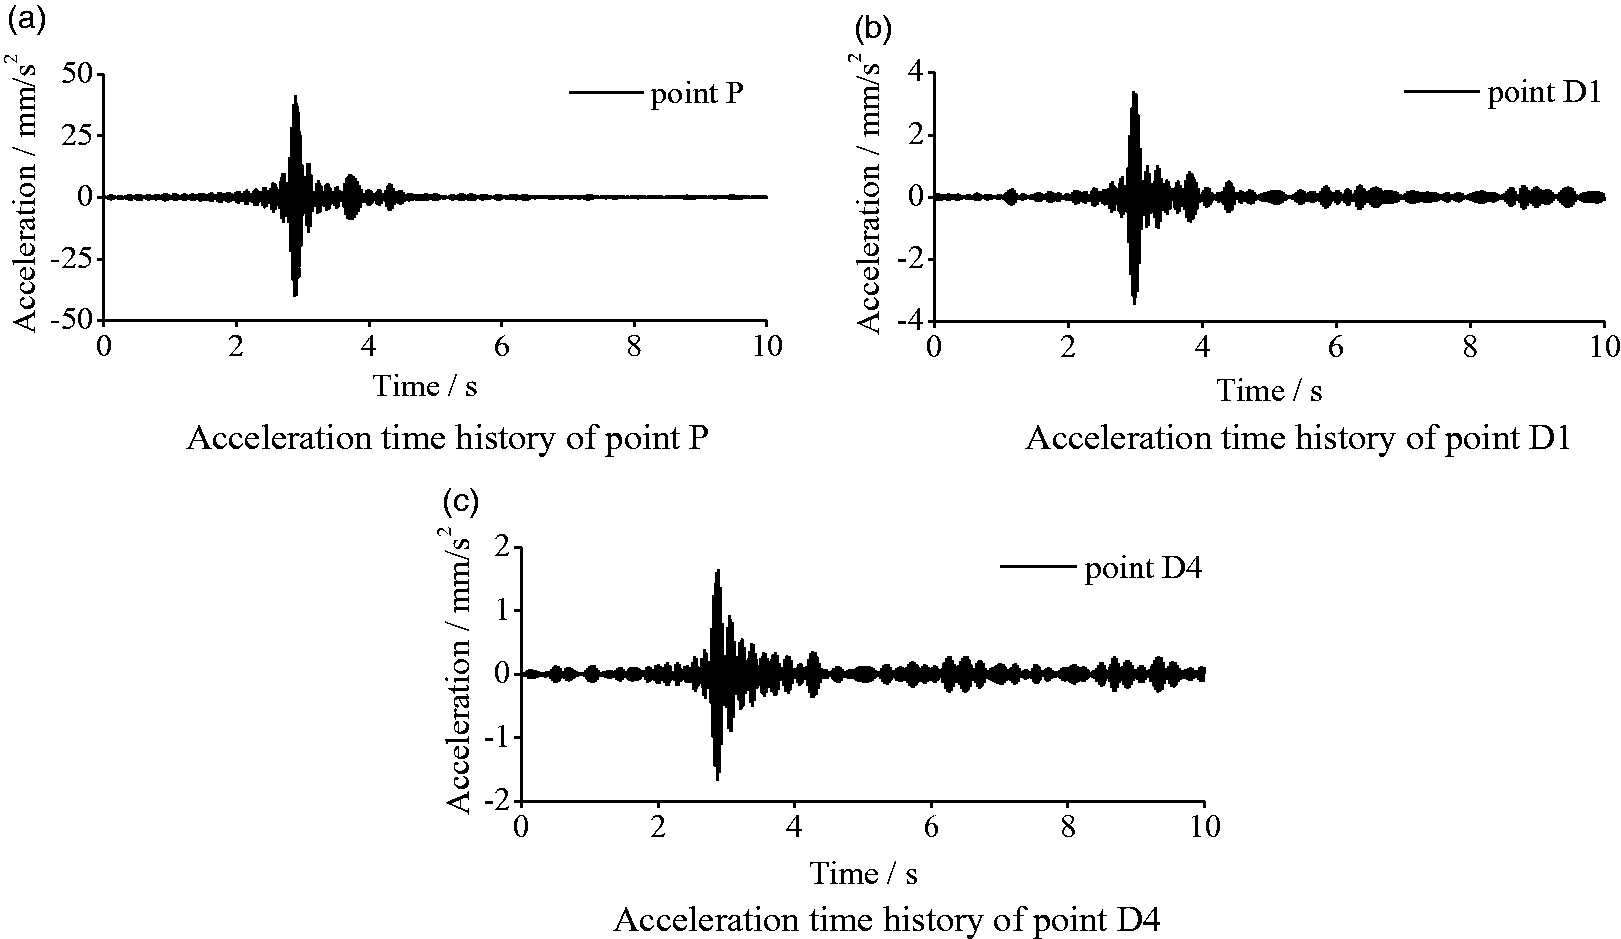
Acceleration time histories of the delivery points at 28.2–35.5 Hz. (a) Acceleration time history of point P. (b) Acceleration time history of point D1. (c) Acceleration time history of point D4.
The acceleration time histories of each frequency band in the dominant frequency band (5–80 Hz) were extracted, and the transfer ratio of each frequency band between the two adjacent delivery points was obtained. Multiple groups of test data were analyzed to minimize the interference of the environmental vibrations. The transfer ratios for each frequency band in the dominant frequency band of 5–80 Hz are shown in Figure 15.
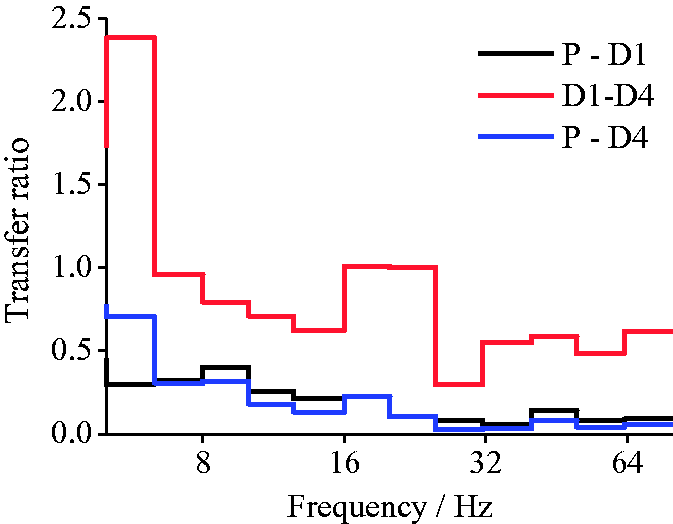
Transfer ratio between different delivery points.
Prediction of the structural responses
To verify the accuracy of the prediction method, the stone was dropped once more on load point O1, the accelerations of points P and D4 were measured, and the vibrations of point D4 were used for the calculations using the prediction method proposed in this paper. The measured and predicted accelerations of point D4 are shown in Figure 16, and one-third octave spectra of the acceleration vibration level at the predicted point are shown in Figure 17.
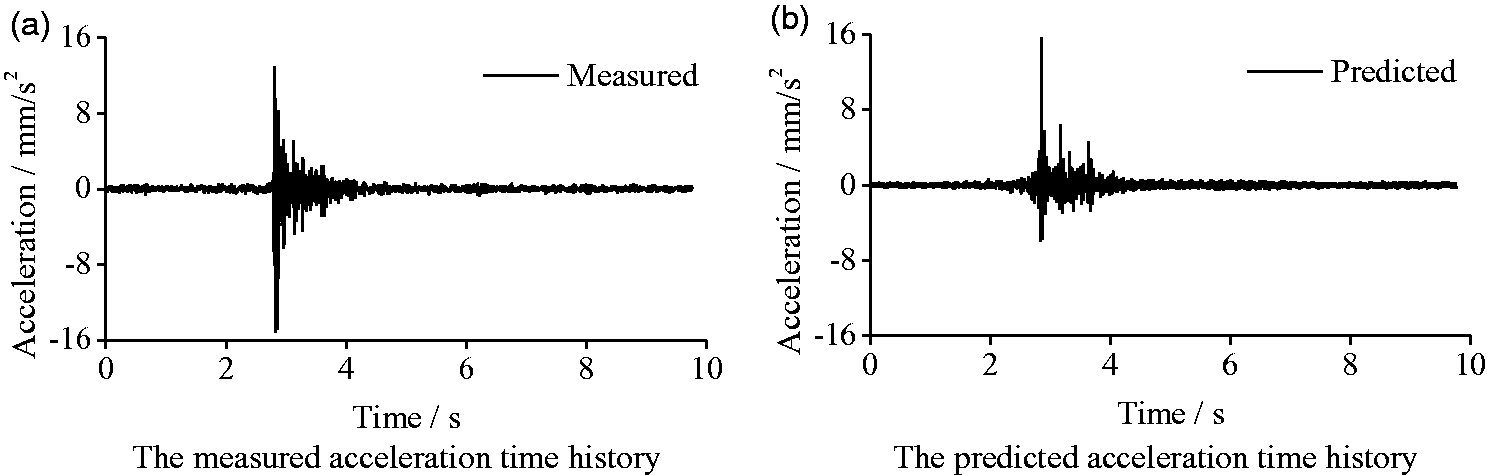
Acceleration time history at the predicted point D4. (a) The measured acceleration time history. (b) The predicted acceleration time history.
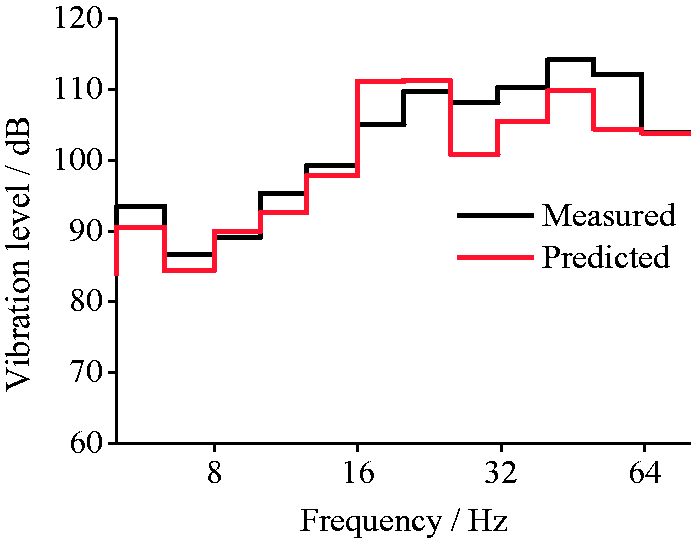
One-third octave spectra of the acceleration vibration level at the predicted point D4.
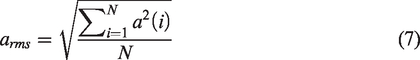
The root–mean–square (RMS) is used as the reference of the vibration energy of each measurement floor, and the vibration energy during a certain time can be reflected by the square of the RMS value. The RMS value of the discrete-time signals can be expressed as
The peak acceleration and RMS value of the acceleration were used as the two quantitative indices to verify the accuracy of the prediction method, and the comparison results are shown in Table 2.
Maximum and root–mean–square (RMS) values of acceleration.
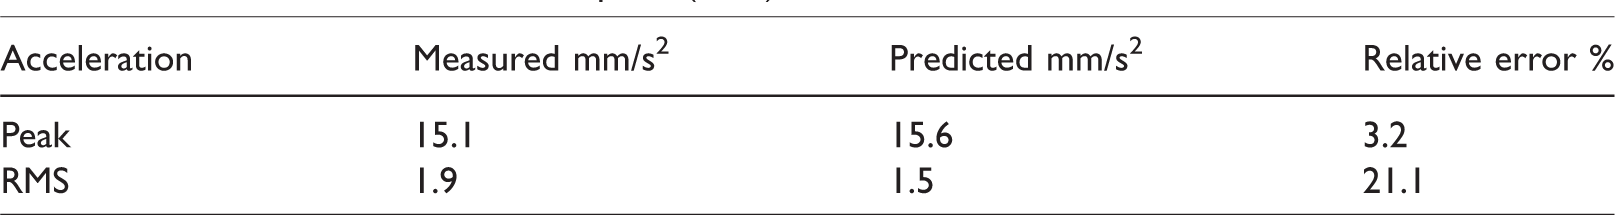
Figures 16 and 17 and Table 2 illustrate that the measured and predicted accelerations are similar based on the shape of the acceleration time–history curve, the comparison of the one-third octave spectra of the acceleration vibration level at the predicted point and quantitative indexes of the acceleration, which demonstrates the validity and accuracy of the proposed method. The RMS the values of measured accelerations were larger than those of the predicted accelerations, and the one-third octave spectrum of the measured acceleration vibration level was larger than that of the predicted accelerations. The difference between the measured and predicted accelerations was mainly induced by the environmental vibrations. The RMS value and the vibration levels indicate the energy of vibration signals, and the energy of the measured accelerations were higher than those of the predicted accelerations.
Conclusion
The aim of this paper is to establish a prediction method of the vibrations of ancient wooden structure induced by traffic loads using the transmission of sub harmonic vibration. Firstly, a field test of the Feiyun pavilion was carried out, then the transfer function between two delivery points of different single frequencies are obtained. Finally, the vibration responses of the Feiyun pavilion induced by traffic loads were predicted and compared with experimental field test results. The conclusions are obtained as follows:
The velocity in the X-direction is greater than that in the Y-direction on the same floor. The maximum vibration level of acceleration in the X-direction occurred on the second floor, and the maximum vibration level in the Y-direction of acceleration occurred on the first floor induced by the typical traffic load. Transfer function of the frequency band in the dominant frequency domain between the vibrations sources and the predicted point can be obtained by multiplying the transfer function between the adjacent delivery points on the transfer path. The vibration response of a certain structure under the influence of traffic load can be effectively predicted by the proposed prediction method in this paper.
Footnotes
Declaration of conflicting interests
The author(s) declared no potential conflicts of interest with respect to the research, authorship, and/or publication of this article.
Funding
The author(s) disclosed receipt of the following financial support for the research, authorship, and/ or publication of this article: This study was supported by the 111 Project (Grant No. B13002), and the Key Project of the National Natural Science Foundation (Grant No. 51338001).