
Abstract
The main goal of this paper is to suppress the effect of unavoidable colored Gaussian noise on declining accuracy of transistor 1/f spectrum estimation. Transistor noises are measured by a nondestructive cross-spectrum measurement method, which is first to amplify the voltage signals through ultra-low noise amplifiers, then input the weak signals into data acquisition card. The data acquisition card collects the voltage signals and outputs the amplified noise for further analysis. According to our studies, the output 1/f noise can be characterized more accurately as non-Gaussian α-stable distribution rather than Gaussian distribution. Therefore, by utilizing the properties of α-stable distribution, we propose a cross-spectrum method effective in noisy environments based on samples normalized cross-correlation function. Simulation results and diodes output noise spectrum estimation results confirm the effectiveness of our method.
Keywords
Introduction
Spectrum estimation of inherent low-frequency 1/f noise has been generally expected to be qualified for indicating the reliability of diverse transistors. Therefore, as an important indicator of reliability, spectrum estimation of transistors’ output noise with its dominant 1/f noise has aroused great attention and a great deal of research has been carried out by Vandamme, 1 Jevtic, 2 and Dai. 3 The principal feature of 1/f noise spectrum is that it increases monotonically with decreasing frequency. The low-frequency noise of transistor is manifested as voltage fluctuation at both ends of the transistor. Traditional method of accelerating electrical aging technique has caused a certain degree of internal damage to transistors and affects the reliability. Therefore, the noise analysis method is proposed to measure the noise of the transistor under regular working conditions. This method possesses advantages of high efficiency and is nondestructive to the test samples, thus it becomes the universal noise measurement method. The measurement technique of noise analysis is to filter the voltage signals through the capacitor in ultra-low noise amplifier to filter the DC voltage, and then the remaining weak AC voltage signal is amplified and input into DAQ. The DAQ collects the voltage signal and outputs the amplified signal to computer for further analysis. Amplifier will introduce background colored Gaussian noise (CGN) into the output signal, which obviously leads to the decline of 1/f noise spectrum estimation accuracy in noisy environments.
Previous studies have assumed that 1/f stochastic process can be described by Gaussian distribution. Gaussian assumption makes it possible to use second-order moments and higher order cumulants as signal processing tools, which greatly facilitates estimating the spectrum of transistor noise. Unfortunately, according to our studies, in the case of zener diode, its output 1/f noise can be characterized more accurately as non-Gauss α-stable process
4
rather than Gaussian process. Thus, Gaussian assumption is proved to be inadequate for spectrum estimation. The diode itself does not have the function of amplification, so it is more difficult to measure and estimate 1/f noise spectrum than other kinds of transistors. In this paper, once we break through the problem of spectrum estimation of zener diode noise, then the spectrum estimation problem of other kinds of transistor noises can be naturally solved. α-stable distribution is one of the classes, which meet the generalized central limit theorem, and Gaussian distribution is its special case (while
Since α-stable process is assumed to be generated by exciting an autoregressive (AR) process7–9 with independent and identically distributed (i.i.d.) symmetric stable noise (
For an α-stable process, due to its absence of fractional moments of order
Although FLOS-based methods can effectively solve the parameter estimation problem of α-stable process, there exists a common problem: such methods can only solve the parameter estimation problem under noise-free environments, thus it cannot be used to solve the parameter estimation problem of α-stable process in colored and/or white Gaussian noise environments pointed out in this paper. This common problem is due to the inherent nonlinear property of FLOS itself, so FLOS-based methods cannot be adopted to solve the parameter estimation problem of α-stable in noisy environments.
To solve the above problem, a samples normalized cross-correlation (SNCC)-based parameter estimation algorithm of AR model in CGN is developed, and based on that, we propose a cross-spectrum method effective in noisy environments based on SNCC function, and comprehensive studies will be carried out on the diodes noise measurement circuit, the definition of SNCC function, the AR model parameter estimation method of diodes output noise, and its performance. The simulation results and diodes output noise spectrum estimation confirm the effectiveness of the proposed method.
The structure of this paper is organized as follows. First, the observed data model is given. Then, the definition of SNCC, its operation properties, and the suppression of CGN is analyzed. Also, an SNCC-based parameter estimation algorithm of AR model in CGN is developed, and spectrum estimation method is given on that basis. Then, experiments are carried out on both simulation data and diodes noise. Finally, some conclusions are drawn in the last section.
Observed data model
The observed data are output diodes signal with additive system noise. Output diodes signal is the measured weak voltage, reflected as the level of the AC voltage at both ends of a diode, including 1/f noise and white noise. Noise measurement technique adopted by us is nondestructive noise analysis method, which is to filter the voltage signals through ultra-low noise amplifier, and then the weak noise is amplified and input into data acquisition card (DAQ). The DAQ collects the voltage signal from sensors and outputs the amplified signal for further analysis. Amplifier will introduce its own background noise into the output signal, which obviously leads to the decline of spectrum estimation accuracy. In order to solve this problem, a method of cross-spectrum measurement technique was proposed by Dai 3 to effectively eliminate the influence of noise produced by the amplifiers on the spectrum estimation accuracy. The specific experimental platform is shown in a later section. The main facilities we adopted are test sample circuit and shielding box, two amplifiers (which lead to a single-channel input and two-channel output linear time invariant system) and a DAQ, as depicted in Figure 1.
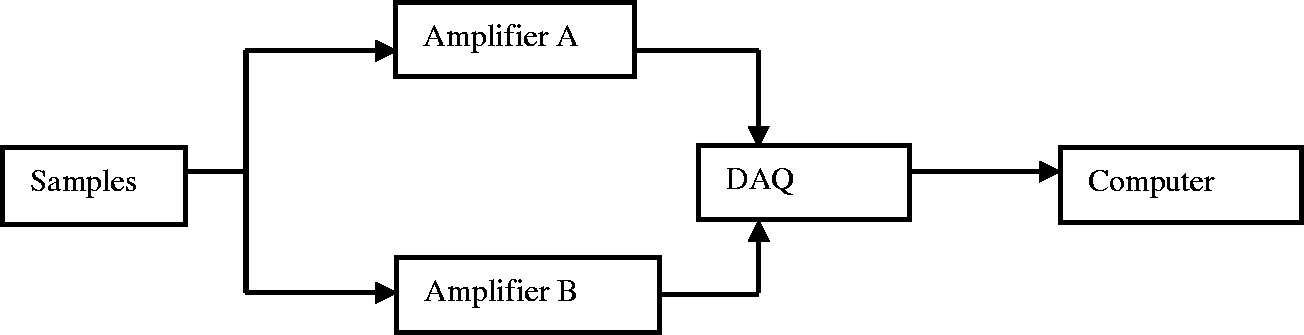
Noise measurement platform.
From Figure 1, we can find that the dual-channel output diodes signals, which pass through different amplifiers, can be expressed by α-stable noise and additive white Gaussian noise (WGN) through the same linear system, and both signals are corrupted by different additive colored Gaussian noise (CGN) introduced respectively by the two amplifiers. The two different CGN of amplifiers are independent, because the amplifiers are powered by independent electric pools in this cross-spectrum measurement technique. This measurement method can improve the accuracy of spectrum estimation by effectively eliminating the influence of zero-mean colored and/or white Gaussian noise on it.
The output 1/f noise can be modeled as α-stable process. Yin and Pethpulu5 and Takayasu 6 have shown that a l/f process can be expressed as a discretized fractional integral of white noise, and follows an α-stable model. According to our studies, in the case of zener diodes, the experimental results show that there holds pulse characteristic in the time domain of the diode 1/f noise. Through the examinations of infinite variance test, the consistency of the model parameter estimation results, the statistical characteristics of 1/f noise signal, and the combination of hypothesis test and actual experiment, 1/f noise signal is verified to satisfy the α-stable distribution. 4
Since α-stable process can be expressed by an AR process driven by
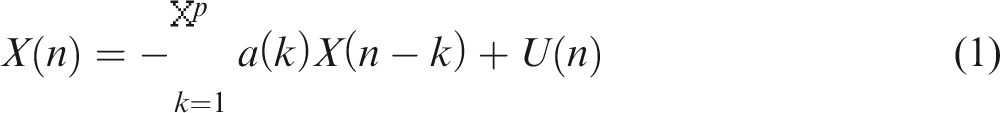

By passing through dual amplifiers, two-channel observed data are yielded. We address the problem of estimating AR coefficients of processes


AR model assumptions are as follows:
[AS1] The order (
[AS2] The system is causal, linear time invariant, exponentially stable, and minimum phase, i.e. the roots of the
[AS3]
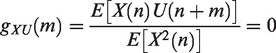
[AS4] The input
[AS5] The 1/f signal
[AS6] The additive noise
[AS7] The noisy output
The dual-channel observed output data
Samples normalized cross-correlation and its operation properties
Definitions of SNSC and SNCC
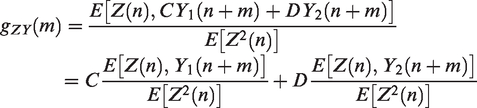
From above, we can conclude that the accuracy of spectrum estimation can be improved by a method utilizing cross-spectrum measurement technique, while the method can achieve such a goal by means of SNCC function.
The definition of SNCC is analog to that of samples normalized self-correlation (SNSC). According to literature,20,24 SNSC
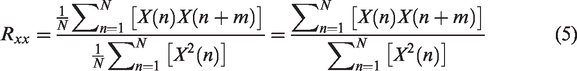
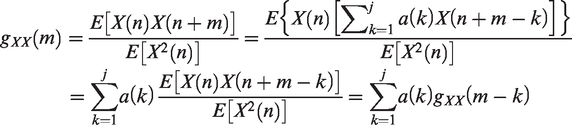
The following identities can be used to establish the existence and boundedness of SNSC
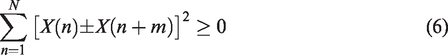
By expanding (6)
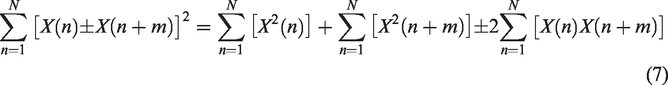
In virtue of
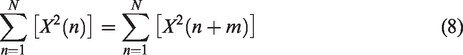
In order to ensure the existence of


Then
Since
Then
Then
So
Properties of SNCC
Following are some of the significant properties of SNCC
If
for arbitrary real constants
Similarly, if 2. If 3. Let
Consistency of parameters estimation for AR model
Theorem 1: The natural estimate
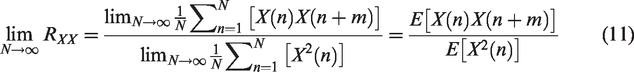
Prove: Since
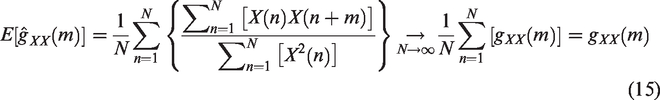
So
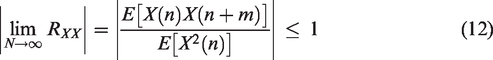
According to equation (12), then
The above suffice to establish the consistency of parameters estimation for AR model.
Development of an SNCC-based parameter estimation algorithm and spectrum estimation
SNCC-based Yule–Walker equation of AR mode
The SNCC functions of processes
According to Kanter and Steiger,
24

Employing equation (19) to write in the form of Yule–Walker equation
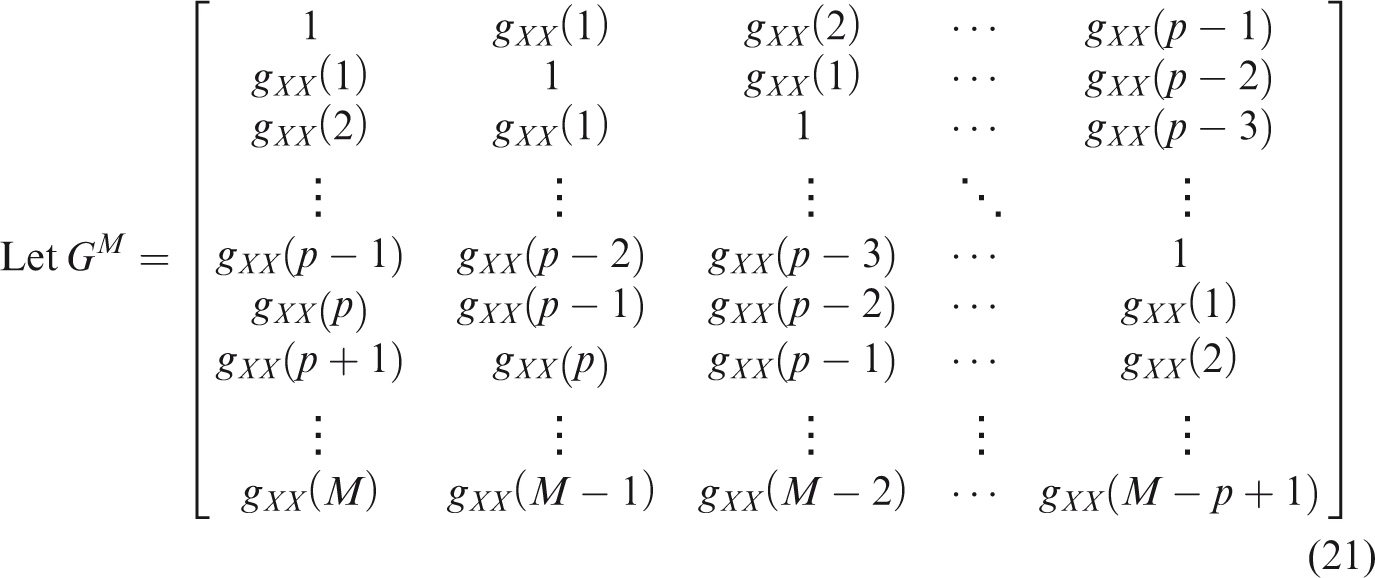
Let
Let
The coefficients
Theorem 2:
Proof
The rest of the form can be deduced as,
Then the nonsingularity of the matrix
Through the reverse proving, suppose the former

It obviously leads to the conclusion that
SVD-TLS algorithm for parameter estimation of AR model
Selecting extended order
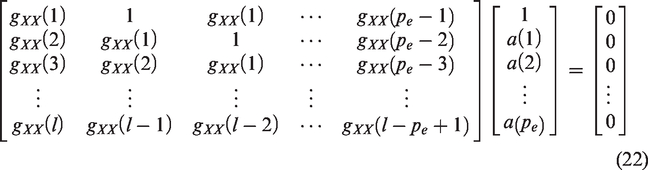
Writing equation (22) in brief

SVD decomposition of matrix


Computing
Similarly,
Solving linear equations
α-Spectrum
Since the problem we are confronted with is estimation of 1/f noise spectrum, the proposed SNCC method is used to suppress CGN of the dual-channel measured data. The spectrum estimation is specially towards the same diode 1/f noise produced by the dual-channel output, thus we can transform the cross-spectrum estimation problem of the dual-channel data into the problem of self-spectrum estimation.
Due to infinite variance of α-stable process

Dealing with the problem of spectrum estimation for an α-stable process, we adopt α-spectrum estimation method, 27 due to its equivalent position to the power spectrum density estimation method based on the autocorrelation function in Gaussian distribution.
On the condition of α-stable distribution, a finite impulse response system with input a

So when the linear model of
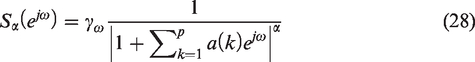
When the value of
Experiments
Simulation and experiments
The composition of the analog dual-channel output data includes the signal (1/f signal conforming to α-stable distribution) and the additive noise (CGN). The 1/f signal is generated according to literature. 28 We substitute α-stable noise for Gaussian noise as AR system input. The generating method of α-stable noise that we adopted is Chambers–Mallows–Stuck method.29,30 Thus, we generate a 1/f process, adding two different colored Gaussian processes, respectively.
According to an earlier section, the characteristic parameter of input
Mixed signal-to-noise
With nonexistence of finite variance, the variance of conventional signal-to-noise (SNR) ratio stands no point, based on that, we use mixed SNR16,31 to define SNR under α-stable distribution.

Comparison between self-spectrum, cross-spectrum and the real spectrum
We refer to the AR spectrum estimation based on SNCC to cross-spectrum with dual-channel data, similarly, self-spectrum is AR spectrum estimation based on SNSC with single-channel data. The real spectrum, cross-spectrum, and self-spectrum are compared in Figure 2.
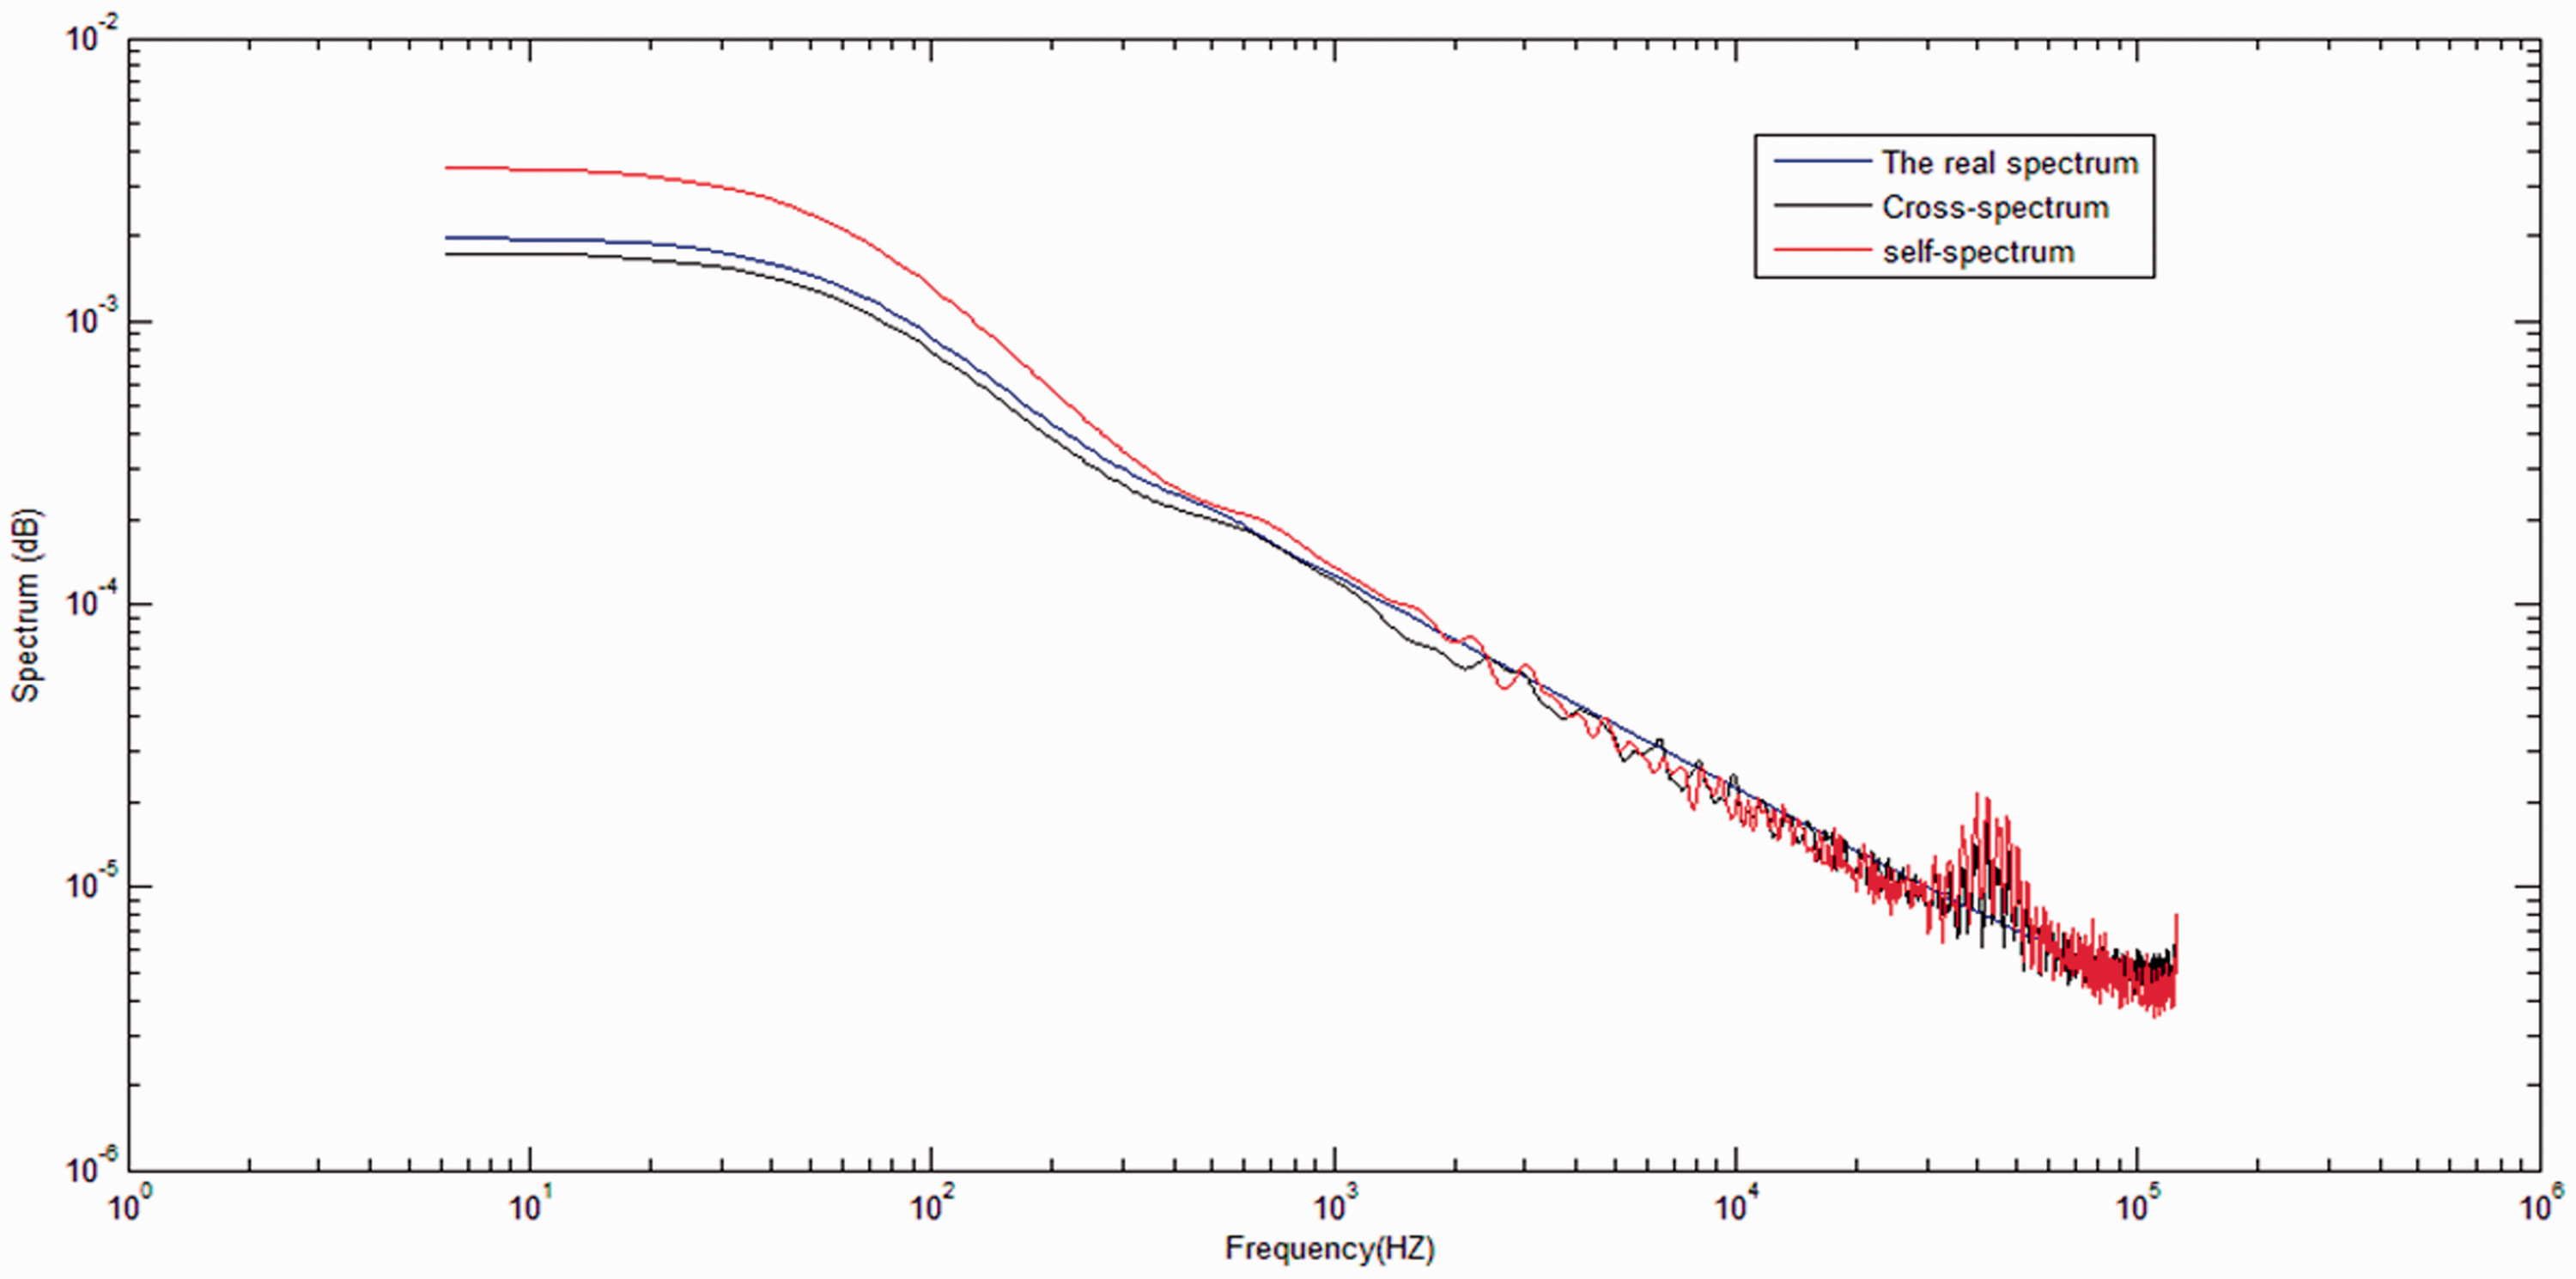
Comparison between self-spectrum, cross-spectrum, and the real spectrum.
From Figure 2, we can see that the spectrum estimation of cross-spectrum method draws nearer to the real spectrum than that of the self-spectrum method.
Estimation of the characteristic parameter
Compared with the Gaussian noise, the non-Gaussian property of α-stable noise is stronger. Due to the non-Gaussian property, we use the method of a fractional lower order statistics-based independent component analysis (ICA) method to extract impulsive α-stable signal. Then, the value of characteristic parameter of extracted signal can be estimated according to Qiu et al. 32
Figure 3(a) shows the original generated 1/f signal. Figure 3(b) shows the original 1/f signal with additive CGN. Figure 3(c) is the extracted signal from original 1/f signal and additive CGN by using the method of Qiu et al. 32
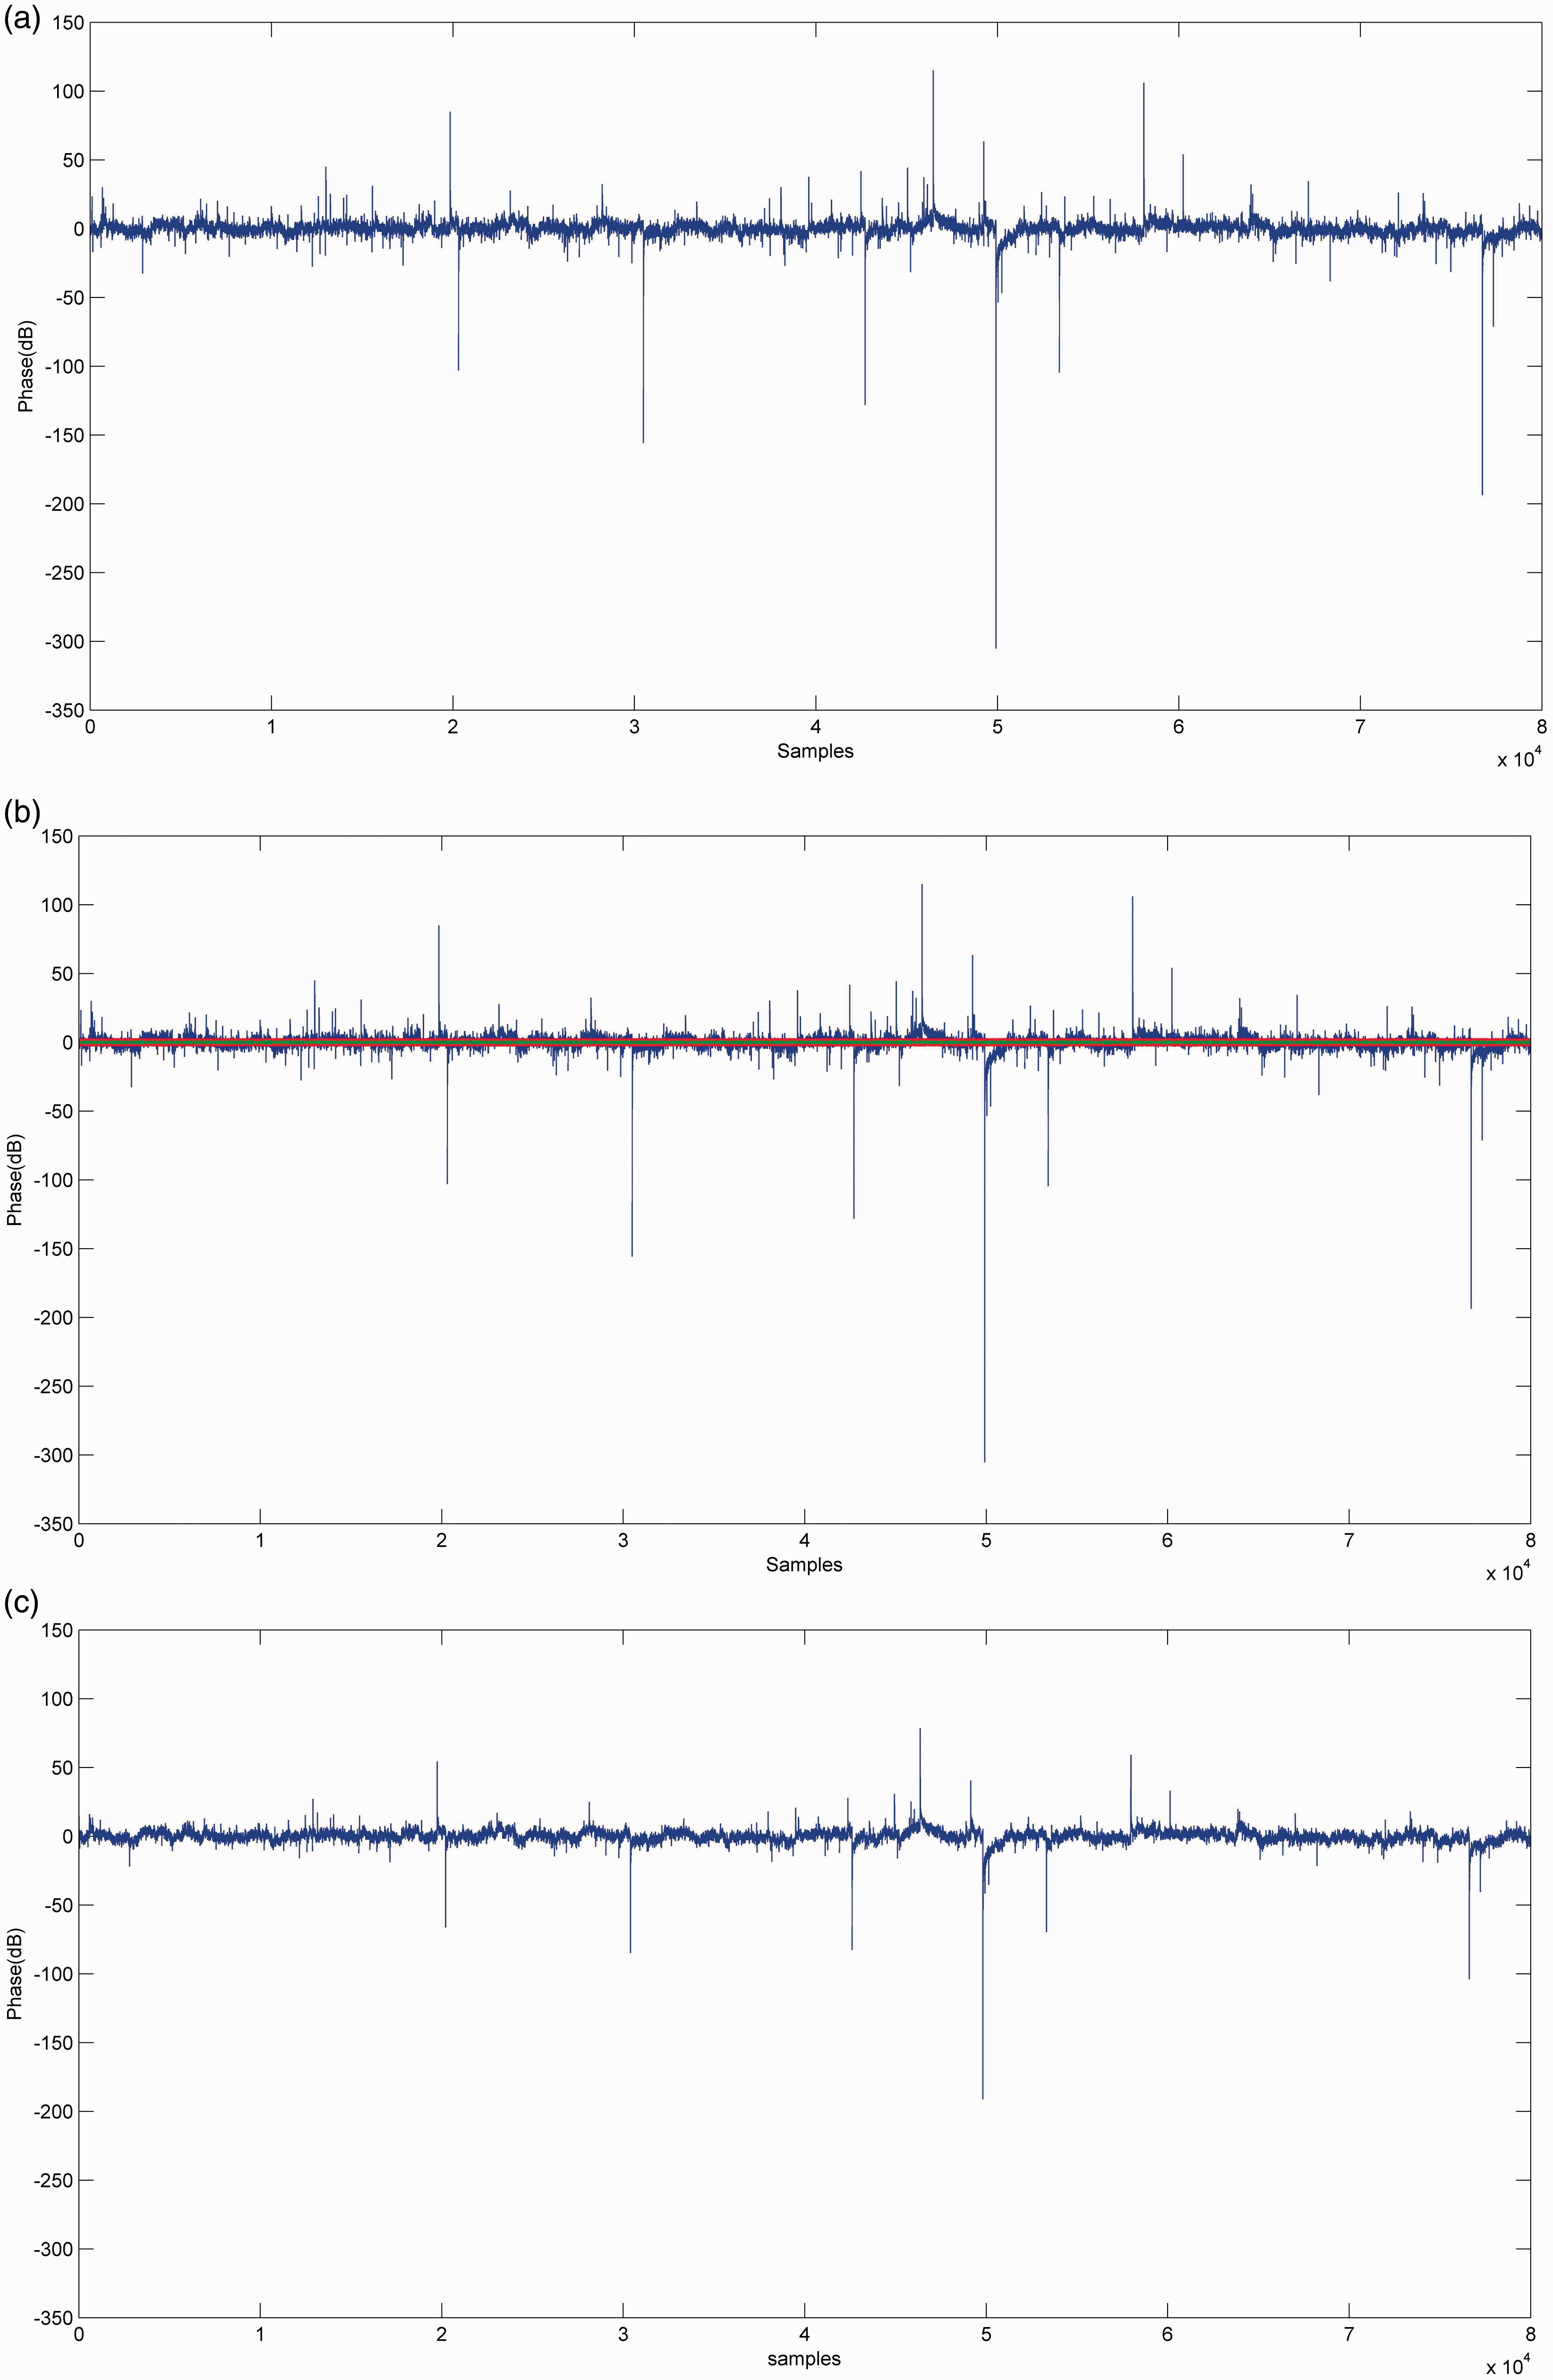
(a) The generated 1/f signal; (b) 1/f signal with additive CGN; (c) the extracted signal.
The true α-value is 1.5. Estimated α-value of generated 1/f signal is 1.4926, and that of extracted signal is 1.5888.
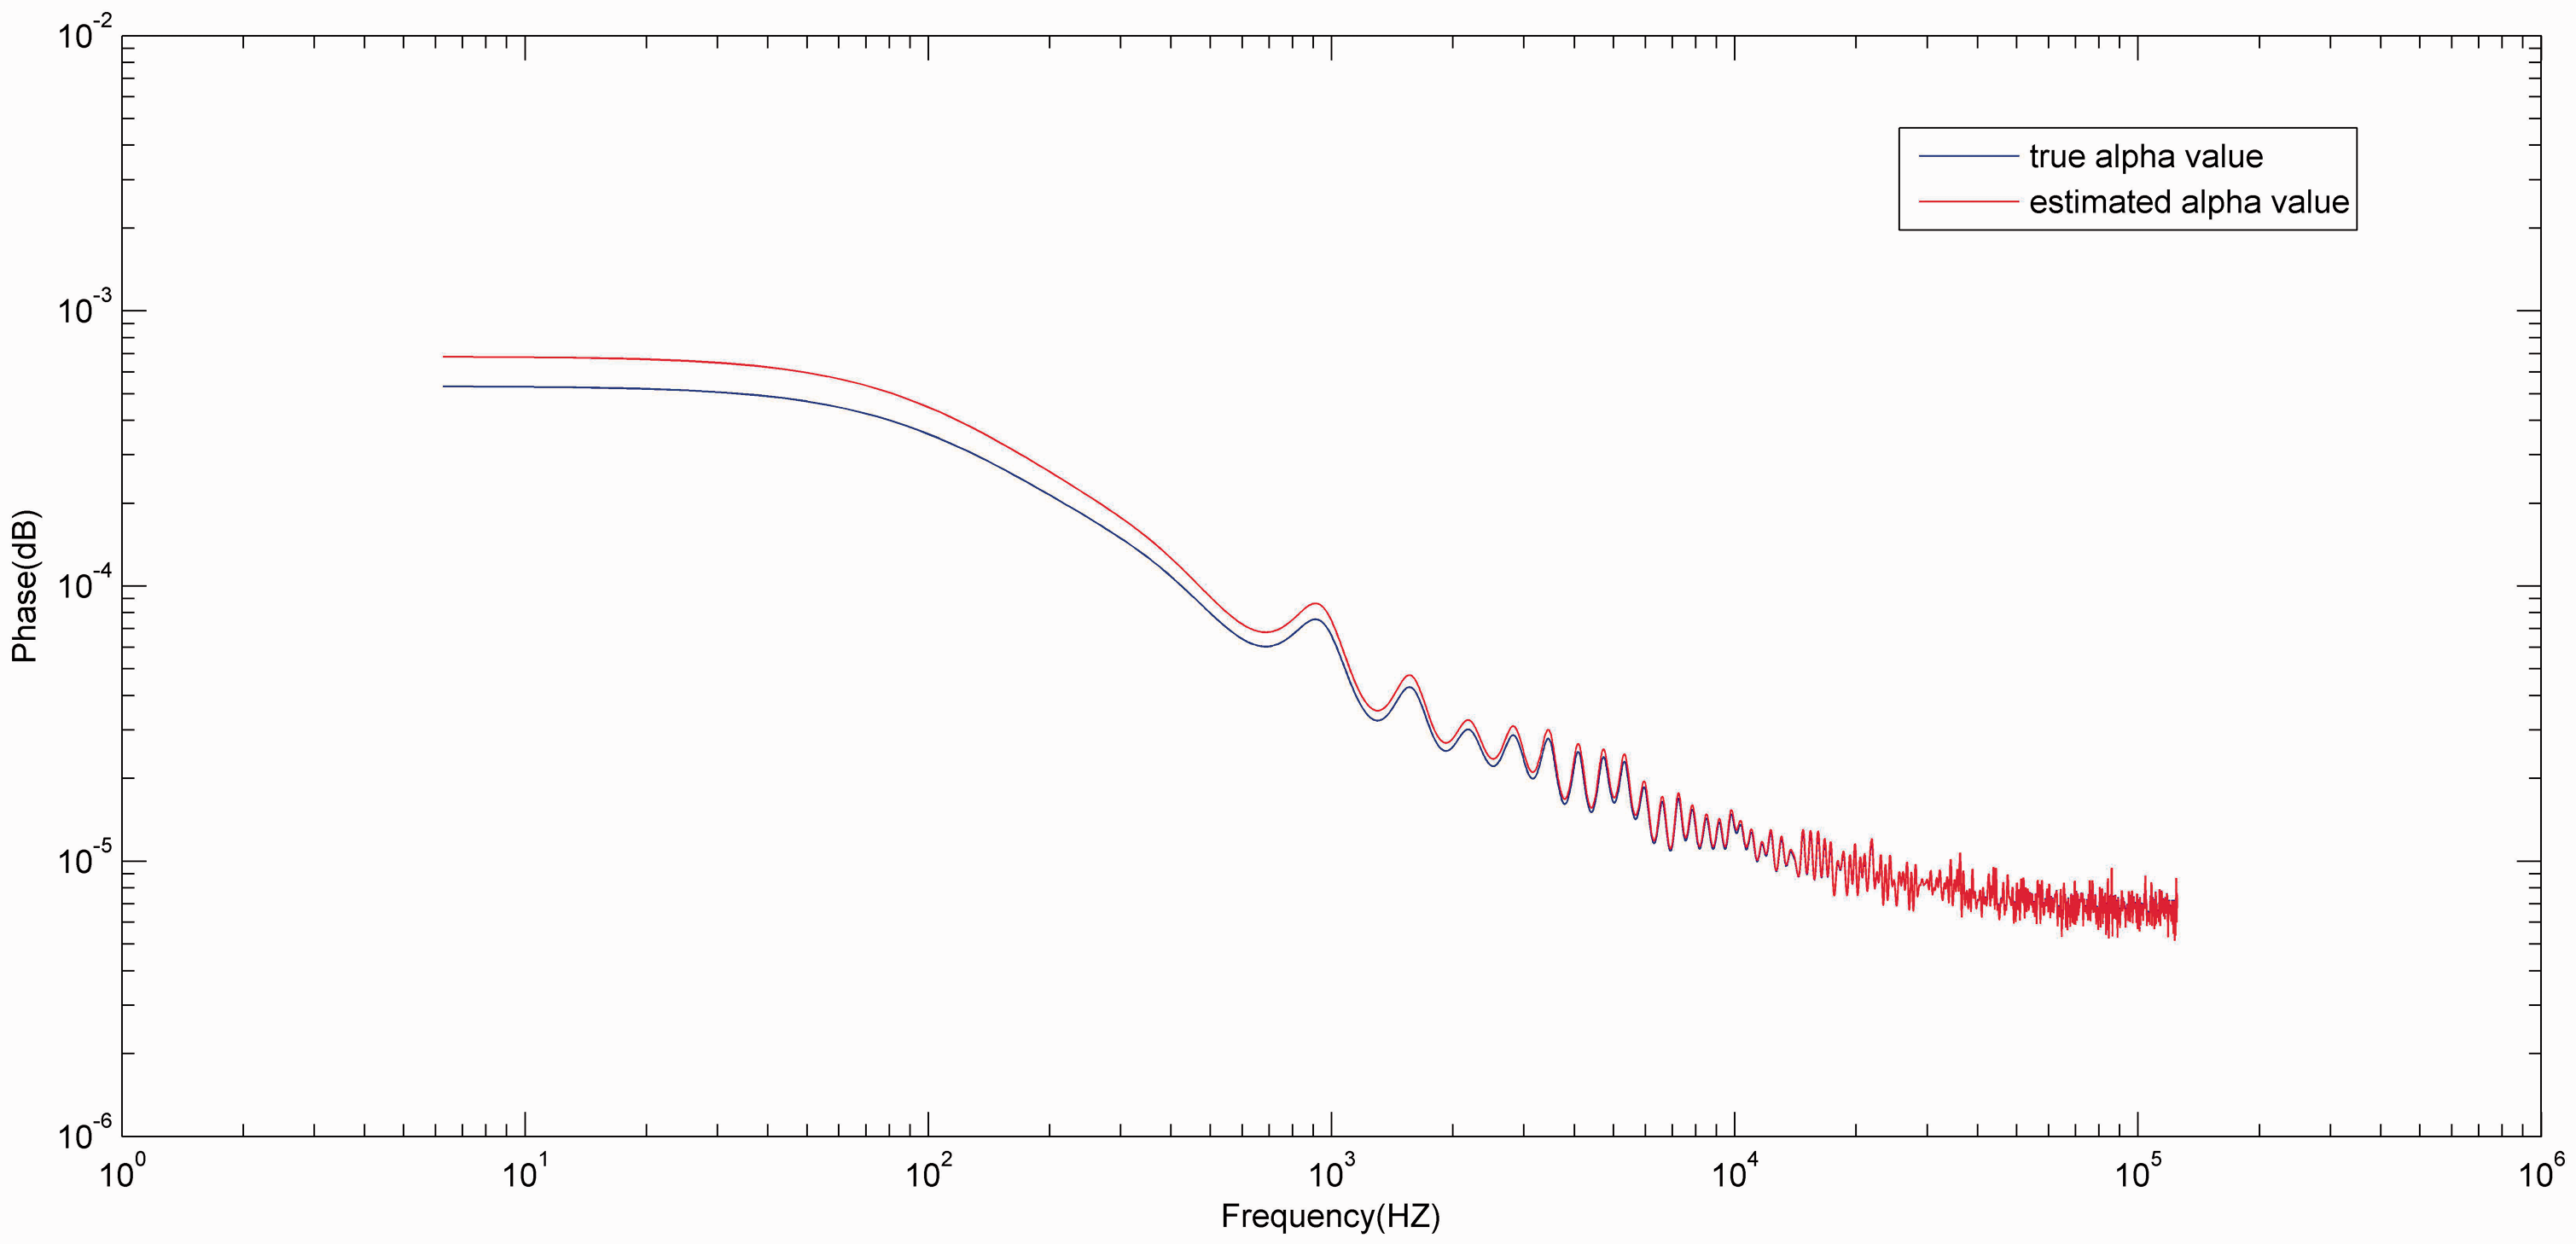
Spectrum with true/estimated α-value.
The mean and standard deviation (std) of estimated value of
Mean (std) of the estimated value of
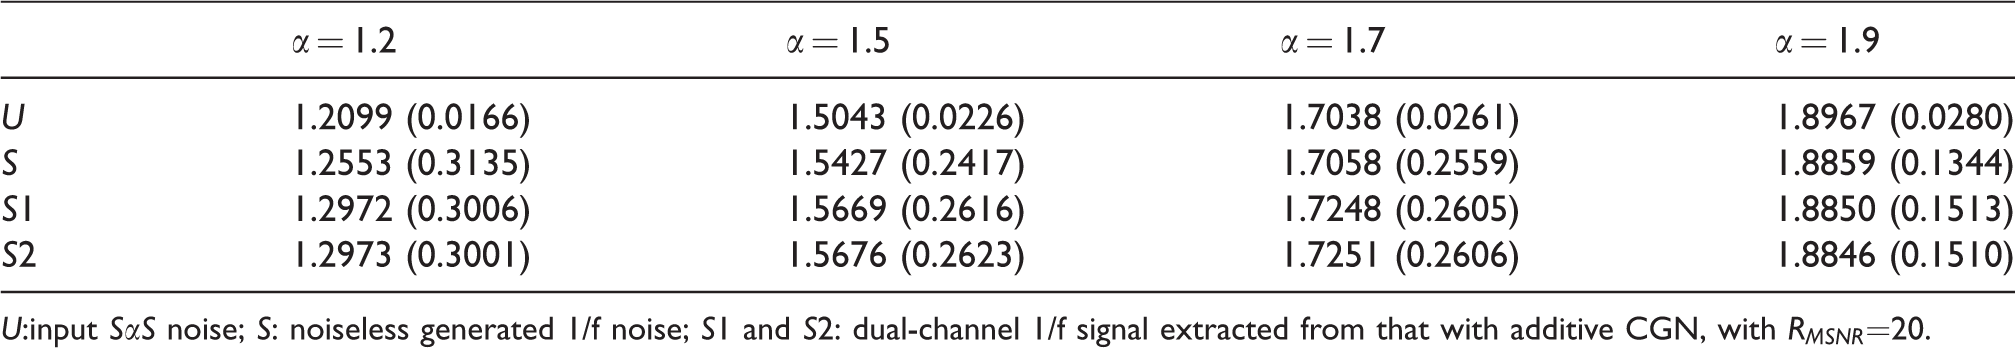
U:input
We refer SNSC-ICA method as applying FLOS based ICA method to extract α-stable signal before SNSC method.
Error analysis of AR coefficients
The accuracy of AR parameters estimation is measured by root mean square error (RMSE). The RMSE of AR parameters estimated respectively by SNCC, SNSC, and SNSC-ICA method are illustrated by Figure 5.
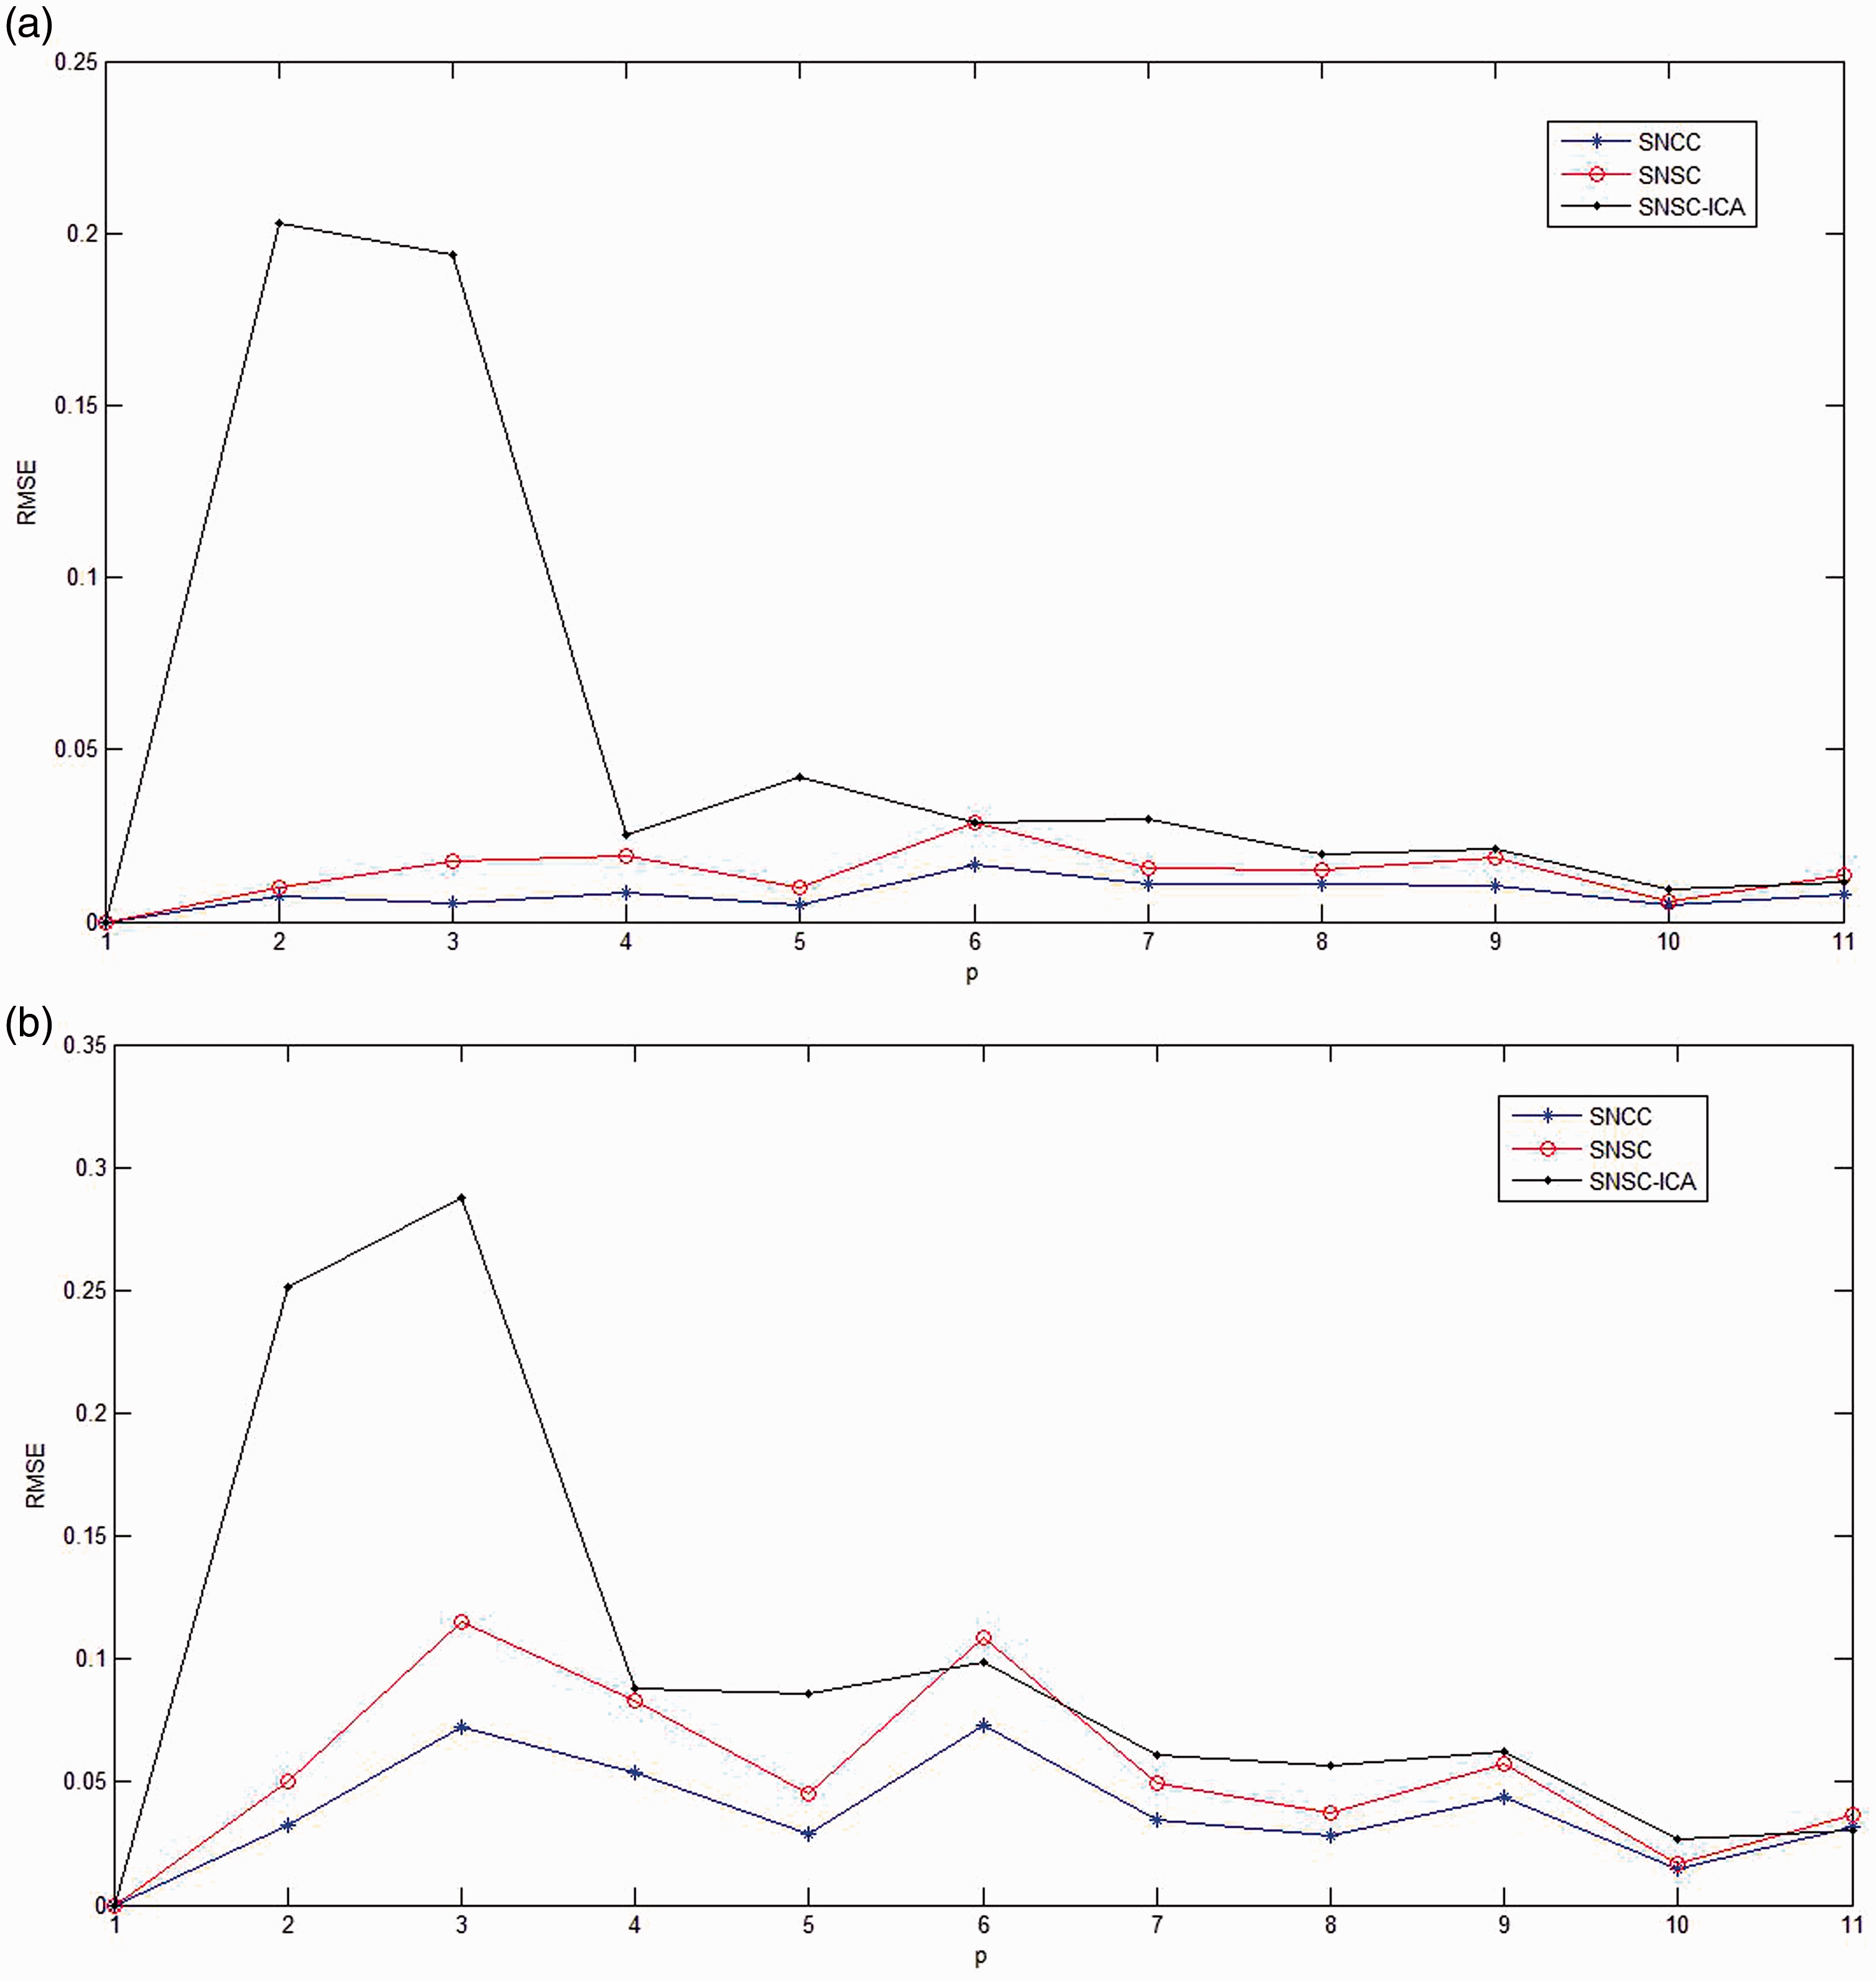
RMSE with α = 1.2; (b) RMSE with α = 1.8.
Figure 5 shows the RMSE of AR coefficients respectively with
The mean and standard deviation (std) of estimated AR coefficients of over 100 trails, each with 10,000 samples generated through Chambers–Mallows–Stuck method are presented in Table 2, where α = 1.8,
Mean (std) of AR coefficients over 100 trails, with 10,000 samples, α = 1.8,
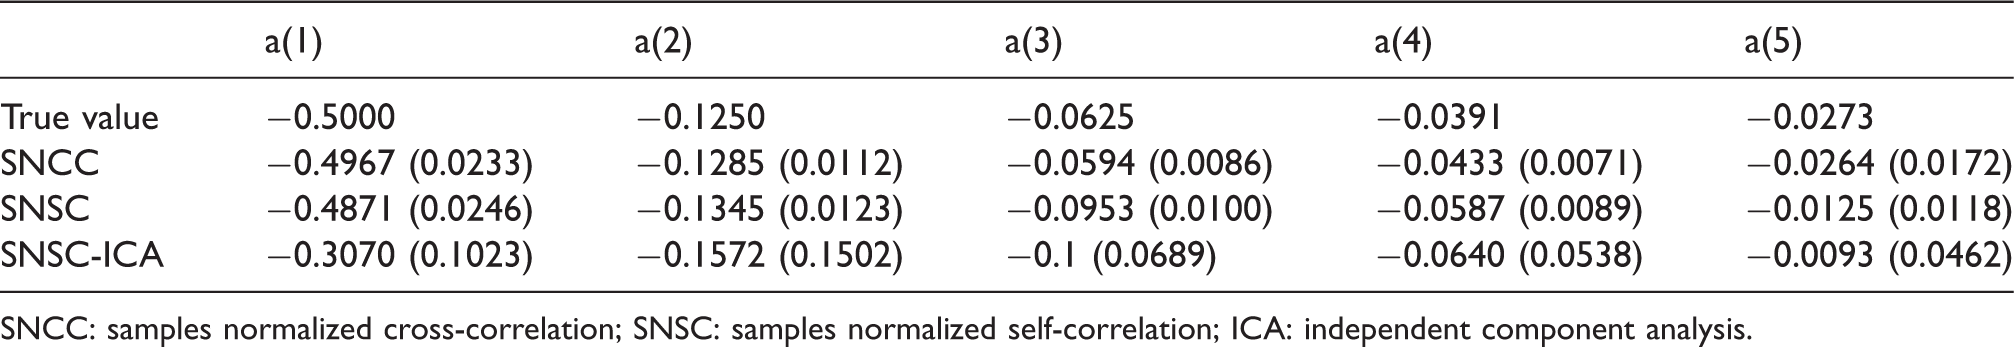
SNCC: samples normalized cross-correlation; SNSC: samples normalized self-correlation; ICA: independent component analysis.
The RMSE of estimated AR coefficients of over 100 trails, each with 10,000 samples generated through Chambers–Mallows–Stuck method are presented in Table 2, where α = 1.5,
From Tables 2 and 3, we can draw the same conclusion that ICA-based method can only be used to extract signal other than spectrum estimation, where the performance of SNCC-based method is better than the SNSC-based method.
Root mean square error (RMSE) of AR coefficients over 100 trails, with 10,000 samples, α = 1.5,
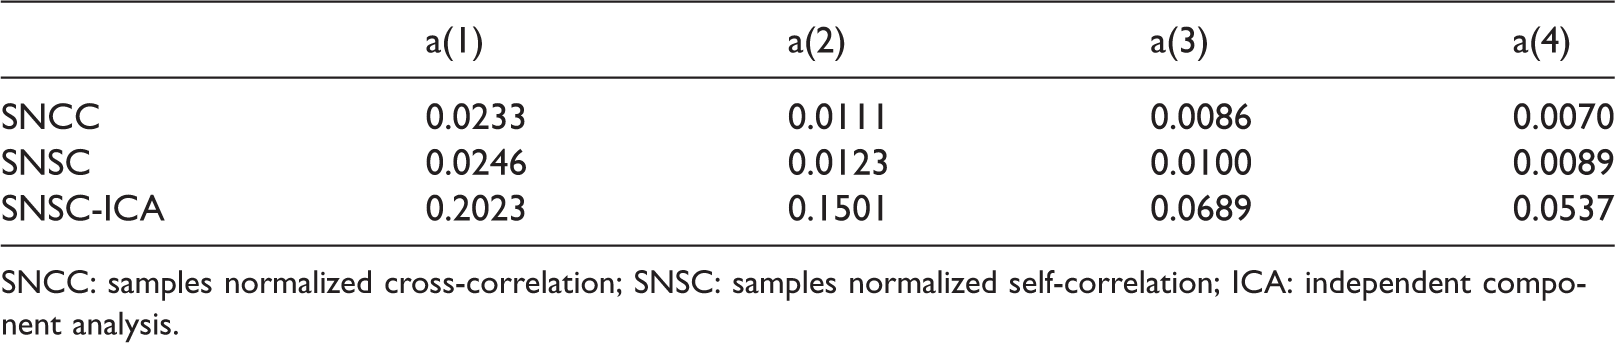
SNCC: samples normalized cross-correlation; SNSC: samples normalized self-correlation; ICA: independent component analysis.
Spectrum estimation of real dual-channel data
The reason why the voltage regulator diode is chosen is that it does not have amplification function itself. It needs amplification by amplifier and noise of amplifier, which is challenging.
Noise measurement system
We choose STC5V1 zener diodes, with a rated power of 0.5 W and a regulated voltage of 5.1 V. Hundred zener diodes with the same type and batch are measured. The noise spectrum is measured in the frequency range of 0.4 Hz to 25 kHz and the specified current of 1 mA with a noise measurement system at room temperature, which consists of two amplifiers, DAQ, a personal computer.
The low noise amplifier selected by this system is two Model 5184 type amplifiers produced by Perkin Elmer. The amplifier is of medium impedance, AC-coupled voltage amplifier. With ultralow noise input amplification characteristics, frequency response is 0.5 Hz to 1 Mhz and magnification is 1000 times. In order to make the two LNA independent, using independent power supply, the experiment uses four batteries (9 V) supplied by itself.
The selected DAQ is ART USB2811, the input range is +5 V, the conversion accuracy is 16 bits, and the sampling frequency is 31 Hz to 250 kHz. The DAQ adopts pseudo-synchronous method for dual-channel acquisition, and the sampling frequency is 200 K. The number of sampling points is 10,000. A group of 100 zener diodes modeled ZW36 are used in our experiments.
Diodes noise measurement and spectrum estimation
We verified that time domain noise processes of 100 zener diodes conform to α-stable distribution, their characteristic exponent
Figure 6 is the time domain diagram of dual-channel noise measurement. Figure 7(a) to (e) demonstrates the influence of sample number
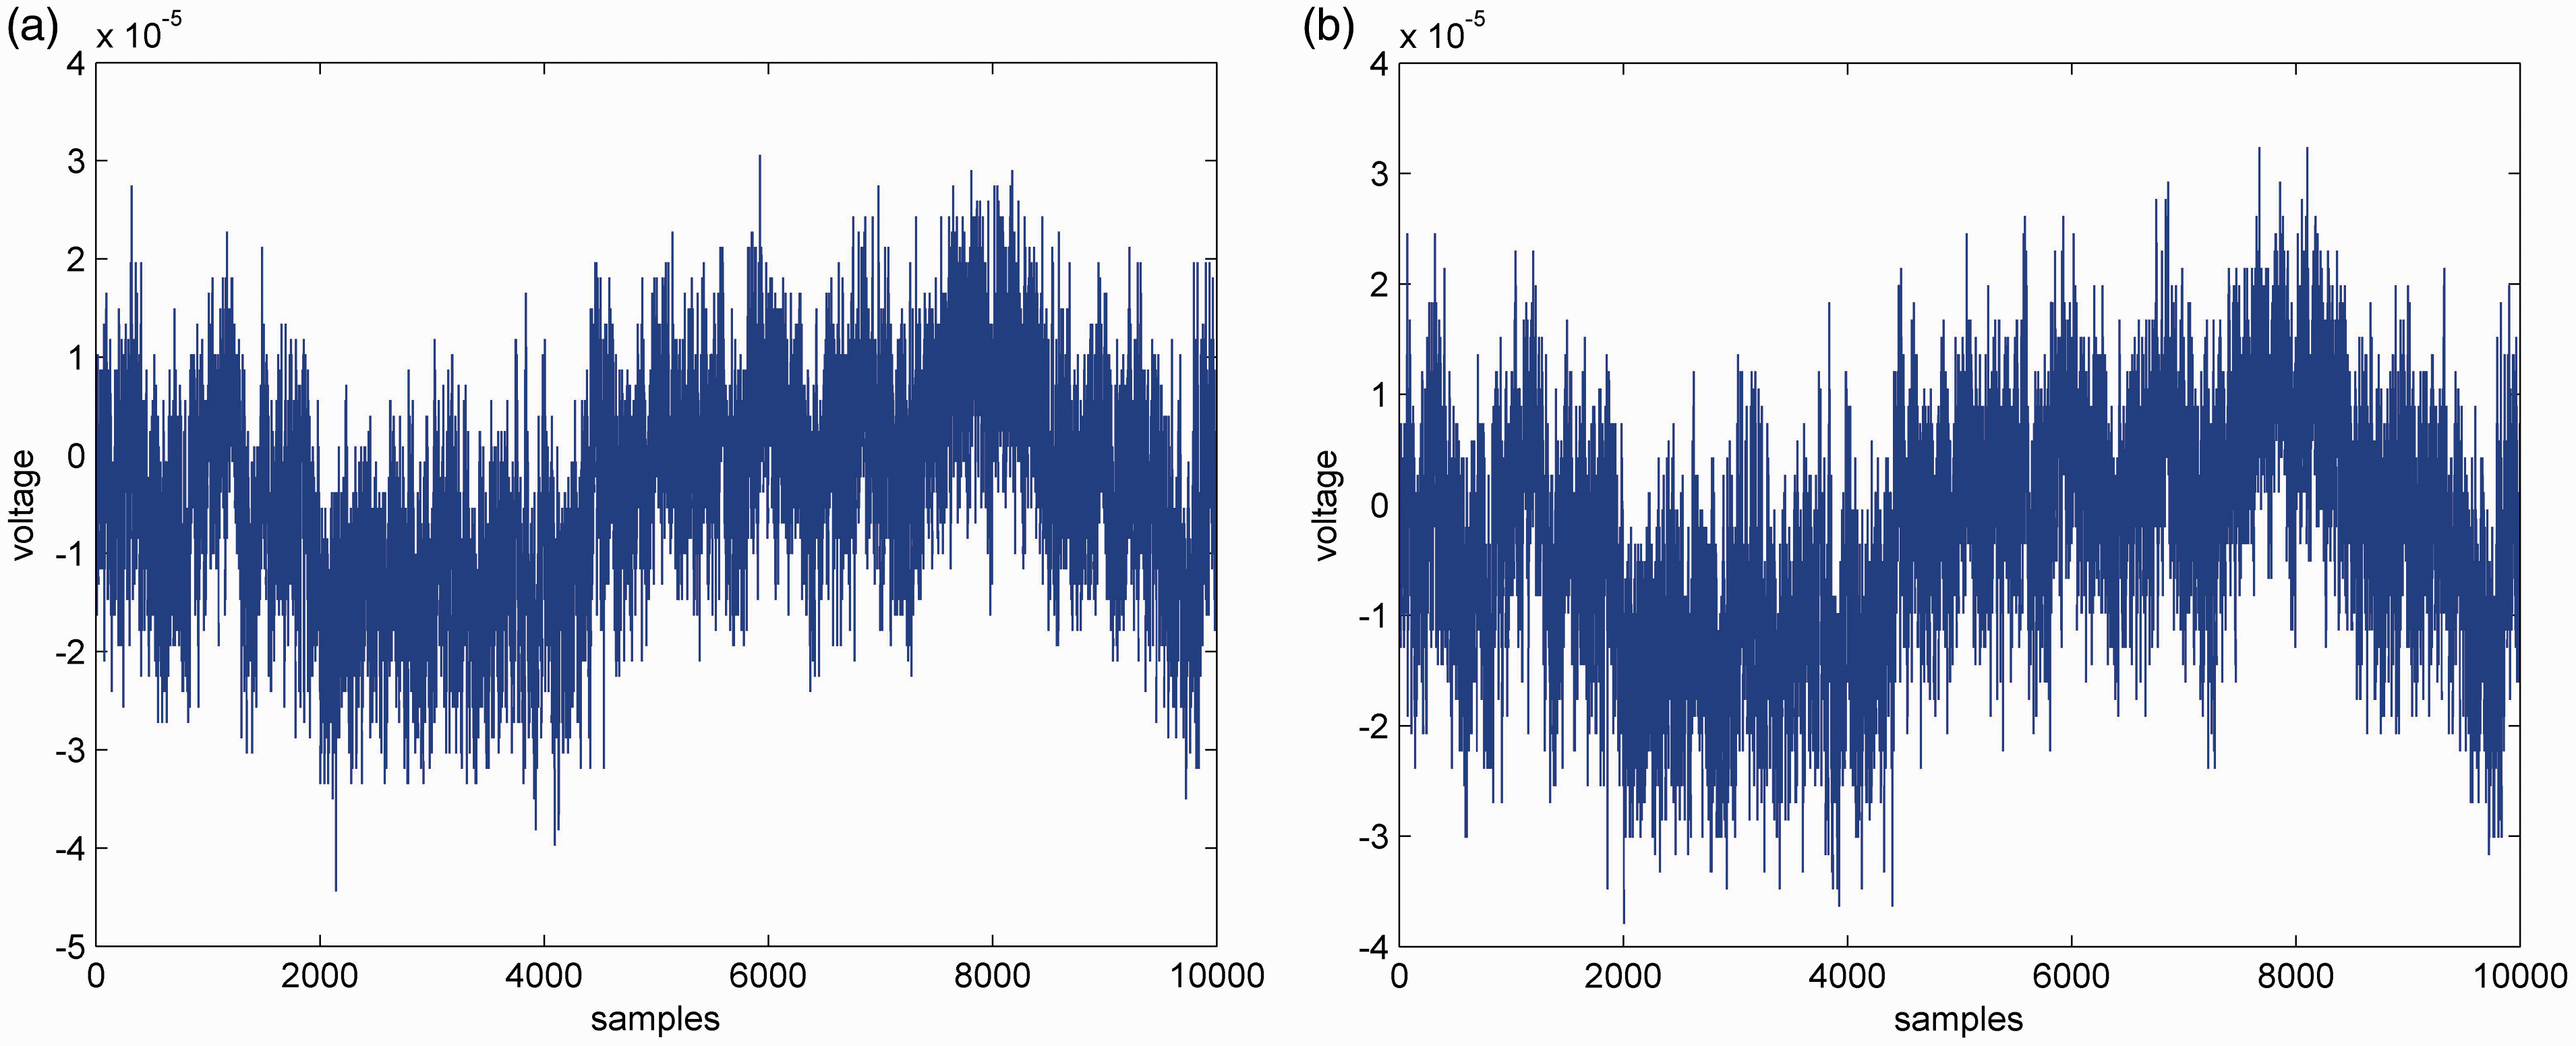
(a) Channel 1; (b): Channel 2.
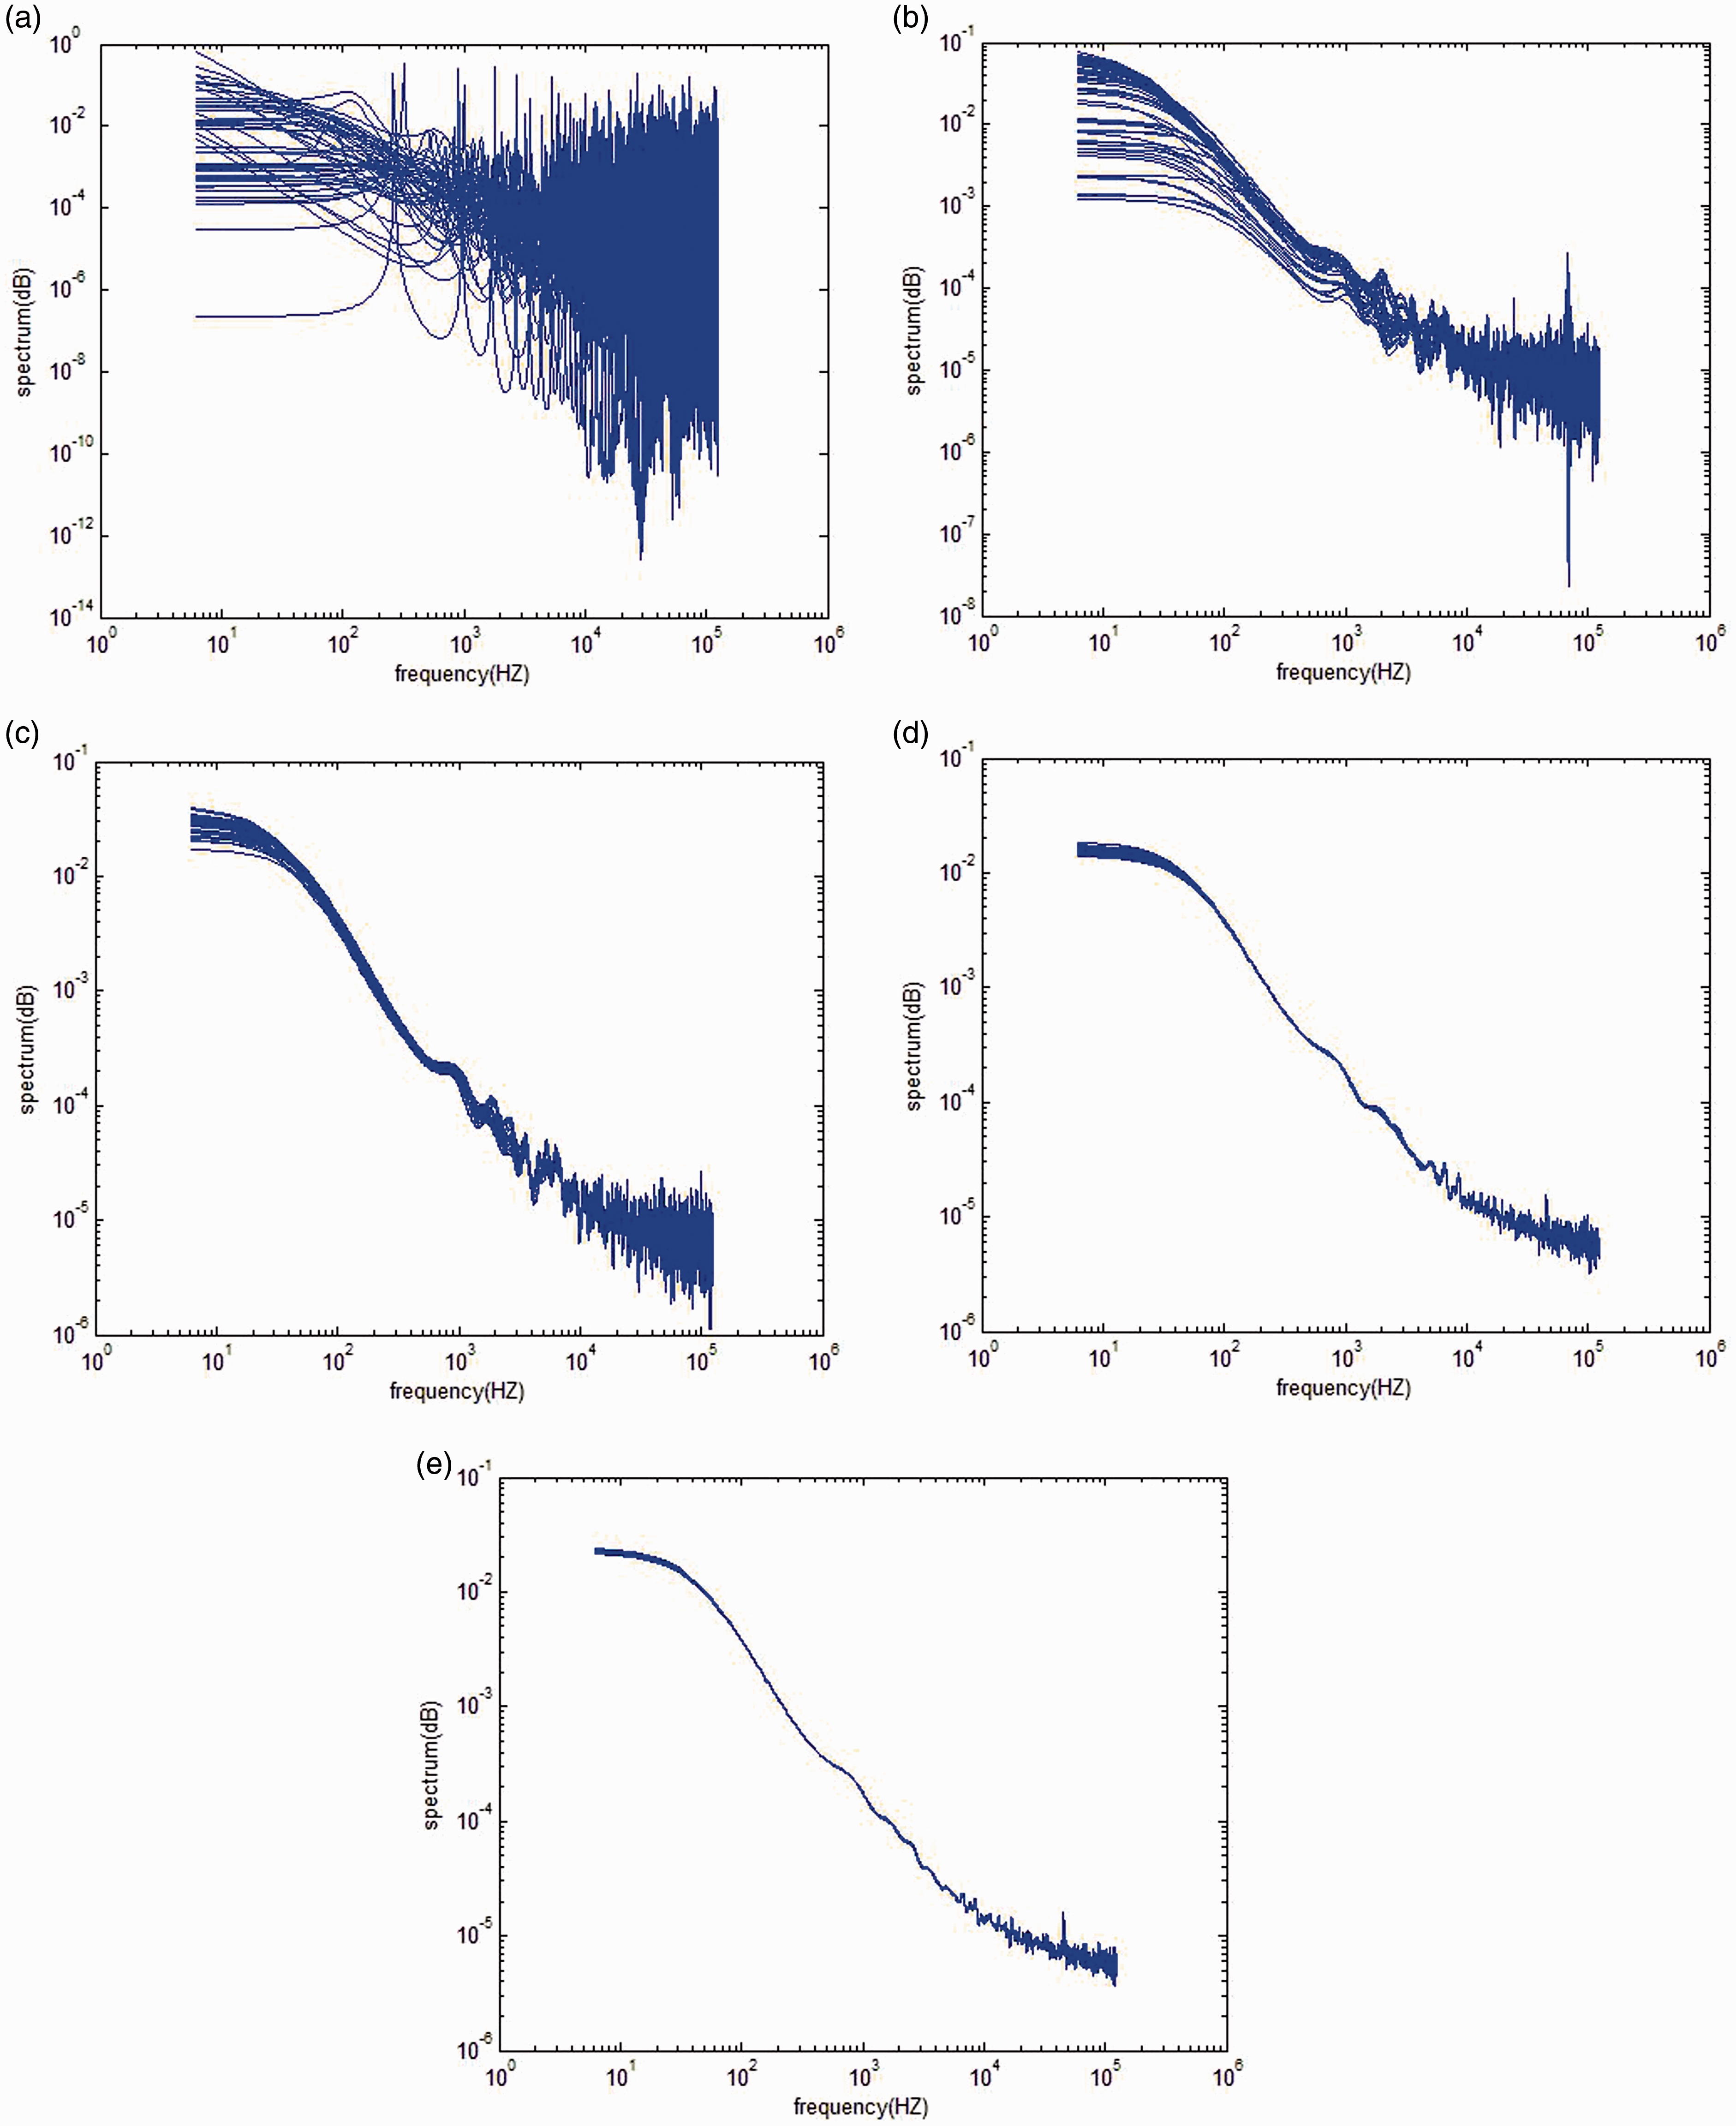
(a) N = 1000; (b) N = 5000; (c) N = 10,000; (d) N = 50,000; (e) N = 100,000.
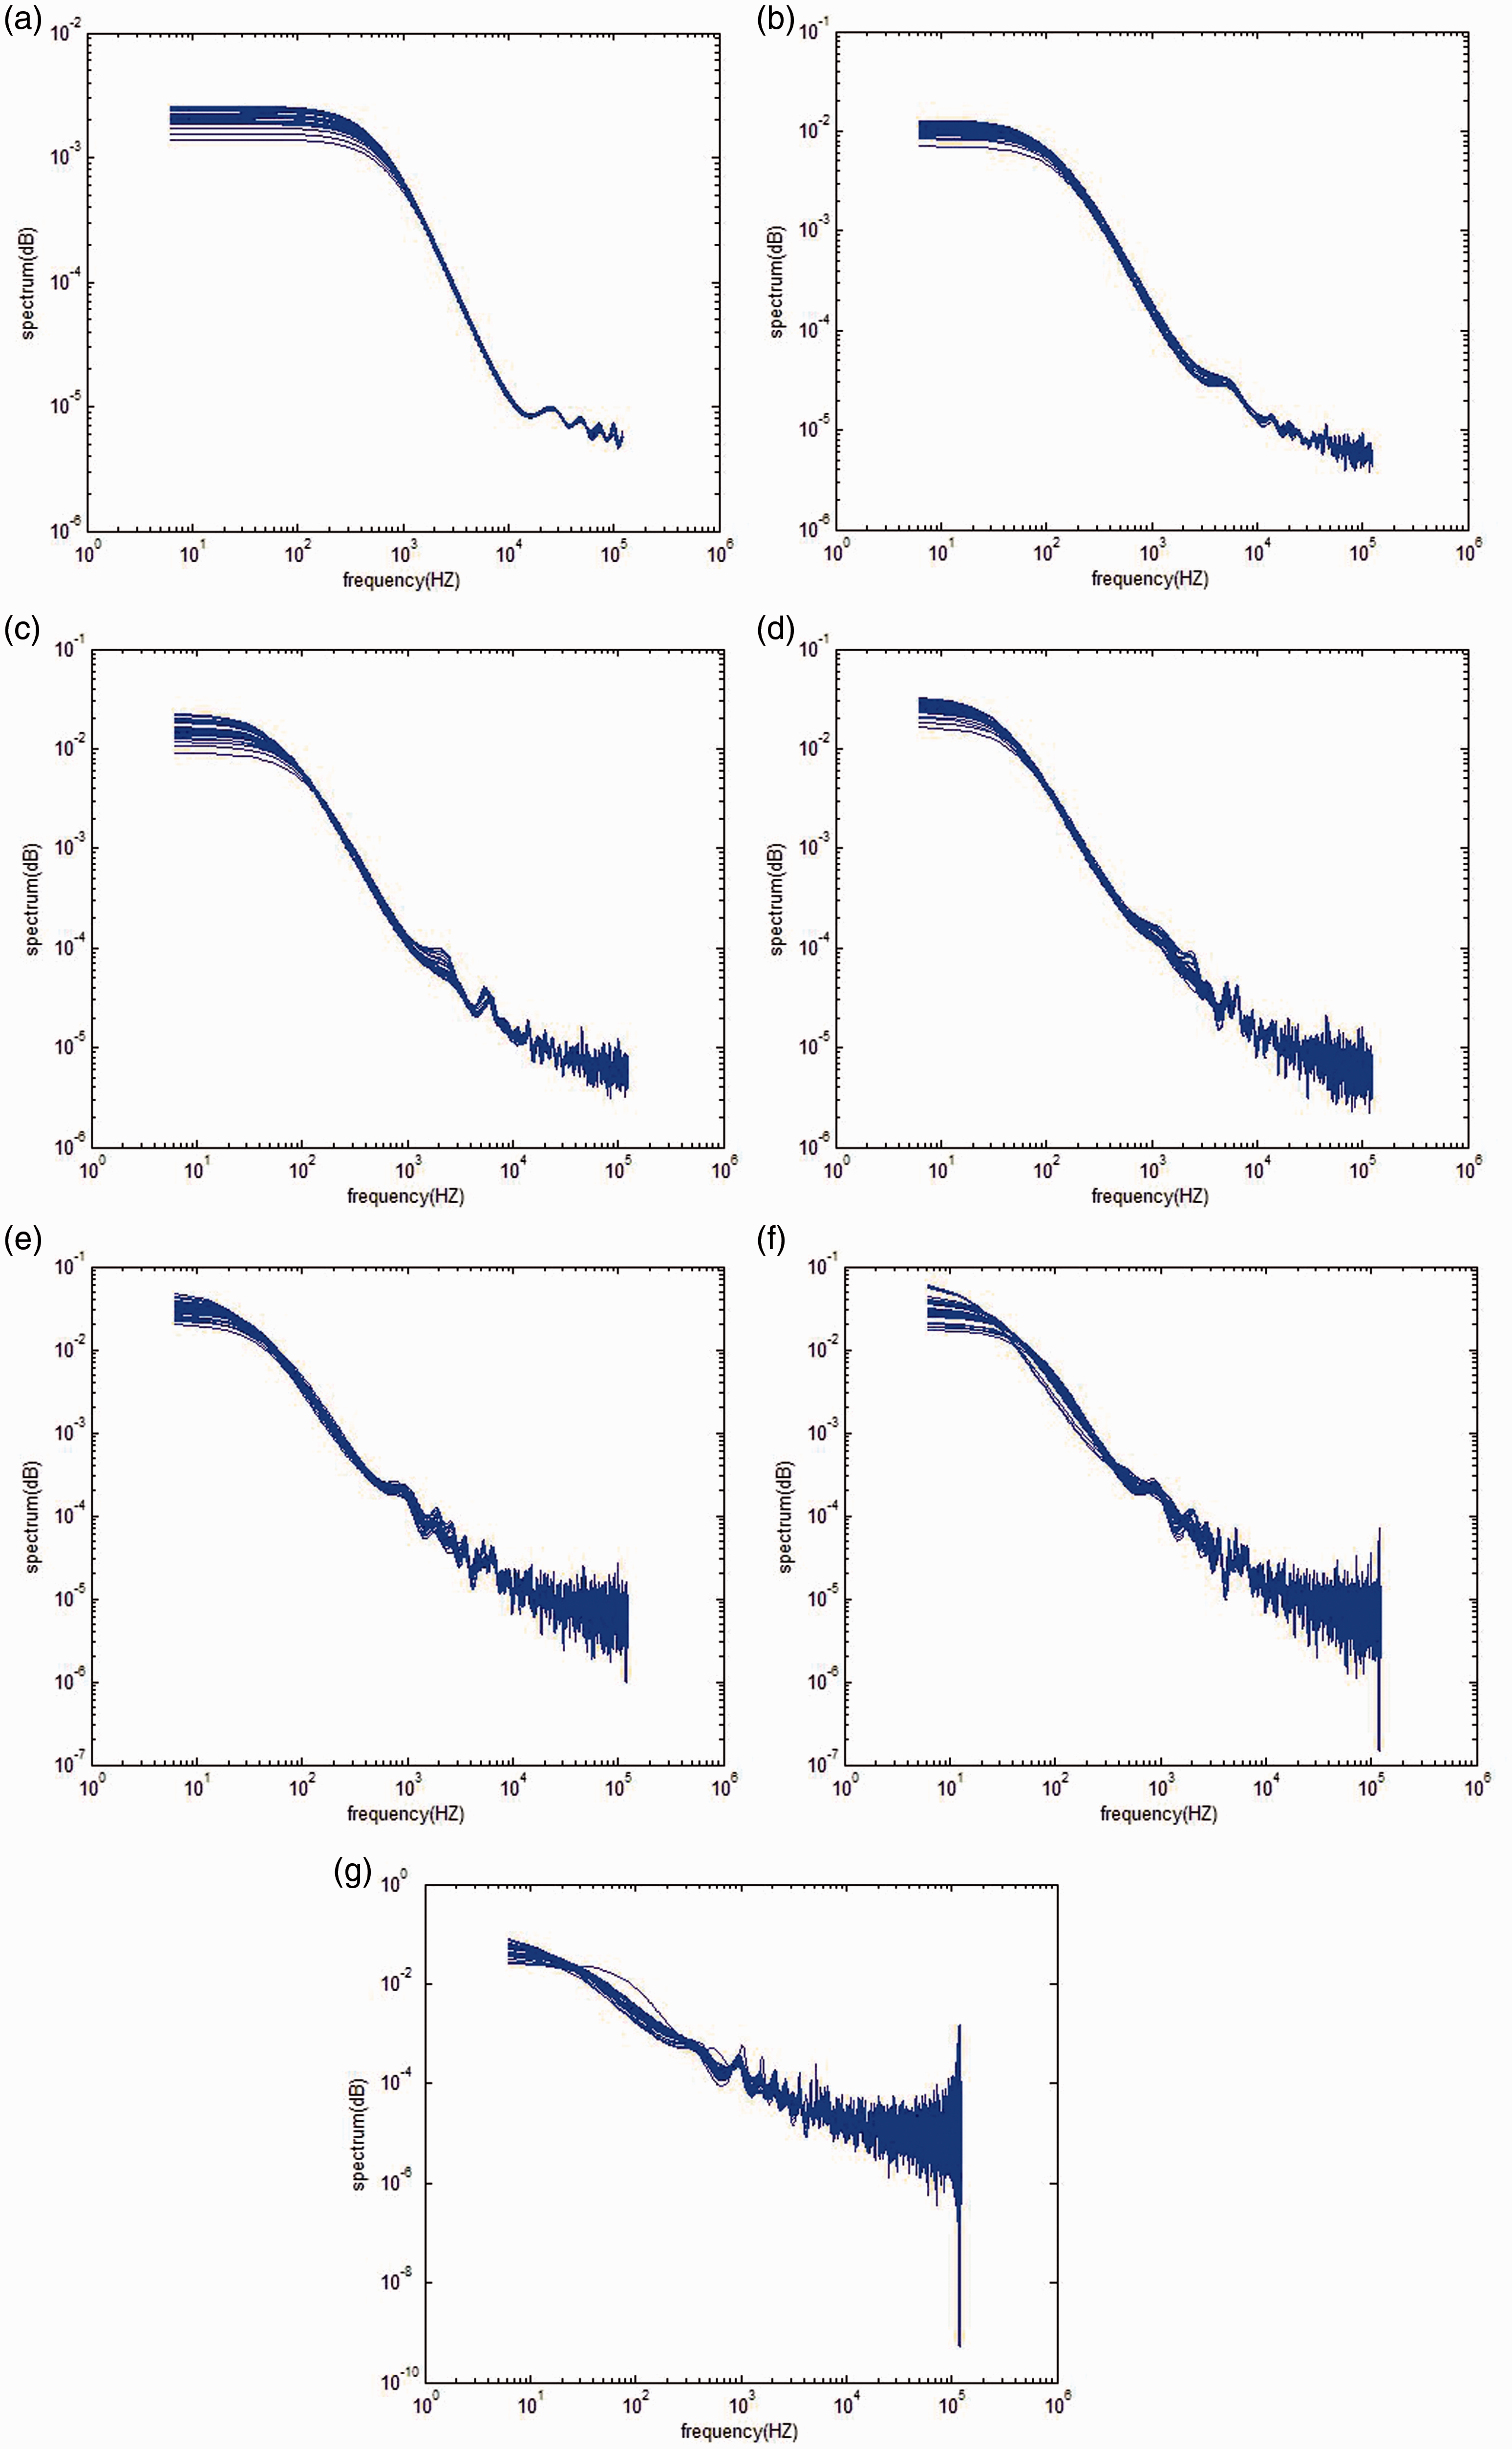
The influence of order p of AR model on spectrum estimation. p = 10; (b) p = 50; (c) p = 100; (d) p = 200; (e) p = 300; (f) p = 400; (g) p = 500.
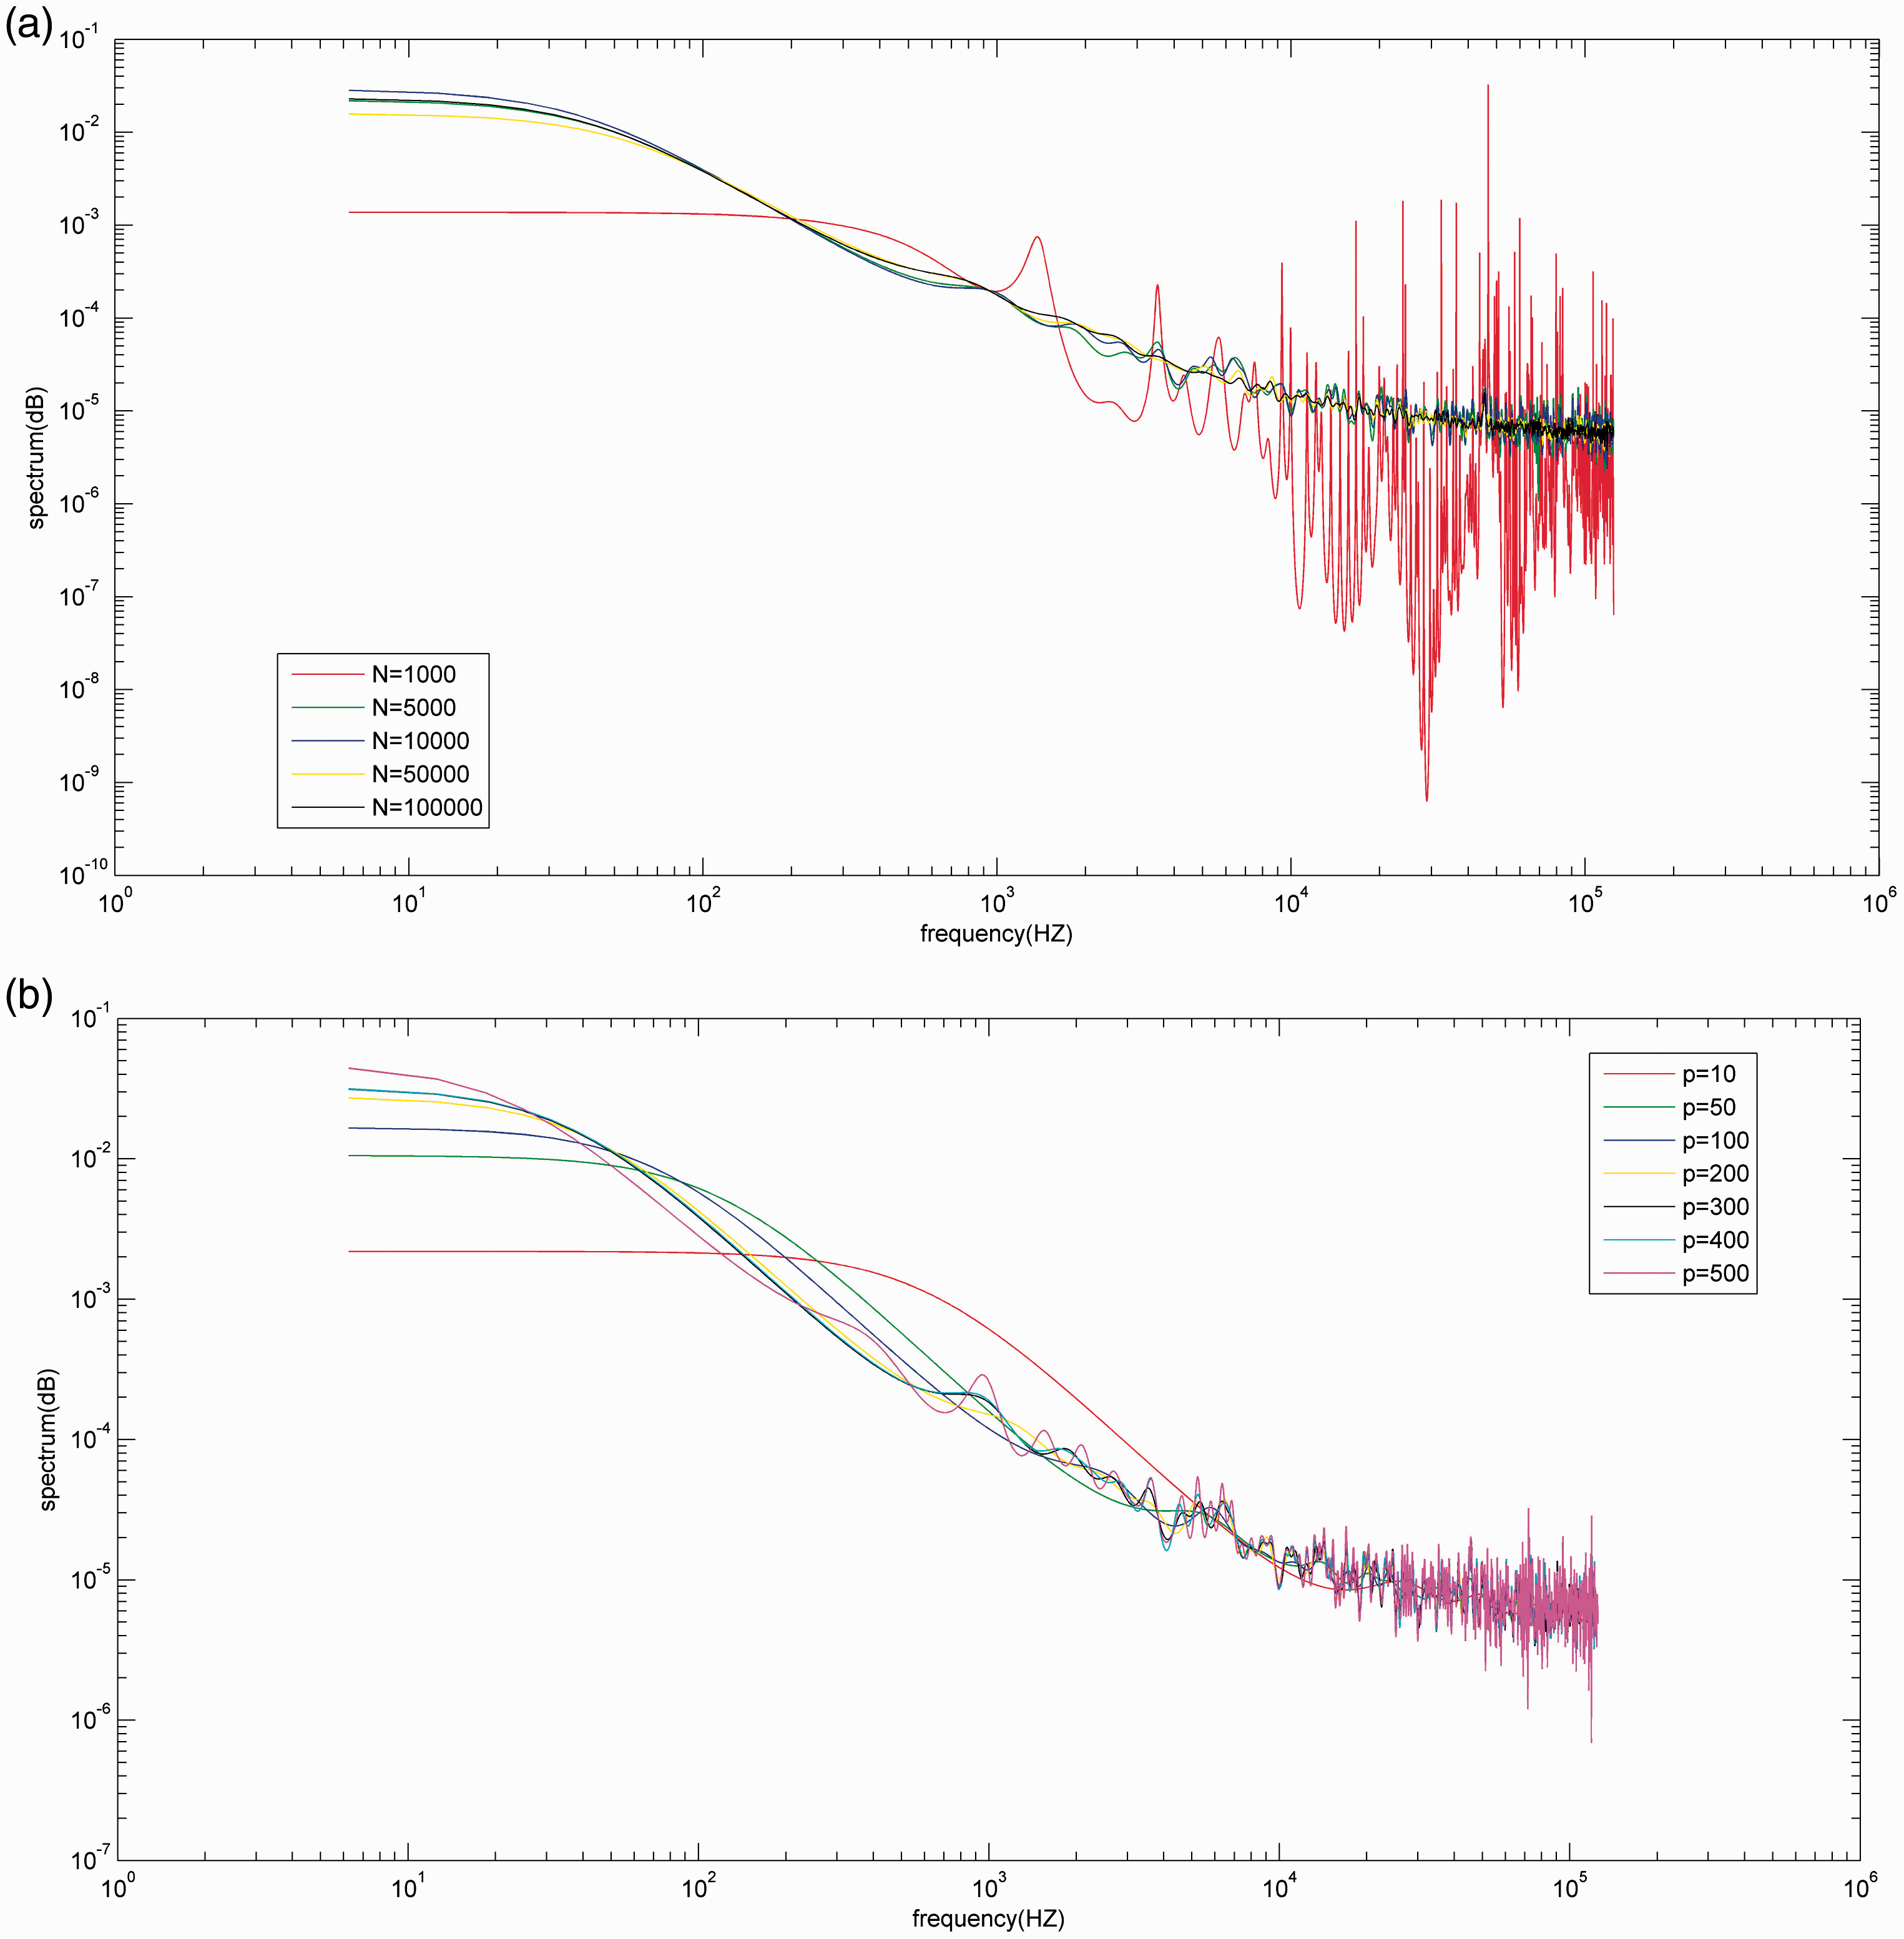
The average spectrum curves of different N and p.
Conclusions
CGN is inevitably introduced during the measurement of transistor 1/f noise, which causes the decline of spectrum estimation accuracy. Our research showed that the 1/f noises of transistors conform to α-stable distribution, so the problem of 1/f spectrum estimation is transformed into α-stable noise spectrum estimation problem. Previously, the estimation of α-stable noise spectrum is carried out under noise-free background. With the increasing of the background noise, the spectrum estimation accuracy of the existing methods is declined. Therefore, in view of the fact that there is no finite second-order characteristic of α-stable noise, we proposed a SNCC method to suppress the influence of CGN on the declining accuracy of spectrum estimation. The experimental results have shown that the estimated spectrum by our method has a high degree of accuracy.
Footnotes
Declaration of conflicting interests
The author(s) declared no potential conflicts of interest with respect to the research, authorship, and/or publication of this article.
Funding
The author(s) received no financial support for the research, authorship, and/or publication of this article.