
Abstract
A pure electric vehicle may produce an abnormal ‘clicking noise’ when idling, especially as start-up, which can be a serious problem in terms of product performance. In this paper: (1) professional evaluators carry out subjective evaluations and the abnormal noise-generation mechanism and its transfer path are analysed; (2) the mode shape and sound pressure distribution are both simulated using the finite element method; (3) the AC compressor’s sound source is identified and located in the main frequency domain using the acoustic array and image formation method, so vibration and interior vehicle noise measurements from the compressor are carried out; and (4) based on the established causes of the abnormal noise, three effective approaches – structure reinforcement, manufacturing process improvement and start-up control optimization – are presented to help prevent abnormal noises from the AC compressor.
Keywords
Introduction
In recent years, with social economic development and growing environmental consciousness, there has been a growth in the market for less-polluting vehicles (e.g. hybrid electric vehicles, plug-in hybrid electric vehicles, pure electric vehicles, hydrogen fuel cell vehicle) with the goal of preserving the environment for future generations and reducing atmospheric pollution. As people’s environmental awareness grows, the most popular among the above-mentioned vehicles will be the pure electric vehicle because of its low pollution and reduced energy consumption. However, in addition to traditional vehicles’ noise and vibration problems, it is necessary to diagnose and solve major problems, including abnormal noises from the air conditioning (AC) compressor. 1 This noise is usually a relatively low-frequency noise. 2 There have been many complaints about the unpleasant sensation this causes for users of these vehicles, and these noises cannot usually be prevented by use of acoustic material, and perhaps can only be resolved through improving the structural design. Several acoustic scholars from Northern Europe have already carried out a lot of investigation work regarding the low-frequency hearing abilities of the complainants, and characteristic matching of the annoying sound. 3
Comfort is one of the most important elements of vehicle performance, and is one of the factors considered in initial research, conceptual design, product development, simulation analysis and experiment evaluation, trial production, final product inspection, market tracking and continuous improvement. In short, comfort is a factor that is considered and measured from the beginning of the design of a vehicle to the end of that vehicle’s use, and is also considered for future iterations. Noise and vibration performance is an important component of automobile comfort, and is a factor that users consider in their vehicle purchases.
Even though pure electric vehicles do not create the same amount of noise as vehicles with conventional engines, the noise of the electrical system is more emphasized. In the product design and development process of one type of pure electric vehicle, the start-up phase of the AC compressor is accompanied by ‘clicking’ and ‘whooping’ sounds, neither of which are considered to be acceptable.
First and foremost, the source must be identified. 4 This can be approached in two ways. (1) Adjust the AC compressor’s design and analyse the results over and over again to produce new iterations of the design to optimize it, 5 using comparisons to competitor vehicles to set noise target values. (2) To confirm the noise transfer path and vibration response causing the abnormal noise in the AC compressor, and the noise-generation mechanism, first it is necessary to analyse the body frame vibration mode frequency and shape, and the interior vehicle body sound pressure field distribution.6–10 In the past few years, there have been some advances in acoustic numerical calculation methods, such as the smoothed finite element method (S-FEM), the stable node-based smoothed finite element method (SNS-FEM) and the element decomposition method (EDM). There is also the gradient smoothing technique (GST), which is used to model the local geometry and extremely distorted meshes. The advantages are higher precision, computational efficiency, reliability and stability, and much faster convergence rate. This means the target could be achieved while reducing costs and development time. All of these methods are suitable for acoustic simulation prediction in engineering, and can be applied for vehicle body structural–acoustic properties in automotive industry development and design fields.
In this paper, the aim is to reduce the abnormal noise of the AC compressor effectively, through an iterative loop of subjective evaluation and objective measurement, including sound source identification, spectrum analysis, noise signal filter processing, troubleshooting, manufacture processing precision checks, start-up control strategy adjustment, diagnosis and analysis. All of the key problems are improved to some extent.
Subjective evaluation
A vehicle’s noises might become a problem or lead customers to believe they have purchased faulty products. As a vehicle noise performance development engineer, in order to diagnose, analyse and improve a noise problem, one must first accumulate engineering experience and knowledge, which allows one to compare and analyse the causes of noise problems both subjectively and objectively – for instance, considering a vehicle’s material, structure, operation principle, and so on. Usually all kinds of factors interact. These engineers can then create evaluation standards and targets to guide production practices to ensure the product is of a satisfactory standard for the end-user.
Subjective evaluation method
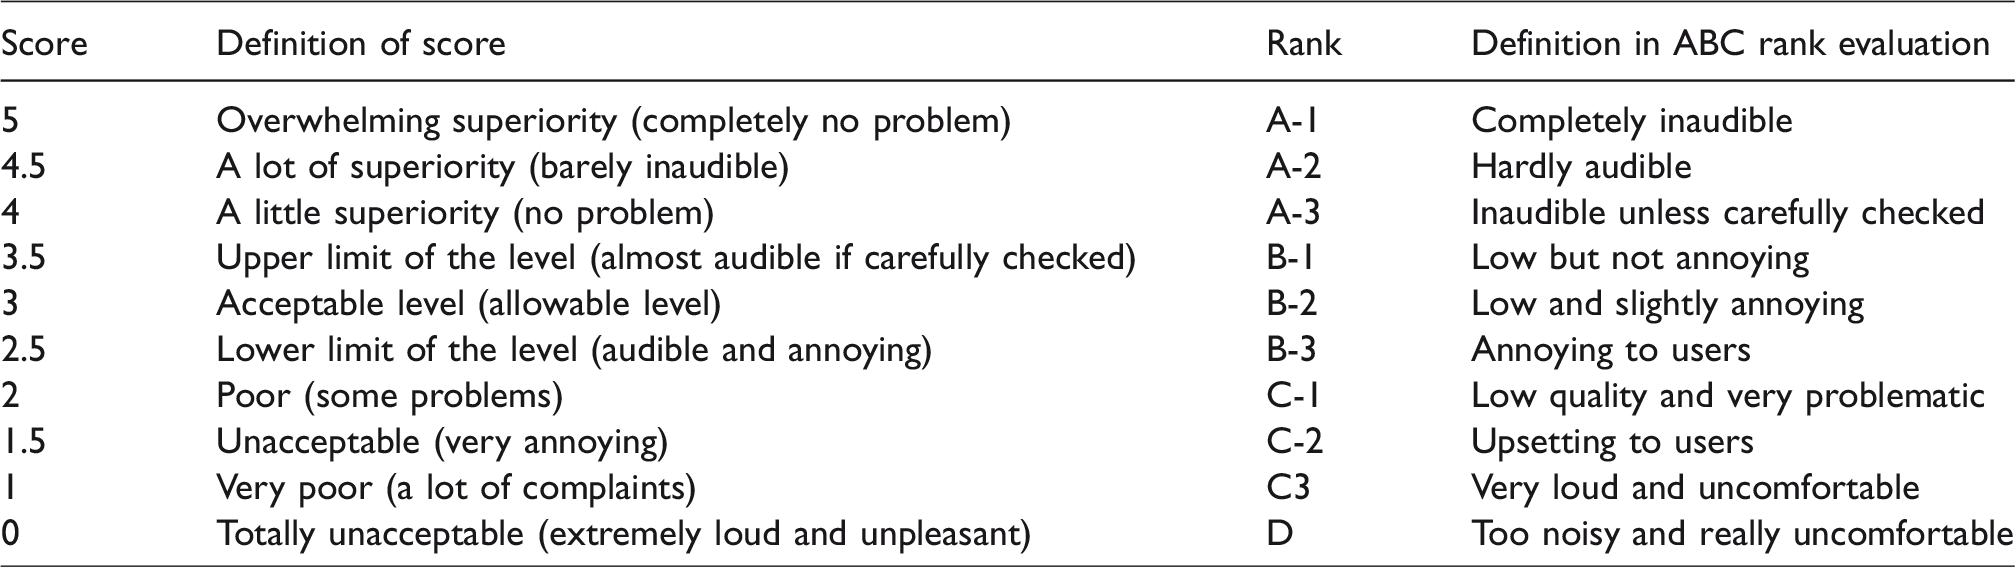
Subjective description and evaluation of vehicle noise for pure electric vehicles is different from conventional vehicles. As such, it is necessary to control the electric motor system’s noise levels at different frequency bands. Table 1 shows a method of vehicle noise evaluation in which elements are scored out of a total of five possible points.
Subjective detailed evaluation rule of vehicle noise (scores out of five).
Subjective evaluation results
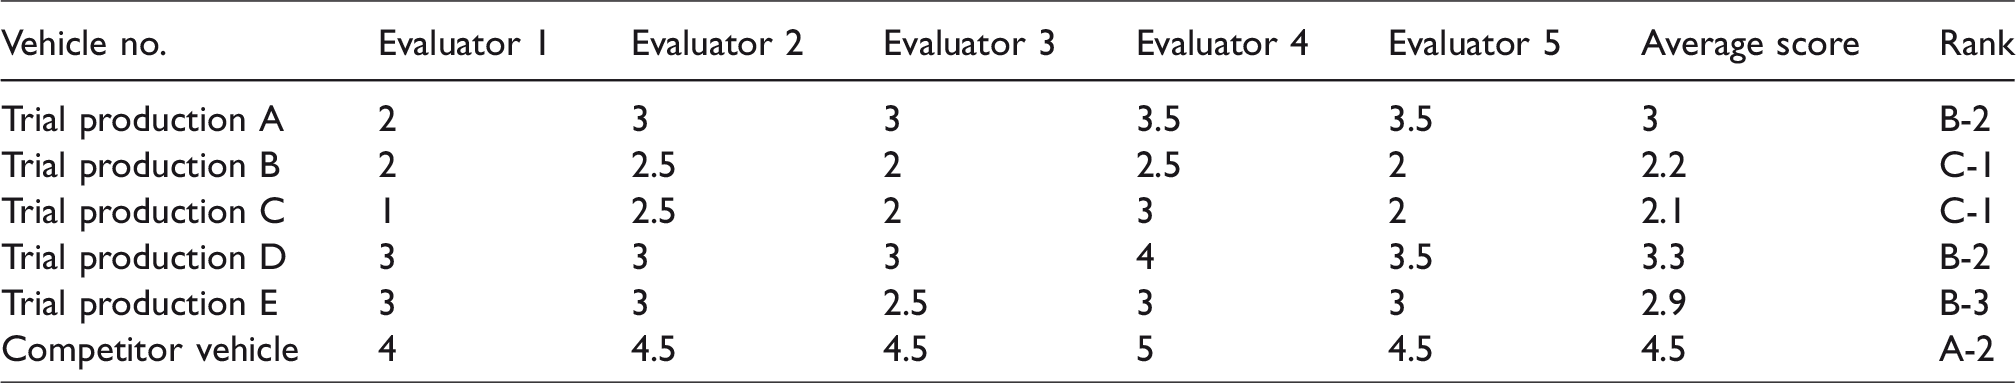
In order to use the grading method and score rules shown in Table 1, we prepared five pure electric vehicle samples. They were parked one day ahead of evaluation and left through the whole evening to ensure the evaluation on the next day would be a cold start. Five professional engineers were organized to provide subjective evaluations of vehicle noise from the AC compressor. The organizers explained to the evaluators in advance that they would not be able to discuss their findings with each other until all five vehicles had been evaluated and the evaluation forms were handed over to the organizers. For the assessment, everyone sat in the vehicle and shut all the doors and windows. The evaluation time was restricted to 1 min because after this time the AC compressor can overheat and cause the cooling fan to activate, meaning there is more than one source of noise that could interfere with the evaluation results. It must be emphasized that in this assessment we adopted the method of blind review – each evaluator completed the work independently and with the vehicles known only as vehicles A, B, C, D and E. All results of the evaluation scores were collected, and were averaged and summarized by the noise evaluation organizer.
As shown in Table 2, based on the criteria in Table 1 three of the five vehicles’ average scores are under 3 points; in other words, 60% of the evaluation samples are were considered to be unsatisfactory, and the highest score is only 3.3 points. Among the trial vehicles, B and C ranked below the lower level of acceptability, under 2.5 points, which is bothering and annoying to customers. On the contrary, the AC compressor subjective noise evaluation average score of the competitor vehicle, at 4.5 points (rank A-2; a lot of superiority), is much higher than the 2.7 points of all five trial production vehicles. Therefore, the abnormal noise problem of the trial vehicle’s AC compressor at idle must be improved.
Subjective evaluation score of AC compressor abnormal noise at idle.
Based on all trial production vehicles’ evaluation scores, in order to find out the cause of the abnormal noise and confirm whether the source is the AC compressor or not, after combining all evaluations of the five professional engineers we chose trial vehicle C as the subject for the remaining work, including quantitative measurement, diagnosis and analysis.
Noise mechanism analysis for vehicle cabin and framework
As illustrated in Figure 1, the main contribution of the AC compressor to the overall noise generally comes from the compressor itself and its components because of connections to the vehicle body – directly or indirectly – such as pipes, brackets and so on. These produce all kinds of aerodynamic, hydraulic and mechanical noises. We must also consider the acoustic propagation’s coupling effect from the position of the AC compressor in relation to the interior vehicle cabin.
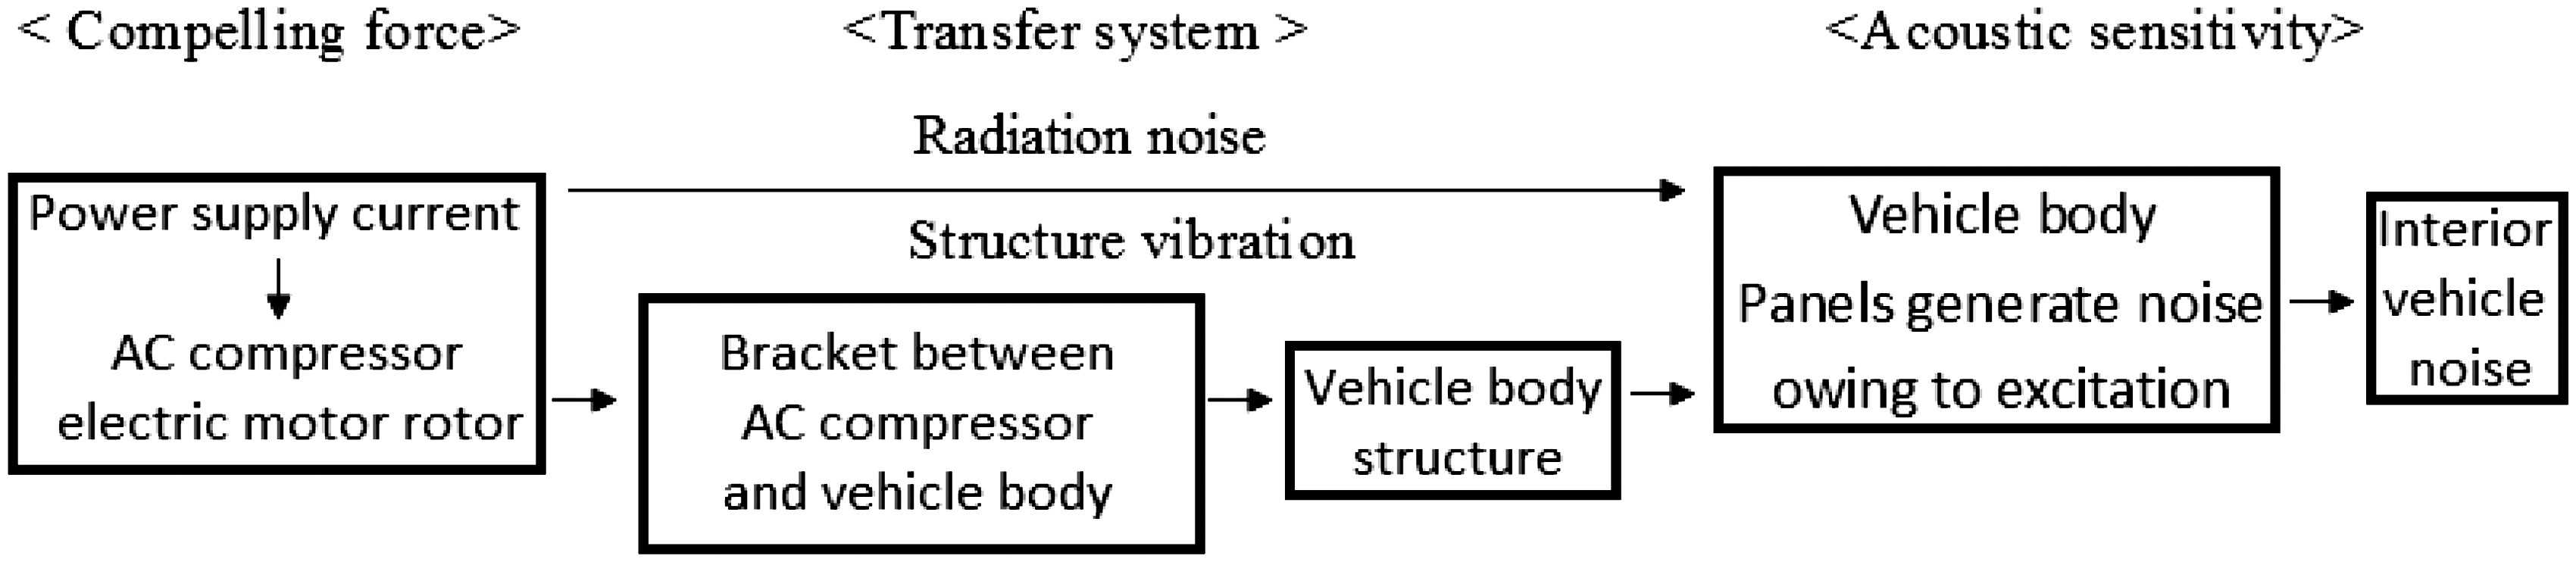
AC compressor noise-generation mechanism and its transfer path.
So in addition to measuring the sound pressure level (SPL) and frequency spectrum of the AC compressor’s nearfield and the driver’s ear, still according to the acoustic wave equation, the pure electric vehicle cabin’s structure mode frequencies could also be computed.
Sound source identification
The theoretical background of sound source propagation calculation and identification
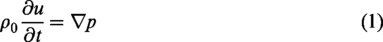
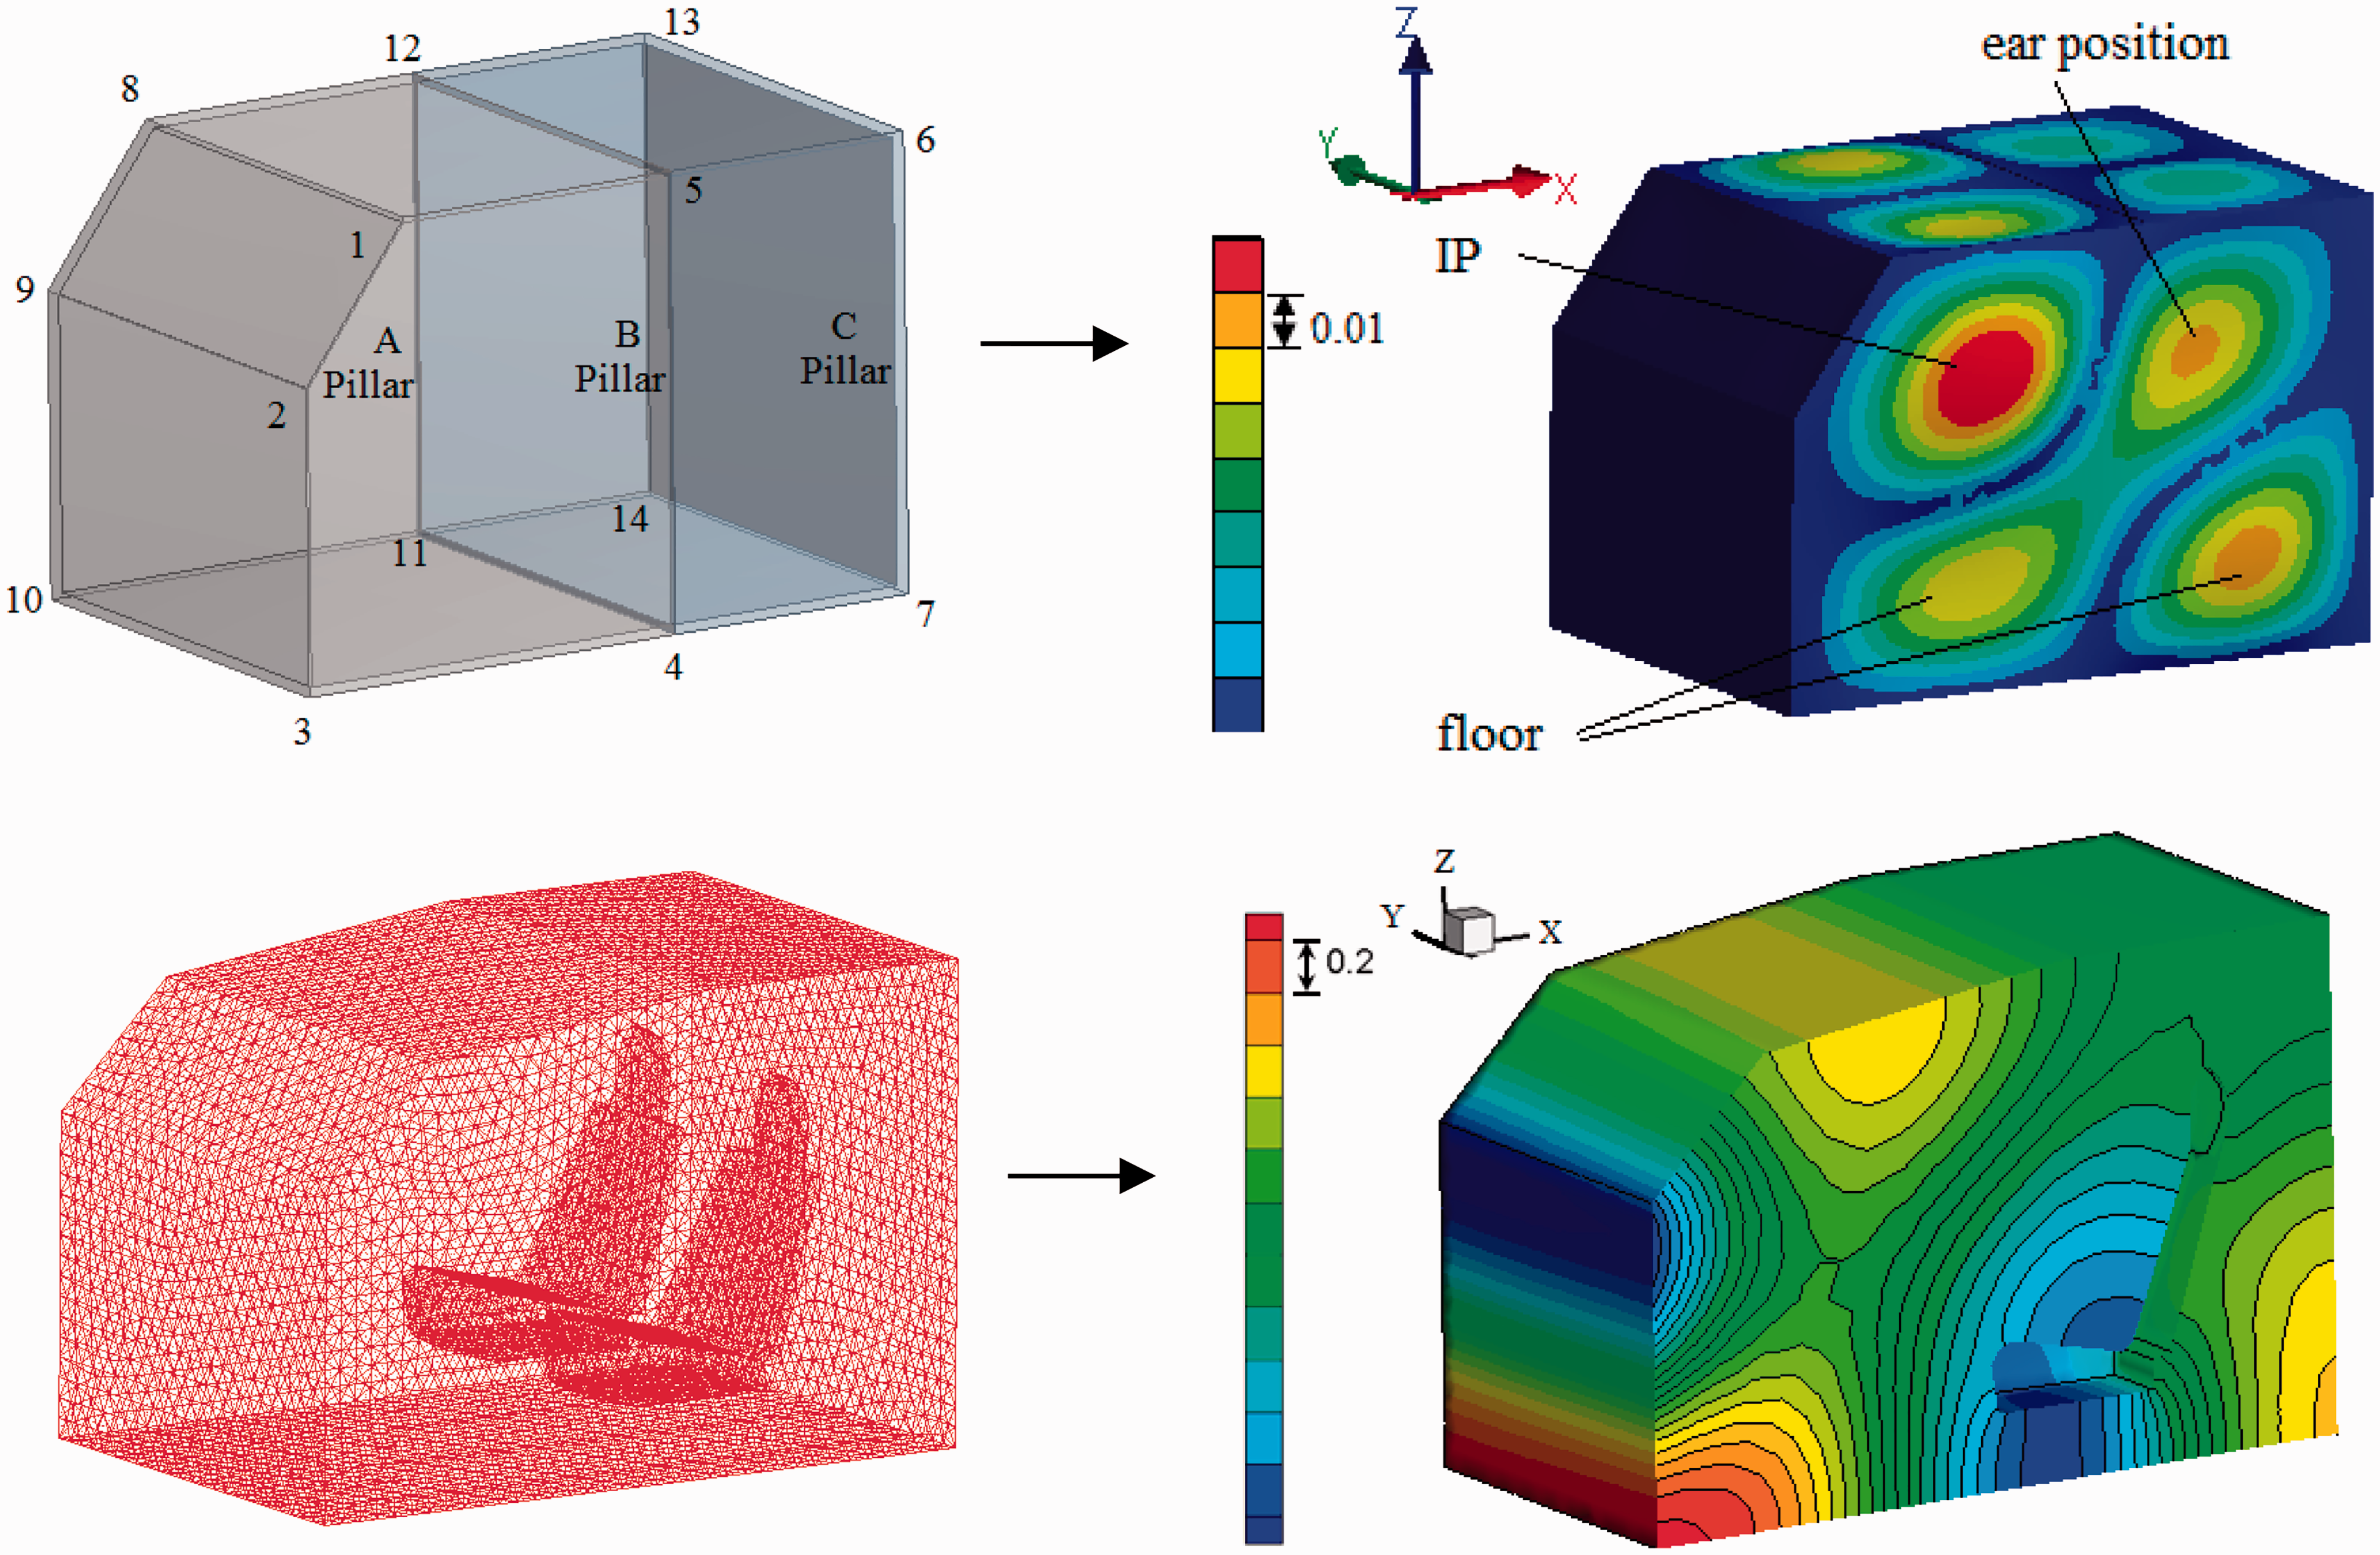
In air, the three-dimensional acoustical kinematic equations and the continuity equation are as shown in equations (1) and (2)
For the absorbent boundaries, the mode shapes and natural frequencies are complex, and the acoustical modes are damped. In this case, when considering the impedance boundary condition

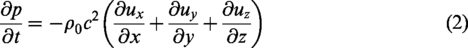
The key parts of the body frame 11 – referred to here as A pillar, B pillar, and C pillar – are shown in Figure 2(a). For example, on the left side of the vehicle cabin the three serial numbers and related coordinate values of A pillar are organized as 5(1.1, 0.0, 1.2), 1(0.3, 0.0, 1.1) and 2(0.0, 0.0, 8.0) respectively; similarly, two serial numbers and related coordinate values of B pillar are organized as 4(1.1, 0.0, 0.0) and 5(1.1, 0.0, 1.2), and another two serial numbers and related coordinate values of C pillar are organized as 6(1.8, 0.0, 1.2) and 7(1.8, 0.0, 0.0). A pillar, B pillar and C pillar on the right-hand side of the vehicle are obtained in the same manner: A pillar is organized as 12(1.1, 1.2, 1.2), 8(0.3, 1.2, 1.1) and 9(0.0, 1.2, 0.8); B pillar as 11(1.1 ,1.2, 0.0) and 12(1.1, 1.2, 1.2); and C pillar as 13(1.8, 1.2, 1.2) and 14(1.8, 1.2, 0.0). Connecting all the adjacent 14 points from point 1 to point 14 constructs the model of the line as shown in Figure 2(a), which is a kind of irregular polyhedron structure. With this, the structure mode shape and its corresponding frequencies can be calculated. 12
(a) Pure electric vehicle frame model(left)and structure mode shape (right) at about 240 Hz. (b) Pure electric vehicle body FEM model(left)and sound pressure field distribution (right) at about 240 Hz.
As shown in Figure 2(a), through the analysis of simulation results, it is found out there exists a mode shape of approximately 240 Hz frequency, whose displacement deformations are mainly concentrated in areas such as the instrument panel (IP), the front seat near the human ear position and the floor between the front and back, which is likely to cause structural resonance. The most notable locations are the IP and the seat near the human ear position, whether the phenomena of sound pressure concentration happens or not. Therefore, when controlling the noise and vibration response in the vehicle cabin, it should first be checked whether the vehicle body’s mode shape leads to vehicle panel vibration and produces the interior noise owing to structural excitation and deformation, which will indicate the direction of investigation and the countermeasures for improving the interior vehicle noise.
With the use of this numerical computation method, 13 the vehicle body FEM model with two seats was constructed, as shown Figure 2(b). Thus, the sound pressure distribution simulation contour is as shown in Figure 2(b), and the sound pressure concentration places the eigenfrequency at about 240 Hz, located mainly in the AC compressor vent of the IP, which also suggests the direction of investigation and problem solving. General speaking, with regards to the shell structure of the AC compressor, the natural frequencies most likely fall in the region of 200–300 Hz. If this is the case, it couples easily with the eigenfrequency of the vehicle body cavity and leads to some degree of structural resonance and may generate a kind of long-term abnormal noise.
In order to further diagnose the issue, first combined with the subject evaluation definitions of Table 1 and subjective evaluation scores of Table 2, especially referring to evaluation benchmark of the competitor vehicle’s AC compressor noise performance in Table 1, the following comments on quantitative tests are necessary. Although the noise frequency spectrum analysis method is very commonly a useful tool that states briefly the peak amplitude at the critical frequency band, it could not provide more details about the spatial sound field radiating from the AC compressor. Moreover, we cannot identify target sound sources with complicated shapes accurately and locate sound sources on the frequency spectrum. By using PULSE Reflex software and Acoustic Camera Type 9712-W-FEN, which is equally suited to noise troubleshooting in vehicles, for example in the field of all kinds of abnormal noise phenomenon buzz, squeak, and rattle (BSR) detection. 14
As illustrated in Figure 3, we consider the array of M microphones at locations rm (m = 1, 2, …, M) in the coordinate system. For acoustic camera technology, through discrete sound source calculation surfaces forming a series of grid nodes, when focusing reversely on each grid node the summation algorithm based on the delay-and-sum beam-forming algorithm of each microphone sensor’s sound pressure signals of receiving ‘phase alignment’ and ‘sum operation’ enhance the true location of the sound source and weaken the other positions’ output, thus identifying the sound source. The sound pressure measured by the microphones will be

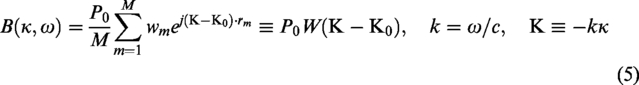
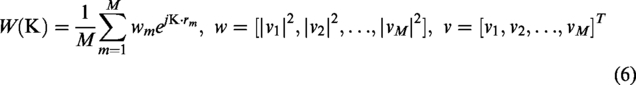
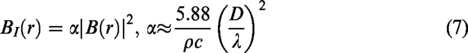
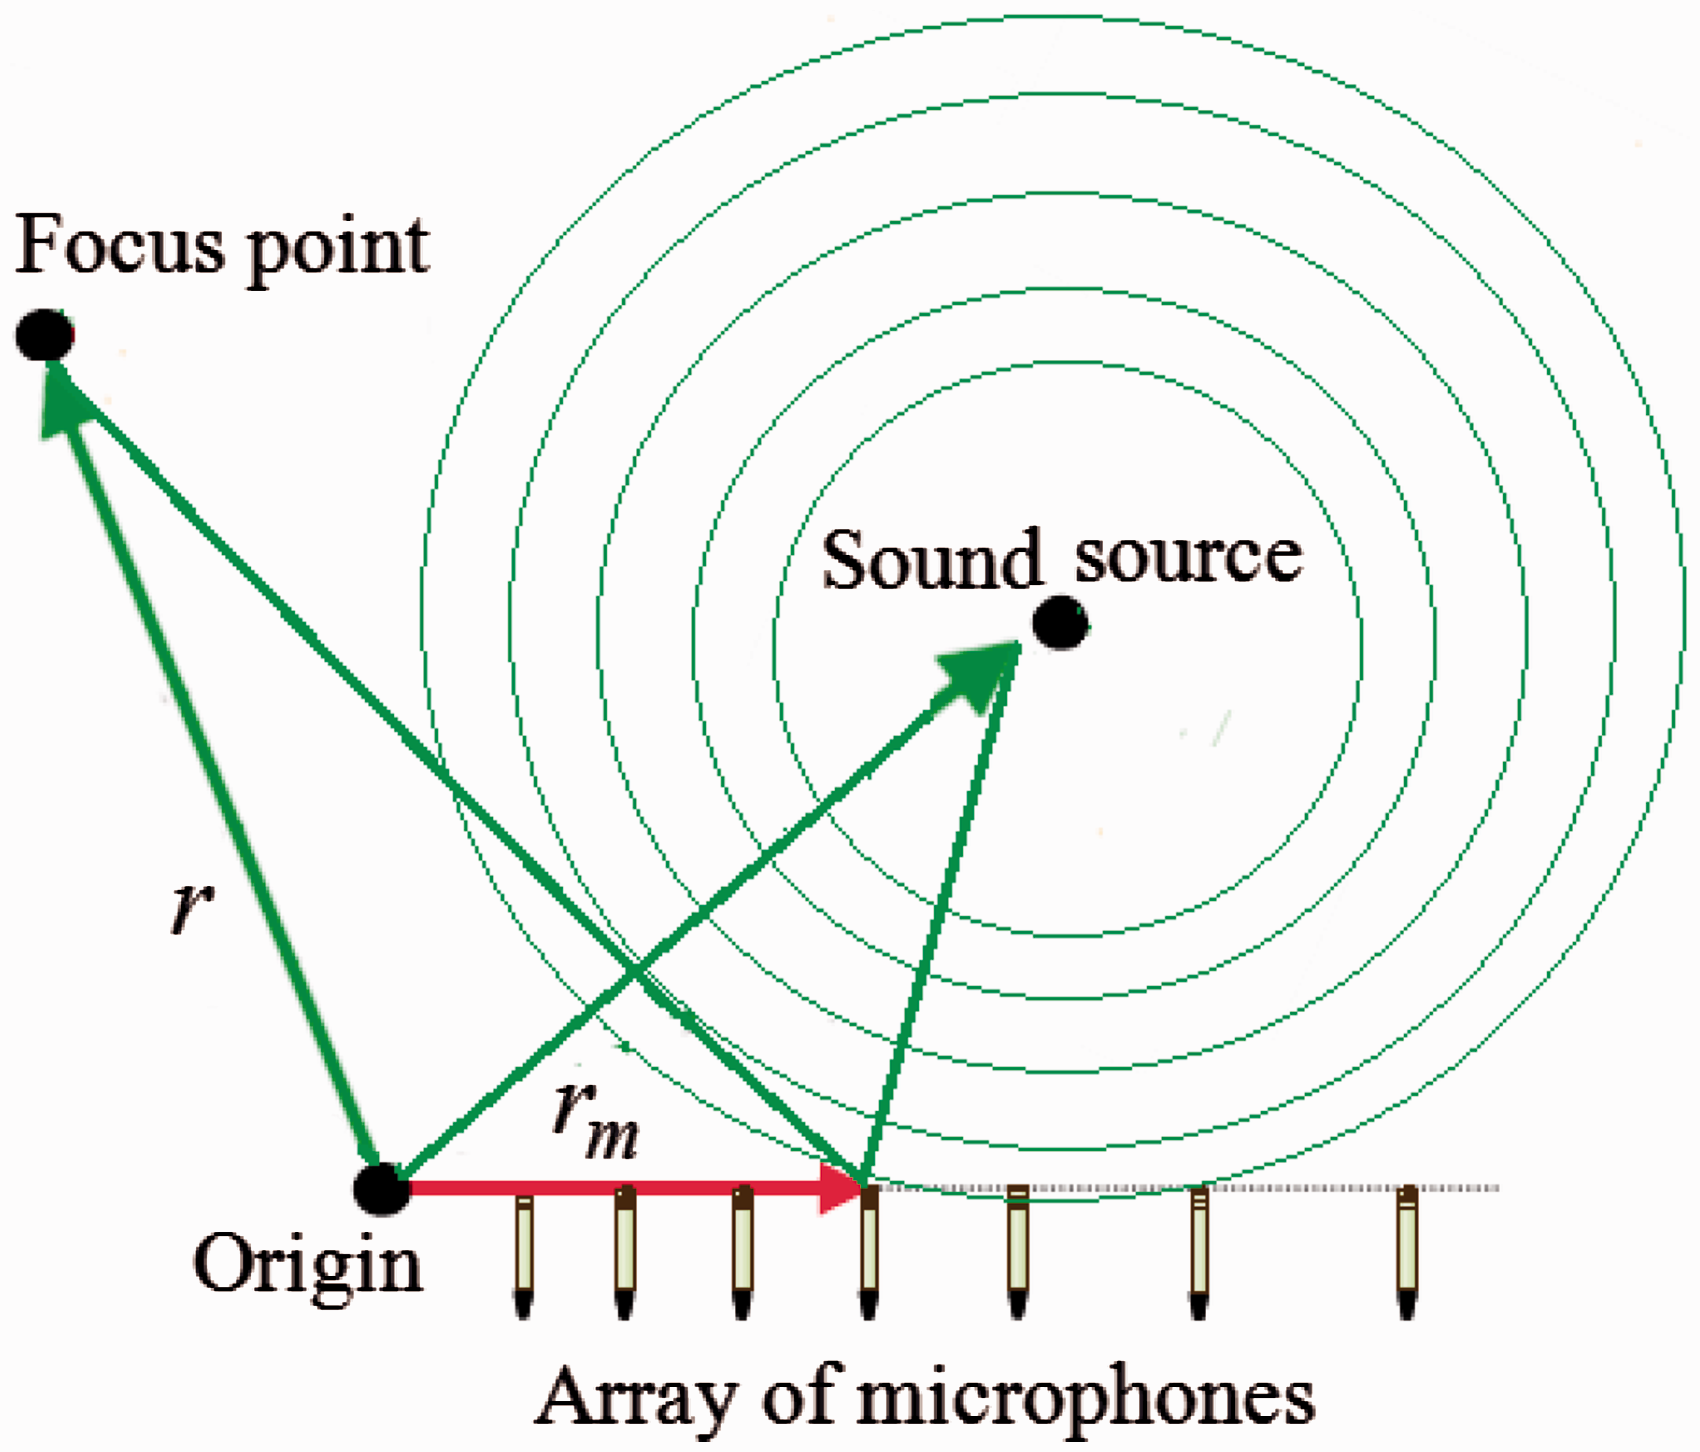
Illustration of sound source identification using an acoustic camera.
The measurement result of sound source identification
It is well known that for sound source identification the intensity method is the most fundamental solution, which is very convenient for noise troubleshooting and so is widely used in vehicle noise performance development. But as described in the previous section, the theoretical background is somewhat complicated.
As shown in Figure 4, when the AC compressor of a pure electric vehicle starts up at idle, with the help of the device acoustic camera, scanning and measuring the interior vehicle noise could quickly diagnose the location as the AC vent (also be part of the IP), and the frequency as nearly 250 Hz It needs to be noted that all visual test results were displayed synchronously.
Measurements on site in real time, locating sound sources and taking screenshots of the abnormal noise frequency domain.
Time and frequency domain analysis of abnormal noise
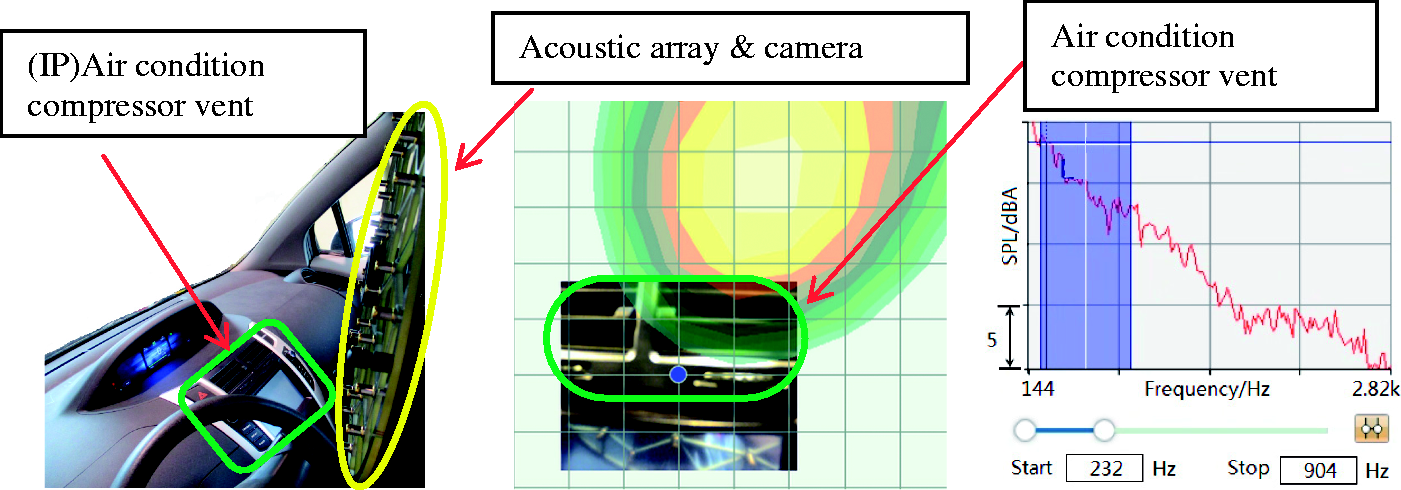
Figure 5 shows a comparison of the AC compressor noise data of the trial production vehicle in the time domain against the competitor vehicle at idle. In the initial 10 s following start-up, the overall SPL of the trial production vehicle is more that 5–10 dB (A) greater than that of the competitor vehicle; at about 10–20 s, the trial production vehicle is still approximately more than 5 dB (A) greater than the competitor, and the trial production vehicle’s noise time-varying fluctuation values are about 5 dB (A) greater than those of the competition vehicle. However, after start-up, at about 8 s, the competitor vehicle’s AC compressor noise is basically constant over time. As shown in Figure 6(a), the noise spectrum of the start-up initial stage of the AC compressor, the trial production vehicle’s SPL is much larger than the competition vehicle in the whole of the frequency range, but Figure 6(b) also shows the noise spectrum comparison when the AC compressor is in the stable working condition, and the trial production vehicle’s SPL peak appears to be nearly 250 Hz.
Sound pressure level in the time domain of at idle.
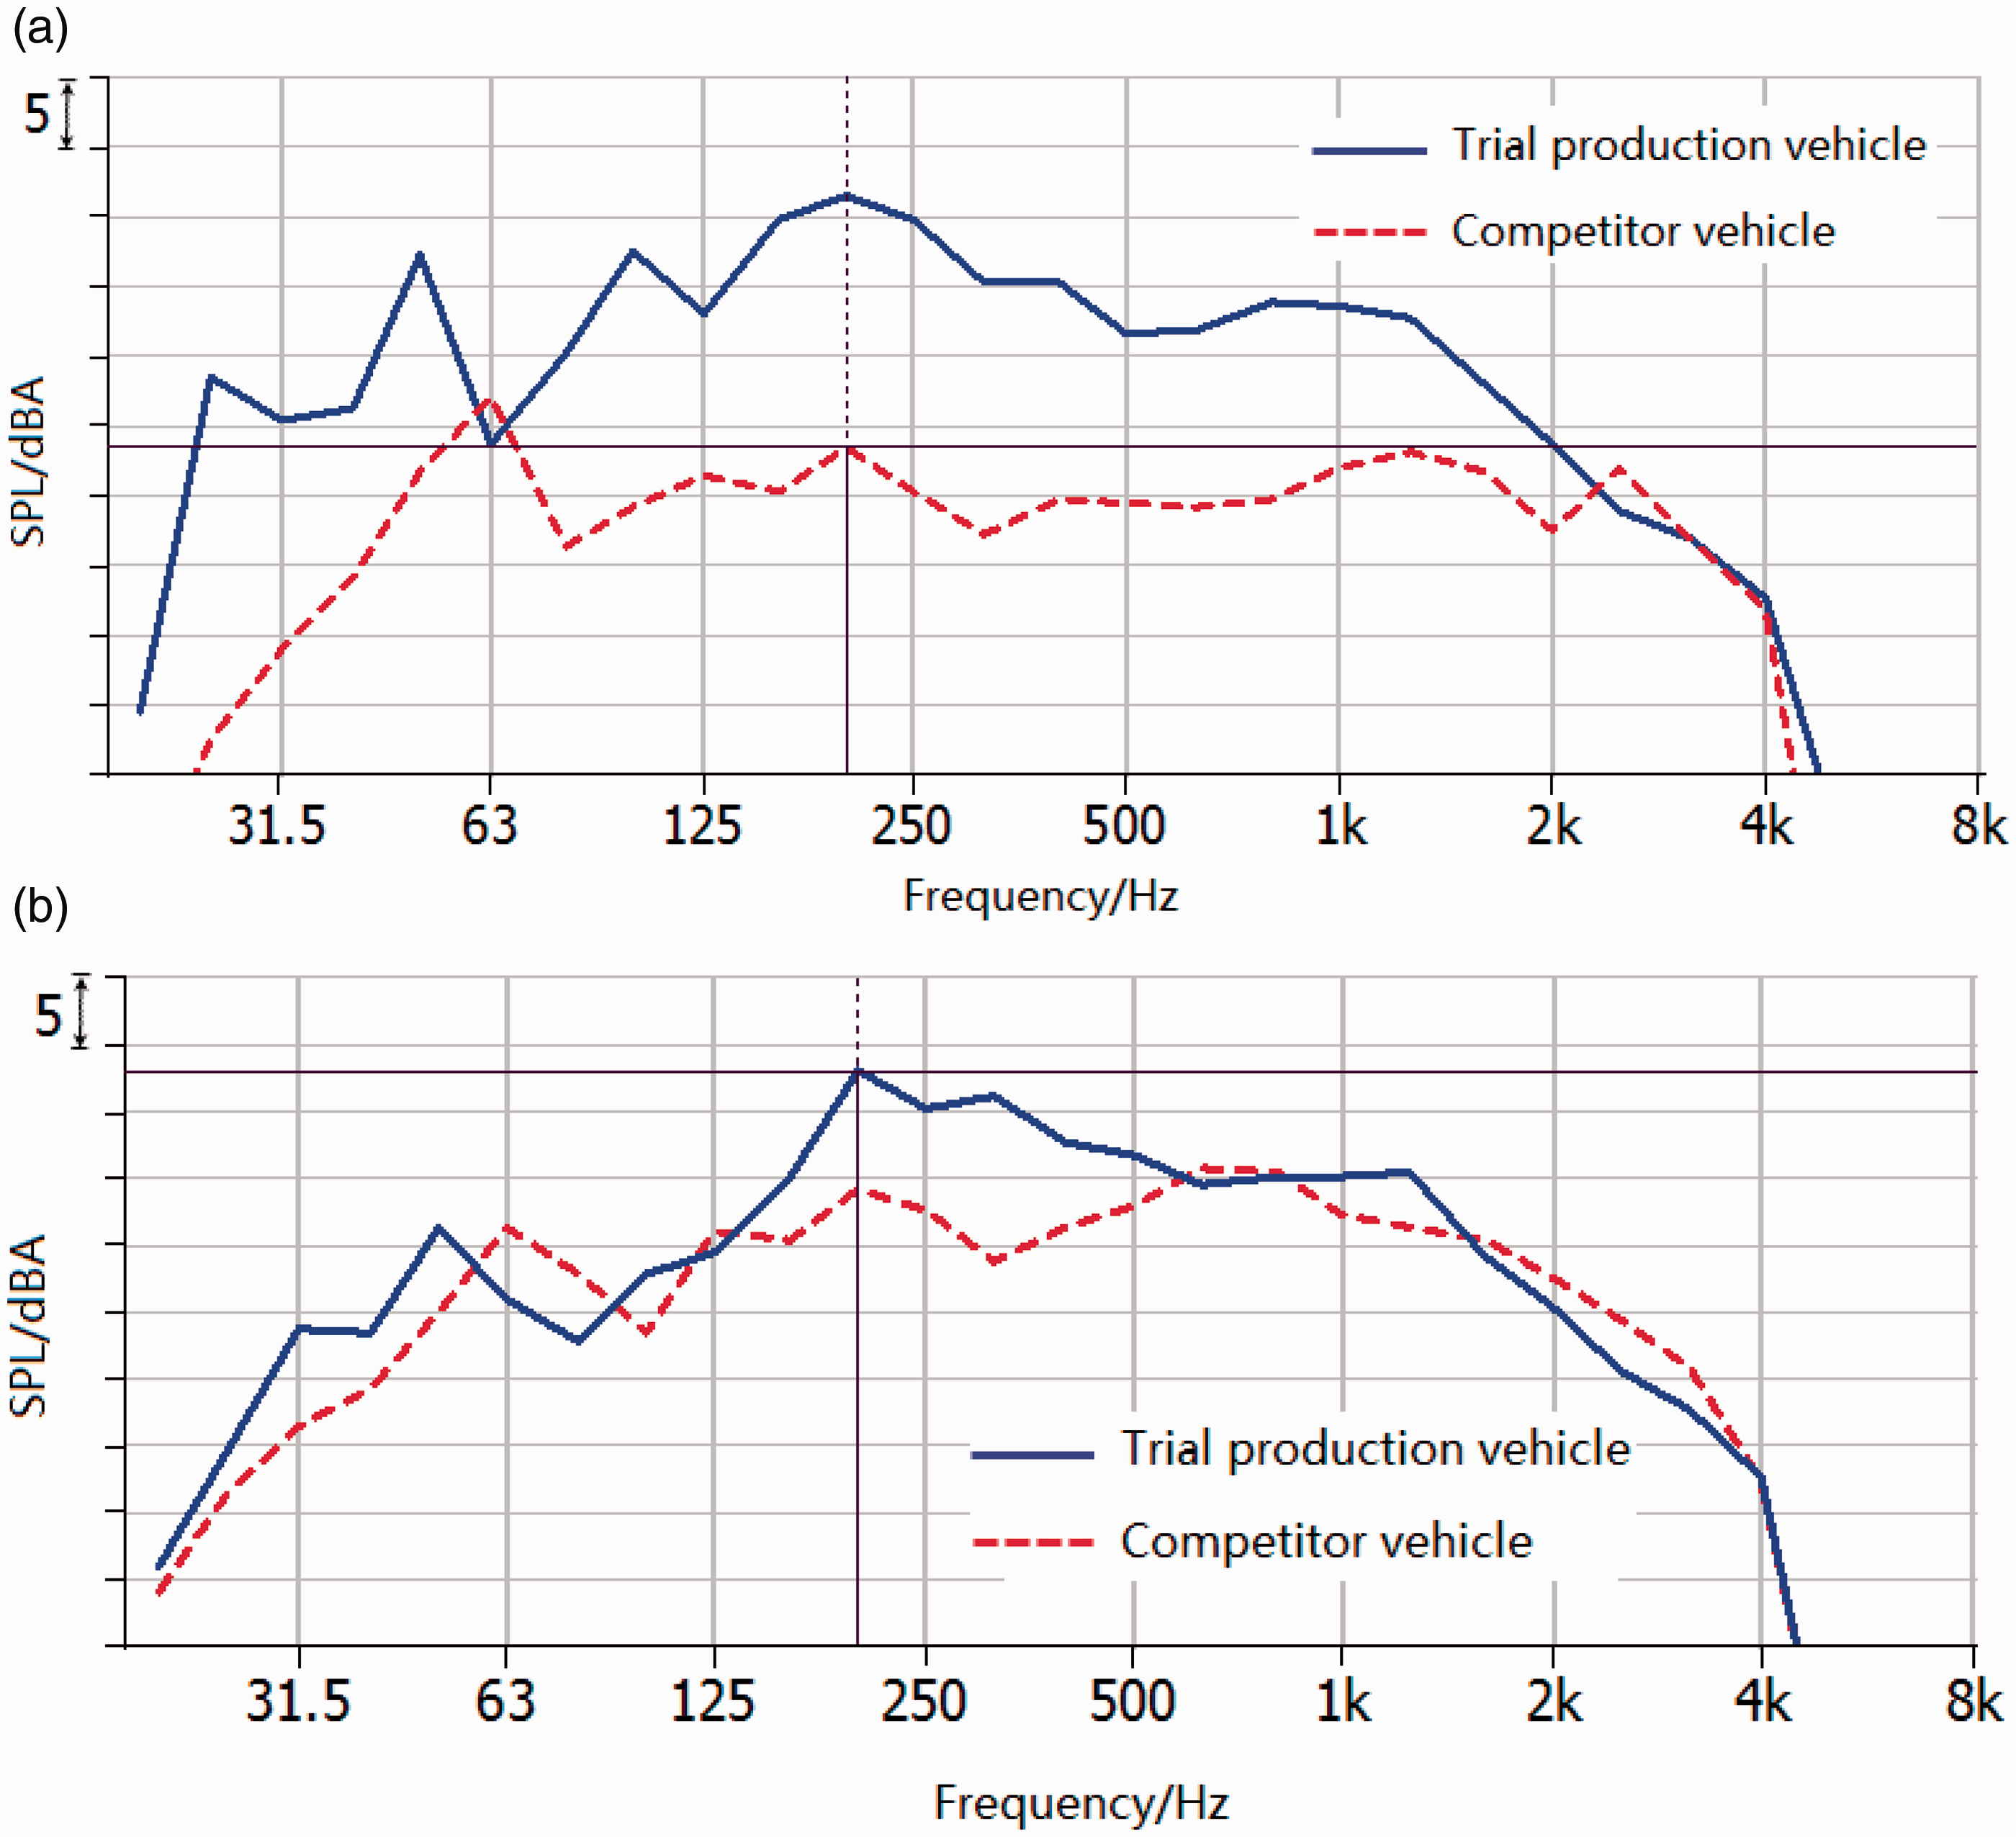
(a) Sound pressure level–frequency spectrum in the start-up initial stage. (b) Sound pressure level–frequency spectrum in the start-up steady stage.
It is concluded that, on the one hand, the total SPL should be well controlled at the initial stage of the AC compressor and, on the other hand, that the focus should be on how to solve the problem of the noise peak value at nearly 250 Hz.
Sound filter analysis
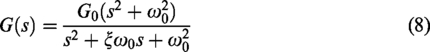
In the critical frequency range of 200–300 Hz, which constitutes the main range in this case, a band-stop filter method could be adopted, such as collection of the 160–400 Hz frequency band signal after filtration processing, comparing the original signal and the signal after filtering. The analysis shows that the peak noise filtered out the main frequency band, and the abnormal noise is eliminated very obviously. This thus points out the correct direction for the next improvement. For example, the transfer function’s definition formula of the second-order Butterworth band-stop filter is
Sound quality analysis
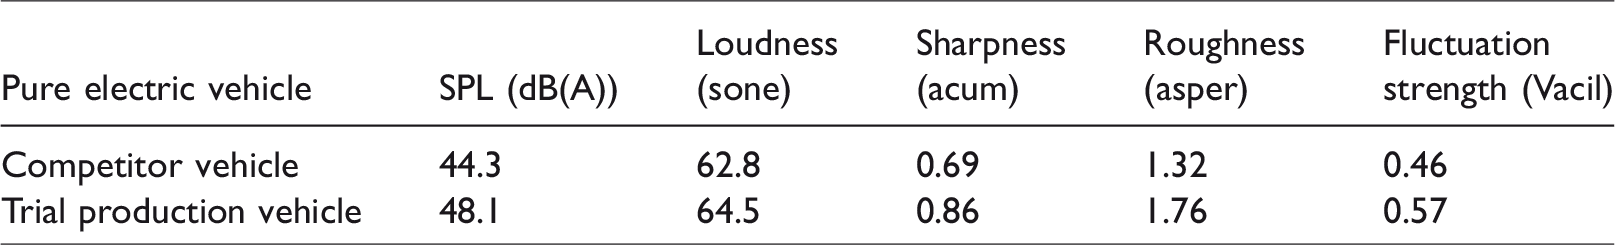
As shown in Figure 7(a–d), in all four sound quality indices, including loudness, sharpness, roughness and fluctuation strength, there exist remarkable differences between the trial production and competitor vehicles. 16 As a result, sound quality objective test results are identical to the subjective scores, as shown in Table 3.
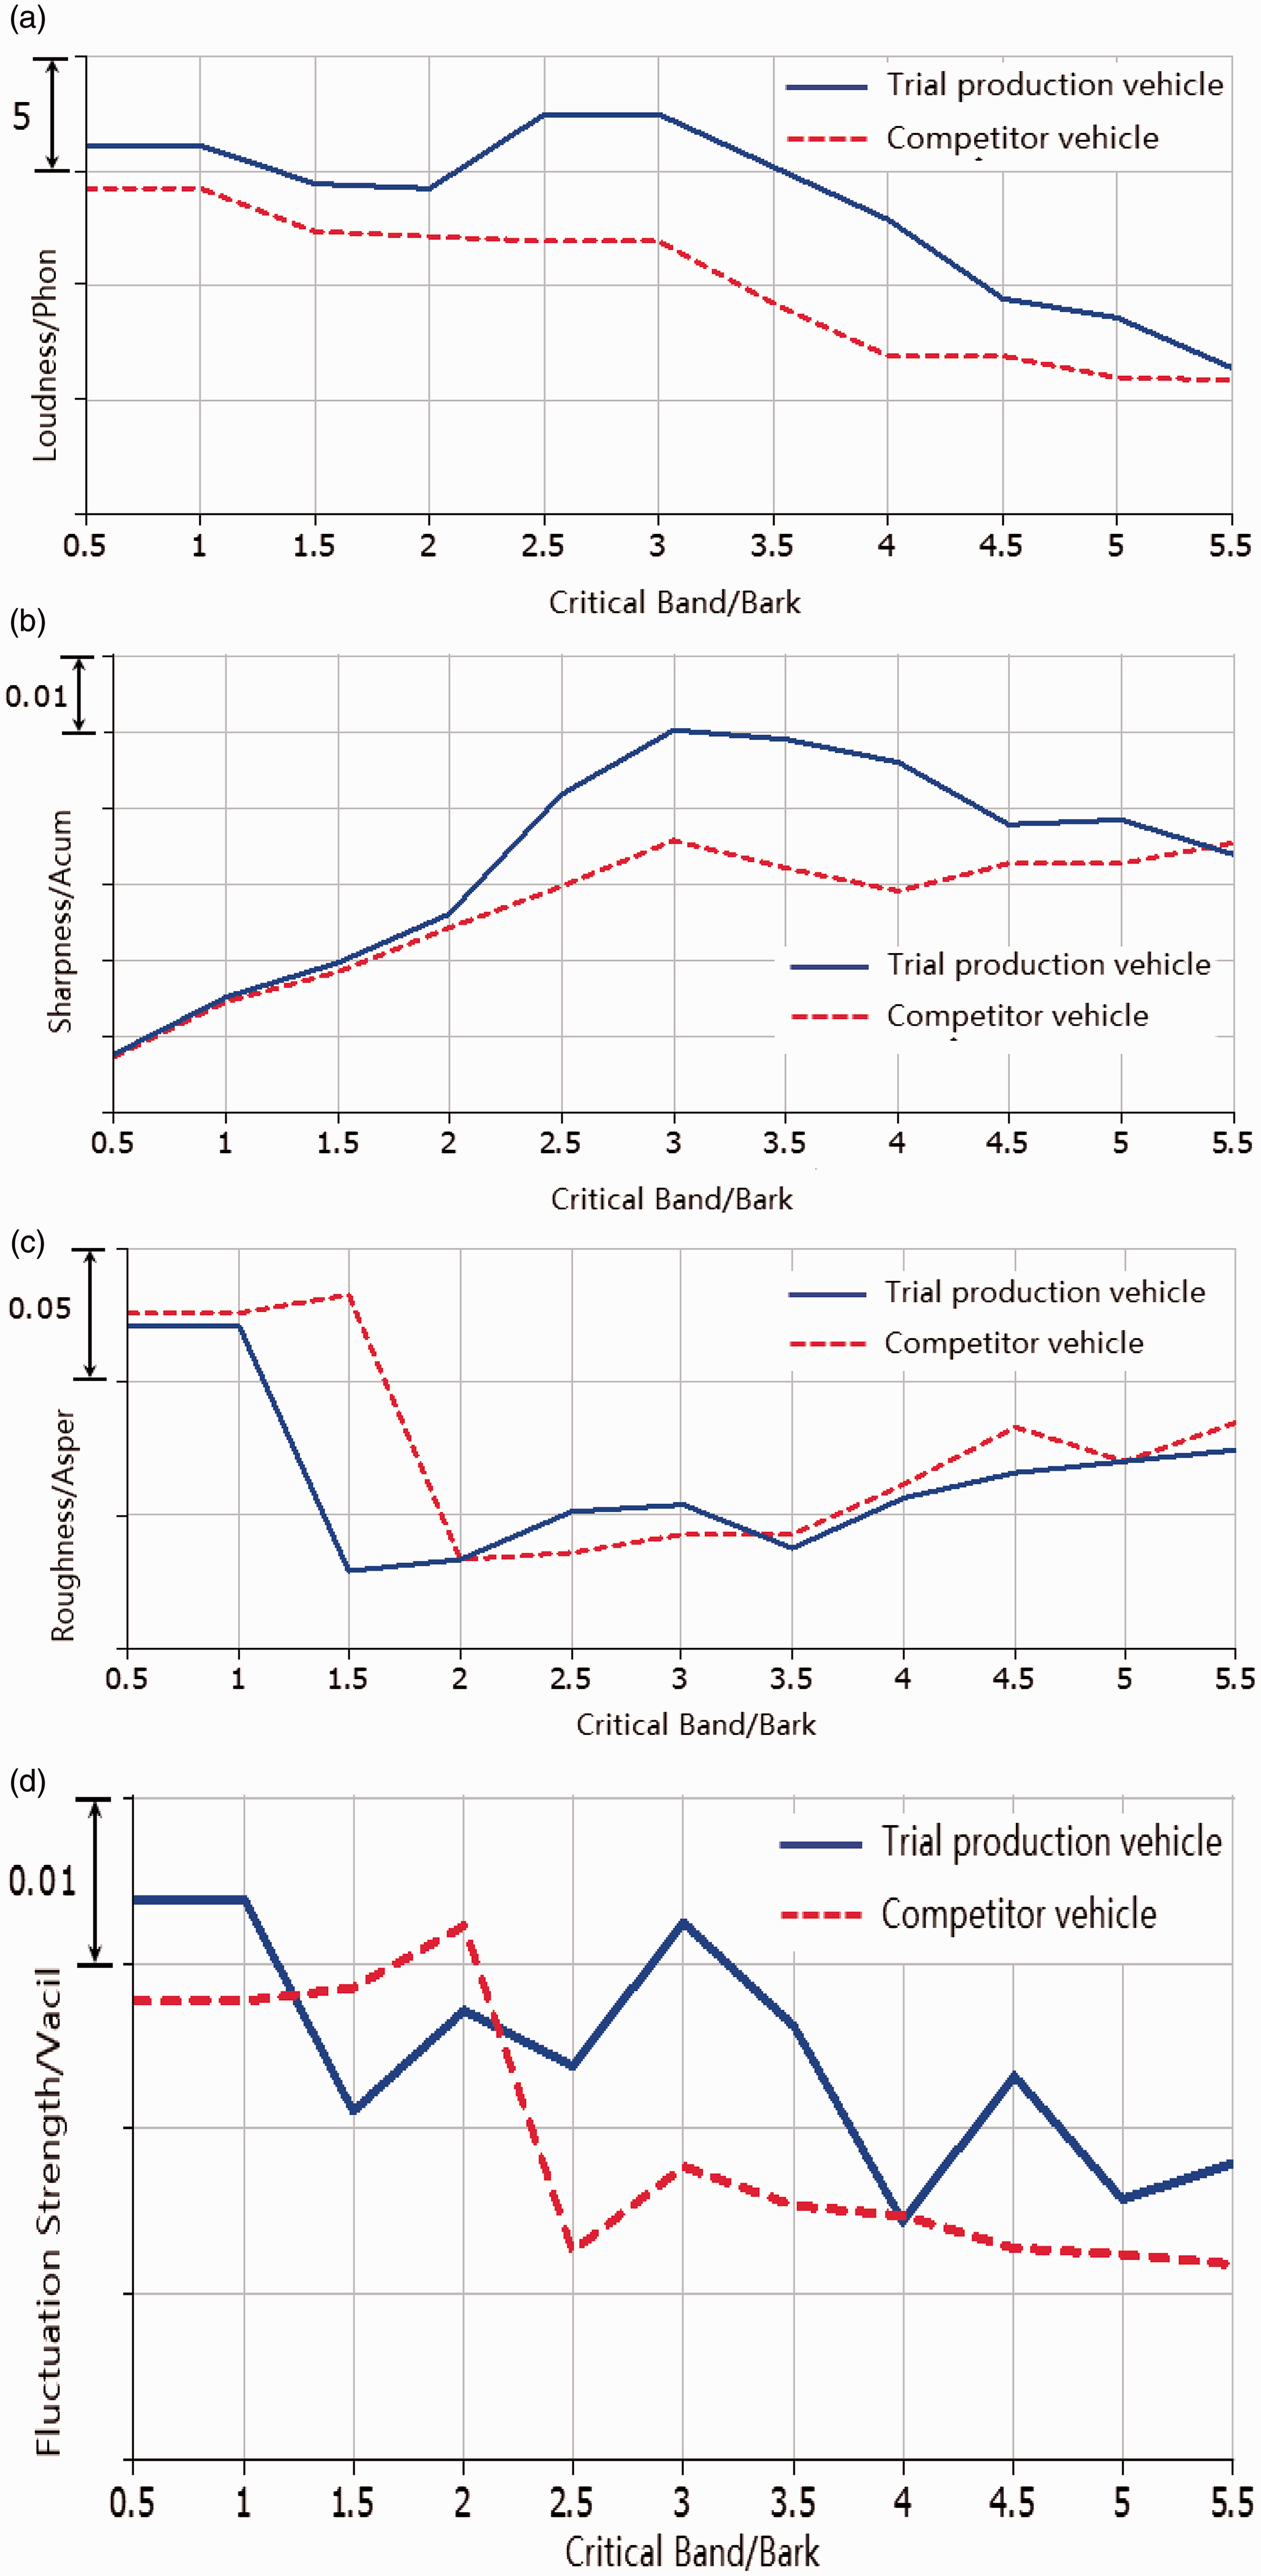
Sound quality index measurement results comparison (a) Loudness curve. (b) Sharpness curve. (c) Roughness curve. (d) Fluctuation strengthen curve.
Sound pressure level and sound quality index.
Structure analysis and improvement effect validation
Structure frequency response analysis
As shown in Figures 8 and 9, the vibration frequency response test results show that in the comparison of the trial and competitor AC compressors, there are two obvious peak values at about 50 Hz and 250 Hz in the trial AC compressor. As noted for Figures 5 and 6, which is the mutual correspond to the noise frequency spectrum results with each other. On the other hand, the competitor vehicle’s force vibration frequency response measurement result shows there is a very small peak value only at about 450 Hz, but the noise peak value at the corresponding frequency is certainly very small. Similarly, as shown in Figure 8, in the idling and start-up working conditions, the AC compressor’s vibration measurement Figure 10 result for the trial production vehicle peak value frequency appears at about 250 Hz. Combined with the above two aspects of the measurement results, both frequency response and vibration, need to be improved in the AC compressor structural vibration response. 17
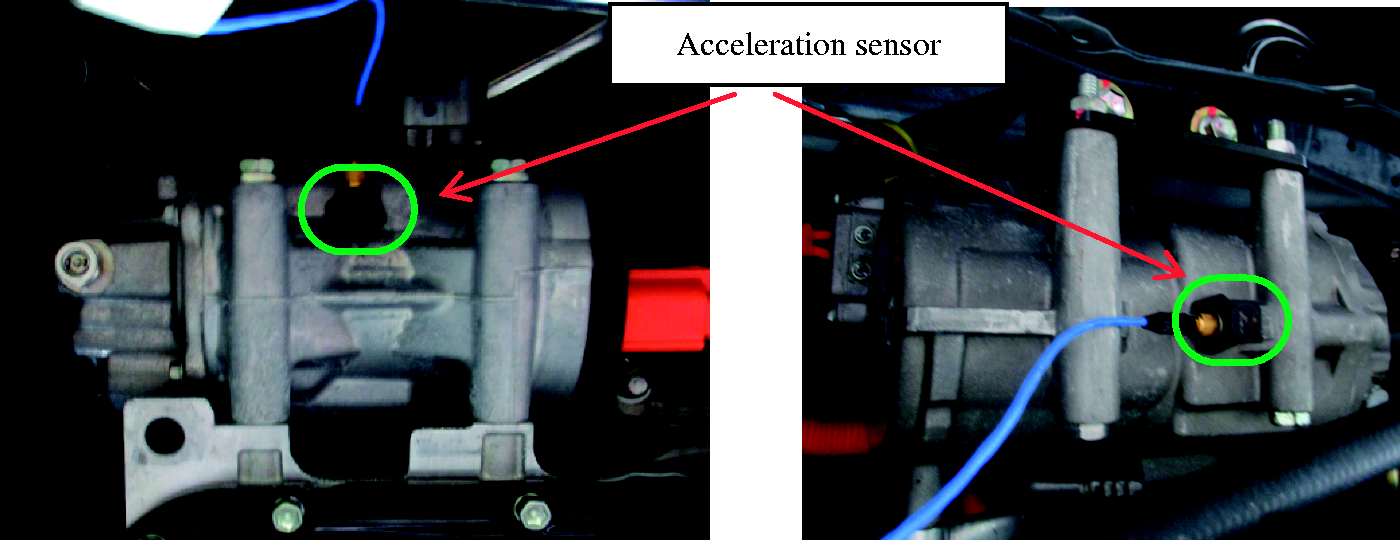
Air conditioning compressor of both competitor vehicle (left) and trial production vehicle (right).
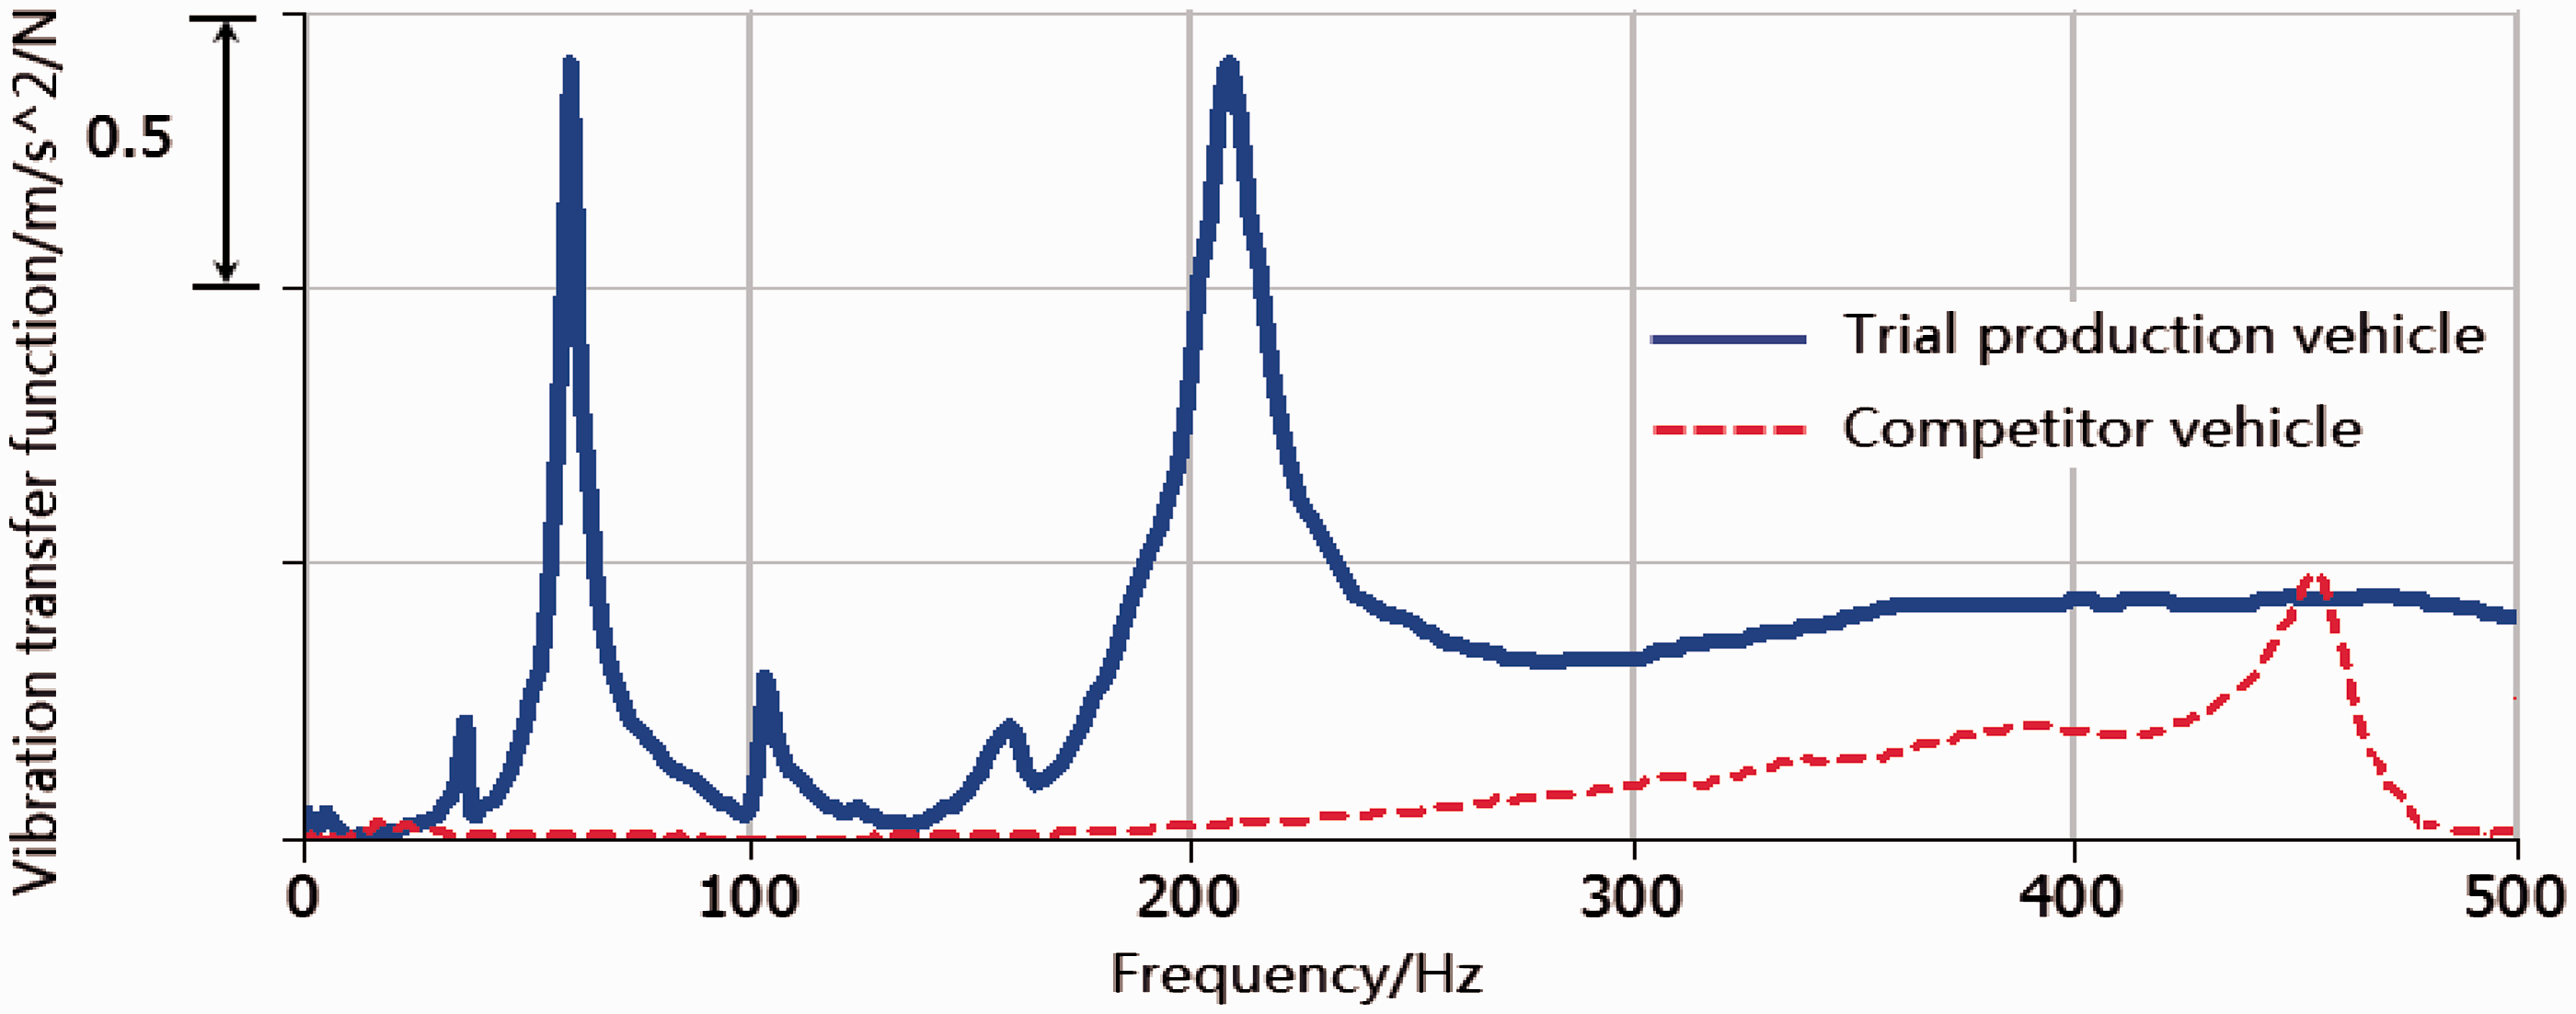
Vibration–force frequency response at the direction of the air conditioning compressor's rotor axial.
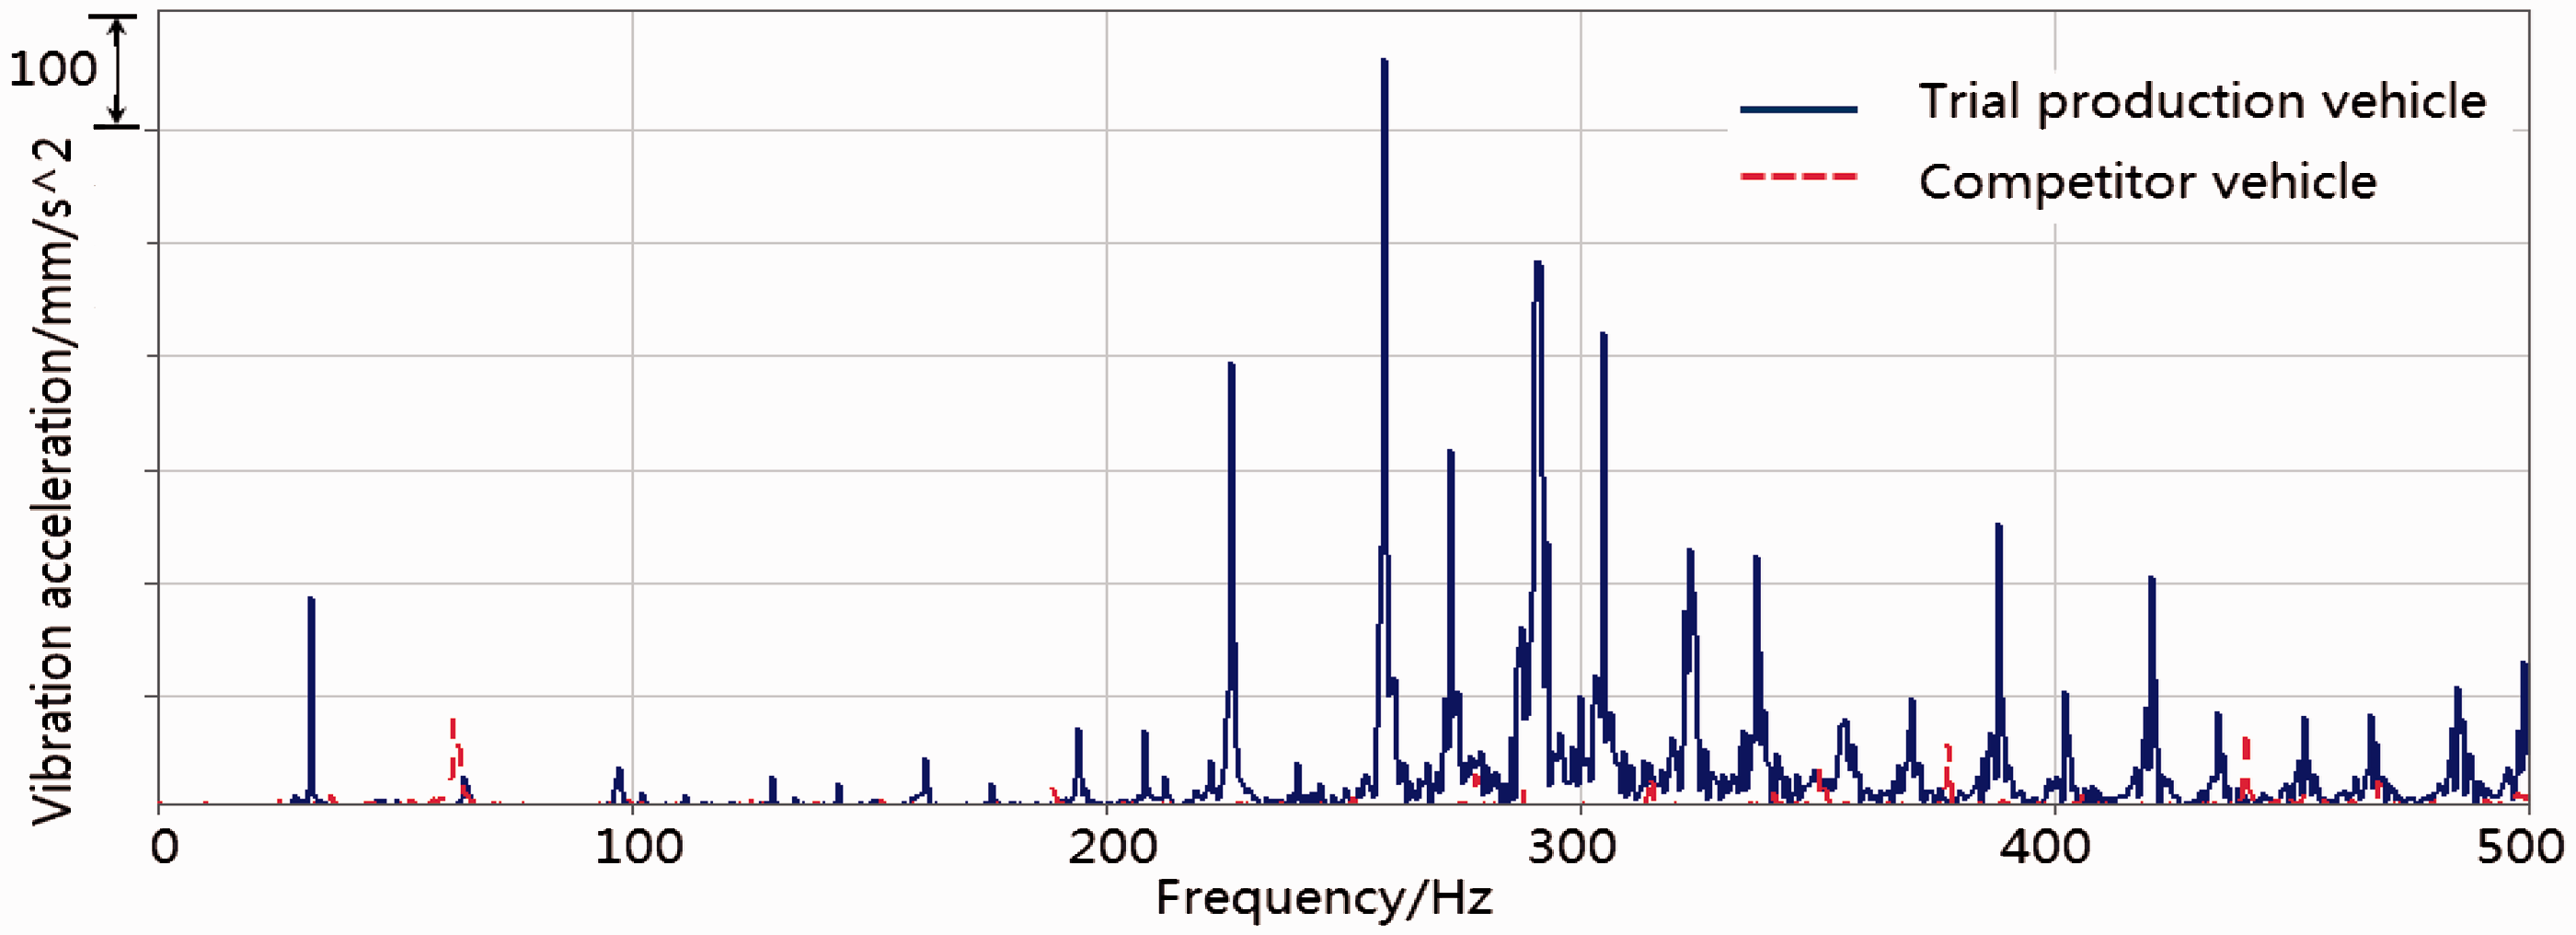
Vibration acceleration measurement results comparing the AC compressor for trial production and competitor vehicle at idle
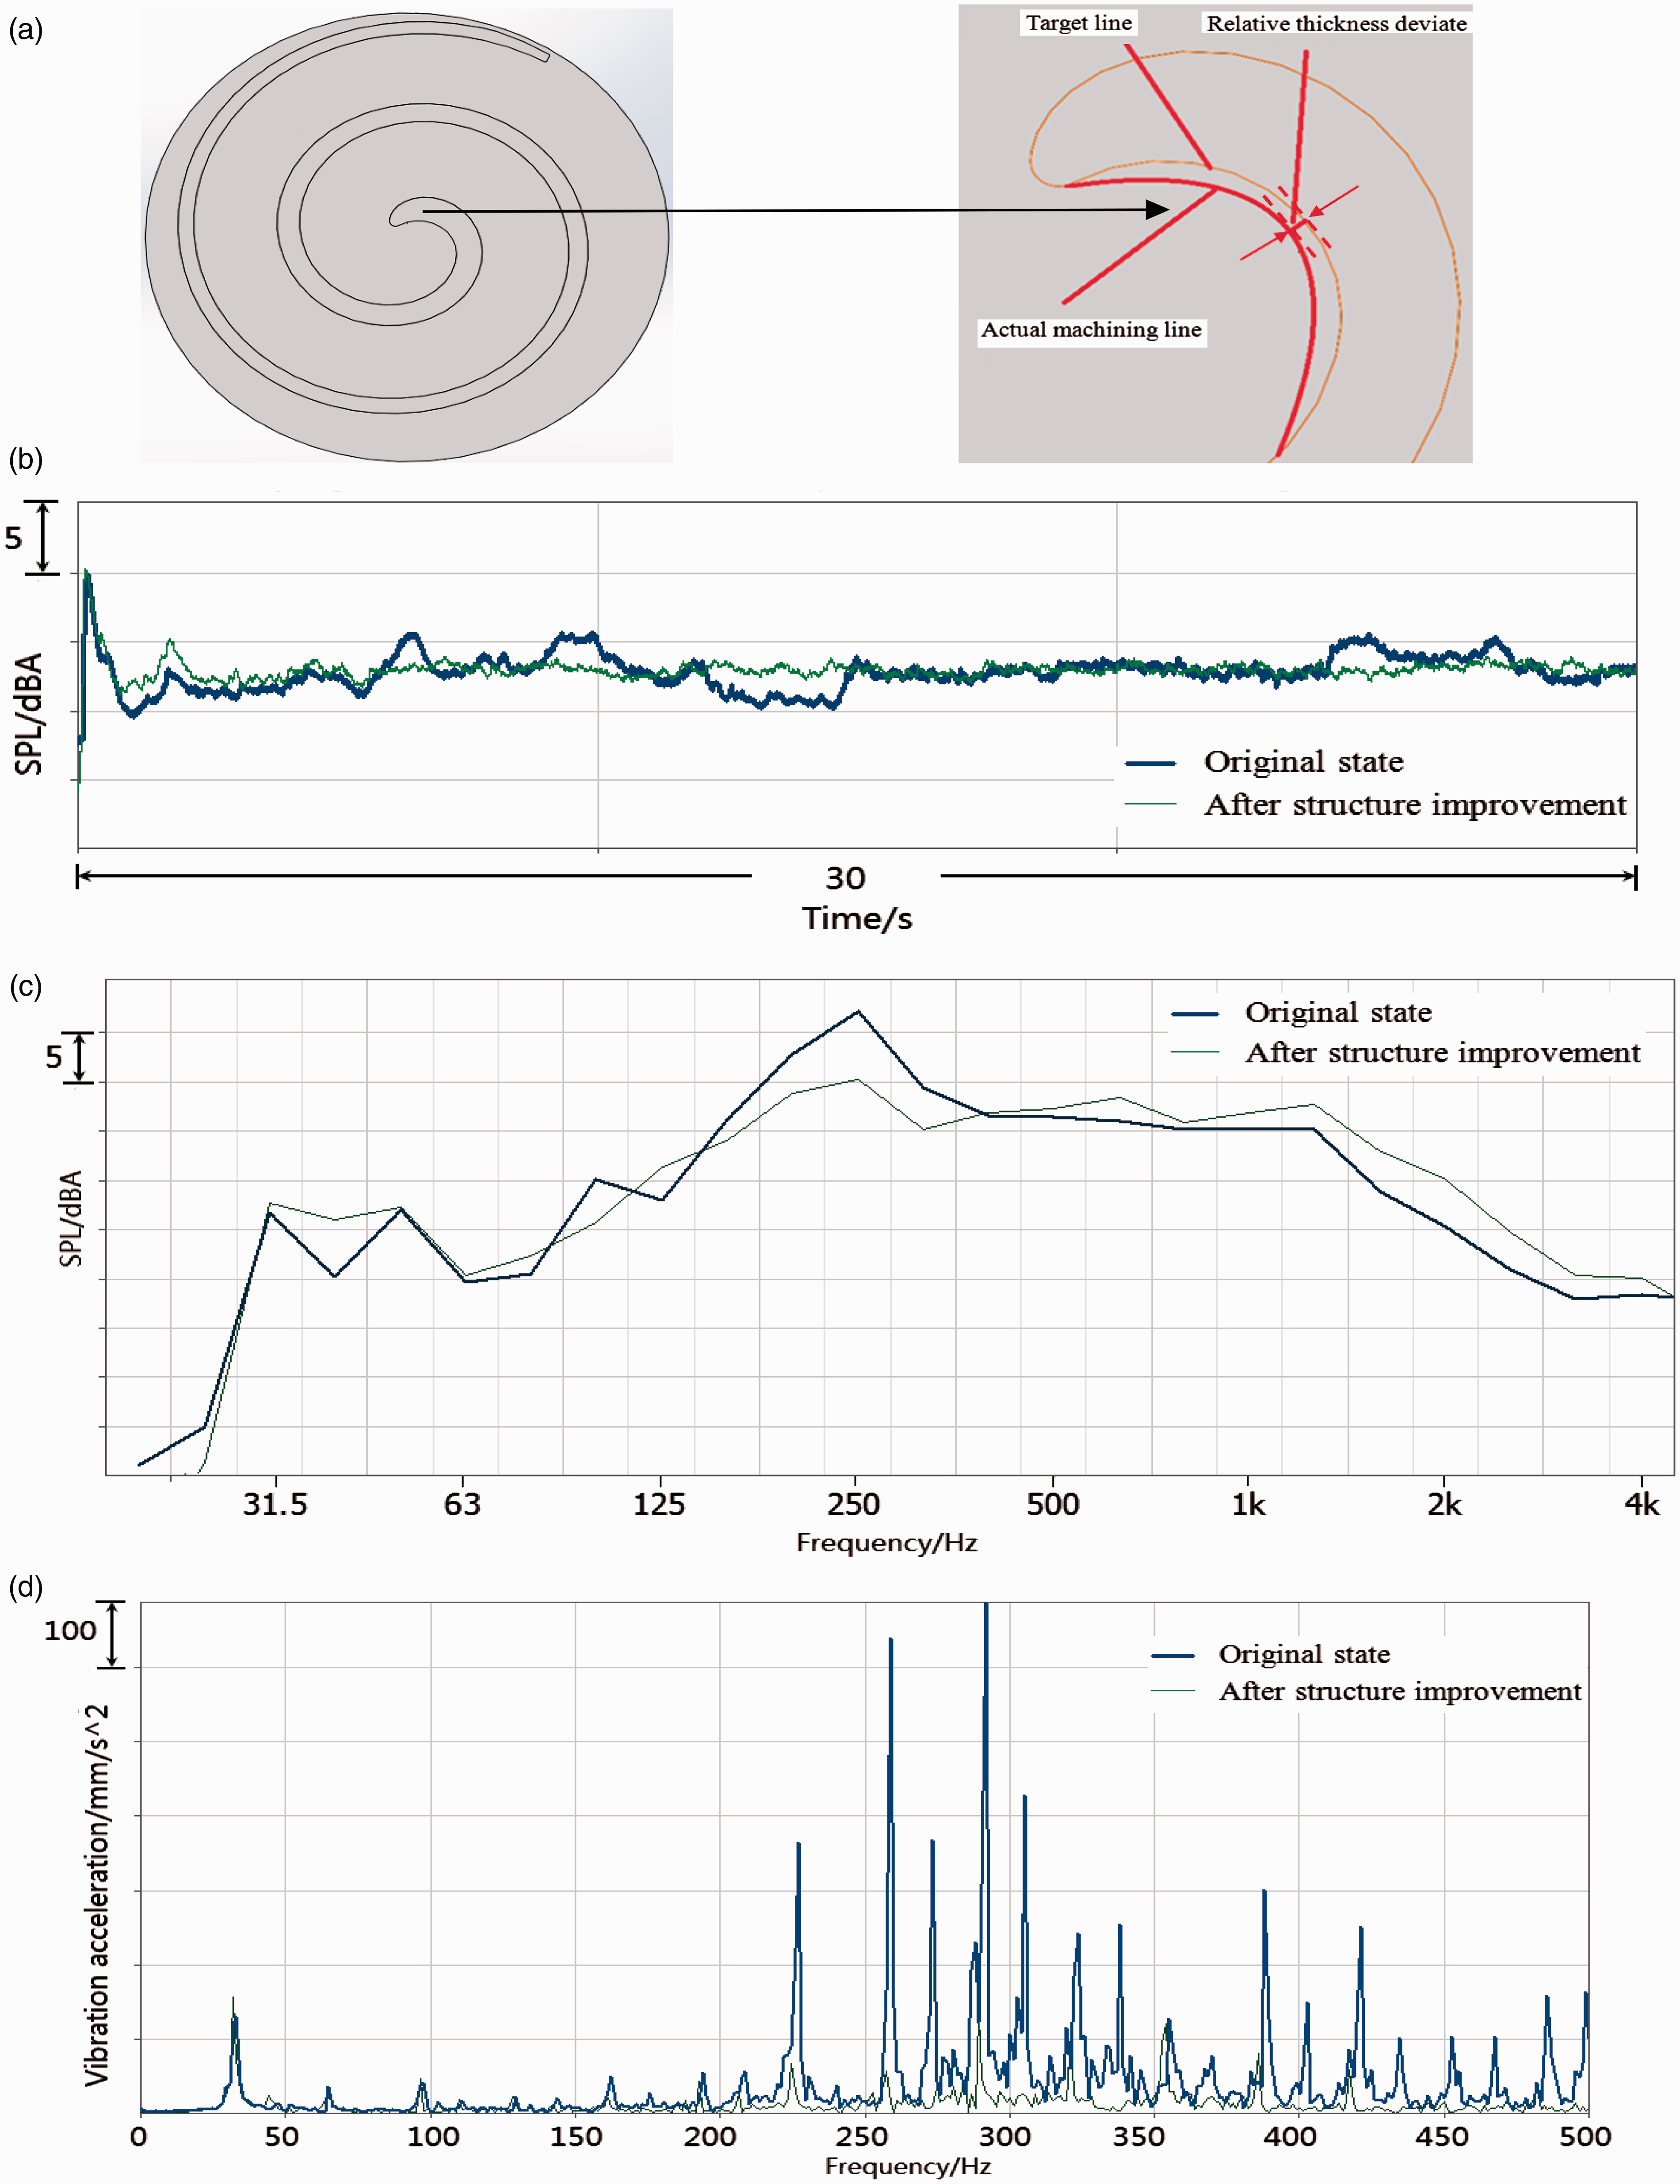
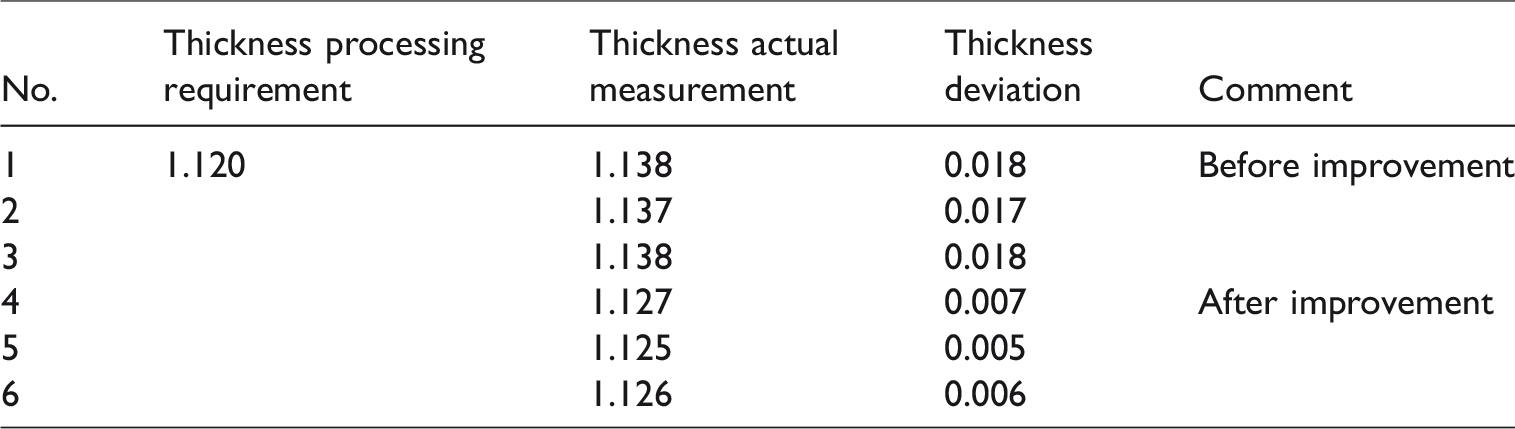
One more problem is in the AC compressor start-up initial stage at idling, where the overall SPL of the trial production vehicle’s AC compressor fluctuates over time more than that of the competitor vehicle. Before taking corrective ways of improving programme to weigh the pros and cons ago, to lay special stress on two aspects of structural design and manufacture processing technology to set out to do. By referring to the structure design of the AC compressor of previous competitor vehicles, shown in Figure 8, we can see that the inside and outside structures of the AC compressor are reinforced, adding strengthening rims on the surface of the AC compressor without adding weight to the AC compressor. Further, under the premise of not affecting product reliability and dynamic performance, as shown in Figure 11(a), through adjusting the AC compressor processing speed of the motor near the centre position of both the dynamic disc and static disc’s vortex line, therefore modifying the shape of the vortex line, the relative thickness deviation between the actual machine line and the target line decreases from about 0.018 mm to about 0.006 mm, as shown in Table 4.
Sound pressure level
Thickness deviation (mm) before and after improvement of the AC compressor processing speed of motor.
As shown in Figure 11(b), compared to the AC compressor’s original state, after the improvement of manufacture processing precision, although at the AC compressor start-up initial stage it lasts only 4–5 s, SPL fluctuation grew larger, but over the next 30 seconds SPL become smoother and the time domain noise performance is obviously improved. As shown in Figures 11(c–d), both noise and vibration performance of the AC compressor are improved at the critical frequency of 250 Hz.
Adjusting control strategy and effect validation
As previously mentioned, after the first 4–5 s of the AC compressor’s start-up stage, the abnormal noise problem obviously improves, but the abnormal noise is still outstanding at moment of start-up. 18 The root cause of the AC compressor electric motor start-up control strategy and its mechanical principle need to be analysed. As shown in Figures 12 and 1 regarding the AC compressor noise-generation mechanism and its transfer path, for AC compressor rotor control systems without sensors, when the electric motor stops, the relative position between the rotor and the stator is uncertain, the purpose of positioning start-up is to specify the rotor location of the process from the uncertain position of it. As shown in the left schematic diagram of Figure 12 regarding rotor shaft positioning at start-up, we can suppose that if the last time the electric rotor stopped it was located in the position shown by the dotted line, then at the next start-up the positioning process is that the rotor moves from the dotted line to the solid line position. After positioning, the motor will just start to work. Moreover, as shown in the right schematic diagram of Figure 12 about rotor shaft no-positioning start-up, the definition of no-positioning start-up is to start from the uncertain position of the rotor. Under the same condition, we also can suppose that if the last time the electric rotor stopped the rotor was located in the position shown by the dotted line, then at the next start-up, the no-positioning process is that the next start-up rotation will start directly from the dotted line position. To adjust the rotor shaft start-up position control strategy, in order to reduce the benefits of the positioning of ‘clicking’ abnormal noise and mechanical collision in the process of positioning.
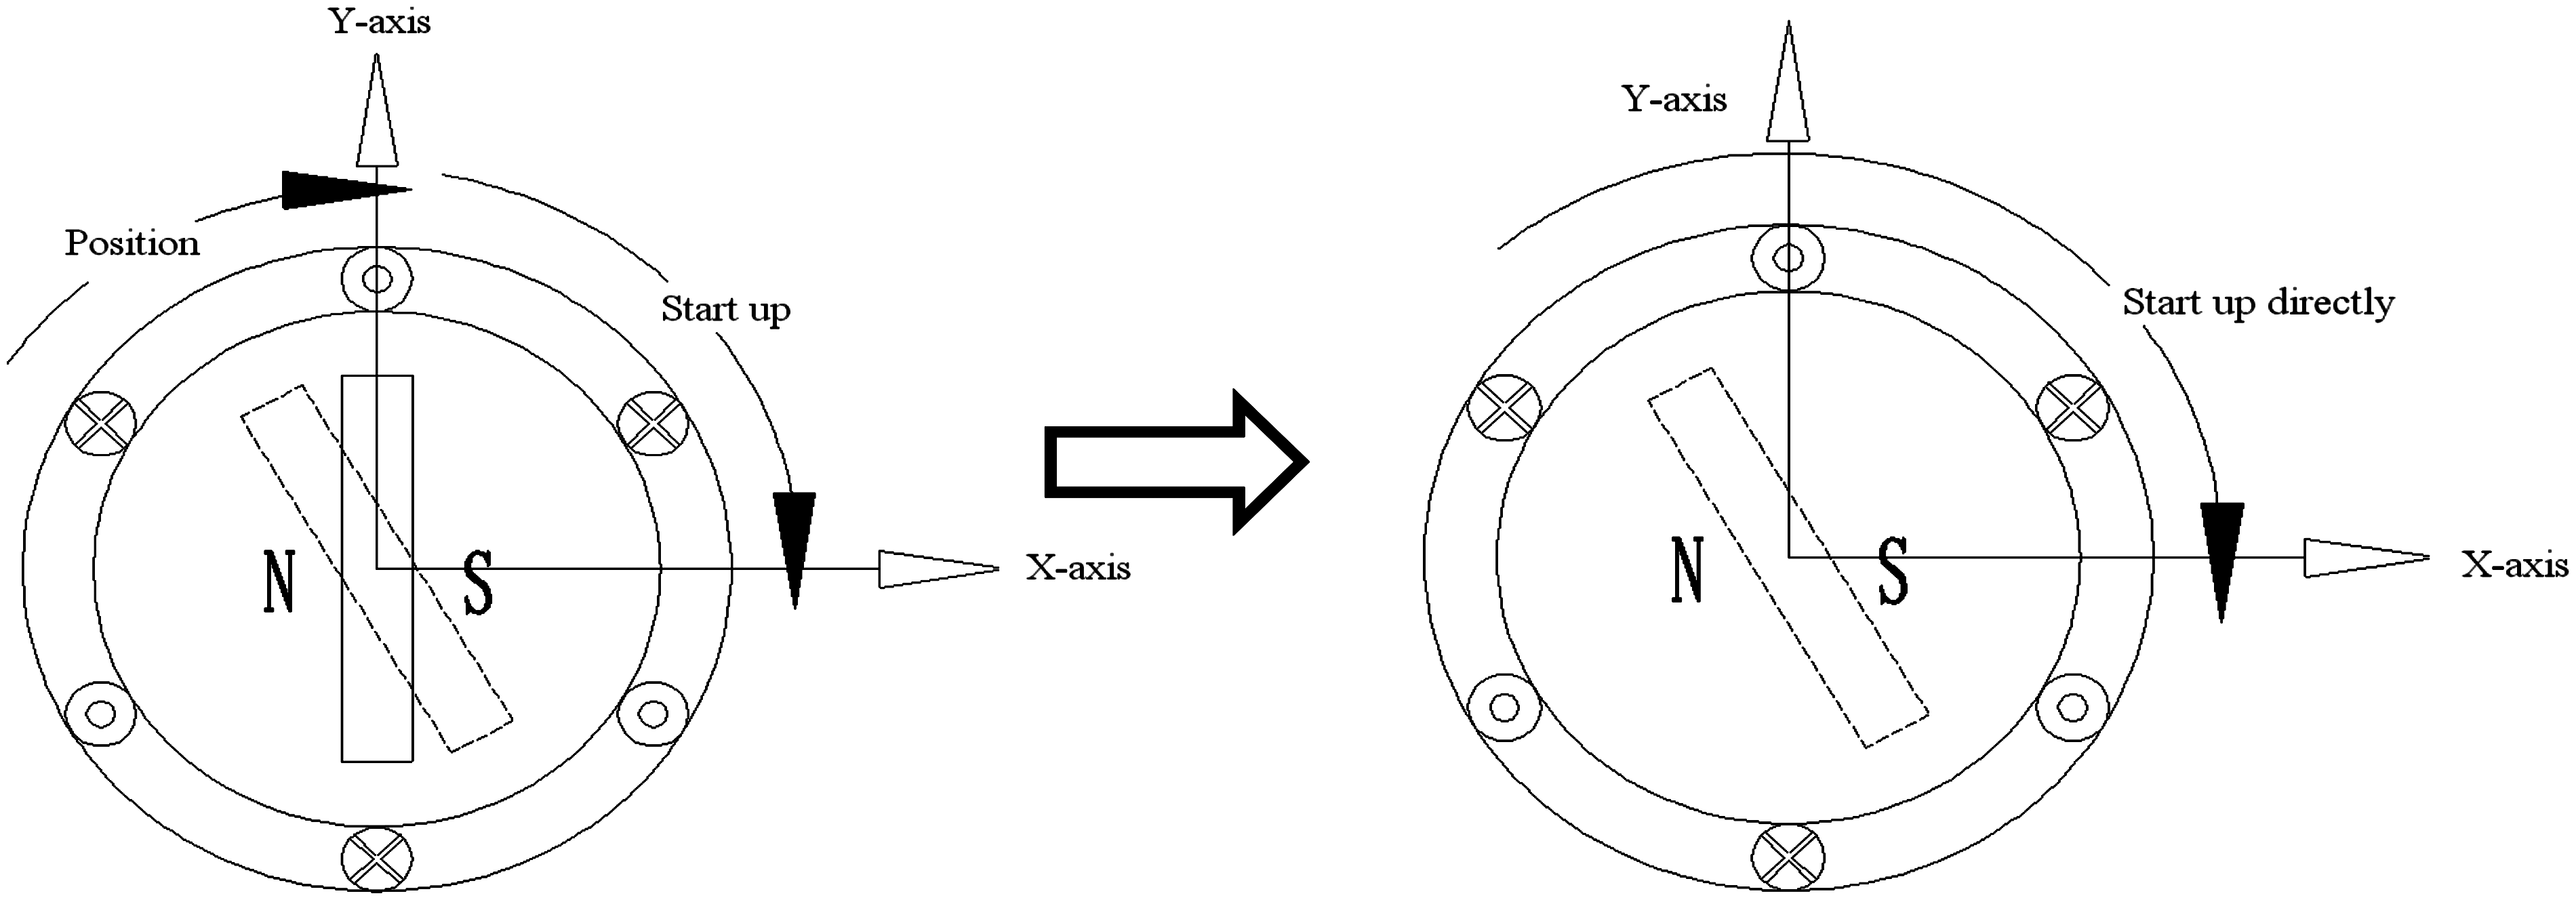
Air condition compressor rotor shaft start-up schematic diagram of positioning (left) and no-positioning (right).
In the meantime, we must pay more attention to the disadvantages of start-up failure risk from positioning to no-positioning, because the moment of inertia of the motor rotor and its accessories is very small, so the risk of failure is very low. Furthermore, in the view of the assessment of the no-positioning start-up failure risk, it has been proved that there is no problem after completing almost 10,000 consecutive AC compressor start-up tests.
When the AC compressor start-up system is changed from the original positioning state to the control strategy optimization of no-positioning, as shown in Figure 13(a), using an electromagnetic induction rotation speed sensor, according to the rotor shaft rotation speed–time measurement curve at the state of no-positioning, whose rotation speed run-up process becomes more gradual and stable than before that at the initial stage speed of the rotor positioning of the AC compressor raises quickly to about 1600 rpm within 1 s.
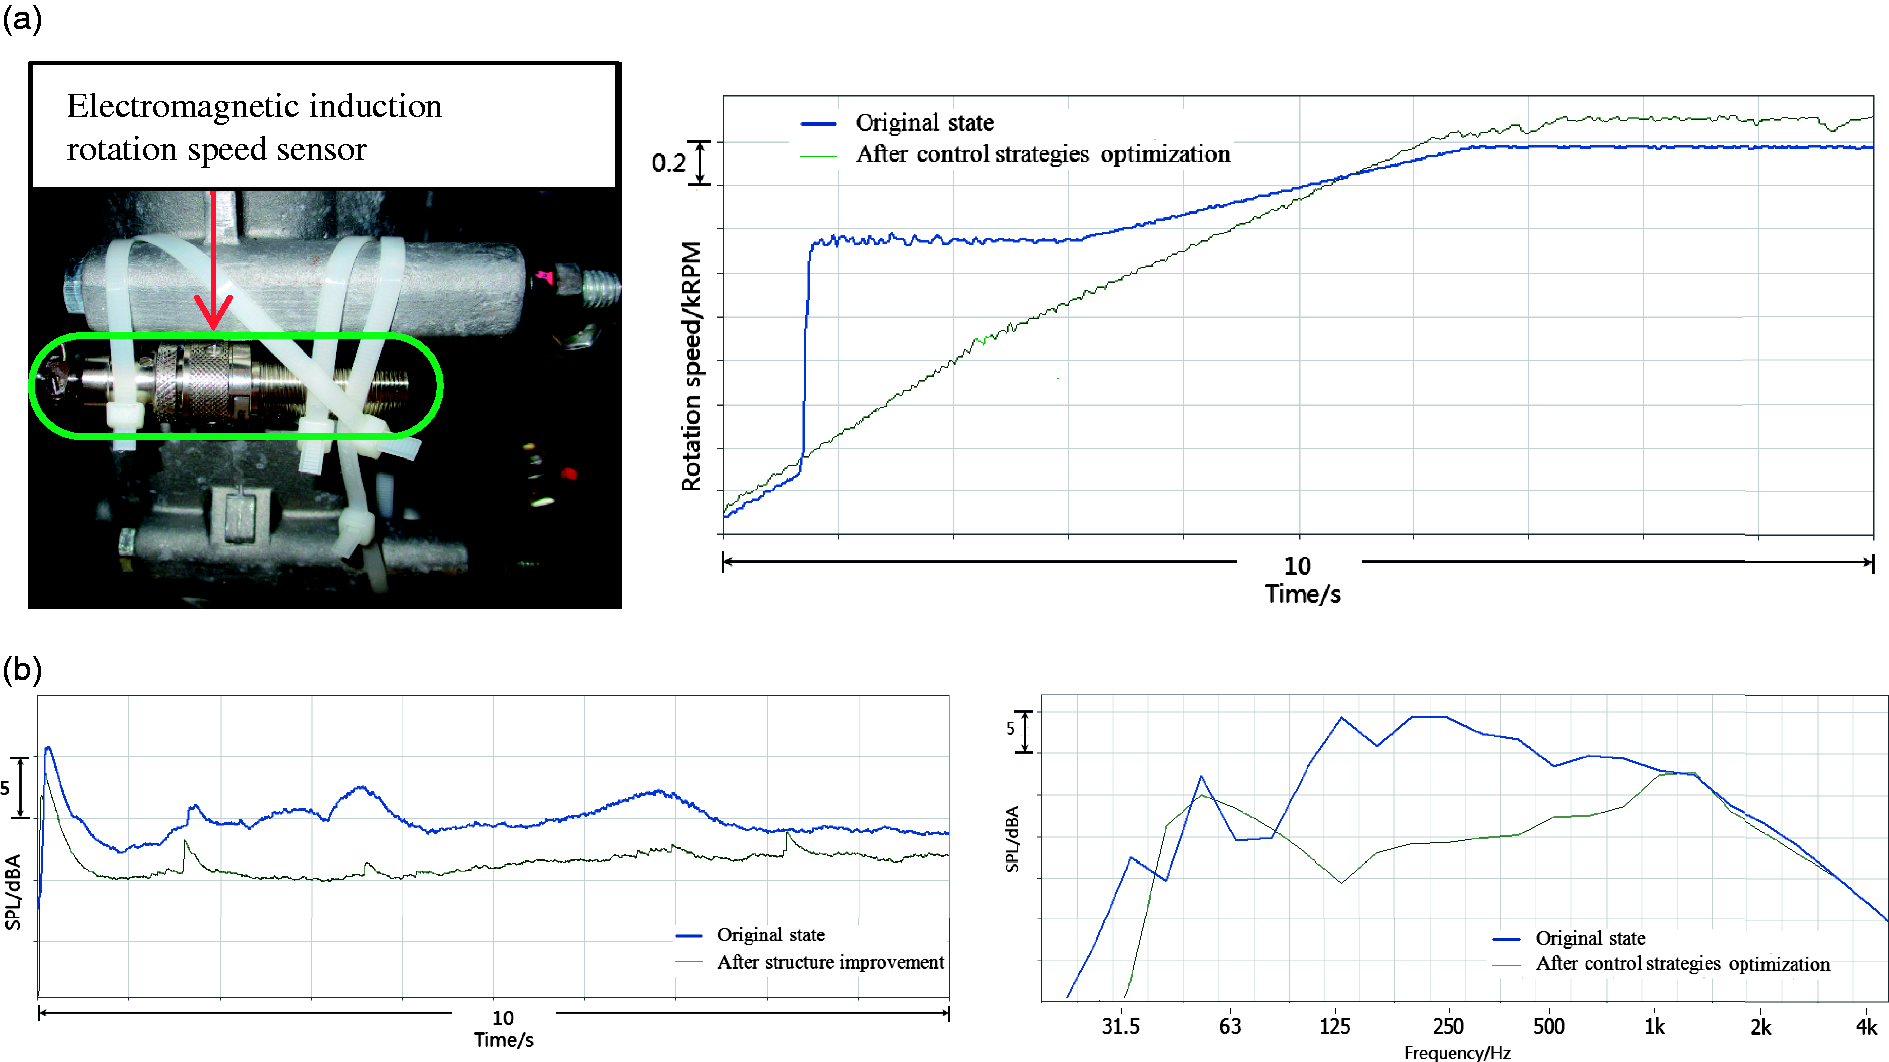
(a) Rotation speed–time curve of the air conditioning compressor comparing of rotor shaft positioning and no-positioning states. Sound pressure level time (left) and frequency domain (right) schematic diagram comparing the of rotor shaft position and no-position.
As shown in Figure 13(b), comparing the original state before the control strategy optimization, the noise performance of both time and frequency domains at the AC compressor start-up stage is obviously enhanced. After the AC compressor control strategy optimization was used on a full pure electric vehicle, it was also proved by the results of a subjective evaluation.
Conclusion
In this work we investigated vehicle body frame mode shape and interior vehicle sound pressure field simulation, and provided some suggestions for causes of a pure electric vehicle’s clicking and whooping noises at the AC compressor start-up stage. In order to predict the abnormal noise’s frequency characteristic, before numerical simulation, key parts of the pure electric vehicle body frame structure and acoustic model are constructed, then the mode shape related to the eigenfrequency is calculated and sound pressure distribution contour is obtained. Based on the expert subjective evaluation and objective test results, the differences including noise spectrum, sound quality, structure and vibration spectrum between the pure electric trial production vehicle and its competitor vehicle were analysed. In the end, comparative test results show that the AC compressor’s abnormal noise is improved after structure stiffness is increased, manufacturing process design is refined and control strategy is adjusted. Through a series of computations and measurements, the following conclusions can be offered.
Applying mode frequency shape and sound pressure field calculation methods to the pure electric vehicle body frame model, the following results are obtained: there exist some displacement deformation and sound pressure concentration at about 240 Hz in the interior vehicle’s AC outlet, and this indicates the solution approach for the AC compressor abnormal noise problem. By the use of the Denmark B&K company’s device acoustic camera, it is efficient to identify that the location of the abnormal noise is in the vicinity of the AC compressor. After filtering interior vehicle noise signal in the 200–300 Hz frequency domain, playback combined with harmonic wave analysis results including the AC compressor’s vibration acceleration signal at idle, it is believed that the abnormal noise source is derived from the AC compressor. Through comparing and referring carefully to the competitor vehicle’s AC compressor design countermeasure, and at the same time considering one’s own situation, a new improved AC compressor sample can be trial-produced and evaluated after installing it in a pure electric vehicle, and good effects have been obtained. Thus, it can be seen that the whole diagnosis and analysis process provides a reliable solution flow for similar abnormal problems of other products.
Footnotes
Declaration of conflicting interests
The author(s) declared no potential conflicts of interest with respect to the research, authorship and/or publication of this article.
Funding
The author(s) received no financial support for the research, authorship and/or publication of this article.