
Abstract
This paper investigated an abnormal noise under idle condition and analyzed the mechanism of the noise based on the results of experiments and dynamics simulations. It is confirmed that knocking inside variable valve timing phaser is the source of the abnormal noise. The results of experiments show that half-order rhythm of the vibration and noise components around 1000 and 2100 Hz are different from the other dominant components, which is possible to involve the abnormal noise. Numerical analyses are conducted to simulate the process of the abnormal noise. It is found that the thickness of the blades of the variable valve timing rotor has significant influence on the abnormal noise. The simulation implies that increasing the thickness of the rotor blades will decrease the abnormal noise. When the thickness increases to 3.0 mm, the acoustic frequencies within 1000–1200 Hz have an average drop of 3.7 dB(A), and the acoustic frequencies within 2000–2200 Hz have an average drop of 12.5 dB(A). The results of verification experiments show that the amplitudes of the abnormal noise have obvious reduction, and the abnormal noise is basically eliminated under subjective evaluation.
Introduction
As in recent years, manufacturers have made great process in controlling civil automobile’s interior sound pressure level; under idle condition, abnormal irritating noise, which used to be sheltered by other noise, has become an increasingly important issue.1,2 Since human beings are more sensitive to the prominent and rhythmed abnormal noise, reducing or eliminating abnormal noise is essential to improve noise vibration and harshness (NVH) performance and riding comfort.
Automotive abnormal noise mainly includes buzz, squeak, and rattle. 3 Most common abnormal noises produced by powertrains are rattles, and rattle noises caused by gears and clutches are studied in previous researches. Karagiannis and Pfeiffer 4 presented a uniform approach to model gear-rattling vibrations based on classical impact theory and applying modern methods of topological dynamics. Mathematical models of rattling are presented on the basis of a patching procedure, putting together free flight phases and impact sequences, and on the basis of discrete mappings, describing the rattling state before some impact in dependence of the state of the preceding impact. 4 Wang et al. 5 proposed a model for torsional vibration of automotive manual transmissions for the purpose of analysis and prediction of gear rattles. They revealed that the gear rattle exhibited three major modes of double-sided, single-sided, or irregular impacts and used a rattle index to compare the rattle levels produced by different gear pairs. 5
Bozca 6 presented an optimization of gearbox geometric design parameters to reduce the gear-rattle noise in an automotive transmission based on a transmission error model. By optimizing the geometric parameters of the gearbox, such as the module, number of teeth, axial clearance, and backlash, it is possible to obtain a gear structure with high bending and contact strength and to minimize the torsional vibration, transmission error, and gear-rattling noise. 6 Zhou and Wenlei 7 introduced a comprehensive procedure to calculate the steady dynamic response and noise radiation generated by a gear reducer. The dynamic bearing force, gearbox vibration, and noise radiation were investigated in different rotational speed and load. 7 Liu et al. 8 developed a nonlinear 3-degree of freedom (3-DOF) torsional model of the clutch system for reducing the abnormal noise during vehicle accelerating. They carefully studied the nonlinear characteristics of the multi-staged clutch damper and the gear backlash and investigated the vibration transmission characteristics of the clutch and the influence of each critical physical parameter on noise generation. 8 Chikatani and Suehiro 9 studied the influence of drag torque applied to the clutch disc on the idling rattle noise. The research revealed that when a clutch has a low spring constant and low hysteresis torque at first stage, torsional characteristics is used to reduce rattling, and noise occurs when the transmission oil temperature is low. 9 Forcelli et al. 10 presented Elasis virtual engine simulator (VES) as a new tool for automotive transmissions NVH testing. This work described a measurement technique to estimate the gear rattle noise using the NVH-transmission test rig. Based on the new methodology, they studied the parametric sensitivity for amplitude of the torsional vibration. 10 Zhang et al. 11 investigated a gear rattle appearing in a novel power-split hybrid transmission. They revealed that the gear rattle takes place mainly owing to engine excitations, unloaded gear pairs, and gear backlashes. For the analysis of gear-rattle phenomena, a non-linear dynamics model is established for the power-split hybrid driveline, and also acoustic measurements for the gear rattle are performed. The test results show that the gear rattle occurs when electric machines are idly operated. 11
There are few studies on the abnormal noise caused by the valve train. Kimura studied a ticking noise of valve train. Using the empirical characteristics of measured ticking noise and the dynamic simulation result of the camshaft bearing, his research revealed that the ticking noise is produced by the cavity collapse in the oil film of the camshaft bearing. 12
In this paper, an abnormal noise under idle condition is investigated, and the abnormal noise is generally found on passenger vehicles. It is a rhythmic rattle under subjective evaluation, which is frequently complained by users and described as the sound of chopping with knives. Considering the complexity of the transmission path and more components involved, the mechanism of the abnormal noise has never been revealed systematically.
A series of noise, vibration, and modal experiments are conducted on a 1.8 L four-cylinder turbocharged gasoline engine. Based on the subjective sensation that the abnormal noise is more obvious at the top, it is implied that the abnormal noise is related to the valve train. Then a dynamics model of valve train is built to study on the moment and the mechanism of the abnormal noise. Numerical analyses are conducted to simulate the process of the abnormal noise production through methods of explicit dynamics, implicit dynamics, and acoustic boundary elements model (BEM). Structure optimization is carried out based on the analyses of the simulation results. The optimization effects are verified through the validation experiments of vibration and noise.
Characteristics of the abnormal noise
Experiments focused on the abnormal noise
This research is based on a four-cylinder turbocharged gasoline engine, which parameters are listed in Table 1. From the subjective evaluation, it can be concluded that the abnormal noise is significant only under idle condition and mainly comes from the top of the engine. The abnormal noise is not significant when the coolant temperature is low after a cold start. However, under idle condition, the abnormal noise becomes noticeable when the coolant temperature rises, and the engine is in a hot state.
Specification of the engine.
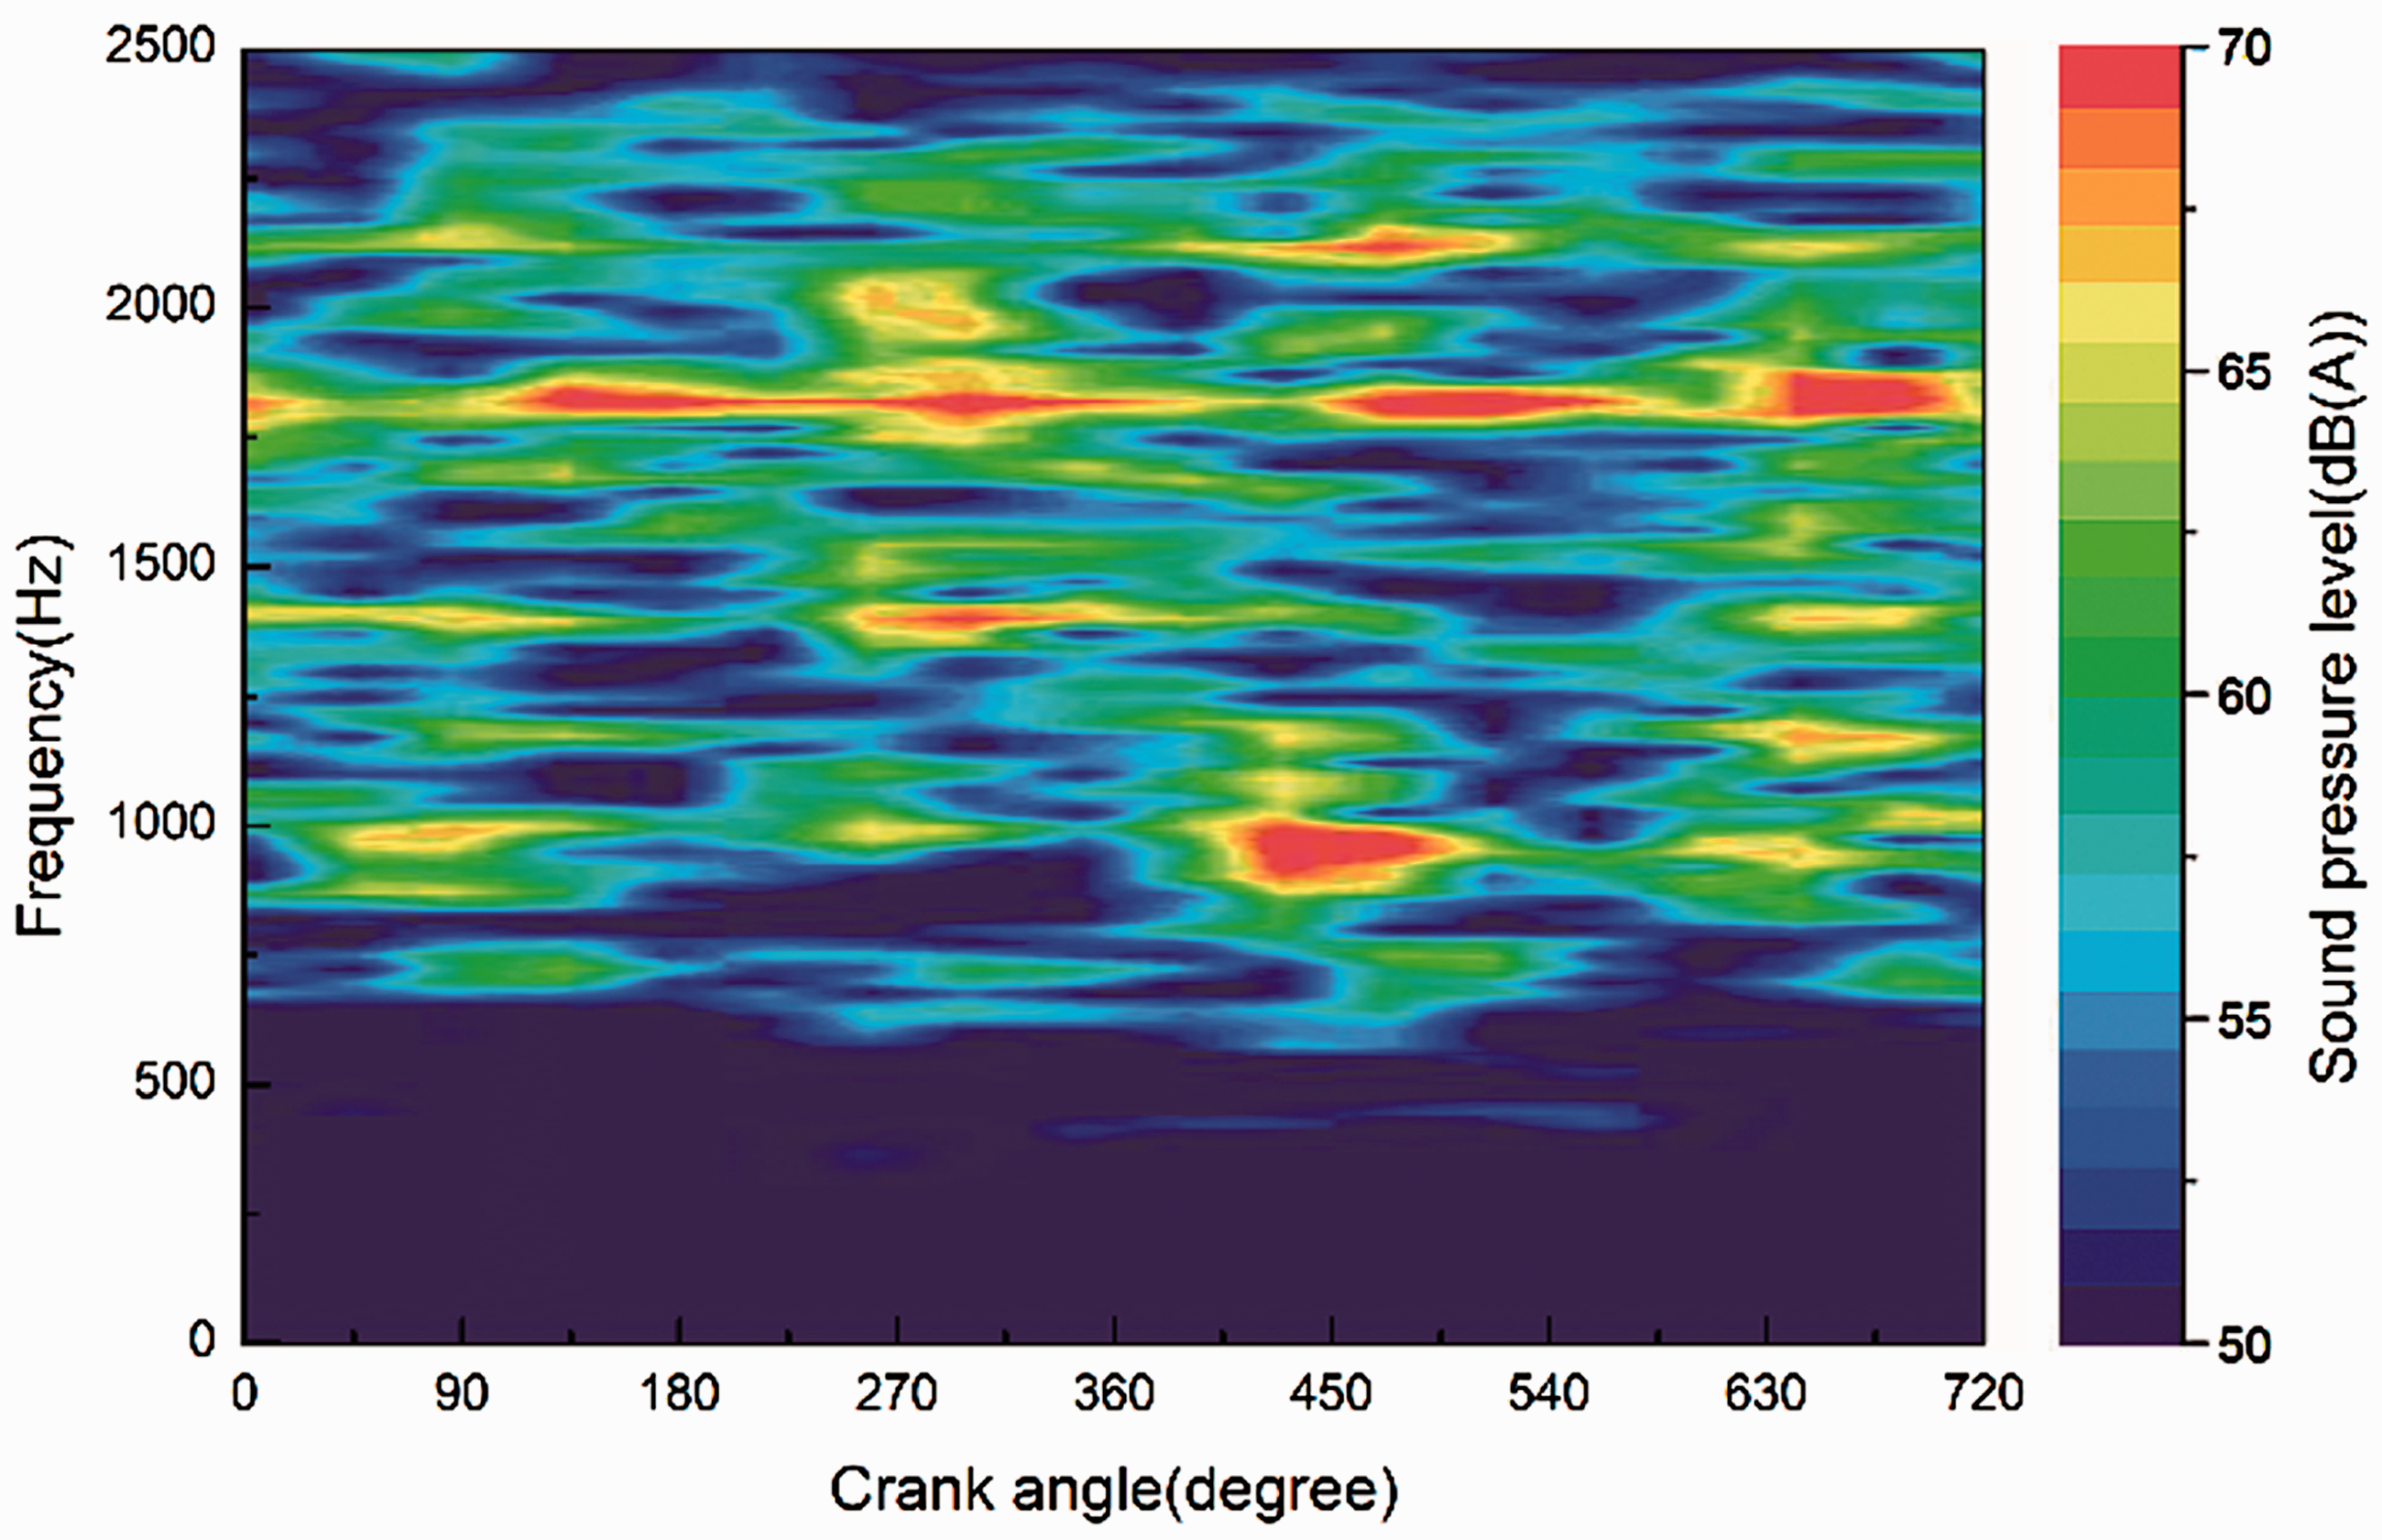
In the following experiments, the coolant temperature is set to 90°C. Noise and vibration experiments on the engine were conducted in a semi-anechoic room. As shown in Figure 1, the near-field noise of the cylinder head and vibration of cylinder head cover of the engine are measured under idle condition. Figure 2 shows the results of vibration and noise measurement of an engine cycle in angle field. As human beings are sensitive to the prominent and rhythmed abnormal noise, the absolute amplitude of the abnormal noise contributes a small proportion of sound pressure level. Therefore, it is hard to confirm the moment of abnormal noise only by the time domain signals. In order to investigate the moment and understand the frequency characteristics of the abnormal noise, the original time domain signals are processed to obtain the time-frequency distribution (TFD) maps.
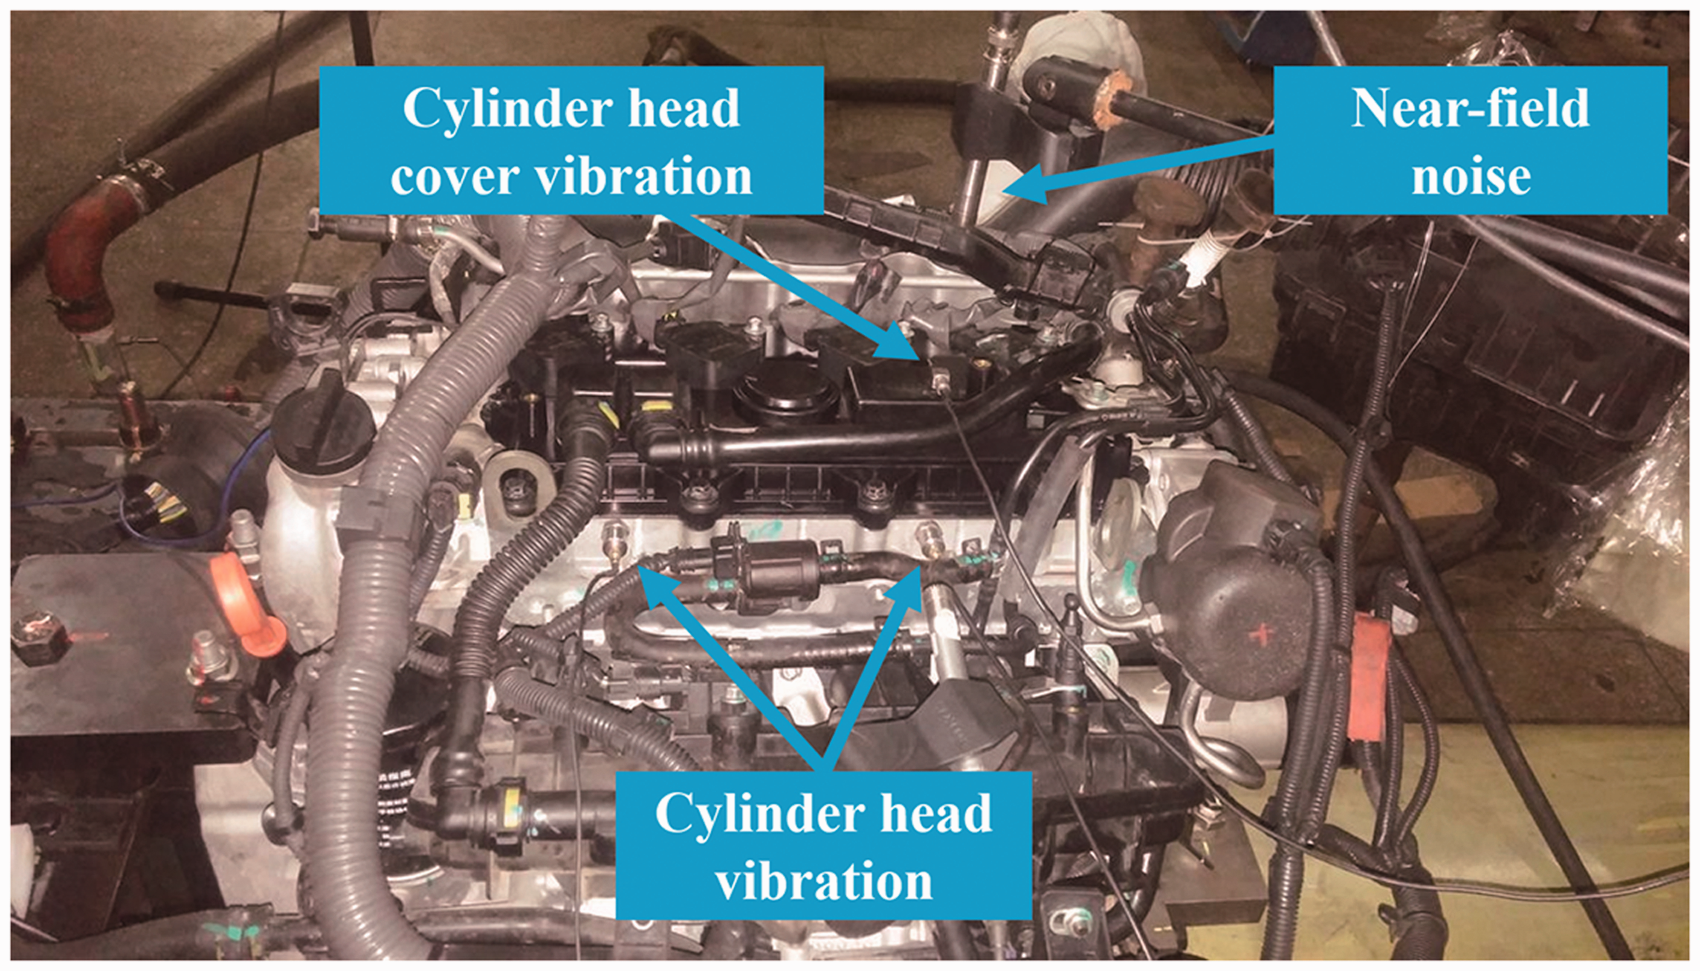
Position of measuring points position for near-field noise and vibration.
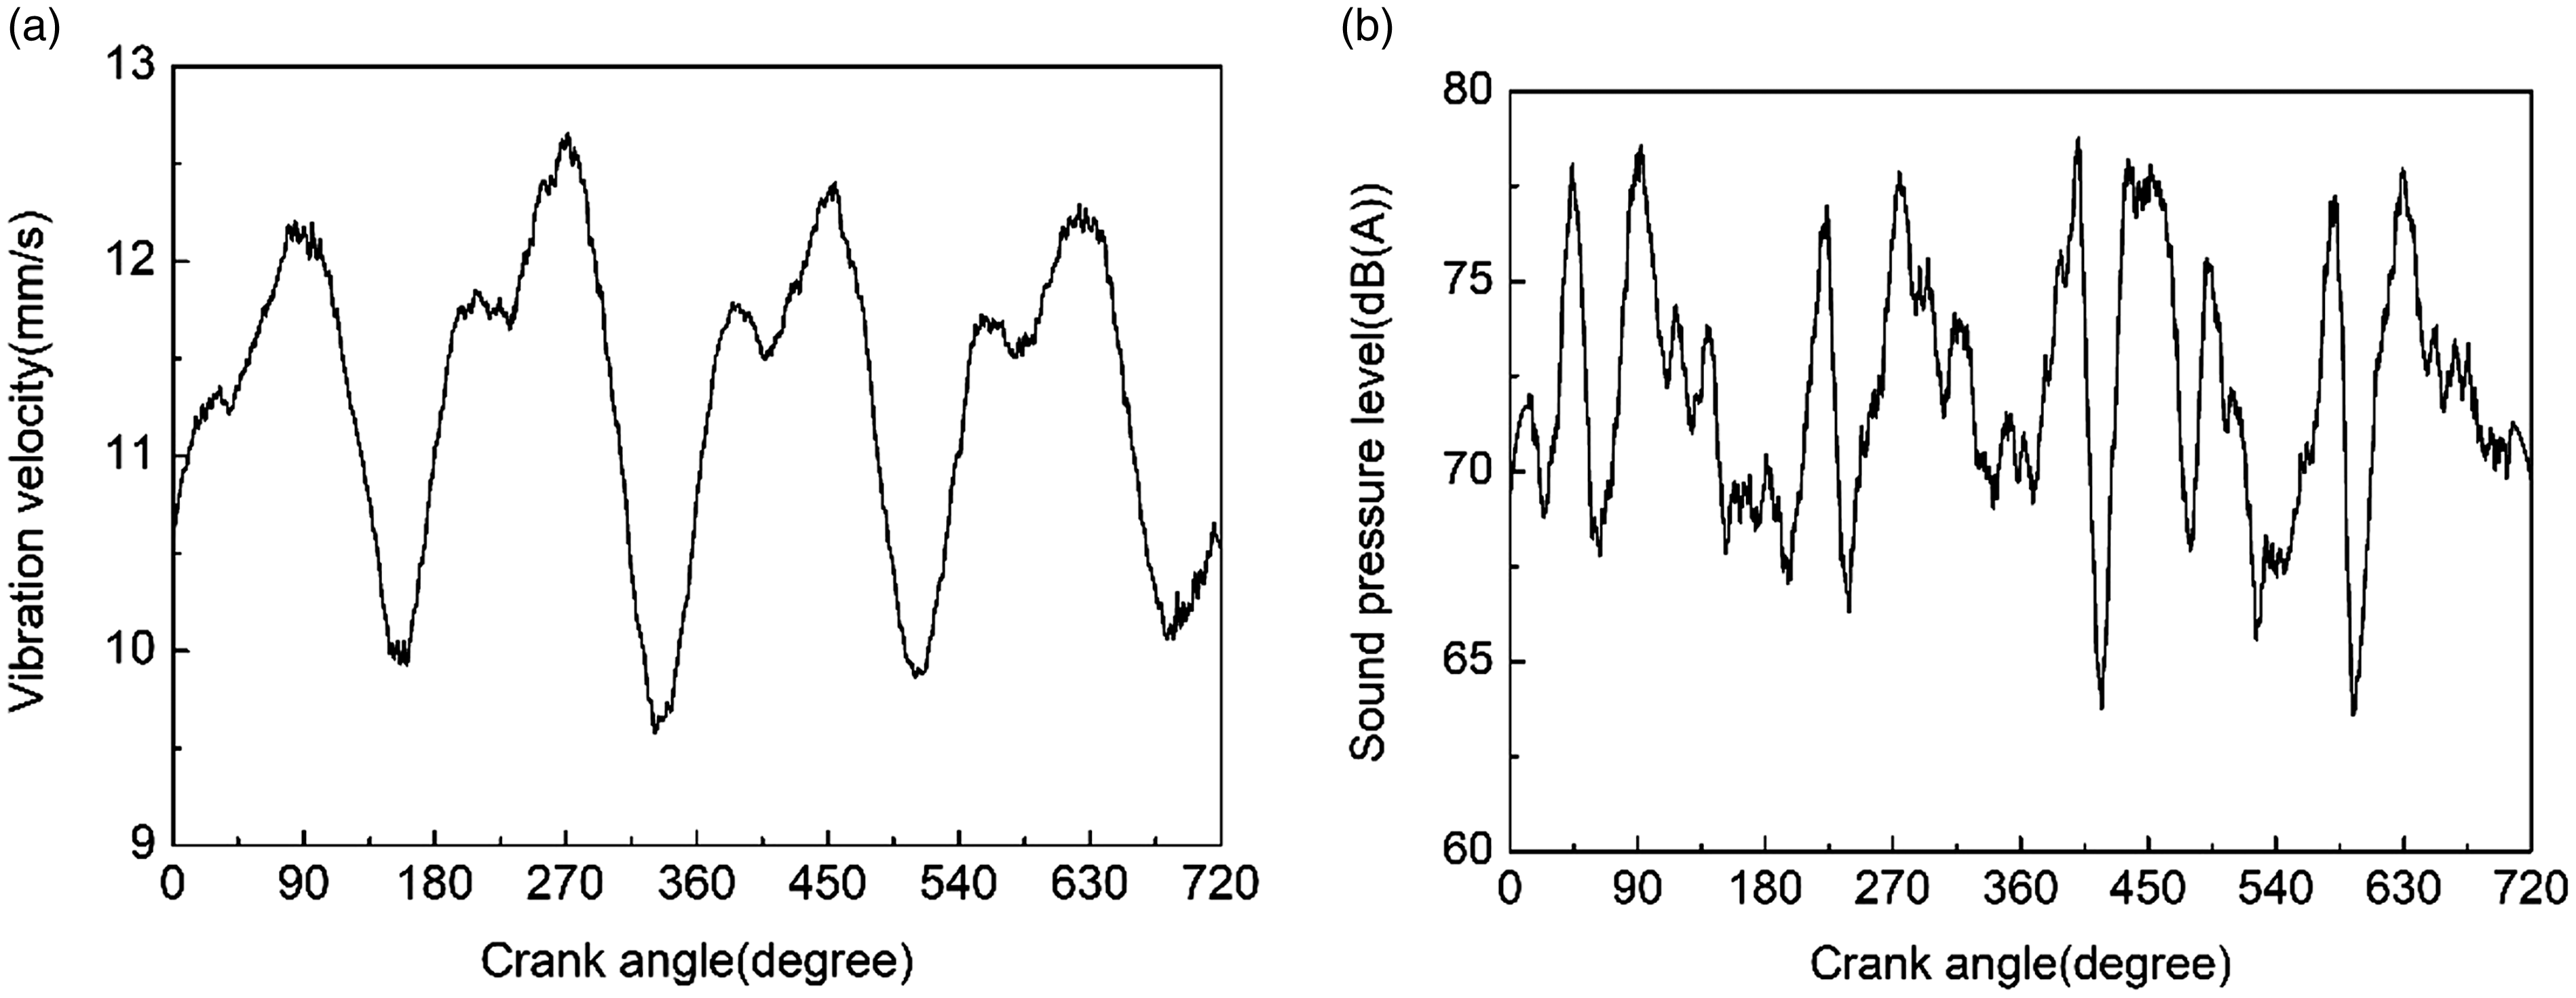
Result of vibration and noise measurement under idle condition (baseline): (a) vibration on the cylinder head cover; (b) near-field noise 10 cm above the cylinder head cover.
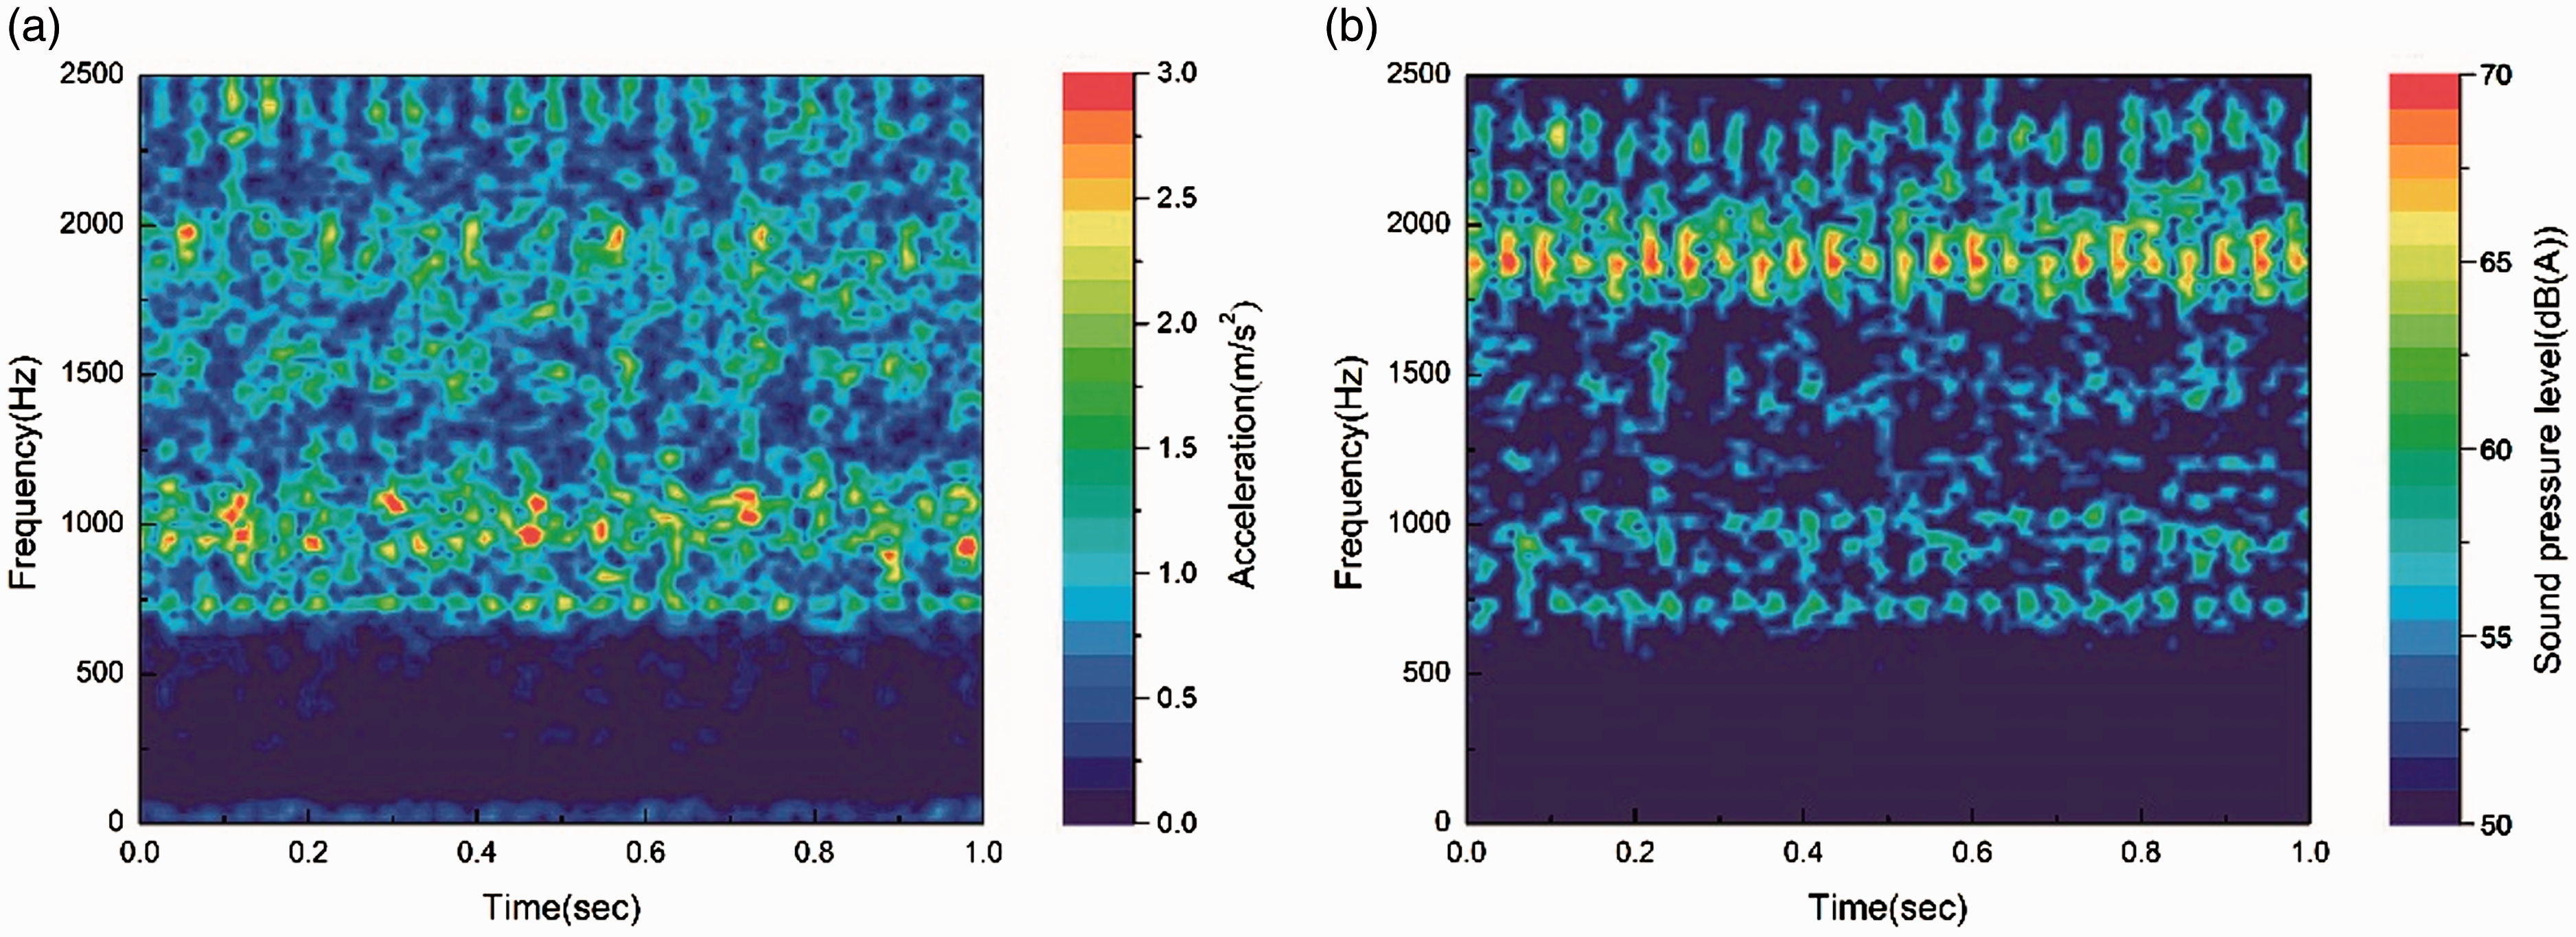
The TFD of the cylinder head cover vibration and the near-field noise are shown in Figure 3, and it can be found that half-order rhythm of the vibration and noise components around 1000 and 2100 Hz are different from the other dominant components. Therefore, these frequency bands are possible to involve the abnormal noise. In order to investigate the mechanism of this abnormal noise, a series of exploration experiments have been conducted on this engine in a semi-anechoic room. The exploration includes changing the camshaft, changing the cylinder head, reinforcing the camshaft bearings, changing the damper bolts, adjusting the valve spring preload, and locking the variable valve timing (VVT), etc. Most attempts are proved to be invalid for reducing the abnormal noise, but the only exception is locking VVT, which can eliminate the abnormal noise thoroughly under subjective evaluation. As shown in Figure 4, when the VVT is locked, the components around 1000 and 2100 Hz are significantly diminished or even disappeared in the TFD of the cylinder head cover vibration and the near-field noise.
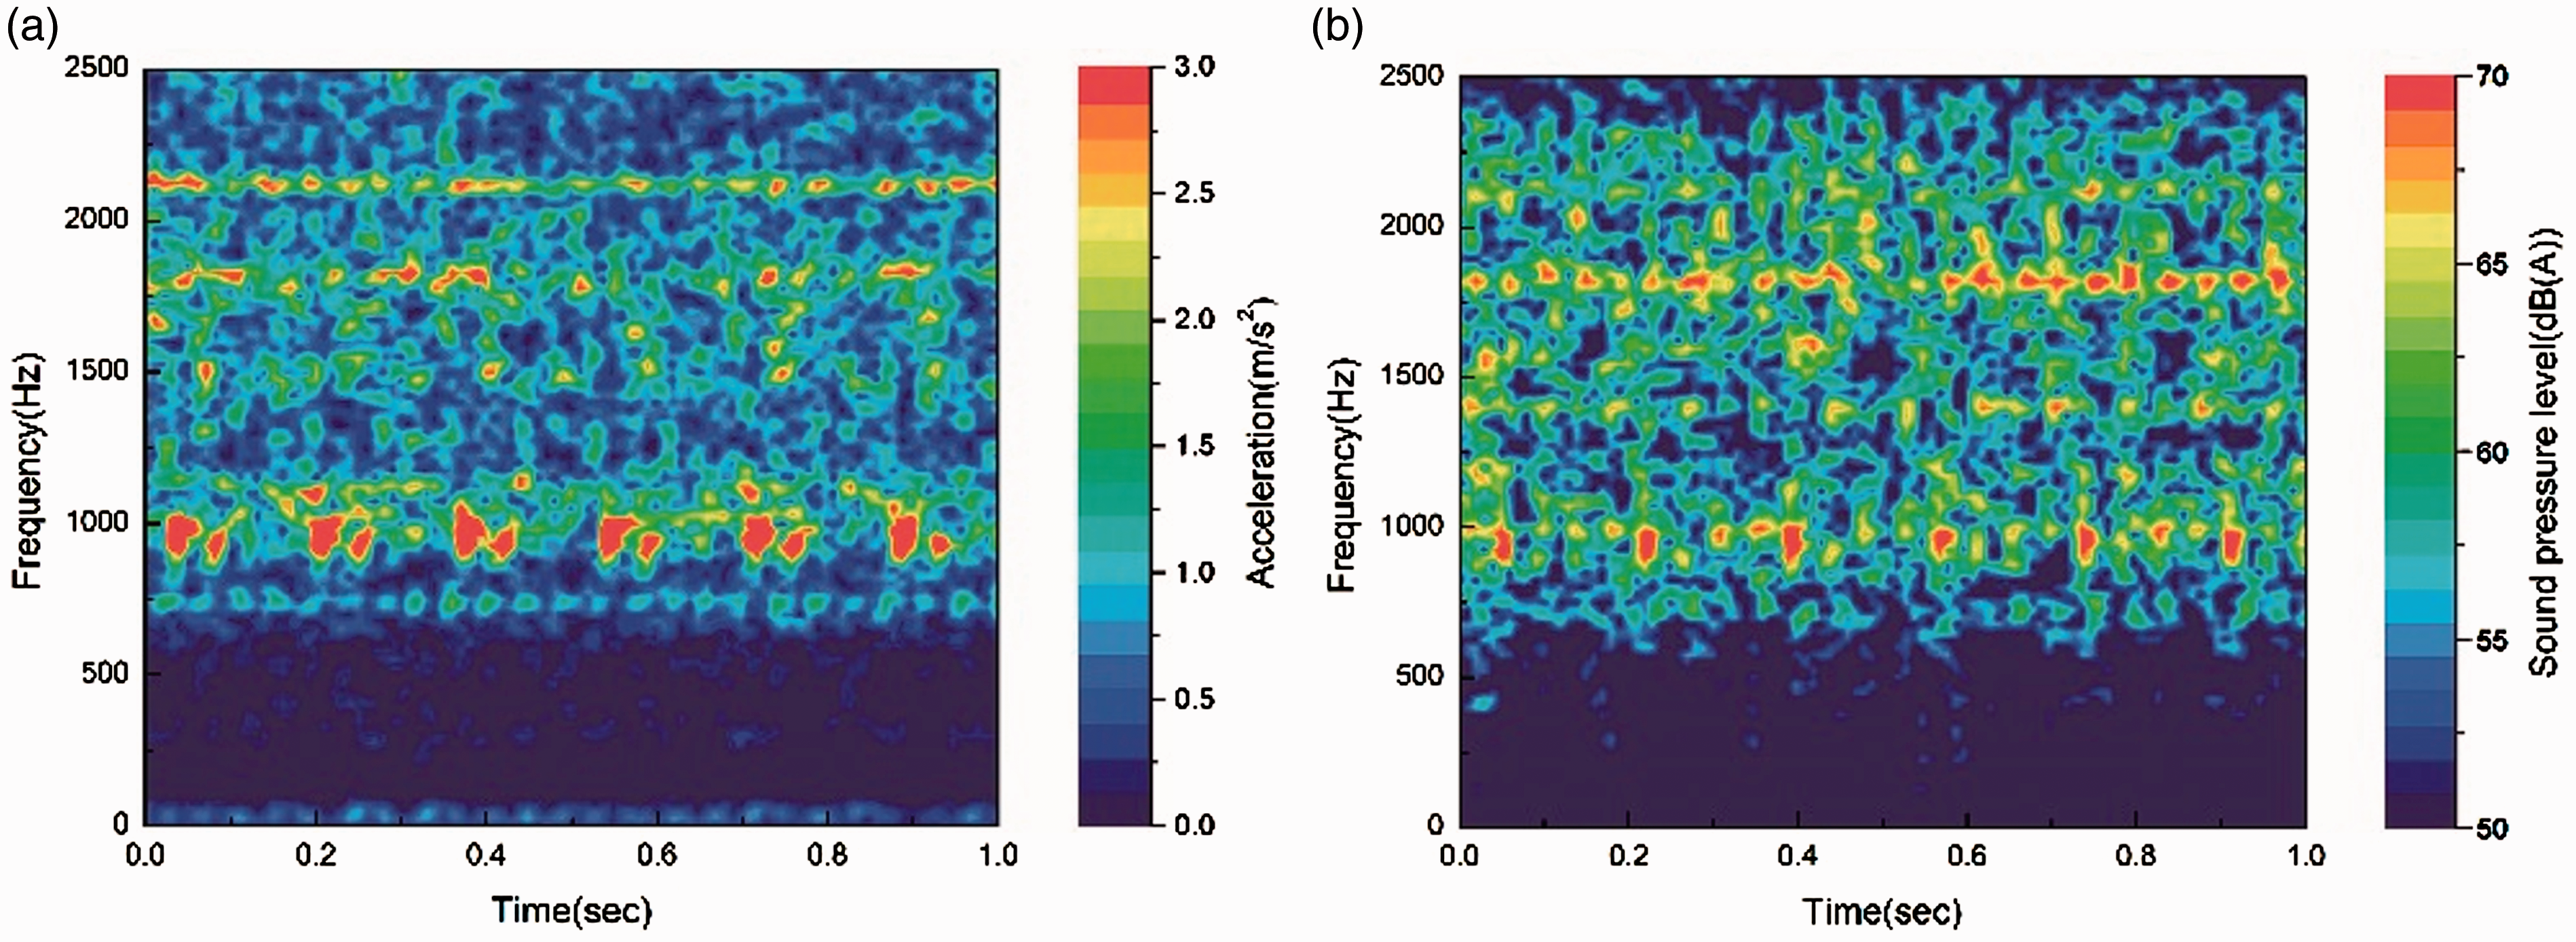
TFD of vibration and noise under idle condition (baseline): (a) vibration on the cylinder head cover; (b) near-field noise 10 cm above the cylinder head cover.
TFD of vibration and noise under idle condition (VVT locked): (a) vibration on the cylinder head cover; (b) near-field noise 10 cm above the cylinder head cover.
Therefore, based on the experimental investigation, it can be inferred that the VVT is closely related to the abnormal noise, and the main frequency bands of the abnormal noise are around 1000 and 2100 Hz.
VVT system mechanism and specification
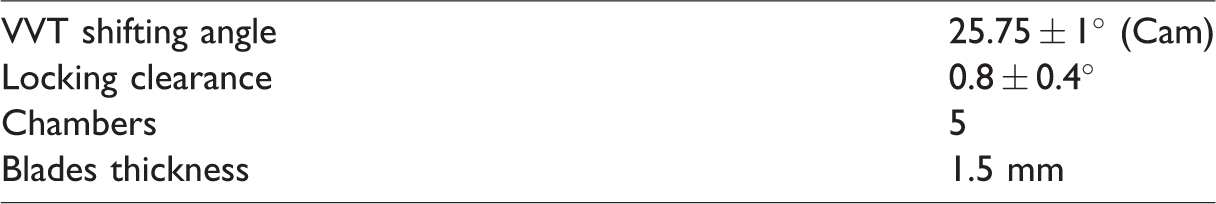
In internal combustion engine, VVT is a system that alters the timing of a valve lift event for the purpose of improving dynamic performance, fuel economy, and emissions by shifting the phase angle of the whole camshaft forward or backward with means of a hydraulic phaser attached to the front end of the camshaft. 13 The mechanical execute mechanism, as shown in Figure 5, is to change the oil pressure of chamber A and chamber B to control the valve timing, which is calculated by the electronic control unit based on the engine speed and acceleration. The VVT phaser of the rattling engine is shown in Figure 6, and the specification of the VVT structure of this engine is shown in Table 2. Five chambers design is adopted, and the blade thickness is 1.5 mm.
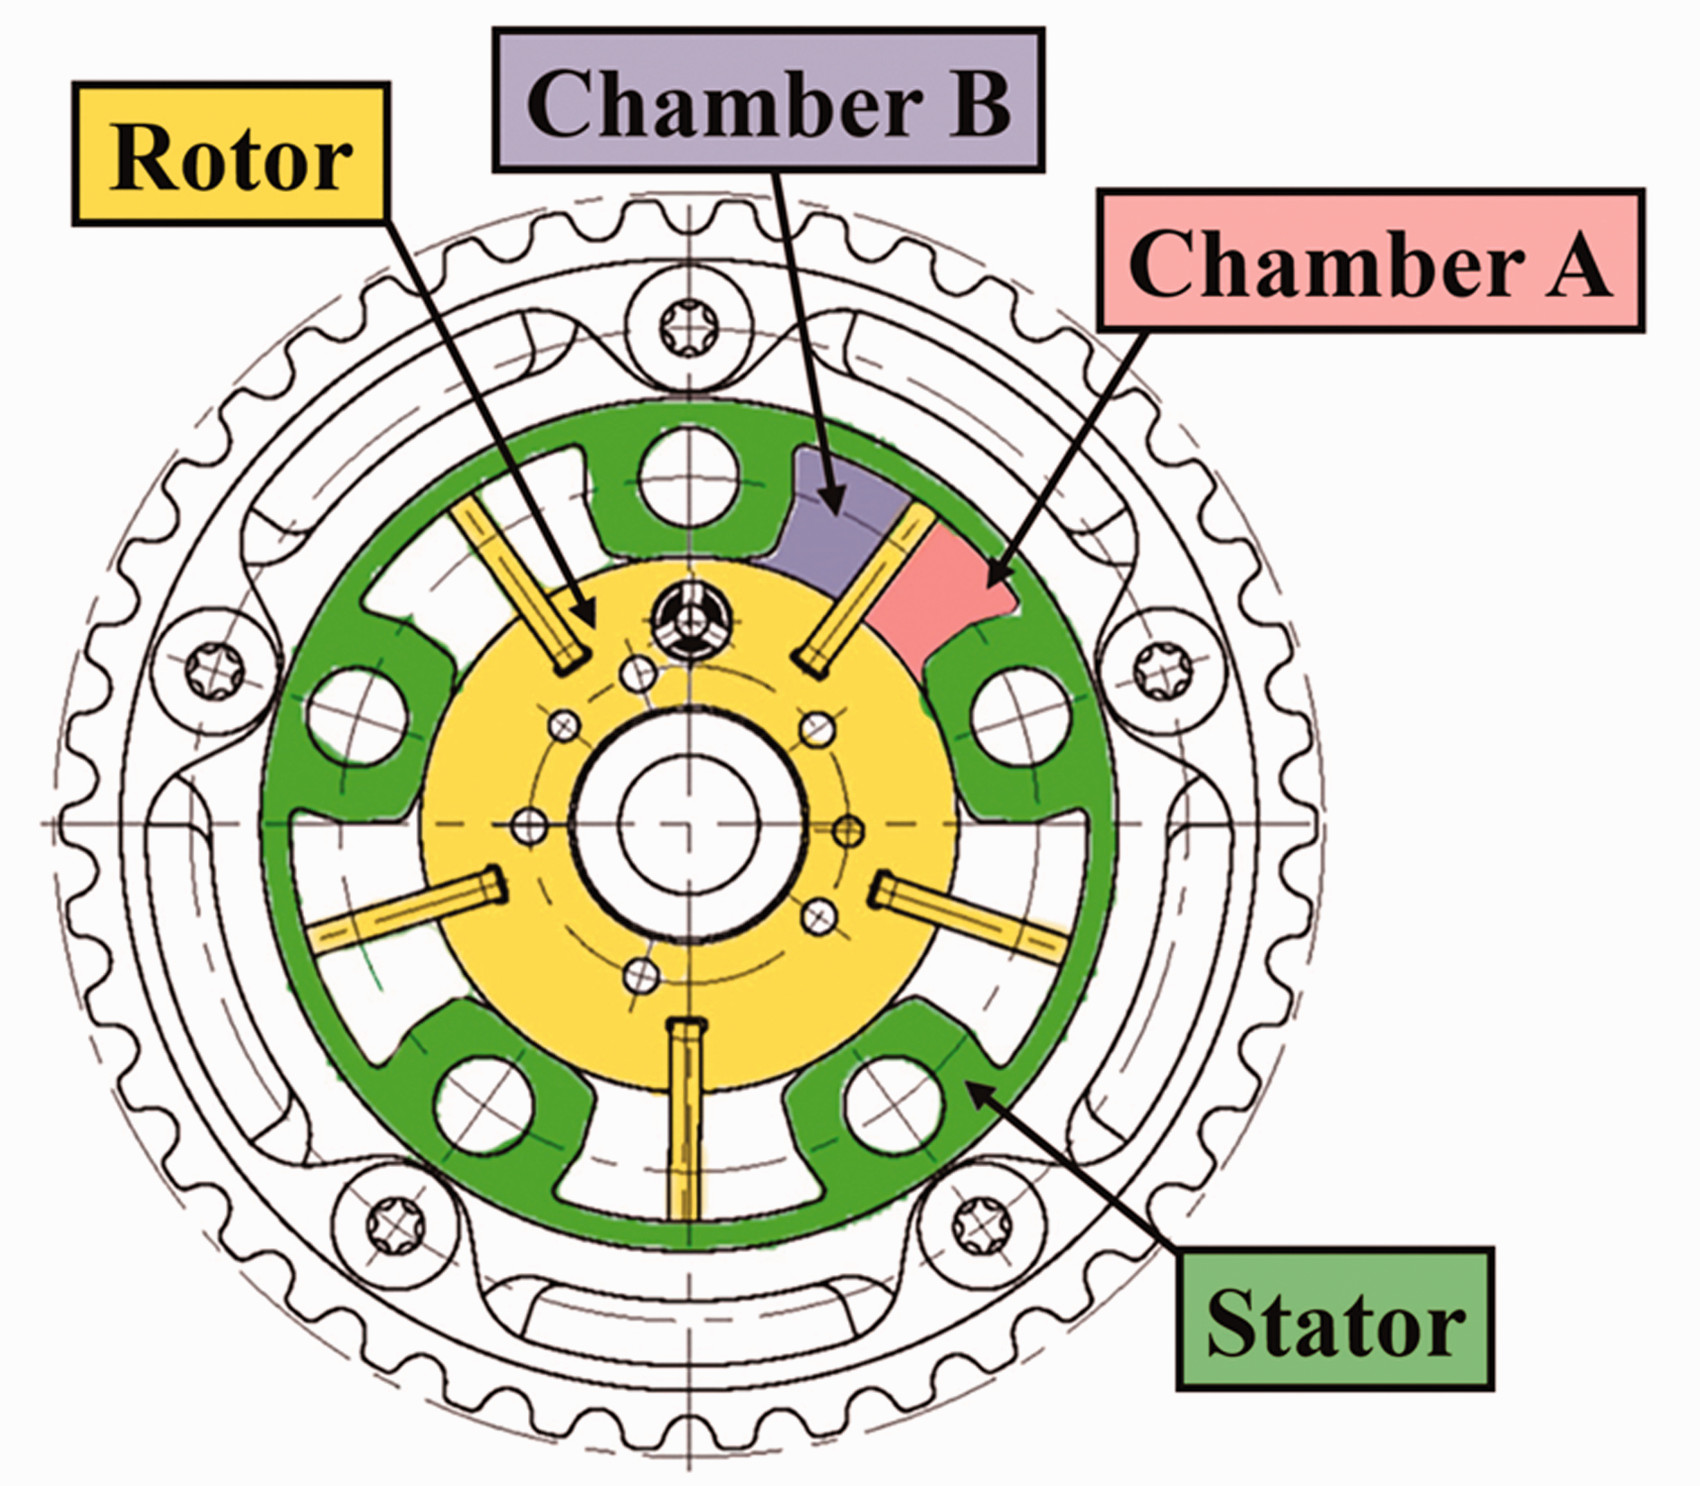
Schematic diagram of the VVT phaser structure.
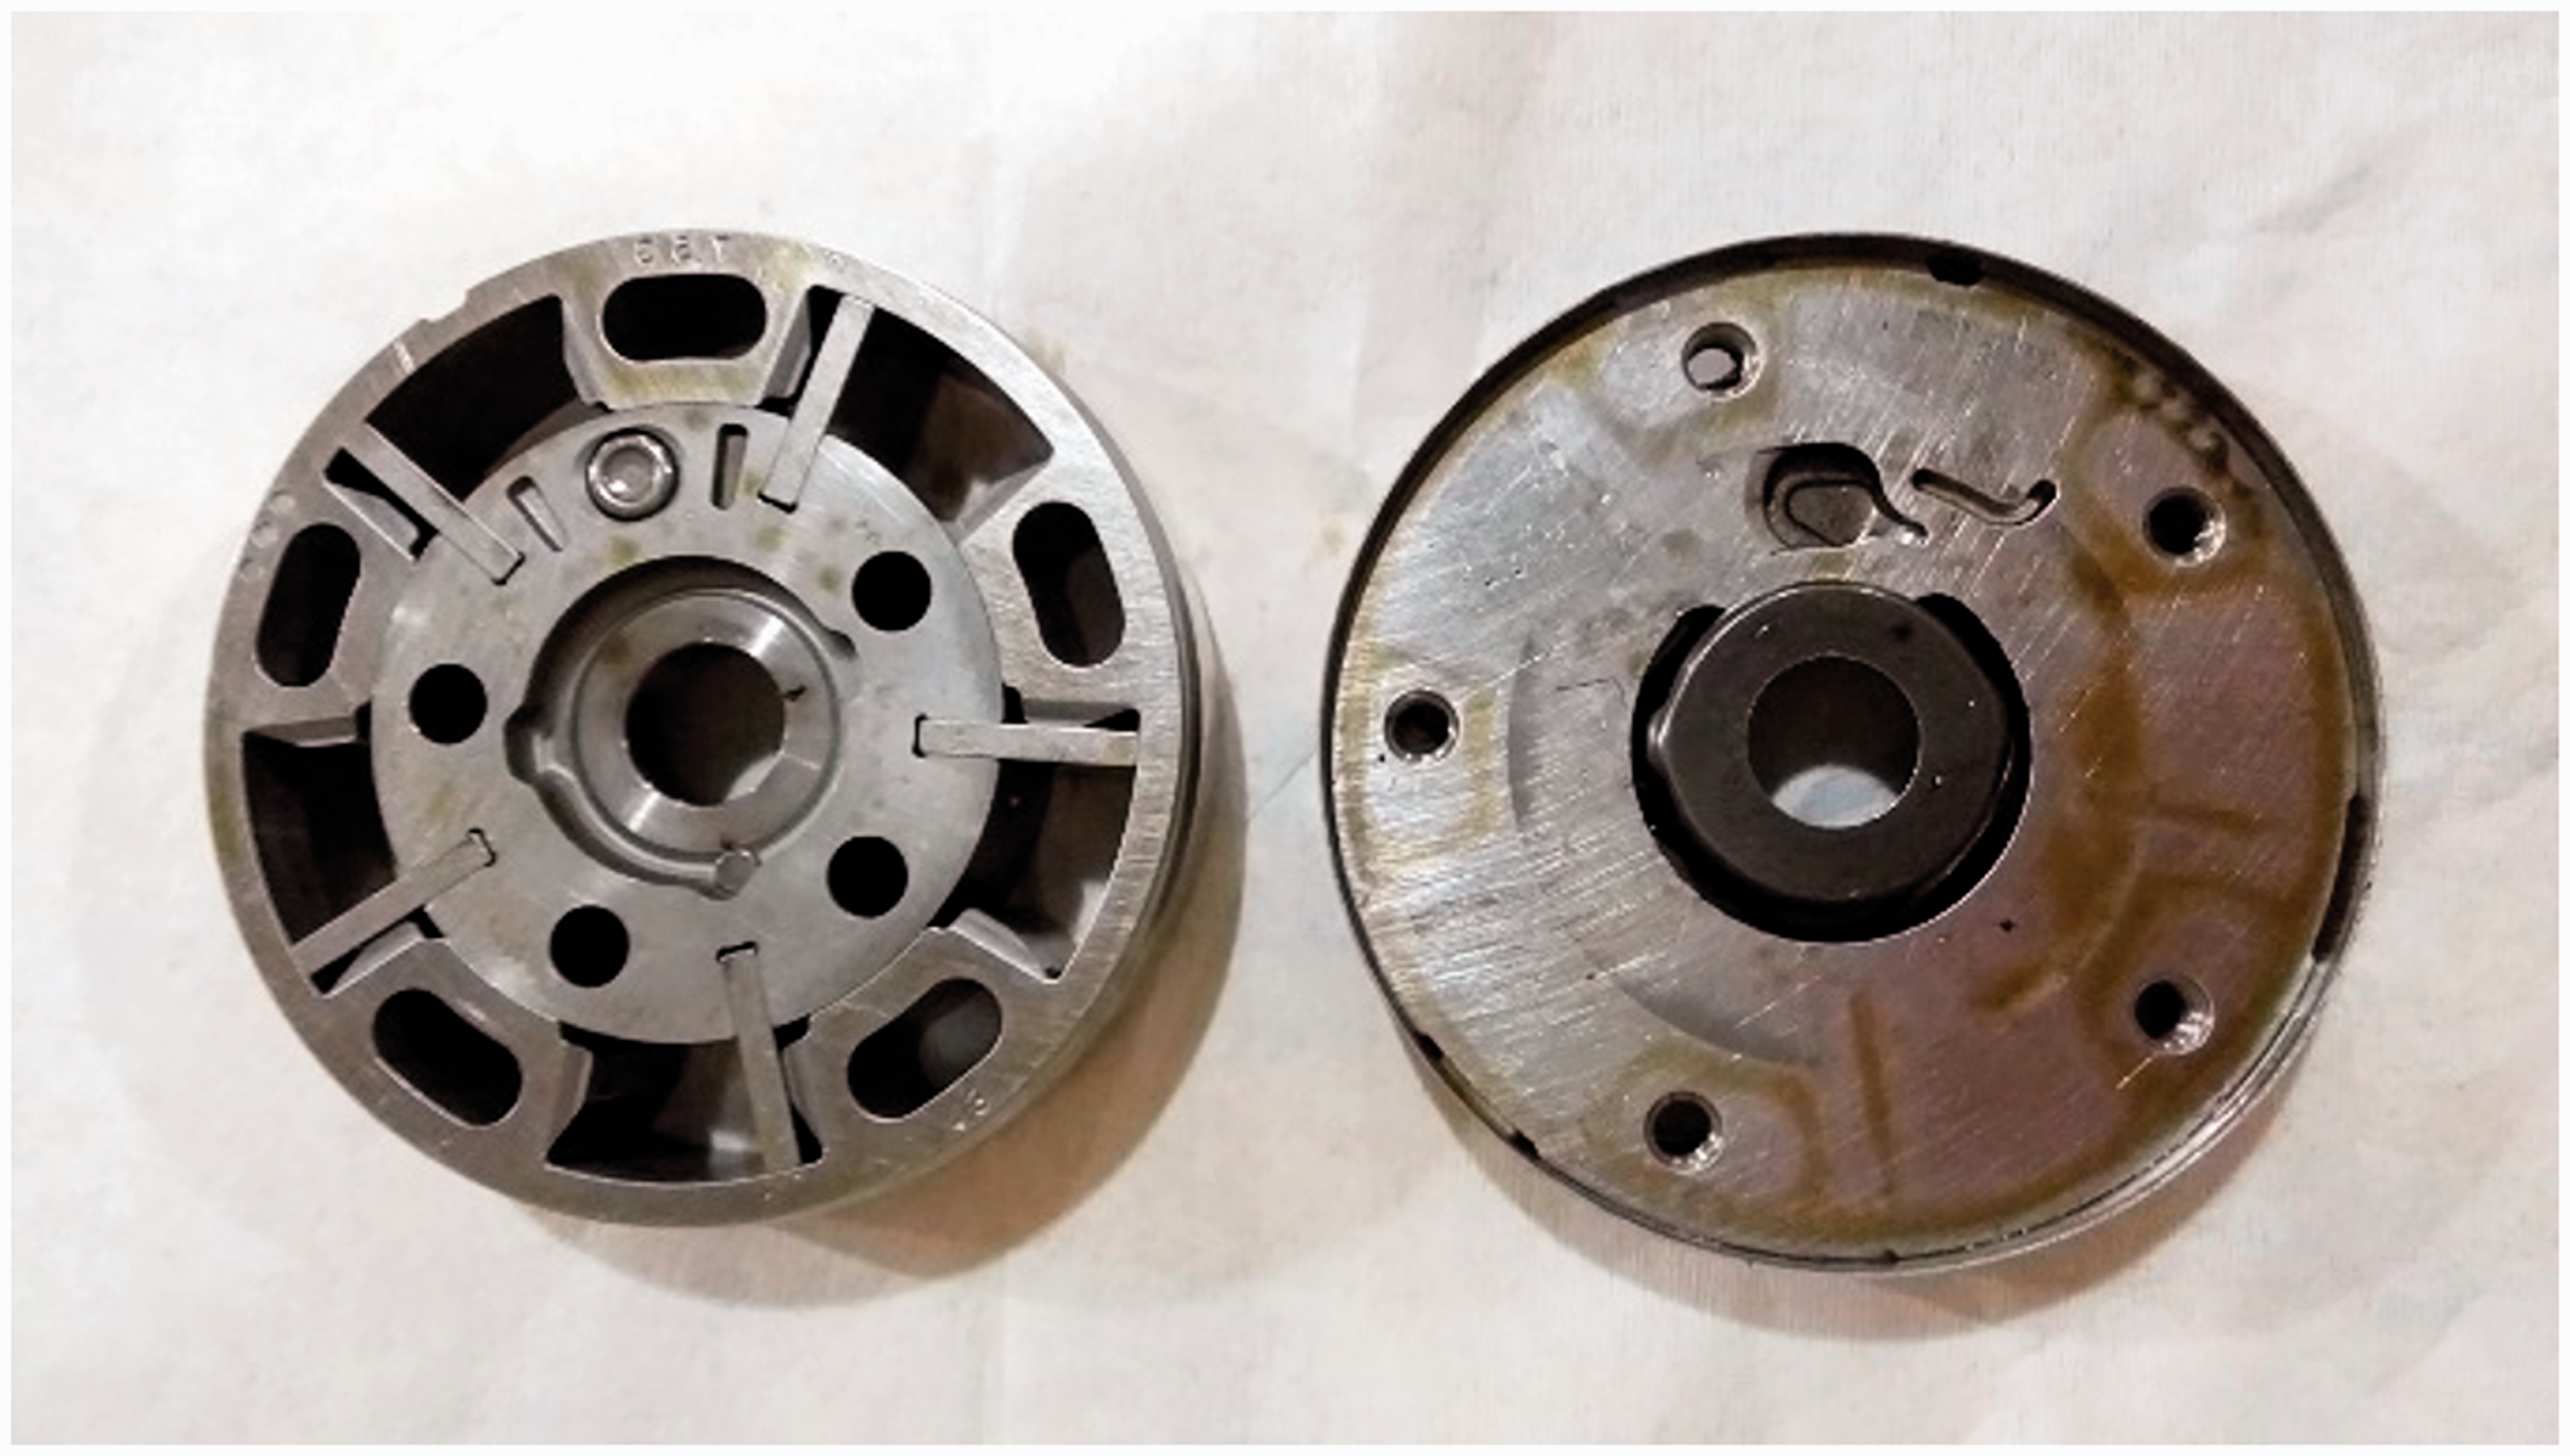
The VVT phaser of the rattling engine.
Specification of the VVT.
Abnormal noise mechanism
A valve train dynamics model is built to investigate the moment and the origin of the abnormal noise. The model includes intake camshaft, rocker arms, valves, valve springs, hydraulic tappets, and valve seats. The driving torque of high pressure pump is loaded on the rear end of the camshaft. Lifts, velocities, accelerations, and forces of each part of the valve train are calculated based on multi-body dynamic analysis.14,15 In addition, since camshaft rotation velocity and acceleration shown in Figure 7 may contain information of the abnormal noise, camshaft rotation velocity fluctuation is also included in the valve train dynamic model.
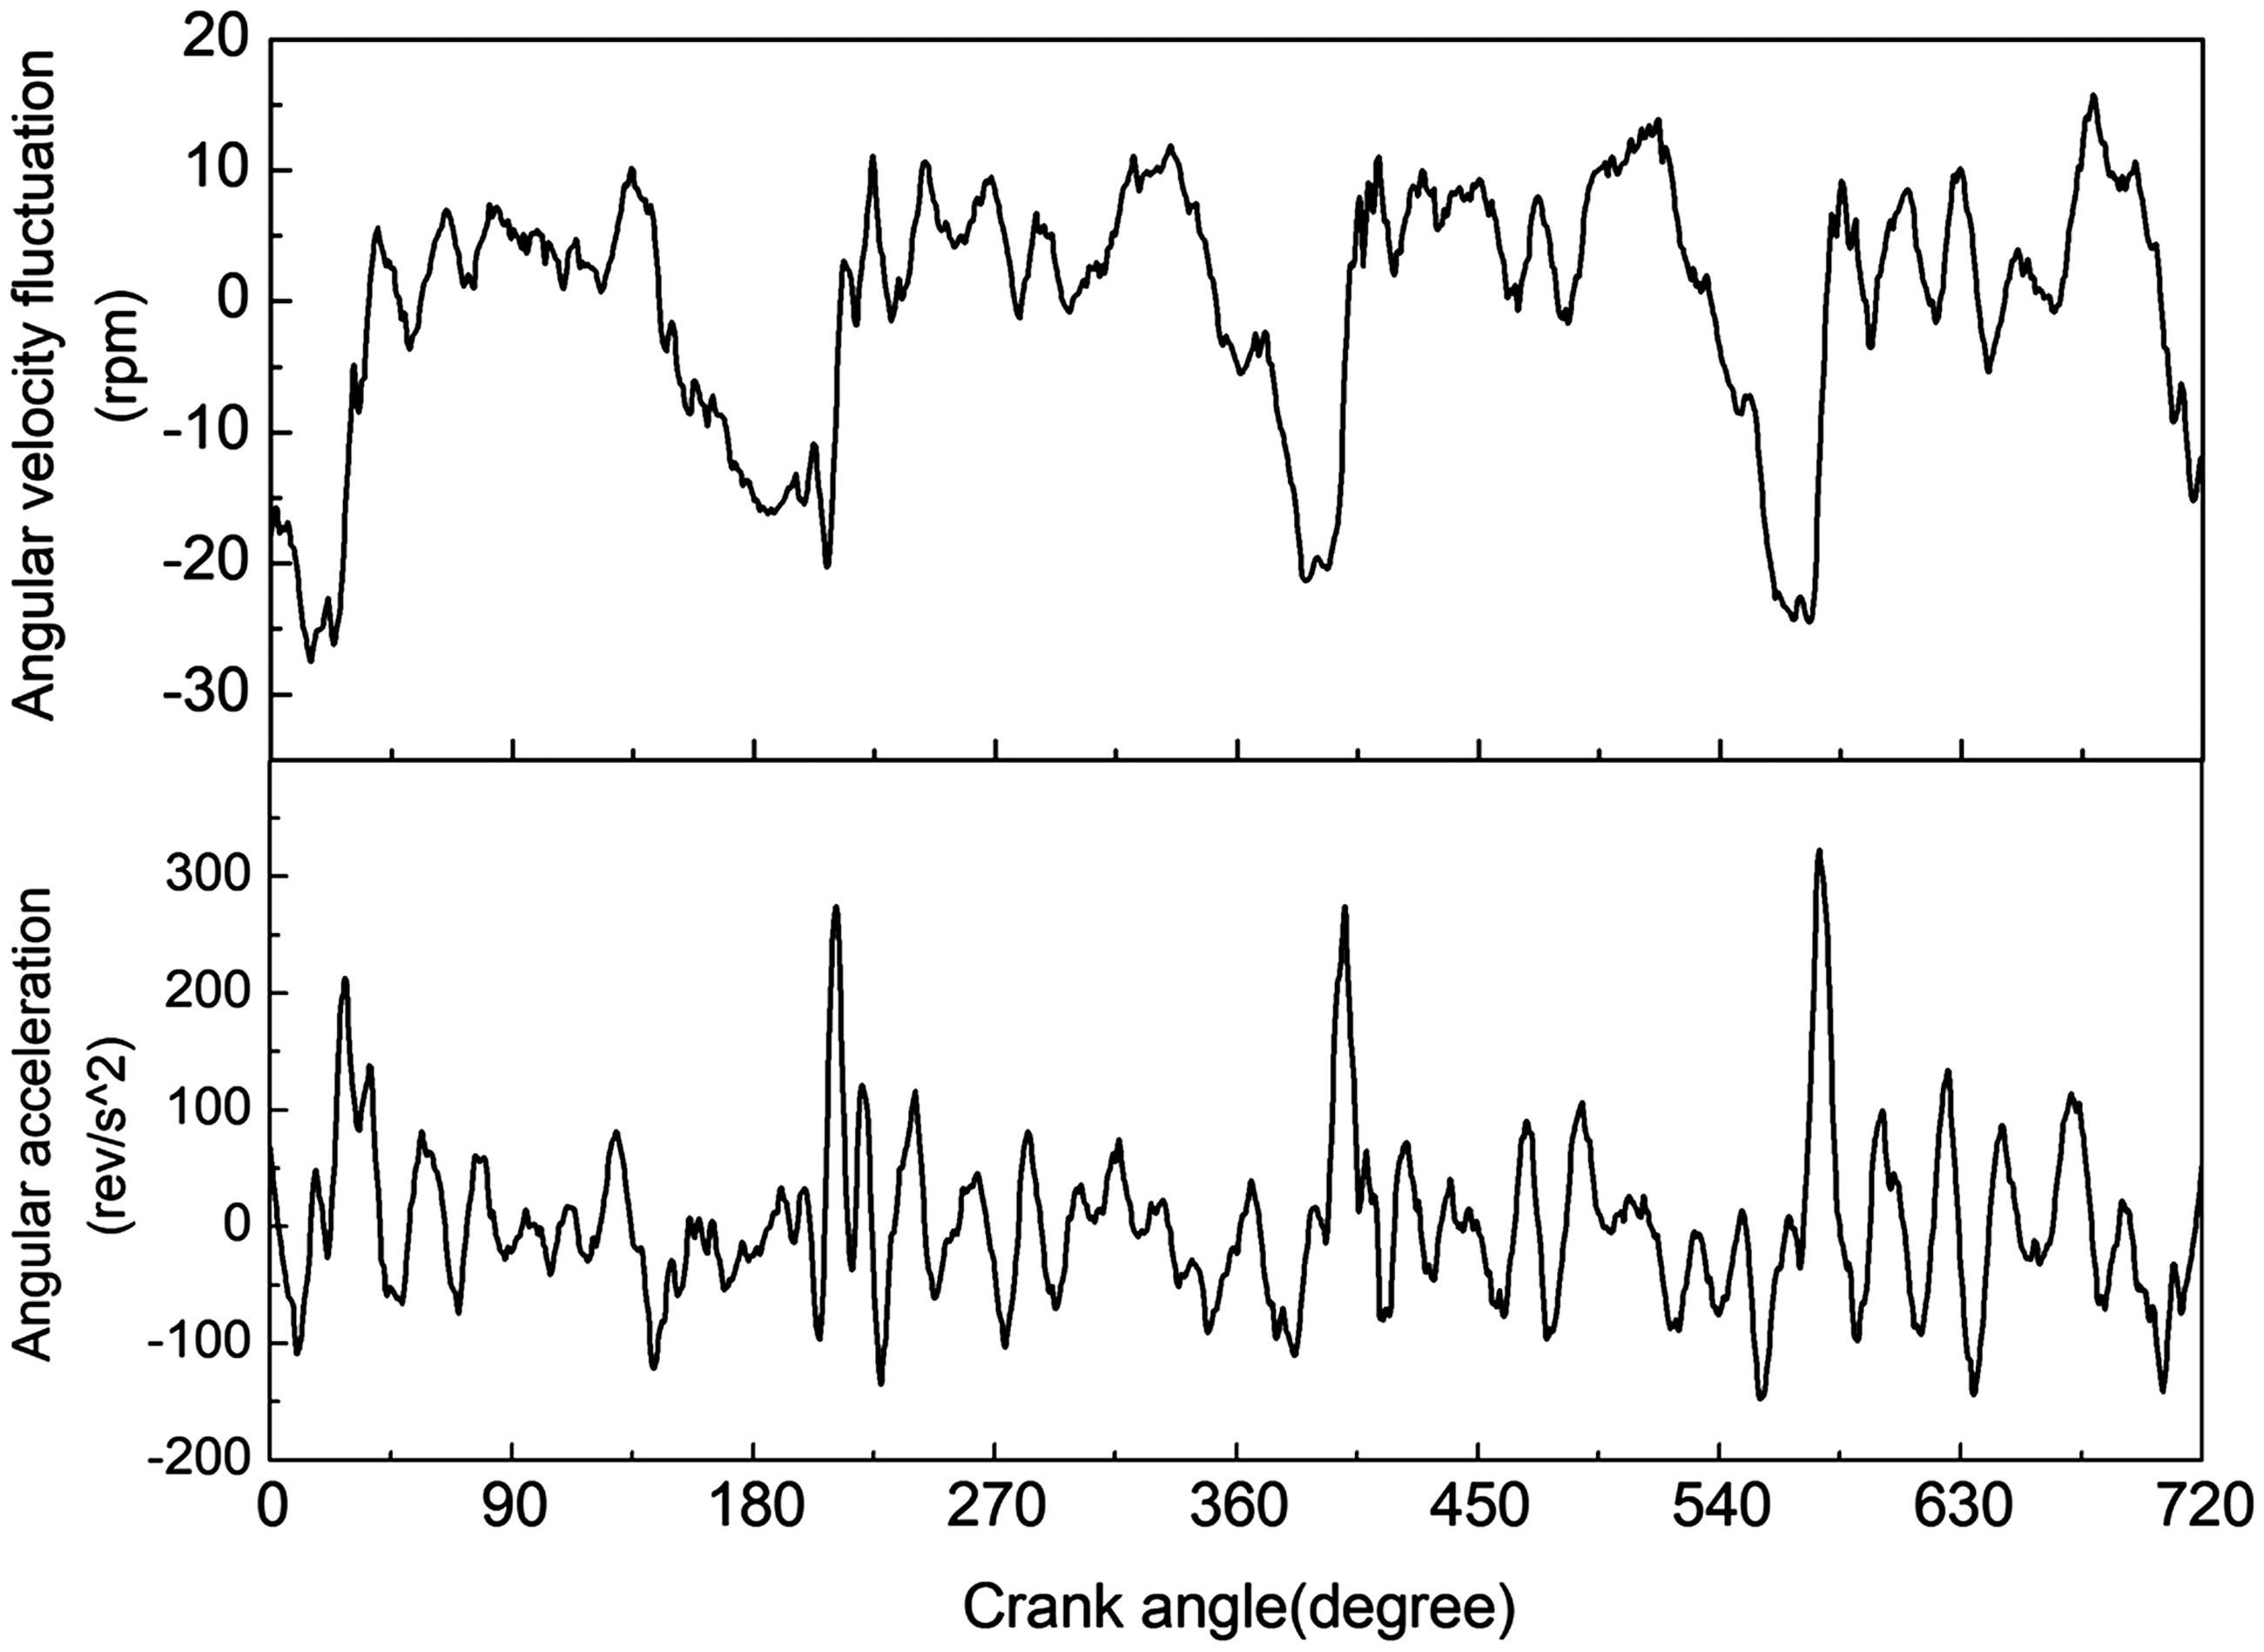
Camshaft rotation angular velocity fluctuation and angular acceleration in the experiments.
Six engine working cycles of the dynamic results are calculated, and the fourth cycle is chosen to analyze for its better calculation stability. The results of the lift and the velocity of cylinder 1# cam in one cycle (0–720° crank angle) are shown in Figure 8, where the starting point (0°) is the top dead center of the compression stroke of cylinder 1#.
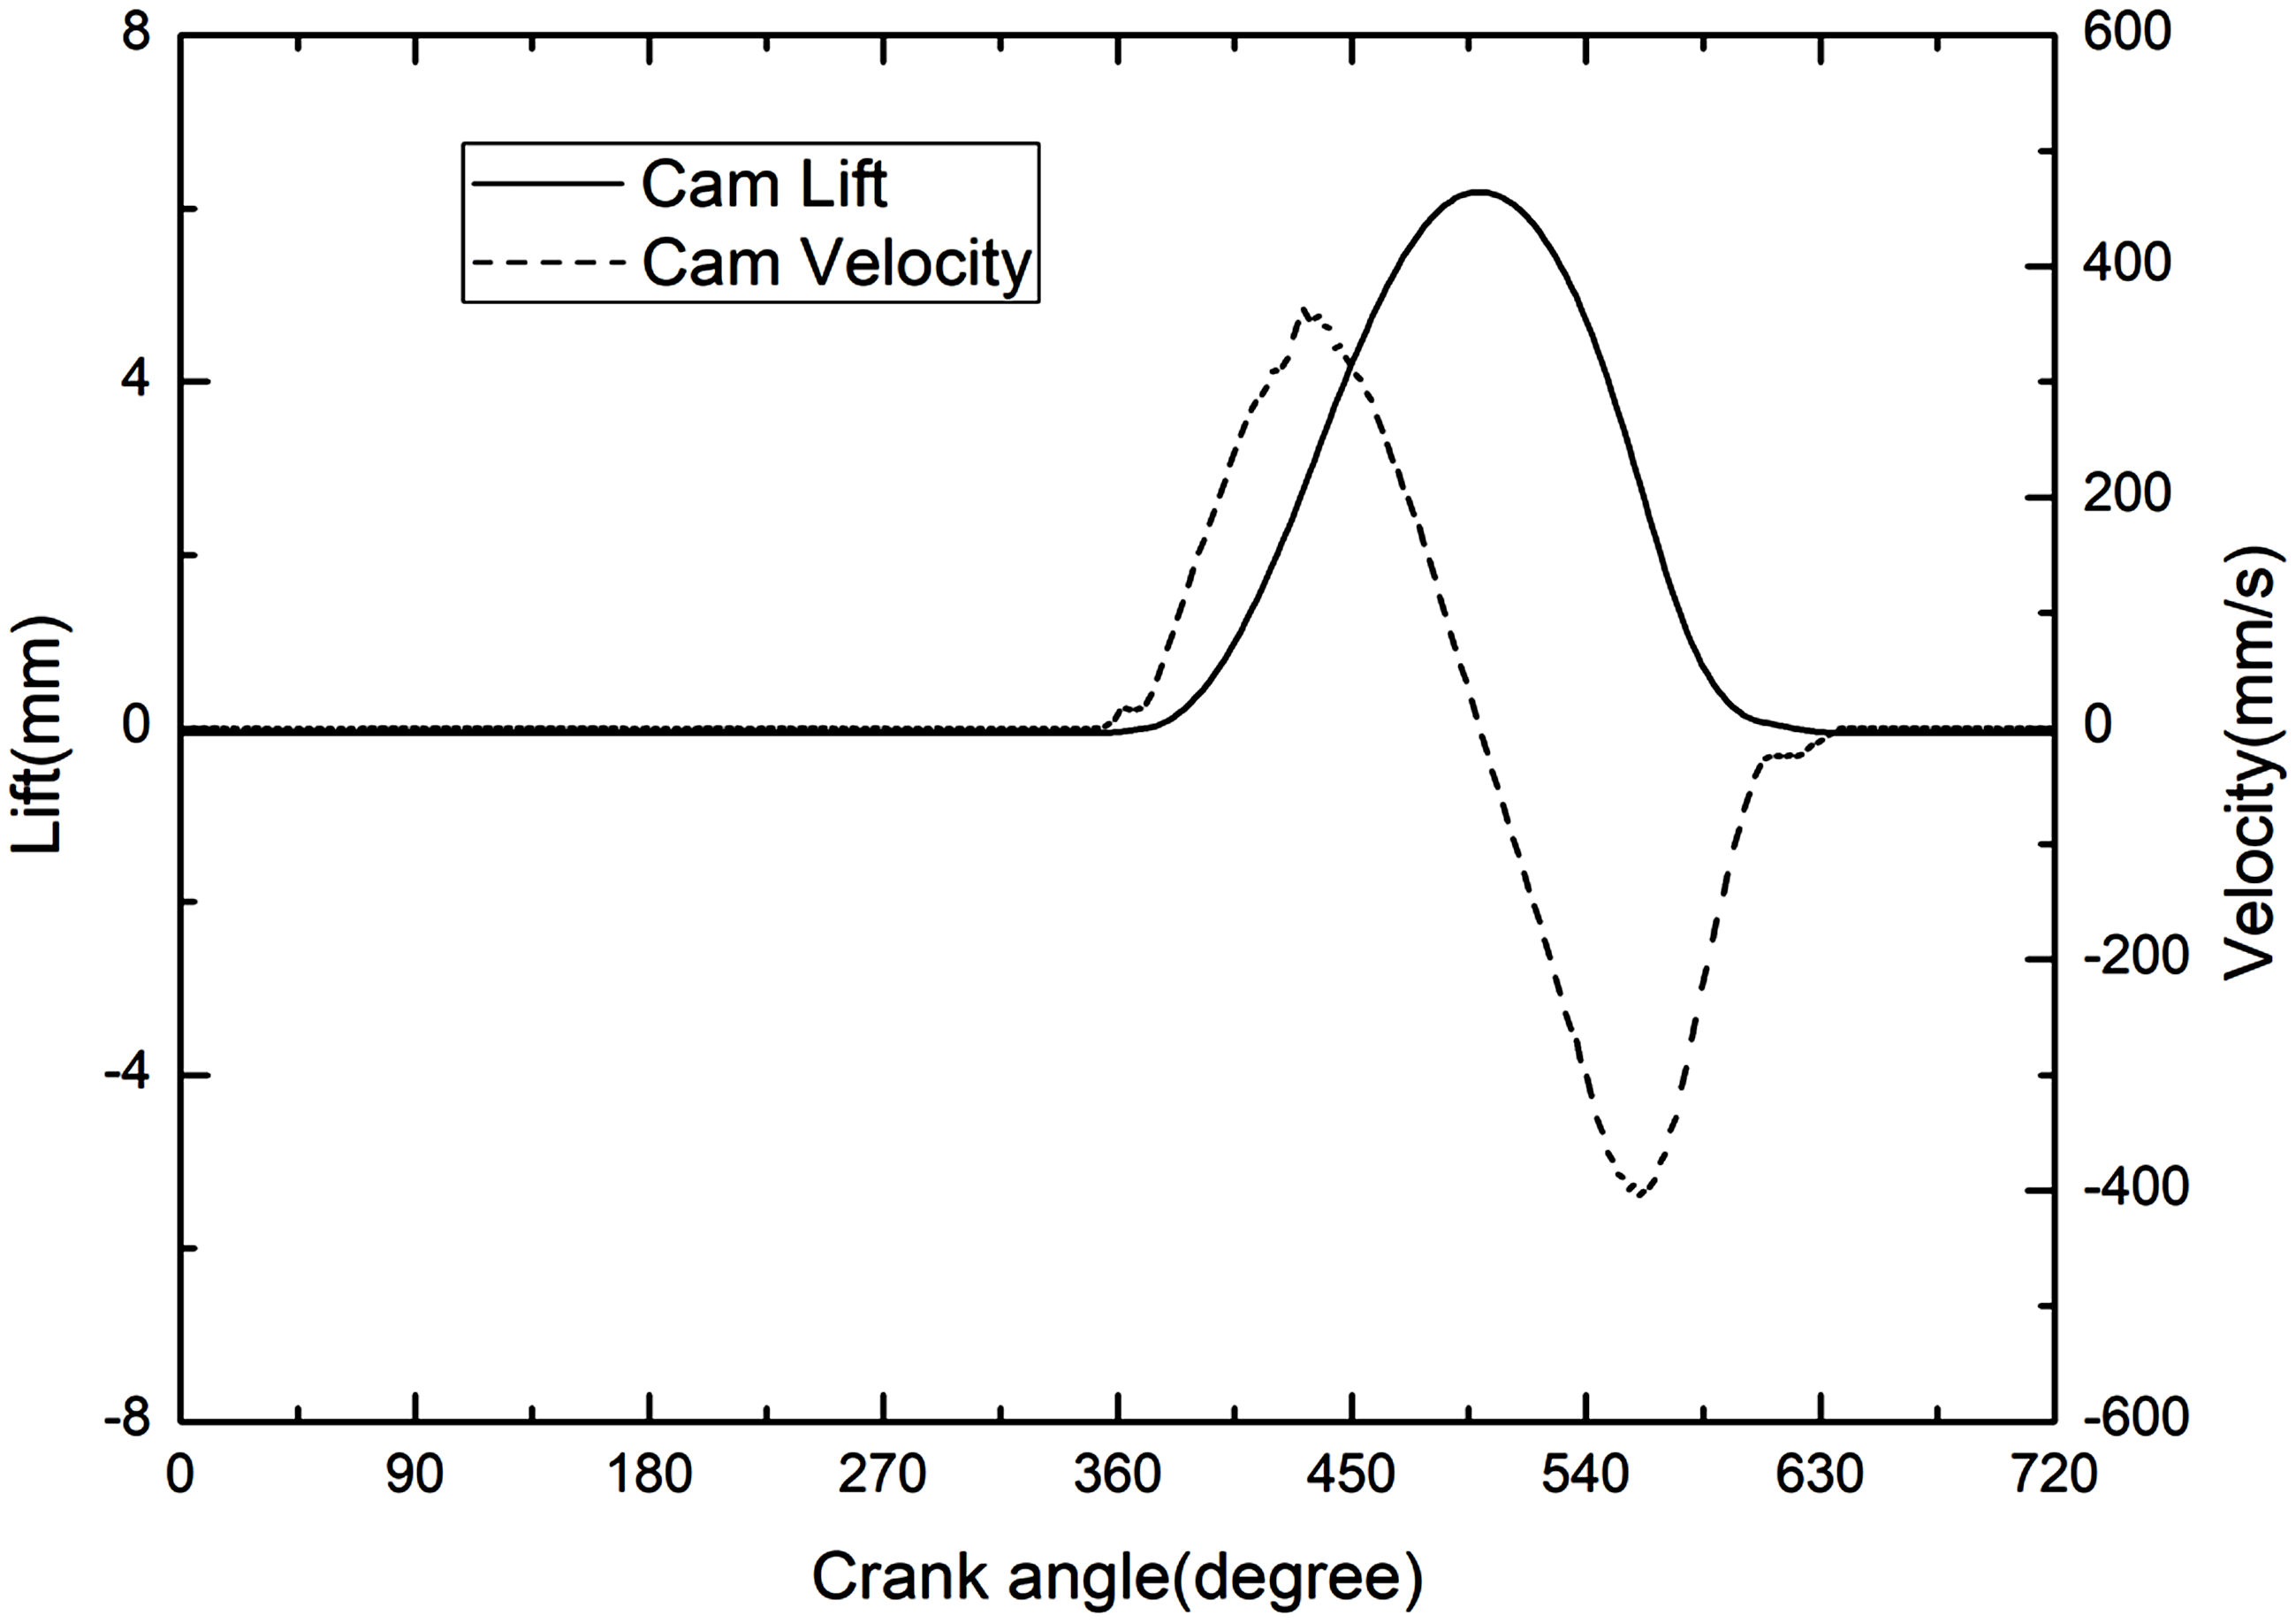
Simulation results of the lift and the velocity of cylinder 1# cam.
As shown in Figure 9(a), the simulation result of the acceleration of cylinder 1# cam shows two obvious impacts in one cycle. One impact around 630° CA (crank angle) is caused by valve seating, while the other impact around 445° CA is not originated from the valves. The TFD of the near-field noise in one cycle is shown in Figure 10, and it can be found that the abnormal noise also occurs around 445° CA. Therefore, the impact around 445° CA is inferred to relate to the abnormal noise.
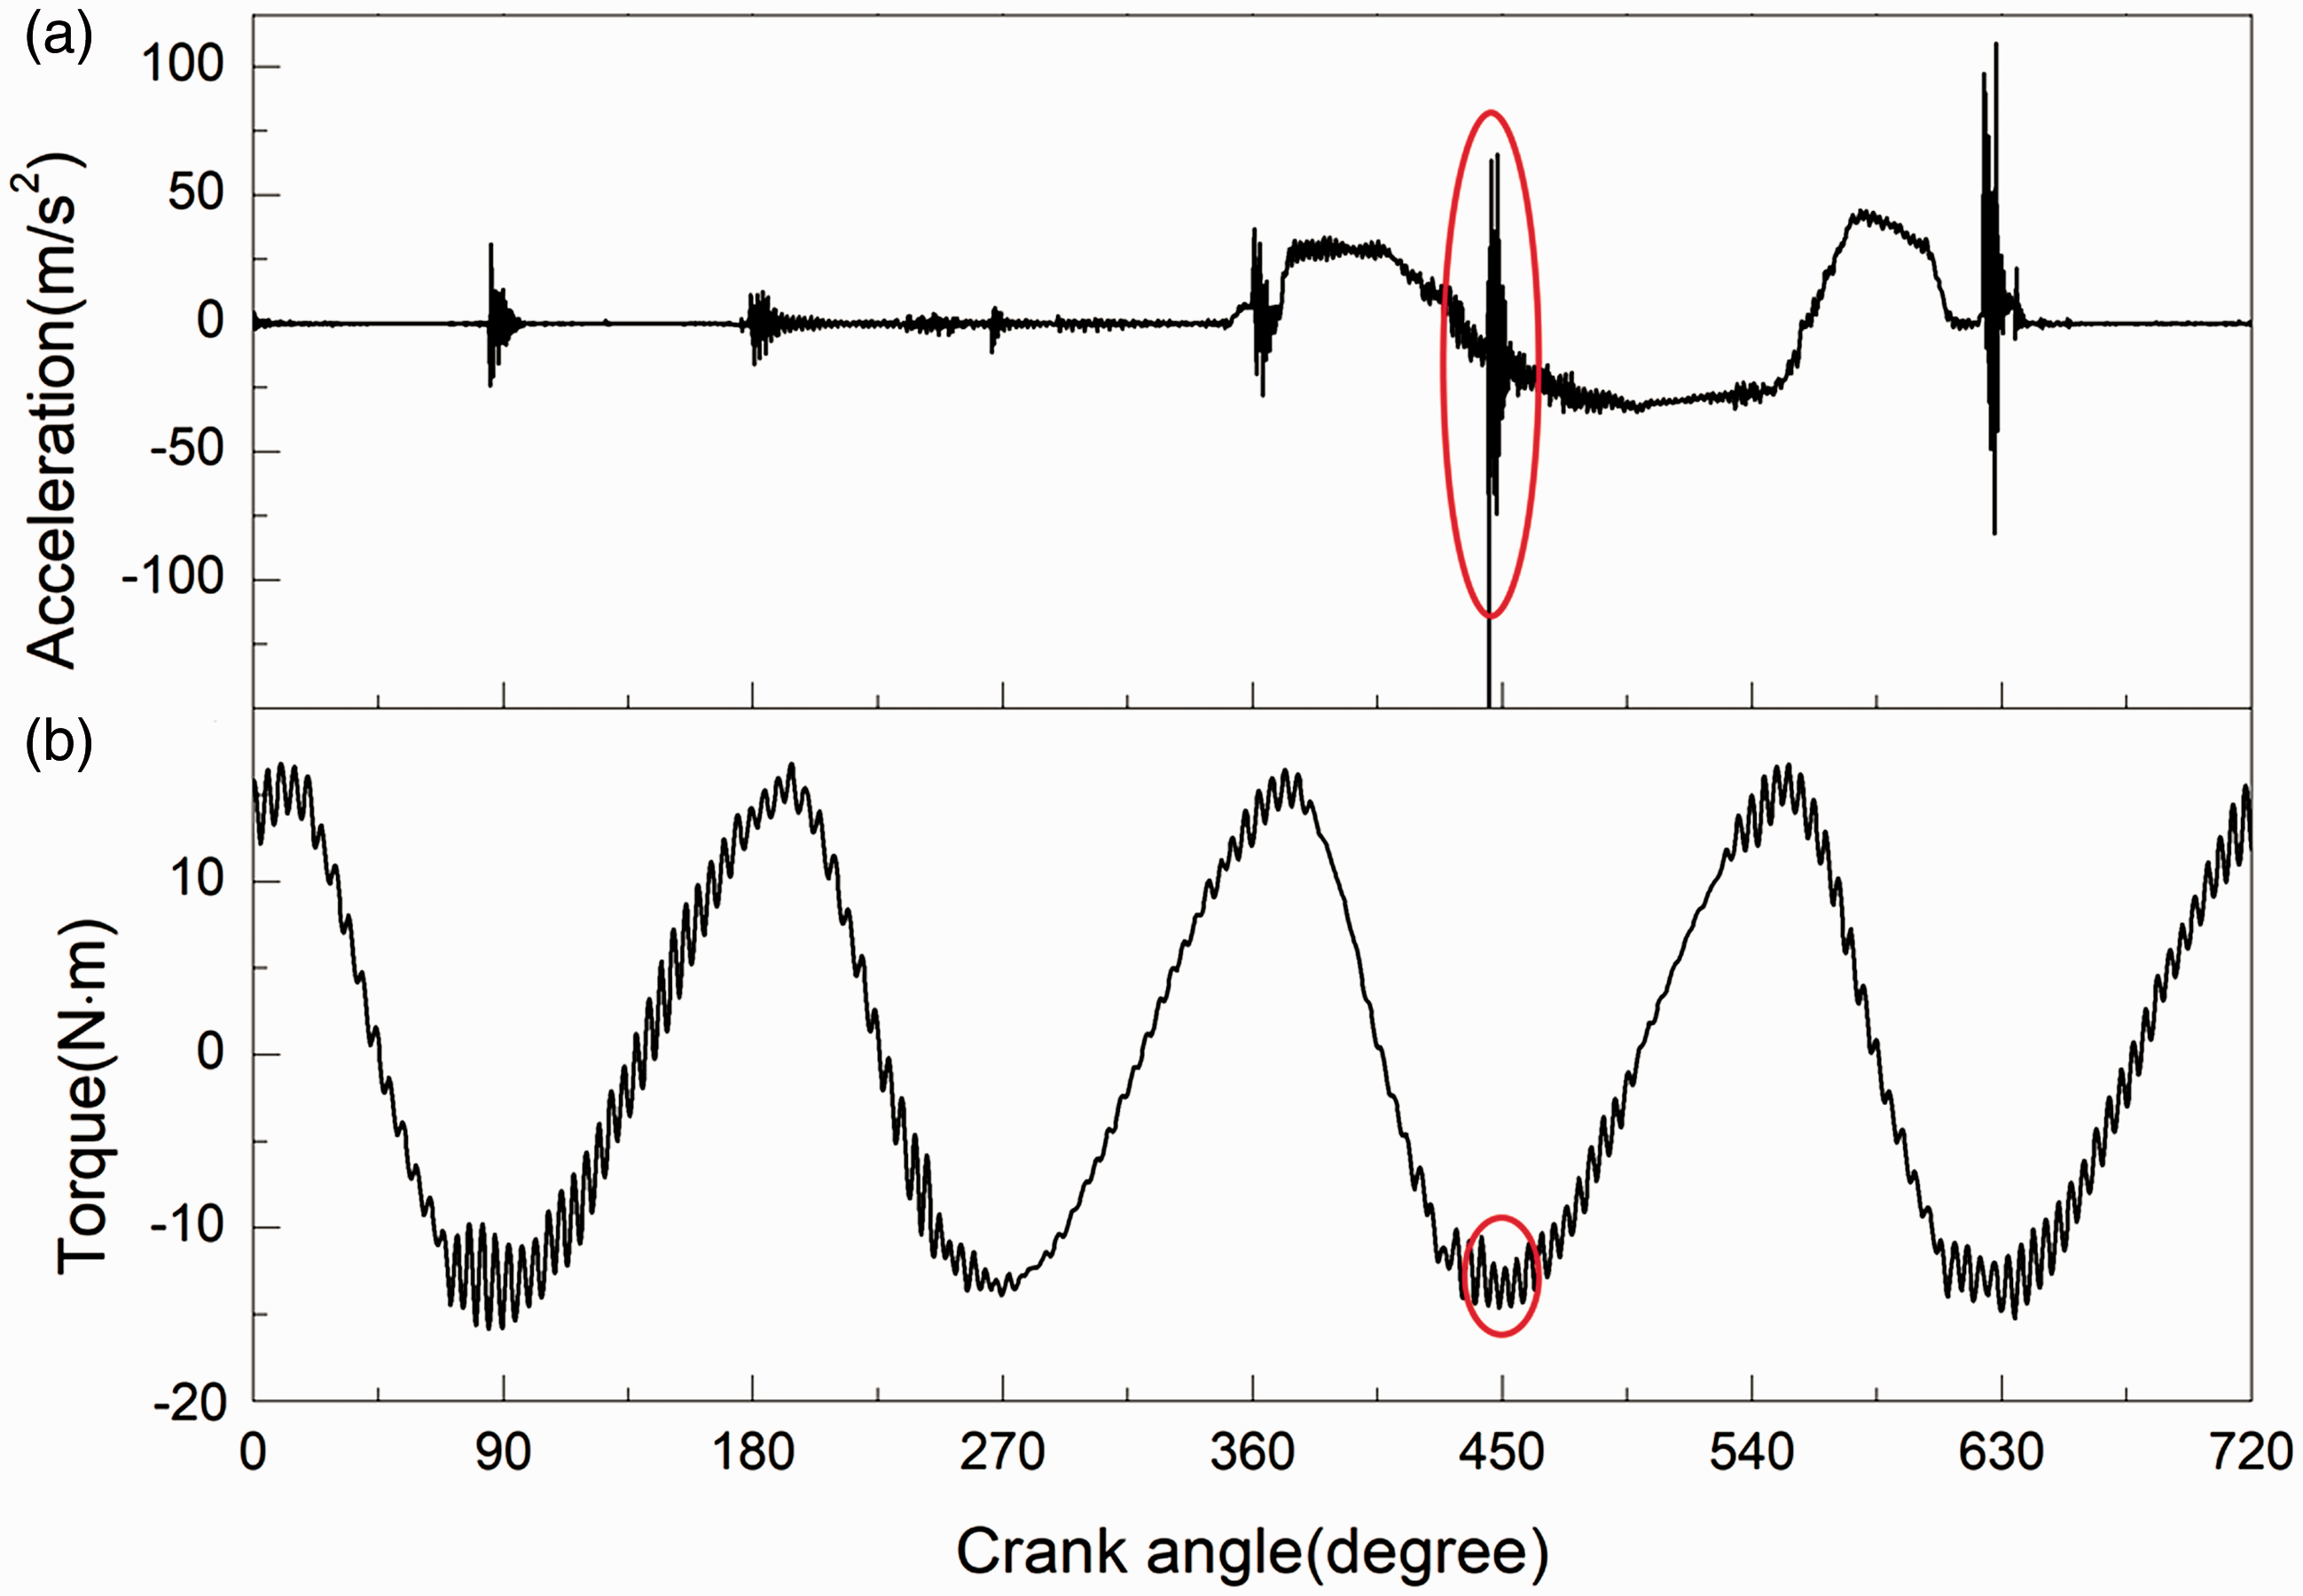
Simulation results of the valve train model: (a) acceleration of cylinder 1# cam; (b) load torque of the camshaft.
TFD of near-field noise 10 cm above the cylinder head cover in one cycle (720° CA).
As both the valves opening and oil pump are driven by intake camshaft, the load torque of camshaft indicates the periodic change as shown in Figure 9(b). Under idle condition, VVT phaser should be in the initial position, and the rotor and stator should always be in contact. However, when the camshaft load torque is below zero (407° CA), the rotor bears a counterclockwise torque. Meanwhile, oil pressure in chamber B cannot maintain the rotor in the initial position, causing that the rotor blades disengage from the stator under negative load torque as shown in Figure 11.
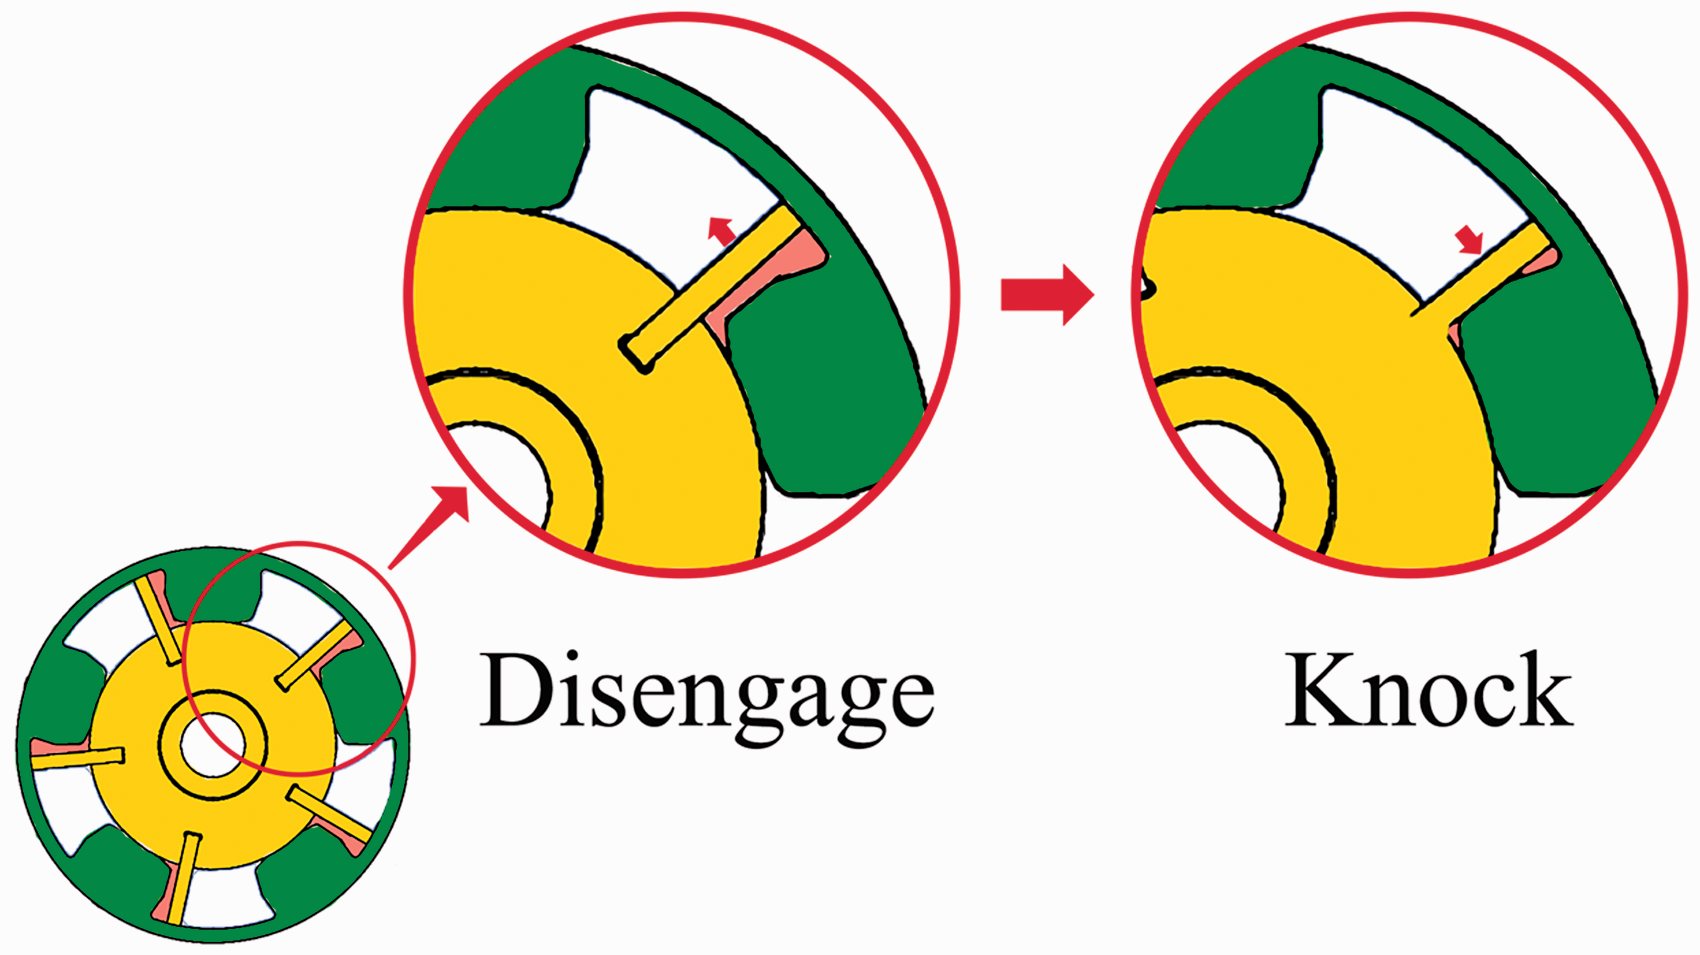
Schematic diagram of the origin of the abnormal noise.
As both the valves opening and oil pump are driven by intake camshaft, the load torque of camshaft indicates periodic change as shown in Figure 9(b). Under idle condition, VVT phaser should be in the initial position, and the rotor and stator should always be in contact. However, when the camshaft load torque is below zero (407° CA), the rotor bears a counterclockwise torque. Meanwhile, oil pressure in chamber B cannot maintain the rotor in the initial position, causing that the rotor blades disengage from the stator under negative load torque as shown in Figure 11.
When the camshaft negative load torque reaches the maximum value, meanwhile, oil pressure in chamber B reaches the maximum value, and the clearance between the rotor blades and the stator reaches the maximum. Under the effect of the torque reduction and the oil pressure difference, the rotor quickly rotates back to the initial position and knocks the stator, causing vibration of valve train and abnormal noise.
Although the load torque of camshaft has four cycles in 720° CA, the knock occurs only when the cylinder 1# cam works. The explanations are discussed as follows: the position of cylinder 1# is closer to the VVT, and the load torque given by the cylinder 1# valve spring is more directly transmitted to the front end of the camshaft, while the other cams are farther from the VVT. The evidence is that only cylinder 1# cam opening makes load torque drop smoothly as shown in Figure 9(b). Considering the torsional deformation of the camshaft, less rotation displacement of the front end of the camshaft connected with the VVT rotor is given by the torque when other cylinder cams work, which do not reach the threshold of the knock. Therefore, the rhythm of the abnormal noise is half order (time interval = 0.17 s), which is easily perceived by users.
Numerical analyses of the abnormal noise
Based on the mechanism analysis of the abnormal noise, the process of the abnormal noise is described as follows: the knock in VVT phaser excites the vibration of the intake camshaft, and then the vibration is transmitted from the journal of camshaft to the bearing on the cylinder head; finally, the abnormal noise radiated from the surface vibration of the cylinder head is heard. The simulation model is based on the actual transmission path of the vibration and the noise to restore the generation of vibration and noise as real as possible.
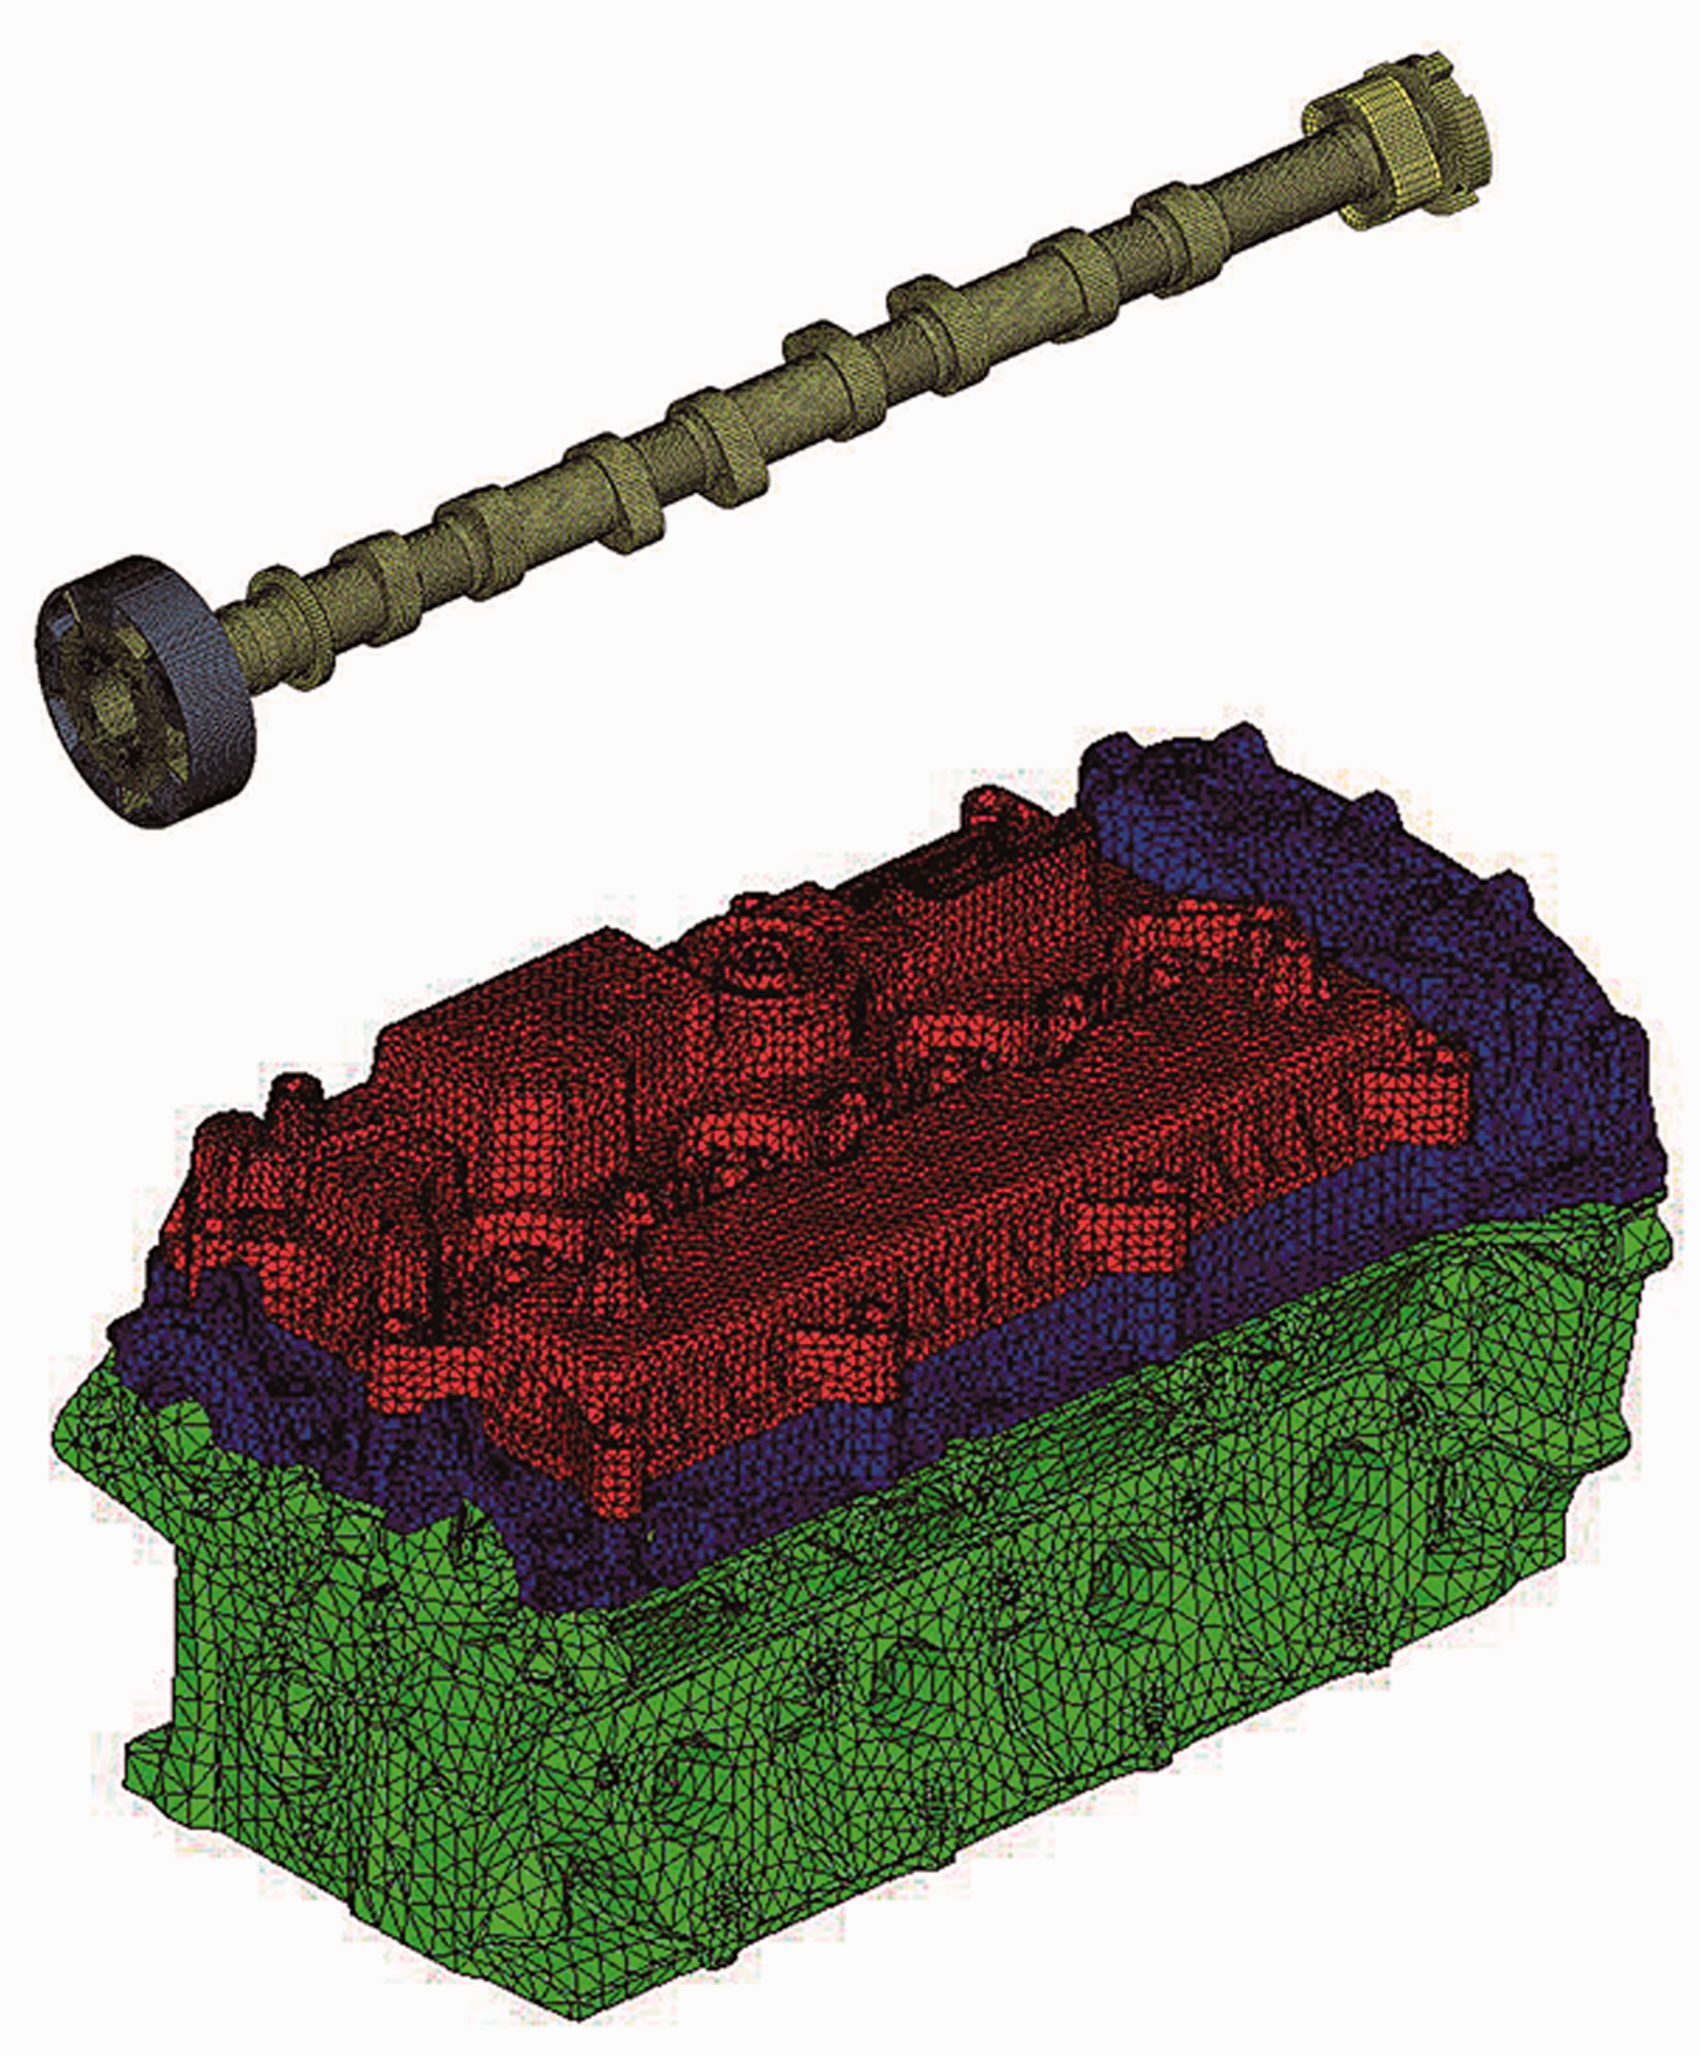
As the internal combustion engine has complex structure with large number of components, it is challenging to establish an abnormal noise model with whole engine due to limitation of the computing power. Based on the transmission path of vibration and noise, the simulation model only retains the intake VVT phaser, the intake camshaft, the cylinder head, the cylinder head cover, and the valve chamber cover. All other components are not considered in the model.
Establishment of FEM models
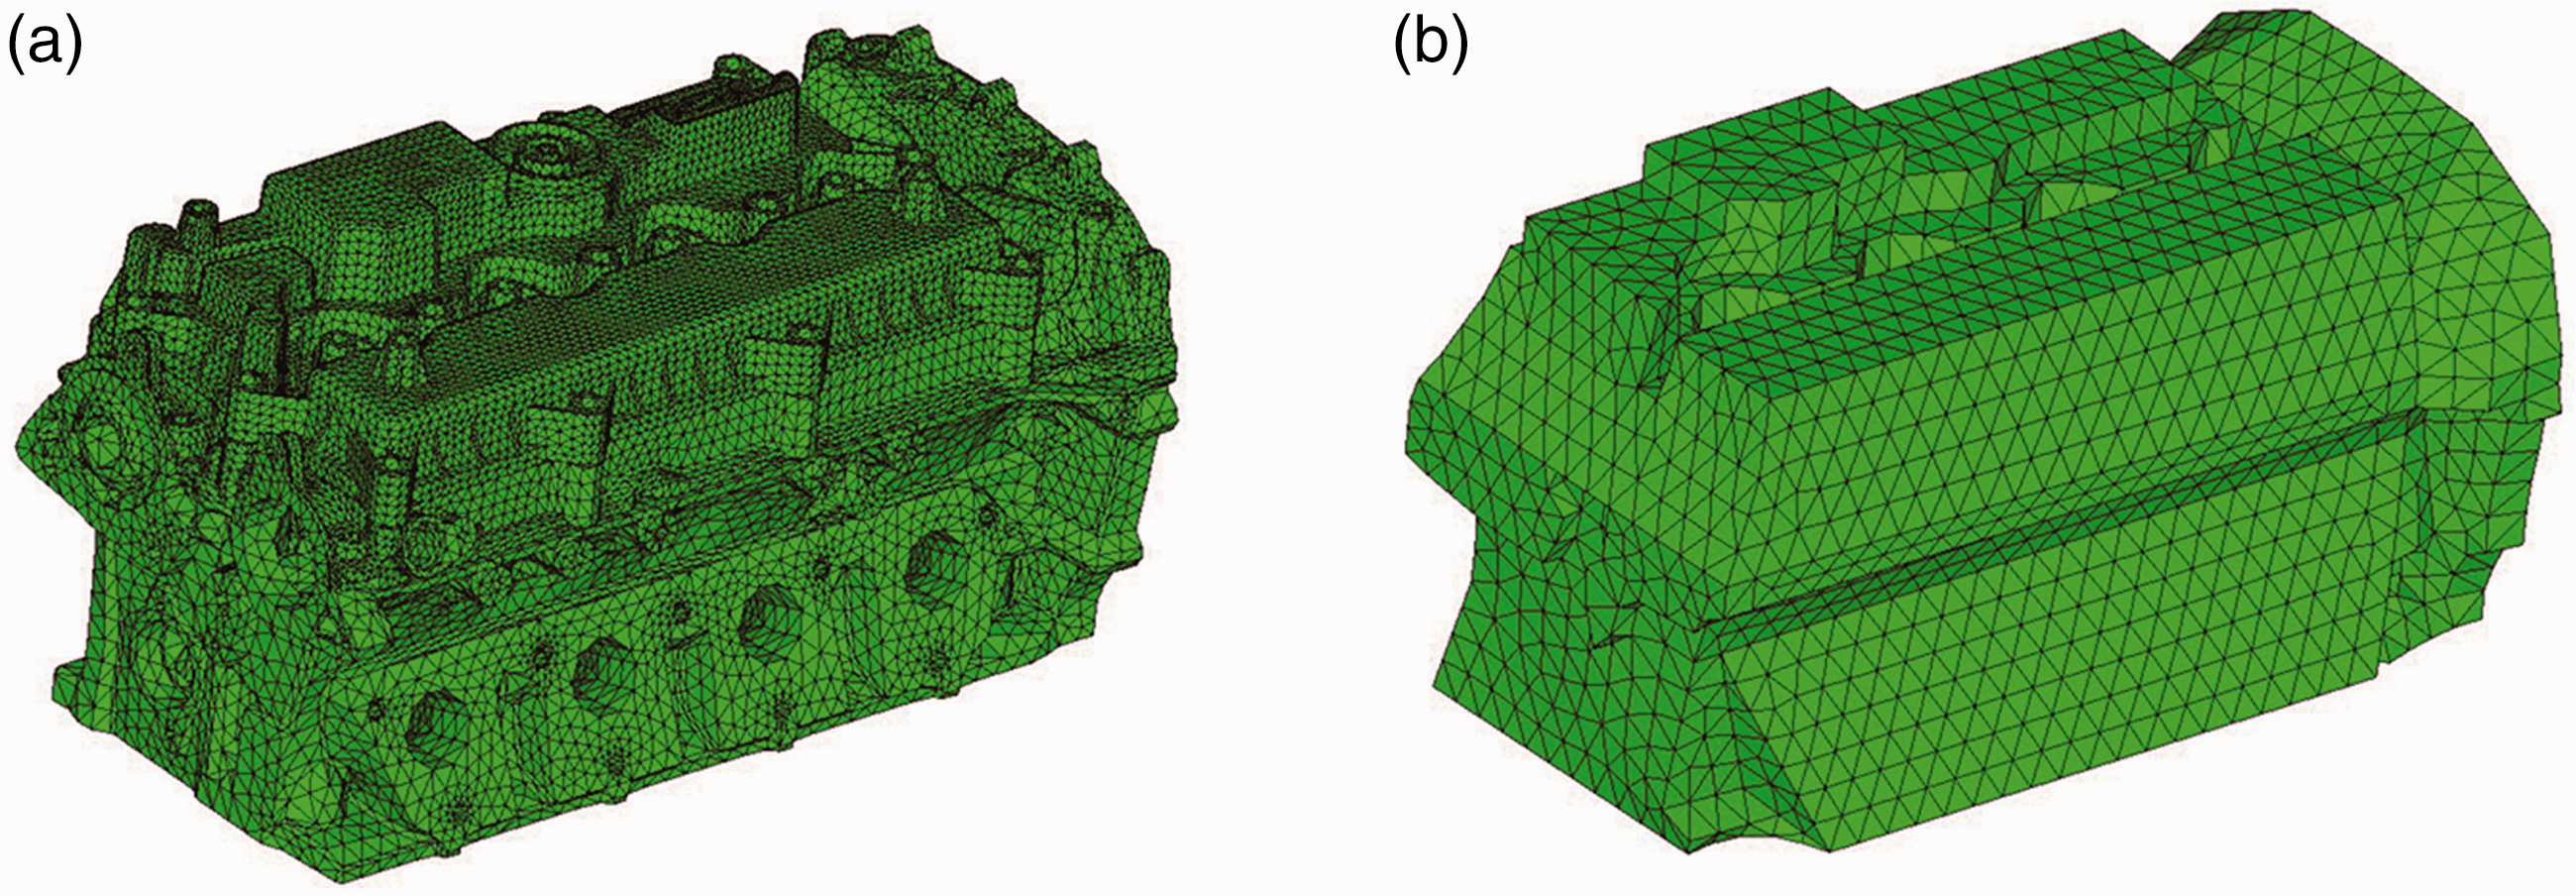
As Figure 12 shows, finite element method (FEM) models of VVT phaser, intake camshaft, cylinder head, valve chamber cover, and cylinder head cover are built based on three-dimensional model of each parts. Given the fact that the VVT phaser and intake camshaft have regular and symmetrical structure, first-order hexahedral elements are adopted in the FEM models. However, the structures of cylinder head, valve chamber cover, and cylinder head cover with many fillets and oil holes are complex, features of which cannot be completely described in FEM models. Thus, second-order tetrahedral elements are adopted in the FEM models of such structures. FEM is used to calculate the natural frequencies and mode shapes of FEM models.
FEM models of VVT phaser, intake camshaft, cylinder head, valve chamber cover, and cylinder head cover.
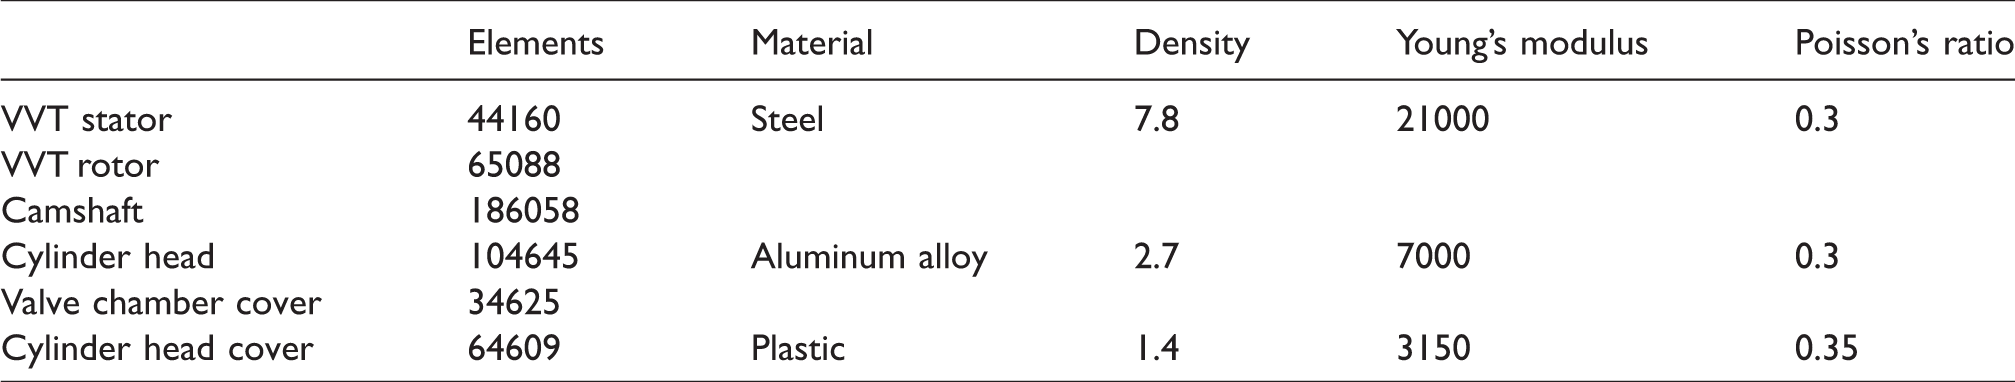
The FEM model of VVT phaser mainly consists of the rotor and the stator, while other parts are not considered in the model for simplicity, including springs, bolts, and gears. The front end of intake camshaft is fixed with the rotor. The cylinder head, the valve chamber cover, and the cylinder head cover are connected with each other by bolts. The parameters of FEM models are shown in Table 3.
FEM models parameters.
In order to verify the accuracy of the FEM models, numerical and experimental free modal analyses of the cylinder head and the camshaft are conducted through Lanczos algorithm and MISO (multi-input single-output) hammering method. 16 The parts are hung on flexible ropes, respectively, a hammer of the type PCB 086C03 is used to excite the structures, an acceleration sensor is set to get natural frequencies and mode shapes, and the experimental modal analysis method can be found in Mohamed et al. 17 The free modal experiment of the camshaft is shown in Figure 13.
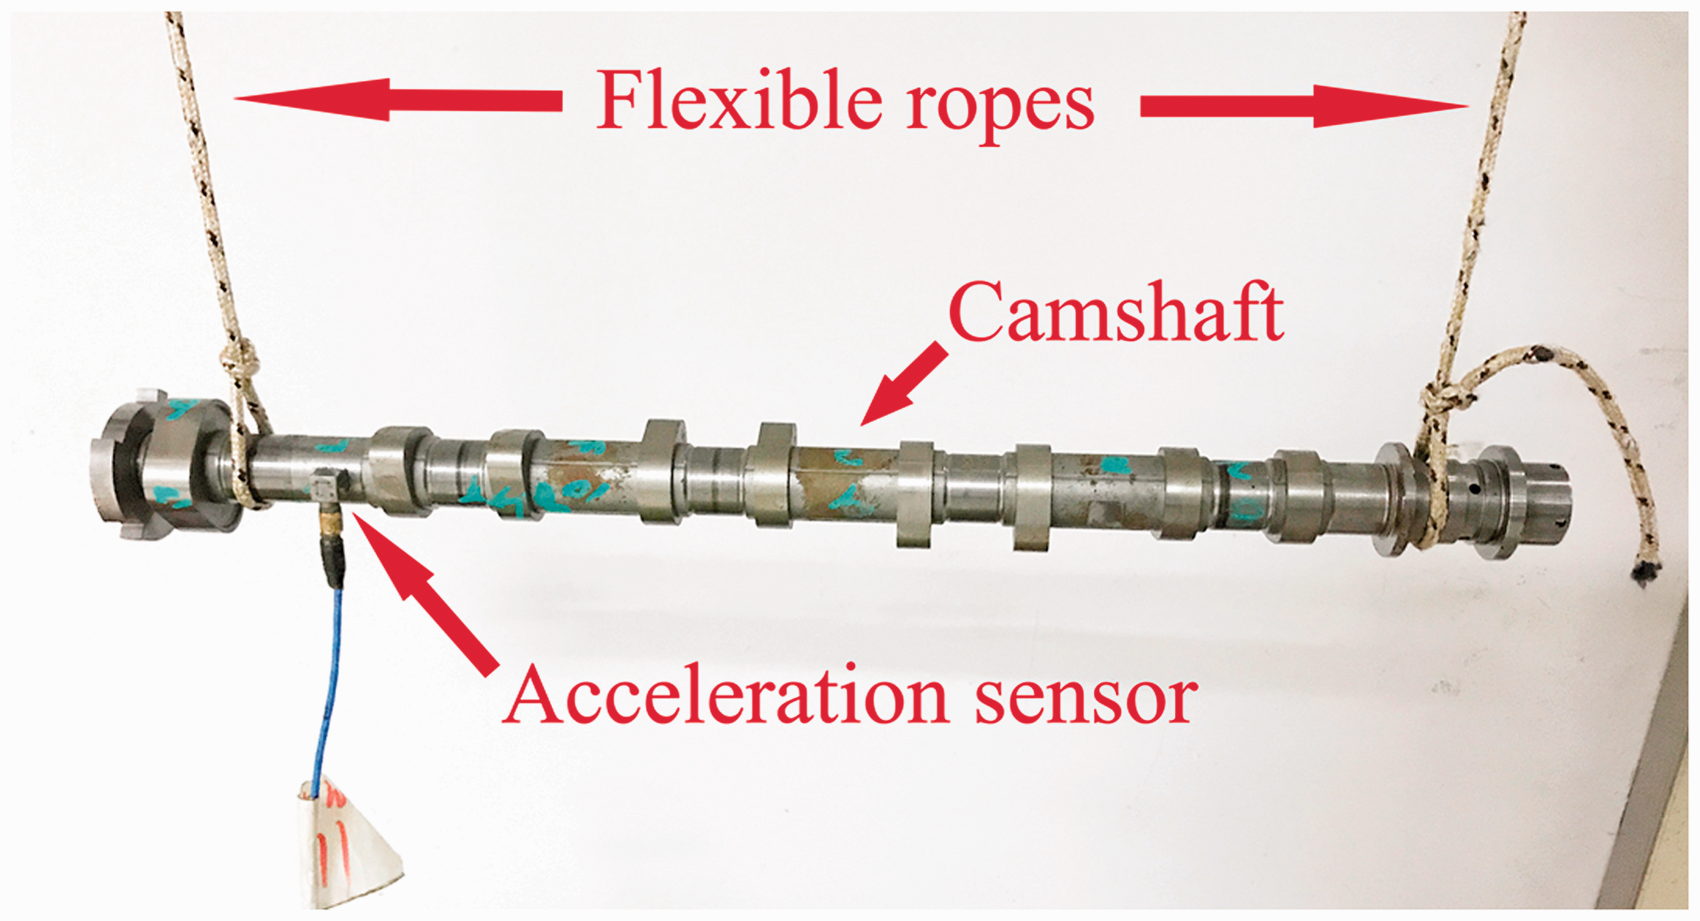
Free modal experiment of the camshaft.
The results of the cylinder head modal frequencies and mode shapes below 3000 Hz are shown in Table 4 and Figure 14. Comparing with the results of the modal experiments, errors of the numerical calculation results are in the range of 1.5–2.8%. The results of the camshaft modal frequencies and mode shapes below 3000 Hz are shown in Table 5 and Figure 15. The numerical mode shapes of both components also align with the experimental results. Therefore, the FEM models are valid enough and can be used for prediction in the following simulations.
Cylinder head modal frequency comparison of measurement and simulation.
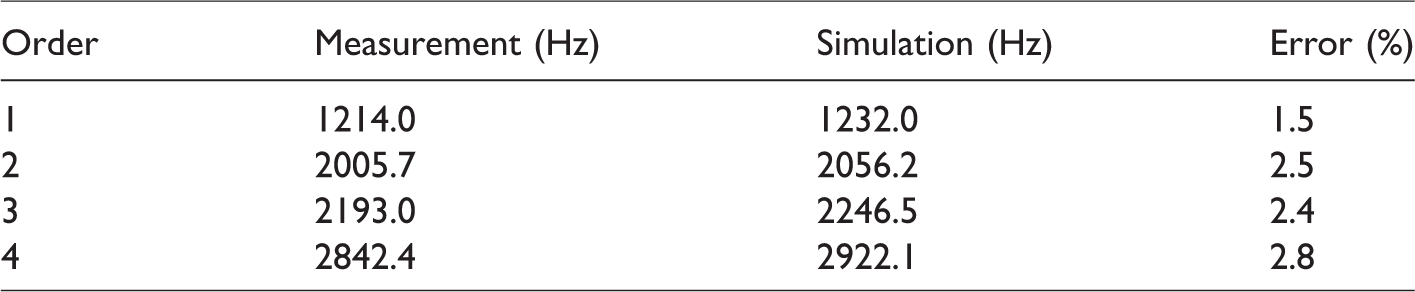
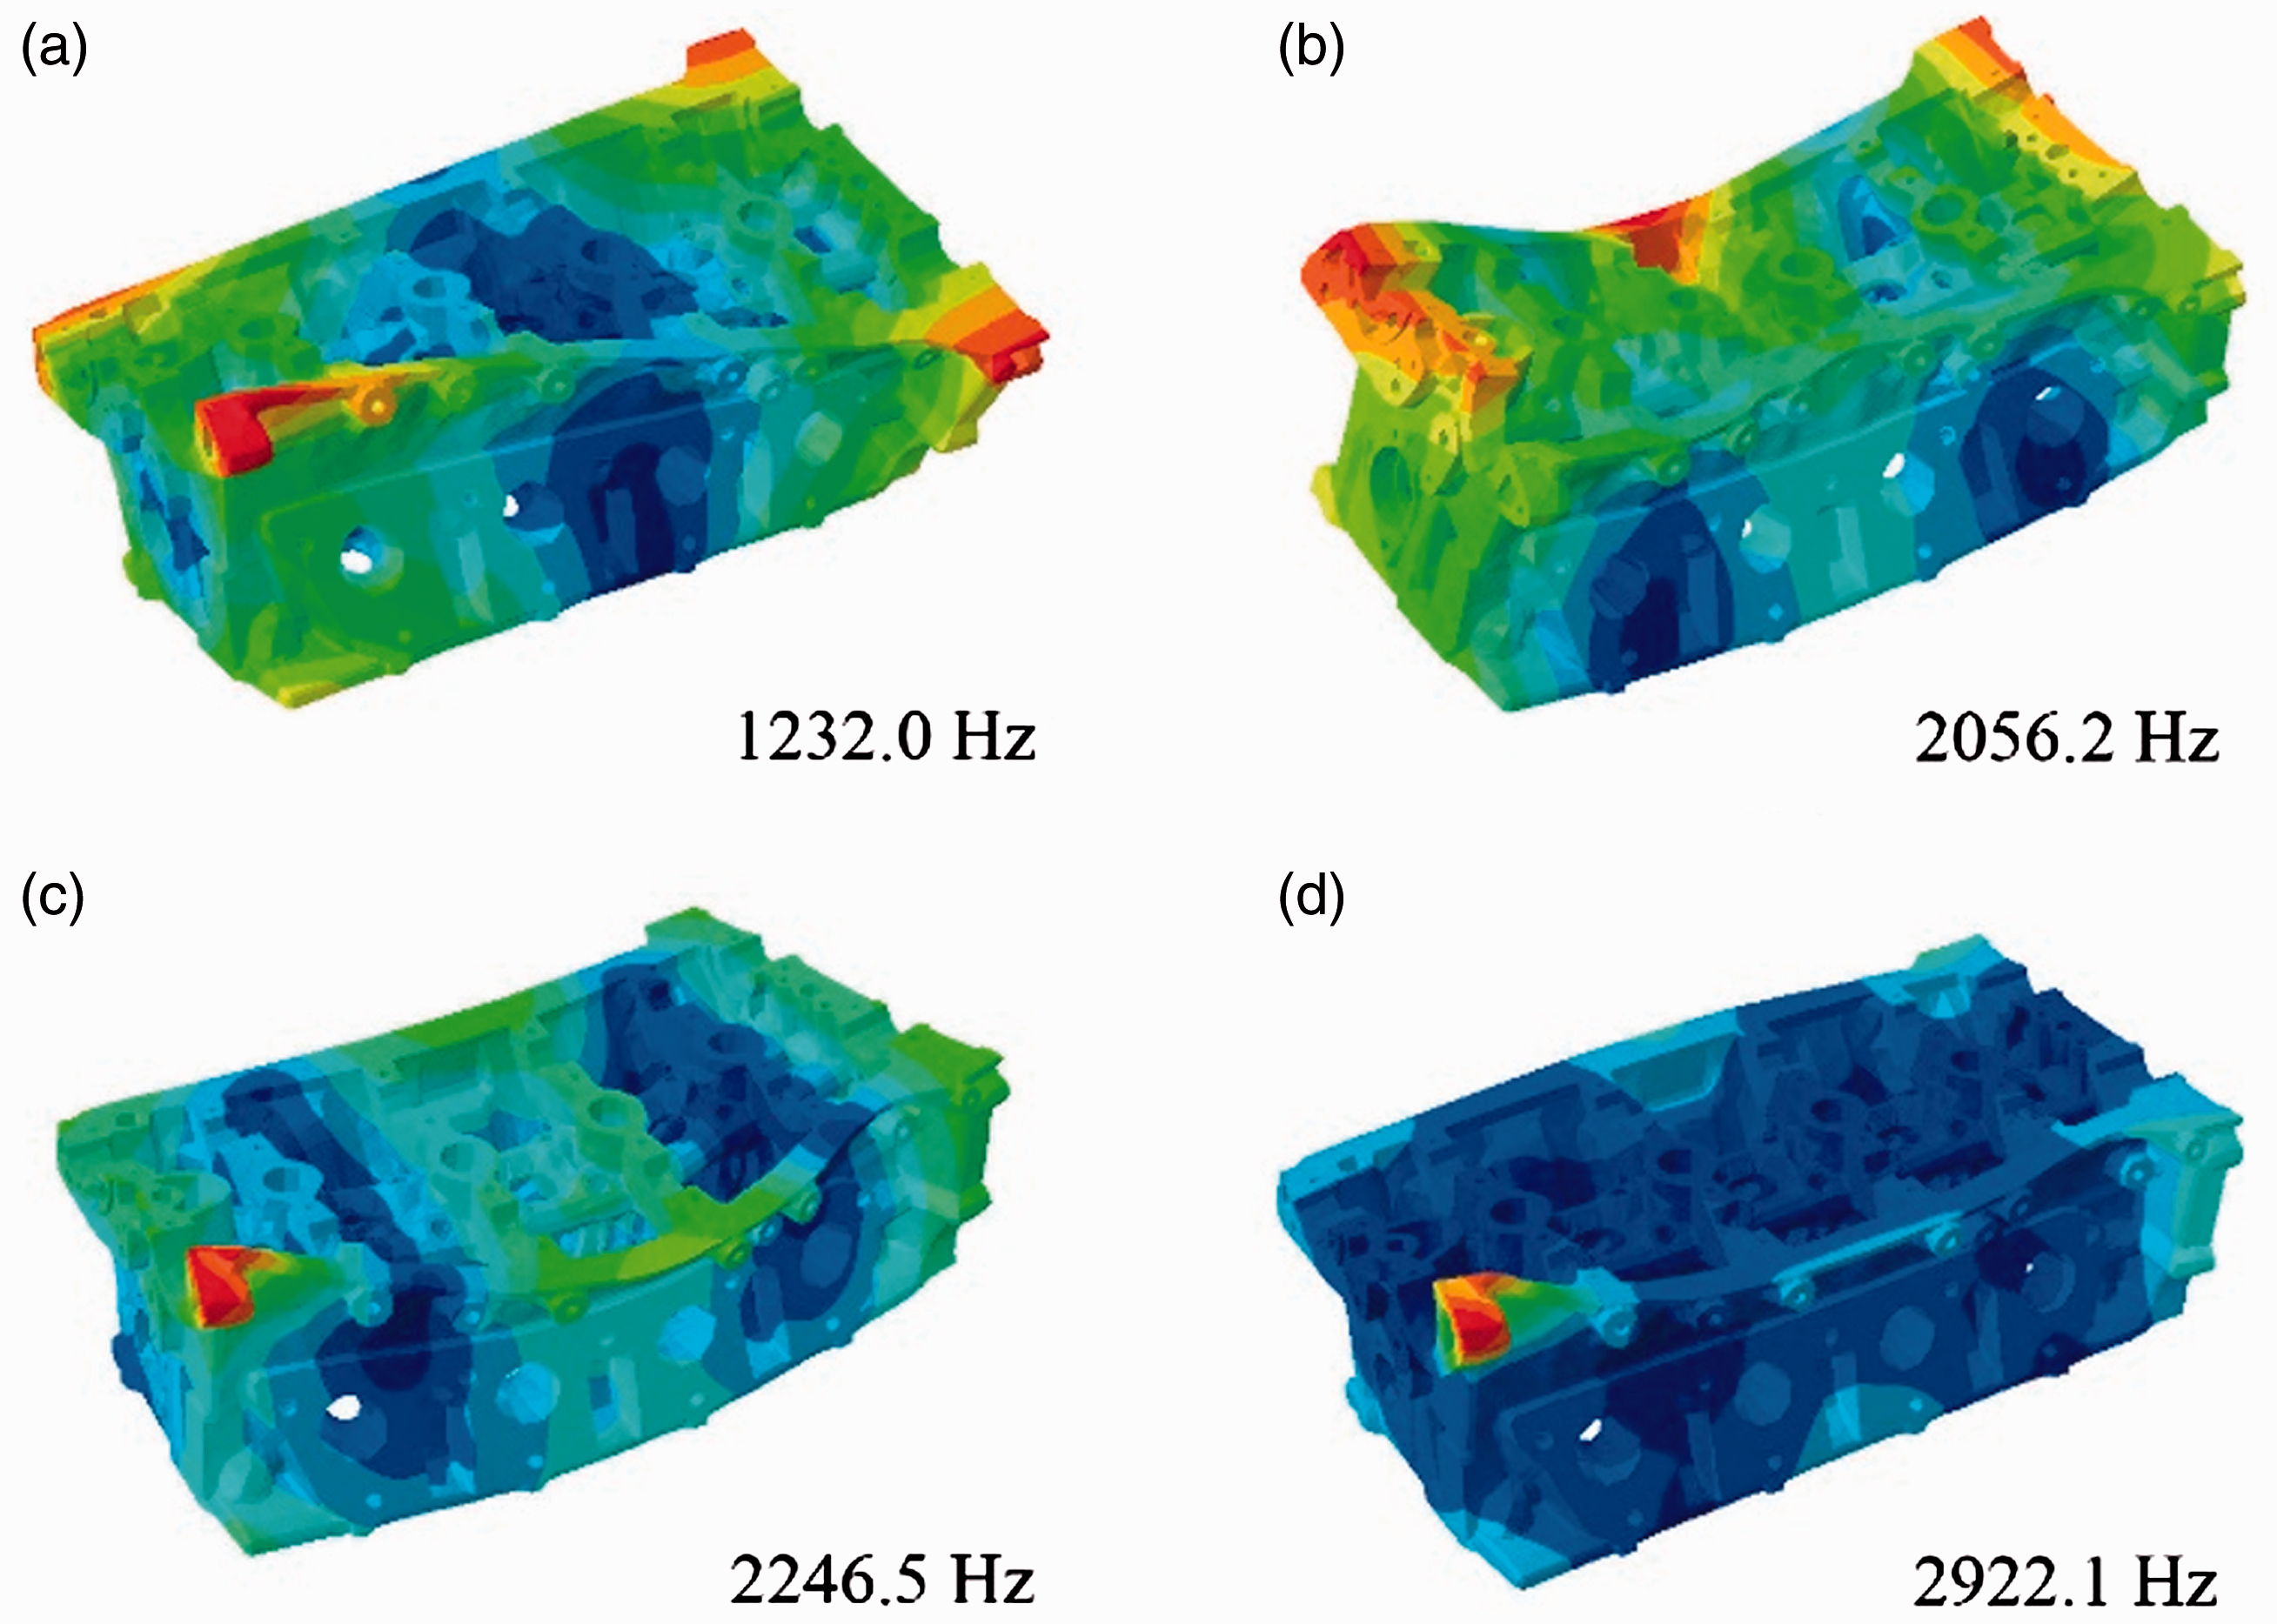
Cylinder head results of modal frequencies and mode shapes simulations.
Camshaft modal frequency comparison of measurement and simulation.
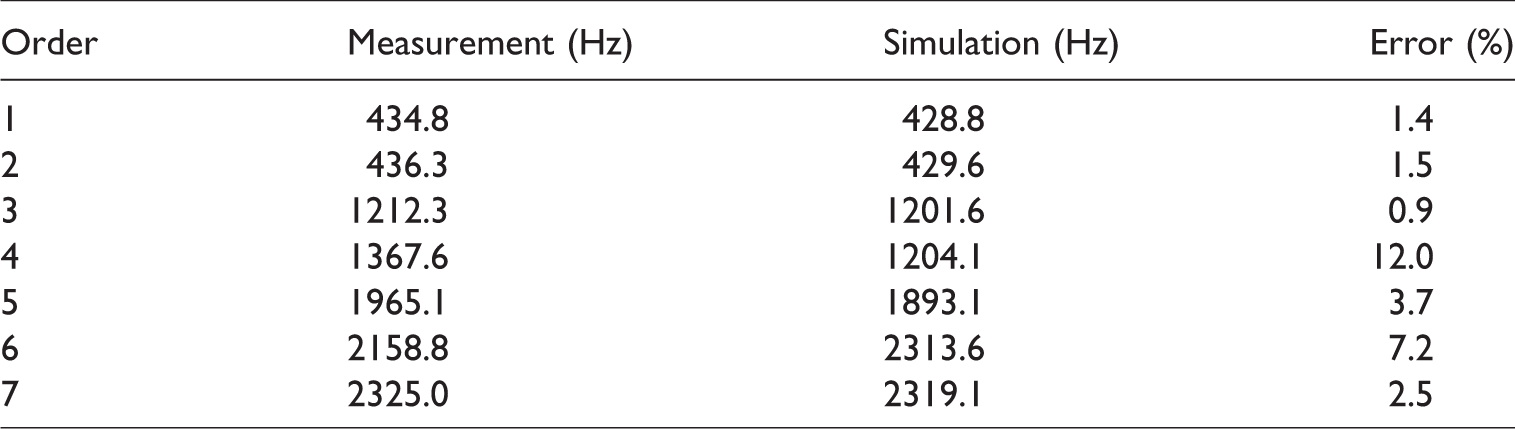
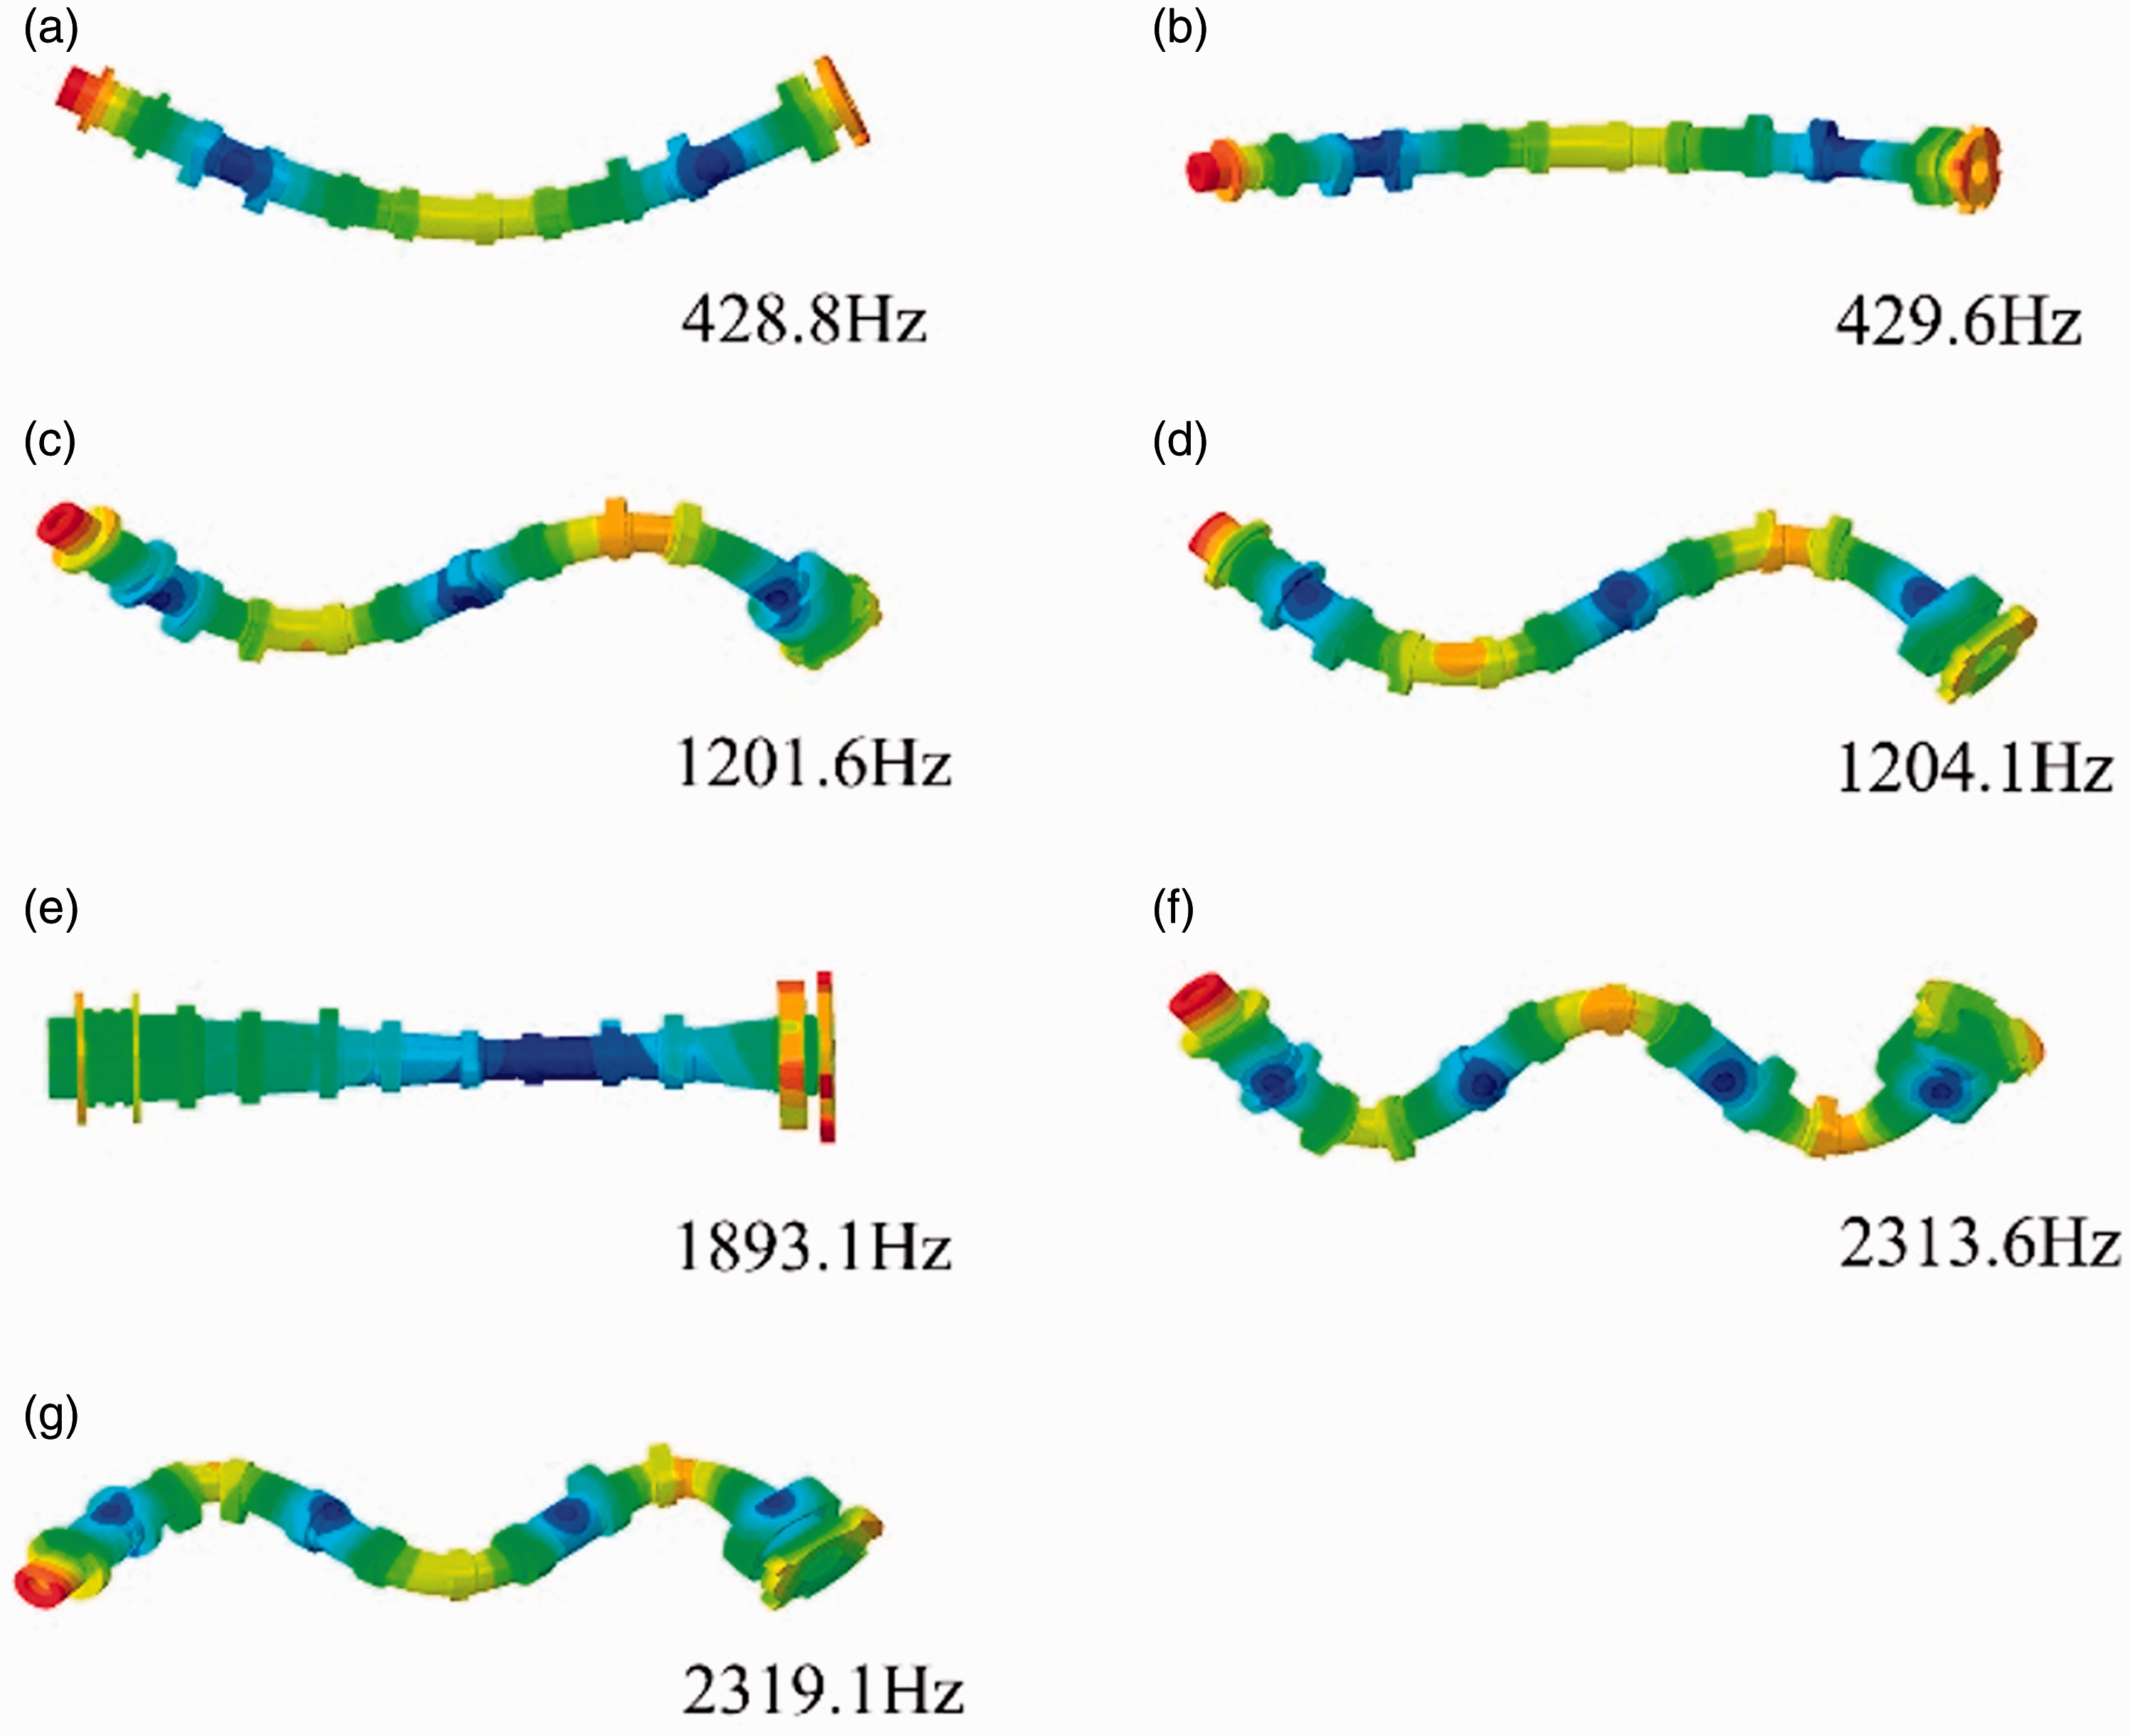
Camshaft results of modal frequencies and mode shapes simulations.
Establishment of simulation model
Implicit and explicit are two methods that can be used to solve the finite element (FE) problem. The implicit method is useful in problems where time dependency of the solution is not an important factor such as static structural, harmonic, modal analysis, etc. The explicit dynamics method is more helpful in solving high deformation time-dependent problems such as crash, blast, impact, etc. 18
The VVT knock dynamics simulation is divided into two steps to reduce the computational complexity. The first step is to calculate the response of the camshaft when the rotor knocks the stator of the VVT. As this is an impact problem, the method of explicit dynamics is applied to the first step of the simulation. 19 The second step of the simulation is to calculate the surface vibration of the cylinder head, the valve chamber cover, and the cylinder head cover. As this is a steady-state process, the method of implicit dynamics is applied to the second step. 20
Acoustic BEM is a numerical method that solves the Helmholtz equation by combining Green’s function and FE analysis theory. The method only needs to divide the boundary of the structure and solve the unknown quantity at the boundary nodes by the interpolation algorithm to calculate the acoustic result at any point in the sound field. 21 Acoustic BEM is applied to the acoustic prediction of the abnormal noise.
Explicit dynamics, implicit dynamics, and acoustic BEM are applied to the calculation of the VVT knock model. The flow chart of the simulation is shown in Figure 16.
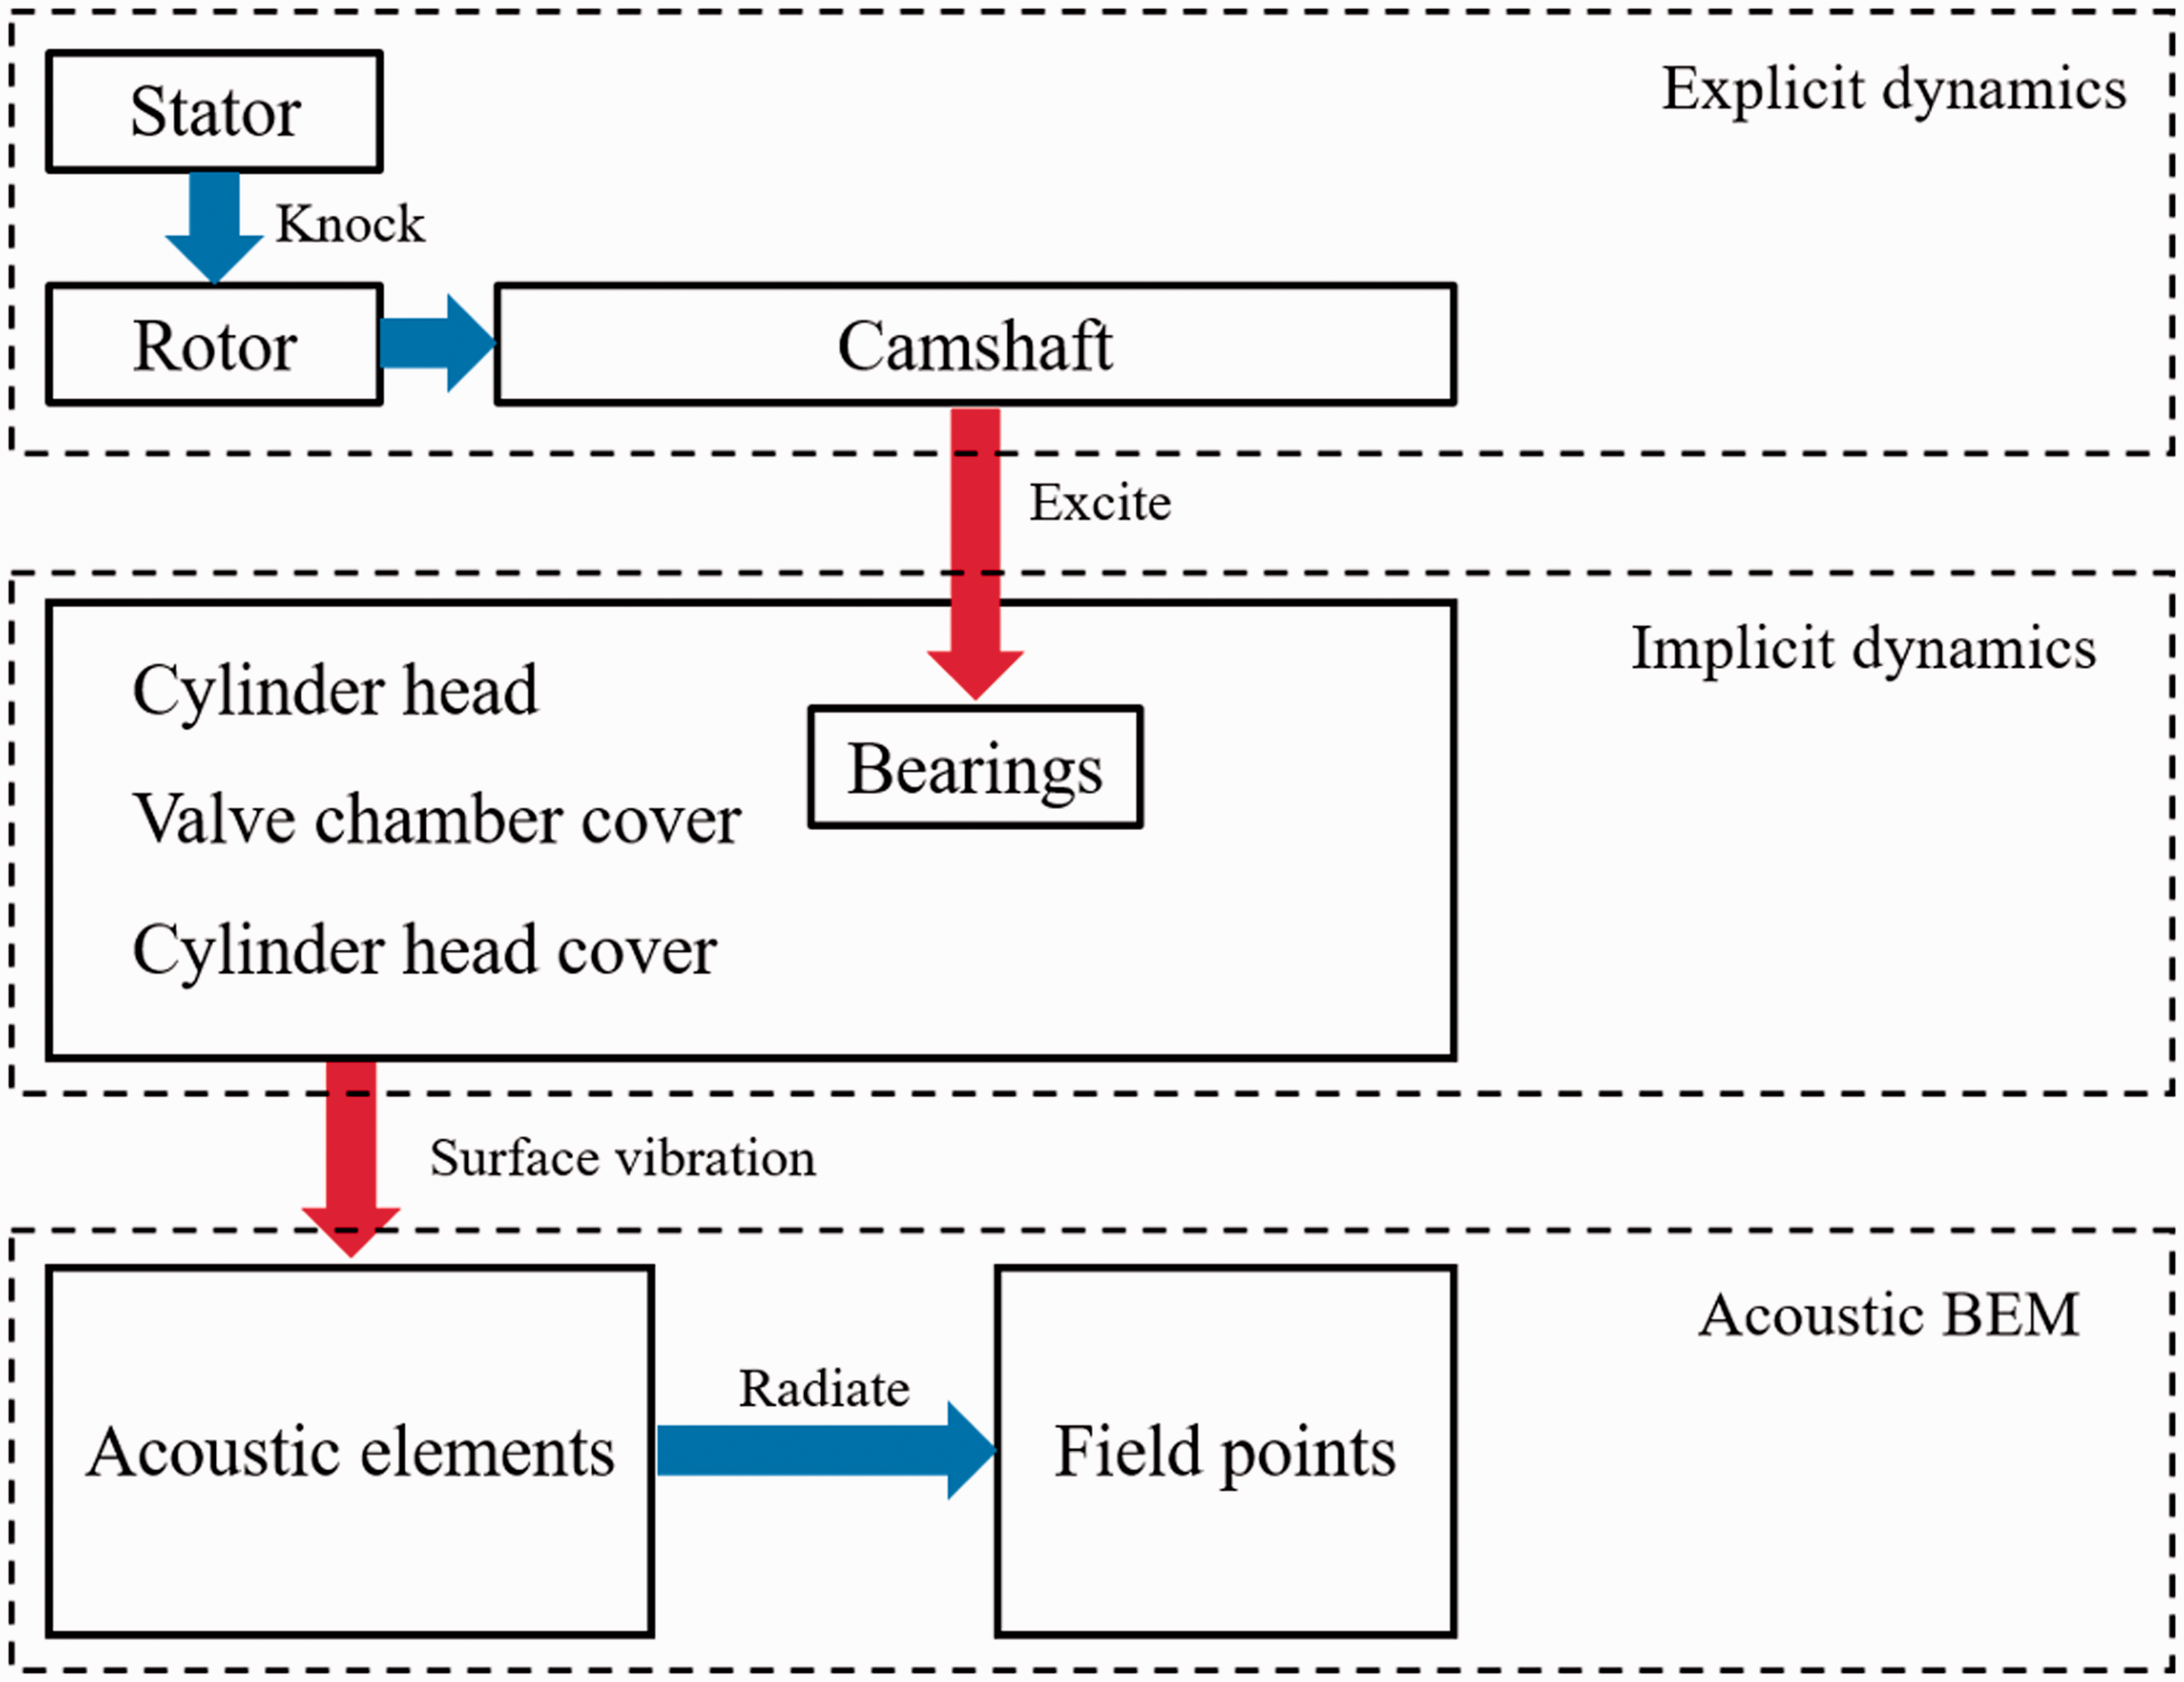
The flow chart of the simulation of the abnormal noise.
Simulations of the abnormal noise
The first step of the simulation calculation is the explicit dynamics part. The time period is set to 0.1 s, and the time increment is set to 0.0001 s. The rotor and the stator of the VVT phaser can rotate relatively. The rotor and the camshaft are fixed together, while the end face of the camshaft is constrained in 6 DOF. The rotor and the camshaft are stationary in initial state, and the stator is rotating to the rotor in an angular velocity of 8 rad/s. The difference between the speed of the rotor and the camshaft, which are measured in the experiment, is input to define the initial angular velocity.
The process of the knock is simulated, and the stress transmits from the rotor to the camshaft, causing the vibration of the whole camshaft. The responses of the rotor, the stator, and the camshaft are calculated in the explicit dynamics model. When the rotor contacts the stator, the blades of the rotor bear great stress, and the max stress is 6.3 MPa as shown in Figure 17(a). Figure 17(b) indicates that the stress wave spreads in the structure of the camshaft over time.
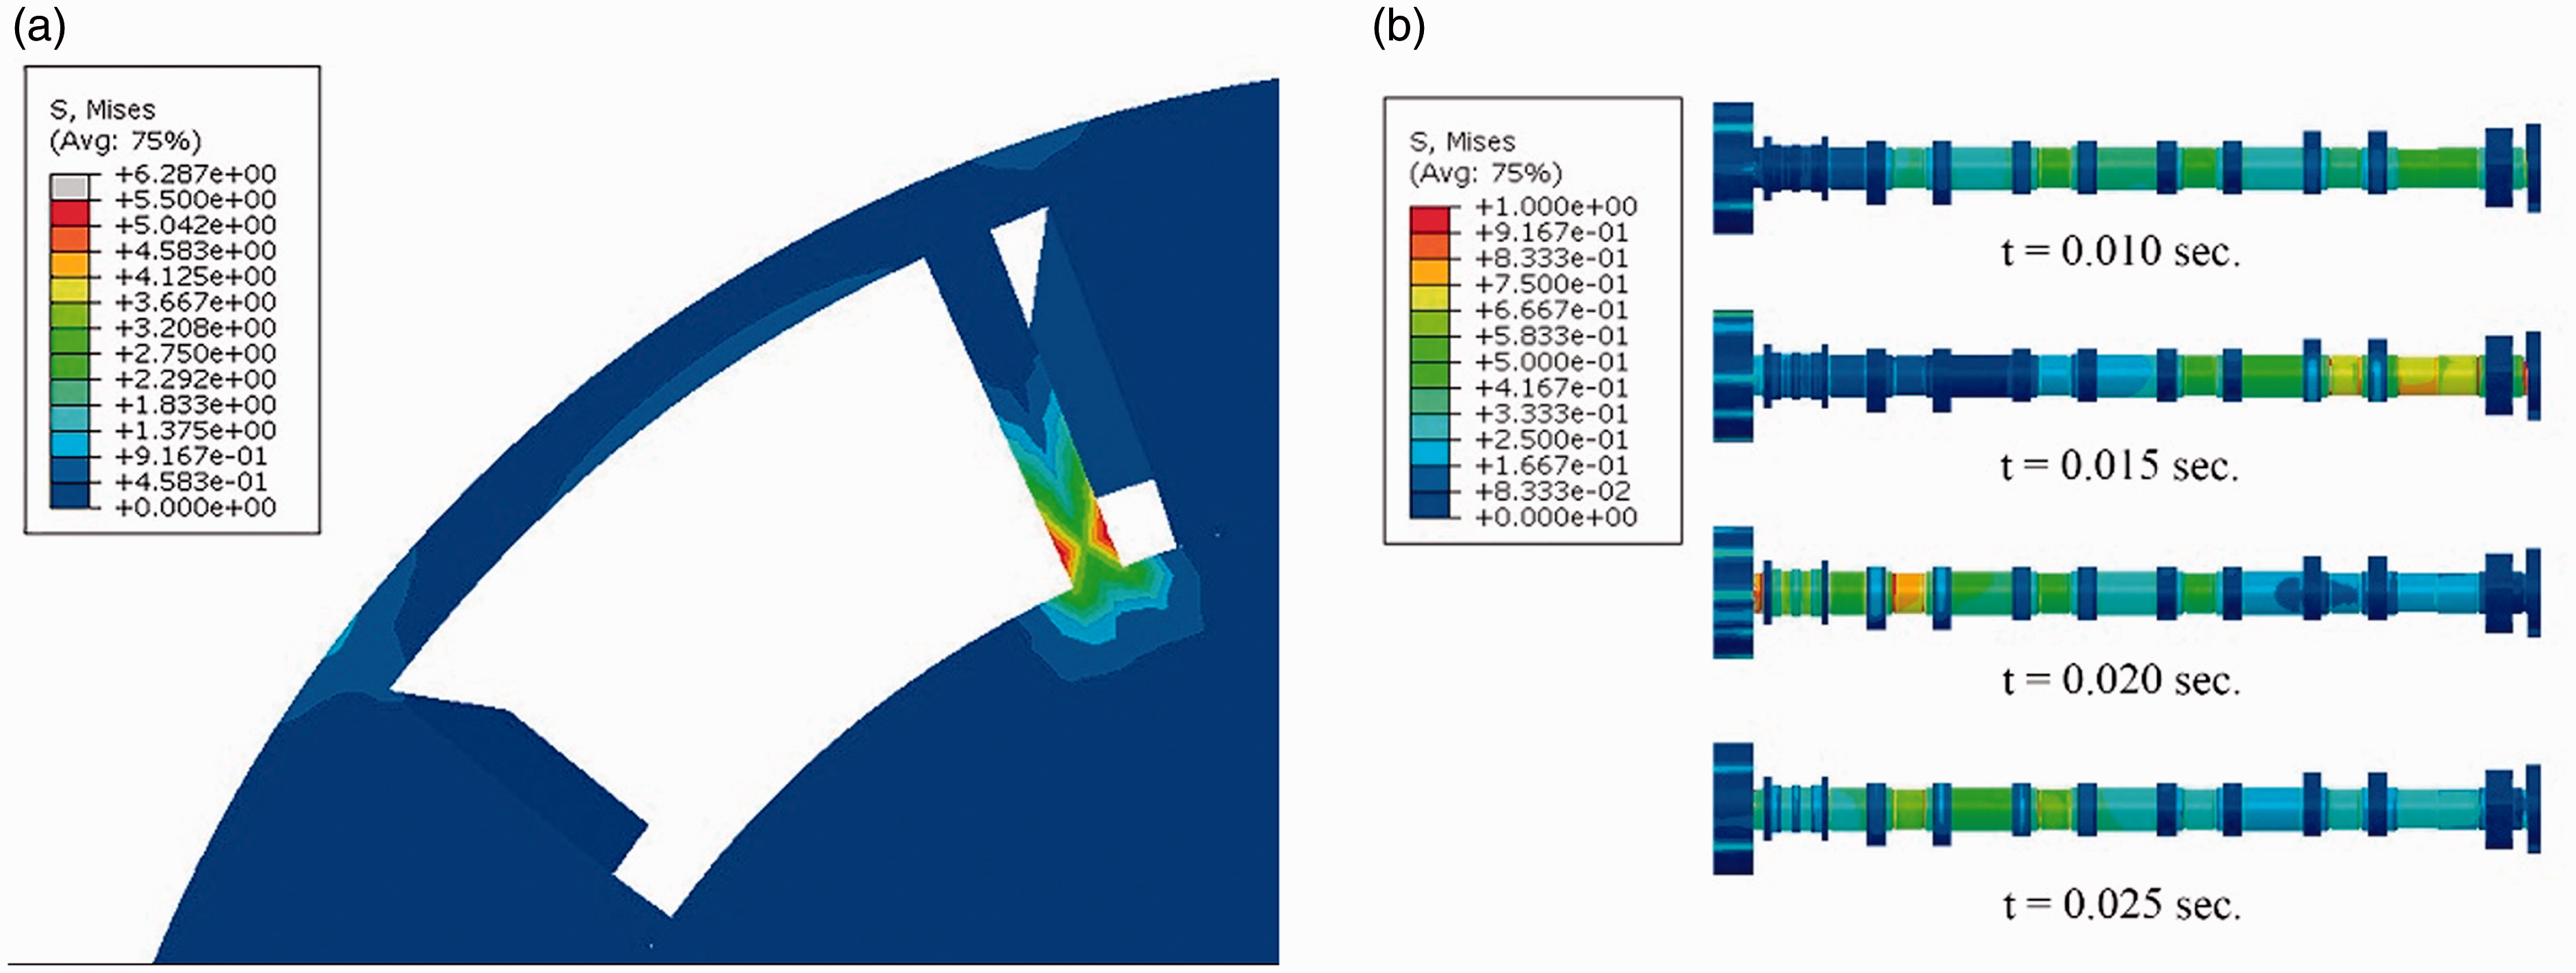
Mises stress results of the explicit dynamics: (a) maximum local mises stress; (b) stress wave spreads over time.
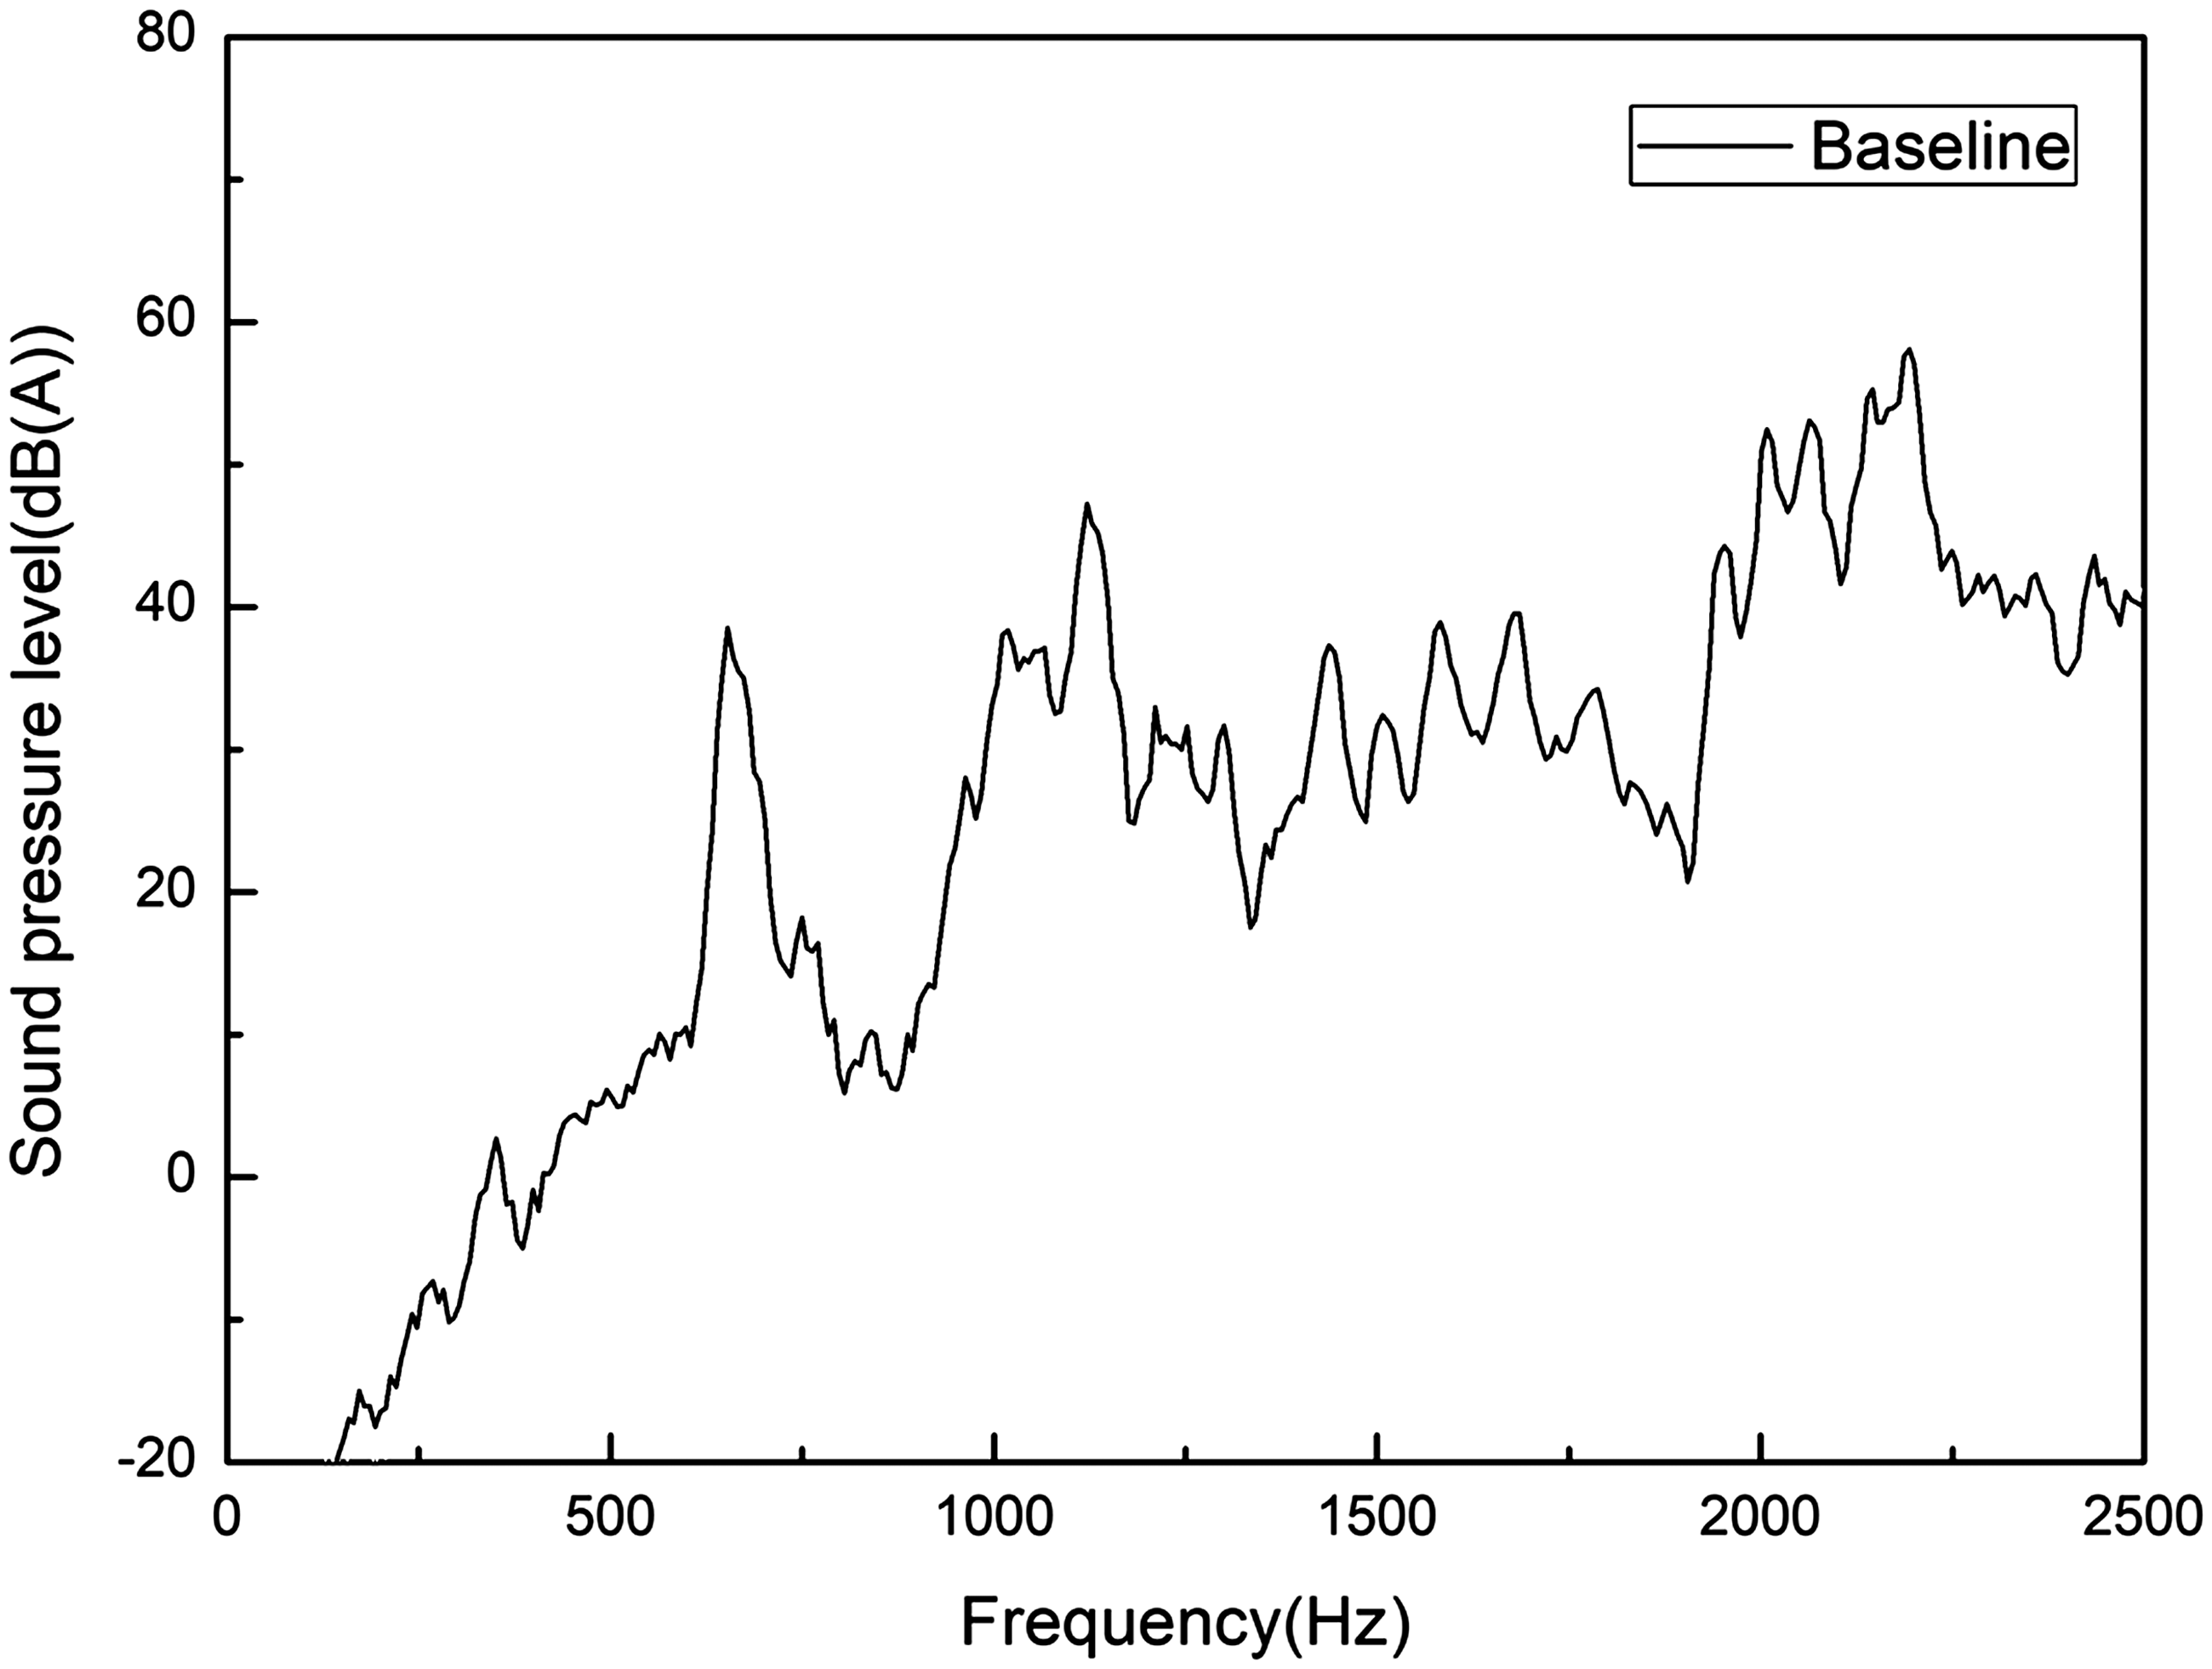
In the second step of the simulation, the model includes the cylinder head, the valve chamber cover, and the cylinder head cover. Three parts are bolted together, and the contact surfaces are tied. The bolt holes of the cylinder head bottom are restrained. In order to simulate the vibration transmission from the camshaft to the bearings, the displacements of the camshaft journals over time from the first step of the simulation are used as input for the bearings of the camshaft. The responses of the cylinder head, the valve chamber cover, and the cylinder head cover are calculated by the method of implicit dynamics. Figure 18 shows that the vibration is transmitting from the bearing to the surfaces of the engine over time. Figure 19 shows the simulation result of vibration spectrum in dB (A-weighting) on the top of the cylinder head cover. There is a large peak around the frequency band of 2200 Hz; meanwhile, there are several peaks around the frequency bands of 1100, 1700, and 2000 Hz.
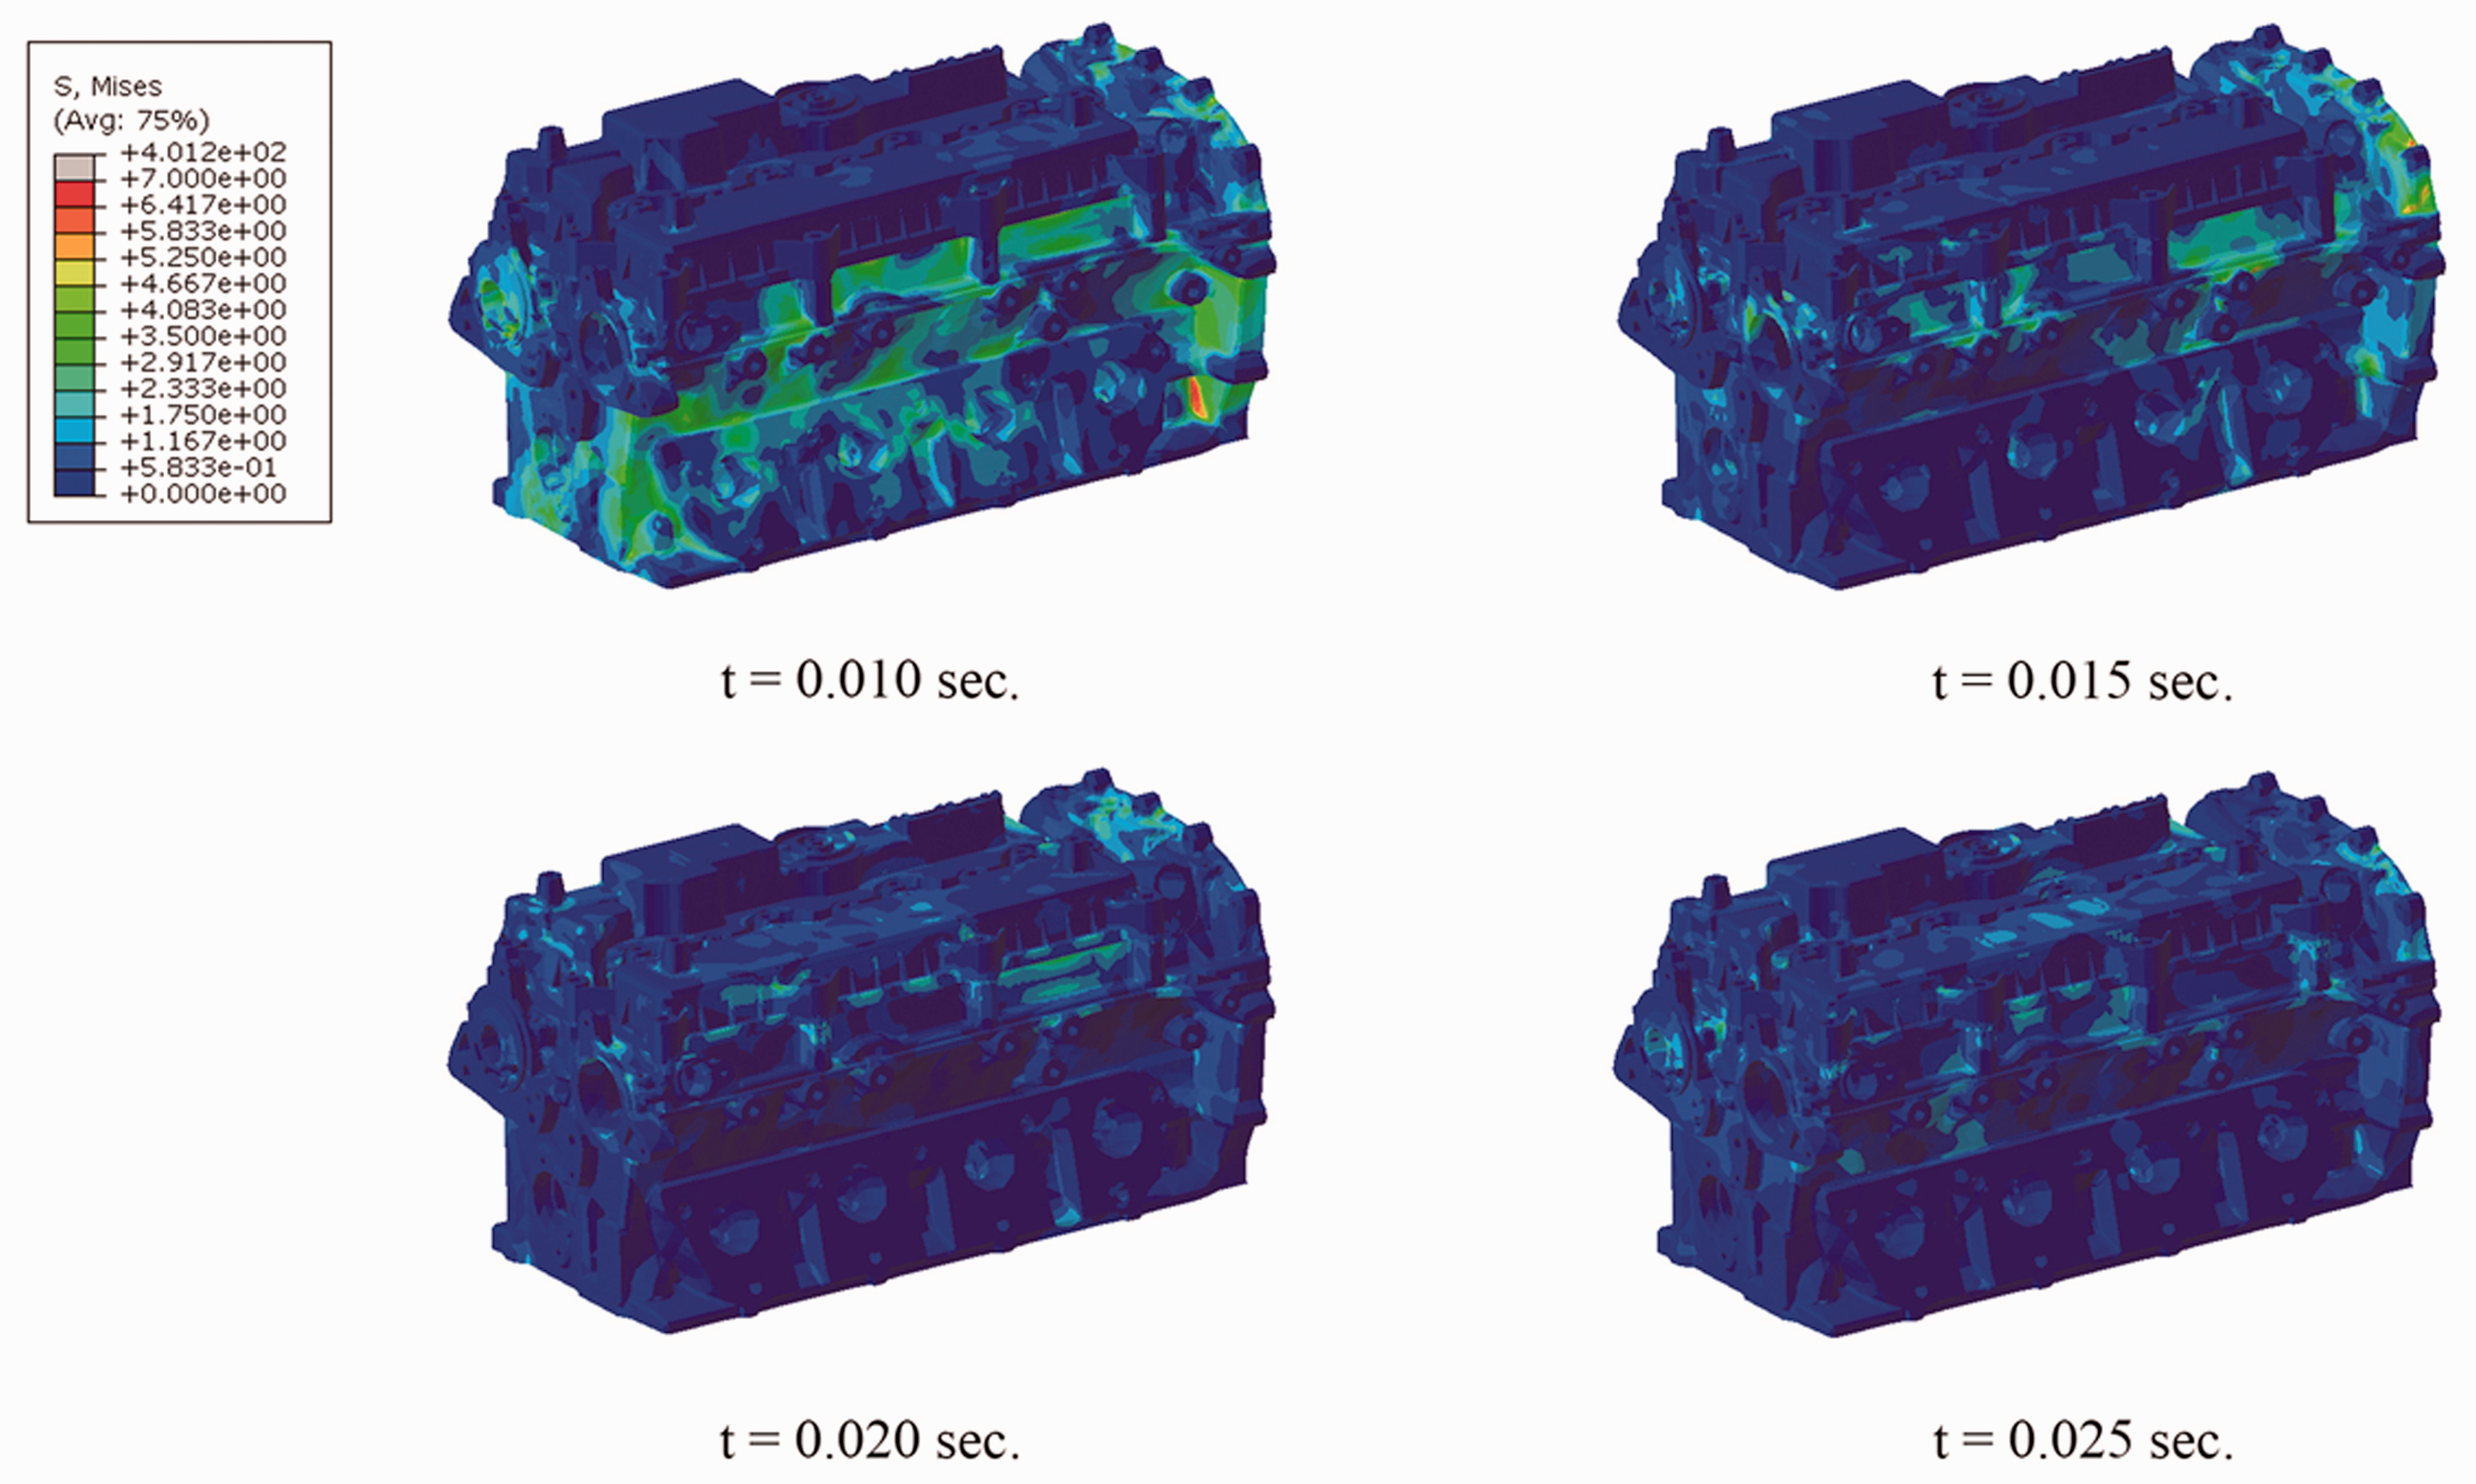
Mises stress results of the implicit dynamics.
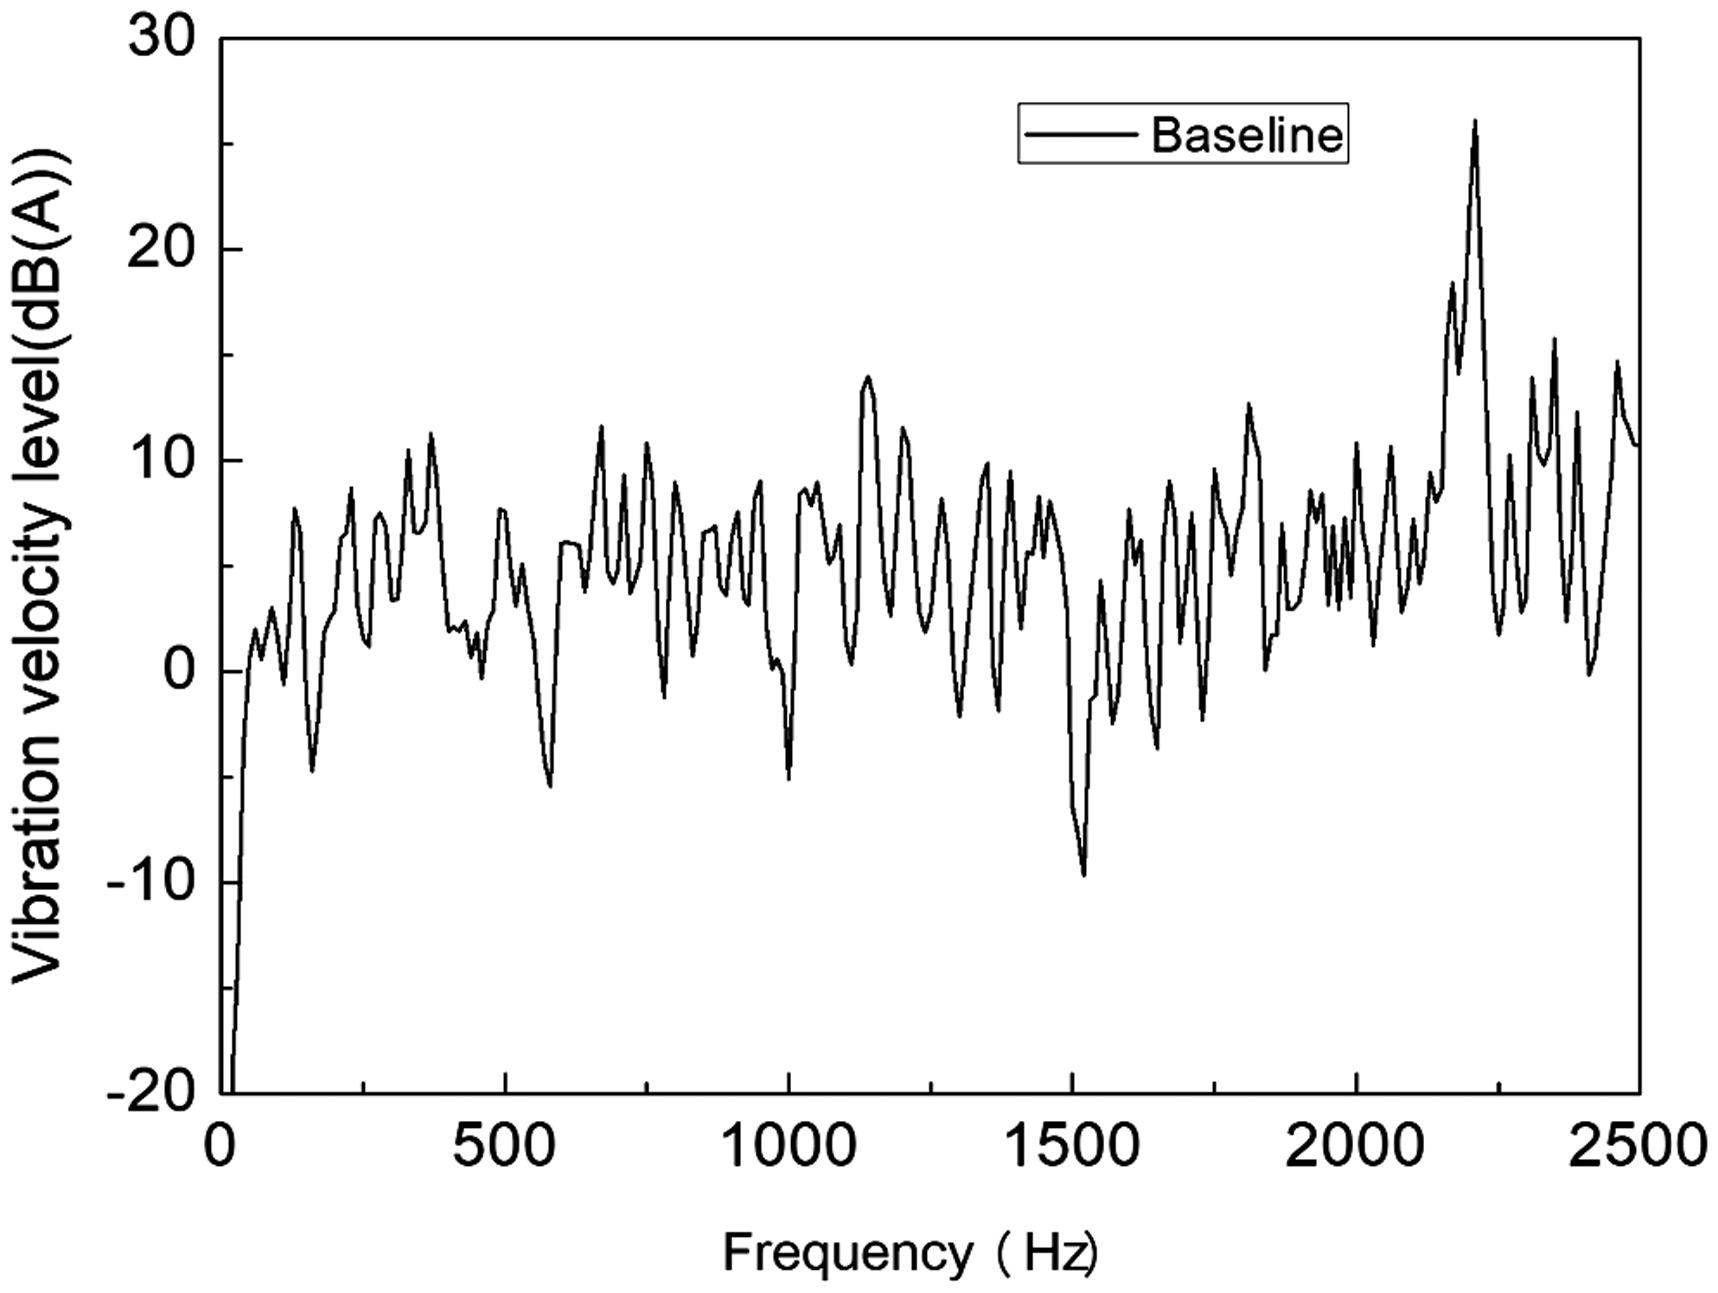
Result of vibration spectrum in dB (A-weighting) on the top of the cylinder head cover.
Then, acoustic prediction is simulated based on the result of the surface vibration in the second step. Considering the frequency band of the abnormal noise is concentrated in the middle and low frequency below 3000 Hz, the transient BEM is used for the acoustic prediction simulation.
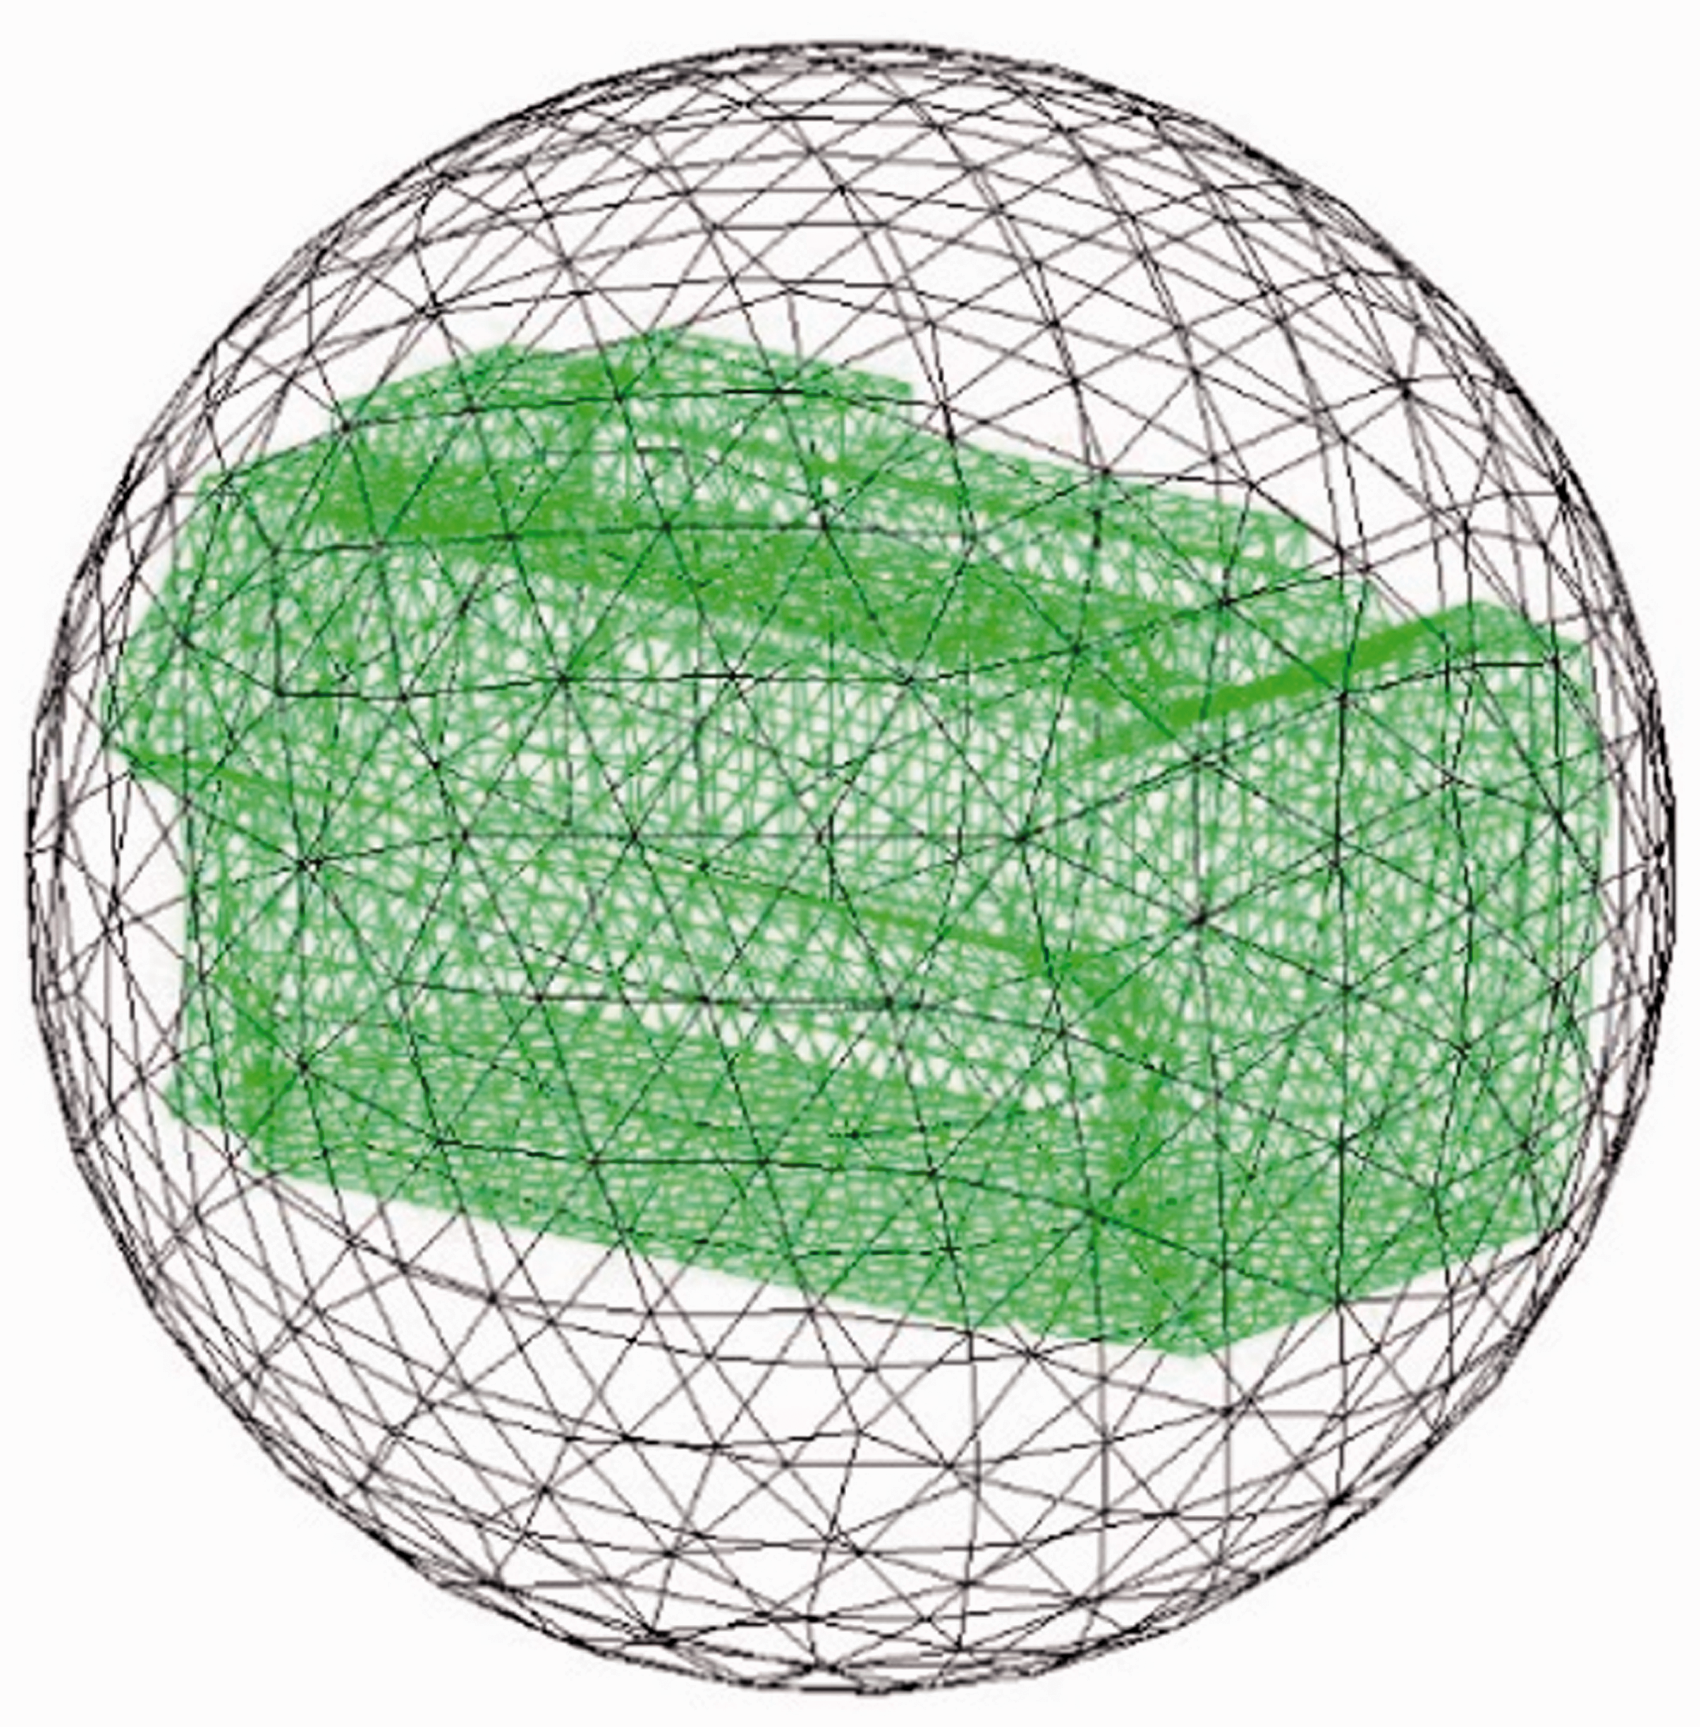
As acoustic elements, 4774 C3D4 elements spread on the closed surface which is similar to the structure surface are shown in Figure 20. As field point elements, 766 C3D4 elements spread on a 52-cm-diameter spherical surface as shown in Figure 21. The near-field measure point 10 cm above the cylinder head cover is on the spherical surface.
Cylinder head models: (a) structure elements; (b) acoustic elements.
Field points elements.
Figure 22 shows the simulation result of noise spectrum 10 cm above the cylinder head cover where the near-field noise measure point is placed in the experiments. There are several peaks around the frequency bands of 700, 1100, 1500, 1700, and 2200 Hz.
Result of noise spectrum 10 cm above the cylinder head cover.
The simulation results show that the amplitudes of vibration and noise around the frequency of 1100 and 2200 Hz are significantly larger. These peak frequency bands of the simulations are close to the results of the experiments. However, the differences of the amplitudes between the result of simulations and experiments are still large. Both vibration and noise amplitudes of the simulation are much larger than those of the experiments. The reasons are discussed as follows:
Due to the limited computational resources, both explicit and implicit dynamics calculation do not consider the effect of the fluid on the results. In fact, chambers of VVT are filled with oil which can buffer and damp the impact. The connections between the camshaft and the bearings are rigid connections without considering the clearance, contact stiffness, and damping between them. More vibration is transferred from the camshaft to the bearings in the simulation. In order to facilitate the calculation, only relative rotation of the rotor and the stator is considered in the simulation, but absolute rotation of the camshaft is not. The constraints of the camshaft and the cylinder head also differ from the actual situation, which can increase internal strain and stress of the structure. Only the vibration and noise caused by the VVT knock is taken into consideration in the simulation, and other excitations such as valve seating, cylinder pressure, and piston-rod movement are not considered in the model. Cylinder block, oil pan, high-pressure pump, and other accessories are omitted in the model. As a result, noise excited by other excitations and radiated from surfaces of other parts is not reflected in the results of simulation.
The purpose of the simulation is to find out the key factor to solve the abnormal problem, which is a qualitative analysis instead of a quantitative one. The model can reflect the frequency domain characteristics of the structure response, which is meaningful to guide the structure optimization.
Structure optimization
After identifying the cause of the abnormal noise, the next step is to optimize the VVT structure to solve the abnormal noise problem. To propose an effective solution within a limited time and cost, the optimized schemes should be feasible and verifiable. According to the results of the explicit dynamics calculation, the rotor blade is thin and bears great stress within current design. In order to reduce the stress concentration of the blades of the rotor, increasing the thickness of the blades is the most effective method to strengthen the structure. To ensure the operation of the VVT, the thickness of blades is limited by the phase range of the VVT. Therefore, the thicknesses of the blades are increased to 2 and 3 mm, respectively, as the optimized schemes A and B. The FEM models of baseline, scheme A and scheme B, are shown in Figure 23.
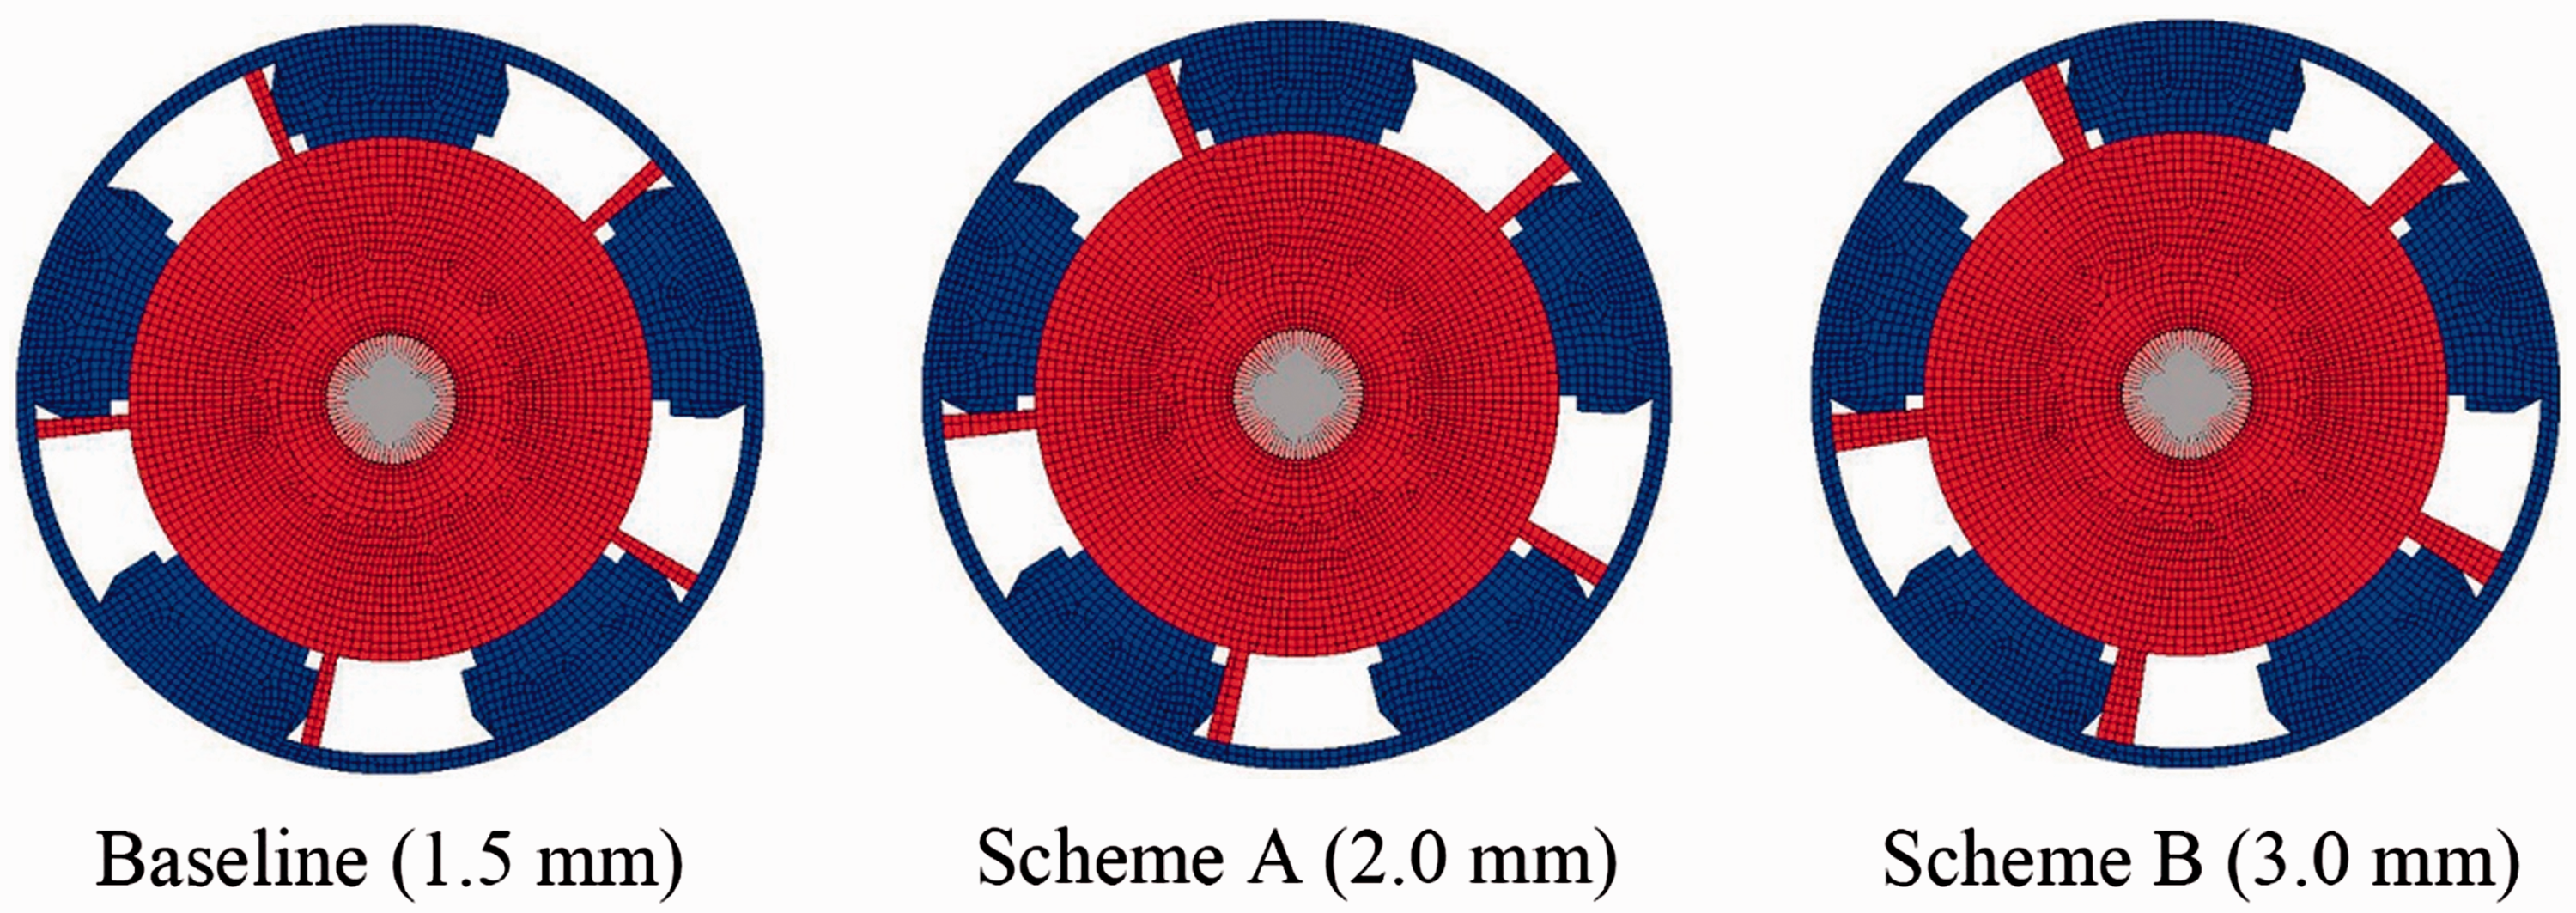
The FEM models of baseline, scheme A and scheme B.
The VVT knock models with optimized VVT phasers are computed by the method consistent with prior simulation. The explicit dynamics results show maximum local mises stress of three models in Figure 24. Compared with baseline, the maximum local stress of schemes A and B decreases significantly in the same scale.
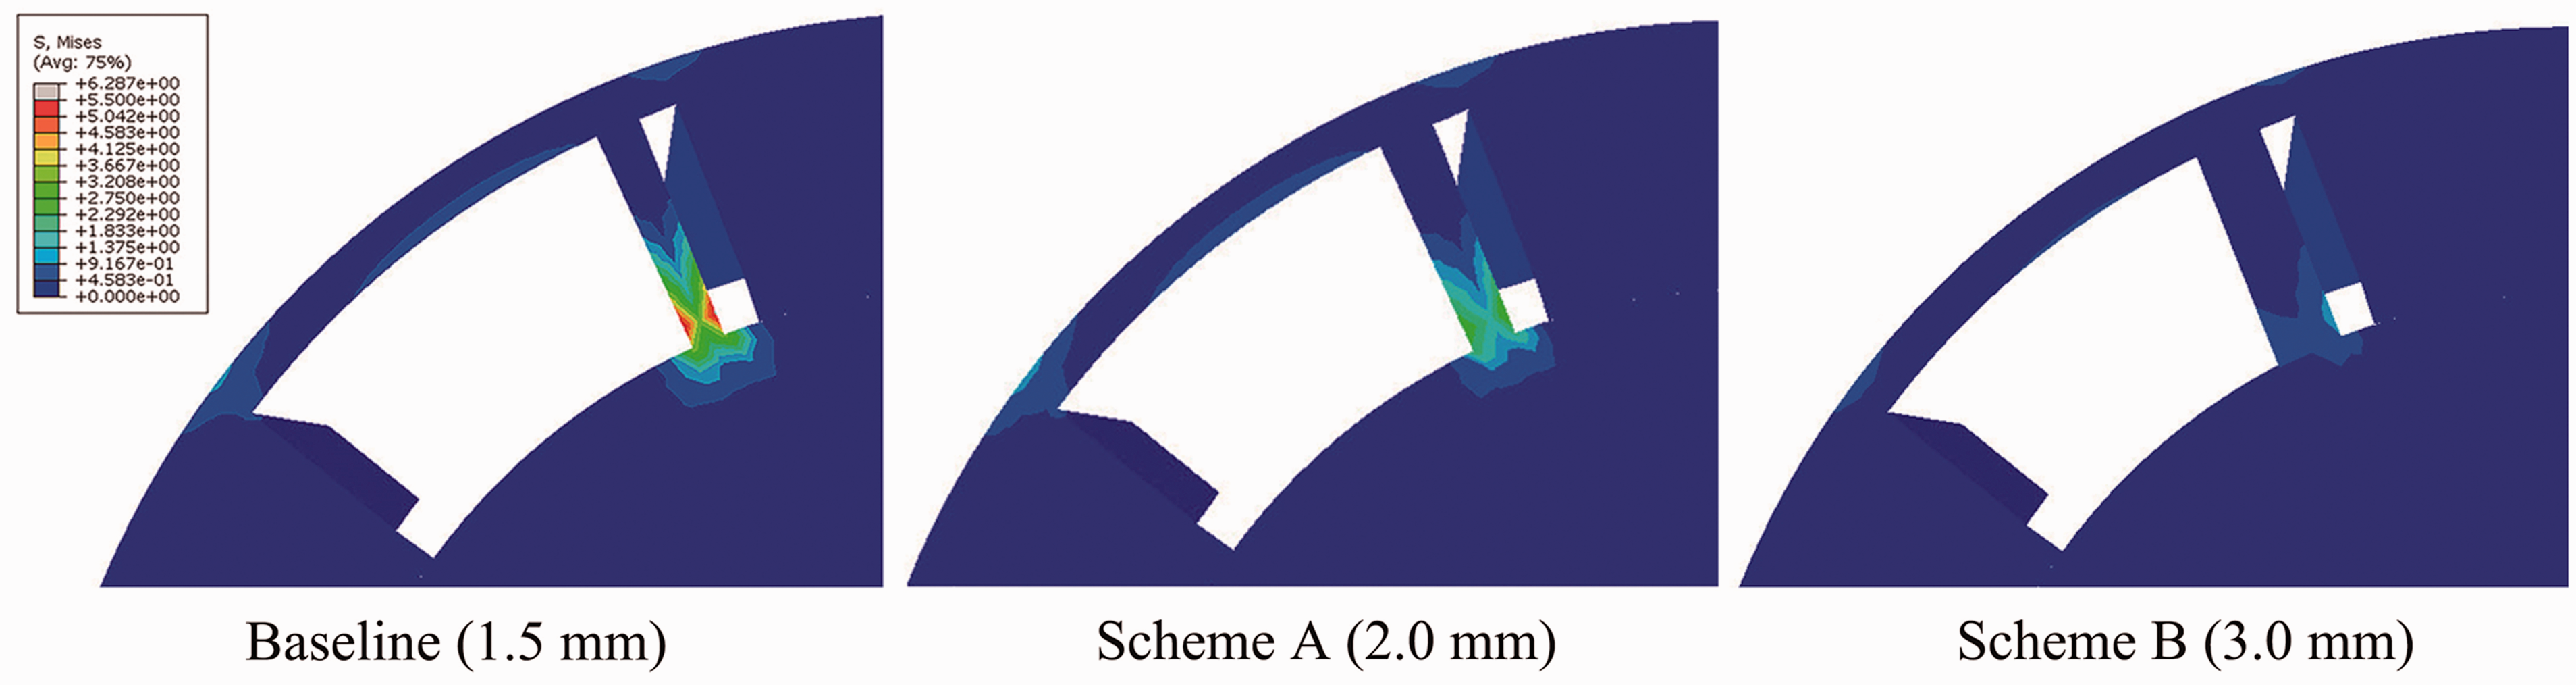
Maximum local mises stress of baseline, scheme A and scheme B.
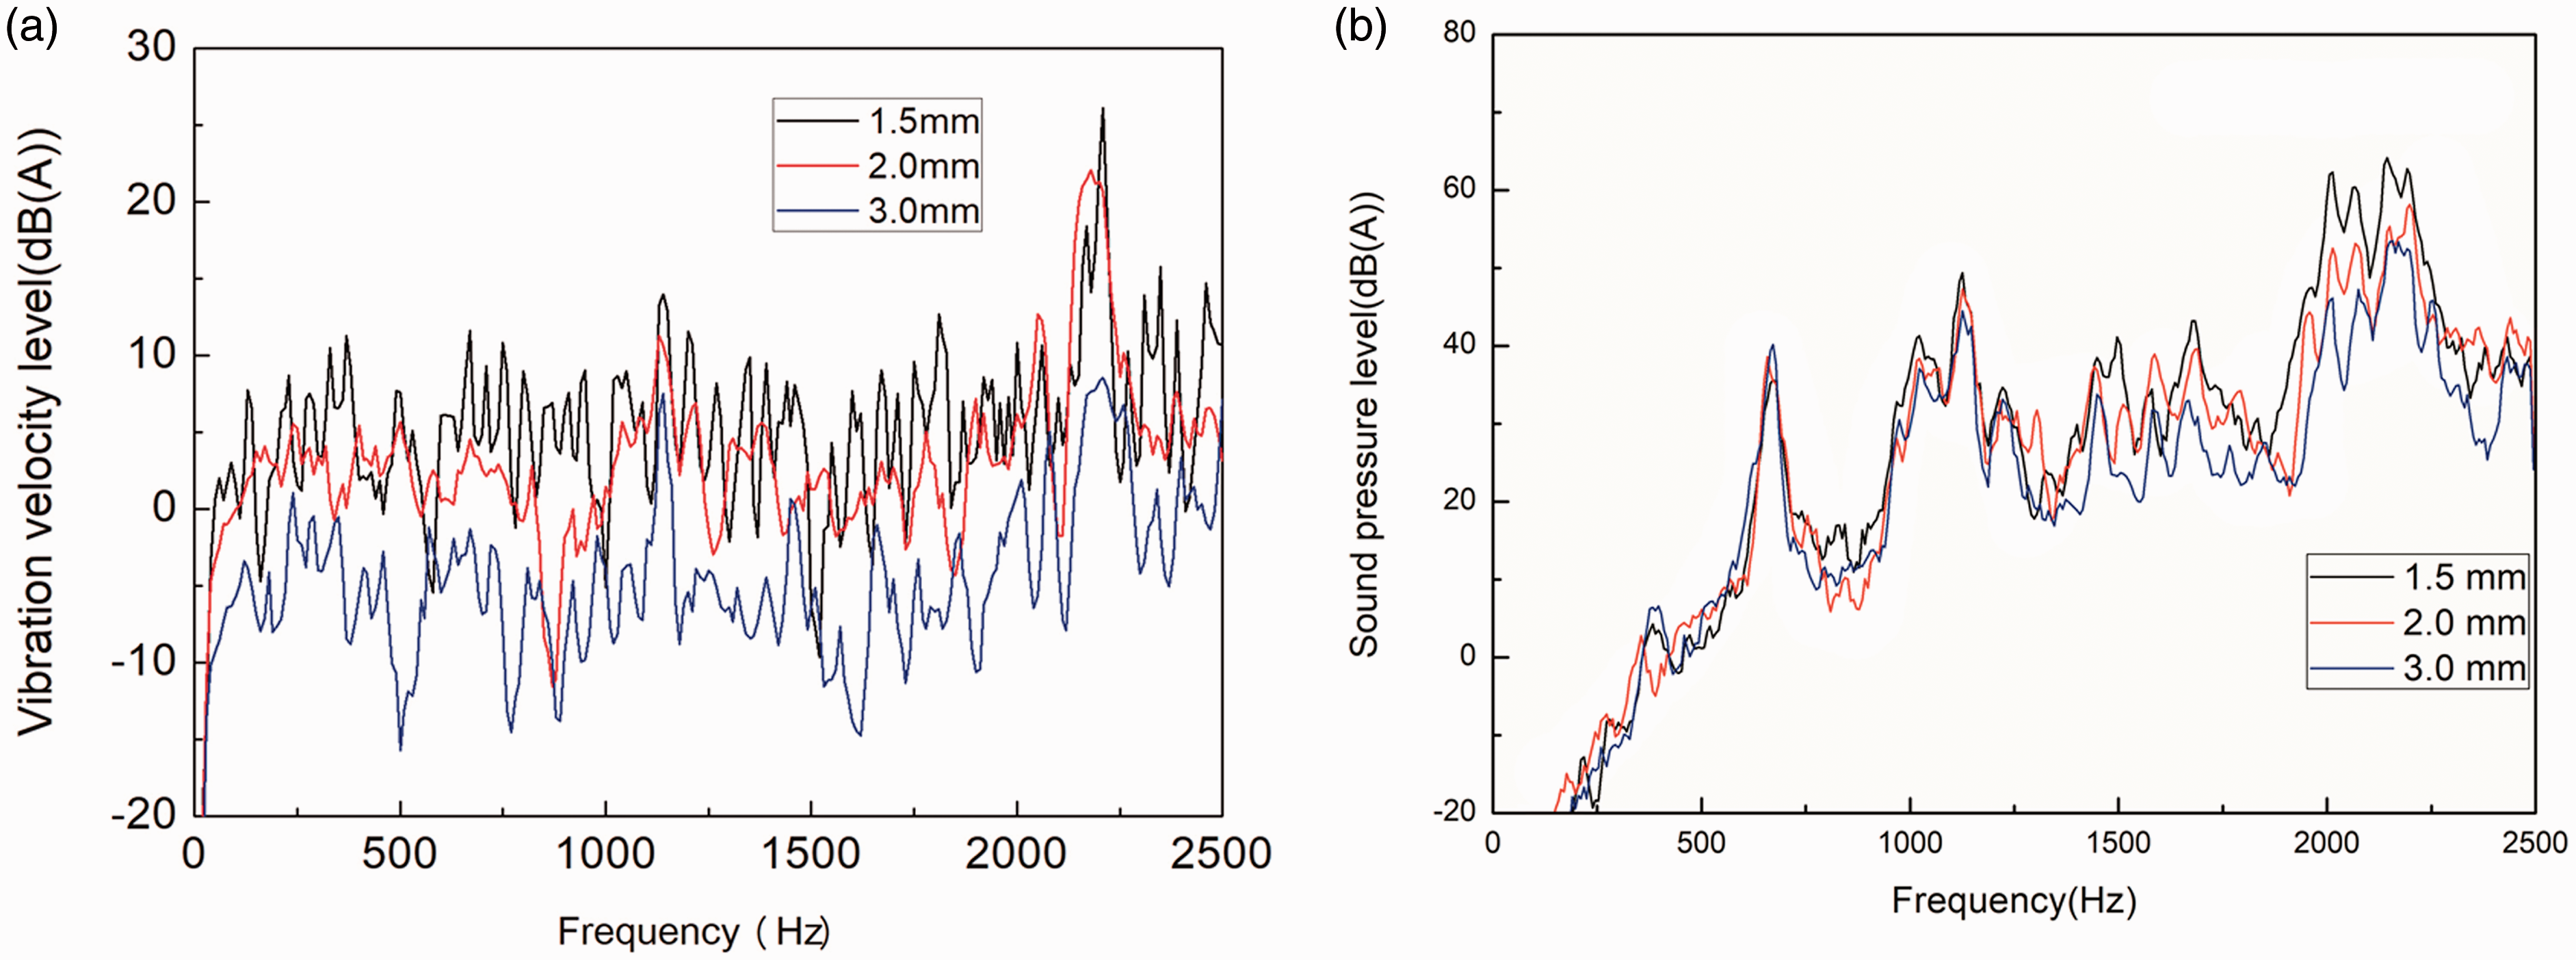
The comparison between the baseline and optimizations indicates that the vibration and noise at the corresponding frequencies are decreased evidently when the thickness of the blades increases to 2 or 3 mm as shown in Figure 25.
Spectra of vibration and noise simulation comparison between baseline and optimized schemes: (a) vibration velocity level on the cylinder head cover; (b) near-field noise 10 cm above the cylinder head cover.
From the vibration simulation results, when the rotor thickness increases to 2.0 mm from 1.5 mm, the peaks around 1100 Hz drop from 14.0 to 11.3 dB(A) and 2200 Hz drop from 26.1 to 21.3 dB(A). Further, when the rotor thickness increases to 3.0 mm, the amplitude of the entire frequency band has a significant decline. The peaks around 1100 Hz decreases to 7.5 dB(A) and 2200 Hz decreases to 8.5 dB(A).
The acoustic prediction simulation shows similar tendency. With the increase of the thickness of the blades, the amplitudes of the sound pressure level decline significantly. When the rotor thickness increases to 2.0 mm, the frequency bands from 1000 to 1200 Hz have an average drop of 1.7 dB(A), and the frequency bands from 2000 to 2200 Hz have an average drop of 7.6 dB(A). When the rotor thickness increases to 3.0 mm, the frequency bands from 1000 to 1200 Hz have an average drop of 3.7 dB(A), and the frequency bands from 2000 to 2200 Hz have an average drop of 12.5 dB(A). Peaks of abnormal noise-related frequency bands decrease evidently. Optimized scheme B (blades thickness = 3.0 mm) is adopted, and the prototype of the optimized VVT phaser is produced.
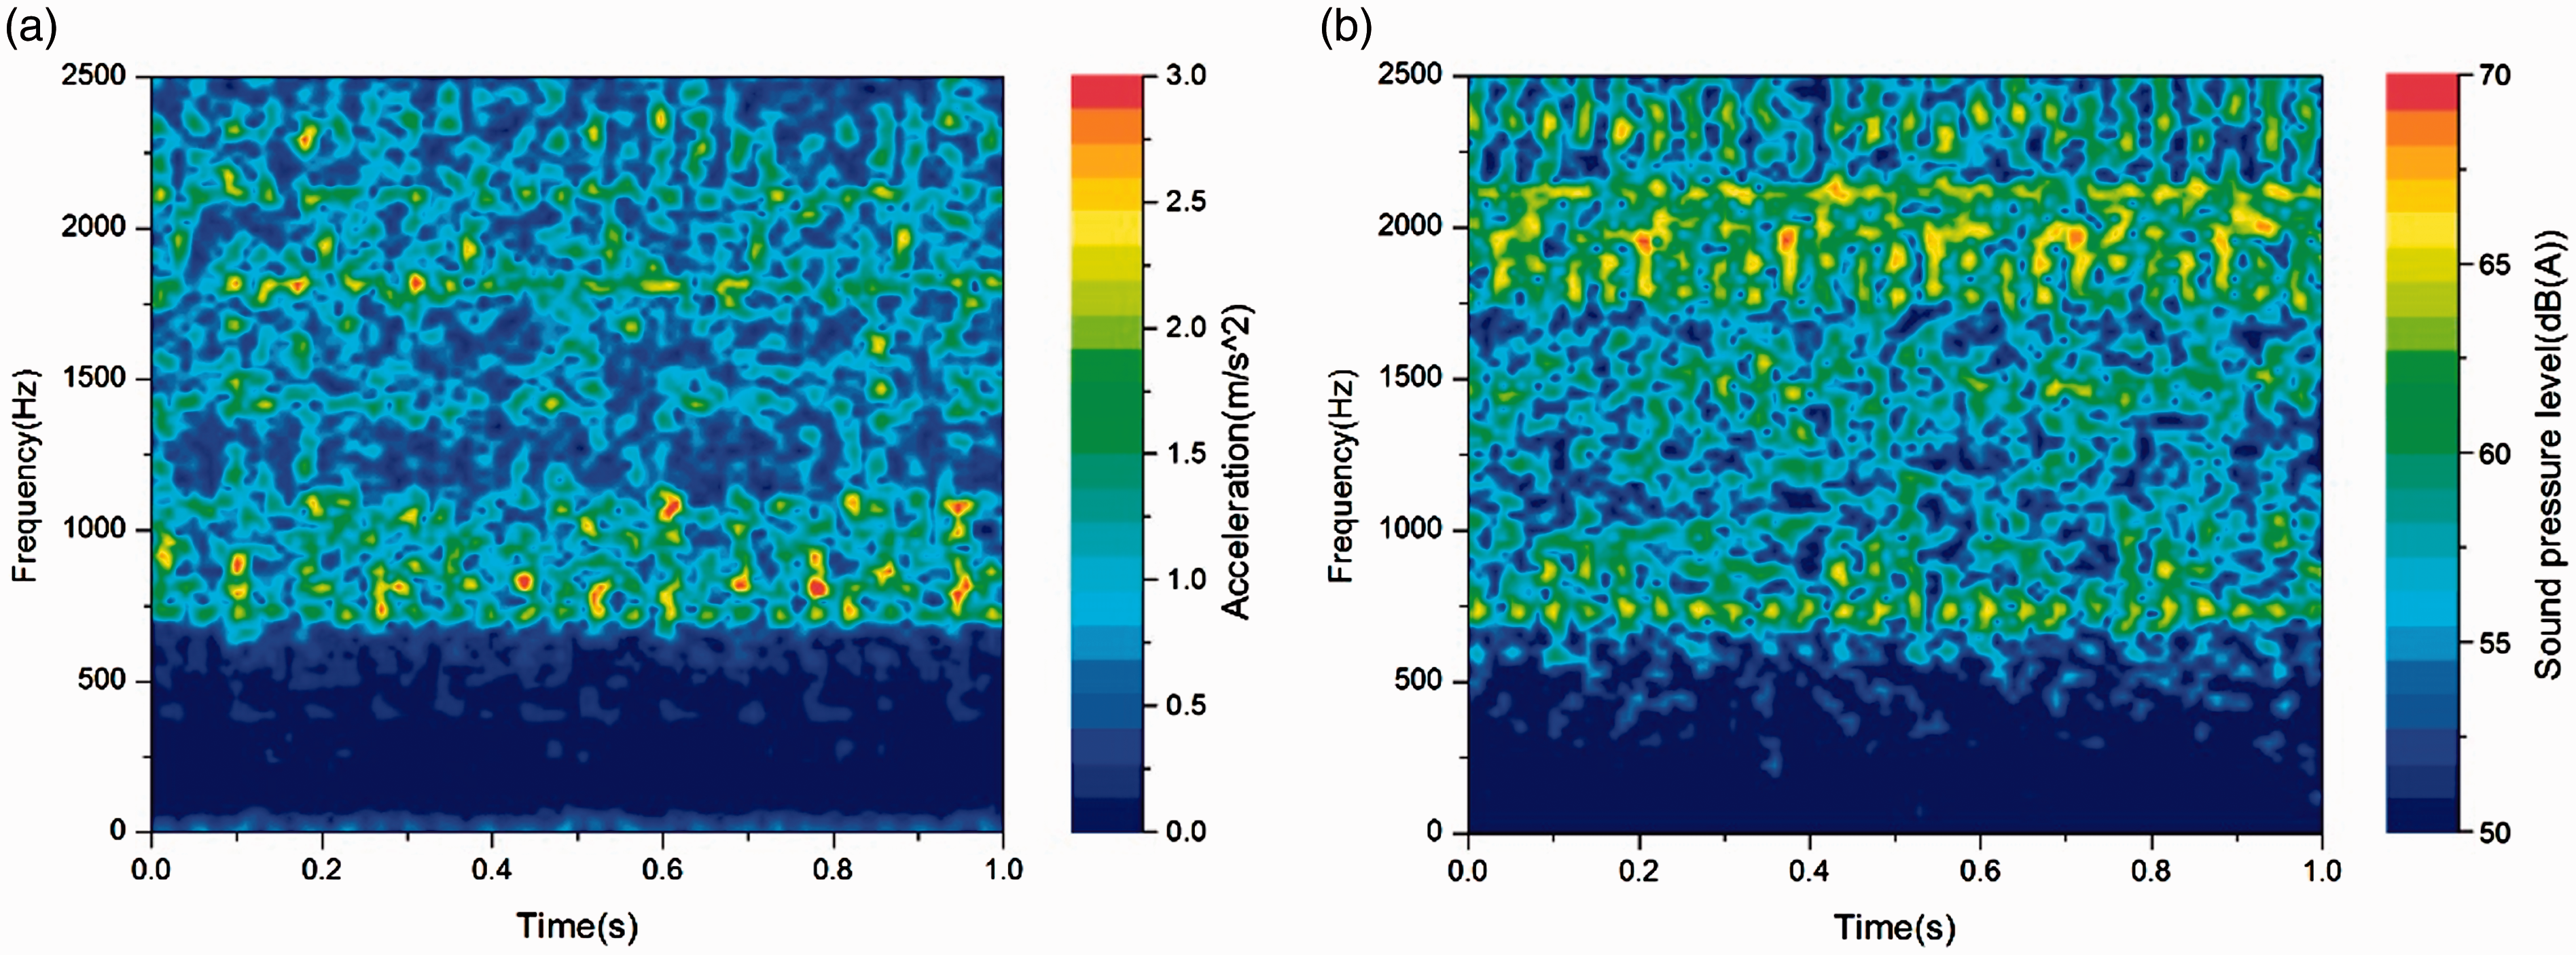
In order to verify the optimization of VVT, noise and vibration experiment is conducted to the engine equipped with optimized VVT (blades thickness = 3 mm). The vibration measure point is placed on the cylinder head cover, and the noise measure point is placed 10 cm over the engine, which is consistent with the prior experiments. The results indicate that the VVT phasers with optimized blades contribute to the reduction of the abnormal noise. The abnormal noise is basically eliminated under subjective evaluation.
As shown in Figure 26, amplitudes around frequencies of 1000 and 2100 Hz decrease significantly, and the abnormal noise is basically eliminated under subjective evaluation. Although there are new peaks around the frequencies of 700 and 800 Hz, the vibration and noise is low frequency and continuous, which is not obviously perceived under subjective evaluation.
TFD of vibration and noise with optimized VVT: (a) vibration on the cylinder head cover; (b) near-field noise 10 cm above the cylinder head cover.
Although increasing the thickness of the blades could cause impacts such as increasing weight of the part, decreasing range of VVT operating angle, and increasing cost, the optimized scheme is still the most verifiable straightforward way to improve the stiffness of the rotor. This is not the only way to reduce the abnormal noise. It is also possible to change the blades’ stiffness by changing the shape of the blades, changing the material of the blades, changing the number of cavities, etc., which needs further study.
Conclusion
The experimental research shows that the rhythmic abnormal noise, which is around 1000 and 2100 Hz, mainly comes from the cylinder head of the engine. Based on the analyses of the exploration experiments, it is concluded that the VVT is the source of the abnormal noise.
It is confirmed that the abnormal noise is produced by the impact of the rotor and the stator of the VVT phaser. Based on the analyses of the valve train dynamic simulation results, the process of the knock is concluded that the rotor blades disengage from the stator under negative load torque of the camshaft; under the effect of the torque reduction and the oil pressure difference, the rotor quickly rotates back to initial position and knocks the stator, causing the vibration of the valve train and the abnormal noise.
Explicit dynamics, implicit dynamics, and acoustic BEM are applied to the calculation of the VVT knock model. The simulation results show that the amplitudes of vibration and noise around the frequencies of 1100 and 2200 Hz are significantly larger, which is in accordance with the experimental results.
The thicknesses of the VVT blades are increased to 2 and 3 mm, respectively, as the optimized schemes A and B. The VVT knock model with optimized VVT phaser is computed by the method consistent with prior simulation. The comparison between the baseline and optimizations indicates that the vibration and noise at the corresponding frequencies are decreased evidently when the thickness of the blades increases to 2 or 3 mm.
Noise and vibration verification experiments are conducted to the engine equipped with optimized scheme B VVT (blades thickness = 3 mm). The results indicate that the VVT phasers with optimized blades contribute to the reduction of the abnormal noise. The noise components around 1000 and 2100 Hz drop significantly in the TFD. The abnormal noise is basically eliminated under subjective evaluation.
Footnotes
Declaration of conflicting interests
The author(s) declared no potential conflicts of interest with respect to the research, authorship, and/or publication of this article.
Funding
The author(s) disclosed receipt of the following financial support for the research, authorship, and/or publication of this article: The author(s) received financial support from the National Natural Science Foundation of China (Nos. 51876188 and 51705454) and National Key Research and Development Program of China (2016YFB0101604) for the research, authorship, and/or publication of this article.