
Abstract
Because of the higher requirements for vehicle comfort and people’s increasing ecological consciousness, research on the interior noise in a vehicle has received wide attention, among which structure-borne noise is hard to diagnose. To solve the problem, the transfer path analysis method of powertrain structure-borne noise has been systematically analyzed. By introduction of the powertrain source-path-receiver model, this method enables the researchers to estimate and study the noise, vibration, and harshness transfer functions and their operational forces. The aim is to further improve noise, vibration, and harshness with minimal negative impact on other vehicle attributes, such as ride comfort, handling, drivability, durability, etc. In this article, a parallel dry friction damper was added to the vehicle nearside powertrain mount, which is the most significant one to the receiver of passenger vehicle for improving its interior structure-borne noise induced by the engine. The test vehicle was a midsize executive vehicle. Since the structure-borne noise is composed of multiple paths, then the transfer path analysis test of the vehicle was carried out, and the transfer function and operational data at speed range started from 20 to 100 km/h were obtained. On the basis of the transfer path analysis results and the above principle, the friction damper on the body side of the nearside mount is improved by combination of the experimental transfer path analysis and the final measurements. The results indicate that a significant reduction for the A-weighted sound pressure level of the interior noise has been gained when the frictional damper was added to conventional mount.
Keywords
Introduction
The linearized transfer functions between selected source and response channels using singular value decomposition were used. For the analysis, several multichannel measurements, containing synchronous data for structure-and air-borne sound, in different operating conditions were performed. 1 The transfer functions calculated from an engine run-up measurement were used to analyze the contributions of the main sound sources over the dominant transfer paths to the vehicle interior noise. 2 In addition, the excitation from the main source was altered while all other aspects of source and structure were kept the same. The results indicate that the sound pressure level (SPL) of the calculated vehicle interior sound is in accordance with the values from the original measurements.
To reduce vibration and noise transmissions from a source to vehicle passenger’s cabin many viscoelastic joints has been used such as engine mounts and bushings. The amount of stiffness fluctuation of engine mounts due to material uncertainty and environmental temperature variation was estimated using a statistical approach. 3 First, the dynamic characteristics of engine mounts were described by a fractional derivative model. The fractional-derivative-model parameters and statistical information of rubber were estimated from test data. To estimate the variability of the dynamic characteristics of the engine mount due to the uncertainties of the rubber, the Monte Carlo simulation was used. 4 Operational condition such as temperature is also included in the variability analysis. The variability analysis results show that the dynamic stiffness variation of the engine mount due to the uncertain material properties of the rubber is more than 10 dB at 100 Hz.
The vehicle take-off shudder was complained of significantly by customers according to after sales statistics. Under an engine torque and half shaft angle, the drive-away shudder usually occurs during acceleration to a specific low speed, which makes the vehicle shakes severely. 5 For a small car, to provide a thorough investigation with possible design optimization of mounting system to reduce this lateral vibration, the take-off shudder which occurs at the speeds between 20 and 30 km/h has been considered. A 12-degree of freedom (DOF) rigid body model was established to simulate the engine and body system. 6 The design of powertrain mounting system should be modified to achieve the reduction of the shudder level.
The presentation of a semi-active engine mount with a controllable friction damper was shown, where the normal force of the friction contact was applied by an electromagnetic actuator and can be varied dynamically. An initialization method to account for wear and assembly tolerances was developed, which was based on indirect measurement of the actuators inductance. The friction contact was made up of industrial friction pads and a friction rod of steel. The control policy imitates viscous damping forces that exert a minimum of harmonics. 7 Damping was activated only when necessary. Finally, the friction mount was compared to the original mount in a row of test rack experiments and also in the vehicle. 7 The damper prototype proves to efficiently damp the combustion engine vibrations, and the design method used for dimensioning the friction damper gives a good approximation for the optimal sliding force of the damper.
Some experiments were conducted, firstly to study the force output performance, response time of ordinary piezoelectric friction damper, hysteretic behavior as well as its energy dissipation, secondly to study the performance of the Pall-typed piezoelectric friction damper, which is consisted by Pall-typed frictional damper and piezoelectric ceramic actuator. 8 The results show piezoelectric friction dampers have good force output capacity and they increase with the input voltage gain 9 ; the dampers have a quick response and a short response time; the hysteretic behaviors are stable, which almost has no relevance with loading frequency.
A nonlinear damper had potential for control of vibration but had not received much attention by researchers. In particular, the nonlinear behavior of the system had not been explored in detail so far. A periodic solution for the response of the structure-friction system modeled as a two-degree-of-freedom system is obtained under harmonic excitation using harmonic balance based on a method of averaging. A statistical linearization method was used to replace the nonlinear friction by an equivalent viscous damping. Numerical simulations have demonstrated that the linearized solutions for both the harmonic and the random cases were accurate enough. The periodic and statistical linearized solutions were used to analyze dynamic characteristics of a structure-friction system. 10 As expected in a nonlinear system, the frequency response function (FRF) of the displacement response of the structure for the structure-friction system was dependent on the level of excitation.
In this study, it is aimed to describe one of the most important steps in vehicle noise, vibration, and harshness (NVH) development and target setting, which can be referred as vehicle interior noise source contribution and transfer path analysis. Moreover, a parallel dry friction damper was added to the vehicle nearside powertrain mount, which is the most significant one to the receiver of passenger vehicle for improving its interior structure-borne noise induced by the engine. The test vehicle was a midsize executive vehicle. Since the structure-borne noise is composed of multiple paths, then the transfer path analysis test of the vehicle was carried out, and the transfer function and operational data at speed range started from 20 to 100 km/h are obtained. Finally, a critical peak noise level, which may be a potential NVH problem, is investigated in more details with the interior noise contribution and transfer path analysis method and potential solution opportunities are addressed
Theoretical considerations
Transfer path analysis (TPA) concept
TPA is a tool to evaluate the contribution of different energy propagation paths between a source and a receiver, linked to each other by a number of connections. TPA is typically used to rank the relative importance of the vibro-acoustic paths in a frequency band and to determine the most significant path to a given receiver location. Since the path is identified and quantified, techniques of noise and vibration control can be efficiently applied to minimize the overall response level. It should be noted that contributions of each path are vector quantities, that is, their magnitudes are not arithmetically summed to obtain the total level since destructive interference can occur at certain frequencies. A single source, implying in total coherence among the noise paths, is the simplest case of TPA. A classical example of this situation is the analysis of the interior noise of an automobile caused by the engine operation during the normal usage. Basically, two quantities have to be determined during the analysis. The FRF are obtained either experimentally or analytically and the influence of the mechanical impedance of the source can be taken into account or not. The operational forces can be directly obtained from measurements using force transducers or estimated through the measurement of auxiliary parameters, using indirect techniques. The methods to obtain these quantities and consequently the analysis of the transfer paths will be presented and discussed in the next section.
Vehicle interior noise simulation (VINS)
The engine mounts constitute the most important components of the structure-borne noise transfer path. The engine vibration excitation (due to combustion and mechanical forces), the energy transfer through the powertrain mounts and the chassis as well as the sound radiation are contributing to the structure-borne noise share. The overall structure-borne noise transfer function is calculated by the consideration of the transfer functions of the mounts, apparent masses and body (Figure 1).
11
The mount transmissibility can be calculated from engine mount acceleration measurements for an engine run up on the vehicle test bench. The value of the mount transmissibility for a certain frequency is calculated based on time sequences with strong excitation at that particular frequency. Through this procedure, signal to noise ratio is improved, and the influence of “cross talk” from one mount to another is minimized. The mount transmissibility depends on the mount properties and on the local stiffness of the chassis. The transfer function, which is a property of the mount itself, is the effective dynamic mount stiffness. This is the product of the mount transmissibility and the apparent mass. The apparent mass is determined via an impact measurement at the vehicle body close to the mount connection. The vehicle body transfer function is measured simultaneously with the apparent mass by additionally recording the cabin noise sound level at the driver’s head position. Finally, the overall structure-borne transfer function is calculated by multiplying the dynamic mount stiffness with the chassis transfer function.
12
The resulting frequency curve typically shows high levels up to approximately 120 Hz and decreases significantly above 500 Hz. This reflects the well-known low pass response of the chassis to structure-borne noise excitation.
Graphical representation of VINS method. VINS: vehicle interior noise simulation.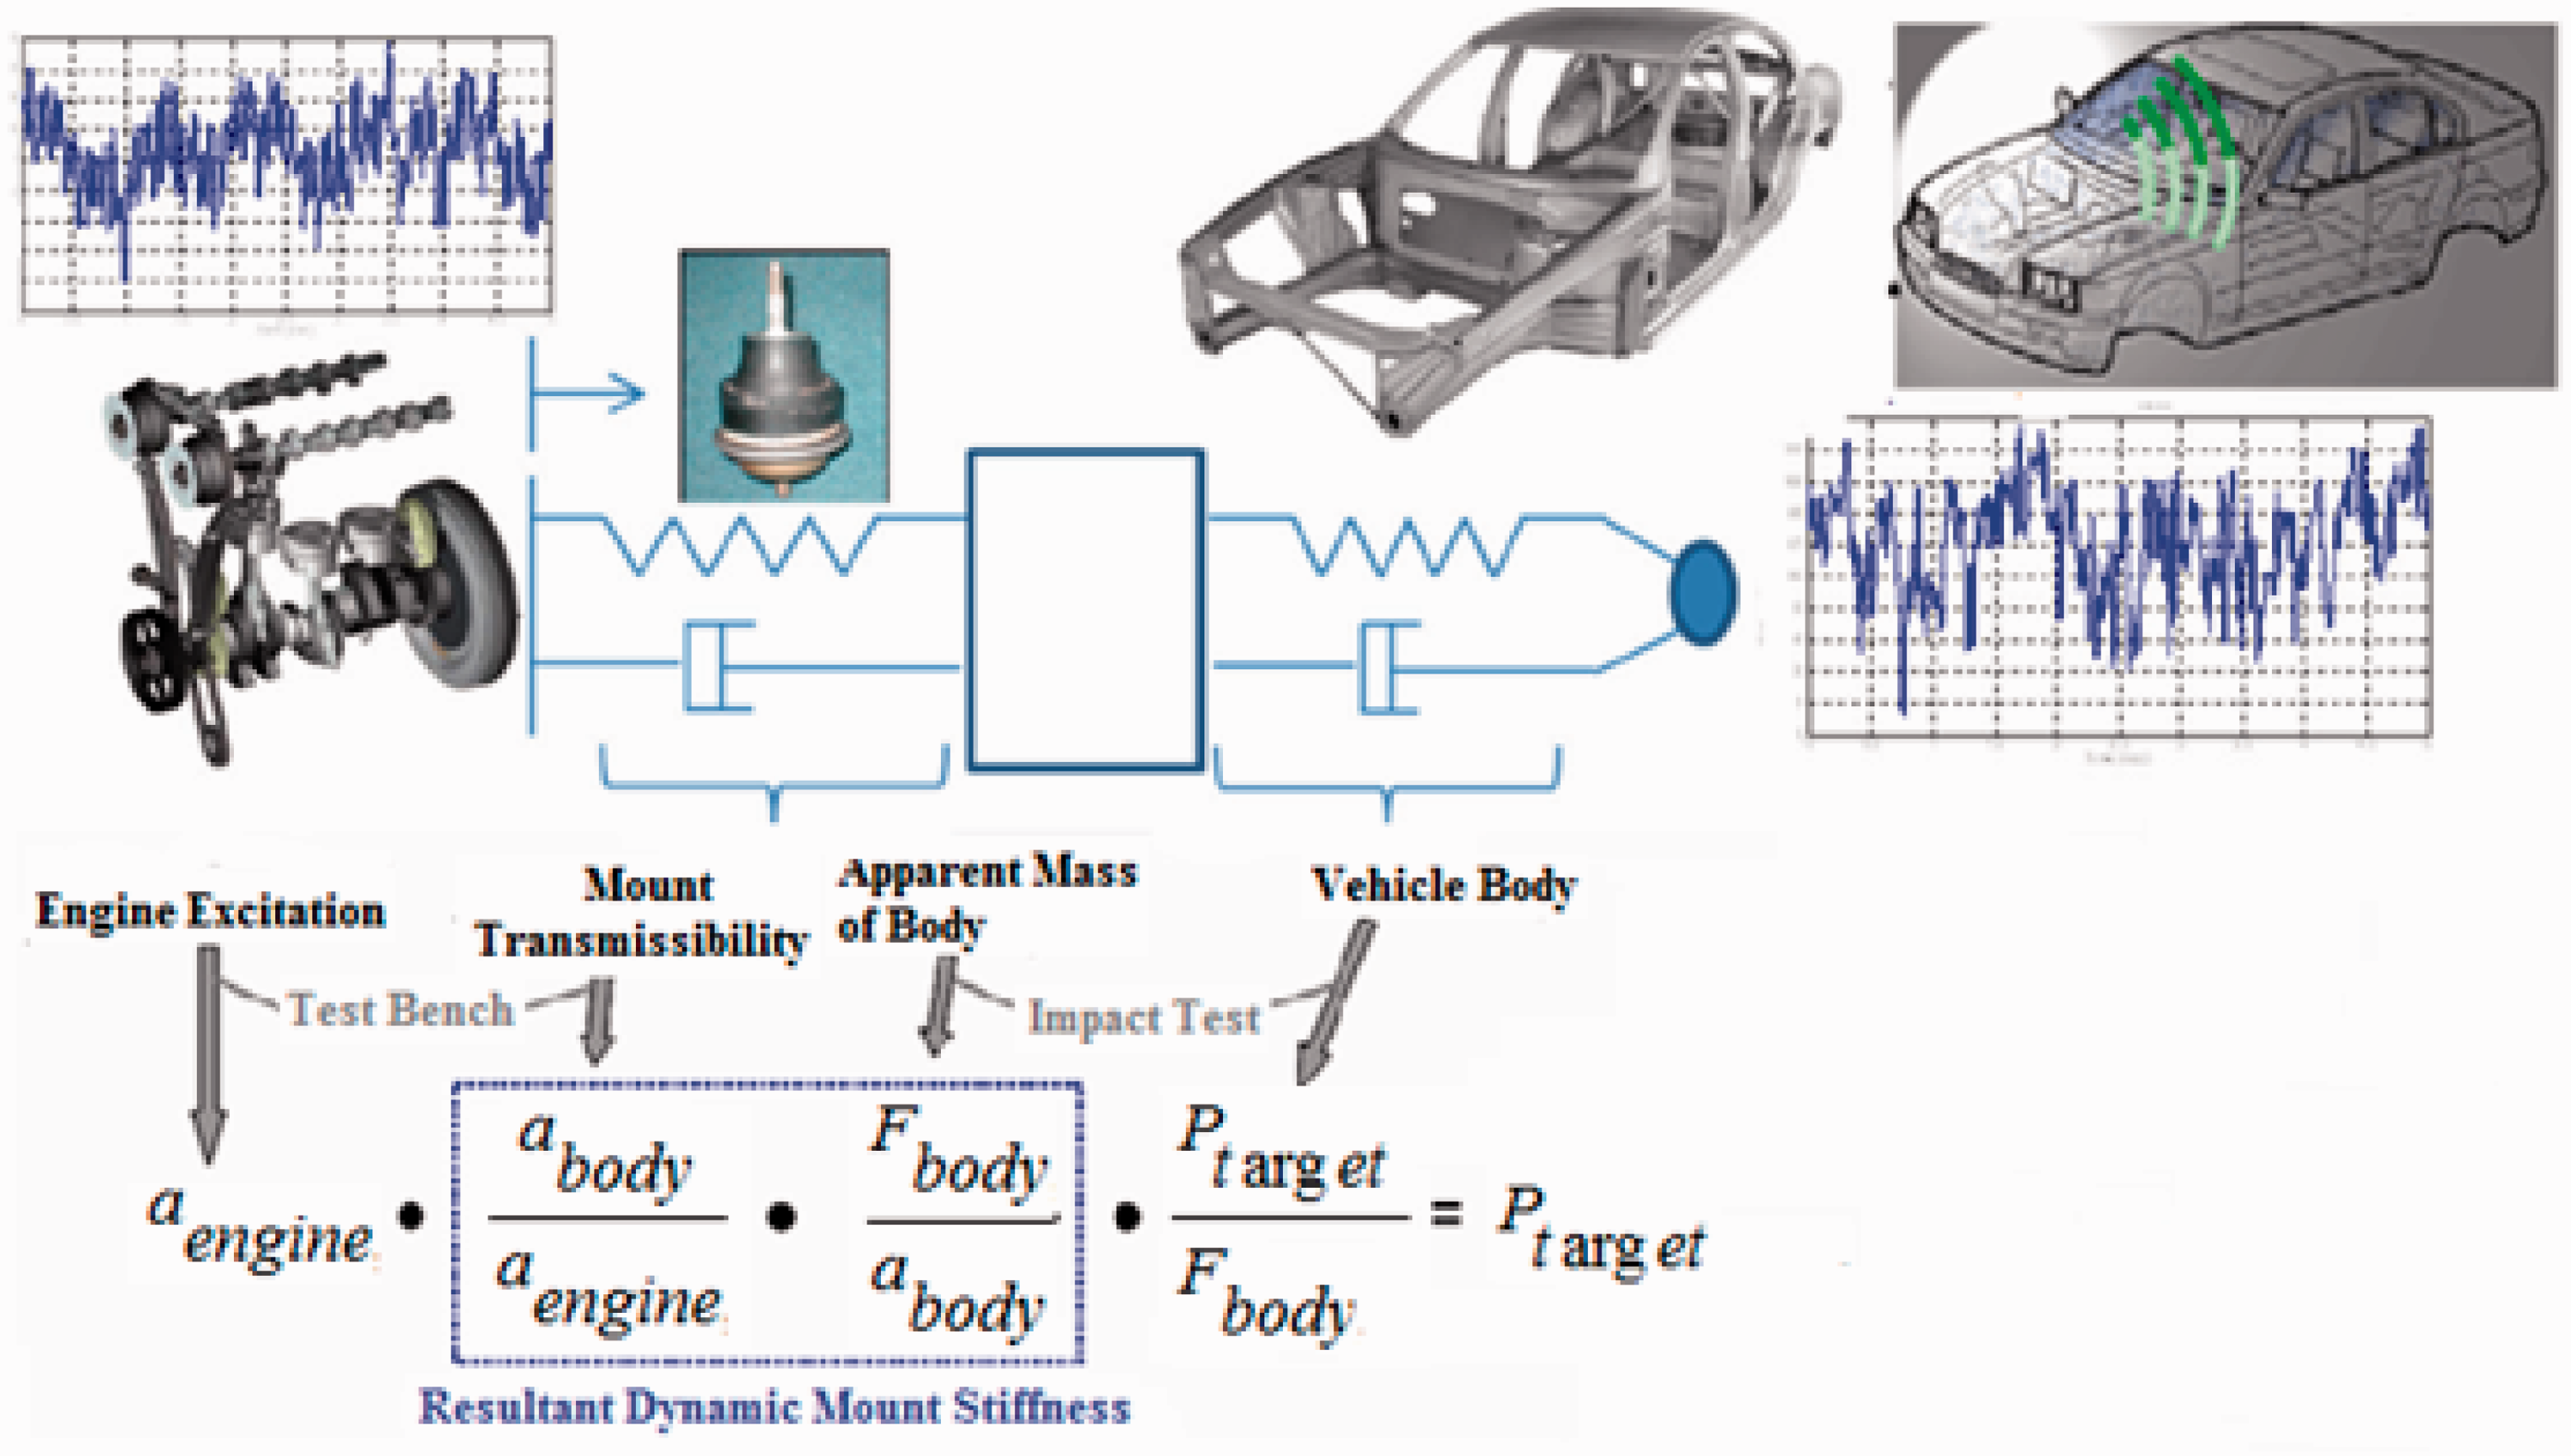
During the development phase of the vehicle (even before an engine is installed in the vehicle), potentially annoying interior noise shares, their causes and transfer paths can be identified by using the VINS technique. This analysis is carried out in the time domain so that all phase information from various paths is preserved and the simulated interior sound can be analyzed subjectively (by listening to it) and objectively. The interior sound simulation technique is also used to perform noise path analysis on an existing vehicle. Measured powertrain level data and structure-borne/airborne noise transfer functions are used to synthesize the interior noise. By chain multiplication of the above-mentioned transfer functions in input vibration of the engine at engine mount location; the noise contribution of different paths will be obtained. Figure 1 shows a graphical representation of the method. Equation (1) shows the mathematical overview of the method.

In equation (1), Pint,j (N,ƒ) is the acceleration amplitude of the vehicle interior at a target point at different engine speed N and each frequency f. This parameter is taken as an output of the system.
H1,j (ƒ) is the mount transmissibility function (in frequency domain f), which is the ratio of the acceleration on engine mount body side to acceleration of the engine mount at engine side, as defined in equation (2) This gives the ratio of engine mount isolation factor. An engine mount would have better performance for higher isolation factors.

H2,j (ƒ) as defined in equation (3) is the ratio of the force to the acceleration of the body near the engine mount; therefore, it is called the virtual mass of the body. Higher values of this parameter show better body NVH performance.

H3,j (ƒ) is the body transfer function in SPL transfer from engine mount location to the vehicle interior target point, equation (4).

Experimental method
The test vehicle was a mid-size executive vehicle, where its class is Kia Soul and layout is front engine with front wheel drive. The conventional mount equivalent stiffness (K) is 200 kN/m. The A-weighting of the dB sound pressures level reveals tonal aspects (speed dependent) related to tire rotation frequency as well as constant resonance characteristics. During the measurements, the vehicle speed changed from 20 to 100 km/h. The noise was measured at the driver’s head position, i.e. the microphone was positioned close to the head, in order to analyze the effect of the noise on the driver while driving the vehicle.
Vehicle engine-transmission vibration source (input)
Vehicle engine-transmission specifications.
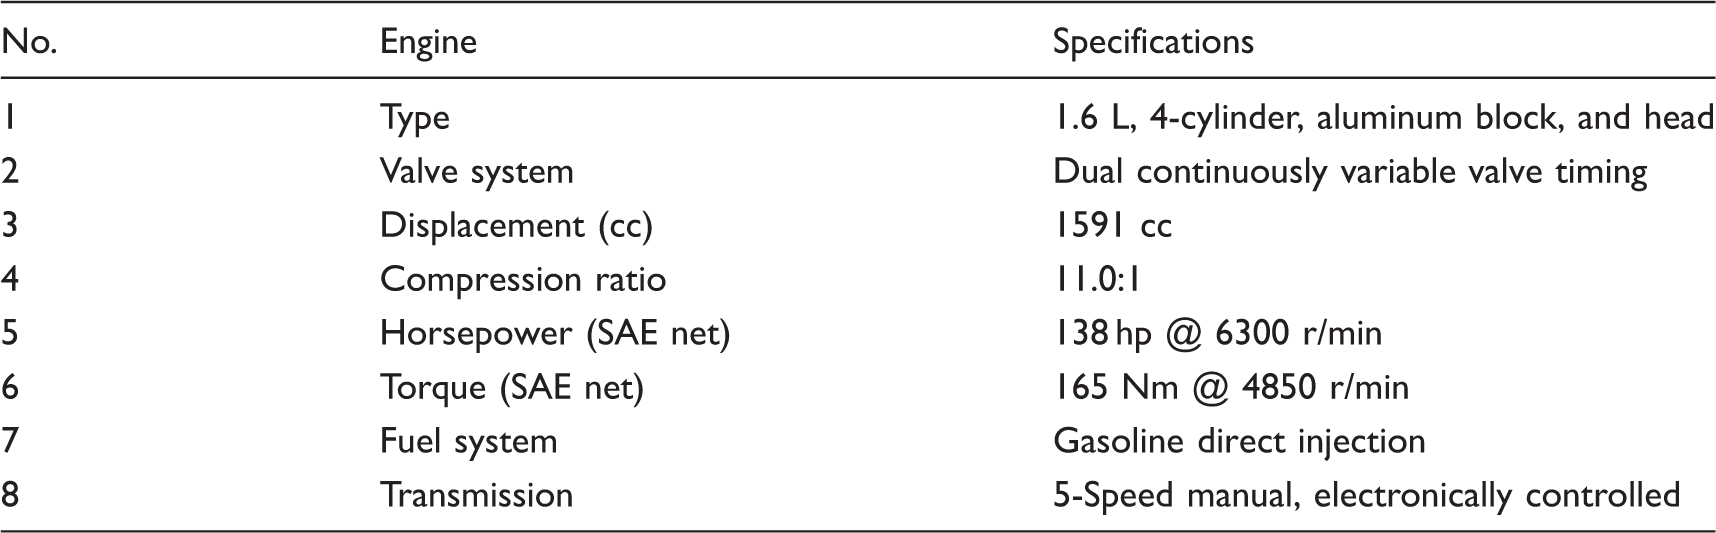
SAE: Society of Automobile Engineers.
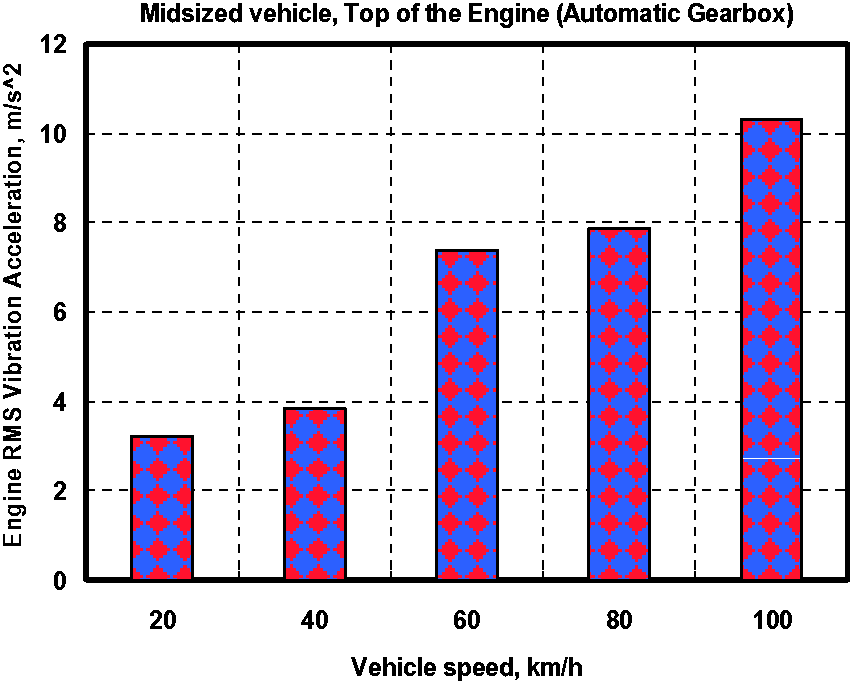
The vehicle has a four cylinder engine of 1.6 l. The engine and the transmission are installed on the vehicle body by three mounts. The time-history of the vibration acceleration was measured over the top of the vehicle engine, when it lifted up from the ground to release the contact between the tires and the ground. This was done to eliminate the influence of tire-road interaction. One accelerometer was installed on the top of the engine as shown in Figure 2. The vehicle was then taken under a run up test from 1250 r/min (20 km/h) to 6250 r/min (100 km/h).
Position of the accelerometers over the top of the vehicle engine.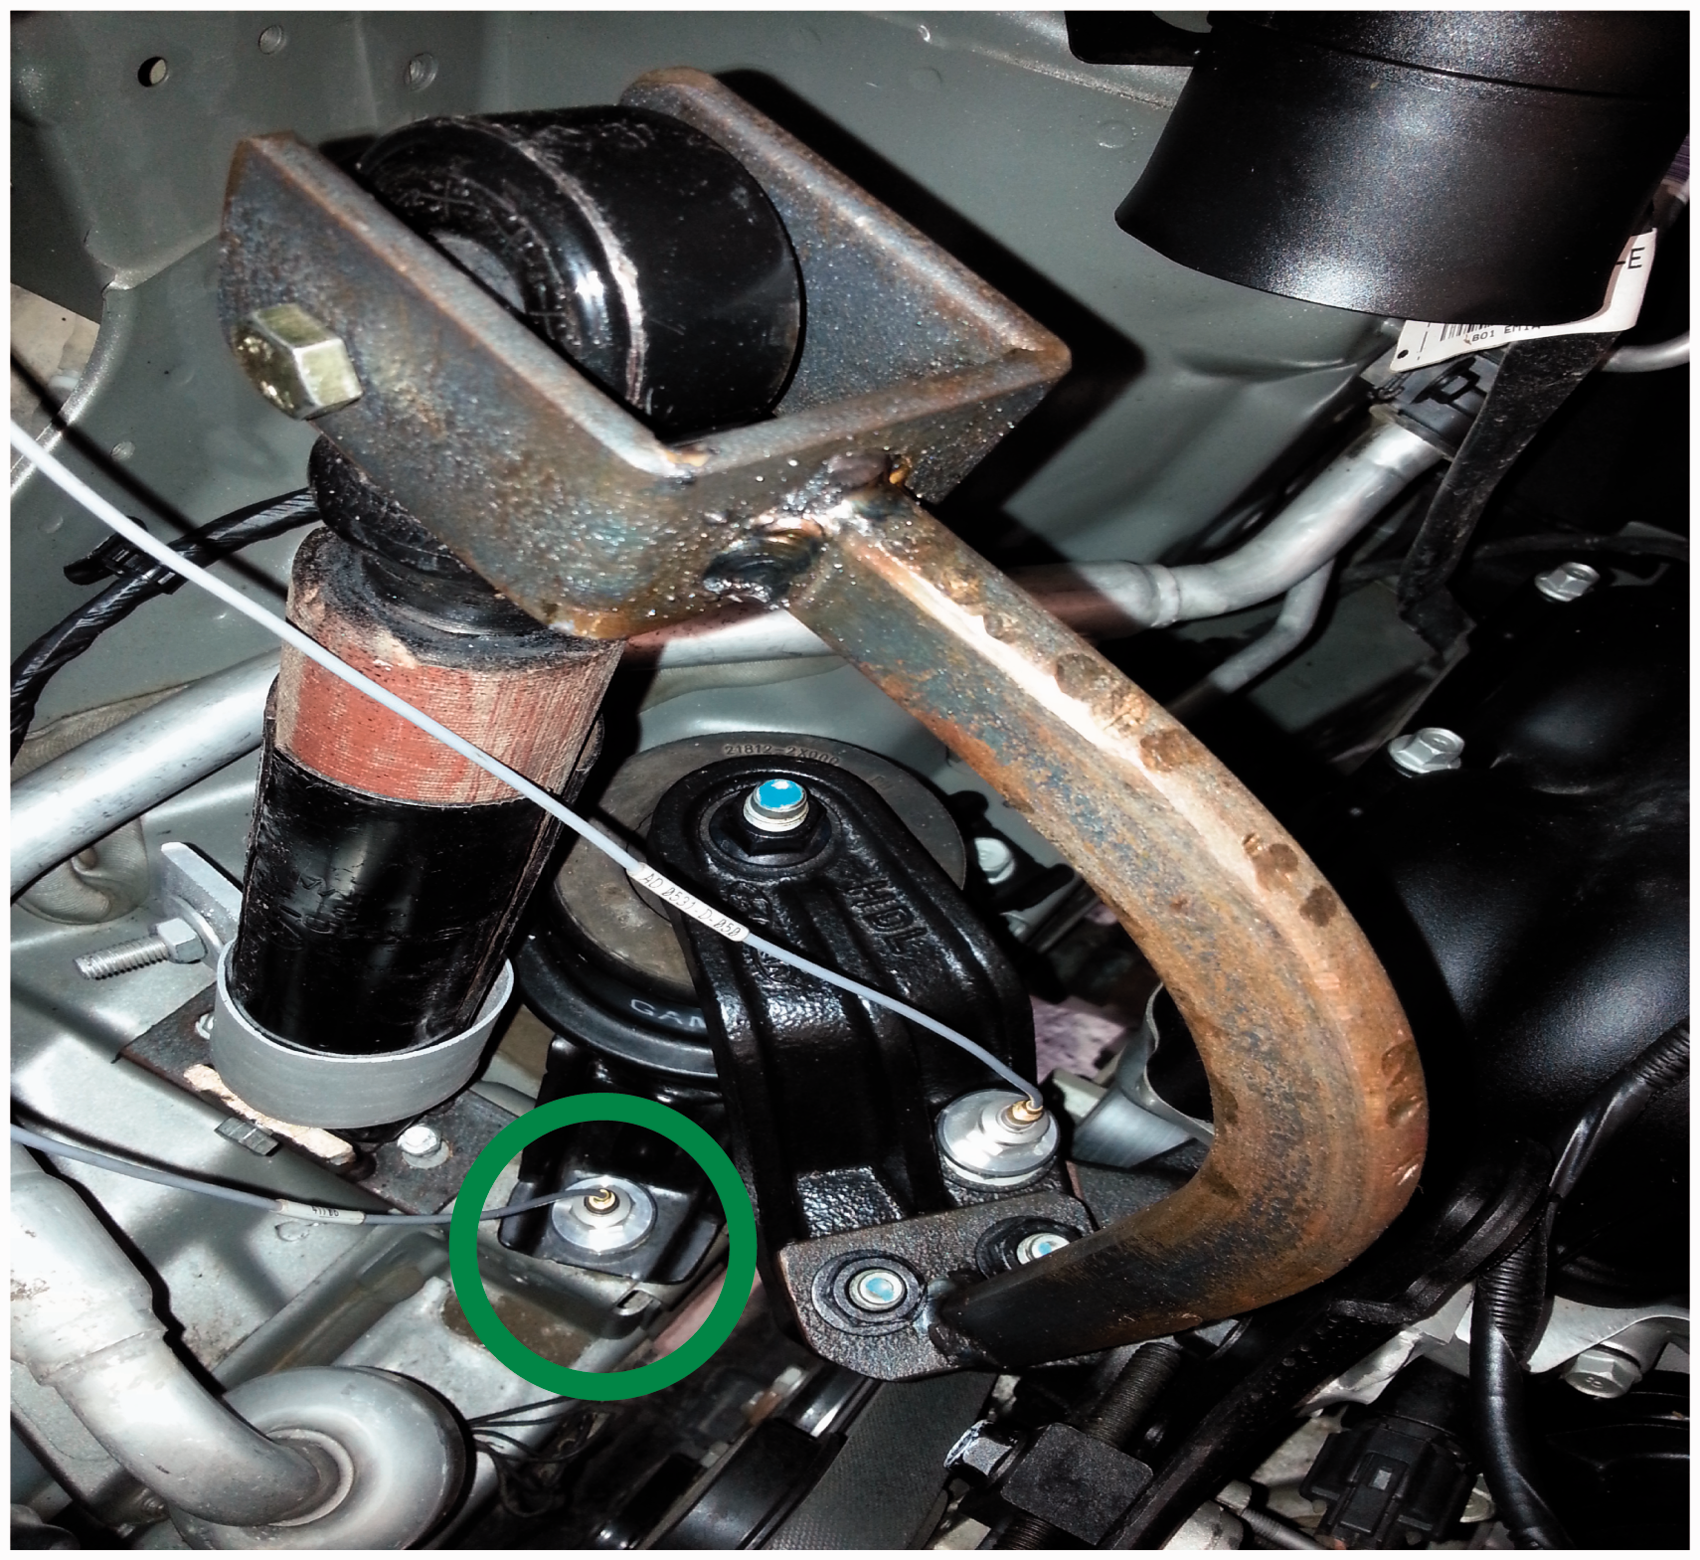
Hammer experiment
The vehicle chassis nearside beam was excited using a hammer with the clamped base boundary conditions of the structure and no free–free conditions were considered. The experiment was carried out based on the recommendation stated in BS6897 (British standards of acoustic and vibration exciter). Therefore, when the vehicle chassis side beam was excited, it takes about one minute for the oscillations to decay.
Experimental friction damper
The friction damper consists of several moving and stationary components as shown in Figure 3. An outer tube is fixed to the inner guide. The moving components consist of the inner tube covered by friction materials and brake band fixed around outer tube. The outer tube also comes in contact with the friction materials as it vibrates. The normal force applied on brake band to close outer tube to the friction materials to induce a frictional load, which retards the motion of the inner tube. The maximum damping coefficient of dry friction damper (c) is 80 Ns/m.
The friction damper and its stationary components.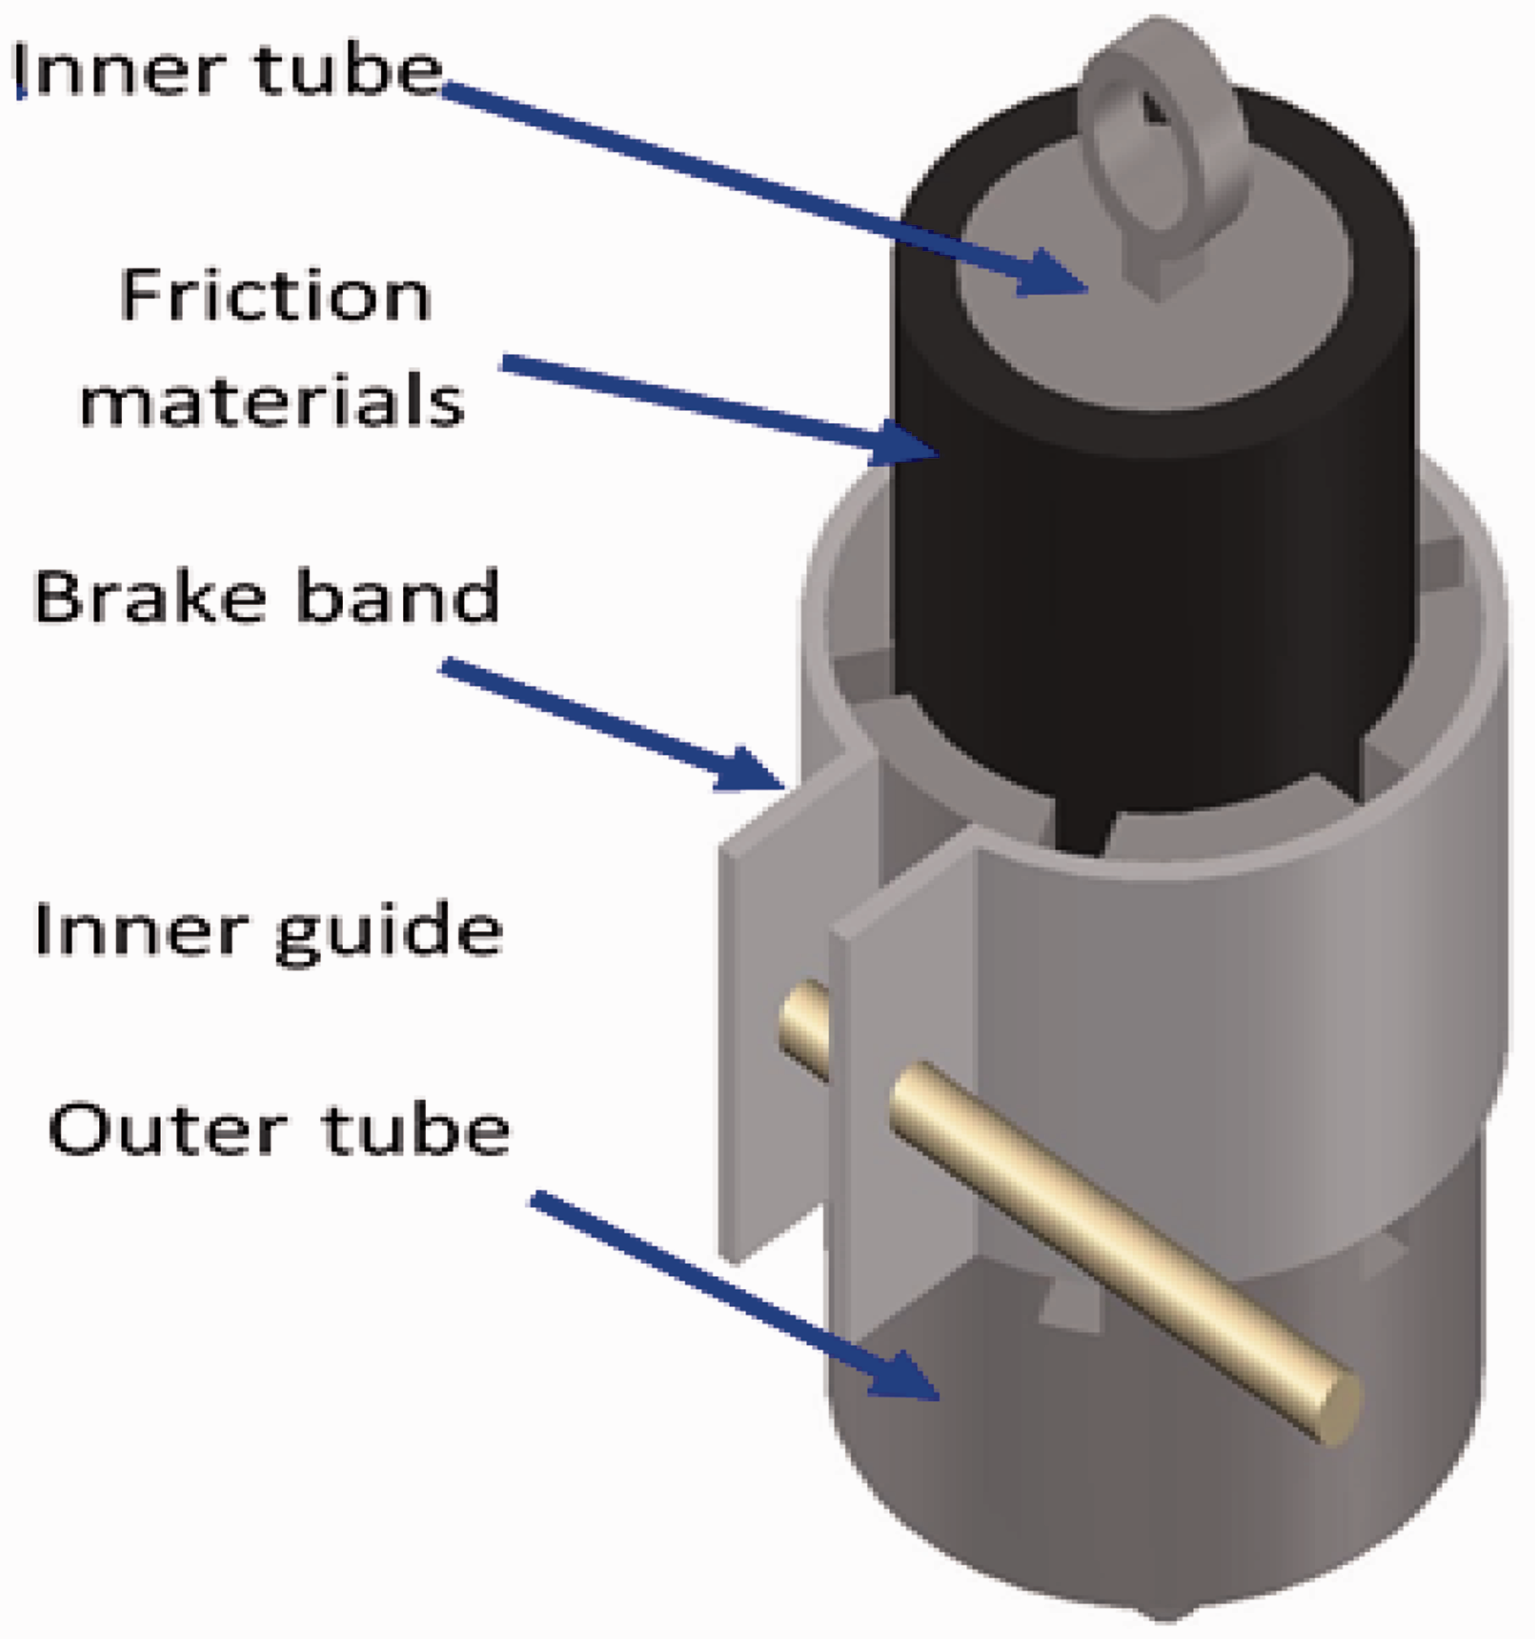
Friction damper impact force experiments
Several experiments were carried out in order to characterize the friction induced by the actuator. First of all, with the only contact of the moving elements being the air bearing, which has negligible friction, the force input, and the inertial force were compared at various excitation amplitudes and frequencies. After this, applying an input voltage to the actuator, a normal force was exerted onto the outer housing through the friction pads. Tests were carried out by varying the actuator voltage (0, 30, 60, 90, 120, and 150 V), the shaker voltage (5, 7, and 9 V), and the shaker frequency (20, 25, and 30 Hz). The applied voltage to the actuator is sinusoidal and the frictional force is determined using equation (5), by measuring the acceleration (
From the results of these experiments, friction force amplitudes were compared. Finally, the actuator input voltage was controlled by dSPACE to vary the normal force linearly and in steps.
General procedure of VINS
Vehicle interior noise at driver’s head position
To measure vehicle interior noise characteristics up to 800 Hz, the relevant physical effects have to be considered. Three main groups of vehicle areas interacting with one another and influencing the interior noise can be selected. These are, the vehicle body structure itself, the fluid enclosed in the passenger room (as well as other cavities e.g. cavities behind covers, etc.) and the trim parts connected to the vehicle body. In present work, one vehicle was prepared using a recording technique with a signal length of 0.8 s and a sampling rate of 2048 Hz. Under each vehicle speed, the noise signals levels were measured for either operating or hammer test and analyzed in terms of SPL by 1/2 in-condenser microphone Bruel & Kjaer Type 4189-A-021, which was mounted in the driver’s head position within the test vehicles with all vehicle windows closed. The1/2 in-condenser microphone Bruel & Kjaer Type 4189-A-021 was calibrated by using B&K Type 4288 pistonphone calibrator. The analysis was carried out by using the a Bruel & Kjaer portable, multi-channel PULSE, Type 3560-B-X05 analyzer, Bruel & Kjaer PULSE labshop, and the measurement software type 7700 and saved in the computer. During measuring, the microphones were arranged at 0 or 0.2 m from the centerline of the seats with a height of 0.7 m as shown in Figure 4, depending on the seated conditions.
Position of the microphone to measure interior SPL. SPL: sound pressure level.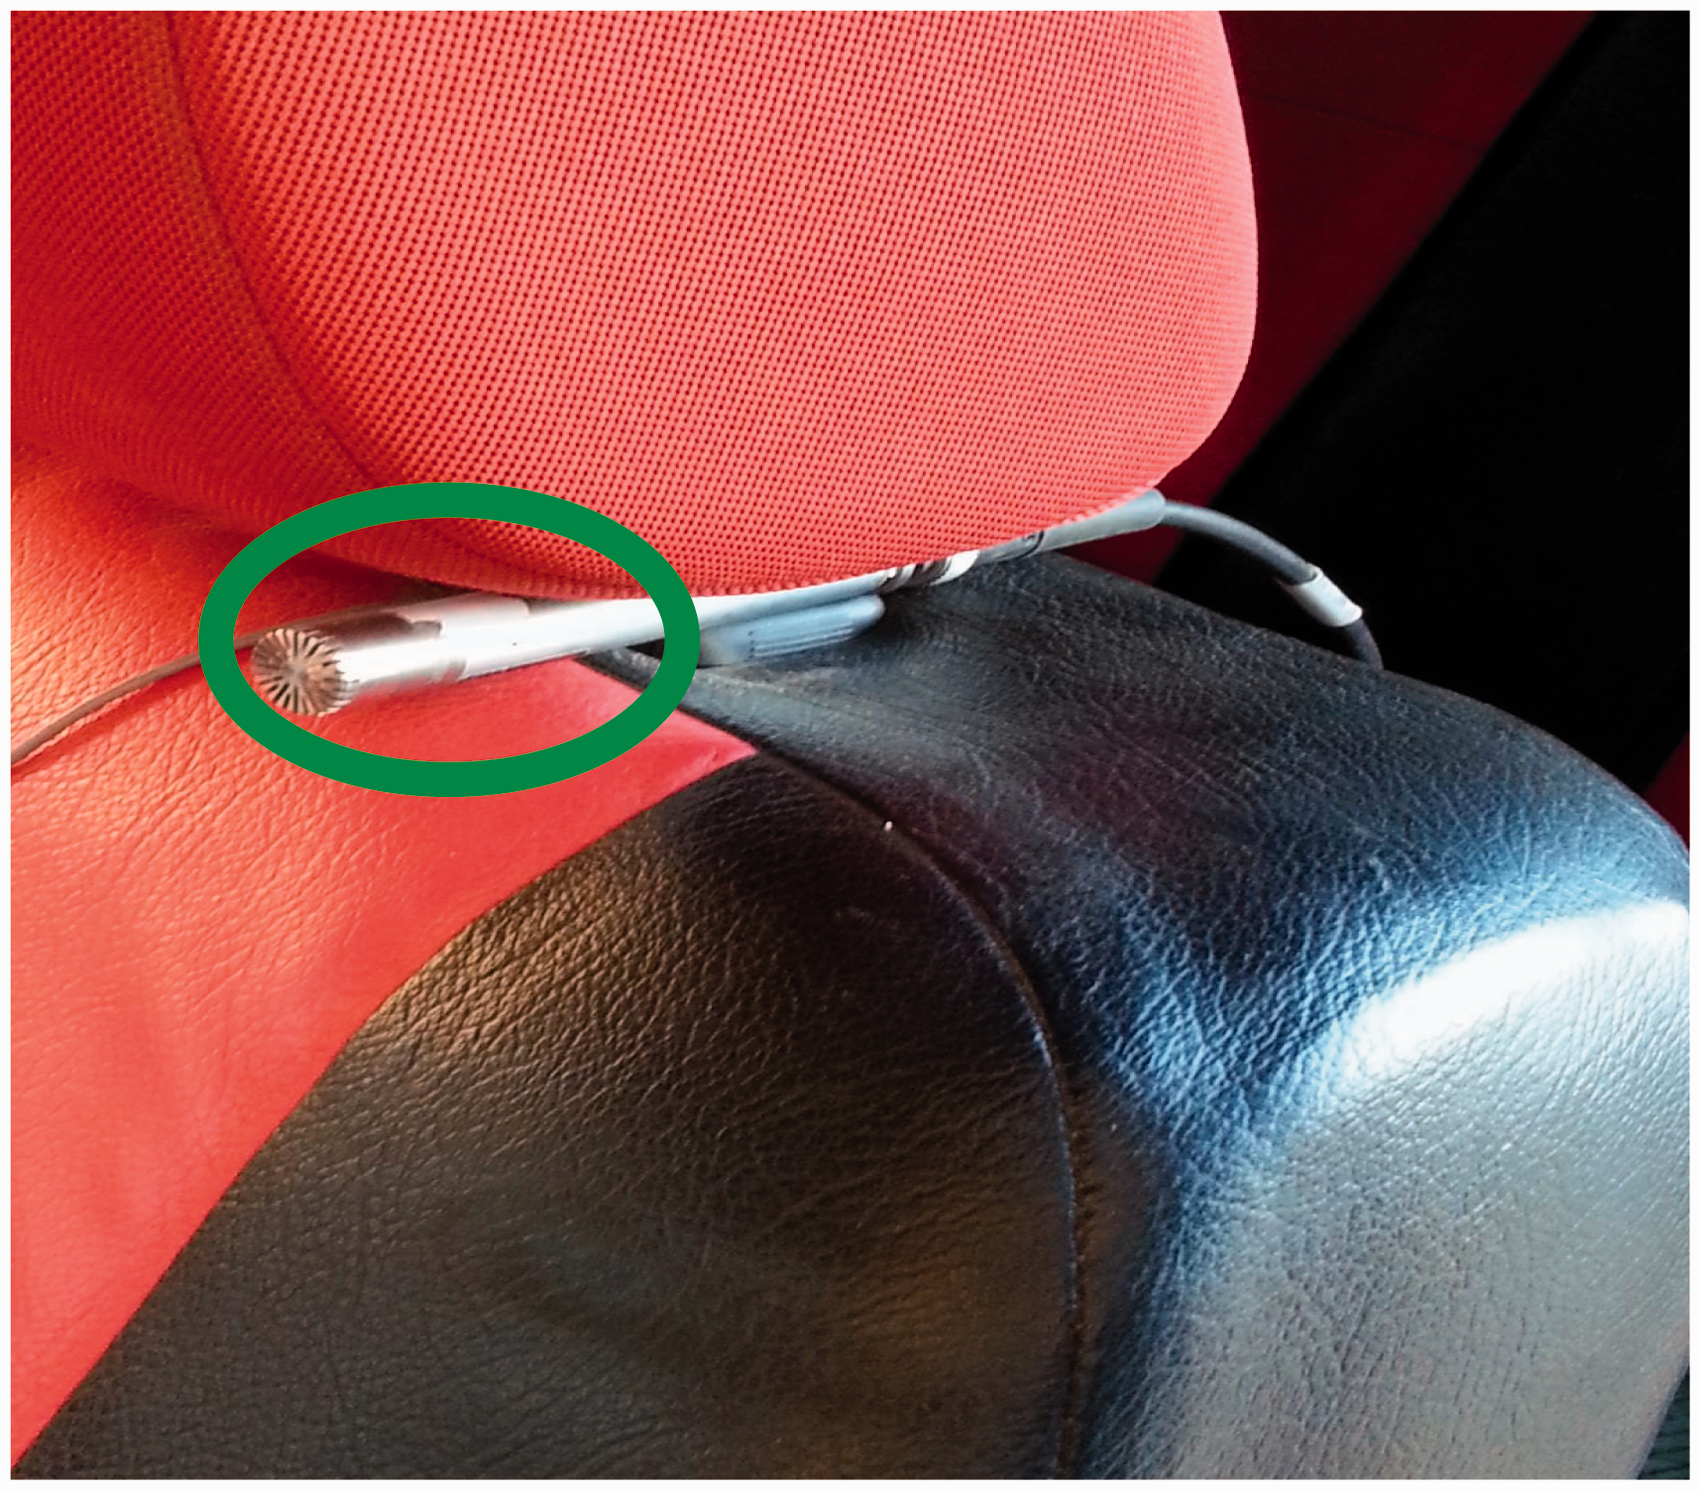
Vehicle vibration acceleration signals
The vibration acceleration in terms of frequency domain was measured on the top of the vehicle engine and on the vehicle chassis nearside beam was measured in vertical direction by using Bruel & Kjaer accelerometer Type 4514B-001, which calibrated by using vibration calibrator B&K Type 4294. The vibration amplitudes recorded from the vehicle engine top and the vehicle chassis nearside beam during hammer (see Figure 5) and operating tests were conducted for possible artifacts and any unclear signals detected are removed. The vibration acceleration measured was truncated to show the frequency range of interest, which is up to 800 Hz.
Accelerometer mounted on the vehicle chassis.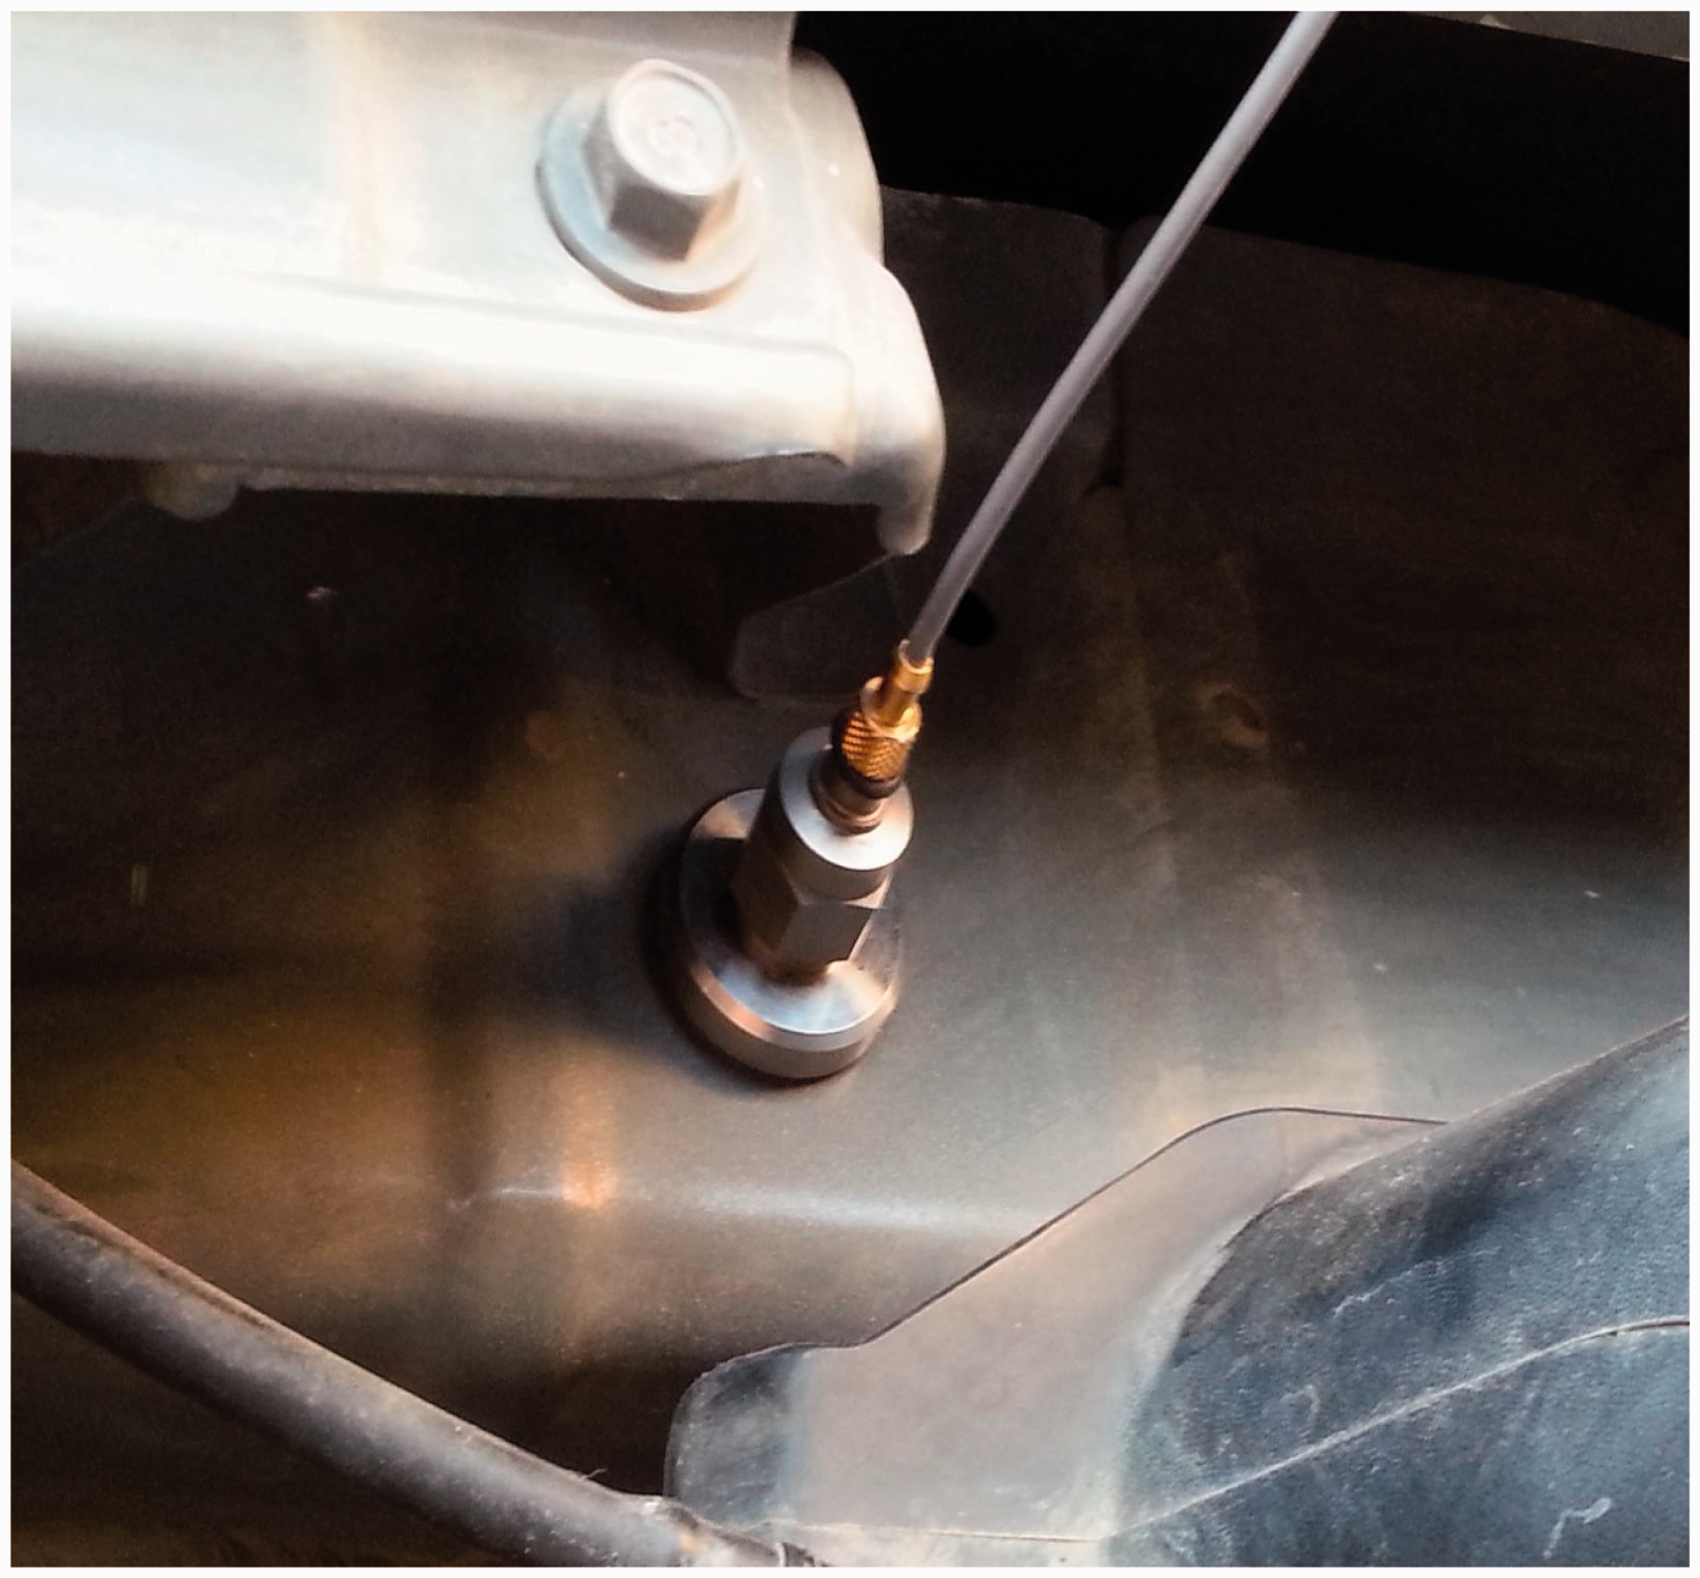
TPA
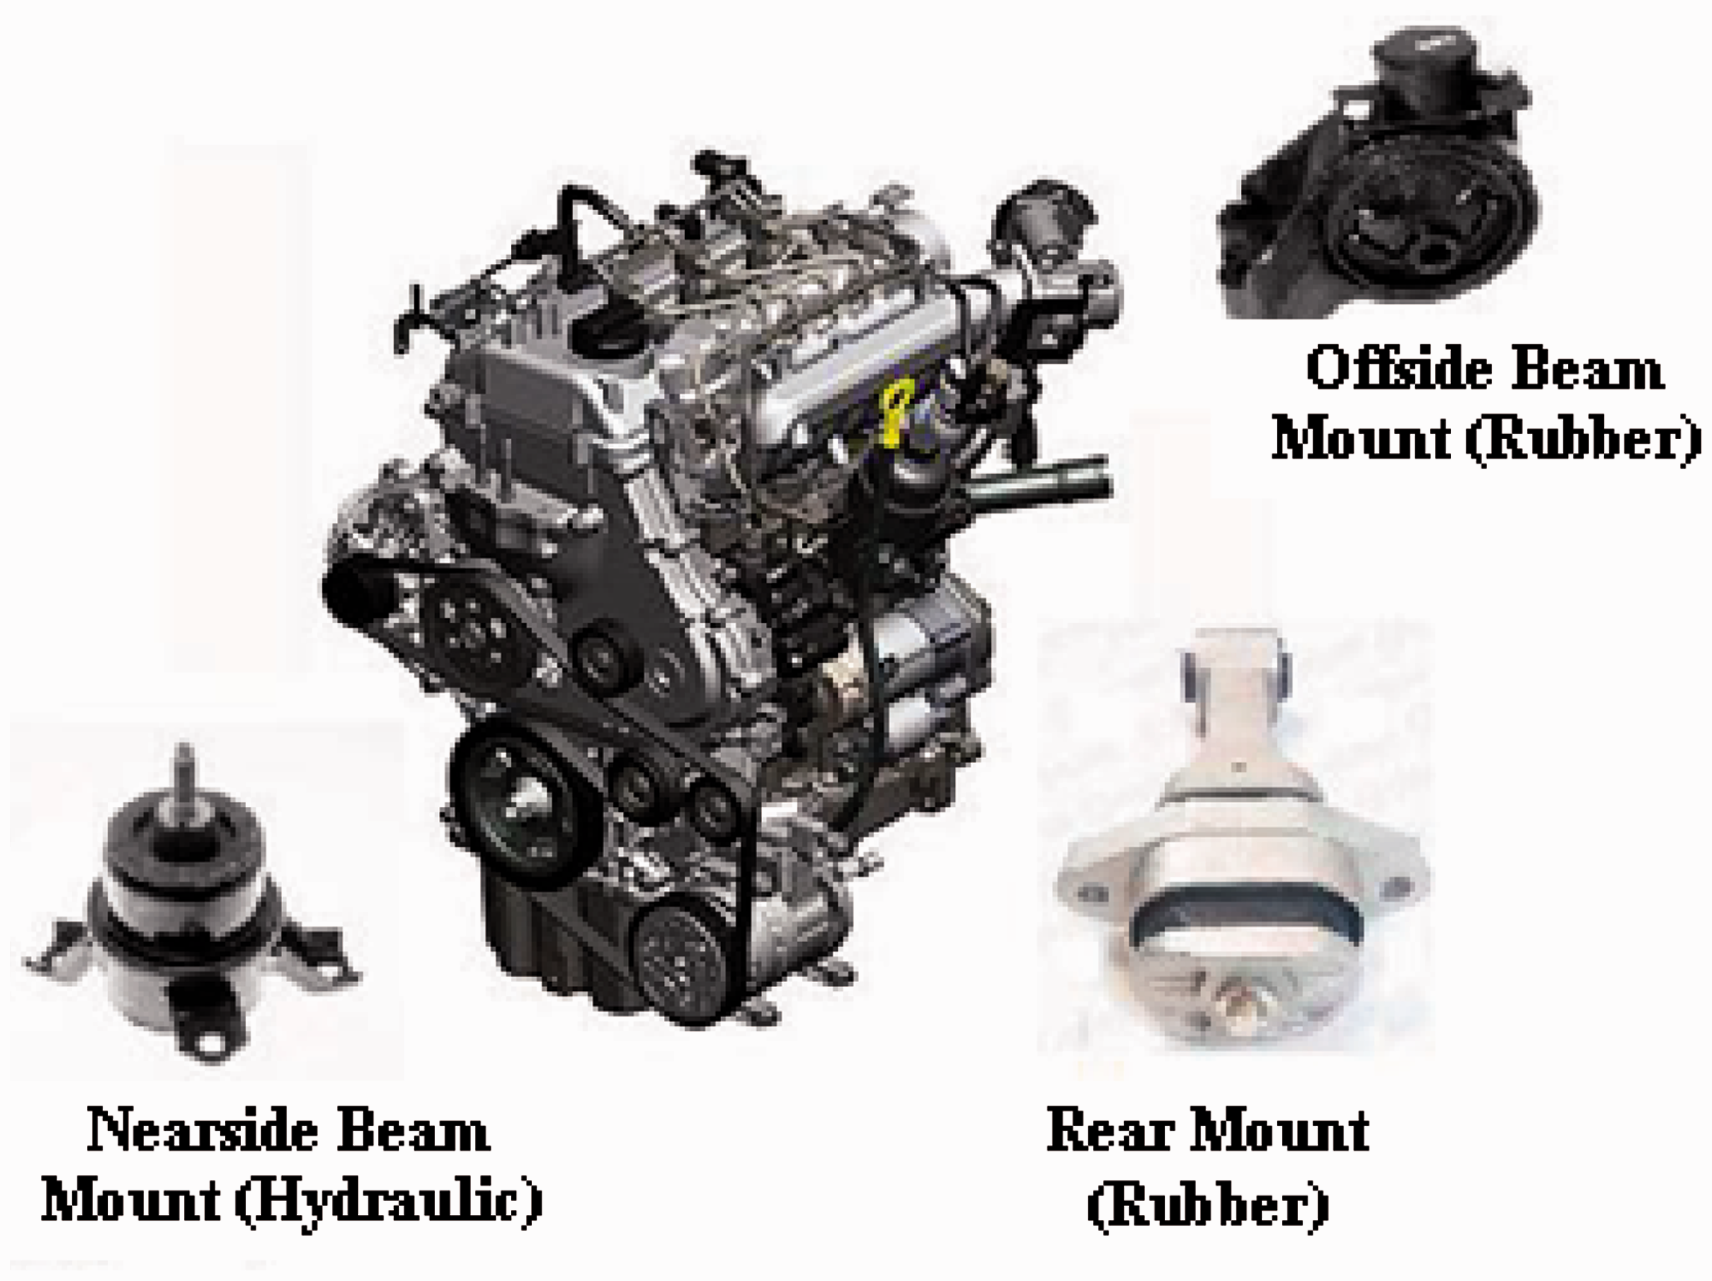
For evaluation of vehicle interior noise in a sedan vehicle compartment, a procedure for interior noise simulation was applied based on multilevel TPA. The vehicle has a four cylinder engine of 1.7 l. The engine and the transmission are installed on the vehicle body by three mounts. Two of the mounts are just rubber and one is a hydraulic mount. The mounts are named as: near side beam mount, driver’s side beam mount and Rear mount. The near side beam mount is a hydraulic mount and driver’s side beam and rear mounts are made of rubber. Figure 6 shows the transverse engine mounting system and also the shape of the mounts.
In this work, the transfer functions of apparent mass and body were measured in presence of powertrain on the chassis. In some publication, the transfer function has been measured without the engine. Test results show (the results are not reported) the measurements without the engine caused significant error in calculating the contributions. Figure 7 shows the test setup of the vehicle on laboratory, while it wheels away from the laboratory floor. Mount transmissibility was measured via a test on the vehicle. Two accelerometers were installed on each sides of every engine mount. The vehicle was then taken under a run up test from 20 to 100 km/h.
Experimental set up on the vehicle.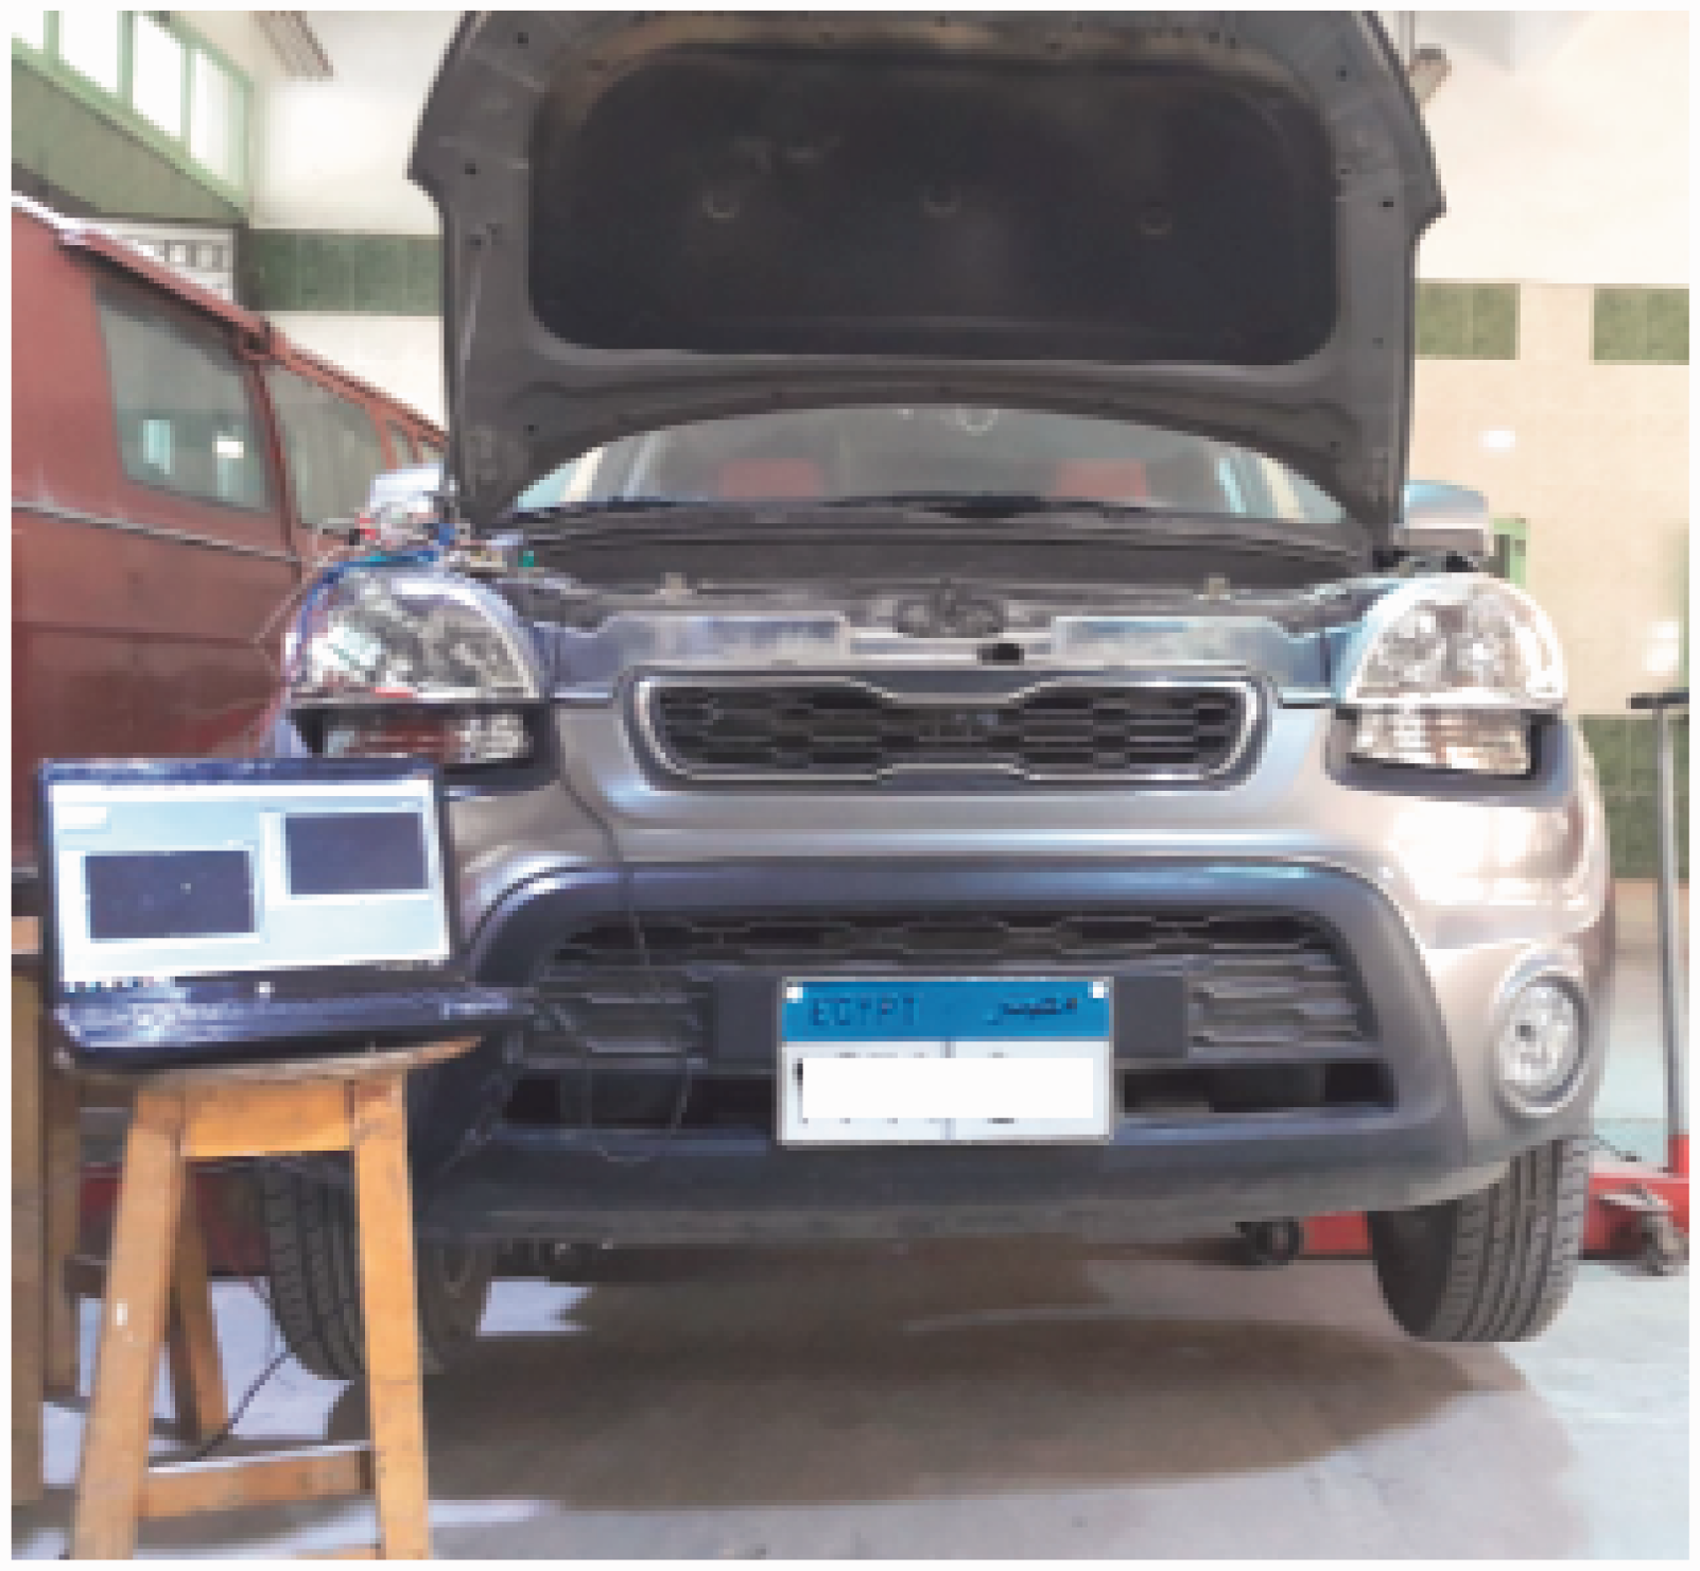
Error analysis
Errors and uncertainties in the experiments may result from instrument selection, condition, calibration, environment, observation, reading, and test planning. Uncertainty analysis is needed to prove the accuracy of the experiments. An uncertainty analysis was performed using the method described by Holman. 15 Percentage uncertainties of various parameters like vehicle speed, vibration acceleration, SPL, and the engine revolution per min were calculated using the percentage uncertainties of various instruments. Total percentage uncertainty of these experiments for the whole experiment is obtained to be ±3.5%.
The virtual mass transfer function was measured by exciting the mount location on body side and measuring the accelerations in vertical direction only. The force on the engine mount location on the body was applied by an impact hammer. Simultaneously, the acceleration on the body near by the engine mount location was measured by an accelerometer. The force and the acceleration were transferred to frequency domain by an FFT analyzer. The frequency band was selected to be 800 Hz as the interior noise was important.
Results and discussion
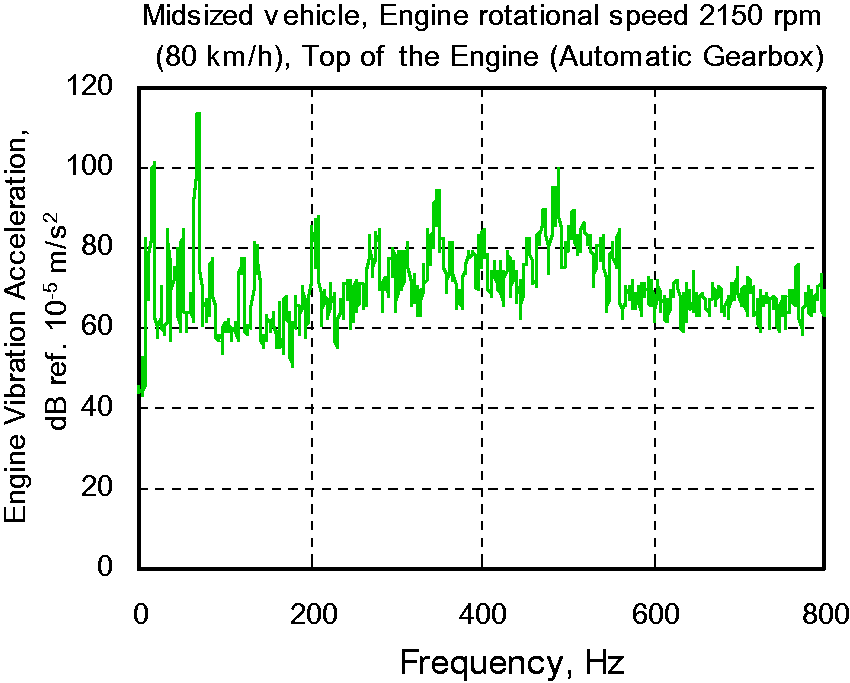
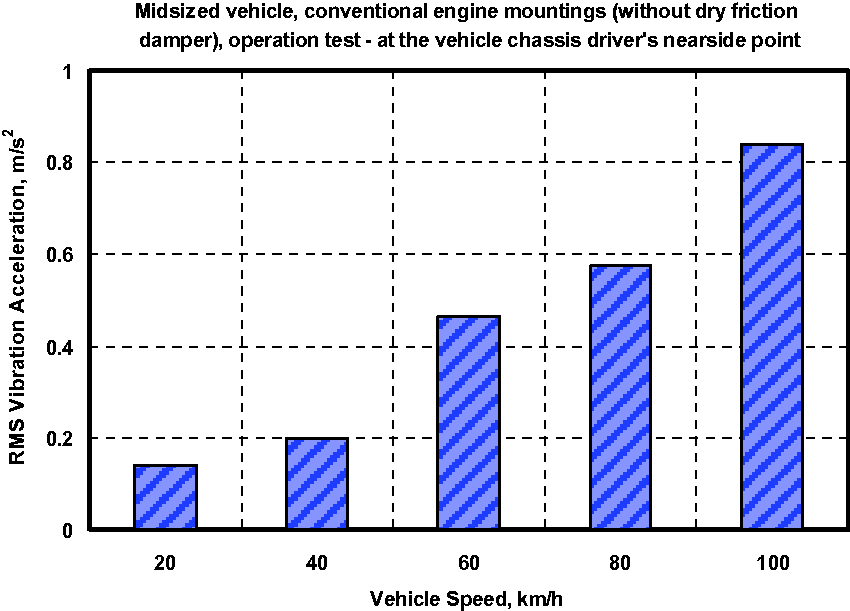
TPA is used to evaluate the contribution of different energy propagation paths between a source and a receiver, linked to each other by a number of connections. TPA is typically used to quantify and rank the relative importance of these paths in a given frequency band. Since the structure-borne noise is composed of multiple paths, the TPA test of the vehicle was carried out, and the transfer function and operational data at speed range started from 20 to 100 km/h were obtained. The test data were processed and an acoustic contribution analysis of the target was performed when the vehicle is lifted up from the ground to release the contact between the tires and the ground. This was done to eliminate the influence of tire-road interaction. Therefore, the main source (engine) of vibration excitation to the target points in run up test are the three engine mounts (see Figure 7), considering one main transfer direction (vertical) for each engine mount. Therefore, subscript j in H1,j(ƒ) which defined in equation (2) is equal to 1. The accelerations on engine side (top of the engine) are mainly caused by the powertrain. The vehicle was then taken under a run up test from 1250 r/min (20 km/h) to 6250 r/min (100 km/h). The initial inspection of the signals shows that the vehicle engine nearside mount represents the main contribution path. Then the match principle of using parallel variable dry friction damper to the powertrain isolation system was proposed. On the basis of the TPA results and the above principle, the friction damper on the body side of the nearside mount can improve the vehicle interior noise by combination of the experimental TPA and the final measurements. The results indicate that a significant reduction for the A-weighted SPL of the interior noise has been gained when the frictional damper was added to conventional mount. Figure 8 shows the frequency-domain vibration acceleration of nearside beam mount in vertical direction at vehicle speed of 80 km/h (2150 r/min), while Figure 9 shows the RMS values for all the considered speeds range. Figures 10 and 11 show the frequency-domain vibration acceleration and RMS values, respectively, measured on the vehicle nearside beam at body side point. The ratio of the acceleration on engine mount body side to acceleration of the engine mount at vehicle engine side is H1,j(ƒ) defined in equation (2) and called as the mount transmissibility function in frequency domain (f).
Frequency domain of the vibration acceleration measured at the top of the vehicle engine (source). RMS of the vibration acceleration measured at the top of the vehicle engine (source). RMS: root mean square. Frequency-domain of the vibration acceleration measured at the vehicle nearside beam, body side. RMS of the vibration acceleration measured at the vehicle nearside beam, body side.
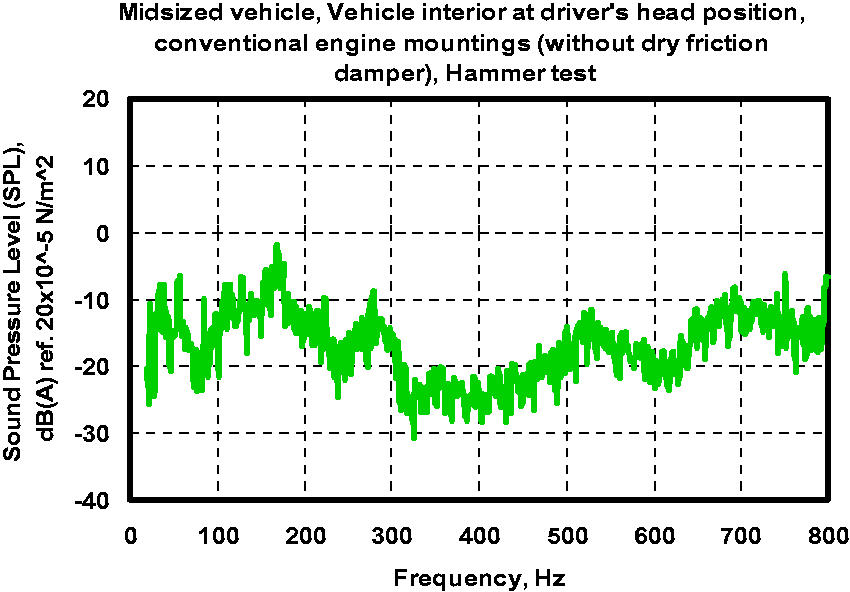
In Figures 12 and 13, the frequency domain of the vibration acceleration measured at the vehicle nearside beam at body side and frequency domain of the interior SPL measured at the driver’s head position (target point) during the hammer are shown, respectively. The ratio of the force in the hammer test to the acceleration of the body near the engine mount is called the virtual mass of the body H2,j(ƒ), which is defined in equation (3) is calculated, while H3,j(ƒ) is the body transfer function in SPL transfer from engine mount location to the vehicle interior target point, equation (4).
Frequency domain of the vibration acceleration measured at the vehicle nearside beam—hammer test. Frequency domain of the SPL measured at the driver’s head position—hammer test (target point). SPL: sound pressure level.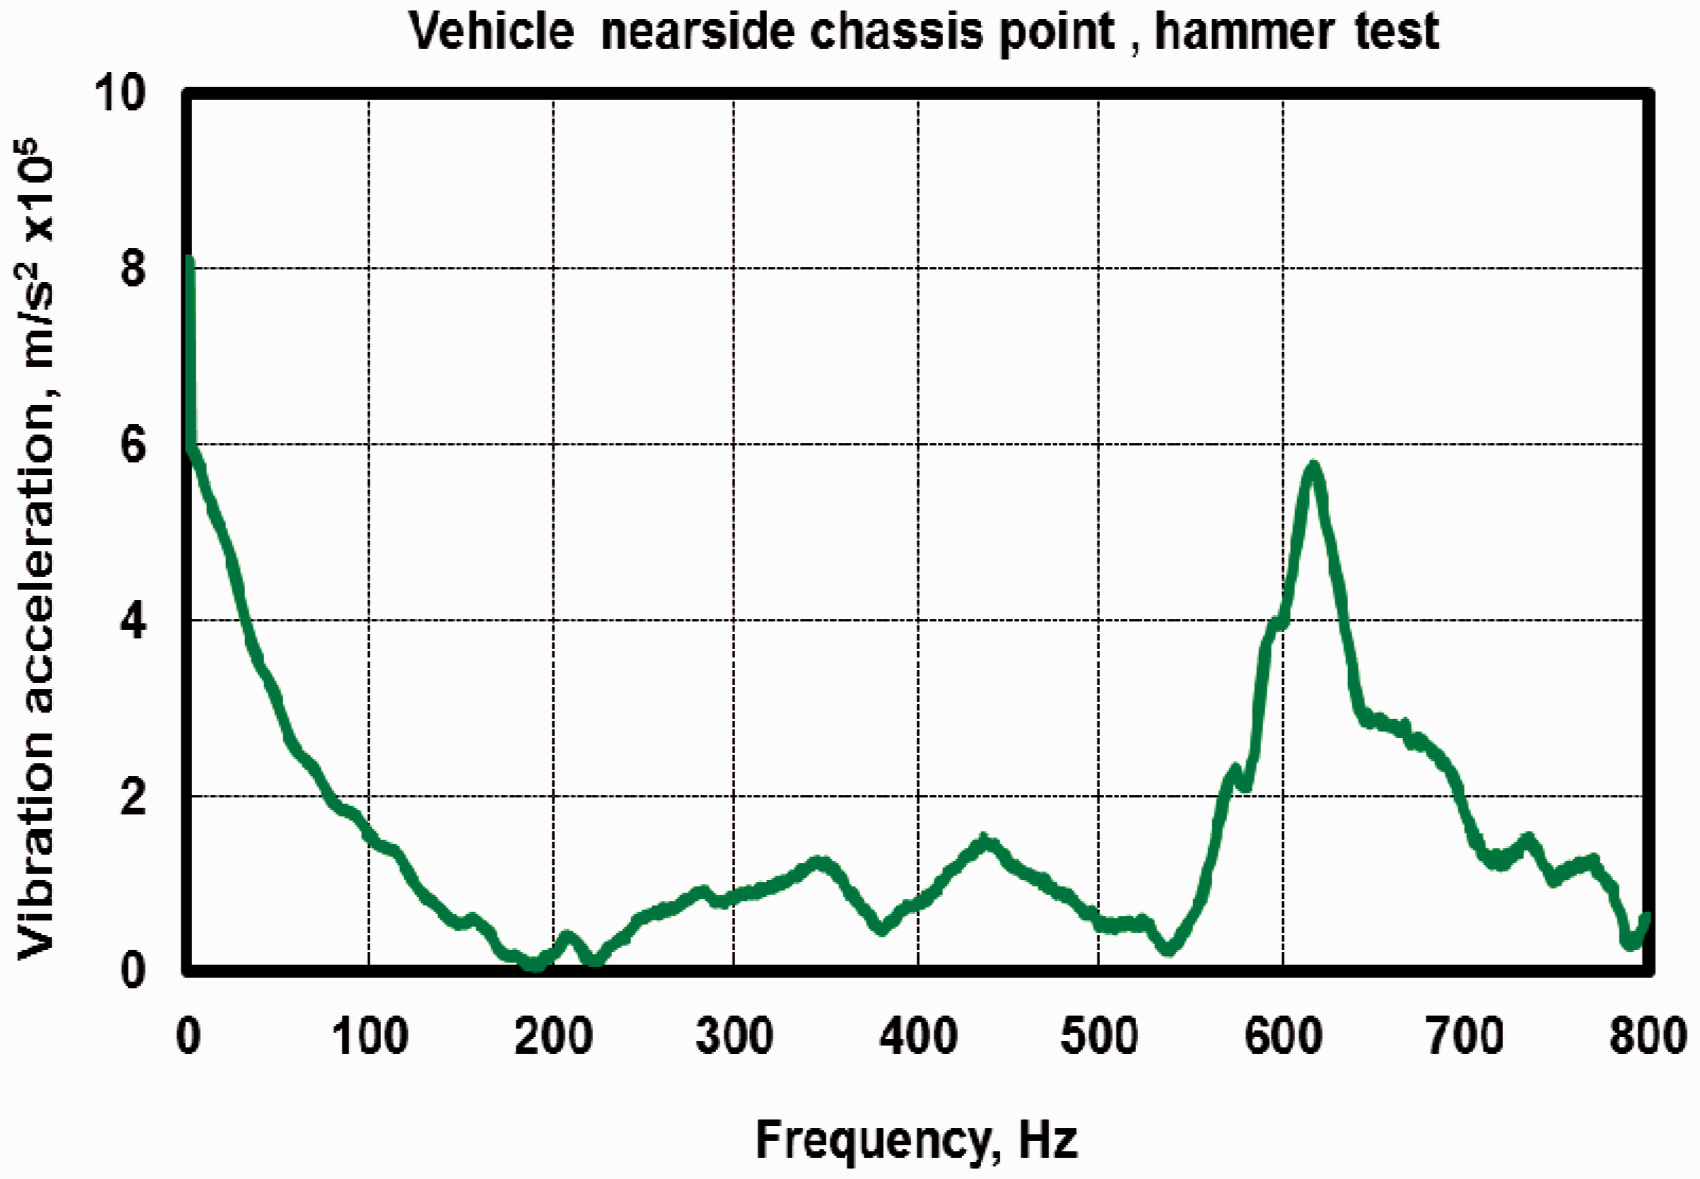
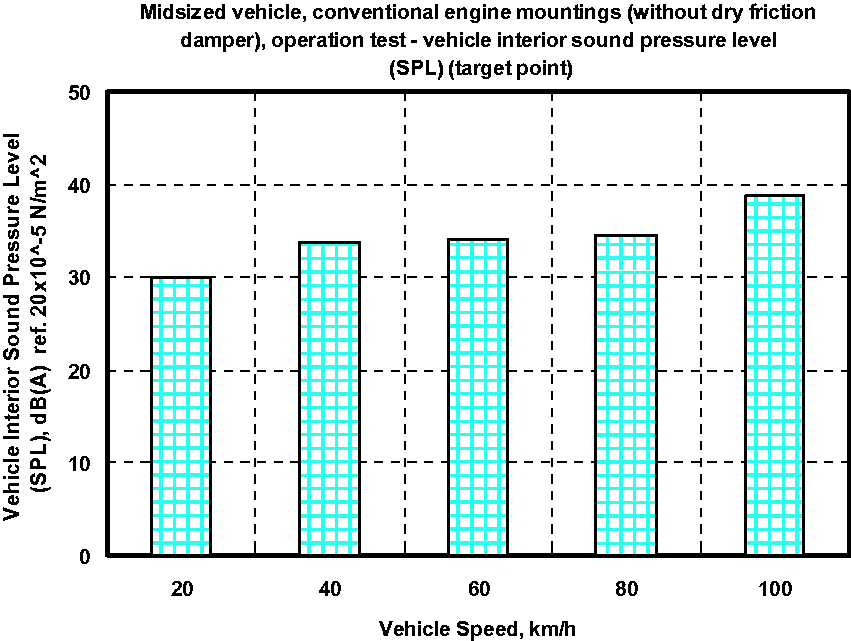
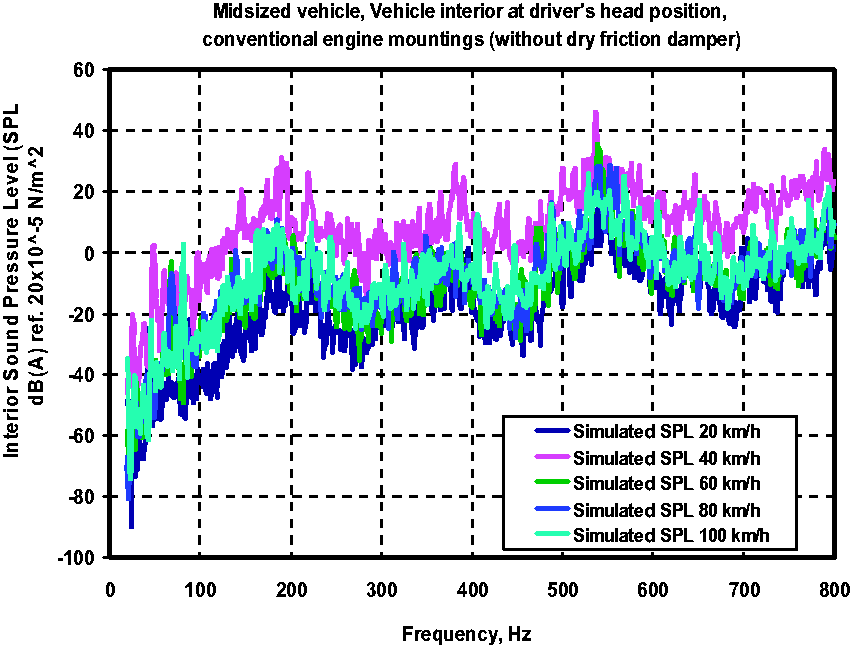
In Figures 14 and 15, a sample of the measured frequency-domain (from 20 Hz to 800 Hz) SPL at the driver’s head position from all the conventional engine mounts paths without dampers during the operating test (target point) at vehicle speed of 80 km/h (1250 r/min) and the corresponding RMS of the SPL measured at all the vehicle speeds from 20 to 100 km/h, respectively. Having the required data, the share of nearside mount path at each frequency can be calculated based on equation (5). It can be clearly seen that the overall vibration transmission acts like a low pass filter diminishing the vibration power at higher frequencies. By multiplying the overall transfer function to engine vibration spectrum at each engine r/min, the vibrations at target point will be derived.
Frequency domain of the SPL measured at the driver’s head position—without damper-operating test (target point). SPL: sound pressure level. RMS of the SPL measured at the driver’s head position—without damper-operating test (target point). SPL: sound pressure level.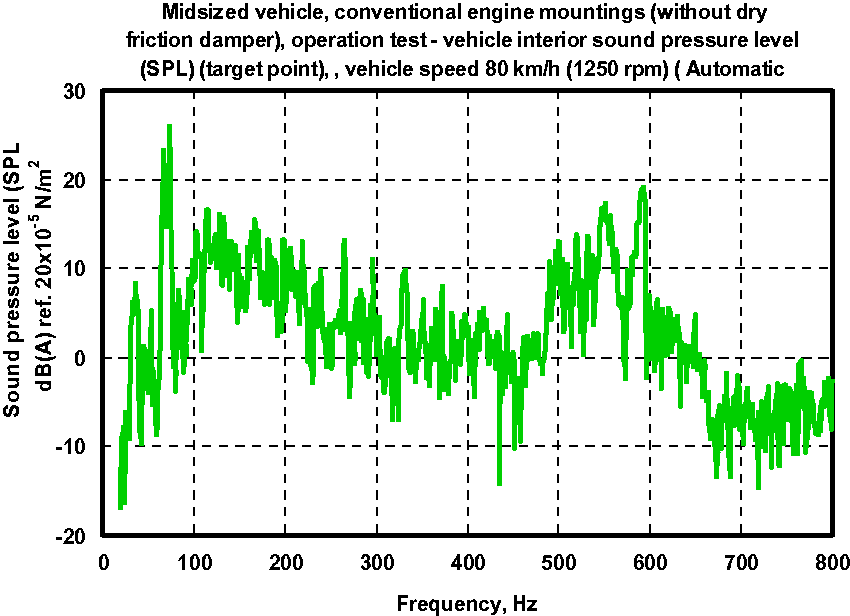
The SPL which was simulated by VINS at target point (driver’s head position) during engine operating test for vehicle speed of 80 km/h (1250 r/min) where it is drawn against the measured one and is shown in Figure 16 and the corresponding curves of the SPL simulated at all the vehicle speeds from 20 to 100 km/h are shown in Figure 17. This result can be used as a verification tool of the method. As it can be seen, there is a good correlation between the VINS results and the measured SPL (see Figure 16). Although despite of a general correlation exists between VINS results and measurements, there are some discrepancies between these two curves especially at three frequency ranges of 190–200, 330–400, and 480–800 Hz. Discrepancies like these come from the assumption of linear body transfer function that has been adopted in this method. In the next part of this article, the vehicle nearside beam engine mounting system has been modified related to this baseline condition by adding the friction damper on the vehicle engine nearside beam mount.
Frequency domain of the SPL simulated at the driver’s head position—without damper-operating test (target point). SPL: sound pressure level. Frequency domain of the SPL simulated at the driver’s head position—without damper-operating test (target point). SPL: sound pressure level.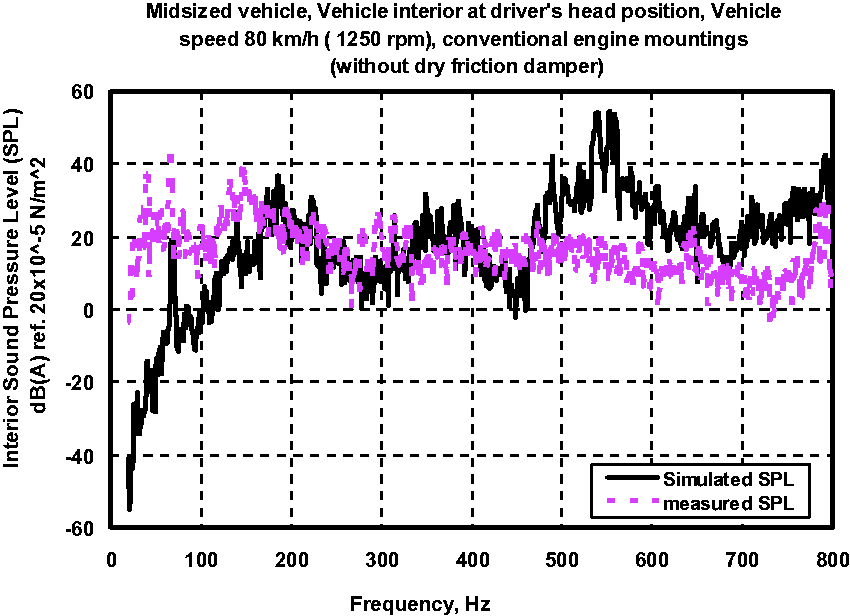
The local damping comparisons of different mounts show that the damping of the vehicle engine nearside mount is significantly lower than the others. This can be explained by the behavior of the stoppers on this engine mount. The stoppers come to action when the mount is compressed more than a certain value. This causes a drastic growth in overall mount stiffness. As a first modification, a friction damper is added on the vehicle engine nearside beam mount. The operational SPL were again measured and are shown in Figures 18 and 19.
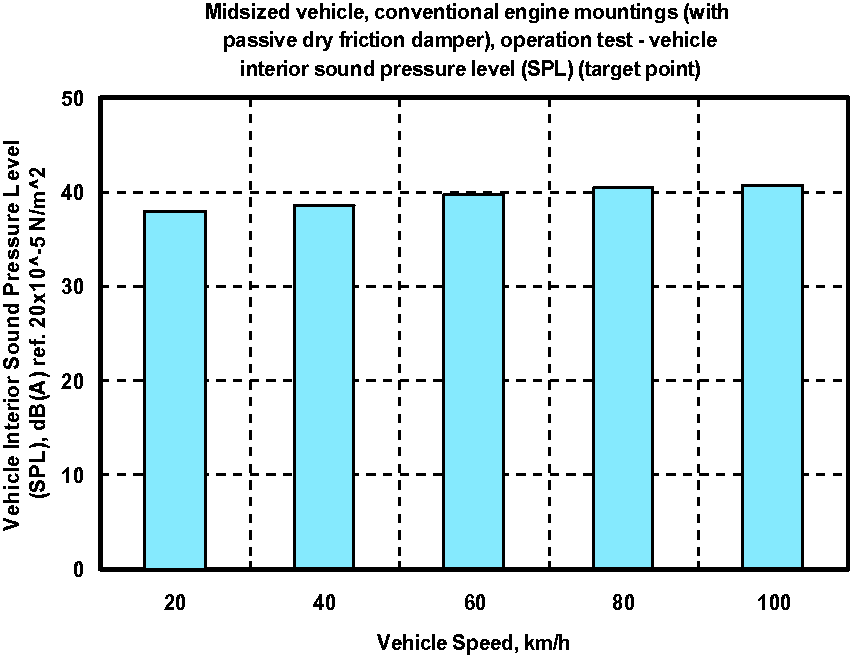
Frequency domain of the SPL measured at the driver’s head position—with damper-operating test (target point). SPL: sound pressure level. RMS of the SPL measured at the driver’s head position—with damper-operating test (target point). SPL: sound pressure level.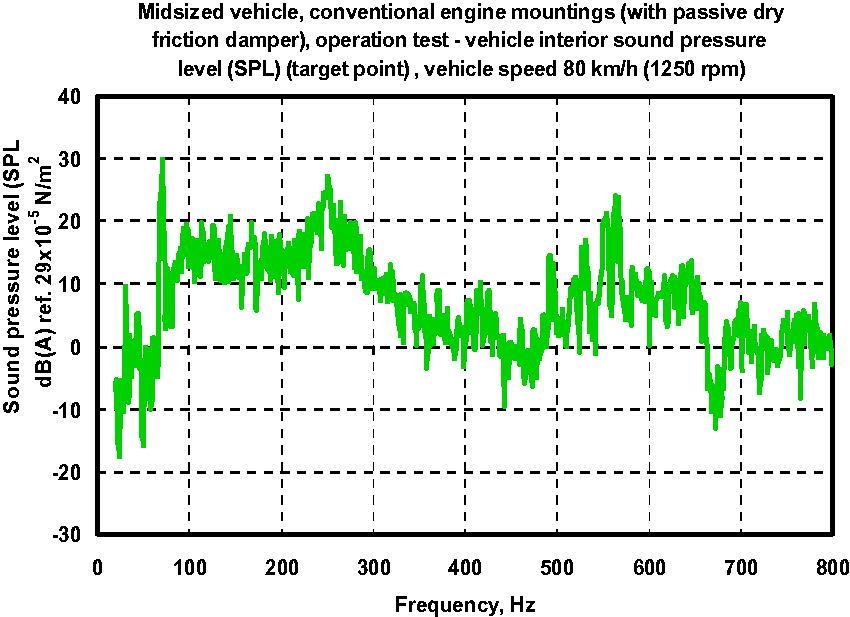
The SPL which was again simulated by VINS at target point (driver’s head position) during engine operating test for vehicle speed of 80 km/h (1250 r/min), where it is drawn against the measured one and is shown in Figure 20 and the corresponding curves of the SPL simulated at all the vehicle speeds from 20 (1250 r/min) to 100 km/h (6250 r/min) are shown in Figure 21. A general correlation exists between VINS results and measurements. As it can be seen, the discrepancies at frequency ranges of 190–200 Hz and 480–800 Hz have been reduced.
Frequency domain of the SPL simulated at the driver’s head position—with damper-operating test (target point). SPL: sound pressure level. Frequency domain of the SPL simulated at the driver’s head position—with damper-operating test (target point). SPL: sound pressure level.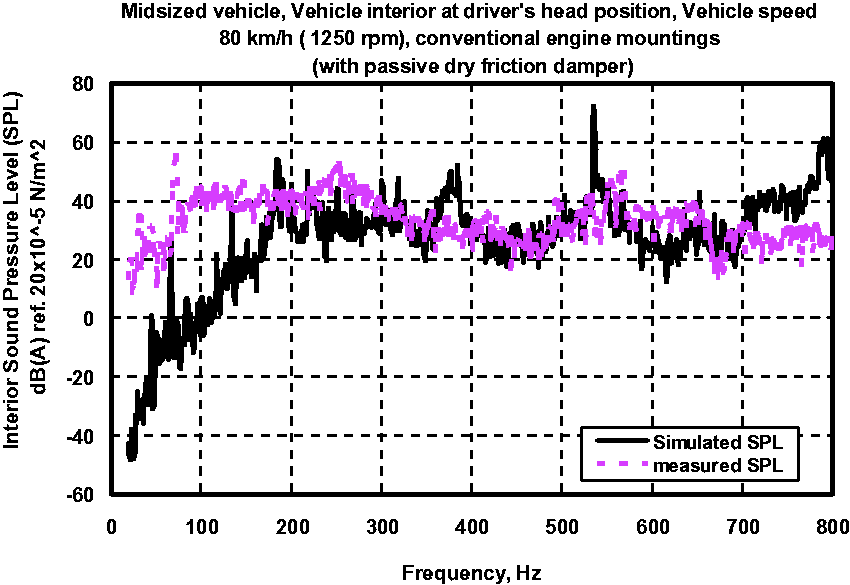
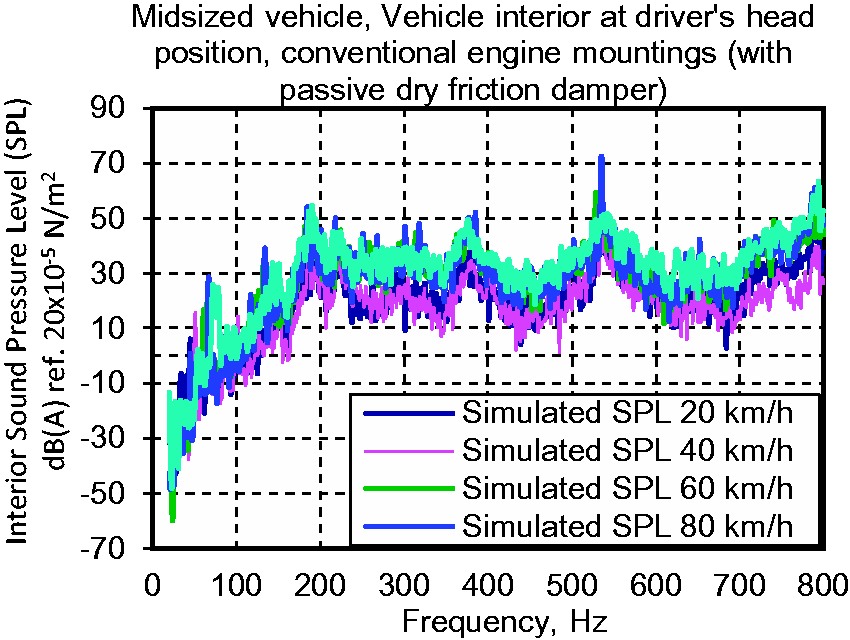
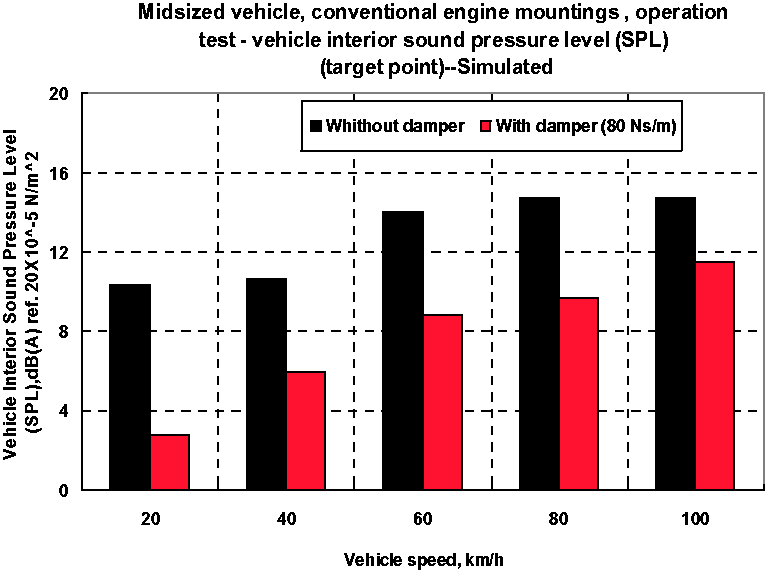
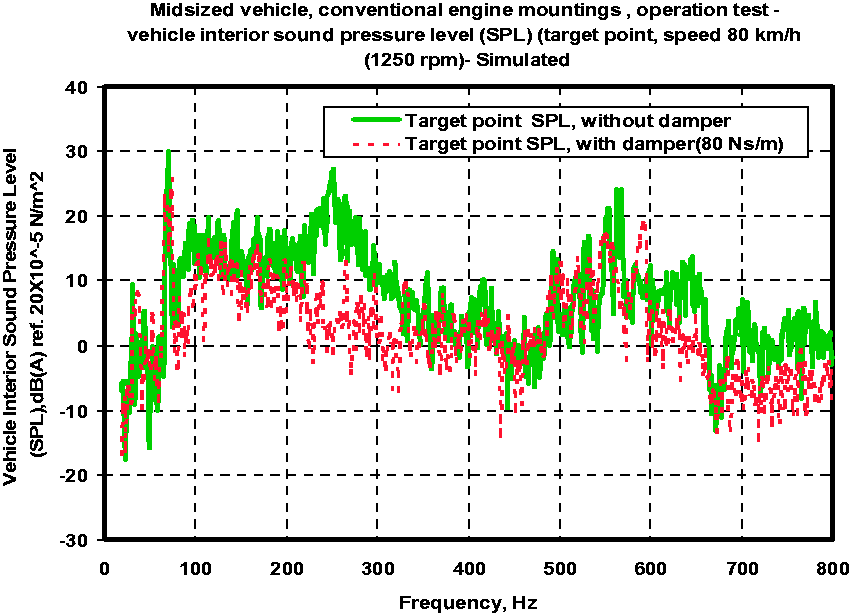
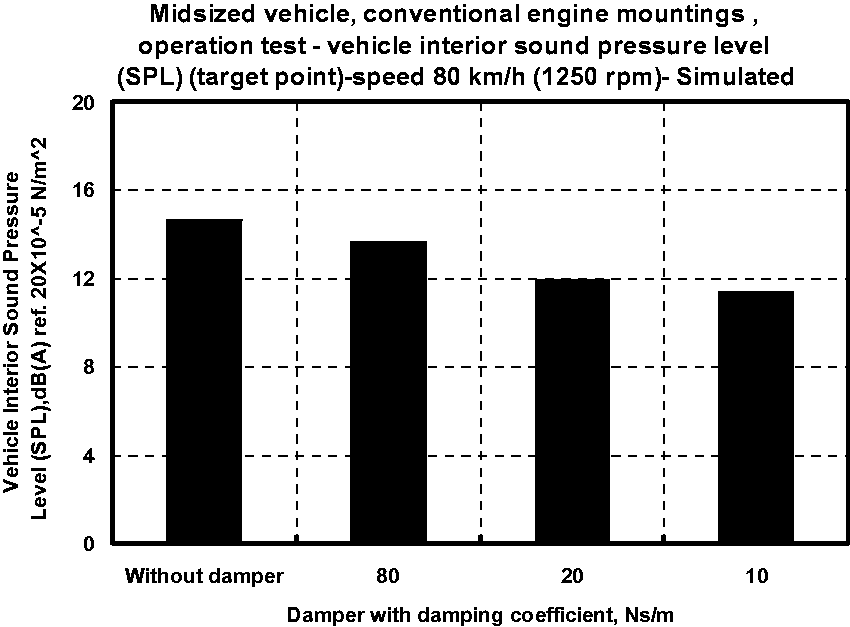
Figure 22 shows the SPL which was simulated by VINS when the vehicle engine nearside mount with and without damper (different damping coefficient from 10, 20, and 80 Ns/m) at target point (driver’s head position) during engine operating test for vehicle speed of 80 km/h (1250 r/min). It is observed that the simulated SPL is correlated with the frictional damper, where the reduction in the damping value, the increase of simulated SPL in the frequency range considered. In Figures 23 and 24, a comparison between the RMS values of the SPL simulated for all the considered speeds range at the target point and frequency domain at speed of 80 km/h, respectively, when the engine mount uses the frictional damper with 80 Ns/m and without damper. It is clearly seen that the simulated SPL at the target point (driver’s head position) during engine operating test using the friction damper is lower than that without damper. Figure 25 shows the vehicle interior RMS SPL simulated at target point (driver’s head position) during engine operating (without damper) compared with those simulated with damper at different damping coefficients ranged from 10 to 80 Ns/m. It can be seen that the simulated SPL without damper is higher than that for with damper. Moreover, as the value of damper damping coefficient is decreased, the simulated SPL without damper is increased.
Frequency domain of the SPL simulated at the driver’s head position operating test (target point). SPL: sound pressure level. RMS of the SPL measured at the driver’s head position operating test (target point) with damper (80 NS/m). SPL: sound pressure level. Frequency domain of the SPL simulated at the driver’s head position—with passive dry friction damper (C = 80 Ns/m). SPL: sound pressure level. RMS of the SPL measured at the driver’s head position operating test (target point). SPL: sound pressure level.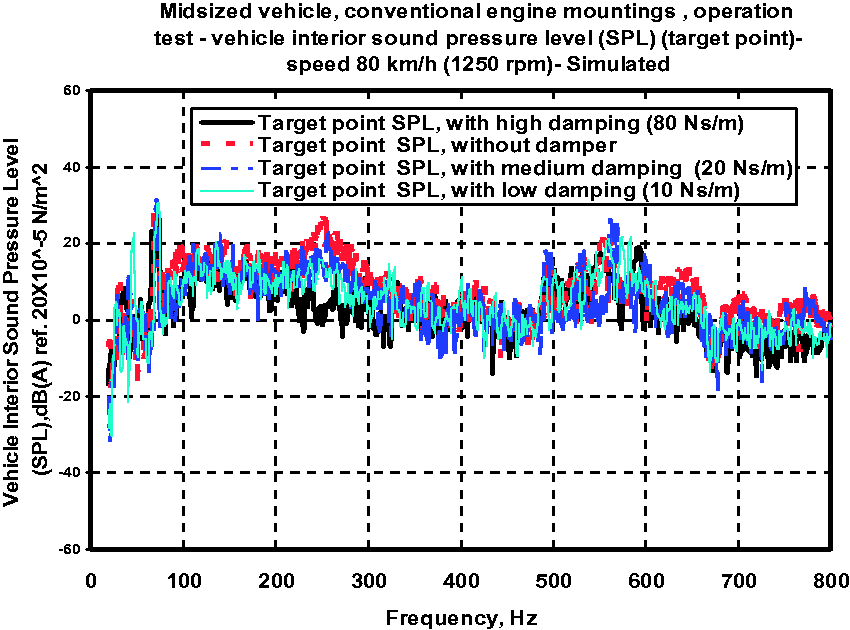
Experimental validation
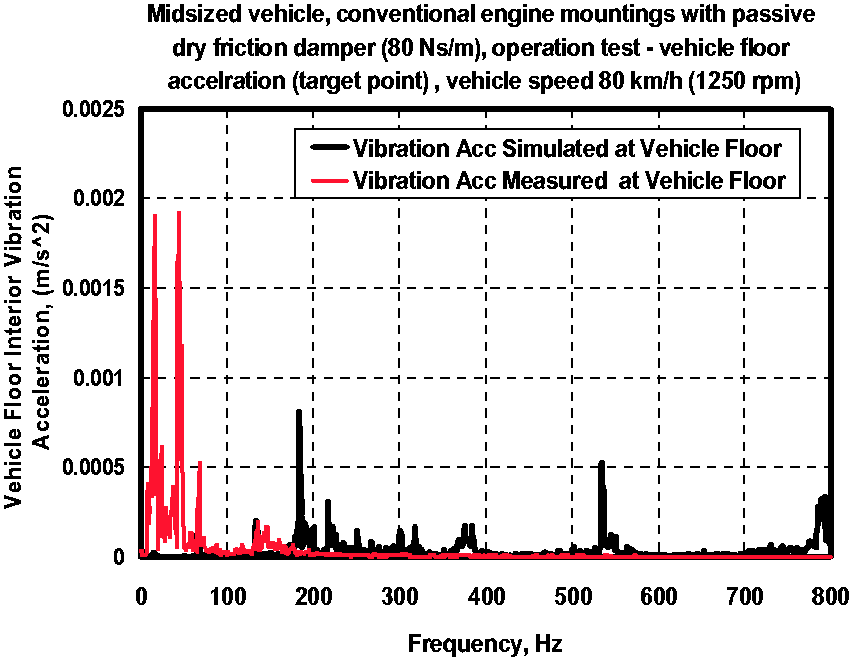
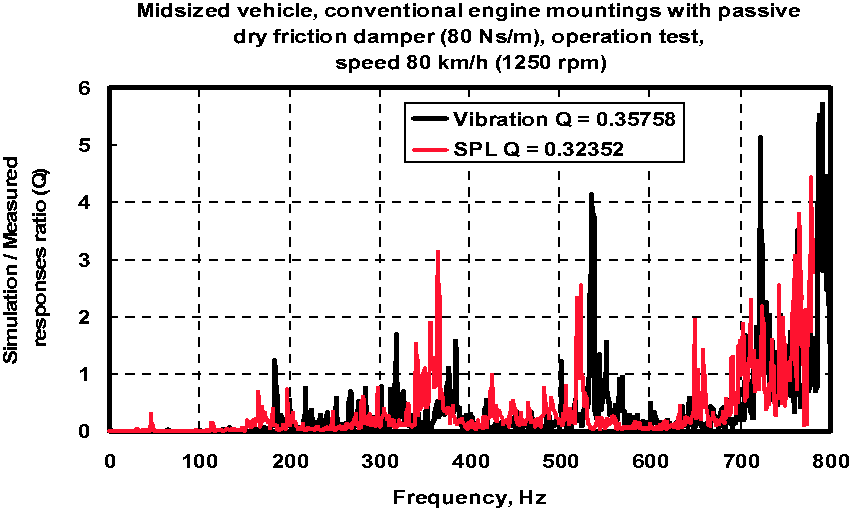
Figures 26 to 28 depict validated experimental results, where the ratio between the vehicle interior SPL simulated/SPL measured at the driver’s head position, where this ratio is donated here as (Q) and it is shown in Figure 26. The same ratio is calculated for the vehicle interior floor vibration acceleration simulated/measured based on equation (1) after it was modified according to the equation (6)
16
presented in Appendix 1 and is shown in Figure 27. Figure 28 shows the values of Q for SPL, which has an average value of 0.32352, while that for the floor vibration acceleration is 0.35758. The two values are too close, which indicates that the VINS technique is valid to be use for such study.
Frequency domain of at vehicle driver’s head position (target point)—with passive dry friction damper (C = 80 Ns/m). Frequency domain of vehicle floor vibration (target point)—with passive dry friction damper (C = 80 Ns/m). Ratio (Q) calculated at vehicle driver’s head position and interior floor—(target point with passive dry friction damper (C = 80 Ns/m).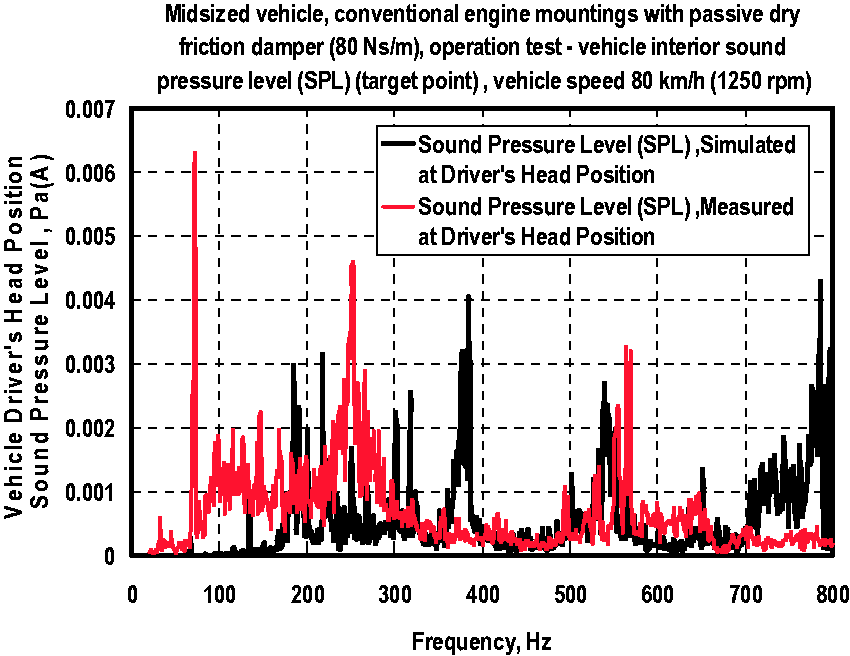
Conclusions
Additionally, the measurement setup for the determination of the structure-borne noise transfer path from the vehicle engine vibration into the driver cabin is shown. The structure-borne noise described by the transfer function from the vehicle engine vibration with respect to the sound pressure in the driver cabin shows position dependent variations. Further investigations should focus on the systematic evaluation of the influences on estimating and averaging structure-borne noise transfer functions, as well as the position dependent variations.
A tool for VINS has been introduced in detail. The effectiveness of the method on NVH of the vehicle interior and engine mount system modification has been shown compared to the classical TPA methods, the proposed method shows to be stronger and more accurate, while calculation speed and execution simplicity have also been improved. By this VINS method, a complete study can be performed on the responsible NVH transfer functions from engine mount locations to target points. This can help an NVH specialist to investigate the paths in more details and focus on the critical paths.
According to the significant lowering of the damping of the vehicle engine nearside mount than the others, the vehicle nearside beam engine mounting system has been modified related to this baseline condition by adding the friction damper on the vehicle engine nearside beam mount. However, a significant improvement for the A-weighted SPL of the interior noise has been gained when the frictional damper was added to conventional mount.
Future work is aimed at advancing the interior noise and vibration simulation towards the creation of a virtual NVH engine and/or vehicle. With such a tool, weak points of the powertrain, the mounts and the vehicle body could be detected and optimized at an even earlier stage of the development process. The experience gained with the development and usage of the VINS methodology could also be applied to simulate the vehicle’s exterior noise. Such a tool, in conjunction with the VINS methodology, could efficiently guide the vehicle development process to meet both interior and exterior noise and sound quality requirements
Footnotes
Declaration of conflicting interests
The author(s) declared no potential conflicts of interest with respect to the research, authorship, and/or publication of this article.
Funding
The author(s) received no financial support for the research, authorship, and/or publication of this article.