
Abstract
The protection of patient information in modern healthcare demands overcoming major challenges intensified by the integration of Internet of Things (IoT) technologies. The proposed Random Coupled Bootstrapped Ensemble Classifier (RCBEC) offers an advanced intrusion detection framework to enhance cyberattack detection in smart healthcare environments. The model optimizes both accuracy and feature selection to improve computational efficiency and precision. Data preprocessing employs Decimal Score Max Normalization for transformation, duplicate removal, and handling of missing values. Feature extraction through K-Best Kernel Discriminant Analysis (K-BKDA) and optimization via Hunter Canis Algorithm (HCA) ensure effective identification of attack-relevant features. Implemented in a Python-based ECU-IoHT environment, the RCBEC achieves 99.6% accuracy and F1-score, outperforming existing intrusion detection methods. The ensemble classifier combines rapid computational performance with robust threat identification capabilities, enhancing security in IoT-enabled healthcare systems. Comparative analysis demonstrates the system’s superior generalization and adaptability across diverse datasets. Overall, the proposed RCBEC model establishes a resilient and intelligent mechanism for detecting and mitigating cybersecurity threats in healthcare networks. This work highlights how machine learning-driven intrusion detection significantly strengthens patient data protection, operational reliability, and trust in next-generation healthcare systems.
Keywords
I. Introduction
The Internet of Things (IoT) has made dramatic advancements in recent years, making it feasible to develop healthcare monitoring systems that use low-power and inexpensive sensors. Over the last several years, these sensors have seen widespread use to permit remote monitoring of patients. This has resulted in a reduction in the need for clinicians to be physically present on-site. A wide variety of medical applications, including early diagnosis, real-time monitoring, and medical crises, may be effectively supported by recent developments in the Internet of Things (IoT) and wireless communications. It is possible to lessen the reliance on carers and cut down on medical treatment expenses by using safe and practical methods to identify life-threatening emergencies in real time. Early therapies that result in favourable health outcomes and potentially save lives in the community may be made possible by adopting innovative decision-making processes. To accomplish such objectives, it is necessary to continuously monitor the vital signs of the community members, which may be accomplished via wearable sensors. Medical care providers will subsequently be able to provide inhabitants of these smart communities with effective remote healthcare communication services for monitoring and diagnosis. The presence of any security risk to these systems can result in a significant issue, such as the imposition of an incorrect diagnosis or the postponement of the contact. Under these circumstances, patients’ right to privacy is violated, they have health problems, and in the most severe situations, they even pass away. 1 In addition to having strong linkages to mathematical optimization, machine learning (ML) is intimately connected to computational statistics, which often overlaps, and it also has significant interactions with ML. A hybrid network analysis that incorporates both abuse identification and anomaly detection has been made possible thanks to the introduction of machine learning (ML) to cybersecurity applications over the last decade. Anomaly detection is used to identify any aberrant behaviour inside the network, while misuse detection is utilized to identify known assaults using their signatures. This is the most promising method for dealing with assaults that have not been observed before, often known as zero-day attacks. 2 Machine learning may be utilized to manage security vulnerabilities in healthcare systems. Monitoring data tampering or detecting changes in the network’s traffic characteristics are two ways it might discover attacks. Examples of assaults that include the modification of packets in real time include Man-in-the-Middle attacks (MITM) against the System. 3 Even though machine learning may not be appropriate for problems that call for a formal descriptive solution, it can produce reliable outcomes in challenges and domains that humans find challenging to formalize. Because of this, machine learning is particularly effective in data clustering and classification, both fundamental building blocks in data security applications. The majority of models for internet security are based on the idea of creating a list of requests that are hazardous or malicious to prohibit them. As a result of the fact that attackers are always using inventiveness to improve and alter their methods, it is hard to anticipate that their malicious requests will fall into the blocklist. If a little adjustment is made, an attacker can avoid detection. 4 This negative paradigm, which involves repeatedly changing the ruleset and defining all requests that may be detrimental, is not only unrealistic but also exceedingly resource-intensive. At this stage, machine learning has the potential to play a big part in learning excellent requests; thus, it may be used to create a model of them in such a way that requests that do not correlate with them are likely to be attacked. 5 With the help of a wide range of healthcare sensors, we have developed a testbed for the Ensemble cyber threat detection system. This testbed makes use of machine learning capabilities to address security concerns. An Intrusion Detection System computer monitors network traffic and identifies anomalous behaviours; a gateway for data collection, an attacker to simulate a genuine attack, a danger to the System, and a server are all components of the System. The endpoint of the System is the server, which is responsible for storing records about medical treatment and making them accessible to the clinic. Using machine learning models allows for detecting risks such as data tampering and spoofing. The integration of Internet of Things (IoT) technologies into healthcare has enabled efficient remote monitoring and intelligent patient care. However, the growing interconnectivity of medical devices and cloud-based services has also exposed healthcare networks to complex cyber threats, including Denial-of-Service (DoS), ARP spoofing, and probing attacks. These threats can compromise patient privacy, data integrity, and even patient safety, emphasising the urgent need for intelligent intrusion detection mechanisms. To do this, a thorough examination of the patient’s biometric data and the peculiarities of network traffic is required. This approach will send a threat warning to the system management if any traffic metric or biometric data is abnormal. In the body of research that has been done, several machine-learning techniques have been examined to see whether or not they are suitable for security approaches. Several healthcare companies use machine learning to construct a randomly linked bootstrapped ensemble classifier model; the work presented here goes thoroughly into the operation of this method. Helbing et al. (2015) argue that many societal risks such as disasters, crime, terrorism, wars, and epidemics arise from complex, non-linear dynamics that cannot be addressed effectively through traditional deterrence or control strategies. 6 They highlight the role of complexity science and real-time information systems in modelling crowd behaviour, detecting early warning signals, and designing proactive, life-saving interventions. Complementing this perspective, Podobnik et al. (2015) explore the resilience of competing and interdependent networks under targeted attacks, introducing a game-theoretic framework to quantify the “cost of attack.” Their findings show that while competition can intensify vulnerabilities, cooperative strategies can reduce systemic risks. 7 Together, these studies underscore the significance of complexity theory and network science in strengthening cybersecurity and healthcare security systems by enabling predictive, preventive, and adaptive responses to emerging threats. 8 Traditional machine learning and deep learning–based intrusion detection systems (IDS) often face limitations such as high false alarm rates, overfitting, and weak adaptability 9 across diverse IoT environments.
This research addresses these challenges through the following research question:
How can an ensemble-based model be designed to enhance intrusion detection accuracy and adaptability across heterogeneous healthcare IoT datasets?
We propose a Random Coupled Bootstrapped Ensemble Classifier (RCBEC), integrated with K-Best Kernel Discriminant Analysis (K-BKDA) for feature extraction and Hunter Canis Optimization (HCA) for optimal feature selection. The key contributions include: (1) A hybrid feature optimization framework combining K-BKDA and HCA; (2) The design of an adaptive ensemble model (RCBEC) with random coupling and weighted voting (3) Comprehensive validation across multiple benchmark datasets showing superior accuracy and generalization.
Beyond state-of-the-art, the proposed system enhances detection precision and resilience by dynamically coupling base learners based on internal validation accuracy—offering improved adaptability, robustness, and real-time applicability in healthcare IoT security. The remaining parts of the paper may be structured as follows: Section 2 analyzes the existing methodology. Section 3 depicts the proposed framework. Sections 4 and 5 present the experimental methodology and the results.
II. Related work
Earlier studies on intrusion detection systems and machine learning have been briefly summarised below, emphasizing their benefits and drawbacks. The study paper’s primary emphasis is on an ensemble-based machine learning technique, which provides the necessary background. Various machine learning-based model techniques have been developed by researchers at multiple points in time. We reviewed pretty recent models, outlining their advantages and disadvantages, so that you may understand the relevance of our ensemble-based strategy to identify intrusion and guarantee network security. Sarker (2022) highlighted the role of machine learning in automating intelligent threat detection and predictive cybersecurity analytics. 10 Jelen (2020) classified intrusion detection systems into NIDS, HIDS, and signature or anomaly-based methods, noting challenges such as false positives. 11 Network Security Concepts (2023) emphasized the CIA triad and layered defenses to protect networks from malware and DDoS attacks. 12 Jeong et al. (2023) demonstrated that multi-resolution analysis improves IDS accuracy by effectively visualizing network traffic patterns. 13
Hachmi et al. (2019) applied multiobjective optimization using genetic algorithms to reduce false positives and negatives in IDS.
14
The average accuracy rate of the KDDCup’99 model is 89%, and it has a 99% accuracy rate. While testing their model on NSL-KDD, another public dataset, they found identification accuracy of
In the current networking environment, the model’s accuracy,
To put this concept to the test, we employ two datasets. Results showed an accuracy of
Remember that the suggested method has only been tried on two widely used IDS datasets; it may not work well with other datasets. Also, much processing power could be required to run the recommended method’s deep learning models and the double PSO-based approach. Turaiki et al.
25
established Anomaly-Based Network Intrusion Detection using the CNN approach and conducted experiments on the NSL-KDD dataset. The model has a very low actual positive rate
Al-Daweri et al.
28
offer a fresh dataset and an adaptive technique for the IDS in 2021. Using the UKM-IDS20 dataset, the accuracy is
Tabbaa and Ifzarne created an online ensemble learning model in 2022 that identified assaults in wireless sensor networks with a success rate
An intrusion detection system that relies on a one-class support vector machine and a Gaussian mixture model was suggested by Wang et al.
35
in 2023. Training two semi-supervised detectors, the one-class support vector machine (OCSVM) and the Gaussian mixture model (GMM), on the produced features after autoencoder (AE) extraction of representative features from standard data is the current research’s methodology. They achieved impressive
Analysis of existing deep learning methodologies for IoT security.

The author presents a deep-autoencoder-based intrusion detection system (IDS) in Ref. 48 to identify hostile acts from IIoT-driven IICS networks in real-time. LSTM auto-encoder design is the foundation for the proposed model, which is intended to recognise intrusive events inside IICS networks. The experimental results of the proposed intrusion detection system (IDS) on two benchmark datasets, namely the gas pipeline dataset and the UNSW-NB-15 dataset, demonstrate the proposed model’s superiority compared to other compelling models. The proposed model achieved an accuracy rate of
The current intrusion detection model makes it abundantly evident that not all intrusion detection approaches are compatible with deep learning models dependent on a single classifier and the current feature selection strategy. As a result of the fact that not all datasets or newly structured invasions are receptive to all models, some models produce answers that are much superior to others. Therefore, developing an intrusion detection model capable of managing known and unknown intrusions and providing support for any datasets available to the general public is essential. Several novel approaches to choosing characteristics were shown in the recommended technique. Once that is complete, the model is constructed with the help of the ensemble classifier. In the ensemble-based machine learning technique, the stability and accuracy of the models are improved by the combination of random forests. The random forest approach can detect a greater variety of incursions with more reliability. This is because it has a reduced risk of false positives and negatives. A random forest ensemble-based machine learning approach is used for intrusion detection using the technique that has been provided. This technique has the potential to offer a solution that is both more comprehensive and more efficient in terms of ensuring network security against any form of attack or intrusion.
Recent advances in intrusion detection and health-IoT security have been driven not only by powerful deep learners (CNN, LSTM, autoencoders, etc.) but increasingly by hybrid approaches that combine metaheuristic optimization with machine-learning models to improve feature selection, hyperparameter tuning and robustness. Metaheuristics such as Particle Swarm Optimization (PSO), Genetic Algorithms (GA), Grey-Wolf/Hunter-Canis and modified evolutionary strategies have been used to optimise model architectures and select discriminative features, reducing false alarms and training cost when paired with classifiers or deep networks. A promising prospective line of research — directly relevant to both healthcare sensing and IoT security — is the coupling of metaheuristics with sequence and representation learners: for example, Deep LSTM models whose hyperparameters or structure are optimized by a modified metaheuristic algorithm (recent work in biomedical signal classification, e.g., Parkinson’s detection, demonstrates clear gains in sensitivity and robustness when model search is guided by optimization algorithms). Similarly, CNN-enhanced frameworks combined with explainable AI (XAI) methods have been proposed for IoT/metaverse security to both detect attacks and provide human-interpretable reasons for alarms, which is essential for clinical or safety-critical deployments. These hybrid families (metaheuristic + ML, CNN + XAI, federated + metaheuristic tuning) differ from single-classifier or off-the-shelf deep models in that they explicitly address (a) feature-space search, (b) model generalization across datasets, and (c) resource-constrained deployment. The current study’s ensemble approach is well placed within this ecosystem, but the literature review and comparative analysis would benefit from explicitly surveying and benchmarking these hybrid methods — including metaheuristic-driven LSTM/CNN variants, meta-learning/AutoML solutions, and XAI-aware detectors — to establish the true robustness and practical advantages of the proposed RCBEC pipeline. Doing so will shift the comparison from “accuracy numbers only” to a fuller assessment of robustness, interpretability and deployment cost.
Summary of hybrid and baseline methods added for comparative analysis to objectively evaluate robustness, scalability, and interpretability of the proposed system.

III. Proposed work
This section provides a detailed description of the proposed model for detecting intrusions Figure 1. Workflow of the proposed intrusion detection framework using the ECU-IoHT dataset.
The Figure 1 illustrates the step-by-step methodology, beginning with structured data preparation and error value removal, followed by normalization (decimal score max normalization) and feature extraction using K-best kernel discriminant analysis. Key features are then selected through HCA, and classification is performed using a random coupled bootstrapped ensemble classifier. Finally, performance analysis is conducted. The overall pipeline highlights how the proposed method integrates preprocessing, feature engineering, and ensemble learning to improve detection accuracy in IoT-based healthcare systems.
a. Dataset
Description and distribution of the ECU-IoHT dataset used in the proposed system.

b. Preprocessing
Data preliminary processing is an essential step in the machine learning technique as it involves cleaning up and transforming the data to ensure efficient utilization by the models. The input data quality substantially influences the final model’s accuracy and efficacy. Data preprocessing ensures the input data’s consistency, correctness, and utility. Data cleansing aids in eliminating discrepancies and inaccuracies within the data, facilitating data normalization for enhanced comparability and analysis. Additionally, it improves data manageability and usability for machine learning models. The preprocessing in this model involves several steps: applying decimal score max normalization, removing duplicates, replacing infinite and large values with NaNs, dropping rows with NaNs, separating numerical and categorical columns, normalizing numerical columns, encoding categorical columns, and converting the target variable into a discrete variable. First, use the “duplicated” function from the panda’s library to identify duplicate rows in the data frame. The method will return True for those rows if any duplicate entries are detected. The “drop_duplicates” function from the panda’s package is then used to remove duplicate entries from the data frame. Subsequently, the “replace” function was used from the pandas and numpy libraries to substitute infinite and huge numbers with NaNs. The “replace” function was used to substitute values that do not conform to a particular pattern with NaNs. Subsequently, any rows with missing values (NaNs) will be eliminated using the “drop” function from the panda’s library.
The remaining data frame is divided between columns that include numerical values and columns that contain category values. Numerical columns refer to columns with data types “float64” or “int64”, whereas categorical columns refer to columns with data type “object”. Subsequently, the code uses the “StandardScaler” function from the sklearn package to standardize the numerical columns. This guarantees that every feature has a mean of zero and a variance of one. The category columns are encoded using the “LabelEncoder” function from the sklearn package. This process transforms categorical variables into numerical variables by assigning a distinct integer value to each unique value. Ultimately, the information was partitioned into two different components: features (X) and labels (y). The “Label” column was designated as the target variable. The target variable, y, is then transformed into a discrete variable using the “cut” function from the pandas library. The target variable is partitioned into 10 equidistant bins, each allocated a distinct integer value. The
c. Feature extraction
Numerous approaches heavily use the K-best kernel discriminant analysis (K-BKDA), which has several potential uses. As an aim function, the author employs each sample point’s degree of membership concerning the class centre. Both the sample point and the clustering centre’s goal function are evaluated using the Euclidean distance. The minimal value of each clustering centre may be found by solving the function for the non-similarity index. You may find the generalization in Equation (1).

Centres c and the membership matrix U are the outputs of the K-BKDA algorithm. The union of all object degrees is U, which is a member of the centres c. Equation (3) provides a series of lower approximations.

The new approach may or may not have a non-membership value. When the membership value is close to 0 or 1, the user may say with confidence that the observations support a high level of certainty; when it’s close to 0.5, it can say with considerable doubt. Eq. (5) measures the non-membership value.

Every feature gets every object membership degree, as given in Eq. (7)
Data equivalence is the basis for measuring approximation similarity or equality, whereas equivalence relations are the basis for model equality. The equivalence relation R is used, as in Eq. (8).
The number b represent
d. Feature selection
The novel optimization algorithm HCA was inspired by the strategies used by grey wolves in the wild while hunting for feature selection. The four steps of this algorithm - encircling, hunting, seeking, and attacking - are shown below as corresponding mathematical models. The whole population of grey wolves may be broken down into four distinct tiers: alpha, beta, delta, and omega. The most significant answer may be in the pack’s alpha Canis, who make all the tough decisions. Beta canis, which backs up alphas, is the best alternative. Delta canis are the third-best option, while omegas represent all other possibilities. In HHWO, the alpha, beta, and delta wolves hunt while the omega wolves follow their lead. Grey wolves, on the other hand, often encircle their victim before beginning to hunt. The below equations serve as a model for the encompassing procedure: Process of optimization in the Grey Wolf Optimizer.


The Figure 2 illustrates how wolves encircle prey and update their positions according to the best candidates (alpha, beta, and delta). The main message is that wolves gradually converge toward the prey, demonstrating the exploitation and exploration balance of the algorithm. Wolves in the area around the prey get within a close range. While it’s impossible to know where the prey hides, we may assume that the pack’s alpha, beta, and delta wolves will be the closest. So, given the best answers obtained so far, the following equations are used to simulate the hunting operation and determine where the other wolves are:


Distances to the alpha, beta, and delta wolves are determined. The new positions of the alpha, beta, and delta wolves are determined by Equations (16)-(18), while the location of the prey is determined by Equation (19). When the grey wolves have finished foraging for food, they are instructed to leave the area. The search process is aided by the coefficient P as well. The value 


The algorithm for the HCA approach is shown below:

e. Attack detection
The random coupled bootstrapped ensemble classifier (RCBEC) method may be categorized as an ensemble learning approach. The current study used the Ensemble and Random Forest methods to construct a classifier model to classify assault data. The RCBEC classifier model is built using several RF classifiers. The classifier functions independently, enabling concurrent training and testing of models without any disruption between the two processes. For this research, a training dataset, G, which consists of g components, was used.
The input customization features are denoted as 
The set 
Equation (9) represents the probability of correctly categorizing a given sample g into class v using the random forest approach. The Equation (10) presents the mathematical formula for the margin function linked to this prediction. The margin function is a quantitative metric used to evaluate the average number of votes obtained by correctly recognized categories relative to the votes received by other categories. The decision function, represented as (24), is responsible for producing the final results provided by the random forest approach.
The notation 

j 
The expected customization settings are connected, referred to as
The attack categories or classes labelled 


Finally, the attack data can be classified.

IV. Performance analysis
This section presents the assessment metrics, environmental setup, and results of the proposed System for detecting cyber-attacks on the Internet of Health Things (IoHT). The suggested technique is implemented and evaluated on the ECU-IoHT dataset using a DELL laptop with Windows 10 OS, 16 GB RAM, and an Intel Core I5-10210U CPU. Spyder Python (version 3.8) serves as an implementation tool with other libraries, including matplotlib (version 3.3.2), Numpy (version 1.19.2), Pandas (version 1.1.3), Scikit-learn (version 0.23.2), Keras (version 2.6.0), and Tensorflow (version 2.6.0).
The suggested methodology is implemented on a dataset that includes regular and aberrant instances to identify different sorts of assaults in the Internet of Health Things.
The correlation between features in the dataset is obtained, and features with high negative or positive values are considered highly correlated. The matrix visualizes pairwise correlations among all features, where values closer to +1 or −1 indicate stronger positive or negative correlations, respectively. Features exceeding a predefined correlation threshold were identified as redundant and subsequently removed to minimize multicollinearity and improve model performance. We derived the correlation map showing the highly correlated features and the features with values more significant than the threshold value were dropped. The correlation matrix of the dataset’s features is shown in Figure 3. Correlation matrix of the dataset’s features.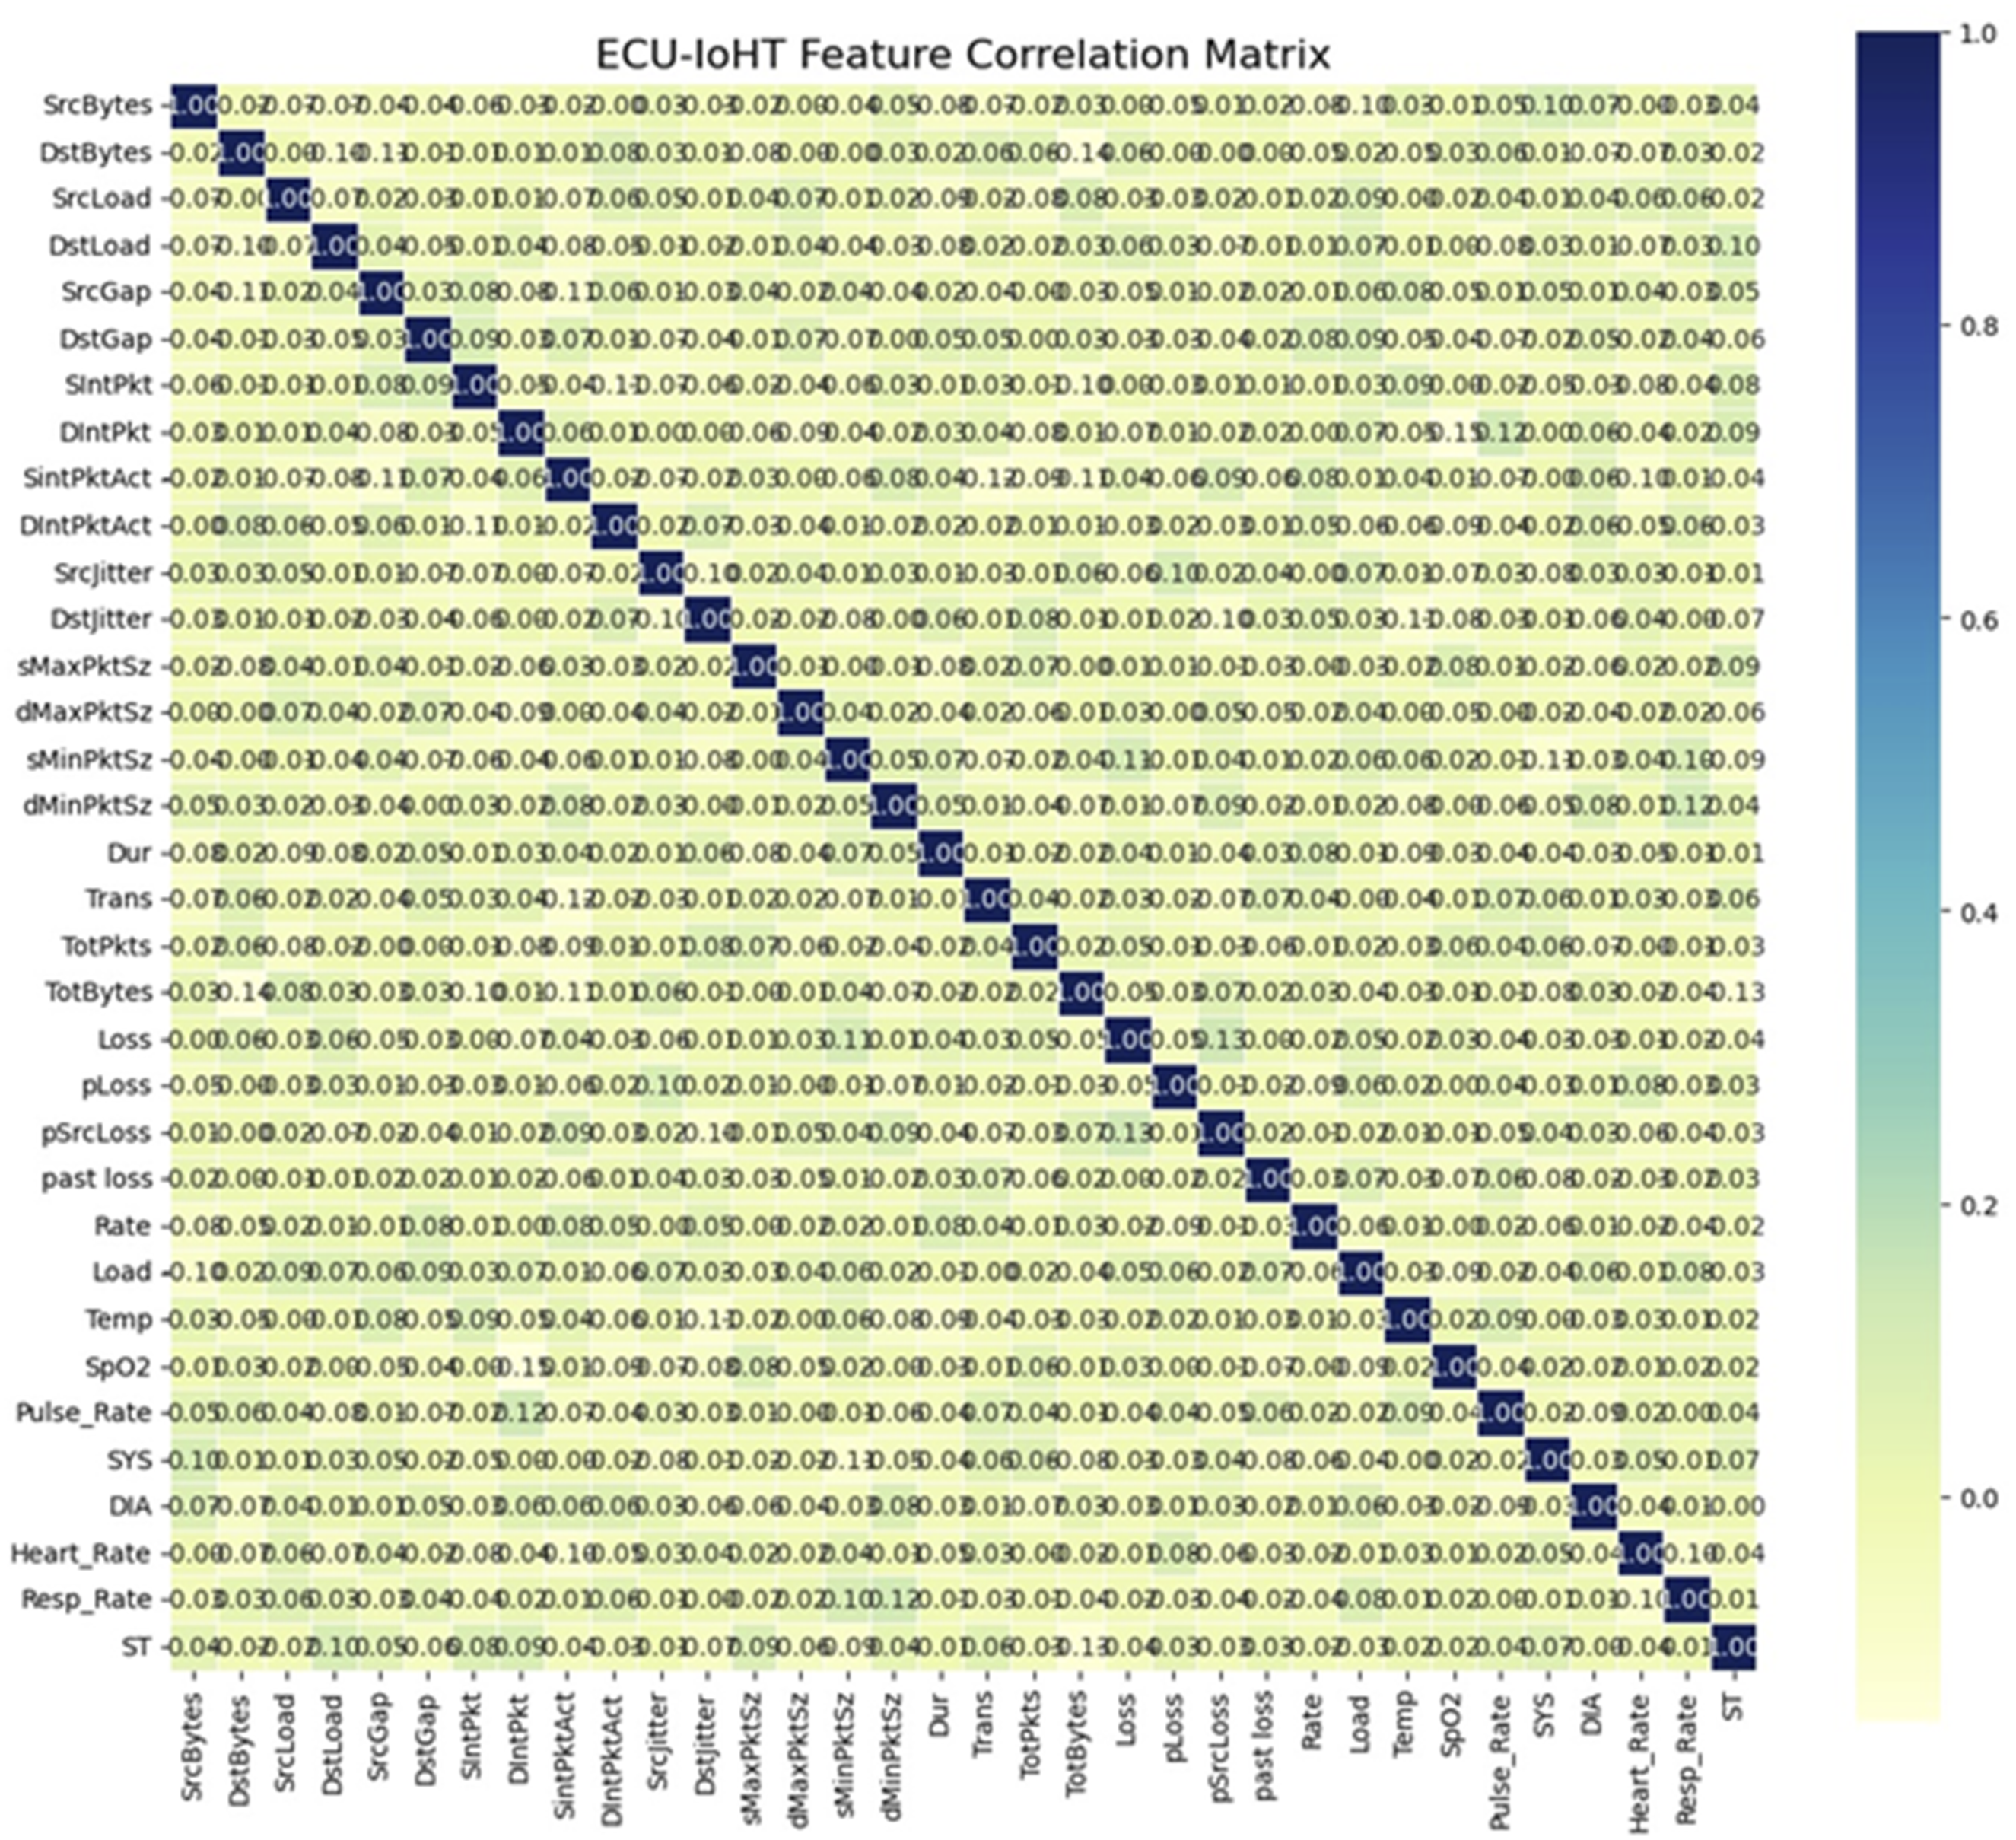
Optimized features selected for the ECU-IoHT intrusion detection framework.

The simulation interface Figure 4 shows the configuration of the Random Coupled Bootstrapped Ensemble Classifier (RCBEC) model, with healthcare as the application domain and Denial-of-Service (DoS) as the selected attack category. The system generates simulation results in the form of output files (e.g., replay of message, channel jamming, and cluster control system attacks), which are used for further analysis and visualization. This simulated output validates the model’s capability to detect different types of network attacks in IoHT environments. Simulated output of the RCBEC model for attack detection in healthcare IoHT.
This Figure 5 shows the training and validation accuracy over 100 epochs. The training accuracy reaches near-perfect levels early in the training process, while the validation accuracy stabilizes around 99%, indicating a well-fitted model. Training and validation accuracy with 100 epochs.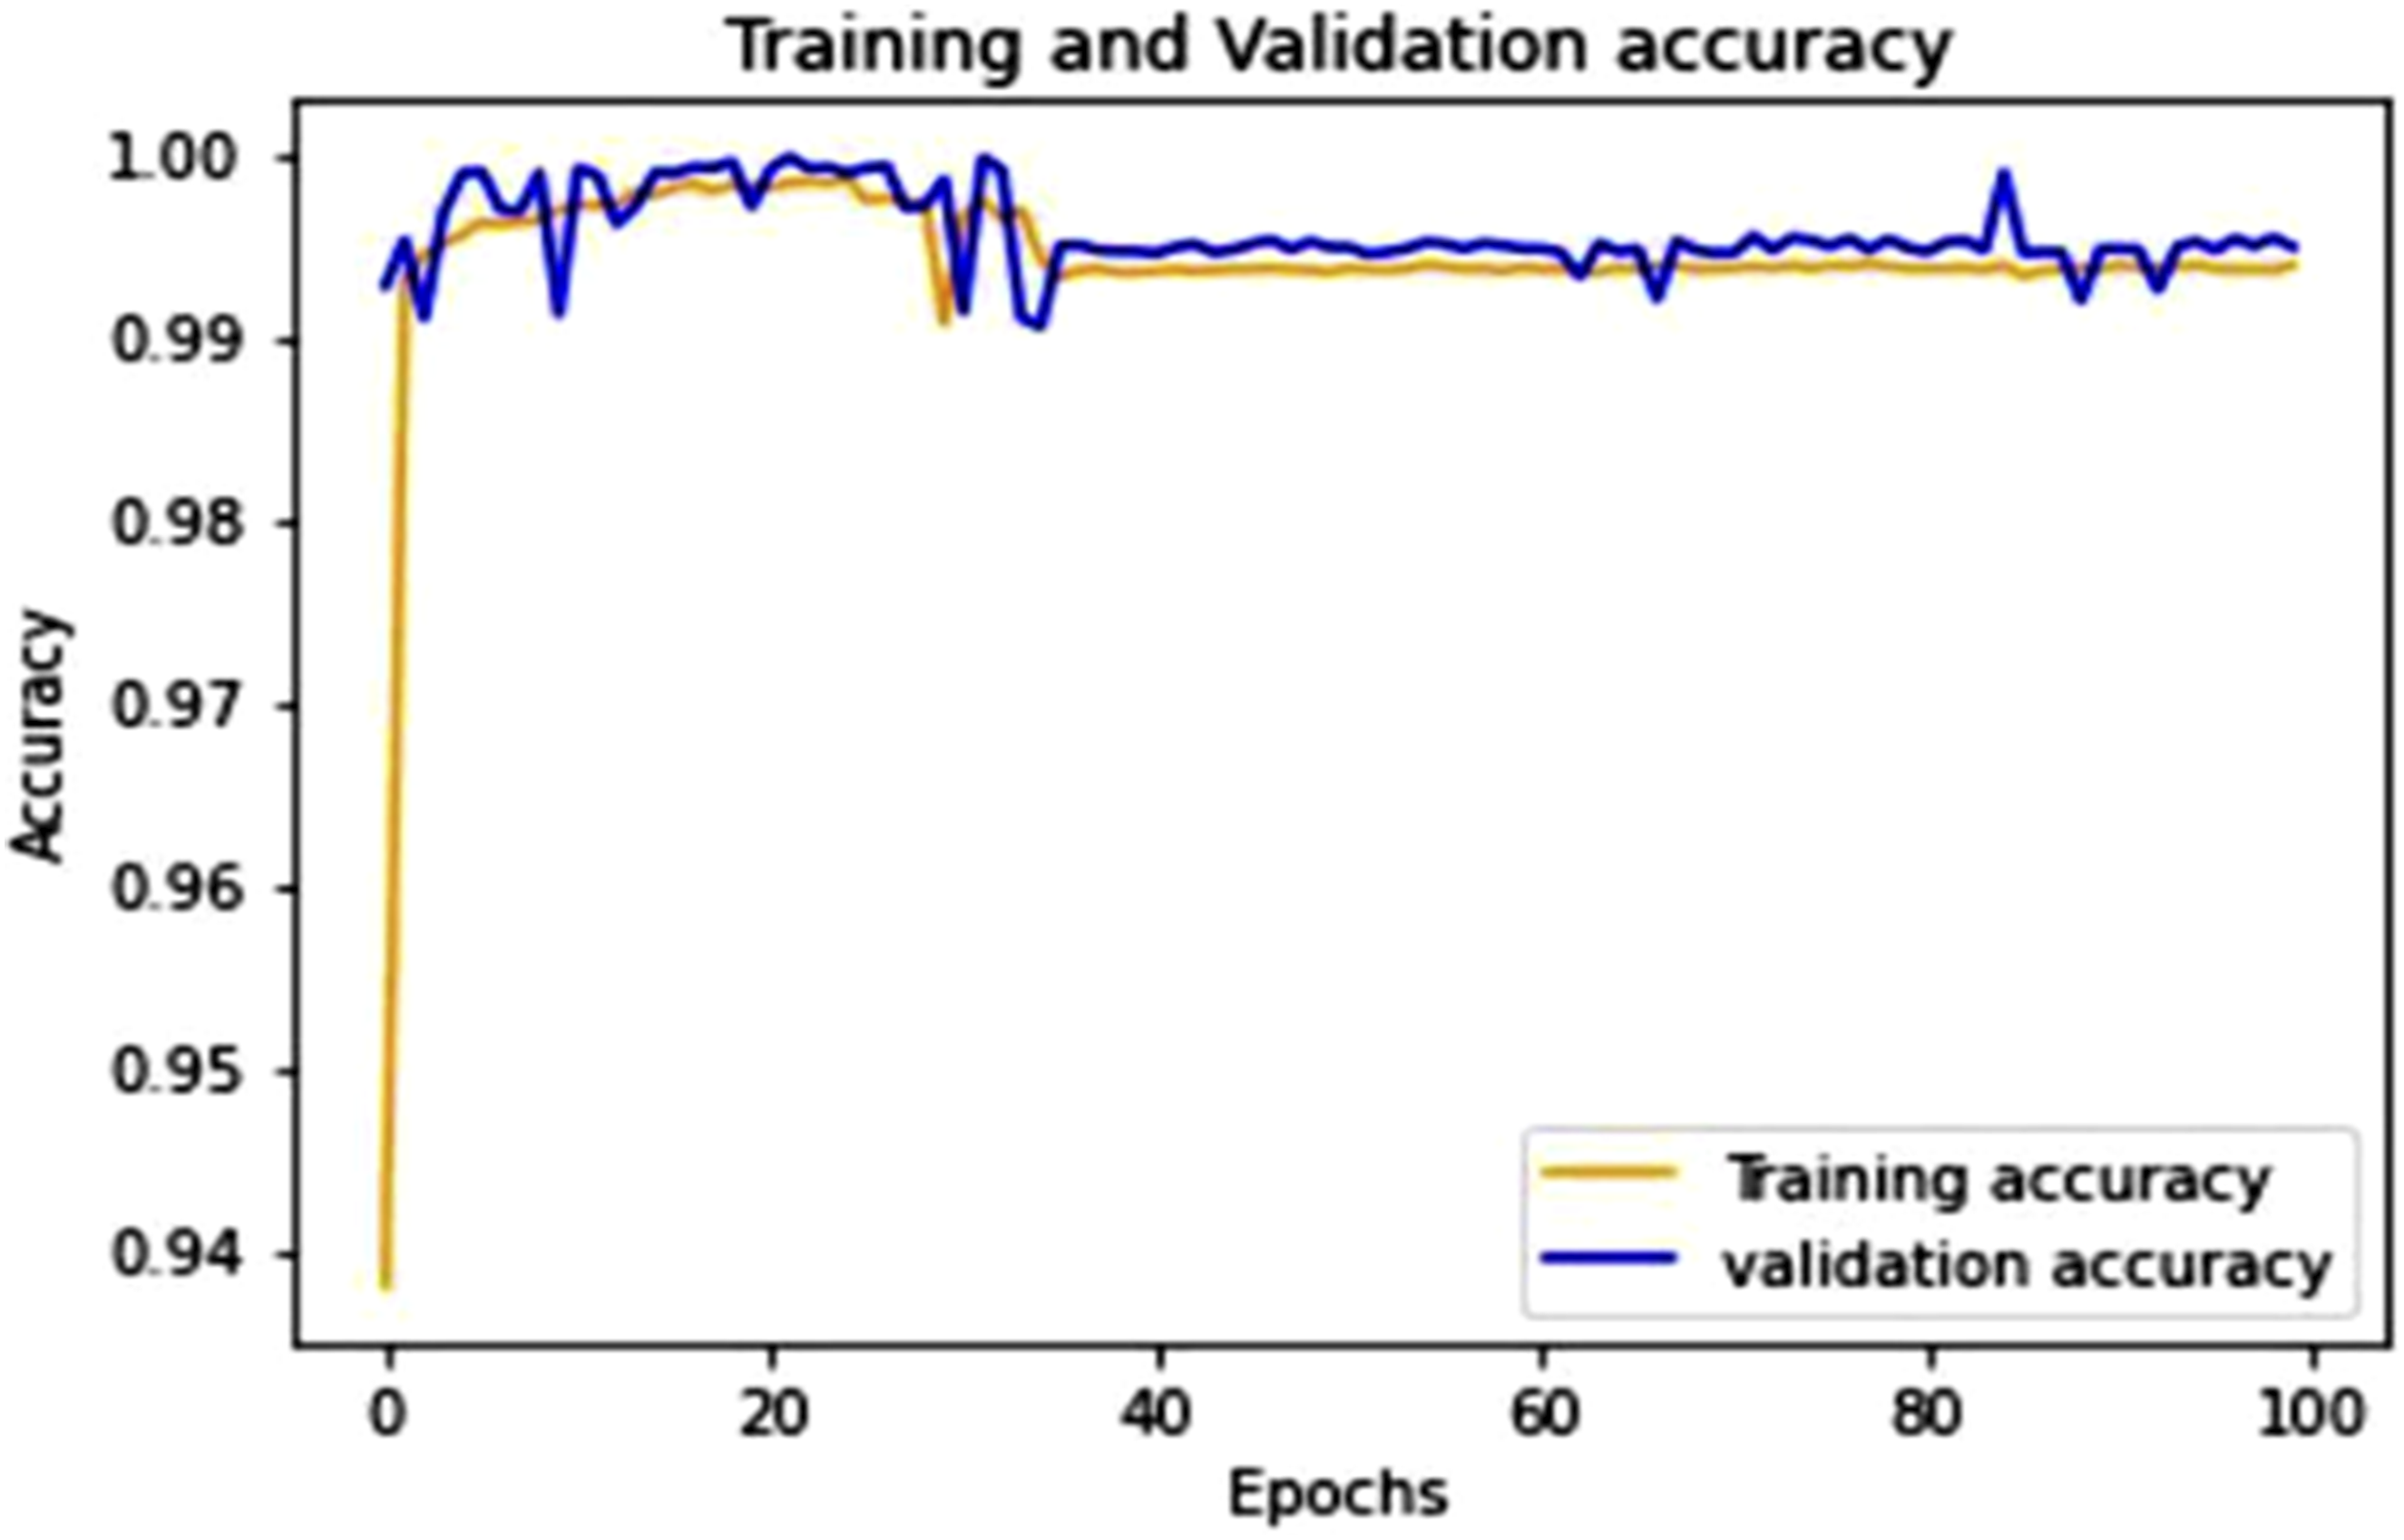
Figure 6 illustrates the training and validation loss across 100 epochs. Both the training and validation losses decrease sharply at the beginning and then stabilize, suggesting that the model quickly learns and generalizes well without overfitting. Training and validation loss with 100 epochs.
This Figure 7 shows that both training and validation accuracy rapidly converge to nearly 100% within the first ∼50 epochs and remain stable thereafter. The minimal gap between training and validation accuracy indicates that the model generalizes well without overfitting. Training and validation accuracy over 500 epochs.
Figure 8 shows the loss drops sharply during the early epochs and remains consistently low, indicating effective model learning. The close alignment between training and validation loss suggests strong model stability and minimal overfitting. Training and validation loss over 500 epochs.
As seen in Figures 7 and 8, the suggested approach significantly improves the detection accuracy, bringing it to 100% when given 500 epochs. The following metrics to measure the efficacy of the proposed System: Accuracy, Precision, Recall, F1-Score, True Positive Rate, and False Positive Rate. The ratio of correctly categorized records to the total number of records or counts is used to measure accuracy, as shown in Equation (32):
According to Equation (33), precision is the percentage of abnormal occurrences that are correctly predicted out of all the instances that are anticipated to be abnormal:
According to Equation (21), recall is the proportion of correctly anticipated abnormal cases to the total number of actual abnormal instances:
To evaluate the precision of the System, the F1 Score takes the harmonic mean of the Precision and Recall, as shown in Equation (22):
Another way to determine accuracy is to look at the Area Under the ROC curve (AUC) and Receiver Operating Characteristics (ROC) curve. This statistic shows how likely it is that a randomly chosen positive test point will be projected to be positive rather than a randomly chosen negative test point.
Figure 9 Performance analysis of the suggested methodology across different attack types (ARP, DOS, NMAP, NORMAL, SMURF). The results show precision, recall, and F1-score values, all consistently above 95%, indicating that the proposed model achieves high detection performance with balanced accuracy across different classes. Performance analysis of the suggested methodology.
The misclassification rate measures the architecture’s performance to analyse the results obtained. The misclassification rate refers to the number of samples being misrecognized. Thirty iterations were performed for each session, using the entire training data. According to Figure 10, the result is Misclassification rate analysis.
This Figure 11 presents the error rate variation with respect to file size (in MB). The error rate remains consistently low, below 0.03%, across different file sizes, demonstrating the robustness and scalability of the proposed methodology in handling varying data volumes. Error rate analysis.
The AUC curve on attack data in Figure 12 shows that the suggested methods show an outstanding value of AUC (96)%. Thus, the classification rate is also higher than that of other existing methodologies. Analysis of AUC.
This figure compares the training and testing (execution) times of different machine learning methodologies—Support Vector Machine (SVM), Random Forest (RF), K-Nearest Neighbours (KNN), Decision Tree (DT), and the proposed model. The results show that while traditional models like RF and KNN consume higher testing times (above 25 seconds), the proposed model significantly reduces both training and testing durations. This demonstrates that the proposed approach achieves faster computational efficiency while maintaining high accuracy. To appropriately characterize machine learning algorithms, it is necessary to evaluate their performance in addition to their accuracy.
55
Essential performance metrics include, in particular, the time spent on training and execution. The amount of time that a model spends training on a dataset is referred to as the training time, whereas the execution time corresponds to the entire amount of time that is spent doing calculations. These computations include data splitting, data preparation, and model assessment. Figure 9 illustrates the amount of time required for training and training execution for each of the machine learning algorithms. The SVM method has a training time of 2.01 seconds and an execution time of 21.59 seconds, respectively. The RF algorithm takes 2.36 seconds and 24.90 seconds, respectively, to complete. Therefore, RF is the approach that takes the most extended amount of time to train and execute because it constructs and computes several different DTs.
56
The KNN method, on the other hand, has a training time of just 0.49 seconds. This is because it does not generate any models during the training process; instead, it only stores training data for later classification. Despite this, the time it takes to execute is 23.46 seconds. It can be deduced from this that KNN requires more time to determine the distance to the data point of the k-nearest neighbour. According to the DT algorithm, the training time is 0.72 seconds, and the execution time is 7.47 seconds. The time required for training and running the proposed method is 0.5 seconds and 6.2 seconds, respectively. As a result, DT is the algorithm that is the quickest among those assessed in terms of the training and execution durations” Figures 13–15. Training and execution times analysis. Combined visualization of model performance across multiple datasets. Friedman Critical difference diagram for F1 score statistics.


Performance analysis of the proposed system compared with existing models under various attack scenarios.

Comparing the shown method’s performance on several datasets to that of already-existing approaches. 57

To verify the statistical significance of the observed improvements, a non-parametric Friedman test was applied across all evaluated models and datasets. This test is appropriate because it does not assume normal distribution and supports multi-model comparison. When the Friedman test indicated significant differences (p < 0.05), a post-hoc Nemenyi test was performed to identify the specific model pairs with statistically meaningful performance gaps. Additionally, Wilcoxon signed-rank tests and effect size measures (Cohen’s d) were considered to quantify the magnitude and consistency of the improvements achieved by the proposed approach.
The Friedman test ranks models based on their mean F1-score performance across all datasets.
The proposed RCBEC model achieved the lowest (best) average rank, demonstrating statistically superior performance compared to traditional classifiers. Models connected within the same group indicate no statistically significant difference at the 0.05 confidence level.
V. Conclusion
IDS systems maintain unprecedented importance in healthcare networks because cyber threats and network security risks continue to increase in frequency. Research investigates IDS capability to improve network security at a high rate. An ensemble learning-based IoT network attack detection system was developed as a solution for distributed IoT application cybersecurity specifically in healthcare setups. Research findings prove that artificial intelligence works effectively in cybersecurity by producing a functional attack detection system. Experimental testing validated the system performance by measuring accuracy at (99.9%) and execution time at (6.2 seconds) together with false alarm rates demonstrating the better capabilities of deep learning models compared to conventional shallow models. Attack detection algorithms perform best when distributed across multiple locations compared to centralized approaches because the exchange of model parameters reduces training overfitting. On previously unseen data the proposed system demonstrates superior capability than ordinary machine learning methods when distinguishing between normal traffic and malicious patterns. The IDS future assessment will test various datasets until researchers evaluate its performance against classic machine learning methods that include Support Vector Machines (SVM) and Decision Trees with additional neural network models. The proposed analysis will examine network payload data for intrusion detection because it holds key patterns to discover attacks.
Future work will systematically explore hybrid metaheuristic–machine learning approaches (e.g., LSTM/CNN architectures tuned by PSO/GA/HCA and CNN+XAI frameworks for attack attribution), and extend the comparative analysis to include AutoML/Bayesian HPO baselines, federated learning variants, and adversarial robustness tests. These additions will provide a deeper, objective evaluation of the RCBEC method’s robustness, deployment cost, and interpretability across heterogeneous IoT/healthcare datasets.
Footnotes
Author contributions
Conceptualization-Paul Rodrigues, methodology-Yosuef Alotaibi,software-Mohammad Alhefdi, investigation, resources,-Yosuef Alotaibi; data curation-Mohammad Alhefdi, writing—original draft preparationwriting-PandimuruganV—review and editing, supervision-Paul rodrigues andYosuef Alotaibi,funding acquisition-Paul Rodrigues and Yosuef Alotaibi.
Funding
The authors disclosed receipt of the following financial support for the research, authorship, and/or publication of this article: The authors extend their appreciation to the deanship of research and graduate studies at king khalid university for funding this work through large research project under grant number RGP 2/321/46.
Declaration of conflicting interests
The authors declared no potential conflicts of interest with respect to the research, authorship, and/or publication of this article.
Data Availability Statement
Data is available based on the request.