
Abstract
Introduction
Audit and feedback (A&F) is a quality improvement strategy widely used within healthcare with the aim of increasing adherence to clinical standards and thereby improving outcomes. 1 An individual or team’s performance is measured (“audited”) against a specific professional standard and the results shared with the individual or team (“feedback”), with the aim of encouraging an increase in achievement. National A&F programmes in the United Kingdom provide feedback on clinical priorities such as diabetes (e.g. the percentage of patients with diabetes achieving recommended levels of blood pressure, cholesterol and blood sugar [HbA1c]). 2
A Cochrane review reported that A&F interventions resulted in a median 4.3% increase in healthcare professionals’ compliance with recommended practice. 1 One quarter of A&F interventions had a relatively large, positive effect on patient outcomes, while one quarter had a negative or null effect. Many studies have investigated how to improve feedback. 3 For instance, the Cochrane review identified ways of delivering feedback (termed feedback techniques in this article) that were associated with increased effectiveness. These included providing specific feedback in more than one mode (e.g. both verbal and written) and specifying goals and action plans. However, the indirect nature of many comparisons within the Cochrane review limits the robustness of conclusions on the relative effectiveness of different feedback techniques. There is therefore a need for more head-to-head comparisons of different feedback techniques. 1
However, there are many potential ways of varying feedback. For example, frequency and timing of feedback can be varied, data can be presented textually or using graphics, co-interventions (e.g. clinician reminders) may or may not be included. Testing each and every variation in ‘real world’ head-to-head randomised trials would require an unrealistic number of trials. 4 Given this is not efficient, online screening experiments offer a way of identifying the most promising feedback techniques for further evaluation. An effective approach is needed to design feedback techniques for such experiments. The Multiphase Screening Strategy (MOST) can be used as a methodological approach to guide the development of these online experiments for A&F interventions.5,6 MOST consists of three steps: preparation, where potential intervention components are identified and piloted; screening, where trials are conducted to compare those intervention components and determine which to take forward; and evaluation, where a randomised trial assesses effectiveness of the intervention. User-centred design (UCD) is an approach which focuses on the needs and abilities of users in order to improve the design of products, services, or processes.7,8 UCD has a strong ‘user focus’ and an iterative process of repeated usability testing.9,10 However, there has been limited use of UCD in collaboration with implementation science to improve patient care services within health informatics research beyond iterative usability testing.8,10 For instance, few studies have utilised other established UCD methods to deliver a fully interactive online experiment in the context of A&F. These methods include co-creation workshops, contextual interviews and expert reviews, as well as the involvement of patients and stakeholders from diverse backgroundsfor example, 11 This study aims to address this gap.
We employed an innovative UCD approach to develop feedback techniques for use in a subsequent online screening experiment. 12 The approach combined the first step of MOST with UCD and illustrates ways to engage with partners (stakeholders and patients), considering feasibility of online delivery, and usability. In this paper we describe the UCD approach and give detailed examples of the feedback techniques that we created. We also discuss how UCD delivered insights about the design of feedback techniques related to practitioners’ intended enactment, understanding, and experiences, the outcomes of which can be used for further ‘real world’ evaluations and intervention studies. Additionally, we explored specific feedback techniques not yet evaluated in previous feedback literature, that is, different ways of presenting feedback information and specific actions to feedback recipients.
Methods
Reporting guidelines
This paper provides an account of using User-Centred Design methods and the first phase of the Multiphase Screening Strategy to design content ahead of an online trial; the results of which have been published elsewhere. 12 Therefore, a CONSORT checklist was not appropriate for the present paper.
Design process overview
Combination of Multiphase Optimization Strategy (MOST; first step only) and User-Centred Design (UCD) approaches used in this study.

List of the six feedback techniques (see 12).

Descriptive summary of participants’ roles.

User-centred design methods used to design feedback techniques
Co-creation workshops (Design stages 1 and 2)
The design process commenced with two co-creation workshops (design stages 1 and 2). The workshops lasted 4 hours each and involved four members of the research team with expertise in clinical health and behavioural science, as well as human–computer interaction researchers at XXXX. The first workshop aimed to: (1) Consider the types of healthcare professionals who engage with A&F reports (the end users); (2) Consider the constraints on the feedback techniques; and (3) Consider ways to address the constraints identified based on other online websites and documents. We used two ideation techniques: constraint removal and analogical reasoning. 13 Constraint removal involved team members removing any practical design constraints that existed, before exploring ways to address or mitigate these constraints. 13 Analogical reasoning involved thinking about the functionality of another system (e.g., an e-commerce website) and considering how this could be applied to feedback techniques. 14
The second workshop aimed to explore ways of operationalising the six feedback techniques (both standard ‘OFF’ and enhanced ‘ON’ versions) and to generate design ideas. Key design ideas for development and testing were recorded in workshop notes.
Prototyping and usability testing (Design stages 3 and 4)
We conducted three iterative rounds of prototyping and usability testing as presented in Figure 1. The research team created low fidelity prototypes for round 1 (paper-based sketches created using Balsamiq software; balsamiq.com), wireframes for round two and high-fidelity prototypes for round 3 (fully functional versions of the feedback techniques incorporated within an online experiment). In UCD, fidelity refers to how closely a prototype resembles the final product. Usability Testing interview process.
Number of prototypes (n = 63) for each feedback technique explored in usability testing* sessions (see21).
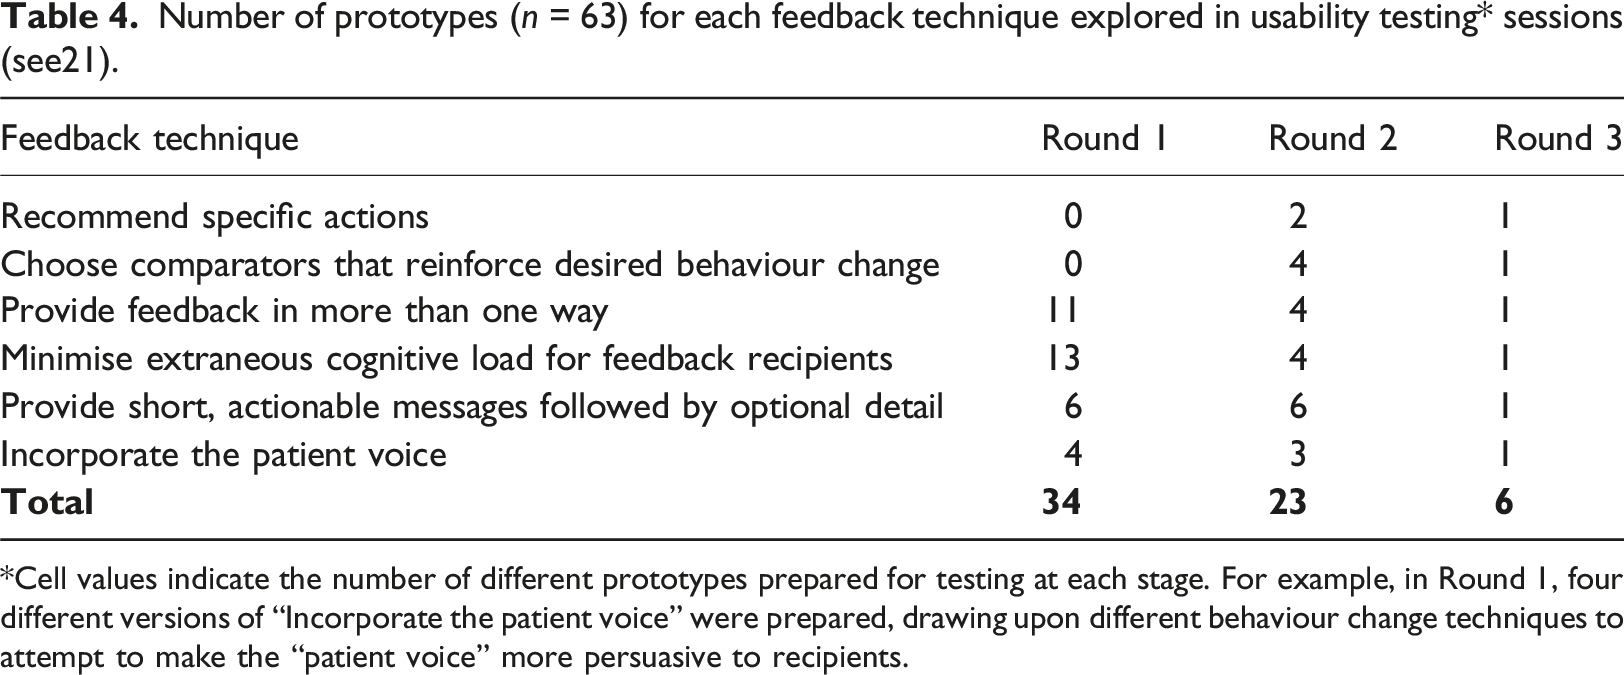
*Cell values indicate the number of different prototypes prepared for testing at each stage. For example, in Round 1, four different versions of “Incorporate the patient voice” were prepared, drawing upon different behaviour change techniques to attempt to make the “patient voice” more persuasive to recipients.
13 participants from the five audit programmes with experience of receiving feedback were recruited for usability testing, using non-probabilistic quota sampling, and snowballing approaches. 15 One member of the public from the study’s Patient and Public Involvement panel also participated, to help ensure relevance of feedback techniques to patient needs. Aside from this individual, those listed in Table 3 were all from healthcare roles and the target recipients of the five audit programmes. We received written and informed consent from all participants during the usability testing. Table 3 summarises the participants’ roles.
Usability testing of the prototypes explored their acceptability, usability, and user experience. 12 Each test session consisted of two main parts: a semi-structured contextual interview followed by think-aloud testing (see supplementary materials). 16 The interview was used to gather information about participants’ roles, usage of audit reports, navigational behaviour and attitudes to A&F. 17 Participants then engaged in think-aloud usability testing where they explored the prototypes and were asked to verbalise their thoughts on the acceptability, usability, and their experience of the different feedback techniques. 18 Sessions were audio recorded for subsequent analysis. Content analysis was conducted using NVivo 12 (QSR International Pty Ltd, Version 12, 2018), applying a priori codes to categorise participants’ responses according to sentiment (mixed or neutral, negative, positive). We used the sentiment coding to guide decisions about the acceptability of prototypes and we used specific comments to guide design improvements.
Expert reviews
Project team members (Development team and domain experts) and the study PPI panel undertook expert reviews of the final prototypes to identify bugs in their functionality, usability issues and ensure the fidelity of the online feedback techniques. 19 This involved testing the functionality and content of feedback techniques, both individually and in combination, for the different audits. Issues identified in the expert reviews were captured in logs and addressed by the development team. 20
Ethical review
The project received ethical approval from the Leeds University Research Ethics Committee.
Results
We present summary outcomes from the co-creation workshops, prototyping and usability testing and expert reviews.
Summary of co-creation workshop outcomes
Key issues explored included the population sample (representative end users) to recruit for usability testing, the types of constraints that stakeholders might experience (e.g., time availability of end-users, different concerns of managers vs clinicians, and technological constraints of online feedback technique developers), and the opportunity to adopt features from other online platforms, such as Amazon, to address some of these constraints (e.g., using a ‘basket’ to prioritise audit recommendations to review). For example, it was decided that whilst having tailored dashboards for individual end-users would increase the personalisation of the feedback for a healthcare professional, such an approach would not be practical for the online experiment.
Key decisions made in the second workshop included the content to use for the feedback techniques, the functionality of feedback techniques to be evaluated (e.g., patient voice as a soundbite), and methods to use in the usability testing sessions. It was decided that developing a full, interactive A&F report inclusive of all the different feedback techniques was beyond the scope of the study. Participants would, therefore, be presented with a short A&F example scenario.
Summary of usability testing outcomes
In total, we prepared 63 prototypes across the three rounds of usability testing (Table 4). These included paper-based, HTML wireframes, and fully-functioning HTMLs. The purpose of this work was to prepare and refine each of the feedback techniques; once this had been achieved the techniques could then be applied to each of the five clinical audits. Design decisions after each round were a balance between addressing usability testing findings and team input to ensure fidelity to the original feedback techniques and the required levels (standard and enhanced versions). As there were six individual feedback techniques that could be used in various combinations, we illustrate this part of the UCD process by reporting the three feedback techniques that generated the most discussions amongst participants, showing how they developed across the three rounds of testing and the value of iterating on the designs: provide feedback in more than one way, minimise extraneous cognitive load, and incorporate the patient voice. Summaries of the iterative design and usability testing for these three feedback techniques are provided below and key quotes are presented to illustrate the points made. It should be noted that not all feedback techniques were explored across all usability testing rounds. Round 1 focused on feedback techniques where we wanted to explore alternative visual and textual forms of presentation using low fidelity prototypes. “Recommended specific actions” and “Choose comparators that reinforce desired behaviour” required exploration of content, not presentation, and therefore were only included in rounds two and 3 which used high-fidelity prototypes.
Table 4 summarises the number of prototypes for each feedback technique across the three rounds of testing.
Feedback technique - provide feedback in more than one way
Paper prototypes in round 1 for the ON versions of this feedback technique presented feedback in a variety of ways using different types of charts (e.g., bar and funnel), quality indicators in written form, and graphical icons. The OFF versions only displayed textual quality indicators. Participants were positive about bar graphs enabling them to understand the data. They reported preferring graphical icons together with textual feedback (e.g., the percentage of practices achieving a given audit standard), allowing them to validate the data and judge the direction and scale of change from 1 year’s figures to the next. Participants suggested choosing a way of presenting data that would cater for most users, for example using a bar chart rather than a funnel plot or allowing users to switch between different types of charts. They suggested that interactive data visualisations might be useful, allowing users to alter variables when exploring the data, and to make judgements about clinical interventions. Participants were also positive about the use of colour, for example colour-coding systems such as traffic light systems (red to denote bad, amber to denote a warning, green to denote good) were regarded as a familiar and well-liked mechanism for reducing cognitive burden.
Of the different chart types, funnel plots received the most critical comments during the testing of wireframes in round 2. Participants reported that whilst funnel plots were visually appealing, other people may find them challenging: “we know how to read them, you know the funnel plots, but whenever we put them up in boards or anything people really struggle to, to read them”.
The final design of the ON version of this feedback technique during round 3 (see Figure 2) used a bar chart with the best-achieving quartile highlighted. Participants considered that bar charts were a readily comprehensible way to present a summary of performance. They also noted the visual appeal of quartile shading on the chart. Round 3 ON version of the feedback technique ‘provide feedback in more than one way’. Feedback Technique: Minimize extraneous cognitive load for feedback recipients.
In designing the round 1 paper prototypes, we considered features known to ease cognitive processes, for example prioritising key messages and reducing visual clutter. The OFF version prototypes were information-heavy, with the inclusion of irrelevant information, poor formatting and no grouping of information, whereas the ON version prototypes used a range of methods such as bullet-pointed lists, personalised information, and filterable tables to reduce cognitive load. Participants noted that too much text and small, tightly packed fonts were not user-friendly, “it’s horrible… I wouldn’t bother reading it” and, “I would completely ignore that if it was in any report”. Conversely, participants were generally positive about the enhanced versions that used graphical percentage shading, enabling participants to compare their organisation’s performance against others in the same region.
Round two focused on participants’ responses to varying amounts of additional information. Participants expressed mixed views about controls they could use to manage the presentation of tabular performance data. Whilst considered more visually engaging and “easier to look at”, the controls created problems when an entire dataset needed to be viewed. Participants also suggested that key results should be included in headline information, with both denominator and percentage values.
The final design in round 3 included extraneous detail in the OFF version (Figure 3) such as background information about the audit and two tables with the number of patients whose care achieved the audit standard. This information was absent in the ON version. The majority of participants stated that they either overlooked the extraneous content or were confused as to why it was included in the feedback. Round 3 OFF version of the feedback technique ‘minimize extraneous cognitive load’ where extraneous background information about the audit was included.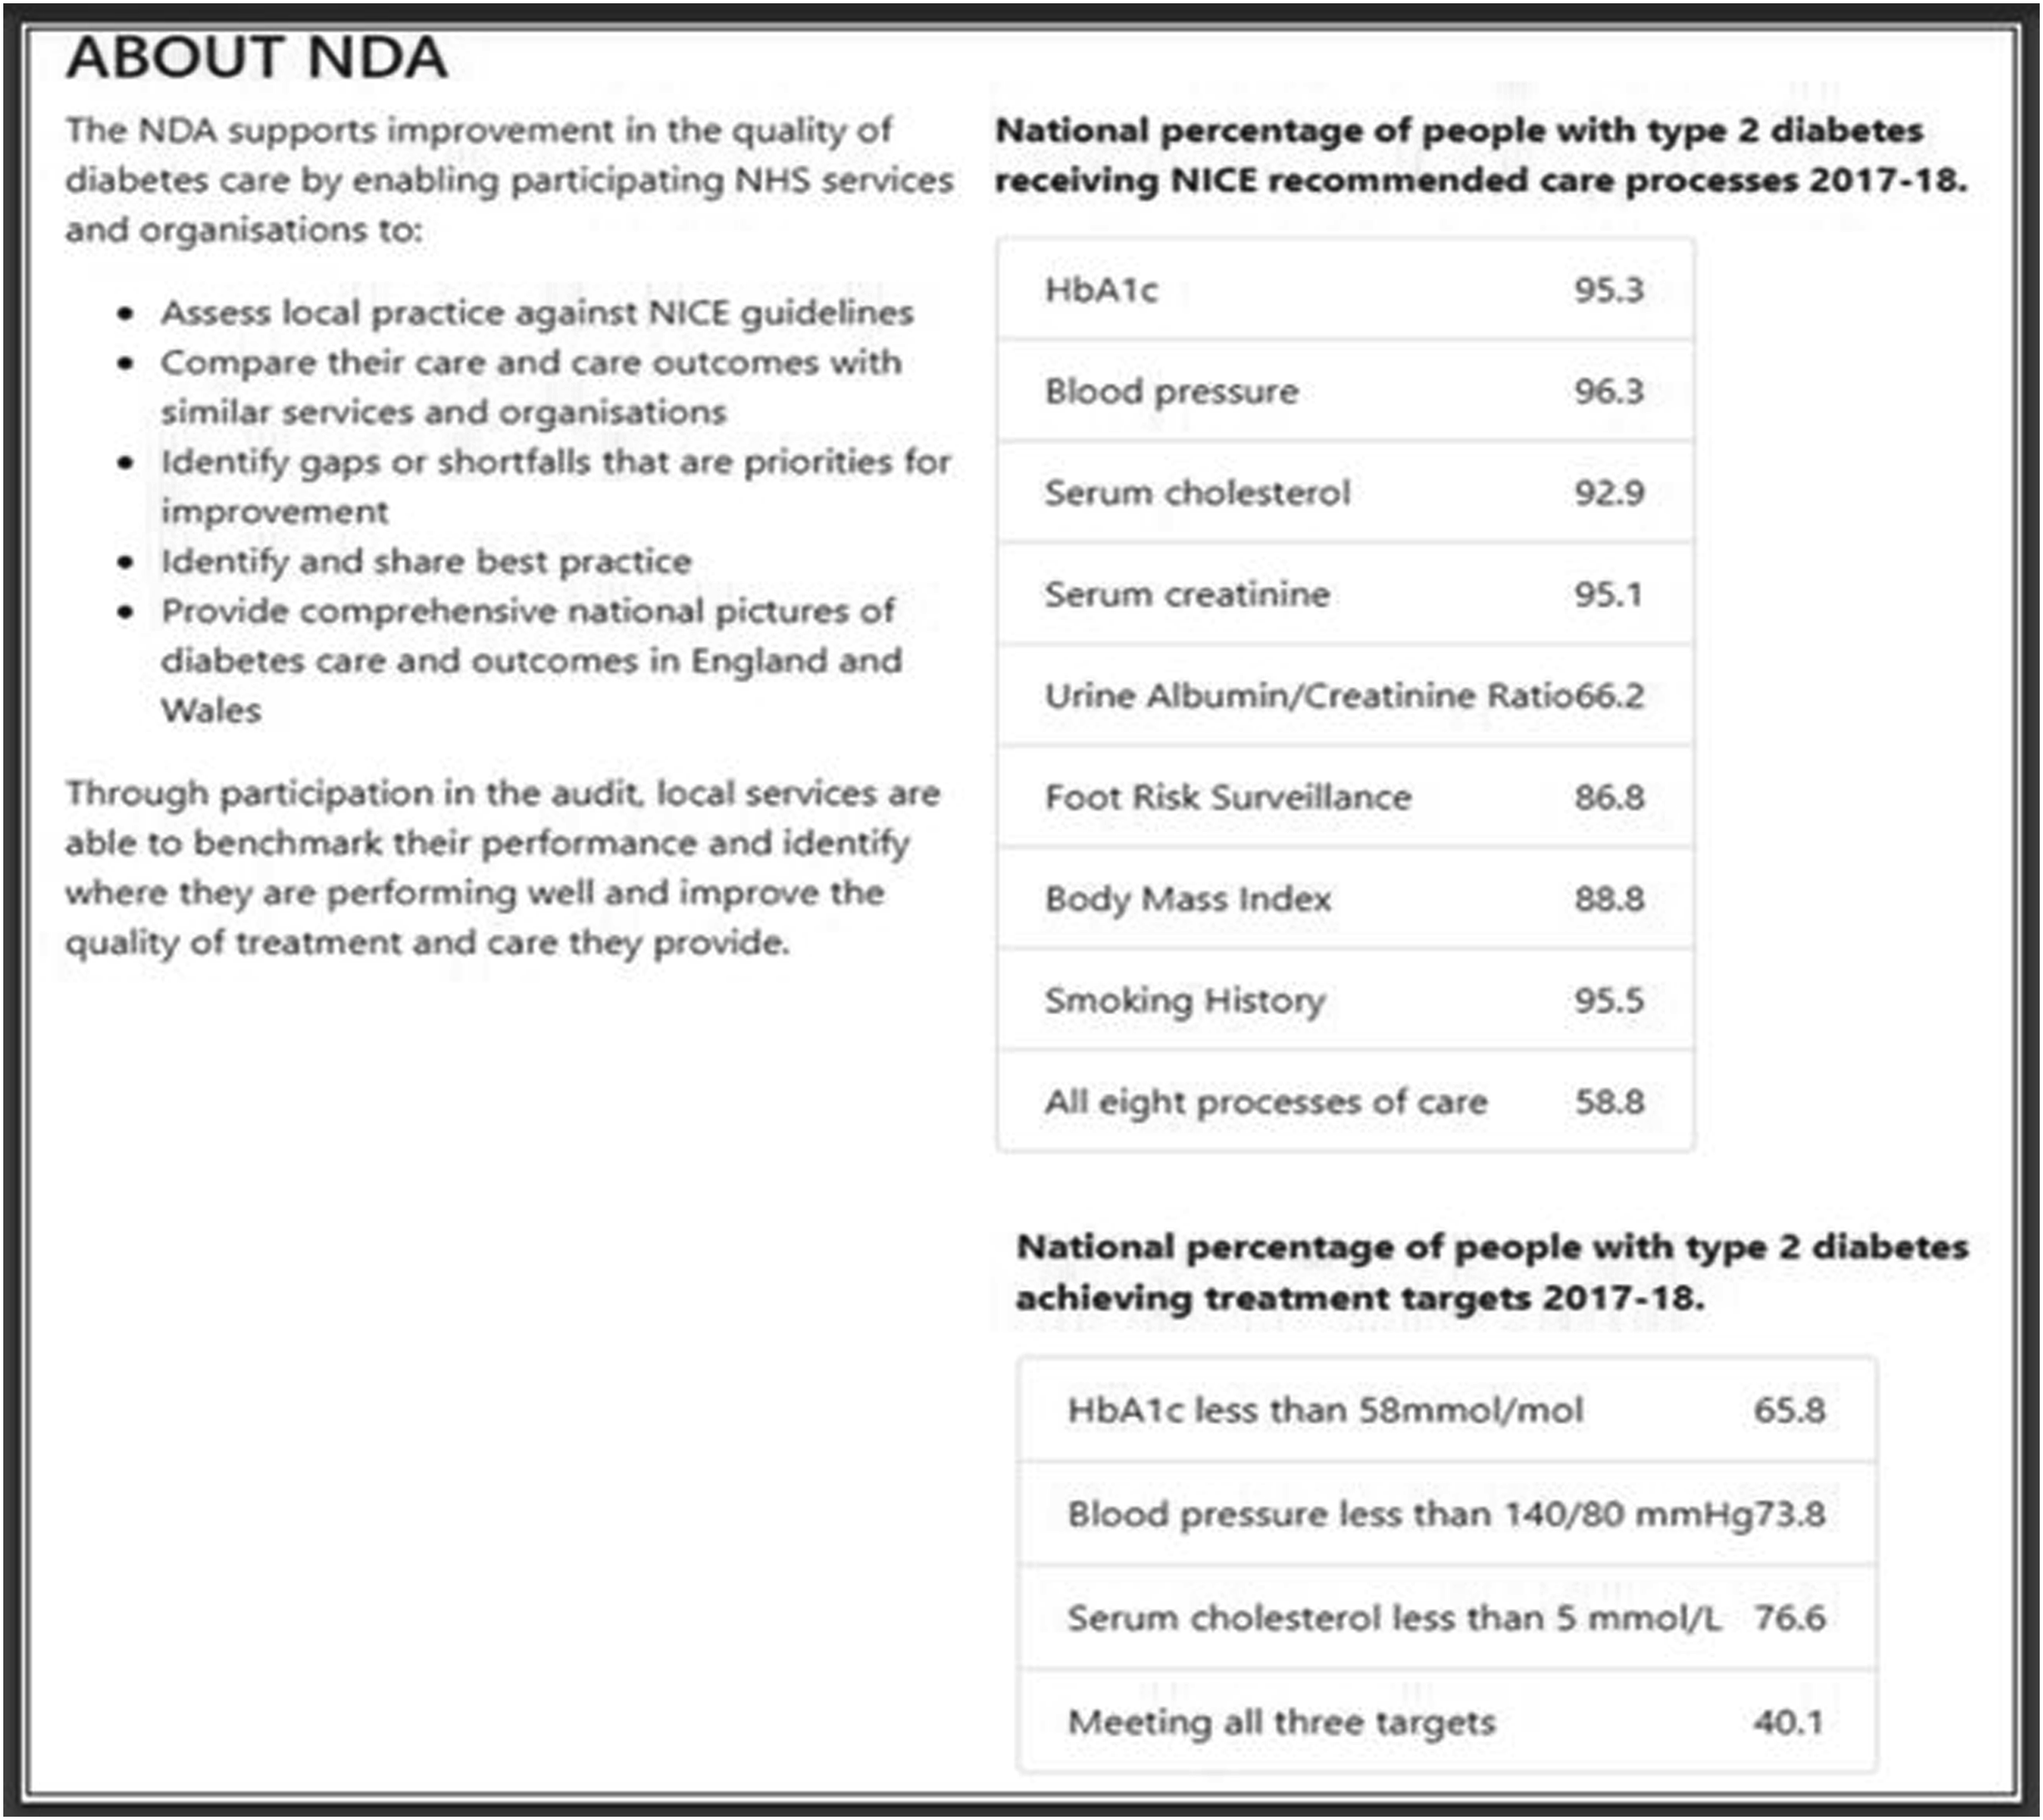
Feedback technique: Incorporate the patient voice
We created a ‘patient voice’ section for the ON version of this feedback technique, with the absence of the section as the OFF version. Round 1 explored using a series of quotations as the patient voice with content that was shaped by four behaviour change techniques: (1) feedback relating to the consequences of clinicians’ actions, or clinical care received, compared with recommended practice; (2) anticipated regret for failing to provide care according to recommended practice; (3) opportunity to observe rewards or punishments experienced by other providers when recommended practice is followed or not; and (4) addition of patient quotes suggesting satisfaction with receiving recommended practice. 21
During round 2, low levels of agreement were found amongst participants regarding the value of including the ‘patient voice’ in feedback. Participants also talked about the challenges, including the importance of maintaining patient confidentiality, the difficulty of finding quotes that are representative and the risk of bias arising from using a single quote. Participants also felt their response would differ according to their healthcare role: “I’m thinking about how … Senior managers work; how executive directors work and are they influenced by patients’ statements […] they aren’t, but the CQC [Care Quality Commission] are and […] the exec’ directors are”.
Participants reported that multimedia features (images and videos) captured attention, added context and made feedback more memorable, noting that these features should be authentic and relevant to the feedback. The final design in round 3 therefore consisted of a short, specific, fictitious, patient story, photograph and a quote related to the audit standard (Figure 4). Round 3 ON version of feedback technique ‘incorporate the patient voice’, using a fictitious story.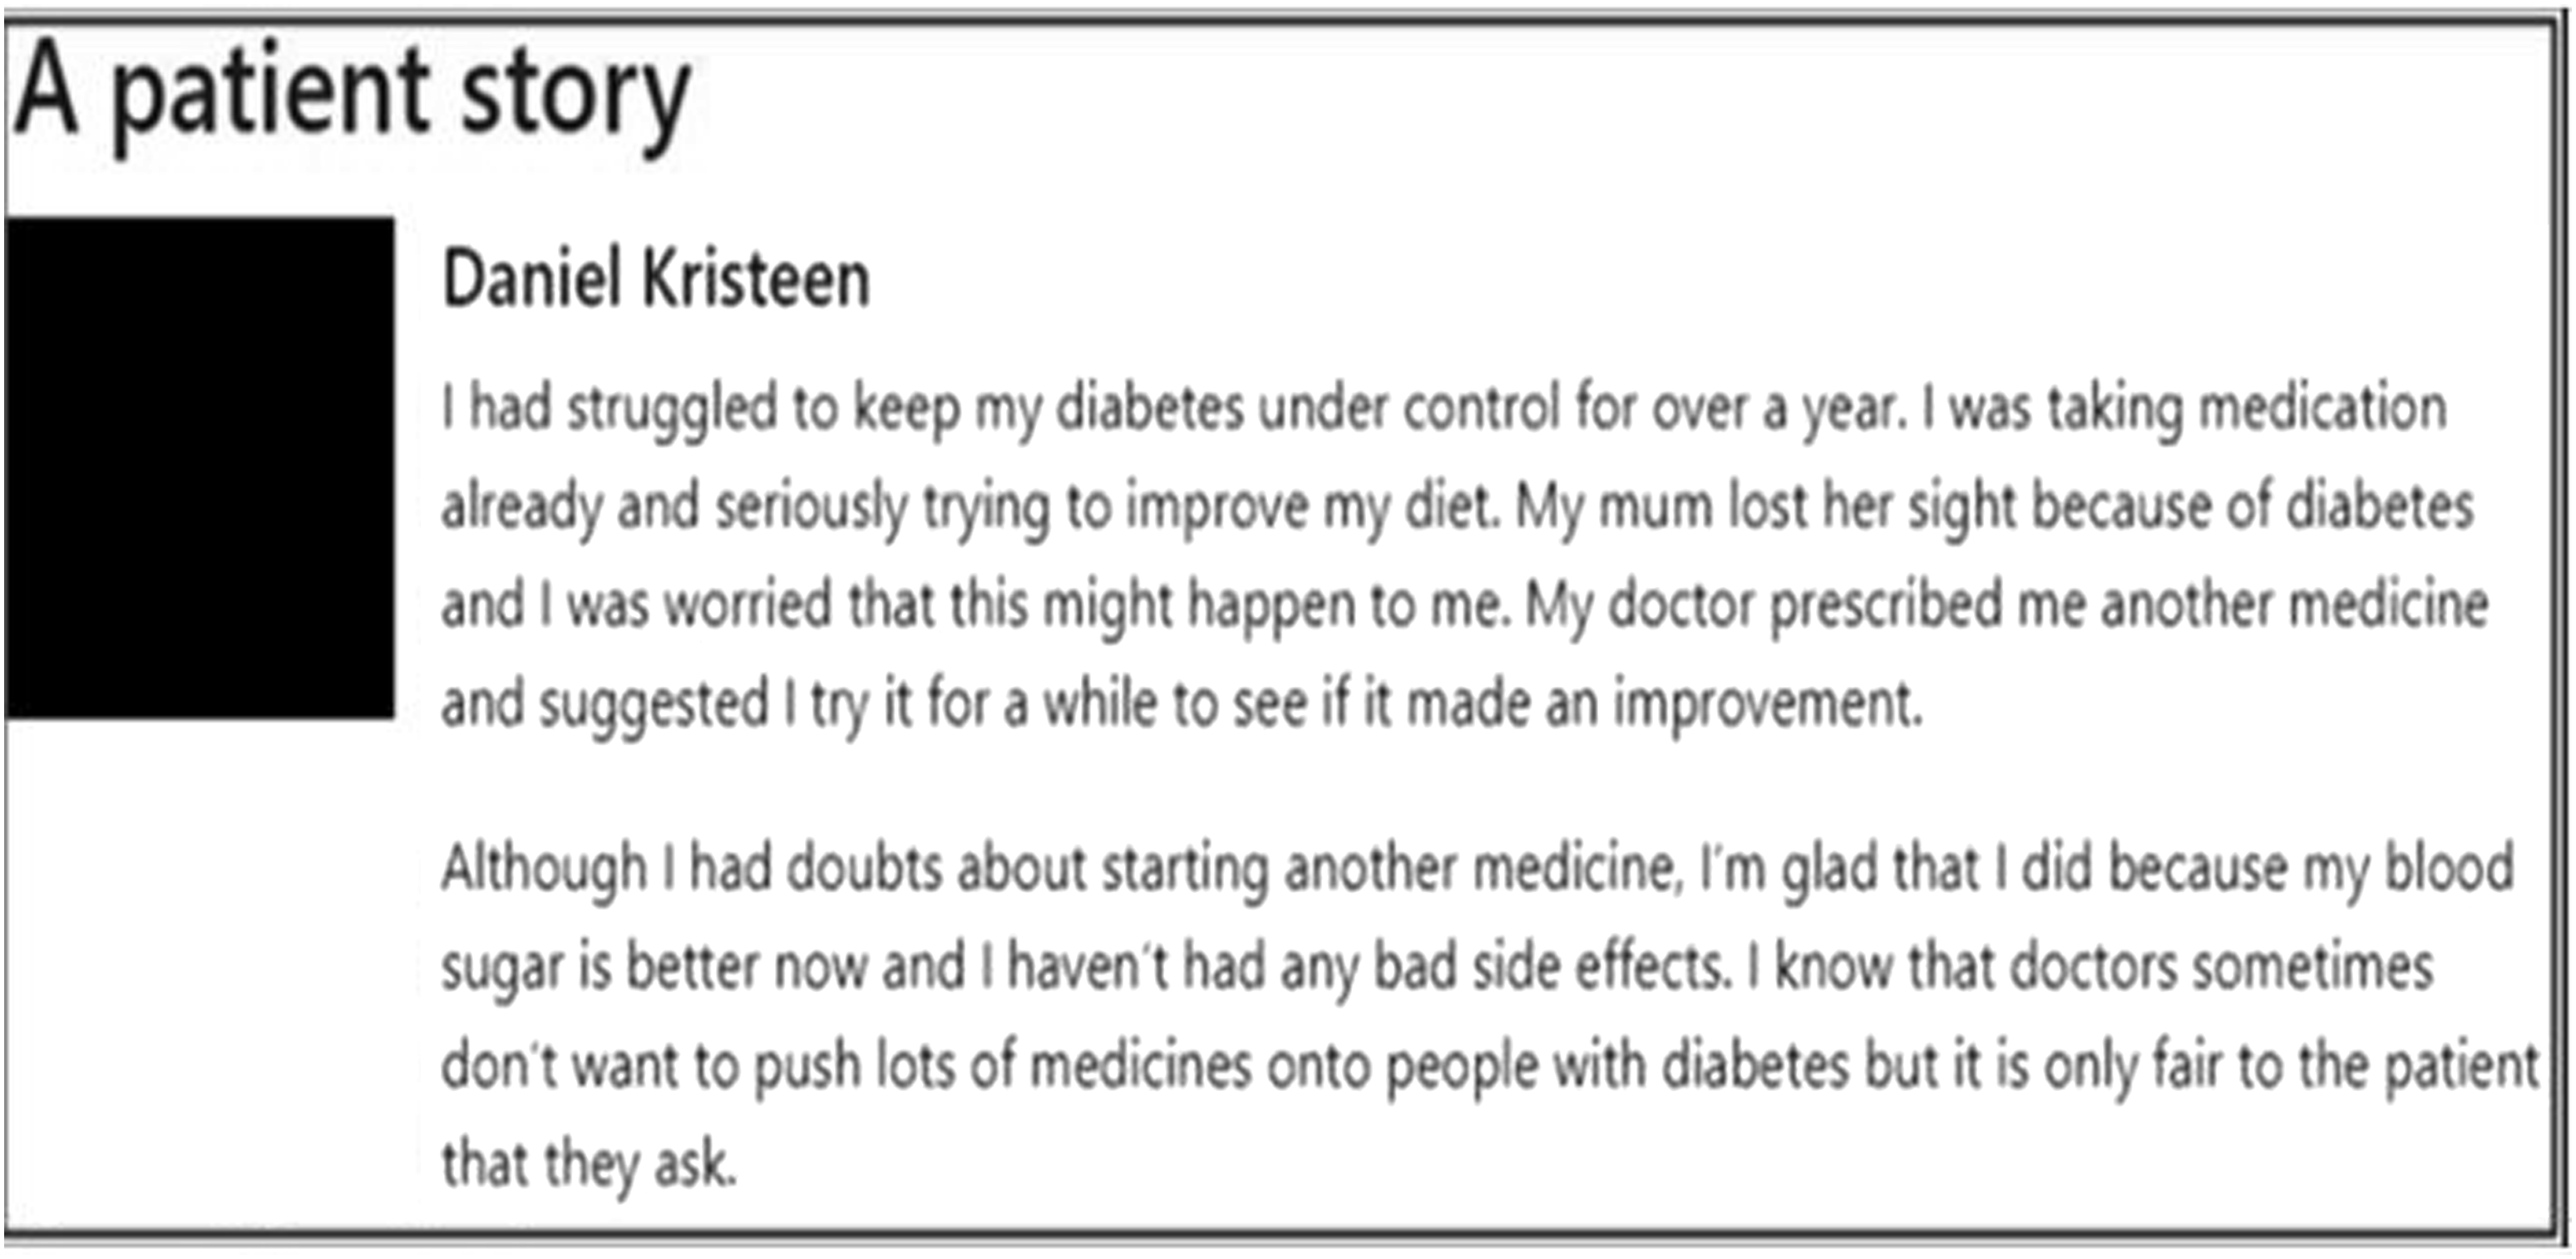
Summary of the expert review outcomes
After the three rounds of iterative usability testing, an expert design review was conducted to check visual consistency, visual and textual content, browser inconsistencies and usability issues (e.g., difficult navigation between screens). Eight project team members and the PPI panel conducted the review.
A total of 139 issues were identified. 22 These were collated into a single document and addressed. The issues identified fell into three main categories: functionality (n = 40; e.g. ability to click through pages), editorial content (n = 56; e.g. typos), and aesthetics (n = 43; e.g. position of textual content on the page). 21
Discussion
The work reported here builds on recent research regarding the role of UCD in enhancing the design of feedback techniques for use in A&F interventions.6,8,23 Specifically, the UCD process aimed to ensure both usability of the designs and fidelity to the original feedback techniques. Six feedback techniques were selected, and we created an enhanced (ON) version and a standard (OFF) version for each one. The designs were templates which we then instantiated with content for five audits. Suggested choices for the feedback techniques were based on previous empirical and theoretical research findings, as well as the involvement of expert and PPI panel judgement.5,9 Fidelity was assessed throughout the process, including through expert review. Study findings should therefore be of value for the design of future online feedback techniques for A&F interventions. 2
Our approach to designing feedback techniques for an online screening experiment has advantages over earlier approaches and could potentially be explored for other online studies seeking to optimise healthcare quality improvement materials. Co-creation workshops enabled idea generation, paper and wireframe prototypes encouraged exploration of alternative design ideas and usability testing sessions provided greater understanding of ways to optimise the effects of feedback techniques10,24 and supported us in clarifying theoretical constructs and behavioural change theories. 15 The interactive prototypes enabled participants to engage fully with online feedback materials.3,24
Our formative work lent insights into why key improvements to feedback are not consistently applied to national clinical audits, 25 such as the challenges associated with developing personalised recommendations. 26 It also delivered findings about ways of operationalising feedback techniques. For example, participants reported that multimedia features engaged their attention yet raised concerns about privacy implications (see10). Similarly, participants identified challenges associated with the use of standardised recommendations, with personalised recommendations (e.g., for particular healthcare professional roles) being viewed as more actionable – a finding previously reported by others. 10 UCD methods applied in this study made participants’ reasoning processes more explicit, leading to a better understanding of how they engaged with feedback techniques, and how they deliberated on a combination of factors before accepting or rejecting different feedback techniques (e.g., feedback in more than one way). 27 Knowledge generated from this study increases our understanding about the dynamic interrelationships between healthcare profession’s working practices, A&F outcomes, and feedback techniques used.
Incorporating UCD methods within the MOST approach enabled the research team to further understand the contextual factors, usability, comprehension, and operational dynamics shaping the ways in which healthcare professionals engaged with feedback techniques. For example, both the co-creation workshops and usability testing sessions enabled developers to explore different ways of implementing the ‘patient voice’ to help identify which could generate the most positive action relating to healthcare performance. Further, the MOST approach provided guidance on the development of online experiments for A&F interventions (i.e., piloting potential intervention components through usability testing). Usability testing also provided insights into the interactive dynamics between users’ perceptions of feedback and their mechanisms of action in response to different feedback techniques. For instance, interviews revealed that traditional bar charts used in A&F reports can be open to misinterpretation, having an effect on the types of actions implemented. Such findings draw attention to issues regarding comprehension of content and visual representations used, and emerging design challenges that warrant further research (e.g., cognitive load).8,25, 28
Finally, a key strength of this study was the collaborative partnership between researchers, National Clinical Audits, study participants and the PPI panel throughout the feedback technique design process, drawing on previous behavioural change, UCD and earlier experiences of research–practice partnerships. This provided several benefits. For instance, researchers shaped the experimental design, and the application of behaviour change theories and models. 26 The PPI panel helped to design quotes used in operationalising the feedback technique ‘incorporate the patient voice’. Research–practice partnerships, such as this study presents, provide opportunity for developing a shared cognitive space around which co-creation activities can be organised. Furthermore, collaborative design approaches foster further benefits. These include aligning priorities and common goals, building long-lasting partnerships through collective leadership, diplomacy, and empowerment.2,12,26 It also enabled the fast tracking of what feedback techniques to test in ‘real world’ settings overcoming the challenges associated with it being impossible to test every possibility.
Study limitations
We acknowledge several limitations. First, the design of the feedback techniques was constrained by what it was feasible to deliver online and the requirements of the planned online experiment. Second, a limited number of participants were recruited to the usability testing sessions. This meant that some prototypes were explored by just one participant before our agile UCD process, typical of ‘in the wild’ methods, iterated to the next version. This may have skewed design decisions towards the preferences of those individuals and the needs of their associated roles and audits. Furthermore, some participants evaluated prototypes populated with content from an audit that was not the one with which they were associated, because it was not feasible to produce prototypes of content for all audits in every round of testing.
Conclusions
This study utilised User-Centred Design and Multiphase Optimization Strategy approaches to design feedback techniques for an online A&F experiment. We have demonstrated the various stages of our approach and highlighted how it not only delivered usable designs but also broader insights into practitioners’ perspectives on feedback. We highlight lessons on ways to engage with partners, considering feasibility of online A&F feedback delivery, and usability over traditional approaches. These techniques could also be applied to the design of other digital interventions.
Supplemental Material
Supplemental Material - Improving audit and feedback: A user-centred approach to designing feedback techniques for an online experiment
Supplemental Material for Improving audit and feedback: A user-centred approach to designing feedback techniques for an online experiment by Valentine Seymour, Ana Weller, Thomas A. Willis, Mohamed Althaf, Mohamed Althaf, Jill J. Francis, Fabiana Lorencatto, Alexandra Wright-Hughes, Rebecca E. A. Walwyn, Sarah L. Alderson, Benjamin C. Brown, Jamie Brehaut, Heather Colquhoun, Noah Ivers, Justin Presseau, Amanda J. Farrin, Robbie Foy, Stephanie Wilson in Health Informatics Journal.
Footnotes
Author Notes
The authors confirm contribution to the paper as follows: study conception and design: Valentine Seymour, Ana Weller, Thomas A Willis, Mohamed Althaf, Jill J Francis, Fabiana Lorencatto, Alexandra Wright-Hughes, Rebecca EA Walwyn, Sarah L Alderson, Benjamin C Brown, Jamie Brehaut, Heather Colquhoun, Noah Ivers, Justin Presseau, Amanda J Farrin, Robbie Foy, and Stephanie Wilson; data collection: Valentine Seymour, Ana Weller, Mohamed Althaf, Stephanie Wilson, Robbie Foy, and Thomas A Willis; analysis and interpretation of results: Valentine Seymour, Ana Weller, Mohamed Althaf, Stephanie Wilson, Robbie Foy, and Thomas A Willis. Author; draft manuscript preparation: Valentine Seymour, Stephanie Wilson, Robbie Foy, and Thomas A Willis. All authors reviewed the results and approved the final version of the manuscript.
Acknowledgements
Thank you to our project steering committee: Paula Whitty, Paul Carder, Chris Dew, Roy Dudley-Southern, Steven Gilmour, Mirek Skrypak, and Laurence Wood. We thank our patient and public involvement panel, comprising Pauline Bland, Allison Chin, Susan Hodgson, Gus Ibegbuna, Chris Pratt, Graham Prestwich, Martin Rathfelder, Kirsty Samuel, and Laurence Wood. We are also grateful for the support of the five national clinical audits that are featured in this research, and particularly, we wish to thank Antoinette Edwards and Fiona Lecky from TARN and John Grant-Casey for the support from the NCABT.
Author Contributions
Robbie Foy, Stephanie Wilson, Jill J Francis, Thomas A Willis, Fabiana Lorencatto, Alexandra Wright-Hughes, Rebecca EA Walwyn, Sarah L Alderson, Benjamin C Brown, Jamie Brehaut, Heather Colquhoun, Noah Ivers, Justin Presseau, and Amanda J Farrin conceived and planned the research project. Valentine Seymour, Thomas A Willis, and Ana Weller carried out the data collection and analysis. Ana Weller and Mohamed Althaf developed the online feedback prototypes and experiment platform. Robbie Foy, Stephanie Wilson, Jill J Francis, Thomas A Willis, Fabiana Lorencatto, Alexandra Wright-Hughes, Rebecca EA Walwyn, Sarah L Alderson, Benjamin C Brown, Jamie Brehaut, Heather Colquhoun, Noah Ivers, Justin Presseau, Amanda J Farrin Valentine Seymour, and Ana Weller contributed to the interpretation of the results. Valentine Seymour, Thomas A Willis, Stephanie Wilson and Robbie Foy took the lead in writing the manuscript. All authors provided critical feedback and helped shape the research, analysis and manuscript.
Declaration of conflicting interests
The author(s) declared no potential conflicts of interest with respect to the research, authorship, and/or publication of this article.
Funding
This project was funded by the National Institute for Health Research (NIHR) Health Services & Delivery Research programme (project reference 14/04/13). The views expressed are those of the authors and not necessarily those of the NIHR or the Department of Health and Social Care. The funding body had no role in the design of the study, the collection, analysis and interpretation of the data, nor the preparation of the manuscript.
Ethical statement
Supplemental Material
Supplemental material for this article is available online.
References
Supplementary Material
Please find the following supplemental material available below.
For Open Access articles published under a Creative Commons License, all supplemental material carries the same license as the article it is associated with.
For non-Open Access articles published, all supplemental material carries a non-exclusive license, and permission requests for re-use of supplemental material or any part of supplemental material shall be sent directly to the copyright owner as specified in the copyright notice associated with the article.