
Abstract
Introduction
A mechanical ventilator is a mechanical machine that overcomes the issue of patient breathing (ventilate) during critical illness. 1 The ventilator is utilized when a patient cannot breathe naturally and independently due to severe illness or syndrome like COVID-19. 2 The ventilator is connected to the patient using a hollow tube (artificial airway). The ventilator supply tube helps pump the air into the patient’s lungs. The ventilator saves the patient’s lives by giving them enough oxygen to the body and improving their breathing mechanism. Although the ventilator has a significant role in saving precious lives, it is also associated with many life risks. During the ventilation process in the ventilator, the air is pumped into the patient’s lungs based on the air pressure. 3 The low or high intensity of ventilator pressure can result in a patient’s life loss. The high air pressure intensity in the ventilator causes the patient lung damage. To detect the ventilator pressure, an artificial intelligence-based system must be attached to the ventilator to alert the high or low air pressure. The air pressure in the ventilator can be controlled using the artificial intelligence-based system alert to save a patient’s life risk.
Mechanical ventilation with correct air pressure is highly required for patients during COVID-19 illness to save them from respiratory distress syndrome and lung injury. According to a recent report, the reported mortality rate is 50% to 65% 4 in patients with COVID-19 syndrome in the intensive care unit (ICU). With COVID-19 illness, 97% of patients require intensive mechanical ventilation support. The studies have shown that the pandemic mortality rate was 100% amongst patients on invasive mechanical ventilation. 5 The patient’s mortality on invasive mechanical ventilation was reported as 97% in China, 6 88.6% in New York, 7 43% in the UK, 8 31% in Spain, 9 88.8% in Australia, 10 and between 40 and 60% in India. 11 However, with later developments in ventilators, the fatality rate is reported to be reduced to 40%.12,13 Despite that, a proper ventilator with normal air pressure is a crucial need for patients.
Machine learning and deep learning-based techniques are the domains of artificial intelligence that are utilized for ventilator pressure prediction in this research study. The artificial intelligence-based systems are trained on historical data, and a predictive system is formed to predict the target values for unseen data. The main motive of artificial intelligence-based techniques is to find the patterns or relationships in data and learn from them to predict unseen data. Machine learning and deep learning-based techniques achieve high-performance accuracy results in medical data predictions.
14
Nowadays, artificial intelligence-based techniques have many applications. They are most commonly used in bioinformatics for diagnosing patients, MRI-based image processing, drug discovery,
15
and many more. The following are our research key contributions to ventilator pressure prediction • A novel hybrid ventilator pressure predictor (H-VPP) approach is proposed based on a hybrid of decision tree regressor (DTR) and random forest regressor (RFR). The approach is applied to the historical data to predict the ventilator pressure prediction for COVID-19 patients. • The ventilator exploratory data analysis (VEAA) is applied to determine the data patterns and valuable insights from the ventilator dataset. The VEAA is applied to determine the significant factors associated with the high or low pressure in the ventilator. • For performance evaluation of the proposed approach, several machine learning and deep learning-based models are employed in this study. Such models include multilayer perceptron (MLP), linear regression (LR), DTR, RF, stochastic gradient descent regressor (SGDR), Bayesian ridge (BR), and light gradient boosting machine regressor (LGBMR). In addition, recurrent neural networks (RNN), long short-term memory (LSTM), and gated recurrent units (GRU) are also applied for experiments. • The regression performance metrics mean absolute error (MAE), median absolute deviation (MAD), mean squared error (MSE), root mean squared error (RMSE), R-squared (R2) score, adjusted R2 score, and variance are used for evaluating the performance of adopted models. The regression analysis is applied based on the mapping difference between target predictions and actual values of pressure.
The remainder of this research study is divided into four sections. Section ”Related work” is based on the related literature analysis and past applied state of art studies analysis. The study methodology is examined in the Section ”Methodology”. It also contains the details of the employed machine learning and deep learning models. The results and discussions are given in the Section ”Results”. Section ”Conclusion” provides the conclusion of the study.
Related work
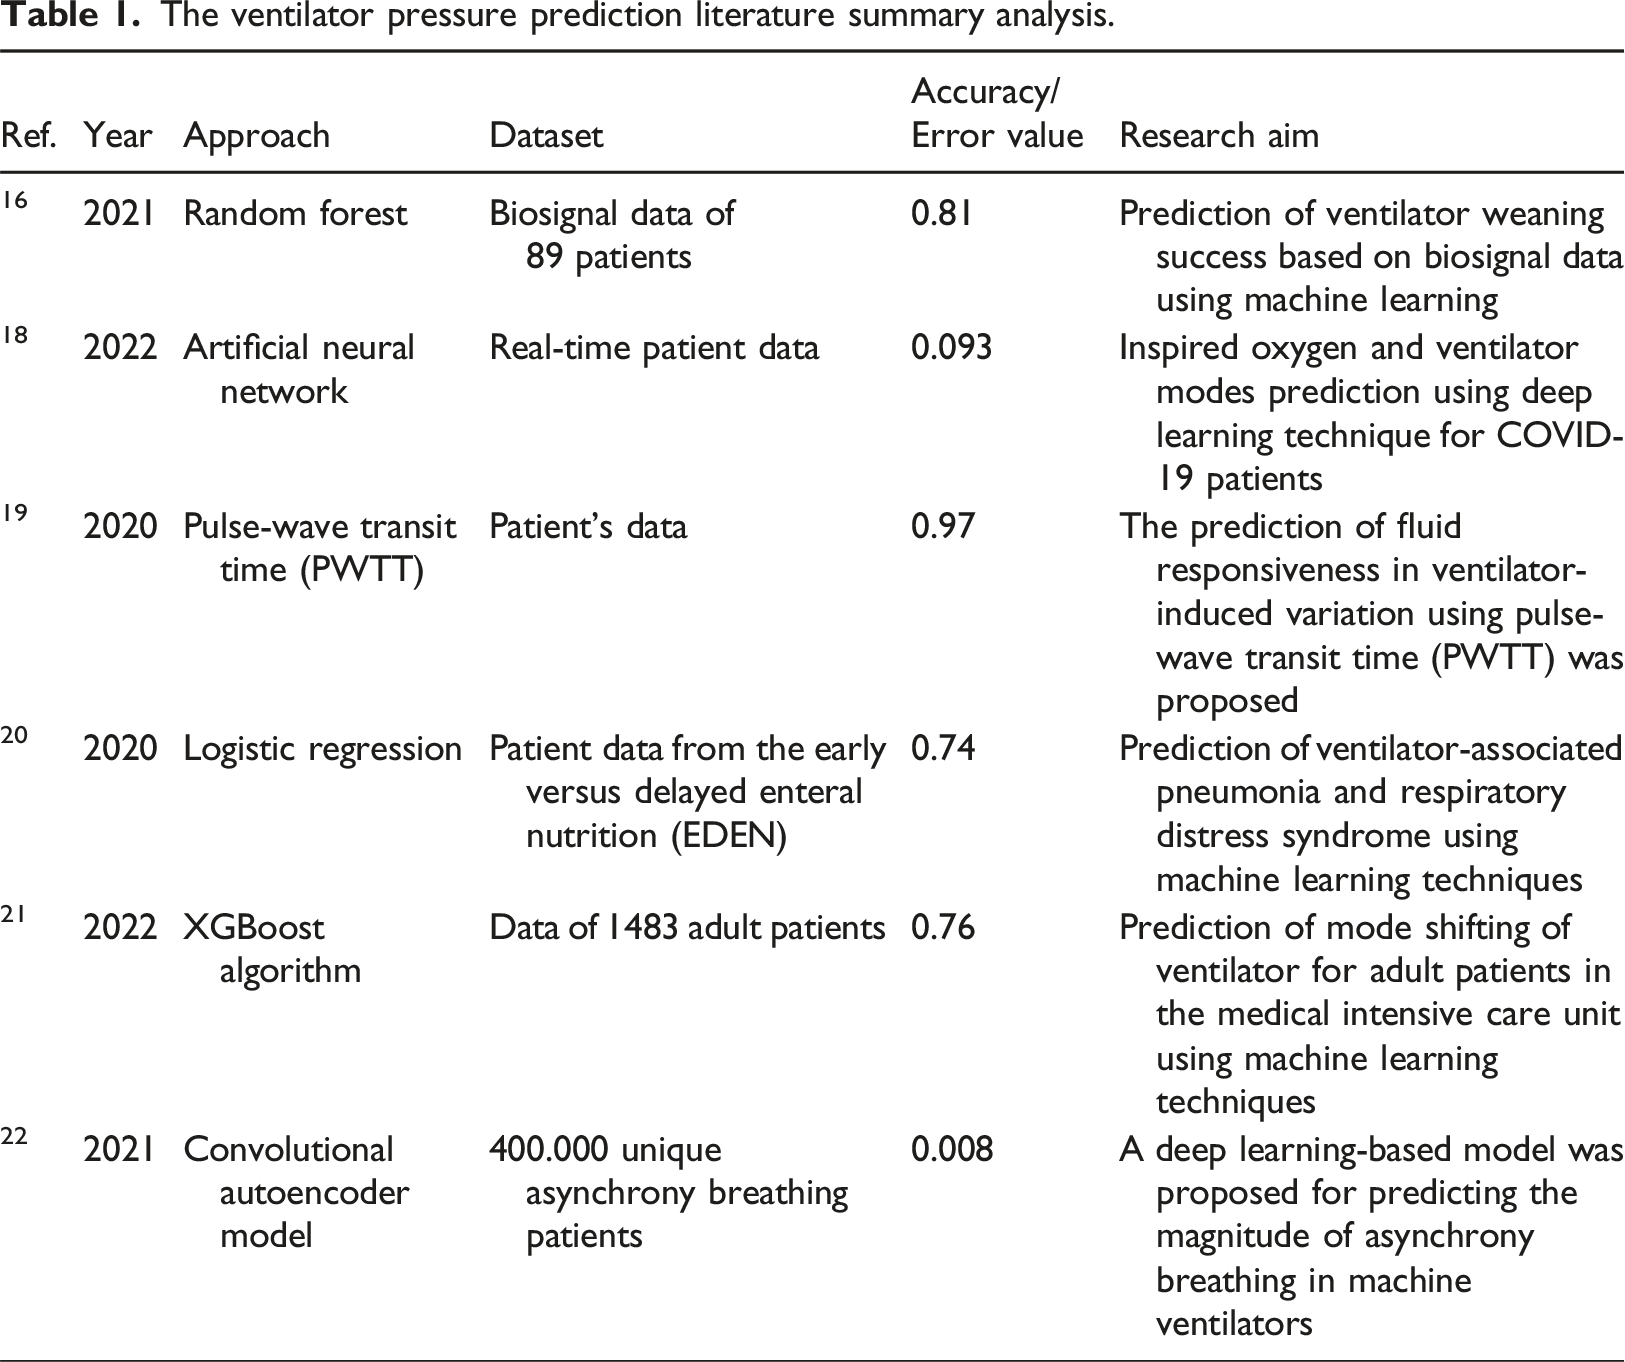
This section is based on the related literature to the current study. The past applied state-of-the-art studies are examined for ventilator pressure prediction along with the proposed techniques and performance evaluation parameters.
The prediction of ventilator weaning success based on biosignal using machine learning was proposed in 16 . The biosignal data of 89 patients were utilized for model building and evaluations. The RF classifier was proposed to predict ventilator weaning failure. The performance evaluation is done by bootstrapping. 17 The proposed model achieved a 0.81 accuracy score of the receiver operating characteristic curve (ROC) with 95% confidence. The inspired oxygen prediction and ventilator modes prediction for COVID-19 patients were proposed in 18 which followed a deep learning approach. The proposed approach for the prediction task was the artificial neural network developed using Python programming. The model building was based on real-time patient data. The proposed model achieved a mean square error of 0.093 and an R-value of 0.81.
The authors proposed the prediction of fluid responsiveness in ventilator-induced variation in 19 . The patient’s data was utilized for model building and evaluations. The pulse-wave transit time (PWTT) technique was utilized to predict fluid responsiveness. A 0.97 accuracy score for RoC is obtained with a p value less than 0.0001 by the proposed PWTT technique. The prediction of ventilator-associated pneumonia and respiratory distress syndrome using machine learning techniques was proposed in 20 . The patient data from the Early versus delayed enteral nutrition (EDEN) was utilized for machine learning model building and evaluations. The multivariate binary logistic regression was the proposed approach for the prediction task. The proposed model achieved a 0.74 accuracy score for the ROC curve while the p value is 0.185.
The prediction of mode shifting of the ventilator for adult patients in the medical intensive care unit using machine learning technique was proposed by. 21 The data of 1483 adult patients were utilized for model training and testing. A modified XGBoost algorithm was used for experiments. The proposed model achieved a 0.76 accuracy score for the ROC curve. The authors proposed a deep learning-based model for predicting the magnitude of asynchrony breathing in machine ventilators in 22 . Data of 400,000 unique asynchrony breathing patients are utilized for model building. The convolutional autoencoder model is used to carry out experiments. The proposed model achieved a 0.008 median validation error using the K-fold analysis.
The study 23 introduces a multi-task Gaussian-based neural network designed to predict the need for mechanical ventilators in COVID-19 patients. The study proposes a robust real-time prediction model to determine the likelihood of in-hospital COVID-19 patients requiring mechanical ventilation (MV). This end-to-end neural network model integrates the Multi-task Gaussian Process to manage irregular sampling rates in observational data and employs a self-attention neural network for the prediction task. The proposed model was evaluated using a large dataset of 9532 nationwide in-hospital COVID-19 patients, achieving an area under the receiver operating characteristic curve (AUROC) score of 0.79 and an area under the precision-recall curve (AUPR) score of 0.39. While the performance of the proposed method is moderate, further performance enhancement strategies are necessary.
The ventilator pressure prediction literature summary analysis.
Methodology
This section describes the proposed approach in detail, along with a description of the machine learning models used for experiments and the dataset. The architecture of the proposed methodology is illustrated in Figure 1. Patients’ ventilator breath time series data is utilized for research model building and evaluations. The ventilator exploratory data analysis (VEAA) is applied to obtain the data patterns and insights that are the primary cause of low or high ventilator pressure. The dataset normalization is applied to transform the dataset into a unit share, achieving the best performance scores. The dataset is split with a ratio of 0.8 to 0.2, where 80% of the dataset is used for training the employed models while 20% is used for testing. We also used the GroupKFold validation split approach for results validation. The proposed predictive model is trained and tested on the ventilator dataset. The architectural analysis of proposed methodology for ventilator pressure prediction.
Dataset
The ventilator breaths time-series data
24
of patients was produced using a modified open-source ventilator
25
connected to an artificial bellows test lung
26
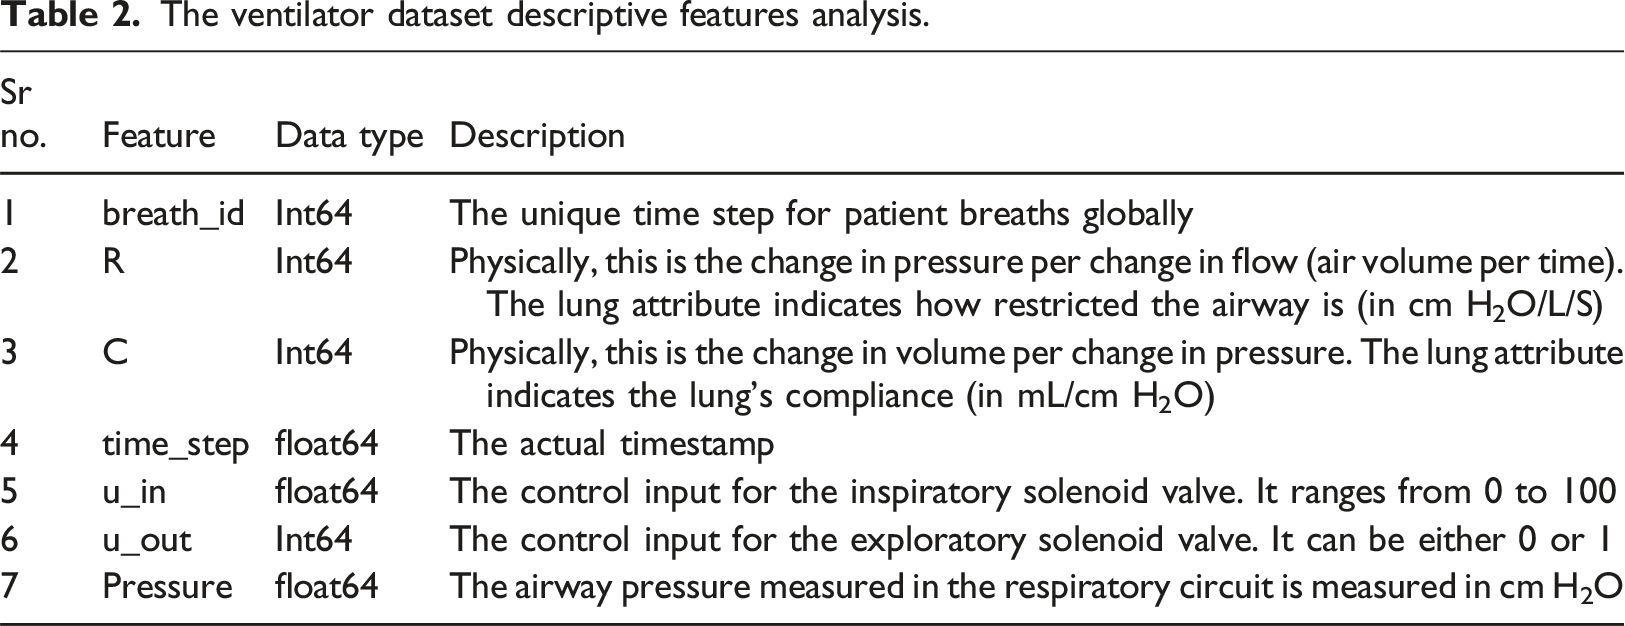
using a respiratory circuit. The time-series data represents an approximately three-second breath. Each row in the dataset is a time step in a breath and gives the two control signals. The control signals are relevant attributes of the lung and the resulting airway pressure. The dataset-related feature descriptive analysis is presented in Table 2. It shows the details of the attributes, attribute types, and related descriptions. • R - lung attribute indicating how restricted the airway is (in cm H2O/L/S). Physically, this is the change in pressure per change in flow (air volume per time). Intuitively, one can imagine blowing up a balloon through a straw. We can change R by changing the diameter of the straw, with higher R being harder to blow. • C - lung attribute indicating how compliant the lung is (in mL/cm H2O). Physically, this is the change in volume per change in pressure. Intuitively, one can imagine the same balloon example. We can change C by changing the thickness of the balloon’s latex, with higher C having thinner latex and easier to blow. • Pressure - the airway pressure measured in the respiratory circuit, measured in cm H2O. The ventilator dataset descriptive features analysis.
Ventilator exploratory data analysis
The VEDA is a crucial process of determining hidden data patterns, hypotheses, assumptions, and cussing factors. The VEDA is based on the summary of graphical representations and statistics on data to discover patterns. The VEDA contains statistical data analysis, graphs, and charts. The VEDA helps us in our research study to find out several factors that cause high or low pressure in ventilators.
The statistical features analysis of the employed research dataset.

The time series analysis based on the pressure, u_in, and u_out features using the different sample values of lung attributes breath_id, R, and C is analyzed in Figure 2. The analysis demonstrates that at the time steps 0 to 1, the ventilator pressure and inspiratory solenoid valve control values are high. The ventilator pressure is high when the value of R and C features is above 20. The analysis shows that after time step value 1, the pressure remains normal. This analysis shows that the ventilator pressure and inspiratory solenoid valve have high values during the initial time step values. The values of lung attributes R and C above 20 also increase the ventilator pressure. The effects of breath_id with lung attributes R and C on ventilator pressure are analyzed in time series analysis.
The joint plot regression analysis based on 1000 data points is examined in Figure 3. A joint pilot is based on three data plots. The first is a bivariate graph representing the regression distribution between the data of two involved variables. The second graph is placed at the top of the bivariate graph horizontally and represents the distribution of the x-axis feature. The third graph is assigned on the right side of the main bivariate graph vertically and represents the distribution of the y-axis feature. The joint plot regression analysis has the univariate and bivariate graphs together to summarize patterns in data distributions. The joint plot regression analysis of the features u_in and u_out with the ventilator pressure feature, (a) The inspiratory solenoid valve control input analysis with pressure, and (b) The exploratory solenoid valve control input analysis with pressure.
Figure 3(a) analyzes the bivariate regression data distribution between the u_in and pressure feature. The time step unit represents an approximately three-second breath. Each row in the dataset is a time step in a breath and gives the two control signals. The control signals are relevant attributes of the lung and the resulting airway pressure. The bivariate regression analysis demonstrates the strength of correlation between features and indicates that u_out – pressure has a 0.61 correlation while u_in - pressure has a 0.31 correlation. The bivariate density curve shows that when the pressure values are between 0 and 30, the u_in has a strong distribution relationship. The regression line is also drawn among the data distributions. This analysis represents a high relationship between u_in and the pressure feature. The bivariate regression data distribution between the u_out and pressure feature is analyzed in Figure 3(b). The analysis represents that the regression line goes negative, which shows that the u_out and pressure features have less relationship strength. The bivariate density curve shows that when the pressure values increase, the u_out has the same value.
The correlation analysis between the dataset features is examined in Figure 4. The analysis demonstrates that all correlation values are positive. The high correlation between the u_out and time_step feature is 0.84 followed by the correlation values of 0.61 between the pressure and u_out feature. This analysis represents that the dataset features have good correlation values, which are best for learning techniques training for ventilator pressure predictions. The correlation analysis among the ventilator dataset features used for pressure prediction.
Normalize dataset
The data normalization is applied to transform all dataset feature data into a unit sphere. The min-max scaler is utilized for ventilator data scaling and normalization. The min-max scaler transforms the feature values into a unit variance scaling range. This min-max scaler scales and translates each feature individually as it is in the given range on the dataset; for example, the scale ranges between one and zero. The data normalization in this research improves the performance of employed learning techniques.
MinMaxScaler is a widely employed data preprocessing technique in machine learning. This normalization helps mitigate the influence of outliers and varying scales among different features, promoting improved model performance. MinMaxScaler preserves the relationships between data points, ensuring that the overall structure and patterns within the dataset remain intact. In summary, the advantages of MinMaxScaler include its ability to normalize data, mitigate the impact of outliers, preserve relationships between data points, and its simplicity of implementation. These attributes collectively make MinMaxScaler a valuable tool in the preprocessing toolbox, enhancing the performance and interpretability of machine learning models across diverse applications.
Dataset splitting
The data splitting is required for the training and testing of employed machine learning models. The dataset splitting is needed to split the data into train and test subsets where the test subset is used to validate the models on unseen test data. The dataset splitting is performed to split the ventilator dataset for training and testing. The splitting ratio is 0.8 to 0.2 for training and testing, respectively.
Employed learning techniques
The applied machine learning and deep learning-based techniques for ventilator pressure prediction are detailed in this section. A total of ten state-of-the-art advanced machine learning and deep learning techniques are employed to predict ventilator pressure. Artificial intelligence (AI) has been widely used in the medical domain over the past decade. 27
As the data in the medical is increasing exponentially, the issues of extracting valuable insights from data arise. Machine learning and deep learning models are involved in the predictive process in this regard. The typical applications of AI systems are biology, 28 disease diagnosis, virtual nursing assistant, enhanced gene editing, proteomics, genomics, microarrays, bioinformatics29–32 and many more. The AI systems solve the problem of obtaining valuable insights from large biological datasets. The machine learning models utilize less computation power as compared to deep learning. Deep learning handles big data efficiently and is mainly used for vision-based applications like image classification in MRI, 33 wireless capsule endoscopy. 34 This study utilizes machine learning and deep learning approaches for predicting ventilator pressure. A brief description of employed state-of-the-art machine learning and deep learning techniques is presented here.
Multilayer Perceptrom MLP 35 is a family of feed-forward neural networks. MLP architecture contains the input, output, and hidden layers to process the input data. MLP utilizes backpropagation 36 techniques during training. The MLP can be used for both classification and regression problems.
Logistic Regression LR 37 is a supervised machine learning model mainly used to solve regression problems. The target prediction value is based on the independent data variables. The prediction is obtained by determining the linear relationship between input and output variables.
Decision Tree Regressor DTR 38 builds the tree-like flow chart structure for predicting the target values. The input data variables are split and placed into the tree’s internal nodes. The target values are placed in the leaf of the tree.
Random Forest Regressor RFR 39 is based on creating a forest of multiple trees. The prediction from multiple trees is combined, and the majority prediction is selected as the final prediction value.
Stochastic Gradient Descent Regressor SGDR 40 is an efficient approach for fitting the linear regressor under loss functions such as logistic regression. The SGDR works by randomly selecting a few data samples instead of the complete dataset during every iteration in the prediction task. The SGDR determines the gradient to minimize the cost function.
Bayesian Ridge BR 41 is suitable to solve the problem where the data is insufficient. The BR uses probability distribution by formulating linear regression. The target prediction values in BR are drawn from a probability distribution.
Light Gradient Boosting Machine Regressor LGBMR 42 is an ensemble learning model used for regression and classification by constructing decision trees. The multiple involved trees in LGBMR determine the prediction values.
Recurrent Neural Network RNN 43 is a deep learning-based model best known for sequential data. In a traditional neural network, the outputs and inputs are independent. However, the RNN follows the looping mechanism, which is based on the working of the previous step. Outputs are input to the current step to predict the output of the layer. This way, RNNs remember the inputs because of their internal memory. The RNN works in the same behavior as the human brain’s function.
Long Short-Term Memory The RNN has the problem of vanishing gradients. LSTM 44 model is an extension of RNN to overcome this issue by extending the memory. The LSTM uses three gates: input gate, output gate, and forget gate. With the help of these gates, LSTM assigns data weights. The series of gates in LSTM controls the information sequence data that enters, stores, and leaves the model network.
Gated Recurrent Unit GRU 45 is a type of RNN model with several advantages over LSTM. The GRU has less memory computation and is much faster than LSTM. Similar to LSTM, GRU utilizes gates to control input information. The GUR uses the update and reset gates to overcome the vanishing gradient problem. 46 The information passing to output is decided by these two gates.
The layers stack architectural analysis of employed deep learning techniques.

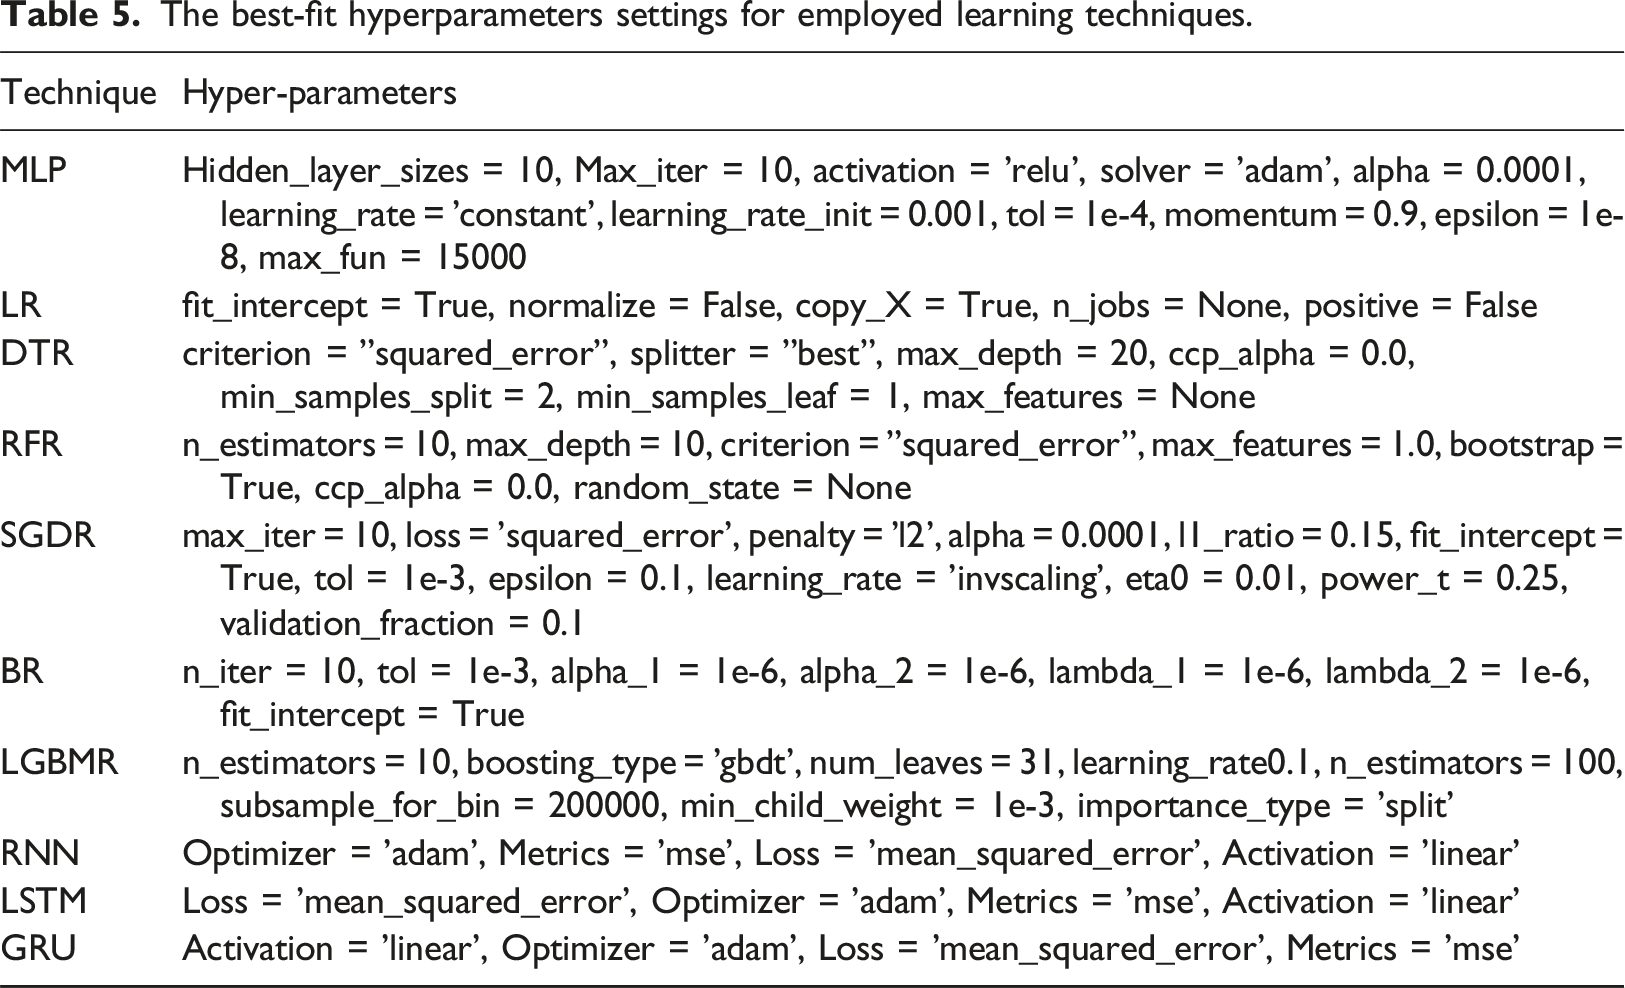
The best-fit hyperparameters settings for employed learning techniques.
Novel proposed approach
Our novel proposed H-VPP approach is based on a hybrid of DTR and RFR techniques. The architectural analysis of the H-VPP approach is analyzed in Figure 5. The whole ventilator dataset is fitted to both DTR and RFR techniques. The ventilator pressure is predicted from the DTR and RFR techniques. The average from individual predictions is taken using a voting regressor to form a final prediction. Then a final prediction of ventilator pressure outcome with high accuracy. The architectural analysis of the proposed H-VPP approach.
The voting regressor 48 is an ensemble learning method designed for solving regression tasks. This method combines the predictions of multiple individual regressors to produce a more robust and accurate prediction. This ensemble technique falls under the category of model averaging, where diverse base regressors are trained independently, and their predictions are aggregated to form the final output. The ensemble’s strength lies in its ability to reduce overfitting and enhance generalization performance by leveraging the collective wisdom of diverse models.
The 
In the case of using 
Results
Experimental results and evaluation are analyzed in this section. The comparative results of employed machine learning and deep learning techniques are validated using the performance metrics 49 MAE, MAD, MSE, RMSE, R2, Adjusted R2, and variance. These regression metrics are analyzed through mathematical notations and computation scores for employed learning techniques.
Experimental setup
Python 3.0 programming language is used for data analysis, model building, and evaluations. The Scikit-learn library module with a version of 1.0.2 is used for machine learning model building and testing. The TensorFlow library module with a version of 2.8.2 and the Keras library module with a version of 2.8.0 are utilized for building deep learning models and testing. The experiments are completed on the platform with a model Intel(R) Xeon(R), 2.20 GHz CPU, 13 GB RAM, cache size of 56,320 KB, and 12 GB NVIDIA Tesla K80 GPU.
Scientific evaluations
The scientific performance evaluations are examined using the regression metrics. This study employs seven evaluation metrics for this purpose.
MAE is the L1 loss function most commonly used for regression problems. MAE measure is the magnitude of difference between the prediction and the actual value of the dataset. It takes the average of absolute errors. It can be calculated using
MAD measures the model’s median deviation between the actual and predicted values. MAD is best for outliers in the target variable, which is the significant reason to use MAD in combination with MAE. MAD is calculated by
MSE is determined by calculating the square average of the difference between the predicted and actual values. MSE is very sensitive to outliers in the data. The mathematical notation to calculate the MSE is
RMSE metric is the same as the MSE; however, the root of values is taken while calculating the MSE. RMSE is robust to the outliers. It is the best measure that shows how accurate the proposed model is with respect to prediction. RMSE is calculated using
R2 accuracy score is a statistical performance metric utilized to determine how well an employed regression technique is in prediction for unseen data samples. R2 accuracy score is also referred to as the coefficient of determination. It explains the proportion of variance for a target (dependent variable) by a feature (independent variable). R2 score always lies between zero and one. R2 is calculated using
Adjusted R2 is another version of R2 which determines the variation in the dependent variable and only the explained features have higher effects in making predictions. The adjusted R2 is calculated using the following
The explained variance score is relatively similar to the R2 score. The variance score explains the dispersion of errors in an input dataset. The variability of the prediction’s proportions is measured by variance for a learning model. The variance score is based on the difference between the expected and the predicted values. It is calculated using
Results of deep learning models
The training and validation performance by epochs for deep learning models.
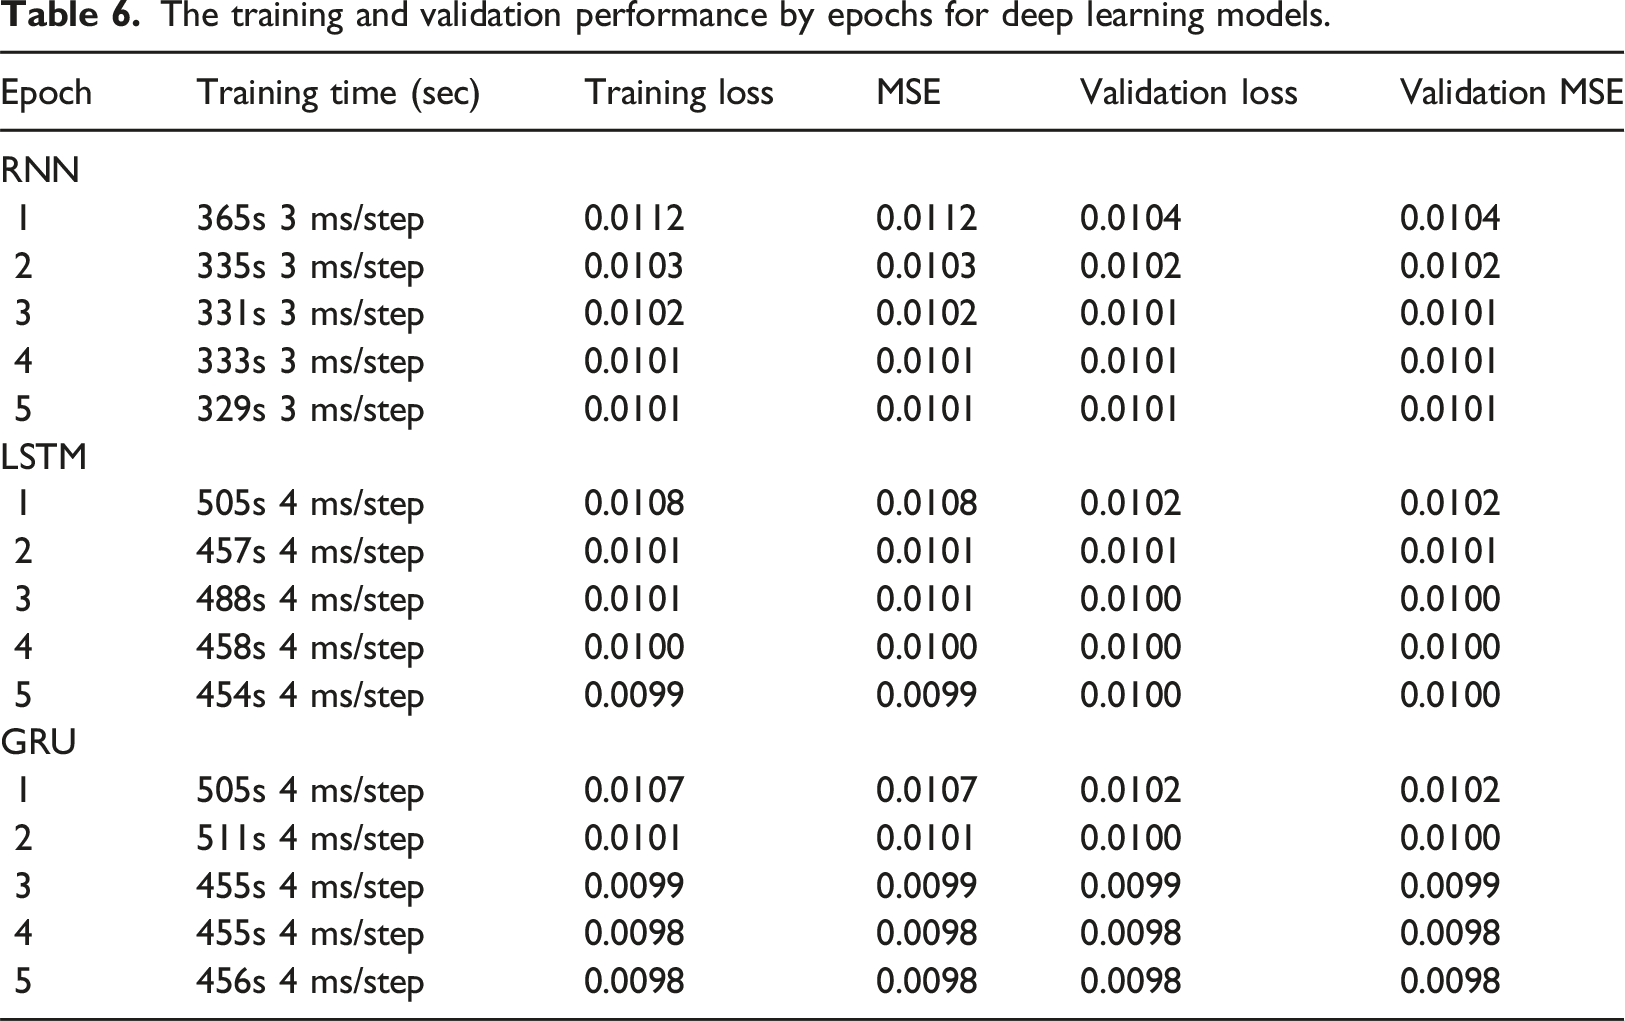
By analyzing the LSTM model training, during the first epoch of the model, the training loss and MSE have a value of 0.0108, which is less than the RNN model’s first epoch. The validation loss and validation MSE have scores of 0.0102. The time computations for the LSTM model are high during training. During the LSTM model training, the training and validation errors are decreased as the number of epochs increases. In the last epoch, the LSTM model has a training loss and MSE value of 0.0099, much less than the first epoch. The validation loss and validation MSE have scores of 0.0100 in the last epoch. The analysis demonstrates that the LSTM model has low error scores during training.
The GRU model has almost similar error rates as compared to LSTM. During the first epoch of the GRU model, the training loss and MSE have a value of 0.0107, which is less than the LSTM model’s first epoch. The validation loss and validation MSE also have scores of 0.0102, the same as the LSTM model. The GRU model has fewer time computations during training as compared to the LSTM model. The error rates decrease as the GRU model epochs are increased. In the last epoch, the GRU training loss and MSE have a value of 0.0098, much less than the first epoch. The validation loss and validation MSE also have scores of 0.0098 in the last epoch. The analysis demonstrates that the GRU model has lower error scores during training than the LSTM model.
Prediction results of models
Comparative performance of employed machine learning and deep learning models.

For the RMSE, 0.056 is the lowest score which is obtained by the proposed hybrid approach while the highest RMSE of 0.095 is achieved by LR, BR, and SGDR techniques. Scores of MAE, MAD, MSE, and RMSE show the error between the predicted and actual values, and higher values show the inability of the model to predict a correct output. Obtained scores from the proposed approach indicate that the proposed hybrid model performs much better than other employed approaches. R2 and adjusted R2 accuracy scores have the same values in this analysis. The highest R2 score of 0.78 is achieved by the proposed approach whereas the minimum R2 score of the study is 0.38 which is obtained by LR, BR, and SGDR techniques. R2 values for the proposed model suggest that it outperforms other models regarding the R2 score. This analysis demonstrates that the novel proposed approach has less error rate than other approaches, leading to high accuracy for ventilator pressure prediction.
The bar chart shows the comparative analysis of the R2 accuracy score for all employed machine learning and deep learning techniques, as given in Figure 6. The analysis demonstrates that a high accuracy score of 78% is achieved by the proposed approach in comparison with other techniques. The DTR and RFR techniques also achieved good accuracy scores. The lowest R2 score of 38% is achieved by LR, SGDR, and BR models. The R2 score performance analysis for employed models.
The regression analysis is demonstrated based on the mapping of actual ventilator pressure values with the predicted pressure values. The 10,000 data points are taken under consideration for regression analysis. In Figure 7(a), the DTR technique is analyzed for ventilator pressure prediction. The DTR prediction regression analysis shows that the model poorly predicts the pressure values from 0.5 or above. In Figure 7(b), the FRR model for ventilator pressure prediction is analyzed. The RFR prediction regression analysis shows that the model poorly predicts the pressure values from 0.4 or above. The RFR model has a higher error rate than the DTR model. In Figure 7(d), the proposed technique is examined for ventilator pressure prediction. The proposed H-VPP prediction regression analysis demonstrates that the pressure values are almost correctly predicted and have high accuracy compared to DTR and RFR. Only a few data points have an error in predicting the pressure values of 0.6 or above predicted by the proposed model. Regression analysis of, (a) DTR technique for ventilator pressure prediction, (b) RFR approach for ventilator pressure prediction (c) Proposed H-VPP approach for ventilator pressure prediction, (d) 100 sample points of Proposed H-VPP approach for ventilator pressure prediction.
Performance comparison with existing approaches
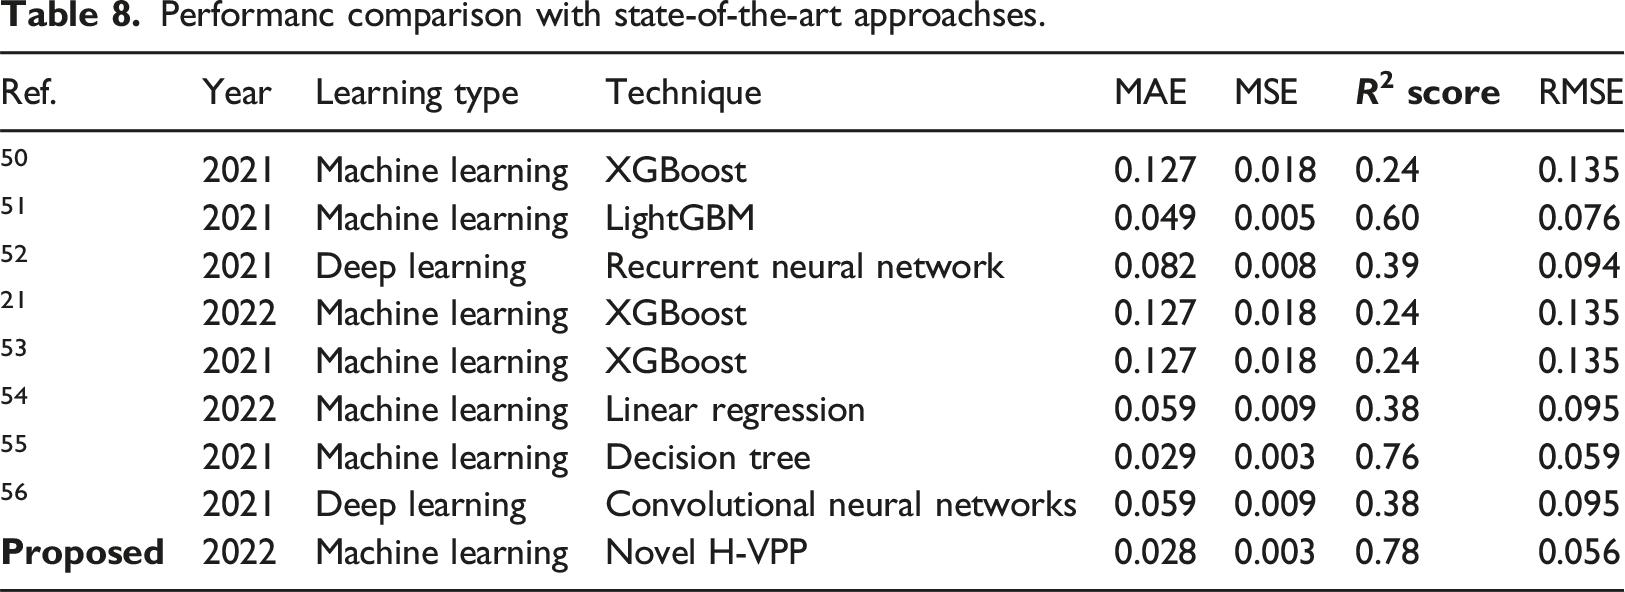
Performanc comparison with state-of-the-art approachses.
Discussions
Mechanical ventilator plays a vital role in saving millions of lives. Patients with COVID-19 symptoms need a ventilator to survive during the pandemic. The pumping of air into the patient’s lungs using a ventilator requires a particular air pressure. High or low ventilator pressure can result in a patient’s life loss as high air pressure in the ventilator causes the patient lung damage while lower pressure provides insufficient oxygen. Consequently, precisely predicting ventilator pressure is a task of great significance in this regard. The analysis of previous studies indicates that machine learning approaches are predominantly used for ventilator pressure prediction, and results suggest that the produced accuracy is still lower than the desired output, and further research efforts are needed in this regard.
This study presents a novel H-VPP approach for precise and accurate ventilator pressure prediction. The proposed H-VPP approach is based on the hybrid of DTR and RFR, where the predictions from these models are regressed to predict the final output. Extensive experiments are performed involving seven machine learning and three deep learning models to investigate the performance of the proposed approach regarding MAE, MAD, MSE, RMSE, R2 score, adjusted R2 score, and variance. Results suggest that the proposed approach outperforms all the employed models with a 0.78 R2 score. The applied VEDA reveals that the prominent cause of high ventilator pressure is the high values of lung attributes R and C during initial time step values.
Limitations
In this research study, we have proposed a novel H-VPP approach for precise and accurate ventilator pressure prediction. However, the proposed research has some limitations. The R2 score of our approach could be enhanced by minimizing the Mean Squared Error (MSE) and Root Mean Squared Error (RMSE) rates. Additionally, the applied deep learning models are computationally expensive and can be optimized by reducing their layered architectures. Regarding study limitations and future work, a transfer learning-based model will be developed for ventilator pressure predictions.
Conclusion
Mechanical ventilators have become important considering the recent surge in the COVID-19 pandemic and play an integral part in saving countless lives. However, high or low ventilation pressure can cause lung damage to patients, and pressure prediction is important to avoid such complications. This study presents a novel H-VPP approach for precise and accurate ventilator pressure prediction. The proposed H-VPP approach is based on the hybrid of DTR and RFR where the predictions from these models are regressed to predict the final output. Extensive experiments are performed involving seven machine learning and three deep learning models to investigate the performance of the proposed approach regarding MAE, MAD, MSE, RMSE, R2 score, adjusted R2 score, and variance. Results suggest that the proposed approach outperforms all the employed models with a 0.78 R2 score. Error metrics also show the superior performance of the proposed approach. Performance comparison with existing state-of-the-art corroborates the superior performance of the proposed model. The applied VEDA reveals that the prominent cause of high ventilator pressure is the high values of lung attributes R and C during initial time step values.
Footnotes
Author contributions
Conceptualization, Ali Raza and Furqan Rustam; Data curation, Furqan Rustam and Hafeez Ur Rehman Siddiqui; Formal analysis, Ali Raza, Hafeez Ur Rehman Siddiqui and Maria Asuncio´n Vicente Ripoll; Funding acquisition, Emmanuel Soriano Flores; Investigation, Juan Luis Vidal Mazon and Isabel de la Torre Diez; Methodology, Hafeez Ur Rehman Siddiqui and Emmanuel Soriano Flores; Project administration, Maria Asuncion and Vicente Ripoll; Resources, Emmanuel Soriano Flores; Software, Emmanuel Soriano Flores and Juan Luis Vidal Mazon; Supervision, Imran Ashraf; Validation, Isabel de la Torre Diez, Maria Asuncion Vicente Ripoll and Imran. Ashraf; Visualization, Juan Luis Vidal Mazon and Isabel de la Torre Diez; Writing – original draft, Ali Raza and Furqan Rustam; Writing – review & editing, Imran Ashraf.
Declaration of conflicting interests
The author(s) declared no potential conflicts of interest with respect to the research, authorship, and/or publication of this article.
Funding
The author(s) disclosed receipt of the following financial support for the research, authorship, and/or publication of this article: This study is funded by the European University of Atlantic.
Data availability statement
The data used in this study can be requested from the corresponding authors.